Embed Size (px)
Citation preview
Improvement in retinal image quality with dynamic correction of the eye’s aberrations
H. Hofer1,2, L. Chen1, G. Y. Yoon1, B. Singer1, Y. Yamauchi1, and D. R. Williams1,2
Center for Visual Science, University of Rochester, Rochester, NY 146271
Institute of Optics, University of Rochester, Rochester, NY 146272
Abstract: We measured the improvement in retinal image quality provided by correcting the temporal variation in the eye’s wave aberration with a closed-loop adaptive optics system. This system samples the eye’s wave aberration at rates up to 30 Hz. Correction of the eye’s aberrations can be completed in 0.25-0.5 seconds, resulting in residual rms wave-front errors as low as 0.1 microns for 6.8 mm pupils. Real-time wave-front measurements were used to determine how effectively the spatial and temporal components of the eye’s wave aberration were corrected. The system provides dynamic correction of fluctuations in Zernike modes up to 5th order with temporal frequency components up to 0.8 Hz. Temporal performance is in good agreement with predictions based on theory. Correction of the temporal variation in the eye’s wave aberration increases the Strehl ratio of the point spread function nearly 3 times, and increases the contrast of images of cone photoreceptors by 33% compared with images taken with only static correction of the eye’s higher order aberrations. ©2001 Optical Society of America OCIS codes: (330.5370) Physiological optics; (010.1080) Adaptive optics; (330.4460)
References and Links 1. M.S.Smirnov, “Measurement of the wave aberration of the human eye,” Biophysics 6, 776-794 (1961). 2. J. Liang, D. R. Williams, and D. T. Miller, “Supernormal vision and high resolution retinal imaging through
adaptive optics,” J. Opt. Soc. Am. A. 14, 2884-2892 (1997). 3. F. Vargas-Martin, P. Prieto, and P.Artal, “Correction of the aberrations in the human eye with liquid crystal
spatial light modulators: limits to the performance,” J. Opt. Soc. Am. A. 15, 2552-2562 (1998). 4. R. Navarro, E. Moreno-Barriuso, S. Bara, and T. Mancebo, “Phase plates for wave-aberration compensation in
the human eye,” Opt. Lett. 25, 236-238 (2000). 5. H. Hofer, P. Artal, B. Singer, J. L. Aragón, and D. R. Williams, “Dynamics of the eye’s wave aberration,” J.
Opt. Soc. Am. A. 18, 497-506 (2001). 6. E. J. Fernandez, I. Iglesias, P. Artal, “Closed-loop adaptive optics in the human eye,” Opt. Lett. 26, 746-748
(2001). 7. American National Standard for the Safe Use of Lasers ANSI Z136.1. (Laser Institute of America, Orlando, FL,
1993). 8. W. Jiang, and H. Li, “Hartmann-Shack wavefront sensing and control algorithm,” SPIE 1271, Adaptive Optics
and Optical Structures, 82-93 (1990)” 9. S. Marcos, S. A. Burns, E. Moreno-Barriuso, and R. Navarro, “A new approach to the study of ocular chromatic
aberrations,” Vision Res. 39, 4309-4323 (1999). 10. G. Y. Yoon and D. R. Williams, “Visual performance after correcting the monochromatic and chromatic
aberrations of the eye,” J. Opt. Soc. Am. A., submitted (2001). 11. W.N. Charman and G. Heron, “Fluctuations in accommodation: a review,” Ophthal. Physiol. Opt. 8, 153-163
(1988). 12. A. Roorda and D.R. Williams, “The arrangement of the three cone classes in the living human eye,” Nature 397,
520-522 (1999).
Introduction
The eye is not a perfect optical system but suffers from higher order aberrations that degrade retinal image quality and limit vision. Smirnov1 (1961) first proposed improving the eye’s optical performance by correcting these aberrations, and the first successful attempt to correct
#31887 - $15.00 US Received March 13, 2001; Revised May 21, 2001
(C) 2001 OSA 21 May 2001 / Vol. 8, No. 11 / OPTICS EXPRESS 631

multiple higher order aberrations simultaneously was made by Liang et al2 (1997) using anadaptive optics (AO) system consisting of a wave-front sensor (WFS) and a deformablemirror (DM). Since then a variety of methods, including liquid crystal spatial lightmodulators3 and phase plates4, have been attempted for correcting the eye’s higher orderaberrations. However, these methods were only capable of providing a static correction of theeye’s higher order aberrations. Hofer et al5 recently showed that that the eye’s higher orderaberrations are not static, but fluctuate in time. They argued that significant gains in theperformance of an AO system should be possible with dynamic correction of the eye’saberrations. They suggested that, in theory, a perfect AO system capable of correctingtemporal fluctuations with frequencies up to 1-2 Hz should provide diffraction-limitedimaging over a large pupil size (5.8 mm). Fernandez et al6 have recently demonstrated a real-time AO system designed with low cost components. In this paper, we also demonstrate areal-time AO system, showing furthermore that it can produce significant improvements inretinal image quality compared with a static system. The system can provide closed-loopcorrection with sampling rates up to 30 Hz, and can complete a correction of the eye’saberrations automatically in a fraction of a second, bringing the eye’s residual rms wave-fronterror over a 6.8 mm pupil as low as 0.1 microns. With temporal wave-front measurementsand spectral analysis, we determine which Zernike modes and which temporal frequencycomponents the system can track in real-time. We illustrate the value of dynamic correctionby comparing retinal images acquired with our system during static and dynamiccompensation.
System description
Fig.1 is a diagram of the AO system. It is a modification of the AO system described by Lianget al2. The system mainly consists of a Hartmann-Shack (HS) WFS, which measures the eye’saberrations, coupled via a Macintosh computer in a feedback loop with a conventional 37channel DM, which is used to correct the aberrations. The AO system also contains animaging path so that it is possible to acquire a high-resolution retinal image immediatelyfollowing correction of the eye’s aberrations. The major system improvements are describedbelow.
Fig. 1. Schematic of the AO system setup.
We used a 790 nm superluminescent diode (SLD) with a spectral spread of 20 nm for theWFS beacon. Advantages of this source are that it has a very small coherence length, about 30microns compared with about a meter for a He-Ne laser, resulting in much less speckle in theWFS spots. It is also a more comfortable and safe viewing source due to the eye’s decreasedsensitivity at longer wavelengths. The irradiance on the cornea was approximately 5microWatts. This is over 35 times smaller than the maximum permissible exposure forcontinuous viewing of 790 nm light according to the ANSI standards for the safe use of
#31887 - $15.00 US Received March 13, 2001; Revised May 21, 2001
(C) 2001 OSA 21 May 2001 / Vol. 8, No. 11 / OPTICS EXPRESS 632

lasers7. To minimize source intensity and to avoid spurious reflections, the SLD was coupled into the system with a pellicle beamsplitter as the very last optical element before the eye. To eliminate the corneal reflection in the HS images we employed an off-axis scheme for the SLD illumination as described in Hofer et al5. The WFS used a square lenslet array with a 24 mm focal length and 0.4 mm lenslet spacing. The pupil size used for wave-front sensing and correction was 6.8 mm.
The locations of the spots in the HS image provide the local wave-front slopes. The direct slope control method (see reference 8 for a detailed description) was used to determine the DM actuator voltages directly from the wave-front slopes. In this method, an influence function, specifying the HS spot displacements caused by movement of a single mirror actuator as a function of applied voltage, is computed for each mirror actuator. These influence functions are then combined to construct a single matrix relating the HS spot displacements directly to the actuator voltages. This method has the advantage that it is extremely quick, requiring only a single matrix multiplication, and does not require the reconstruction of the wave-front shape in terms of Zernike polynomials or other functions, so it is less sensitive to fitting errors and edge artifact effects. Although we do reconstruct the wave aberration in terms of Zernike polynomials when we wish to measure the eye’s aberrations, we do not need to compute the wave aberration to control the DM or to perform the AO correction. The direct slope control method is also somewhat self-calibrating and impervious to small misalignments between the DM and the lenslet array. We used a commercially available 37 channel Xinetics DM with an aluminumized glass faceplate for our wave-front correcting device. This mirror is identical to that described by Liang et al2 with the exception that it has lead magnesium niobate (PMN) instead of lead zirconate-titanate (PZT) actuators.
With this AO system we can measure and correct the eye’s aberrations in real-time at rates up to 30 Hz (a rate ultimately limited by the speed of the WFS CCD camera). For this study we operated with a 30% gain at a rate of 21 Hz with 50 msec HS image exposures. These parameters were determined empirically to give the best trade-off between speed and noise, resulting in optimal correction for one subject. Typically the eye’s residual aberrations can be brought to a minimum after 5-10 iterations, thus a full correction of the eye’s aberrations can usually be completed automatically in 0.25-0.5 seconds. After the eye’s aberrations have been corrected, the WFS computer can automatically trigger a flash lamp and a science CCD camera for retinal image acquisition. We used a krypton flash with a 550 nm interference filter for the retinal image illumination. To avoid possible edge artifacts of the DM, only the central 6 mm of the pupil was used for retinal imaging.
We use different wavelengths for wave-front correction and retinal imaging. Because the eye’s higher order monochromatic aberrations are not appreciably wavelength dependent9, we can exploit this wavelength difference by using a high quality cold mirror, which transmits at 790 nm and reflects at 550 nm, to allow simultaneous wave-front correction and retinal imaging without loss or mixing of light at the CCD planes. The eye exhibits a chromatic difference in focus of approximately 0.8 diopters between 790 nm and 550 nm. This offset was incorporated into the retinal imaging path of the AO system by translating the lens that brings the retinal image into focus on the science CCD camera. This allowed simultaneous focusing of the retinal image and the AO correction path.
An example of the temporal performance of the AO system is presented in Figs. 2 and 3. Fig. 2 is a movie illustrating the wave aberration over a 6.8 mm pupil for one subject during AO correction. Each contour line represents one wavelength (0.55 microns) of wave aberration. Note how much flatter the wave aberration becomes once AO correction is completed. A movie of the corresponding point spread function (calculated from the wave aberration at 550 nm with a 6 mm pupil) for this subject is shown in Fig. 3. The point spread function is irregular and distended before the start of AO correction. After AO correction begins the point spread function rapidly becomes much more compact. These images were calculated from measurements of the wave aberration taken during AO compensation at 21 Hz.
#31887 - $15.00 US Received March 13, 2001; Revised May 21, 2001
(C) 2001 OSA 21 May 2001 / Vol. 8, No. 11 / OPTICS EXPRESS 633
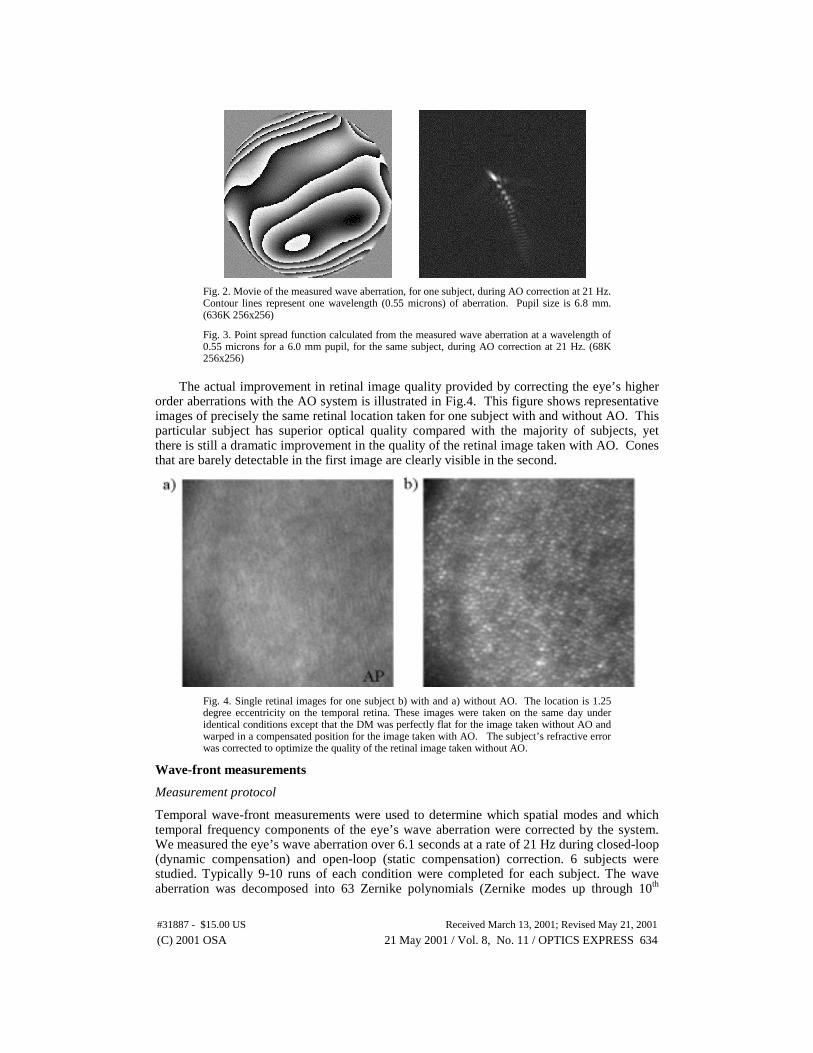
Fig. 2. Movie of the measured wave aberration, for one subject, during AO correction at 21 Hz. Contour lines represent one wavelength (0.55 microns) of aberration. Pupil size is 6.8 mm. (636K 256x256)
Fig. 3. Point spread function calculated from the measured wave aberration at a wavelength of 0.55 microns for a 6.0 mm pupil, for the same subject, during AO correction at 21 Hz. (68K 256x256)
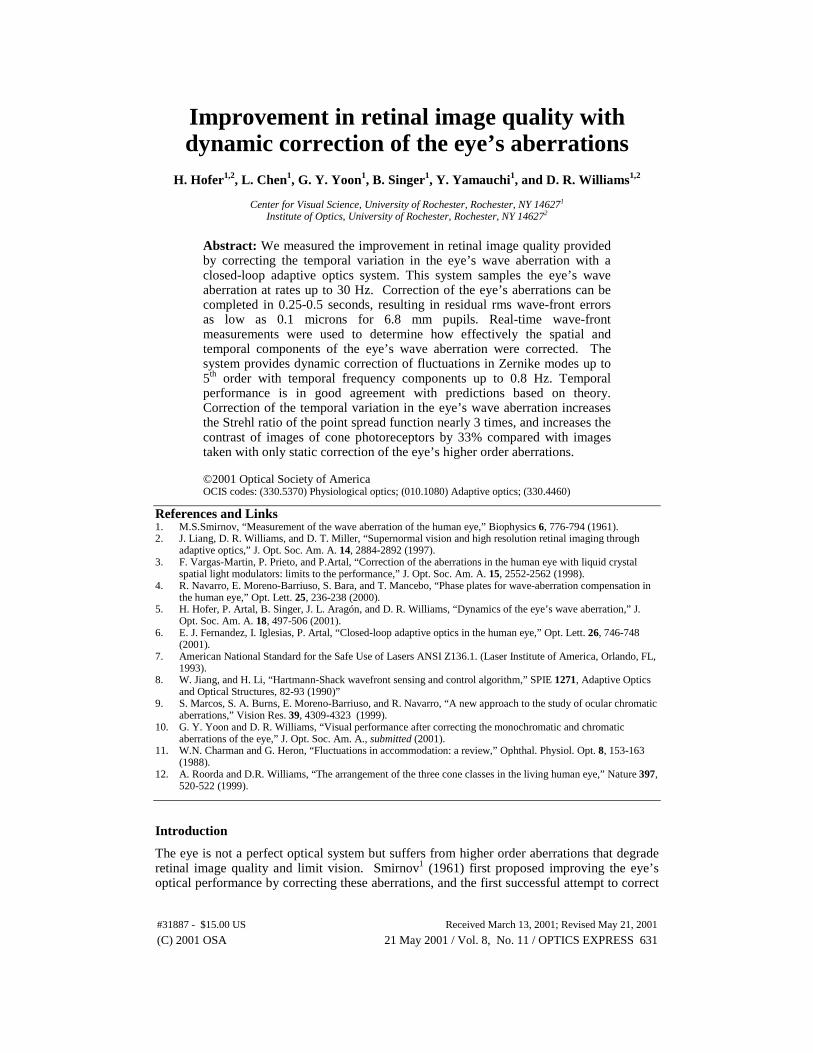
The actual improvement in retinal image quality provided by correcting the eye’s higher
order aberrations with the AO system is illustrated in Fig.4. This figure shows representative images of precisely the same retinal location taken for one subject with and without AO. This particular subject has superior optical quality compared with the majority of subjects, yet there is still a dramatic improvement in the quality of the retinal image taken with AO. Cones that are barely detectable in the first image are clearly visible in the second.
Fig. 4. Single retinal images for one subject b) with and a) without AO. The location is 1.25 degree eccentricity on the temporal retina. These images were taken on the same day under identical conditions except that the DM was perfectly flat for the image taken without AO and warped in a compensated position for the image taken with AO. The subject’s refractive error was corrected to optimize the quality of the retinal image taken without AO.
Wave-front measurements
Measurement protocol
Temporal wave-front measurements were used to determine which spatial modes and which temporal frequency components of the eye’s wave aberration were corrected by the system. We measured the eye’s wave aberration over 6.1 seconds at a rate of 21 Hz during closed-loop (dynamic compensation) and open-loop (static compensation) correction. 6 subjects were studied. Typically 9-10 runs of each condition were completed for each subject. The wave aberration was decomposed into 63 Zernike polynomials (Zernike modes up through 10th
#31887 - $15.00 US Received March 13, 2001; Revised May 21, 2001
(C) 2001 OSA 21 May 2001 / Vol. 8, No. 11 / OPTICS EXPRESS 634

order, excluding piston, x-tilt, and y-tilt) for a 6.8 mm pupil. Tropicamide, which is only a mild and incomplete cycloplegic, was used to dilate the pupils of 5 of the subjects. One subject had a naturally large pupil and did not require any mydriatic. The response of the system was not qualitatively different for this subject so his analysis was not treated separately. The mirror began every trial in a position of static compensation. Throughout each trial the subjects accommodated on a high contrast complex target, consisting of text, concentric circles, and radial lines, which was located at the far point. As illustrated in Fig. 1, the fixation target was not viewed through the AO path. Thus the subjects experienced exactly the same visual stimulus in both measurement conditions and were unable to use quality or stability cues, which would have been present had the target been viewed with AO, to infer the correction condition. Trials were self-initiated by the subjects when they were confident of accurate and stable fixation. The two trial conditions were identical except that the mirror was actively updating at a rate of 21 Hz during the measurement interval in one condition, but remained in a fixed position of static compensation throughout the measurement interval in the second. These conditions were indistinguishable to the subjects.
From each temporal sequence of Zernike coefficients average power spectra for the total wave-front disturbance and for each Zernike order were calculated. Average spectra were obtained for each subject for both the dynamic and static compensation conditions. The spectrum for the wave-front disturbance was calculated by spatially averaging the power spectrum of the residual wave-front fluctuations over the pupil. The wave-front disturbance rejection, defined as the ratio of the closed-loop wave-front disturbance spectrum to the open-loop disturbance spectrum, was also calculated for each subject. The wave-front disturbance rejection tells us how well the AO system corrects the temporal fluctuations of different frequency components in the eye’s wave aberration. Because of the finite sampling duration (6.1 seconds) and discrete sampling rate (21 Hz) we were unable to obtain information about the temporal performance for fluctuations with frequencies lower than approximately 0.17 Hz or higher than 10.5 Hz.
Performance results
There is no doubt that a static correction of the eye’s higher order aberrations provides significant improvement in the eye’s optical performance2,10. The range in best-refracted rms wave-front error before AO correction for our subjects was 0.3 - 1.5 microns for a 6.8 mm pupil. With only a static correction of the eye’s higher order aberrations the residual rms wave-front error was reduced to time-averaged values of 0.2 - 0.3 microns for the same pupil size. By correcting the temporal fluctuations in the eye’s optics with dynamic compensation, further improvements could be realized, resulting in time-averaged residual rms values ranging from 0.1 - 0.2 microns for the 6.8 mm pupil. This illustrates the benefit in optical quality that can be obtained with static compensation of the eye’s aberrations and the further gains that can be achieved with dynamic compensation.
Figs. 5 and 6 show the open-loop (static compensation of higher order aberrations) and closed-loop (dynamic compensation) wave-front disturbance power spectra and the wave-front disturbance rejection spectrum. The power spectra are the open-loop and closed-loop wave-front disturbance spectra averaged across the 6 subjects. From Fig. 5 we see that dynamic compensation reduces the power in the temporal fluctuations of the wave aberration significantly for low temporal frequencies (by approximately a factor of 10 at the lowest frequencies), and slightly increases instability at higher temporal frequencies. For each subject a disturbance rejection spectrum was also calculated. Fig. 6 shows the disturbance rejection curve averaged across the 6 subjects. The disturbance rejection curve represents the temporal response of the AO system. The correction bandwidth is the frequency where the disturbance rejection curve crosses one. For our subjects the average correction bandwidth was approximately 0.8 Hz. Fluctuations with frequencies below this value are reduced by our system and fluctuations of higher frequencies are exacerbated. Because the eye’s natural dynamics show greater activity at low frequencies than at high frequencies, the effect of the
#31887 - $15.00 US Received March 13, 2001; Revised May 21, 2001
(C) 2001 OSA 21 May 2001 / Vol. 8, No. 11 / OPTICS EXPRESS 635

decrease in the low frequency components more than offsets the effect of the increase in the high frequency components.
Fig. 5. Wave-front disturbance power spectra with dynamic and static AO averaged for 6 subjects, 6 mm pupil size.
6 mm pupil
Fig. 6. Disturbance power rejection curve averaged for 6 subjects and the theoretical prediction. Error bars are the standard deviation across subjects. The frequency where this curve crosses one represents the correction bandwidth of the system.
We compared the measured disturbance rejection curve with the theoretical rejection
curve obtained by assuming a simple model for the temporal behavior of the system. The model incorporates two assumptions: that the DM has adequate spatial resolution to reconstruct the eye’s aberration profile, and that the sampling rate of our system is high enough to accurately measure the dynamics of the eye’s aberrations. The first assumption we know to be only approximately true because the 37 channel DM cannot accurately reconstruct aberrations above the 5th Zernike mode order (see Fig. 7) and typical eyes have some amount of aberration in the higher Zernike mode orders. We believe the second assumption to be true because the eye’s dynamics show negligible activity above about 6 Hz5. Thus a rate of only 12 Hz is needed to adequately capture the eye’s dynamics, this is well below the 21 Hz sampling rate used for this study. The model also ignores the effects of noise.
The model consists of the following components: wave-front sensor (integrator), frame readout and slope calculation (simple delay), and mirror update (discrete proportional
#31887 - $15.00 US Received March 13, 2001; Revised May 21, 2001
(C) 2001 OSA 21 May 2001 / Vol. 8, No. 11 / OPTICS EXPRESS 636

control). Since the speed of the DM is 4 kHz, much faster than any other element in our system, we assume that the DM responds instantaneously to changes in voltage signals. These components have the following Laplace transforms:
Wave-front sensor: 1 − e−Ts
Ts(integration over the exposure time T=50 msec)
Delay:e−τs (τ =67 msec, this includes the time for CCD frame transfer and slope calculation)
Simple digital proportional mirror control:
Z-transform of the deformable mirror: g ⋅ zz −1
(g is the mirror loop gain)
continuous Laplace Transform equivalent: g
1 − e−Ts
(new mirror voltages are applied once every T=50 msec)
Zero order hold: 1 − e−Ts
Ts
(mirror voltages are also held constant over each sampling interval T=50 msec) These terms were combined to calculate the total closed-loop and open-loop system
transfer functions and the expected wave-front power rejection curve. The gain used in the model was the optimal gain as determined by Bode analysis, which was 28%. Empirically we determined that a 30% mirror loop gain provided optimal performance, this is consistent with the model’s predicted optimal gain. The red line in Fig. 6 indicates the model’s prediction of the system’s temporal performance. The measured curve agrees very well with the model’s prediction at higher frequencies. The model predicts a correction bandwidth of 0.9 Hz, nearly what we determine empirically. The model predicts a higher rejection of fluctuations at low temporal frequencies than we measure. One reason for this is that the model assumes that the DM can perfectly reproduce all necessary surfaces. In reality the 37 channel DM does not have infinite spatial resolution and can only accurately reproduce aberrations up to about the 5th Zernike mode order2.
Fig. 7 shows which Zernike modes the system was able to track successfully during dynamic correction. For aberrations of each Zernike mode order, the ratio of the total power in the temporal fluctuations with static compensation to the total power with dynamic compensation is plotted. We show the ratio of the total integrated power because this includes the effects of both the reduction in fluctuations at low temporal frequencies as well as the increase in fluctuations at high temporal frequencies. In other words, it shows how much the total fluctuations in each Zernike mode order are reduced by the system with dynamic compensation. We integrated the power in the frequency range from 0.17 - 6.01 Hz. While the fluctuations are negligible above 6.01 Hz, the activity below 0.17 Hz is most likely substantial as we empirically observe slow drifts in accommodation with time-scales on the order of tens of minutes and even hours. Because of this, our estimates of the benefit of dynamic correction are probably conservative. Fig. 7 shows the power reduction in each order averaged across 6 subjects, the error bars indicate the spread for the subjects. Although there is a lot of inter-subject variability, due to the large inter-subject variability in the dynamics of the eye’s optics, we see that on average the system can track 2nd and 3rd order Zernike modes well. The power carried by fluctuations in these modes is reduced by about a factor of two. On average, statistically significant tracking occurs for Zernike modes up to and including the 5th order.
#31887 - $15.00 US Received March 13, 2001; Revised May 21, 2001
(C) 2001 OSA 21 May 2001 / Vol. 8, No. 11 / OPTICS EXPRESS 637

Our system does not track Zernike modes above 5th order. This is to be expected because the 37 channel DM simply lacks the spatial resolution to provide even a static correction of Zernike modes higher than 5th order.
Fig. 7. Reduction of the power in the fluctuations of various Zernike mode orders with dynamic AO correction. Average of 6 subjects, 6.8 mm pupil size. Error bars indicate the spread for the subjects. The average power reduction is statistically significant for Zernike modes up to and including 5th order.
To estimate the impact of dynamic closed-loop correction on image quality, we
calculated the time-averaged Strehl ratio from the measured Zernike coefficients for a 6 mm pupil and a wavelength of 550 nm. These are the parameters corresponding to the retinal imaging conditions. Fig. 8 shows the Strehl ratio averaged across all subjects. The Strehl ratio calculated for dynamic correction is a factor of 2.8 higher than the Strehl ratio calculated for static correction of the eye’s higher order aberrations, indicating that we should expect to see significant improvements in optical performance and retinal image quality.
6mm pupil size, 550 nm
no AO correction
static correction
dynamic correction
Fig. 8. Time-averaged Strehl ratio for 6 subjects computed from the measured wave aberration with no AO correction (correction of only defocus and astigmatism), static AO correction, and dynamic AO correction. Error bars are the standard deviation across subjects.
#31887 - $15.00 US Received March 13, 2001; Revised May 21, 2001
(C) 2001 OSA 21 May 2001 / Vol. 8, No. 11 / OPTICS EXPRESS 638

Retinal image quality measurements
Measurement protocol
Wave-front measurements tell us which spatial and temporal components of the fluctuations in the eye’s aberrations the AO system is capable of correcting. They also provide a theoretical estimate of the benefit of this correction on the eye’s optical performance. To assess the actual improvement in optical quality afforded by dynamic correction of the eye’s aberrations, we compared the quality of the retinal images taken with static and dynamic correction for 5 subjects (ages 23-32). Images were taken in pairs, with typically about 20 pairs acquired for each subject, at 1.25 degrees retinal eccentricity with 550 nm light through a 6 mm artificial pupil. Fixation was controlled with a high contrast target located at the far point. Tropicamide was used to dilate the subjects’ pupils.
For each pair, the dynamic AO image was taken first. The subject blinked then began the image acquisition trial when confident of accurate and stable fixation. The subject was asked to try to maintain a consistent interval between the blink and the start of each trial. The AO system then measured and corrected the eye’s aberrations for approximately one half of a second. Approximately 70 msec following the last mirror update, the krypton flash discharged and the dynamic retinal image was acquired. Meanwhile the DM remained in the corrected position. After waiting no more than about 30 seconds, the subject blinked and started another image acquisition trial. This time the DM did not update during the pre-flash interval, and instead remained in the position of static compensation. After an equivalent amount of time elapsed, the krypton flash was discharged and the static retinal image was acquired. The two imaging conditions were identical, except that in one the mirror was actively updating during the pre-flash interval, and in the other the mirror remained in a fixed position of static compensation throughout the pre-flash interval. Subjects reported that they could not distinguish between these two conditions. The wave aberration measurement just prior to each retinal image acquisition was also recorded. Because the static retinal images were never taken more than about 30 seconds after the last AO correction, comparison of the dynamic and static retinal images only illustrates the improvements in image quality that can be gained by correcting rather rapid changes in the eye’s wave aberration.
All the images within each condition were registered and summed for each subject to obtain average retinal images with dynamic and static AO correction. Retinal image power spectra were then computed from the average dynamic and static retinal images with an FFT algorithm. Image subsections for the spectral analysis were chosen so that exactly the same portions of retina (encompassing exactly the same cones) were used in the power spectra calculations. Dynamic and static retinal image power spectra were computed for each subject and also averaged across subjects. The average image contrast at the cone frequencies with static and dynamic AO was also determined for each subject.
Image quality results
Fig. 9 shows some examples of the retinal images obtained with a static and dynamic correction of the eye’s higher order aberrations. Each image is a registered sum of many individual images. The improvement in retinal image quality obtained by dynamic correction varies widely among individuals. Some individuals (a&b) show subjective increases in retinal image quality, while other individuals (c) show no subjective improvement in retinal image quality. This inter-subject variability can be understood because different individuals also show significantly different amounts of temporal instability in their eye’s optics. In general, the improvement in retinal image quality is greatest in those subjects who show the highest degree of temporal instability in their wave aberrations.
#31887 - $15.00 US Received March 13, 2001; Revised May 21, 2001
(C) 2001 OSA 21 May 2001 / Vol. 8, No. 11 / OPTICS EXPRESS 639
1.25 deg retinal eccentricity
a) AP c) GYYb) CM
Fig. 9. Examples of retinal images taken with dynamic (top row) and static (bottom row) AOcorrection. Location was 1.25 degrees retinal eccentricity. Each image is an average ofapproximately 20 individual images. All images are shown at the same scale.
To quantify the improvement in retinal image quality we compared image power spectra.Fig. 10 shows the improvement in the retinal image power spectrum for one subject (AP). AtAP’s cone frequencies the retinal image power spectrum increases by about a factor of threewith dynamic than with static correction of the eye’s aberrations. Fig. 11 shows theimprovement in the retinal image power spectrum (ratio of the image power spectrum withdynamic AO to the image power spectrum with only static correction of higher orderaberrations) averaged across the 5 subjects. The range of cone frequencies for these subjects isindicated on the plot. At these frequencies, the average improvement in the retinal imagepower spectrum is almost a factor of two.
#31887 - $15.00 US Received March 13, 2001; Revised May 21, 2001
(C) 2001 OSA 21 May 2001 / Vol. 8, No. 11 / OPTICS EXPRESS 640

Fig. 10. Radially-averaged retinal image power spectra for one subject (AP), with dynamic (blue) and static (pink) correction of they eye’s aberrations. The peak at ~80 cycles/degree represents cone photoreceptors. At this frequency the power spectrum is approximately 3 X higher with dynamic then with only static correction of the eye’s aberrations.
Fig. 11. The average improvement in the retinal image power spectrum when using dynamic instead of static AO. This is the ratio of the image power spectrum with dynamic AO to the spectrum with static AO, averaged across 5 subjects. The range of the subjects’ cone spatial frequencies is indicated on the plot.
Fig. 12 shows the ratio of the cone contrast with dynamic AO to the cone contrast with
static AO for each subject and also the average for all the subjects. Again, there is large inter-subject variability. On average, the contrast of the cones in the retinal image increased by 33% with dynamic AO correction. In all likely-hood this is an underestimate of the value of dynamic correction since the measurement protocol was not designed to include the effects from slow (on the scale of minutes or longer) drifts in the ocular aberrations.
#31887 - $15.00 US Received March 13, 2001; Revised May 21, 2001
(C) 2001 OSA 21 May 2001 / Vol. 8, No. 11 / OPTICS EXPRESS 641

CM MD GYY JP AP AverageFig. 12. The improvement in the contrast of cones in retinal images when using dynamic,instead of static, AO correction of the eye’s higher order aberrations. On average, cone contrastis 33% higher with dynamic AO than with static-only compensation.
It is important to note that despite these improvements in retinal image quality, it is stillnot possible to routinely detect cone photoreceptors in the retinal images of every subject.Since we have acquired dynamic correction ability we have attempted retinal imaging on 19subjects. Photoreceptors could be detected in retinal images from 11 of those 19. However,we already knew, based on previous imaging experiments, that photoreceptors could bedetected in 4 of those subjects. It is safe to say that cones can be detected in about half of thepeople attempted. Interestingly, the subjects in whom we fail to detect cones often appear toachieve excellent post-correction optical quality. One possibility is that ocular scatter, whichwould not be detected by the WFS, could degrade the retinal image, although we do notexpect this effect to be prominent for our relatively young subjects (23-32 years old). Thefailure of the measured residual wave aberration to necessarily correlate with the ability todetect photoreceptors suggests that there are other physiological effects, besides the eye’soptical quality, that effect the ability to image retinal features. Perhaps there are individualdifferences in the light gathering or guiding properties of photoreceptors that limit theefficiency with which light can be reflected back out of the pupil.
Conclusion
Using a real-time AO system developed for the human eye, we demonstrate significant gainsin retinal image quality with dynamic correction of the eye’s aberrations. This system cancorrect the eye’s aberrations automatically in 0.25-0.5 seconds, bringing the residual rmswave-front error as low as 0.1 microns over a 6.8 mm pupil. Aberrations up to the 5th Zernikemode order with temporal frequency components up to a correction bandwidth of 0.8 Hz aresuccessfully corrected by the system. For a 6 mm pupil, we estimate nearly a 3 foldimprovement in the Strehl ratio with dynamic AO than with static AO, and we demonstrate a33% increase, on average, in the contrast of cones in retinal images acquired through thesystem.
We have demonstrated that the improvement in optical performance afforded by dynamiccorrection of the eye’s aberrations results in significant gains in the quality of retinal images.However, it remains to be seen whether similar gains will be achieved in visual performance.While there is some uncertainty as to whether the temporal instability in the eye’s aberrationsis perceivable under normal conditions11, it is generally accepted that it is not visuallyrelevant. If temporal instability in the eye’s aberrations does impact visual performance, it islikely to do so in a manner similar to that of chromatic aberration, whose effects are unmaskedonly once the eye’s higher order aberrations have been corrected10. Further studies will clarifythe significance of temporal instability for visual performance after higher order aberrationshave been corrected.
#31887 - $15.00 US Received March 13, 2001; Revised May 21, 2001
(C) 2001 OSA 21 May 2001 / Vol. 8, No. 11 / OPTICS EXPRESS 642

Dynamic AO correction will be most valuable for imaging applications which require the detection of small differences in the contrast of very fine retinal features. For example, the cone classification technique pioneered by Roorda et al12 for determining the arrangements of the three types of cones in the living human retina, depended on the acquisition of a large number of retinal images (on the order of a hundred) to reliably detect very small differences in cone reflectivity. By increasing cone contrast with dynamic AO correction, the number of images needed for cone classification can be substantially reduced, allowing the experiment to be completed more quickly, efficiently, and routinely, in larger numbers of subjects. Furthermore, the automatic, fast, and robust correction that we have demonstrated is a prerequisite for any viable clinical instrument, thus dynamic AO correction is relevant not only for basic science but for clinical applications as well. Acknowledgements Supported by National Institutes of Health grants EY04367 and EY01319, and a research contract from Bausch and Lomb. This work has been supported in part or full by the National Science Foundation Science and Technology Center for Adaptive Optics, managed by the University of California at Santa Cruz under cooperative agreement No. AST-9876783. In addition, H. Hofer acknowledges a National Science Foundation graduate fellowship. Send all correspondence to Heidi Hofer ([email protected]).
#31887 - $15.00 US Received March 13, 2001; Revised May 21, 2001
(C) 2001 OSA 21 May 2001 / Vol. 8, No. 11 / OPTICS EXPRESS 643
![Improvement of retinal blood vessel detection using ......(5) model-based techniques and (6) mathematical morphology [1]. In matched filtering methods, retinal images are filtered](https://img.pdfslide.net/doc/110x75/60f12576a9739b0fda316773/improvement-of-retinal-blood-vessel-detection-using-5-model-based-techniques.jpg)