Embed Size (px)
Citation preview
Bates CollegeSCARAB
Community Engaged Research Reports Environmental Studies
Winter 4-2018
Improving Access, Affordability, Fairness, andEfficiency of the Good Food Bus Mobile MarketAdair AndreBates College
Joakim CohenBates College
Josephine GillettBates College
Nell HoudeBates College
Follow this and additional works at: https://scarab.bates.edu/community_engaged_research
This Article is brought to you for free and open access by the Environmental Studies at SCARAB. It has been accepted for inclusion in CommunityEngaged Research Reports by an authorized administrator of SCARAB. For more information, please contact [email protected].
Recommended CitationAndre, Adair; Cohen, Joakim; Gillett, Josephine; and Houde, Nell, "Improving Access, Affordability, Fairness, and Efficiency of theGood Food Bus Mobile Market" (2018). Community Engaged Research Reports. 62.https://scarab.bates.edu/community_engaged_research/62
Improving Access, Affordability, Fairness, and Efficiency of
the Good Food Bus Mobile Market
Adair Andre, Joakim Cohen, Josephine Gillett, Nell Houde
For ENVR 417 - Community Engaged Research in Environmental Studies
Department of Environmental Studies, Bates College
Lewiston, Maine
Winter 2018
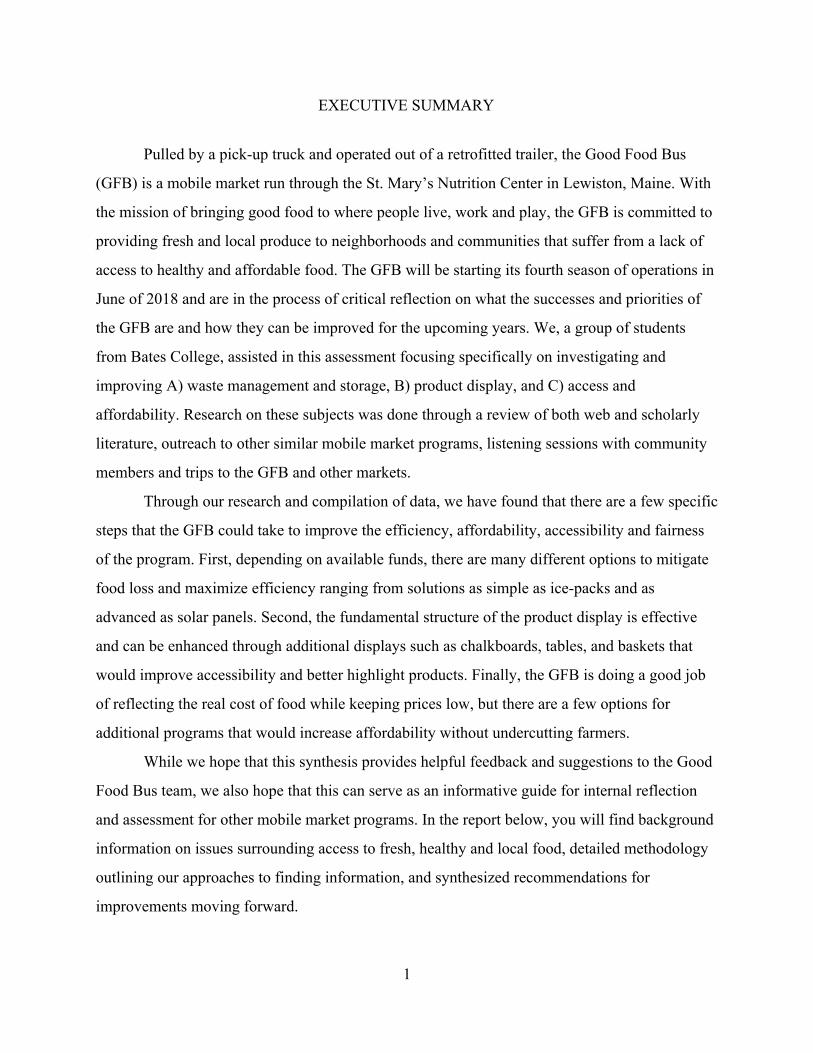
EXECUTIVE SUMMARY
Pulled by a pick-up truck and operated out of a retrofitted trailer, the Good Food Bus
(GFB) is a mobile market run through the St. Mary’s Nutrition Center in Lewiston, Maine. With
the mission of bringing good food to where people live, work and play, the GFB is committed to
providing fresh and local produce to neighborhoods and communities that suffer from a lack of
access to healthy and affordable food. The GFB will be starting its fourth season of operations in
June of 2018 and are in the process of critical reflection on what the successes and priorities of
the GFB are and how they can be improved for the upcoming years. We, a group of students
from Bates College, assisted in this assessment focusing specifically on investigating and
improving A) waste management and storage, B) product display, and C) access and
affordability. Research on these subjects was done through a review of both web and scholarly
literature, outreach to other similar mobile market programs, listening sessions with community
members and trips to the GFB and other markets.
Through our research and compilation of data, we have found that there are a few specific
steps that the GFB could take to improve the efficiency, affordability, accessibility and fairness
of the program. First, depending on available funds, there are many different options to mitigate
food loss and maximize efficiency ranging from solutions as simple as ice-packs and as
advanced as solar panels. Second, the fundamental structure of the product display is effective
and can be enhanced through additional displays such as chalkboards, tables, and baskets that
would improve accessibility and better highlight products. Finally, the GFB is doing a good job
of reflecting the real cost of food while keeping prices low, but there are a few options for
additional programs that would increase affordability without undercutting farmers.
While we hope that this synthesis provides helpful feedback and suggestions to the Good
Food Bus team, we also hope that this can serve as an informative guide for internal reflection
and assessment for other mobile market programs. In the report below, you will find background
information on issues surrounding access to fresh, healthy and local food, detailed methodology
outlining our approaches to finding information, and synthesized recommendations for
improvements moving forward.
1
TABLE OF CONTENTS
EXECUTIVE SUMMARY 1
TABLE OF CONTENTS 2
INDEX OF TABLES AND FIGURES 3 Figures 3 Tables 3
INTRODUCTION 4
METHODS, RESULTS, AND RECOMMENDATIONS BY FOCUS AREA 8 Focus Area A: Product Storage and Waste Management 8
A1: Methods 8 A1: Results 9 A1: Recommendations 13
Focus Area A2: Product Storage and Refrigeration 15 A2: Methods 15 A2: Results and Recommendations 15
Focus Area B: Product Display 17 B: Methods 17 B: Results and Recommendations 17
Focus Area C: Access and Affordability 19 C: Methods 19 C: Results 21 C: Recommendations 23
Focus Area D: Listening Sessions 25 D: Methods 25 D: Results and Recommendations 26
TAKEAWAYS AND RECOMMENDATIONS 30
REFERENCES CITED 31
APPENDICES 32 APPENDIX I: Questionnaire 32 APPENDIX II: Waste Data Spreadsheet 33 APPENDIX III: Product Display 37 APPENDIX IV: Price Comparison Spreadsheet 37 APPENDIX V: Listening Sessions Report 40
2
INDEX OF TABLES AND FIGURES
Figures Figure 1: Conceptual Framework 7 Figure 2: Top 15 Spoiled Products 12 Figure 3: Monetary Loss from Spoiled Products 12 Figure 4: Least Popular Items 13 Figure 5: Add-on Options for Product Display 19 Figure 6: General Pricing Trends 21 Figure 7: Price Comparisons for Top Grossing GFB Items 22 Tables Table 1: Food Loss 10 Table 2: Cost of Food Loss 11 Table 3: Cost Comparisons of Refrigeration Systems 16 Table 4: Signage Examples 18
3
INTRODUCTION
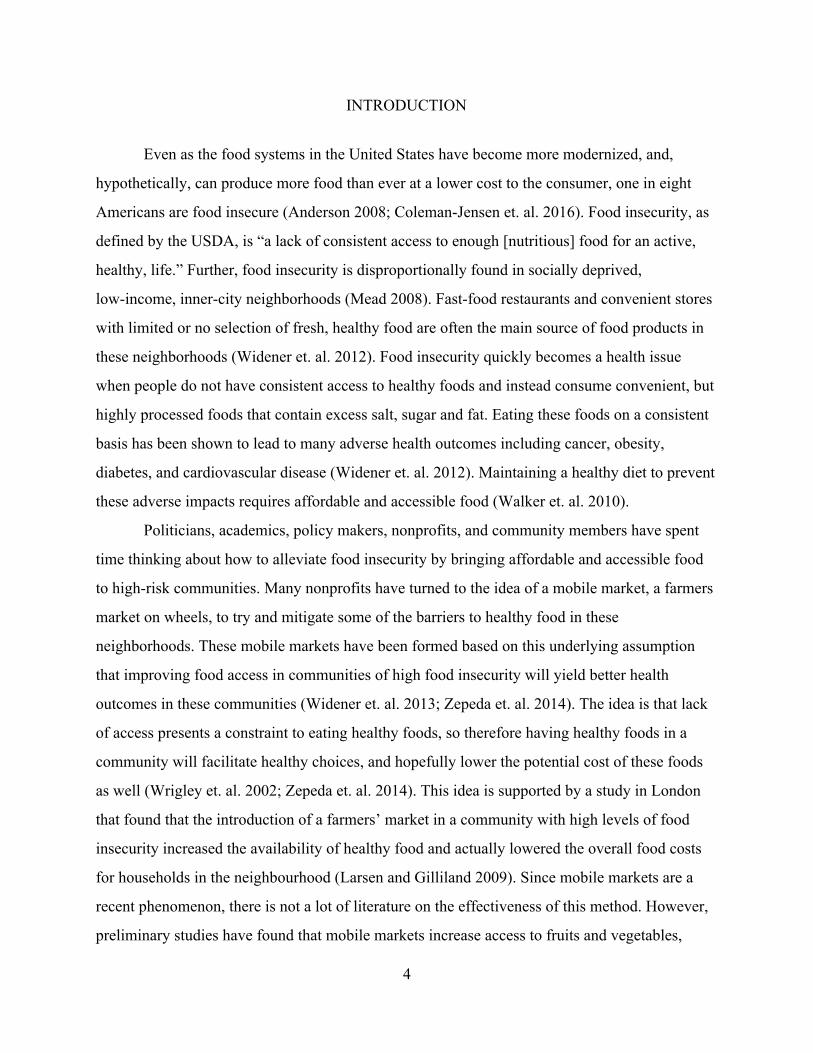
Even as the food systems in the United States have become more modernized, and,
hypothetically, can produce more food than ever at a lower cost to the consumer, one in eight
Americans are food insecure (Anderson 2008; Coleman-Jensen et. al. 2016). Food insecurity, as
defined by the USDA, is “a lack of consistent access to enough [nutritious] food for an active,
healthy, life.” Further, food insecurity is disproportionally found in socially deprived,
low-income, inner-city neighborhoods (Mead 2008). Fast-food restaurants and convenient stores
with limited or no selection of fresh, healthy food are often the main source of food products in
these neighborhoods (Widener et. al. 2012). Food insecurity quickly becomes a health issue
when people do not have consistent access to healthy foods and instead consume convenient, but
highly processed foods that contain excess salt, sugar and fat. Eating these foods on a consistent
basis has been shown to lead to many adverse health outcomes including cancer, obesity,
diabetes, and cardiovascular disease (Widener et. al. 2012). Maintaining a healthy diet to prevent
these adverse impacts requires affordable and accessible food (Walker et. al. 2010).
Politicians, academics, policy makers, nonprofits, and community members have spent
time thinking about how to alleviate food insecurity by bringing affordable and accessible food
to high-risk communities. Many nonprofits have turned to the idea of a mobile market, a farmers
market on wheels, to try and mitigate some of the barriers to healthy food in these
neighborhoods. These mobile markets have been formed based on this underlying assumption
that improving food access in communities of high food insecurity will yield better health
outcomes in these communities (Widener et. al. 2013; Zepeda et. al. 2014). The idea is that lack
of access presents a constraint to eating healthy foods, so therefore having healthy foods in a
community will facilitate healthy choices, and hopefully lower the potential cost of these foods
as well (Wrigley et. al. 2002; Zepeda et. al. 2014). This idea is supported by a study in London
that found that the introduction of a farmers’ market in a community with high levels of food
insecurity increased the availability of healthy food and actually lowered the overall food costs
for households in the neighbourhood (Larsen and Gilliland 2009). Since mobile markets are a
recent phenomenon, there is not a lot of literature on the effectiveness of this method. However,
preliminary studies have found that mobile markets increase access to fruits and vegetables,
4
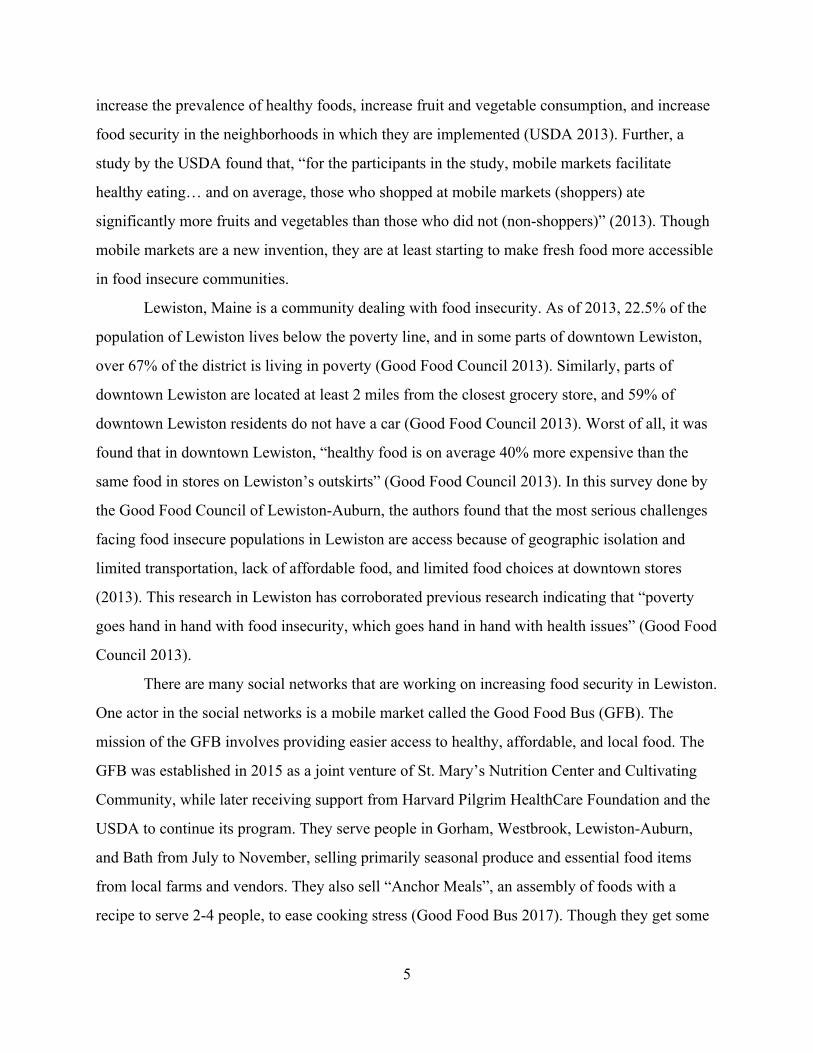
increase the prevalence of healthy foods, increase fruit and vegetable consumption, and increase
food security in the neighborhoods in which they are implemented (USDA 2013). Further, a
study by the USDA found that, “for the participants in the study, mobile markets facilitate
healthy eating… and on average, those who shopped at mobile markets (shoppers) ate
significantly more fruits and vegetables than those who did not (non-shoppers)” (2013). Though
mobile markets are a new invention, they are at least starting to make fresh food more accessible
in food insecure communities.
Lewiston, Maine is a community dealing with food insecurity. As of 2013, 22.5% of the
population of Lewiston lives below the poverty line, and in some parts of downtown Lewiston,
over 67% of the district is living in poverty (Good Food Council 2013). Similarly, parts of
downtown Lewiston are located at least 2 miles from the closest grocery store, and 59% of
downtown Lewiston residents do not have a car (Good Food Council 2013). Worst of all, it was
found that in downtown Lewiston, “healthy food is on average 40% more expensive than the
same food in stores on Lewiston’s outskirts” (Good Food Council 2013). In this survey done by
the Good Food Council of Lewiston-Auburn, the authors found that the most serious challenges
facing food insecure populations in Lewiston are access because of geographic isolation and
limited transportation, lack of affordable food, and limited food choices at downtown stores
(2013). This research in Lewiston has corroborated previous research indicating that “poverty
goes hand in hand with food insecurity, which goes hand in hand with health issues” (Good Food
Council 2013).
There are many social networks that are working on increasing food security in Lewiston.
One actor in the social networks is a mobile market called the Good Food Bus (GFB). The
mission of the GFB involves providing easier access to healthy, affordable, and local food. The
GFB was established in 2015 as a joint venture of St. Mary’s Nutrition Center and Cultivating
Community, while later receiving support from Harvard Pilgrim HealthCare Foundation and the
USDA to continue its program. They serve people in Gorham, Westbrook, Lewiston-Auburn,
and Bath from July to November, selling primarily seasonal produce and essential food items
from local farms and vendors. They also sell “Anchor Meals”, an assembly of foods with a
recipe to serve 2-4 people, to ease cooking stress (Good Food Bus 2017). Though they get some
5
select items from outside of Maine, such as citrus and bananas, they believe that “small-scale,
Maine agriculture is an important part of Maine’s economy, culture and future” and thus receive
the majority of what they sell from local producers such as Emery Family Farm in Wayne and
Fresh Start Farms in Lisbon (Good Food Bus 2017). Their ultimate goal is to support local farms
and provide affordable food while also maintaining their mobile market business.
Though they have had three successful seasons thus far, and sales are up 40% from the
first year, there are many issues they are working to overcome (Sherie Blumenthal, meeting with
authors). One of these challenges is striking the balance between supporting the local farm
economy while also keeping food affordable. Though they are a subsidized program and could
likely discount food to make it more affordable, they don’t want to undercut the farms and
producers which are selling to similar locations. One method they have employed to address this
is to accept payments from SNAP/EBT and WIC recipients, and provide bonus fruits and
vegetables to those who use these assistance programs through the Maine Harvest Bucks
program. Though this is a great step in the right direction, they are interested in finding other
methods to make food accessible and affordable, while also not undercutting other vendors.
Beyond this greater issue, they are also consistently addressing the logistical challenges of
providing food on wheels, such as product storage and management, food waste, and managing
space and display. To best assist the Good Food Bus team with these issues, at the beginning of
this research project, we identified our aims and objectives as follows:
Aim: To provide information to and assist the Good Food Bus (GFB) team in maximizing the potential of the GFB program by increasing its accessibility, efficiency, affordability and fairness. Objective 1: Through focus groups and research, identify some of the barriers that make mobile markets inaccessible, to further increase information about accessibility and enable the GFB team to make their mobile market more accessible to the people of Gorham, Westbrook, Lewiston-Auburn, and Bath. Objective 2: Draw upon existing literature and conversations with other mobile market teams to understand the ways these mobile markets have balanced affordability of produce with fairness to local farmers, and make recommendations for ways the GFB can improve in this respect. Objective 3: Explore the ways other mobile markets have improved efficiency to be able to provide the GFB concrete ways to streamline their operations, both in making the actual trailer more energy efficient, and by reducing excess food waste and labor time.
6
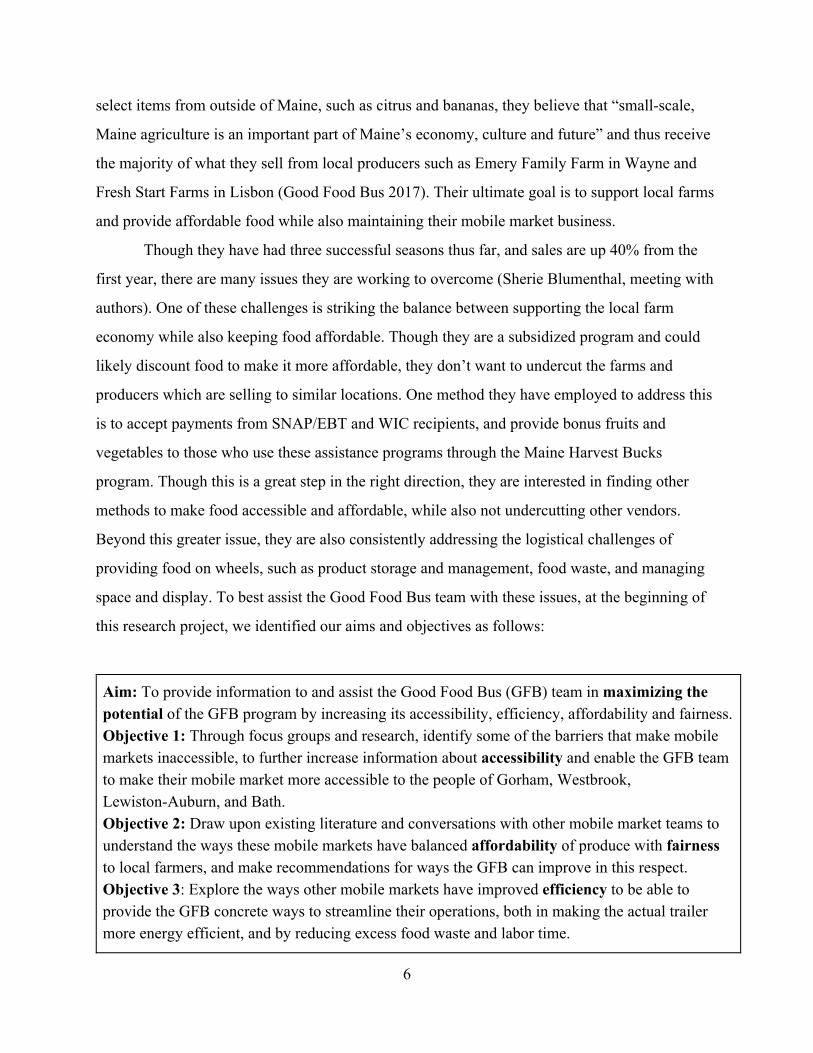
The GFB team provided us with four focus areas that address these objectives and inform
our larger aim. Focus Area A (Product Storage and Waste Management) investigates product
storage and waste management by analyzing waste data and then looking for ways to mitigate
food waste and food loss, including investigating the feasibility of converting the GFB trailer
into a mobile refrigeration unit. Focus Area B (Product Display) deals with product display by
looking into ways to make the GFB physically more accessible and customer-friendly. Focus
Area C (Access and Affordability) explored the accessibility of the GFB by comparing price data
from the GFB to other retailers and analyzing the different strategies implemented by other
mobile markets to make their food more affordable to customers. For Focus Area D (Listening
Sessions) we took notes at listening sessions held in the different communities that the GFB
serves, and used this as a method to to gather information that would later inform our other
Focus Areas. Other methods included on-the-ground research whereby our group visited the
Good Food Bus and other markets; a questionnaire sent out to other mobile markets to compare
their project design to that of the GFB (Appendix I); and an extensive web and literature review
of academic articles and the websites of other mobile markets to get a nuanced picture of why
and how mobile markets are utilized in communities of high food insecurity. To better
understand how all of these moving parts relate to one another, we created a graphic to
demonstrate the interconnectedness of the methods, focus areas, objectives and aim (Figure 1).
Figure 1: A conceptual framework to clarify how our methods (blue) inform our focus areas (red) and how those map onto our objectives (green) and our larger aim (orange) for this project.
7
METHODS, RESULTS, AND RECOMMENDATIONS BY FOCUS AREA
Focus Area A: Product Storage and Waste Management For clarity purposes in this report, Waste Management is denoted as Focus Area A1 and Product Storage and Refrigeration is denoted as Focus Area A2. These were not separated into separate Focus Areas because Waste Management and Product Storage have closely related strategies. The goals for addressing the issues of product storage and waste management on the Good Food Bus were two-fold: determine total food loss, costs associated with food loss, and trends in food loss for specific products to be able to discern potential solutions to alleviate this food loss, including investigating the potential to configure the trailer into a mobile refrigeration system. Focus Area A1: Waste Management
A1: Methods
Determining GFB Food Loss
The GFB keeps track of their purchases, inventory, and sales using a web program called
the Farmers Registry. The Farmers Registry had data for the entire 2017 season in various
reports. Generally it provides good data, but there are some times when various reports don’t
match up in information, so certain specific data may not be entirely accurate.
Within the Farmers Registry there were two reports which were especially useful for
determining food loss: Inventory Actions and Product Profitability. In the Inventory Actions
report, it outlines inventory increases or decreases as they come in, the wholesale and retail costs,
the wholesale and retail quantities, as well as inventory actions. Inventory actions denotes the
gain or loss in inventory. If there was an inventory loss, the loss was explained in the Reduction
Type column. Reduction Type had five categories: spoiled, damaged, donated, resold, loss, and
unknown. Besides resold, all of these reduction types led to a loss of profit on these items.
Resold generally meant it was going towards being used in an anchor meal. It is assumed that
spoiled and food loss was food taken from the system which could no longer be used for other
reasons, and thus was composted. Damaged, donated, lost, and unknown, could be used for other
reasons but was a financial loss for the GFB. The unknown category could also entail a mix up in
the system in inputting data or human error, and thus is not actual food loss.
The second report which was used to determine food loss data was the Product
Profitability Report. The Product Profitability Report provides a summary of each products
8
inventory, quantity sold and lost, prices and costs, and profitability statistics. These totals were
cross referenced to calculated totals of quantity, cost, and loss in the Inventory Transactions
Report to ensure that there was consistency through the reports. These reports provide similar
information, but the Inventory Transactions report provides more specific reasons for food loss,
and the Product Profitability Report provides more readily available general trends.
Questionnaire for Other Mobile Markets
The questionnaire which we sent to various mobile markets provided information about
average food loss on mobile markets, and provided us with potential waste management
techniques. For this focus area we focused primarily on questions 5, 6, and 7 of the questionnaire
(Appendix I).
A1: Results
General Trends- Total Food Loss and Associated Costs
Before discussing the specific results from the Farmers Registry it is important to note
that there are inconsistencies in the data. In cross referencing the Inventory Actions and the
Product Profitability reports there were some inconsistencies in the wholesale quantity
purchased, total wholesale cost, amount lost, and amount resold (i.e. when the total wholesale
quantity was calculated in the Inventory Actions report it did not equal the noted total wholesale
quantity in the Product Profitability Report). Furthermore, there was significant food loss data
which was marked as “unknown.” (Table 1) As stated in the methods, this could simply be due
to human error or miscalculation, not actual food loss. Yet there could also be some unknown
which is food loss, but the nature of where the food was lost is uncertain. These incongruencies
in the data make it so that the following results are not exactly representative, but provide
important general themes.. For that reason, when looking at more specific products, we will
focus solely on the “spoiled” category.
9
Spoiled Damaged Donated Unknown Total Loss
Number of Products
419 4 124 340 971
Average Percent per Product
10.47% .13% 3.86% 1.75% 16.22%
Table 1. Total product loss and average per product loss for various food loss categories across all 74 products studied.
The following food loss data analysis includes only fruits, vegetables, and eggs (no
grocery, dairy, or nuts). There was some minor waste data for a few grocery items (for example,
there was one loaf of damaged bread), but the rest was negligible or had no data (i.e. it did not
exist in the Inventory Actions report). The total produce loss for all categories (spoiled, donated,
damaged, unknown) for the 74 products measured for the 2017 GFB season was 8.53%
(calculated by dividing the total quantity of products lost by the retail quantity purchased). Even
though this percent may not reflect the actual food loss of the program (because of the
“unknown” loss), this percentage reflects the total potential food loss which may have occurred.
This food loss amount is comparable to the other mobile markets in the questionnaire, which
amounted to an average of 6% among six mobile markets. For the specifics of food waste
management however, we examined simply the amount of “spoiled products” which adds up to
3.8% of all products measured. Of those 74 products, 43 had some amount of spoilage, and 31
had no spoilage at all.
The costs associated with total food loss and spoil reflect the various prices of those lost
products. The costs associated with total food loss and food spoil from all products can be seen
in Table 2. The cost for buying the product reflects the actual monetary loss from the food
spoil/loss, but there is also the opportunity cost to be considered in not having sold that product.
This monetary loss could be factored into payment for waste management strategies and
refrigeration, as it is likely these costs would lessen with better techniques.
10
Spoiled Total Loss
Total Monetary Loss Based on Average Unit Cost per Product
$789.16 $1769.45
Total Monetary Loss Based on Average Unit Price per Product
$1,058.45 $2275.92
Percent Monetary Loss Based on Total Unit Cost versus Total
Wholesale Cost
4.93% 11.05%
Table 2. Costs associated with food loss and spoil for all 74 products studied. The first row is based off of the unit cost when buying the products wholesale. The second row is the amount that was lost from not having sold that produce at the average mark-up price. The third row is a calculation of the unit wholesale cost of the products divided by the total wholesale costs of all the products bought (i.e. percent of money lost based on unit costs). Product Specific Food Loss
In order to make a relevant waste management program to the GFB, it is important to
know which products need to be targeted. The following section analyzes the top 15 most spoiled
products, the top 15 products which lead to the most monetary loss from spoil, and the 15 least
popular products. For a full analysis of each product for these various variables (as well as for
other food loss categories) see Appendix II.
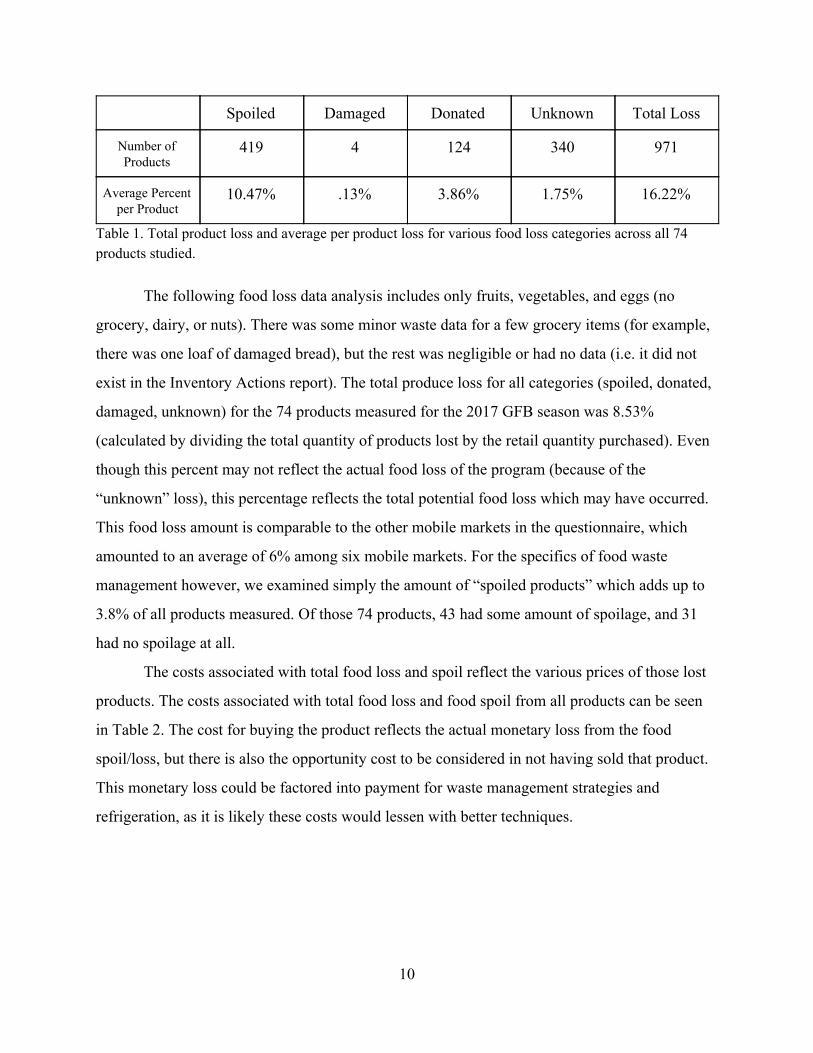
In looking at the fifteen most spoiled foods, common trends included herbs, greens, or
less commonly sold “niche” items such as shitake mushrooms and tomatillos (Figure 2) . The
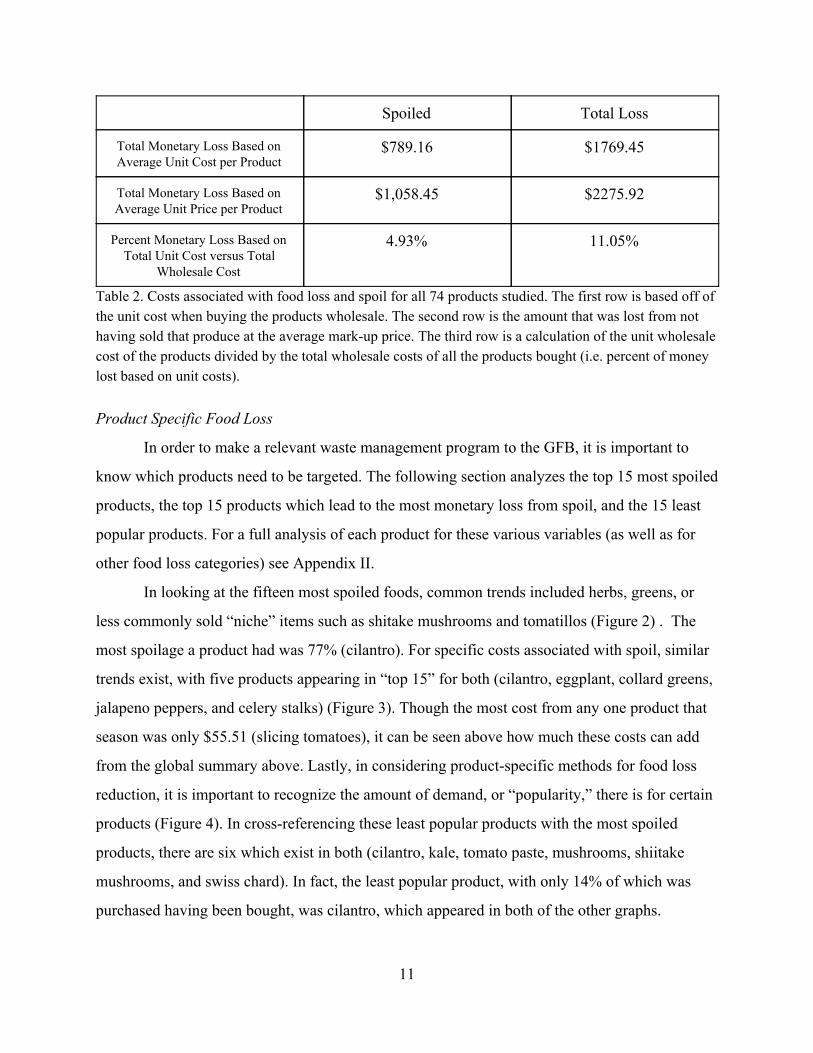
most spoilage a product had was 77% (cilantro). For specific costs associated with spoil, similar
trends exist, with five products appearing in “top 15” for both (cilantro, eggplant, collard greens,
jalapeno peppers, and celery stalks) (Figure 3). Though the most cost from any one product that
season was only $55.51 (slicing tomatoes), it can be seen above how much these costs can add
from the global summary above. Lastly, in considering product-specific methods for food loss
reduction, it is important to recognize the amount of demand, or “popularity,” there is for certain
products (Figure 4). In cross-referencing these least popular products with the most spoiled
products, there are six which exist in both (cilantro, kale, tomato paste, mushrooms, shiitake
mushrooms, and swiss chard). In fact, the least popular product, with only 14% of which was
purchased having been bought, was cilantro, which appeared in both of the other graphs.
11
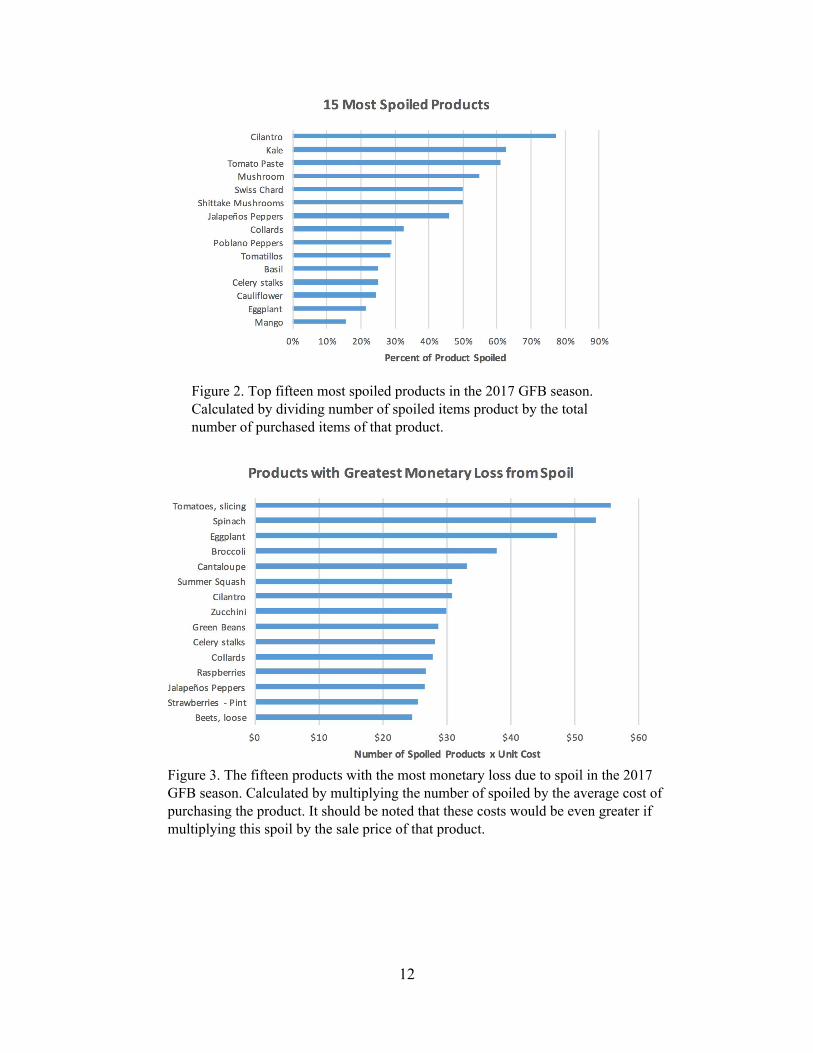
Figure 2. Top fifteen most spoiled products in the 2017 GFB season. Calculated by dividing number of spoiled items product by the total number of purchased items of that product.
Figure 3. The fifteen products with the most monetary loss due to spoil in the 2017 GFB season. Calculated by multiplying the number of spoiled by the average cost of purchasing the product. It should be noted that these costs would be even greater if multiplying this spoil by the sale price of that product.
12
Figure 4. The fifteen least popular products in the 2017 GFB season. Calculated by dividing the quantity sold by the quantity purchased of each product.
A1: Recommendations
Though we will provide suggestions for how to do a greater revamp to reduce food waste
with a new refrigeration system, there are also many options which are simpler and cheaper fixes
to reduce food loss. The following suggestions for addressing waste are compiled from the
questionnaire or were brainstormed by our group. For those which were recommended by other
mobile markets, they are cited following the suggestion. We included all relevant and feasible
suggestions which came from the survey, but ordered them from more highly recommended to
less based on their suitability to the GFBs goals as a program, their likely effectiveness, and their
ease in implementing:
1. Handle products as little as possible and properly training staff (SAMM Van; Fresh
Truck; Real Food Farm)
2. Display with cooling capacities: putting ice packs in display containers and covering
them with cloth, and then resting produce on top (SAMM Van); nesting industrial plastic
containers (one large with ice water, with one smaller one inside with the produce (and
there are fitting tops so they won’t spill during motion); having an herb rack made of
mason jars which hold water and are stored in the fridge when not on display to keep
herbs from wilting.
13
3. “Bruised but Beautiful” basket for ripe or lightly damaged produce. Anticipate spoilage a
few days out and put those items on discount. Can have various levels of discount based.
on the quality of the product (My Street Grocery; St. Louis MetroMarket; Freshest
Cargo) This program is especially beneficial because it addresses the issue of
affordability for clients, while also allowing the GFB to recoup some losses.
4. “Product of the week” with a recipe for how to cook that product and some facts about
why that product is nutritionally beneficial. This would help for some of least popular
and niche items which people may not be as familiar with (Figure 4). With available time
and facilities, the GFB could even provide small tastings of that item.
5. Assorted bunches of herbs and greens which would allow customers to only take the
amount they want (rather than already having prepackaged quantities). This is especially
relevant to herbs, which people may not want to spend much money on, and which
people only need small amounts of for meals.
6. Strategic ordering, FIFO (first in first out) inventory, dating deliveries, and analyzing past
weeks sales to optimize purchase amount (Mobile Food Market; Fresh Truck; Freshest
Cargo). Some of these strategies are already adopted by the GFB, but the more time spent
on specificity of these and figuring out an efficient system to keep up with these would be
beneficial. It is also important, though, to consider the relationships to farmers and their
reliance on the GFB to sell certain products they produce.
7. Value added processing such as pickles, salsas, or juicing. This could be done by the
GFB themselves or could be a partnership with a local commercial kitchen (Mill City
Growers). Though this requires more time and labor, it is beneficial because it allows for
a greater potential profit, and it can allow for produce to last longer into the season (for
the GFB and for customers).
8. Removing less popular and expensive products from sales. This could be determined by
assessing the food loss/spoil, expenses, and popularity of each product provided in
Appendix II. Similar to suggestion 6, it is also important to consider the farmers who may
rely on the GFB for sale of certain products.
14
9. Keeping back storage in coolers and out of sun during the hot months to keep products
looking good, especially those that tend to wilt (greens and herbs) (SAMM Van; Real
Food Farm). This is a great option for cooling, but is more laborious and takes up more
space than the other cooling options presented above.
10. Partnering with Local Restaurants who purchase leftovers to recoup costs, or sell to staff.
(Mobile Food Market; Freshest Cargo) This would be time consuming and cumbersome
to GFB employees, and does not necessarily provide for the current goals of the GFB.
However, if the program continues to expand, it may be a worthwhile option.
Focus Area A2: Product Storage and Refrigeration
A2: Methods
To tackle the issue of storage and refrigeration we looked at how other mobile markets
addressed this through looking at websites of mobile markets as well as through the responses
collected from Adair’s questionnaire. We also researched the feasibility of alternative modes of
refrigeration as well as the potential costs involved in such systems.
A2: Results and Recommendations
Most other mobile markets we’ve researched have small chest refrigerators and freezers
installed on board their bus. Others use cold plate refrigeration and others only have a walk in
refrigeration unit at their Headquarters. The ones with refrigerators on board only plug them in
when stationary, but one mobile market (The Mill City Grows Mobile Market) has actually
installed solar panels on the roof of their bus to power the refrigerators on board. We later
explored the feasibility of such a system for the Good Food Bus team but mainly focused on the
potential of converting the Good Food Bus trailer into its own mobile refrigeration unit.
With the installation of a 24k btu window AC unit hooked up to a temperature modifier
called “coolbot”, the AC unit would be capable of reaching temperatures below its pre
programmed minimum of 60 degrees. With complete insulation of the walls, ceiling and floor,
the trailer would theoretically be able to reach temperatures in the high 30s to low 40s. This
would allow the good food bus team to store their produce on the trailer itself and not have to
worry about loading produce from their refrigerators in the Nutrition Center to the trailer itself.
15
Refrigerating the whole trailer would also allow produce to stay fresh for a longer duration of
time while they travel to the different locations they serve. In this setup, the AC unit would be
plugged into an outlet while stationary at the Nutrition Center or at an actual stop. While on the
road, the AC unit would be turned off and the temperature would stay somewhat stable
throughout the duration of the drive. For on the road refrigeration however, the purchase of a
gasoline generator would need to be considered.
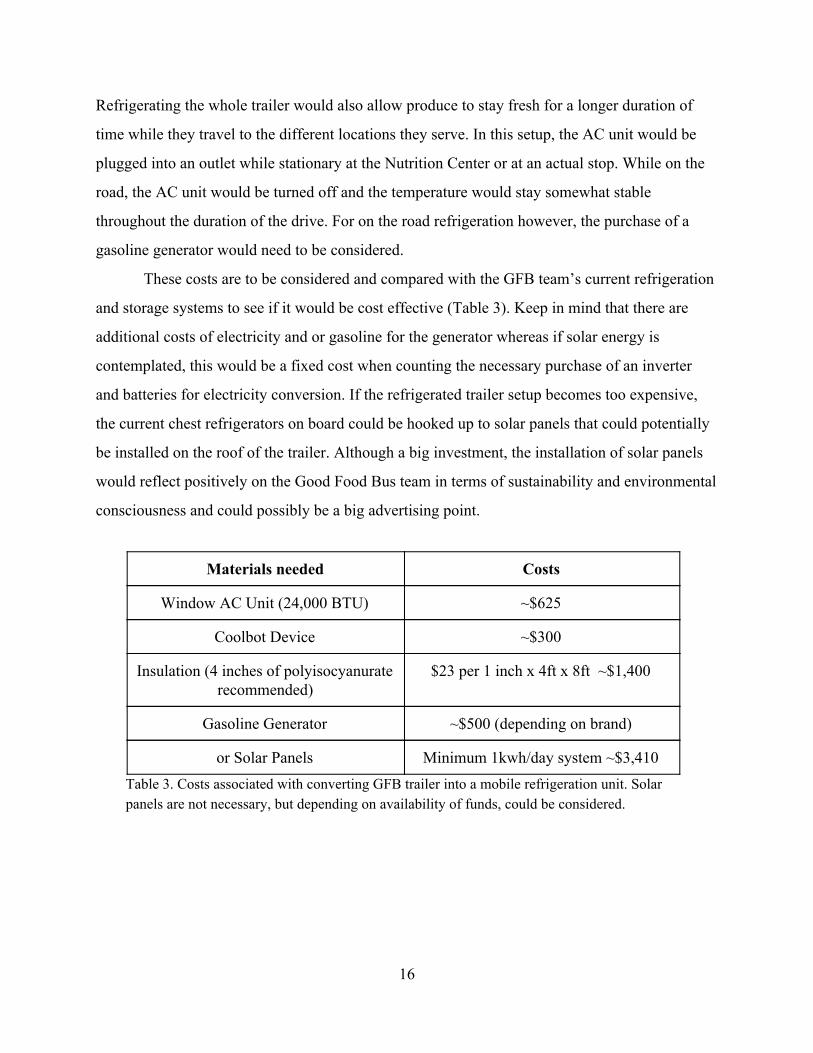
These costs are to be considered and compared with the GFB team’s current refrigeration
and storage systems to see if it would be cost effective (Table 3). Keep in mind that there are
additional costs of electricity and or gasoline for the generator whereas if solar energy is
contemplated, this would be a fixed cost when counting the necessary purchase of an inverter
and batteries for electricity conversion. If the refrigerated trailer setup becomes too expensive,
the current chest refrigerators on board could be hooked up to solar panels that could potentially
be installed on the roof of the trailer. Although a big investment, the installation of solar panels
would reflect positively on the Good Food Bus team in terms of sustainability and environmental
consciousness and could possibly be a big advertising point.
Materials needed Costs
Window AC Unit (24,000 BTU) ~$625
Coolbot Device ~$300
Insulation (4 inches of polyisocyanurate recommended)
$23 per 1 inch x 4ft x 8ft ~$1,400
Gasoline Generator ~$500 (depending on brand)
or Solar Panels Minimum 1kwh/day system ~$3,410 Table 3. Costs associated with converting GFB trailer into a mobile refrigeration unit. Solar panels are not necessary, but depending on availability of funds, could be considered.
16
Focus Area B: Product Display This focus area investigated what physical changes could be made to the product display on the GFB. Accessibility, efficiency and aesthetic appeal were all considered when designing new ideas for display. B: Methods
The current produce display setup in the trailer works fine, so we addressed ways to stay
within the current theme of the display when thinking of what to add. Our designs ideas came
from researching how other similar mobile markets display their produce and create an easily
navigable space for customers. This was done by looking at the responses on Adair’s
questionnaire and by looking at websites and images of other mobile markets. Additionally, we
took results from Focus Areas A and D to help inform the changes. Specifically, we used waste
data and listening session feedback to inform our recommendations.
B: Results and Recommendations
While keeping the basic structure of the current display, we found that there are several
add-on options that would enhance both the functionality and appearance of the GFB. There is a
full list of pricing for the following options in Appendix III. First, we found that signage could
be improved to increase clarity on both what the GFB is and what the GFB is selling. Signs that
clarify that the GFB is a mobile market would help attract more customers. A chalkboard
inventory that lays out every item that the bus is selling with the help of visual aids would ensure
that customers are fully aware of all of their options. Finally, a smaller portable chalkboard could
be used to highlight and draw attention to specific items (Table 4).
Additionally, we thought that adding a table to the left side of the trailer to create a semi
circle would help more clearly define the shopping space. This could be done with a simple
folding table, or more produce specific display tables could be purchased. While these would be
outfitted with wheels and might be easier to move, they also would be more expensive. This
table would be a good space to display “bruised but beautiful” items as discussed in Focus Area
A1.
17
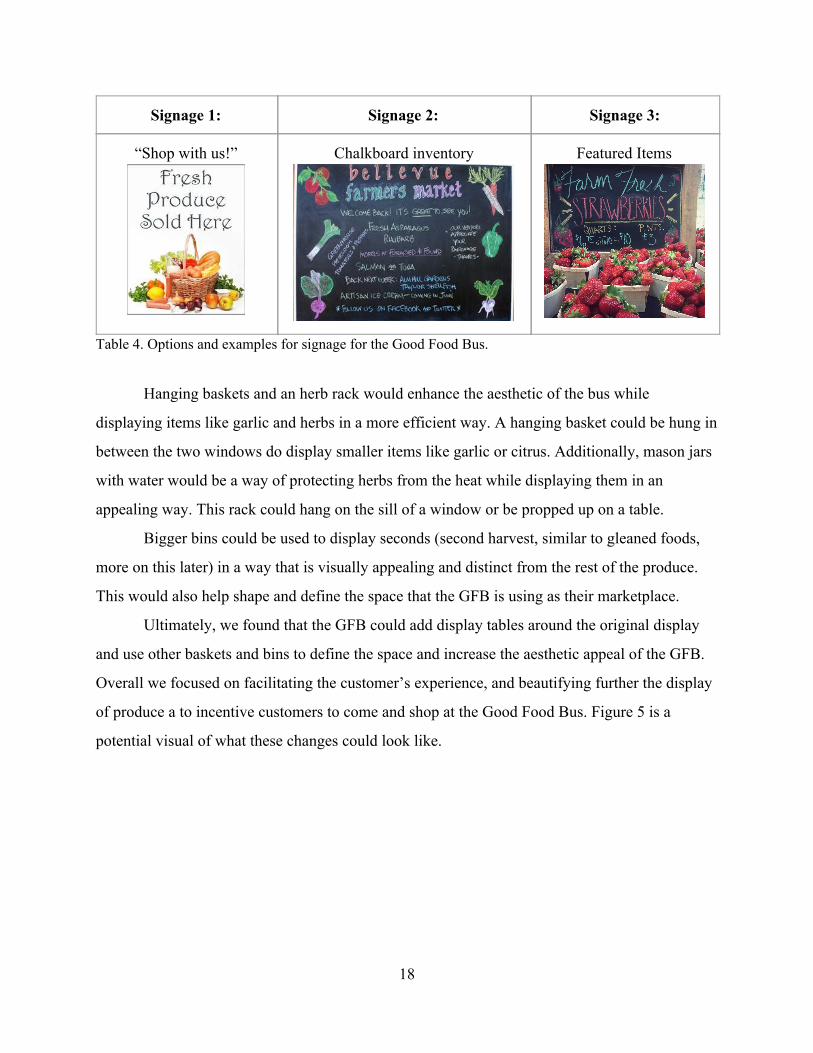
Signage 1: Signage 2: Signage 3:
“Shop with us!”
Chalkboard inventory
Featured Items
Table 4. Options and examples for signage for the Good Food Bus.
Hanging baskets and an herb rack would enhance the aesthetic of the bus while
displaying items like garlic and herbs in a more efficient way. A hanging basket could be hung in
between the two windows do display smaller items like garlic or citrus. Additionally, mason jars
with water would be a way of protecting herbs from the heat while displaying them in an
appealing way. This rack could hang on the sill of a window or be propped up on a table.
Bigger bins could be used to display seconds (second harvest, similar to gleaned foods,
more on this later) in a way that is visually appealing and distinct from the rest of the produce.
This would also help shape and define the space that the GFB is using as their marketplace.
Ultimately, we found that the GFB could add display tables around the original display
and use other baskets and bins to define the space and increase the aesthetic appeal of the GFB.
Overall we focused on facilitating the customer’s experience, and beautifying further the display
of produce a to incentive customers to come and shop at the Good Food Bus. Figure 5 is a
potential visual of what these changes could look like.
18
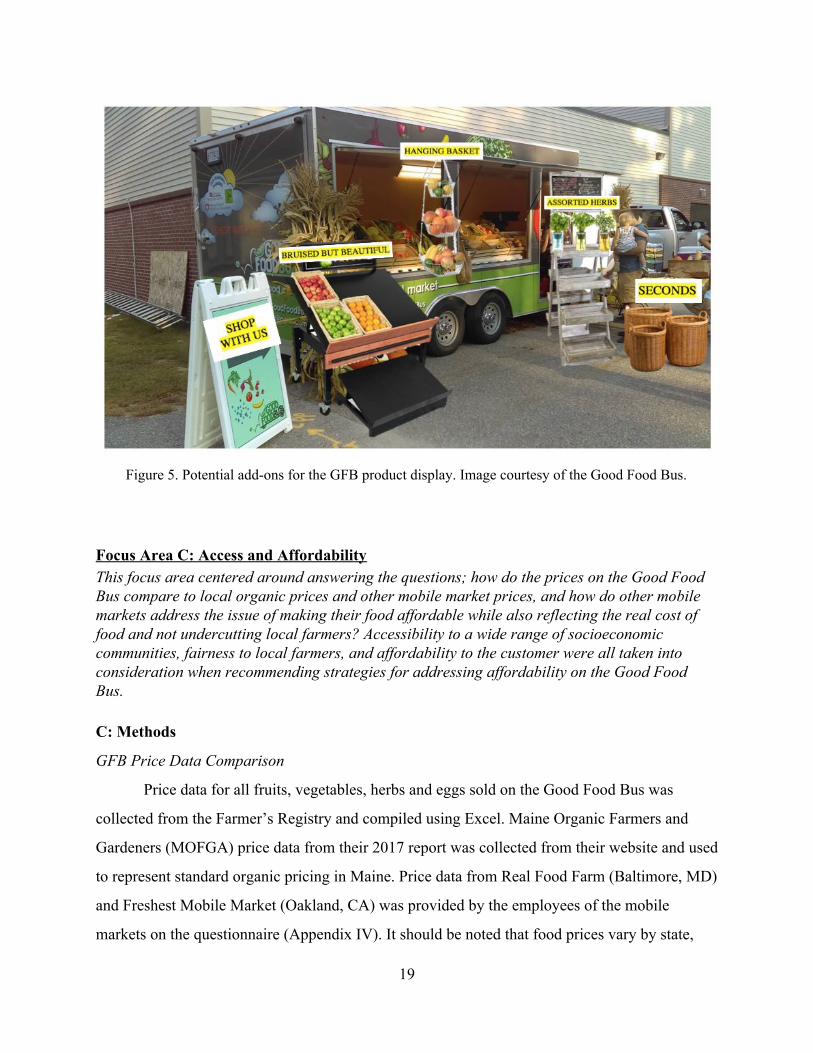
Figure 5. Potential add-ons for the GFB product display. Image courtesy of the Good Food Bus.
Focus Area C: Access and Affordability This focus area centered around answering the questions; how do the prices on the Good Food Bus compare to local organic prices and other mobile market prices, and how do other mobile markets address the issue of making their food affordable while also reflecting the real cost of food and not undercutting local farmers? Accessibility to a wide range of socioeconomic communities, fairness to local farmers, and affordability to the customer were all taken into consideration when recommending strategies for addressing affordability on the Good Food Bus. C: Methods
GFB Price Data Comparison
Price data for all fruits, vegetables, herbs and eggs sold on the Good Food Bus was
collected from the Farmer’s Registry and compiled using Excel. Maine Organic Farmers and
Gardeners (MOFGA) price data from their 2017 report was collected from their website and used
to represent standard organic pricing in Maine. Price data from Real Food Farm (Baltimore, MD)
and Freshest Mobile Market (Oakland, CA) was provided by the employees of the mobile
markets on the questionnaire (Appendix IV). It should be noted that food prices vary by state,
19
and it might be a more accurate comparison to compare the GFB to Real Food Farm as opposed
to Freshest Mobile Market simply because of geographical differences. In order to create a
localized price comparison, price data from Hannaford and Walmart (two places identified in the
Listening Sessions as places people in Lewiston-Auburn frequently shop) was collected. It
should be noted that these prices were taken in March of 2018 when much of the produce is out
of season, while all other prices came from the 2017 growing season (May-October). The prices
at these retail locations would presumably be lower in the summer months. Members of the GFB
capstone group went to these shopping places and wrote down the prices of produce that is sold
both at these retail locations and on the GFB. We only took data on conventional (non-organic)
prices, because we made the assumption that people who were shopping at these retail locations
were doing so because of the assumed lower prices. All collected data was added to the GFB
Excel price data sheet. To make up for inconsistencies in data (ie. GFB sells plantains but
MOFGA does not have organic price data for plantains), data was entered by hand. Price data
was only compared for products that the GFB sells (ie. if Real Food Farm sells parsnips but the
GFB does not, the data would not be included). Some unit conversions were made to
homogenize the units of price comparison (changing price per pound to price per pint or vice
versa). MOFGA provided different price data from farmers markets, natural food stores and
grocery stores. Based on the similarities of the prices, MOFGA data was averaged for ease of
comparison. Data was analyzed using JMP software. To create an average price per pound for
comparison, all of the price per pound data was averaged. Using data from the Farmer’s
Registry, the top 10 most profitable GFB items were determined (the top ten highest grossing
products). Graphs were created to compare GFB prices to MOFGA, Real Food Farm, Freshest,
Hannaford, and Walmart prices for these top 10 items.
Addressing Affordability
The questionnaire we sent to various mobile markets provided information about
different mobile markets’ strategies for addressing affordability. For this focus area we focused
primarily on questions 14, 15, and 16 of the questionnaire which asked about strategies
20
implemented by different mobile markets and the pros/cons of these strategies (Appendix IV).
These data will appear in the form of recommendations for Focus Area C.
Information about GFB customers’ and Lewiston, Auburn, and Westbrook residents’
opinions about different strategies for addressing affordability was provided from the listening
sessions. Questions were asked to gauge interest in a potential Membership Program that would
offer discounts on produce. These results were compiled in the Listening Session report, and
were taken into account in the recommendations for ways the GFB can address affordability
(Appendix IV).
C: Results
GFB Price Data Comparison
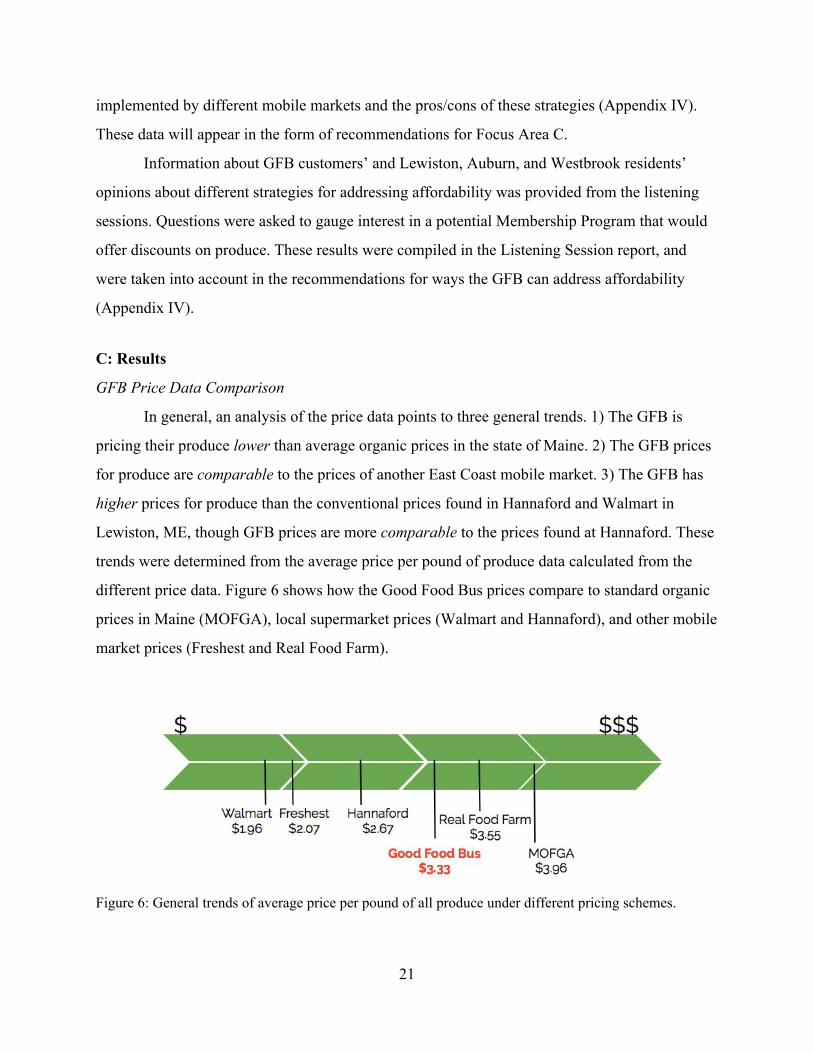
In general, an analysis of the price data points to three general trends. 1) The GFB is
pricing their produce lower than average organic prices in the state of Maine. 2) The GFB prices
for produce are comparable to the prices of another East Coast mobile market. 3) The GFB has
higher prices for produce than the conventional prices found in Hannaford and Walmart in
Lewiston, ME, though GFB prices are more comparable to the prices found at Hannaford. These
trends were determined from the average price per pound of produce data calculated from the
different price data. Figure 6 shows how the Good Food Bus prices compare to standard organic
prices in Maine (MOFGA), local supermarket prices (Walmart and Hannaford), and other mobile
market prices (Freshest and Real Food Farm).
Figure 6: General trends of average price per pound of all produce under different pricing schemes.
21
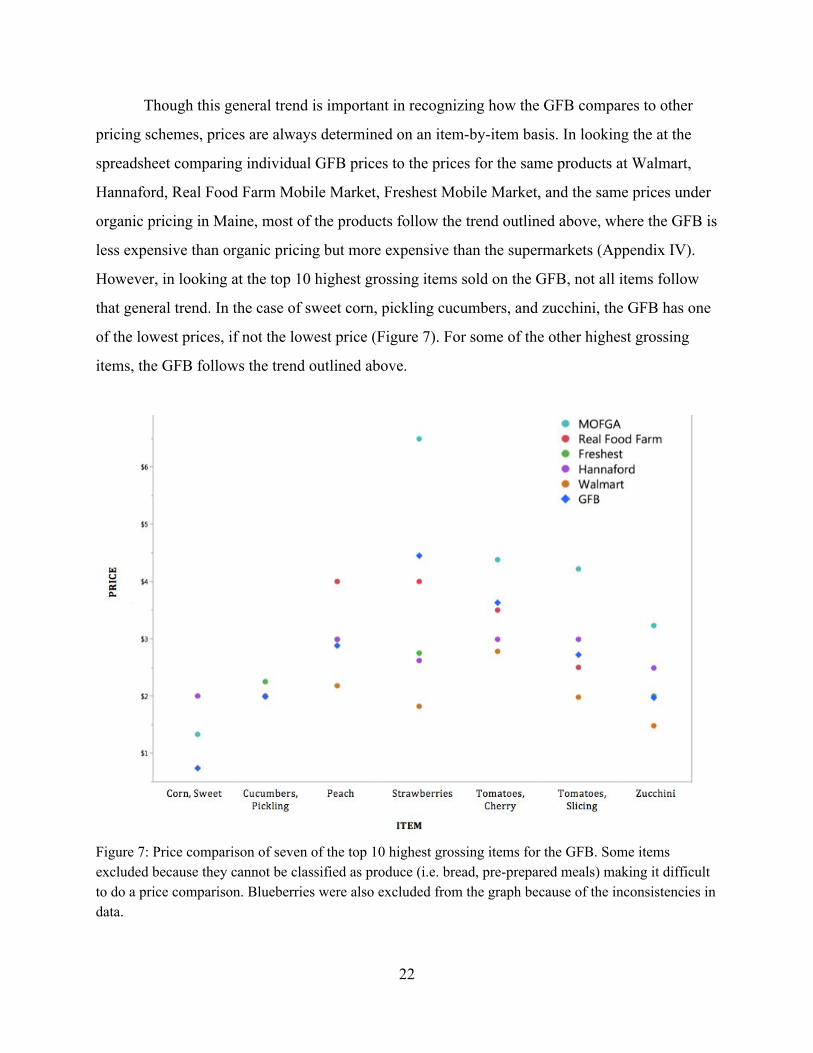
Though this general trend is important in recognizing how the GFB compares to other
pricing schemes, prices are always determined on an item-by-item basis. In looking the at the
spreadsheet comparing individual GFB prices to the prices for the same products at Walmart,
Hannaford, Real Food Farm Mobile Market, Freshest Mobile Market, and the same prices under
organic pricing in Maine, most of the products follow the trend outlined above, where the GFB is
less expensive than organic pricing but more expensive than the supermarkets (Appendix IV).
However, in looking at the top 10 highest grossing items sold on the GFB, not all items follow
that general trend. In the case of sweet corn, pickling cucumbers, and zucchini, the GFB has one
of the lowest prices, if not the lowest price (Figure 7). For some of the other highest grossing
items, the GFB follows the trend outlined above.
Figure 7: Price comparison of seven of the top 10 highest grossing items for the GFB. Some items excluded because they cannot be classified as produce (i.e. bread, pre-prepared meals) making it difficult to do a price comparison. Blueberries were also excluded from the graph because of the inconsistencies in data.
22
As shown in the graph, prices vary greatly between items and between different vendors. For a
comprehensive spreadsheet showing the price comparisons, see Appendix IV.
Though the GFB is generally more expensive than local options, there are some
exceptions to the rule. The following list are all items that are cheaper at the GFB as compared
to Hannafords.
● Fruit: Watermelon, pears, peaches and oranges.
● Vegetables: Fall squash, green beans, white onion, sugar snap peas, red bell peppers,
radish, summer squash, tomatillos, slicing tomatoes, and zucchini.
Similarly the following list are all items that are cheaper at the GFB as compared to Walmart.
● Fruit: Watermelon, pears, and oranges.
● Vegetable: Cauliflower, sugar snap peas, green bell peppers, and red bell peppers.
However, it should be noted again that prices fluctuate throughout the season and that these
grocery store prices were written down in March of 2018, and the prices will likely be cheaper in
the summer.
C: Recommendations
Strategies for Addressing Affordability
From the questionnaire, it was clear that all surveyed mobile markets struggle with
addressing the issue of affordability. Also, it should be noted that there is a lot of variance in the
goals of different mobile markets, so they implement different strategies for addressing
affordability. For example, Freshest Mobile Market (Oakland, CA) has the goal of providing the
cheapest possible food to their customers because they recognize that Oakland is a community
that is dealing with high levels of food insecurity. They are heavily subsidized, and are often able
to sell their products at wholesale price, or at a 10% markup just to cover the cost of waste. As
shown in the graphs above, Freshest was consequently often one of the least expensive options,
and its prices are on average only $0.11 more expensive than the prices at Walmart. On the other
hand, other mobile markets like Real Food Farm are trying to supply neighborhood communities
with affordable and local food, and are still trying to reflect the real cost of food in their prices.
The GFB is similarly trying to balance affordability with reflecting the real cost of food.
23
Results compiled from the questionnaire point to four main strategies for addressing
affordability. These strategies were recommended by various mobile markets in the
questionnaire and are cited following each suggestions (Appendix IV). These suggestions are
ordered from most highly recommended to least based on their suitability to the GFBs goals as a
program, and their ease in implementing:
1. Cheaper Prices Period: only do a 10% markup from wholesale to just cover cost of waste
for produce, which makes the prices as cheap as possible for the customer (Mobile Food
Market; My Street Grocery; St. Louis MetroMarket; Freshest Cargo Mobile Market).
2. Sponsored Healthy Eating: taking from the “FreshCash” program, there is the possibility
for local healthcare providers to buy gift cards to the mobile market and then distribute
the gift cards to community, which subsidizes the cost of food. Incorporating health care
providers into the work of mobile markets further highlights how providing healthy,
accessible, and affordable food is in many ways a healthcare problem (Fresh Truck).
3. Different Prices at Different Stops: categorize stops into “Business Stops” where the
mobile market can provide convenient food at a higher price to the customer and
“Neighborhood Stops” where the mobile market can provide affordable food at a lower
cost to the customer (Seacoast Eat Local SAMM Van).
4. The More You Shop, the Less you Pay (Membership Program): have frequent shopper
discounts which allows the price tag on the food to stay the same, but means the
customers don’t have to pay the full price at the cash register. This could also take the
form of a membership card that gives the customers benefits every time they shop (Real
Food Farm Mobile Market).
Though these strategies can act as stand-alone solutions for addressing affordability, we
recommend a hybrid of these strategies for the GFB. The idea of a Membership Card (Strategy
4) was well received in many of the Listening Sessions. People at the Listening Sessions said
they would be willing to give a name and an email to be able to receive discounts when they
shop. The GFB could combine the Membership Program with the strategy of having different
prices at different stops (Strategy 3) to have different membership benefits at different stops. The
GFB already uses the language of “Business Stops” and “Neighborhood Stops,” and they could
24
have larger discounts on food at the Neighborhood Stops. Finally, the GFB could get in contact
with local healthcare providers such as St. Mary’s Medical Center and Central Maine Medical
Center to see if they would be interested in partnering and implementing a “Good Food Cash”
program (Strategy 2). The healthcare providers could purchase gift cards to the GFB and
distribute the gift cards at community events such as the St. Mary’s “Commit to Get Fit 3k, 5k,
and 10k Challenge.” The GFB is already partially funded by the Harvard Pilgrim Health
Insurance company, so this would act as a way to expand healthcare providers’ involvement in
the project. Together, these strategies would allow the GFB to continue to reflect the real cost of
food in their prices, but at the same time allow customers to pay less at the cash register.
Focus Area D: Listening Sessions This focus area was centered around seeking out, compiling and synthesizing community feedback regarding the functionality and efficacy of the Good Food Bus. A full report from these listening sessions can be found in Appendix V and the major findings and takeaways are outlined below. D: Methods
Six listening sessions were organized to get direct feedback from target customers in
different areas. Some of the sessions were held at places where the GFB has stopped before and
is scheduled to stop again (The Hub in Westbrook, The Center for Wisdom’s Women in
Lewiston) and some of the sessions took place at potential new stops (Raise Op in Lewiston, the
Root Cellar in Lewiston). Listening sessions consisted of roughly ten questions and lasted about
an hour, and the number of participants ranged from two to thirty people per group, with ages
ranging from 10 to 70 years old. The sessions targeted both returning shoppers and people who
had never shopped at the GFB before. They were facilitated by GFB staff and recorded by the
GFB capstone group. It is important to note that answers of individuals were sometimes
influenced by the answers and perceptions of others in the groups, but the facilitation of the
session was set up to avoid any such issues. To see the questions asked and a full report of the
sessions, see Appendix V.
25
D: Results and Recommendations
For the most part, past and potential GFB customers are pleased with how things are
going and excited for improvements in future years. A few questions at the beginning of the
listening sessions went over basic information about what participants want from the GFB, and
for the most part their answers confirmed that what the GFB is doing and selling align with their
needs. More ideas for change and improvement came with questions regarding programs,
discounts, and outreach. Below, sorted by focus area, are key takeaways from these sessions. The
fourth “other” category didn’t map on cleanly to any focus area because they lie outside the
realm of work that we were tasked with, but they still provide important feedback for the GFB
team. Finally, there were many discussions on pricing and the inherent cost of locally sourced
food. Below we provide suggestions for ways to mitigate these costs, but it is important to note
that customers acknowledge this cost and are often understanding of the ramifications of
lowering costs too much. Thus, the programs discussed in the paragraph below in Focus Area C
and those mentioned above in the section of Focus Area C seek to address these costs while
ensuring fair prices for all involved.
Focus Area A: Product Storage and Waste Management
Pre-Order Option
One idea that came up in focus groups was the option of an order-ahead system that
allows shoppers to place an order at the beginning of the week and pick it up when the bus stops
in their neighborhood. This essentially ensures that the shoppers participating know exactly what
they can get ahead of time, thus giving them the consistency of a grocery store experience that
comes to them. This program could help enhance the feeling of “food security” in
neighborhoods--if they have consistent access to the foods they need and want they can avoid
needing to shop at other places. However, this project has the potential to be a lot of work, so it
might make sense to test out the program on a few willing and enthusiastic customers before you
offer it to everyone.
26
Stop-Specific Selection
Another finding is that the GFB serves many different types of communities and it might
make sense to cater to those communities in different ways. For example, some stops are near
grocery stores (Westbrook is a 5 minute walk from Hannaford) and customers at those stops
seemed totally uninterested in buying staple foods like rice and pasta at the GFB if they could get
it at the grocery store instead. However, several groups in Lewiston expressed interest in the
same staple items because of their limited access to stores. This means that depending on the
stop, customers are using the GFB for different purposes, and it makes sense to cater to the needs
of the specific community when possible. When looking at the options of possible goods, it is
important to keep proximity to grocery stores in mind when deciding what items to add for each
stop.
Focus Area B: Product Display
Signage On & Around the GFB
There was some confusion about what the GFB actually did to those who had never used
it. Some people had seen it but thought it was a mobile food pantry, and others had never seen it
at all. Both of these problems could be easily fixed by clearer and more widespread signage on
and around the GFB. First, the addition of a sign that clearly indicates that the GFB is a mobile
market would add clarity to the purpose of the bus. Second, signs around town and near stops
could help advertise in communities that might not know about the GFB. As outlined in Focus
Area B, new signage could also enhance the aesthetic appearance of the GFB.
Chalkboard Inventory
Another point of confusion among customers was the inventory of what was actually on
the bus. A few times in listening sessions participants asked for specific items only to find out
that the GFB sold them--they just didn't know it. This was especially true with items like Hotties
and other items that were kept in the freezer or out of site. Additional and more detailed
inventory chalkboards would help clarify confusion around what the GFB is actually selling.
27
Focus Area C: Access and Affordability
Membership Program
The membership program was met with enthusiasm all across the board people seemed
excited to join as soon as possible. A system that keeps track of what people are buying and who
is coming back from week to week would give the GFB a ton of data on customer habits, and
membership discounts would both incentivise shoppers to return to the GFB in addition to
making the food more affordable. People liked the idea of having both a physical card and a
number or name you could look up, and people said they would be most excited about regular
small discounts each time they shop.
½ off Harvest Bucks Option
Another question discussed at the listening sessions was how to most effectively utilise
the Harvest Bucks discount. Harvest Bucks are a Maine state sponsored healthy eating initiative.
For people purchasing their food with SNAP/EBT, they get a dollar coupon for every dollar that
they spend on fresh and local fruits and vegetables. In years past, the GFB has used Harvest
Bucks in their traditional form: at the cash register, if a customer bought $5 worth of vegetables,
they would get a $5 coupon for their next trip. In listening sessions, participants showed interest
in changing that system--instead of getting coupons for next time, some participants would prefer
the discount to be applied instantly (paying $2.50 and receiving no coupon). This system allows
for shoppers who don’t frequent the GFB weekly to still receive the benefits of the Harvest
Bucks program, and it also eliminates the chance that customers lose their Harvest Bucks before
they can use them. The general consensus from the listening sessions was that the customer
should choose their prefered option of an instant discount or coupons for later as they check out
at the point of sale.
Selling “Seconds”
The idea of selling seconds (similar to gleaned food; or a “second harvest”) came up in a
few focus groups and there was a lot of positive momentum behind it. People seemed
enthusiastic about the idea of cheaper prices for high quality locally sourced food regardless of
28
how it looks. This would be a relatively easy program to start, but it would have to happen with
conversations between the GFB in the farmers providing the seconds to ensure that all parties are
supportive of this plan. Additionally, it would be important to keep the seconds in clearly marked
bins separate from the normal display to ensure that there is no confusion between the seconds
and the regular produce.
Other Findings
New Items
In the listening sessions, customers requested new items that they would like to see on the
bus. While some of them were niche and unique to individual shoppers, a few of them were
shared by multiple customers (for a full list of requested items, see Appendix V, question 8). The
most commonly requested item was honey; it came up at almost every listening session. Pickles
and assorted pickled vegetables were frequently requested: this could be something to consider
alongside the waste-management practice of value added processing. Additionally, the idea of
meat, especially chicken, was pretty popular. Rice and pasta were popular at stops in Lewiston
where residents didn’t have easy access to grocery stores. Finally, there was a general request for
a wider variety of fruits, but that might also be addressed with clearer signage of the daily
selection.
Flyers and Ads
As addressed above, it was made clear that the ambiguity around what the GFB is and
does had partly to do with a lack of signage and advertisement. Flyers around central areas
would help raise awareness in the general public, but fliers in buildings and community spaces
would also be helpful in educating people about the GFB. There was a lot of support behind this
idea from listening session participants--people seemed eager to spread the word. One customer
said “If you give me your flyers I will make sure they get hung up” and many others echoed this
sentiment. Additionally, ads in the newspaper and TV could help target new customers that
might not otherwise hear about the bus.
29
Reminder Systems
One reason people said they didn’t shop at the bus was because they simply forgot when
it came or that it existed at all. This problem would be simply fixed with text or email reminders.
Many neighborhoods have community listservs and/or text message alerts, and the GFB could
use these platforms to remind people when the GFB comes. This can be organized on a
stop-by-stop basis through community organizers. Additionally, items like GFB fridge magnets
or reusable shopping bags could help remind people on a daily basis.
TAKEAWAYS AND RECOMMENDATIONS
While this report is full of recommendations and ideas, we have synthesized our core
findings into four main takeaways that we hope will help inform future growth of the GFB. First
of all, depending on priorities and available funds, there are several options to alleviate food loss
and increase efficiency of storage and refrigeration that range from sometime as simple as using
ice packs underneath greens and herbs to something as advanced as using solar panels to run a
mobile refrigeration unit. Secondly, the fundamentals of the current display are good, but the
minor adjustments and additions that we have suggested could better highlight products and
improve accessibility and ease of use for the customers while attracting more customers and
incentivizing them to shop at the bus. Thirdly, the GFB is doing a good job reflecting the real
cost of local food as compared to other mobile markets and local supermarkets, but that in turn
makes them somewhat less affordable. There are a variety of strategies for ways to continue to
reflect the real cost of food while also making food more affordable for customers, but these
should be implemented in accordance with the larger goals of the GFB. Finally, the listening
sessions have proved useful in figuring out what customers and community members want.
Better advertising of the bus through the addition of signs, and the implementation of a
membership program stood out as two improvements that would better incentivise people to
shop at the GFB. In conclusion, there is always room for improvement for a project of this
caliber, but the GFB is doing a great job acknowledging and navigating the wants and needs the
customers, farmers, and organizational partners to which they are accountable.
30
REFERENCES CITED
Anderson, M.D. 2008. “Rights-based food systems and the goals of food system reform.”
Agriculture and Human Rights 25(4): 593-608. Blumenthal, Sherie. Meeting with Adair Andre, Joakim Cohen, Josie Gillett, and Nell Houde. St.
Mary’s Nutrition Center, Lewiston, ME. 16 January 2018. Coleman-Jensen, Alisha, Rabbitt, Matthew P., Gregory, Christian A. and Anita Singh. 2017.
Household Food Security in the United States in 2016, ERR-237, U.S. Department of Agriculture, Economic Research Service.
Good Food Bus Working Team. Good Food Bus: 2017 Information (Lewiston, ME: St. Mary’s Nutrition Center, 2017).
Good Food Council of Lewiston-Auburn. 2013. Community Food Assessment. Lewiston. Accessed 30 January 2018. http://goodfood4la.org/files/2014/03/cfa-layout-0128-low-resolution.pdf
Larsen, Kristian and Jason Gilliland. 2009. “A farmers’ market in a food desert: Evaluating impacts on the price and availability of healthy food.” Health & Place 15(4): 1158-1162.
Mead, Nathaniel. 2008. “Urban Issues: The Sprawl of Food Deserts. Environmental Health Perspectives 116, no. 8. https://www.ncbi.nlm.nih.gov/pmc/articles/PMC2516593/
Walker, Renee E., Keane, Christopher R. and Jessica G. Burke. 2010. “Disparities and access to healthy food in the United States: A review of food deserts literature.” Health & Place 16(5): 876-884.
Windmoeller, Michelle. 2012. “Mobile Markets.” Accessed 28 January 2018. https://www.communitycommons.org/2012/11/mobile-markets-one-food-desert-solution/
Widener, Michael J., Metcalf, Sara S., and Yaneer Bar-Yam. 2012. “Developing a mobile produce distribution system for low-income urban residents in food deserts.” Journal of Urban Health 89(5): 733-745.
Widener, Michael J., Metcalf, Sara S., and Yaneer Bar-Yam. 2013. “Agent-based modeling of policies to improve urban food access for low-income populations.” Applied Geography 40: 1-10.
Wrigley, Neil, Warm, Daniel, Margetts, Barrie, and Amanda Whelan. 2002. “Assessing the impact of improved retail access on diet access on diet in a 'food desert': A preliminary report.” Urban Studies 39(11): 2061–82.
Zepeda, Lydia, Reznickova, Anna, and Luanne Lohr. 2014. “Overcoming challenges to effectiveness of mobile markets in US food deserts.” Appetite 79: 58-67.
31
APPENDICES
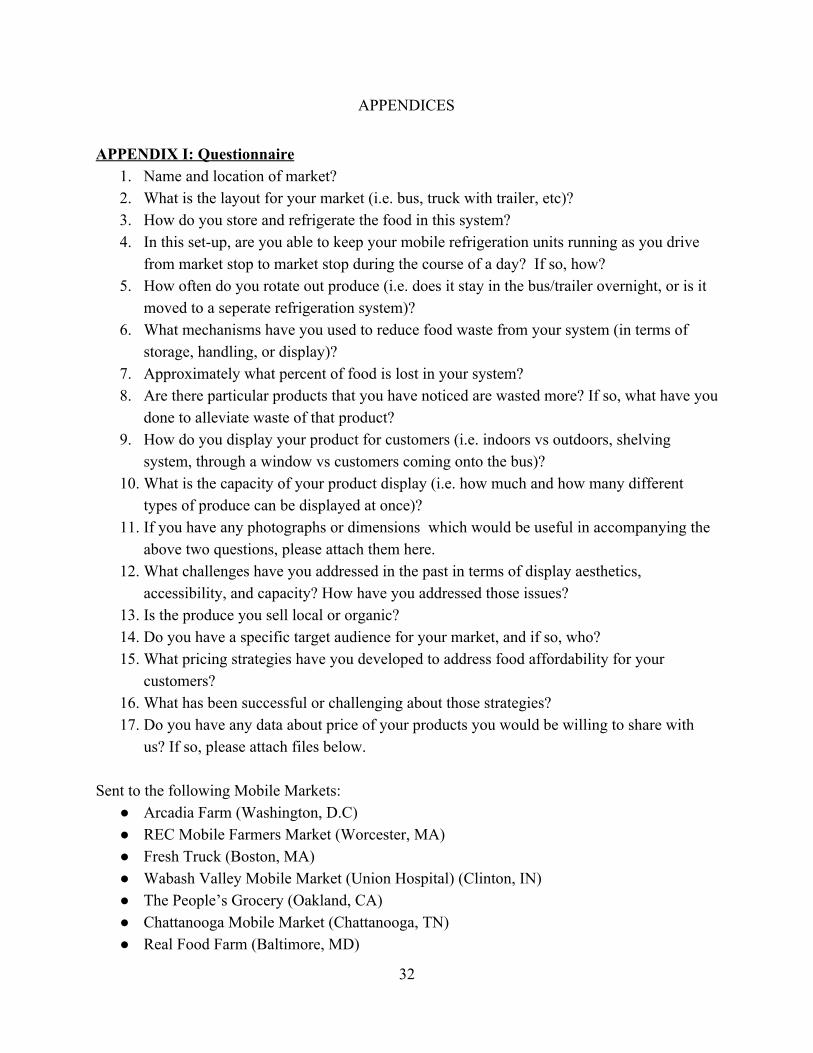
APPENDIX I: Questionnaire
1. Name and location of market? 2. What is the layout for your market (i.e. bus, truck with trailer, etc)? 3. How do you store and refrigerate the food in this system? 4. In this set-up, are you able to keep your mobile refrigeration units running as you drive
from market stop to market stop during the course of a day? If so, how? 5. How often do you rotate out produce (i.e. does it stay in the bus/trailer overnight, or is it
moved to a seperate refrigeration system)? 6. What mechanisms have you used to reduce food waste from your system (in terms of
storage, handling, or display)? 7. Approximately what percent of food is lost in your system? 8. Are there particular products that you have noticed are wasted more? If so, what have you
done to alleviate waste of that product? 9. How do you display your product for customers (i.e. indoors vs outdoors, shelving
system, through a window vs customers coming onto the bus)? 10. What is the capacity of your product display (i.e. how much and how many different
types of produce can be displayed at once)? 11. If you have any photographs or dimensions which would be useful in accompanying the
above two questions, please attach them here. 12. What challenges have you addressed in the past in terms of display aesthetics,
accessibility, and capacity? How have you addressed those issues? 13. Is the produce you sell local or organic? 14. Do you have a specific target audience for your market, and if so, who? 15. What pricing strategies have you developed to address food affordability for your
customers? 16. What has been successful or challenging about those strategies? 17. Do you have any data about price of your products you would be willing to share with
us? If so, please attach files below. Sent to the following Mobile Markets:
● Arcadia Farm (Washington, D.C) ● REC Mobile Farmers Market (Worcester, MA) ● Fresh Truck (Boston, MA) ● Wabash Valley Mobile Market (Union Hospital) (Clinton, IN) ● The People’s Grocery (Oakland, CA) ● Chattanooga Mobile Market (Chattanooga, TN) ● Real Food Farm (Baltimore, MD)
32
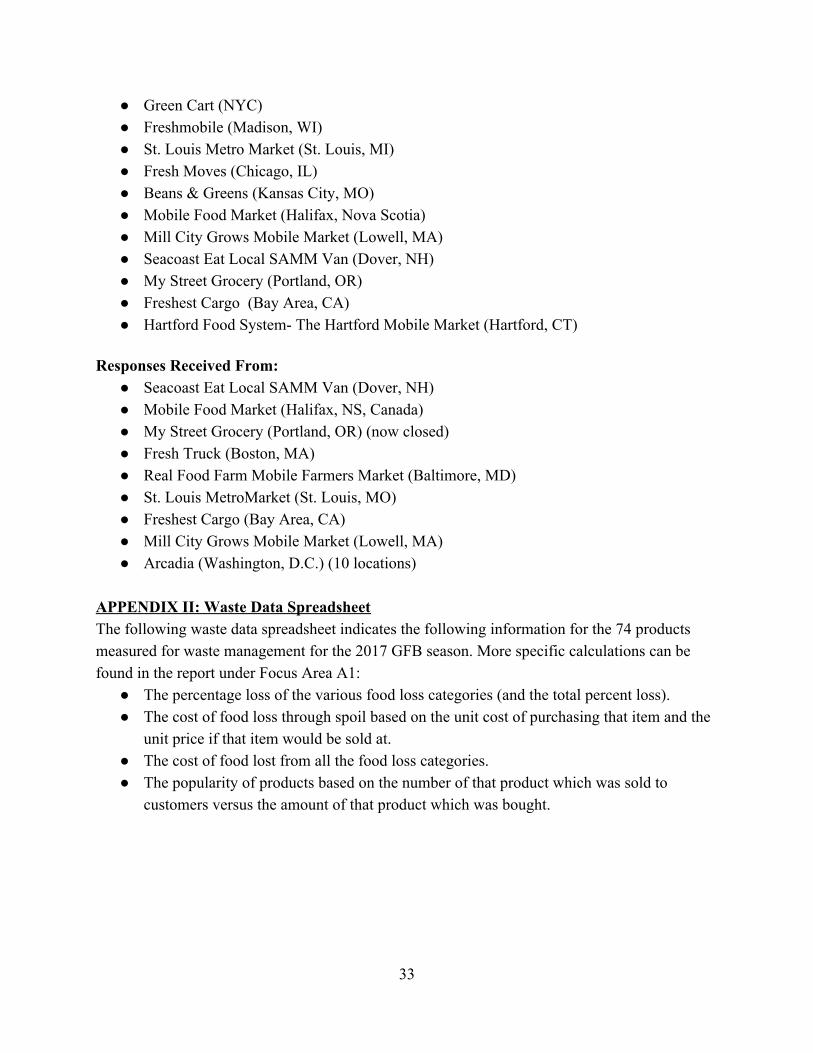
● Green Cart (NYC) ● Freshmobile (Madison, WI) ● St. Louis Metro Market (St. Louis, MI) ● Fresh Moves (Chicago, IL) ● Beans & Greens (Kansas City, MO) ● Mobile Food Market (Halifax, Nova Scotia) ● Mill City Grows Mobile Market (Lowell, MA) ● Seacoast Eat Local SAMM Van (Dover, NH) ● My Street Grocery (Portland, OR) ● Freshest Cargo (Bay Area, CA) ● Hartford Food System- The Hartford Mobile Market (Hartford, CT)
Responses Received From:
● Seacoast Eat Local SAMM Van (Dover, NH) ● Mobile Food Market (Halifax, NS, Canada) ● My Street Grocery (Portland, OR) (now closed) ● Fresh Truck (Boston, MA) ● Real Food Farm Mobile Farmers Market (Baltimore, MD) ● St. Louis MetroMarket (St. Louis, MO) ● Freshest Cargo (Bay Area, CA) ● Mill City Grows Mobile Market (Lowell, MA) ● Arcadia (Washington, D.C.) (10 locations)
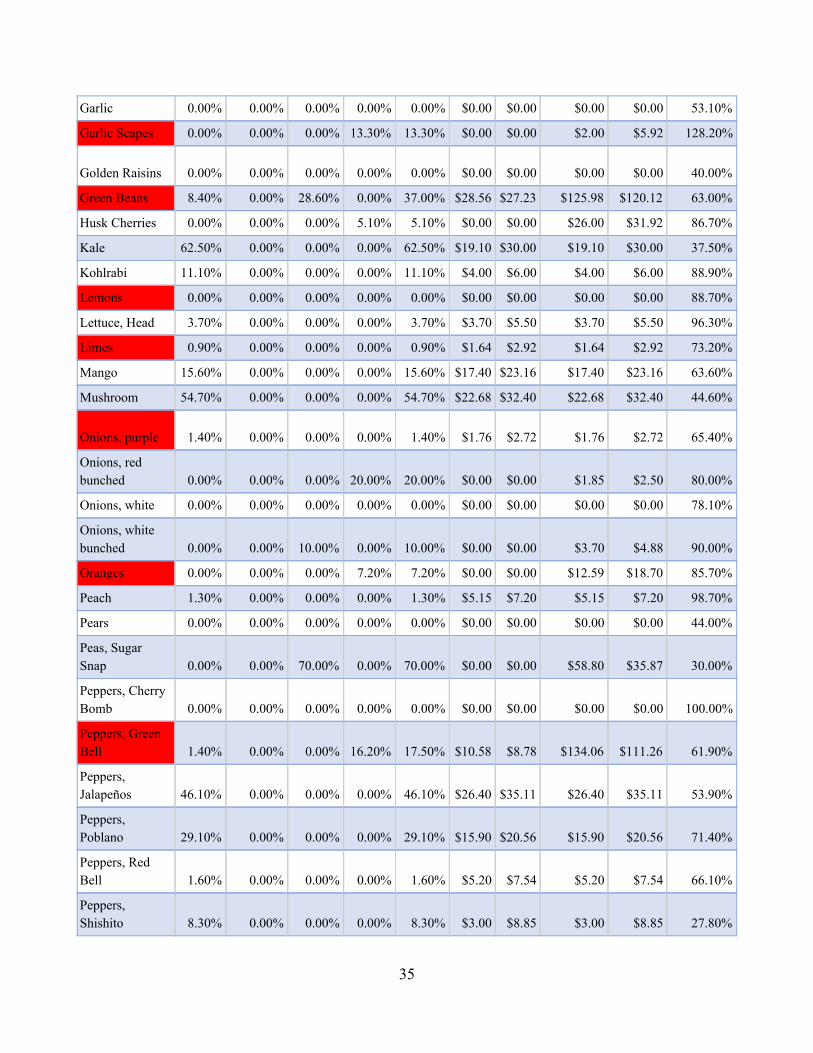
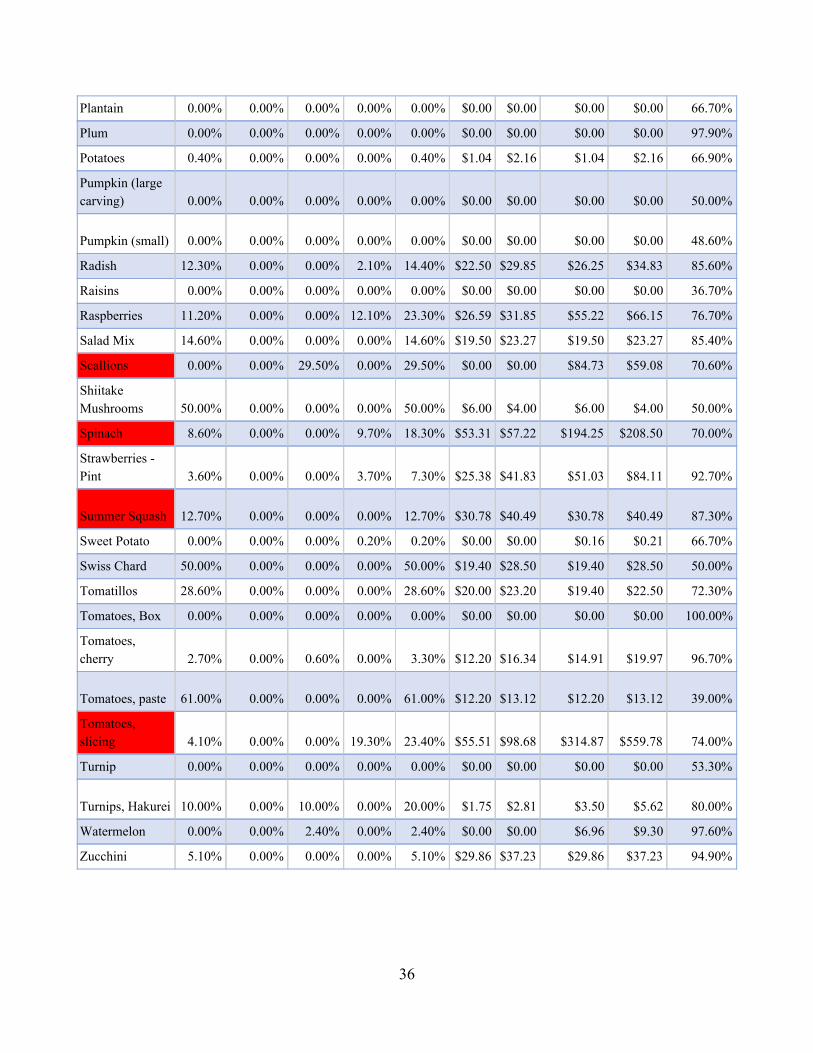
APPENDIX II: Waste Data Spreadsheet The following waste data spreadsheet indicates the following information for the 74 products measured for waste management for the 2017 GFB season. More specific calculations can be found in the report under Focus Area A1:
● The percentage loss of the various food loss categories (and the total percent loss). ● The cost of food loss through spoil based on the unit cost of purchasing that item and the
unit price if that item would be sold at. ● The cost of food lost from all the food loss categories. ● The popularity of products based on the number of that product which was sold to
customers versus the amount of that product which was bought.
33
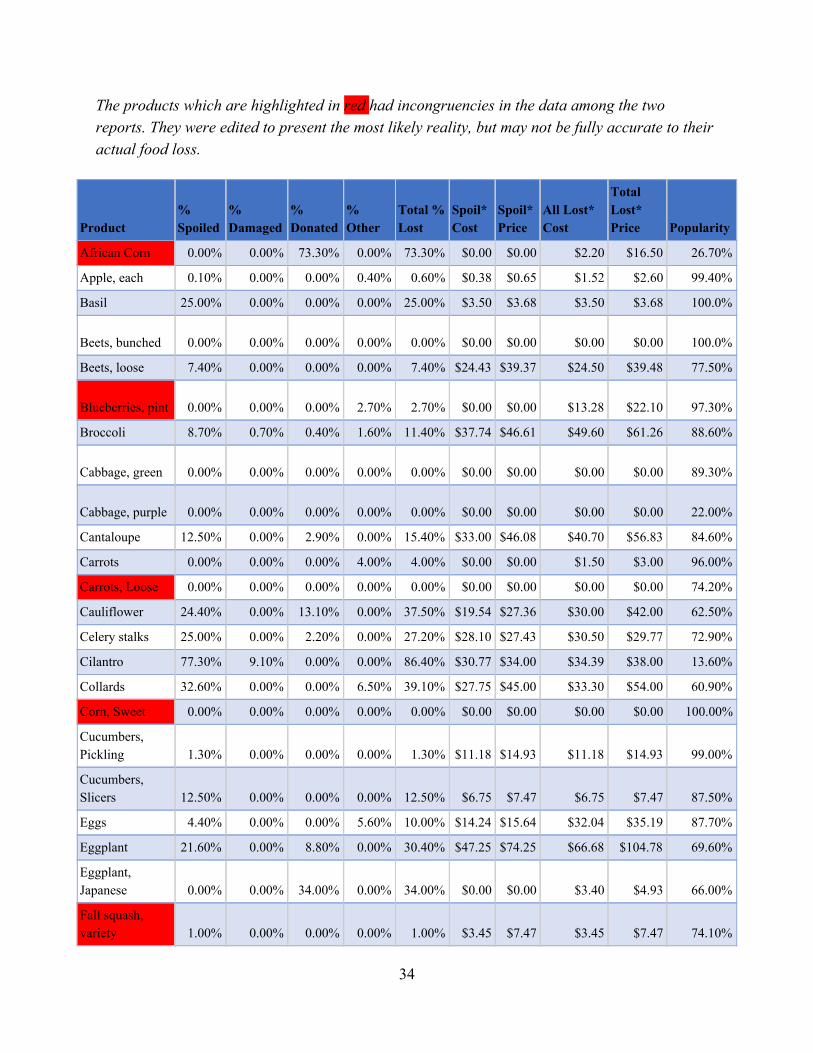
The products which are highlighted in red had incongruencies in the data among the two reports. They were edited to present the most likely reality, but may not be fully accurate to their actual food loss.
Product % Spoiled
% Damaged
% Donated
% Other
Total % Lost
Spoil* Cost
Spoil* Price
All Lost* Cost
Total Lost* Price Popularity
African Corn 0.00% 0.00% 73.30% 0.00% 73.30% $0.00 $0.00 $2.20 $16.50 26.70%
Apple, each 0.10% 0.00% 0.00% 0.40% 0.60% $0.38 $0.65 $1.52 $2.60 99.40%
Basil 25.00% 0.00% 0.00% 0.00% 25.00% $3.50 $3.68 $3.50 $3.68 100.0%
Beets, bunched 0.00% 0.00% 0.00% 0.00% 0.00% $0.00 $0.00 $0.00 $0.00 100.0%
Beets, loose 7.40% 0.00% 0.00% 0.00% 7.40% $24.43 $39.37 $24.50 $39.48 77.50%
Blueberries, pint 0.00% 0.00% 0.00% 2.70% 2.70% $0.00 $0.00 $13.28 $22.10 97.30%
Broccoli 8.70% 0.70% 0.40% 1.60% 11.40% $37.74 $46.61 $49.60 $61.26 88.60%
Cabbage, green 0.00% 0.00% 0.00% 0.00% 0.00% $0.00 $0.00 $0.00 $0.00 89.30%
Cabbage, purple 0.00% 0.00% 0.00% 0.00% 0.00% $0.00 $0.00 $0.00 $0.00 22.00%
Cantaloupe 12.50% 0.00% 2.90% 0.00% 15.40% $33.00 $46.08 $40.70 $56.83 84.60%
Carrots 0.00% 0.00% 0.00% 4.00% 4.00% $0.00 $0.00 $1.50 $3.00 96.00%
Carrots, Loose 0.00% 0.00% 0.00% 0.00% 0.00% $0.00 $0.00 $0.00 $0.00 74.20%
Cauliflower 24.40% 0.00% 13.10% 0.00% 37.50% $19.54 $27.36 $30.00 $42.00 62.50%
Celery stalks 25.00% 0.00% 2.20% 0.00% 27.20% $28.10 $27.43 $30.50 $29.77 72.90%
Cilantro 77.30% 9.10% 0.00% 0.00% 86.40% $30.77 $34.00 $34.39 $38.00 13.60%
Collards 32.60% 0.00% 0.00% 6.50% 39.10% $27.75 $45.00 $33.30 $54.00 60.90%
Corn, Sweet 0.00% 0.00% 0.00% 0.00% 0.00% $0.00 $0.00 $0.00 $0.00 100.00%
Cucumbers, Pickling 1.30% 0.00% 0.00% 0.00% 1.30% $11.18 $14.93 $11.18 $14.93 99.00%
Cucumbers, Slicers 12.50% 0.00% 0.00% 0.00% 12.50% $6.75 $7.47 $6.75 $7.47 87.50%
Eggs 4.40% 0.00% 0.00% 5.60% 10.00% $14.24 $15.64 $32.04 $35.19 87.70%
Eggplant 21.60% 0.00% 8.80% 0.00% 30.40% $47.25 $74.25 $66.68 $104.78 69.60%
Eggplant, Japanese 0.00% 0.00% 34.00% 0.00% 34.00% $0.00 $0.00 $3.40 $4.93 66.00%
Fall squash, variety 1.00% 0.00% 0.00% 0.00% 1.00% $3.45 $7.47 $3.45 $7.47 74.10%
34
Garlic 0.00% 0.00% 0.00% 0.00% 0.00% $0.00 $0.00 $0.00 $0.00 53.10%
Garlic Scapes 0.00% 0.00% 0.00% 13.30% 13.30% $0.00 $0.00 $2.00 $5.92 128.20%
Golden Raisins 0.00% 0.00% 0.00% 0.00% 0.00% $0.00 $0.00 $0.00 $0.00 40.00%
Green Beans 8.40% 0.00% 28.60% 0.00% 37.00% $28.56 $27.23 $125.98 $120.12 63.00%
Husk Cherries 0.00% 0.00% 0.00% 5.10% 5.10% $0.00 $0.00 $26.00 $31.92 86.70%
Kale 62.50% 0.00% 0.00% 0.00% 62.50% $19.10 $30.00 $19.10 $30.00 37.50%
Kohlrabi 11.10% 0.00% 0.00% 0.00% 11.10% $4.00 $6.00 $4.00 $6.00 88.90%
Lemons 0.00% 0.00% 0.00% 0.00% 0.00% $0.00 $0.00 $0.00 $0.00 88.70%
Lettuce, Head 3.70% 0.00% 0.00% 0.00% 3.70% $3.70 $5.50 $3.70 $5.50 96.30%
Limes 0.90% 0.00% 0.00% 0.00% 0.90% $1.64 $2.92 $1.64 $2.92 73.20%
Mango 15.60% 0.00% 0.00% 0.00% 15.60% $17.40 $23.16 $17.40 $23.16 63.60%
Mushroom 54.70% 0.00% 0.00% 0.00% 54.70% $22.68 $32.40 $22.68 $32.40 44.60%
Onions, purple 1.40% 0.00% 0.00% 0.00% 1.40% $1.76 $2.72 $1.76 $2.72 65.40%
Onions, red bunched 0.00% 0.00% 0.00% 20.00% 20.00% $0.00 $0.00 $1.85 $2.50 80.00%
Onions, white 0.00% 0.00% 0.00% 0.00% 0.00% $0.00 $0.00 $0.00 $0.00 78.10%
Onions, white bunched 0.00% 0.00% 10.00% 0.00% 10.00% $0.00 $0.00 $3.70 $4.88 90.00%
Oranges 0.00% 0.00% 0.00% 7.20% 7.20% $0.00 $0.00 $12.59 $18.70 85.70%
Peach 1.30% 0.00% 0.00% 0.00% 1.30% $5.15 $7.20 $5.15 $7.20 98.70%
Pears 0.00% 0.00% 0.00% 0.00% 0.00% $0.00 $0.00 $0.00 $0.00 44.00%
Peas, Sugar Snap 0.00% 0.00% 70.00% 0.00% 70.00% $0.00 $0.00 $58.80 $35.87 30.00%
Peppers, Cherry Bomb 0.00% 0.00% 0.00% 0.00% 0.00% $0.00 $0.00 $0.00 $0.00 100.00%
Peppers, Green Bell 1.40% 0.00% 0.00% 16.20% 17.50% $10.58 $8.78 $134.06 $111.26 61.90%
Peppers, Jalapeños 46.10% 0.00% 0.00% 0.00% 46.10% $26.40 $35.11 $26.40 $35.11 53.90%
Peppers, Poblano 29.10% 0.00% 0.00% 0.00% 29.10% $15.90 $20.56 $15.90 $20.56 71.40%
Peppers, Red Bell 1.60% 0.00% 0.00% 0.00% 1.60% $5.20 $7.54 $5.20 $7.54 66.10%
Peppers, Shishito 8.30% 0.00% 0.00% 0.00% 8.30% $3.00 $8.85 $3.00 $8.85 27.80%
35
Plantain 0.00% 0.00% 0.00% 0.00% 0.00% $0.00 $0.00 $0.00 $0.00 66.70%
Plum 0.00% 0.00% 0.00% 0.00% 0.00% $0.00 $0.00 $0.00 $0.00 97.90%
Potatoes 0.40% 0.00% 0.00% 0.00% 0.40% $1.04 $2.16 $1.04 $2.16 66.90%
Pumpkin (large carving) 0.00% 0.00% 0.00% 0.00% 0.00% $0.00 $0.00 $0.00 $0.00 50.00%
Pumpkin (small) 0.00% 0.00% 0.00% 0.00% 0.00% $0.00 $0.00 $0.00 $0.00 48.60%
Radish 12.30% 0.00% 0.00% 2.10% 14.40% $22.50 $29.85 $26.25 $34.83 85.60%
Raisins 0.00% 0.00% 0.00% 0.00% 0.00% $0.00 $0.00 $0.00 $0.00 36.70%
Raspberries 11.20% 0.00% 0.00% 12.10% 23.30% $26.59 $31.85 $55.22 $66.15 76.70%
Salad Mix 14.60% 0.00% 0.00% 0.00% 14.60% $19.50 $23.27 $19.50 $23.27 85.40%
Scallions 0.00% 0.00% 29.50% 0.00% 29.50% $0.00 $0.00 $84.73 $59.08 70.60%
Shiitake Mushrooms 50.00% 0.00% 0.00% 0.00% 50.00% $6.00 $4.00 $6.00 $4.00 50.00%
Spinach 8.60% 0.00% 0.00% 9.70% 18.30% $53.31 $57.22 $194.25 $208.50 70.00%
Strawberries - Pint 3.60% 0.00% 0.00% 3.70% 7.30% $25.38 $41.83 $51.03 $84.11 92.70%
Summer Squash 12.70% 0.00% 0.00% 0.00% 12.70% $30.78 $40.49 $30.78 $40.49 87.30%
Sweet Potato 0.00% 0.00% 0.00% 0.20% 0.20% $0.00 $0.00 $0.16 $0.21 66.70%
Swiss Chard 50.00% 0.00% 0.00% 0.00% 50.00% $19.40 $28.50 $19.40 $28.50 50.00%
Tomatillos 28.60% 0.00% 0.00% 0.00% 28.60% $20.00 $23.20 $19.40 $22.50 72.30%
Tomatoes, Box 0.00% 0.00% 0.00% 0.00% 0.00% $0.00 $0.00 $0.00 $0.00 100.00%
Tomatoes, cherry 2.70% 0.00% 0.60% 0.00% 3.30% $12.20 $16.34 $14.91 $19.97 96.70%
Tomatoes, paste 61.00% 0.00% 0.00% 0.00% 61.00% $12.20 $13.12 $12.20 $13.12 39.00%
Tomatoes, slicing 4.10% 0.00% 0.00% 19.30% 23.40% $55.51 $98.68 $314.87 $559.78 74.00%
Turnip 0.00% 0.00% 0.00% 0.00% 0.00% $0.00 $0.00 $0.00 $0.00 53.30%
Turnips, Hakurei 10.00% 0.00% 10.00% 0.00% 20.00% $1.75 $2.81 $3.50 $5.62 80.00%
Watermelon 0.00% 0.00% 2.40% 0.00% 2.40% $0.00 $0.00 $6.96 $9.30 97.60%
Zucchini 5.10% 0.00% 0.00% 0.00% 5.10% $29.86 $37.23 $29.86 $37.23 94.90%
36
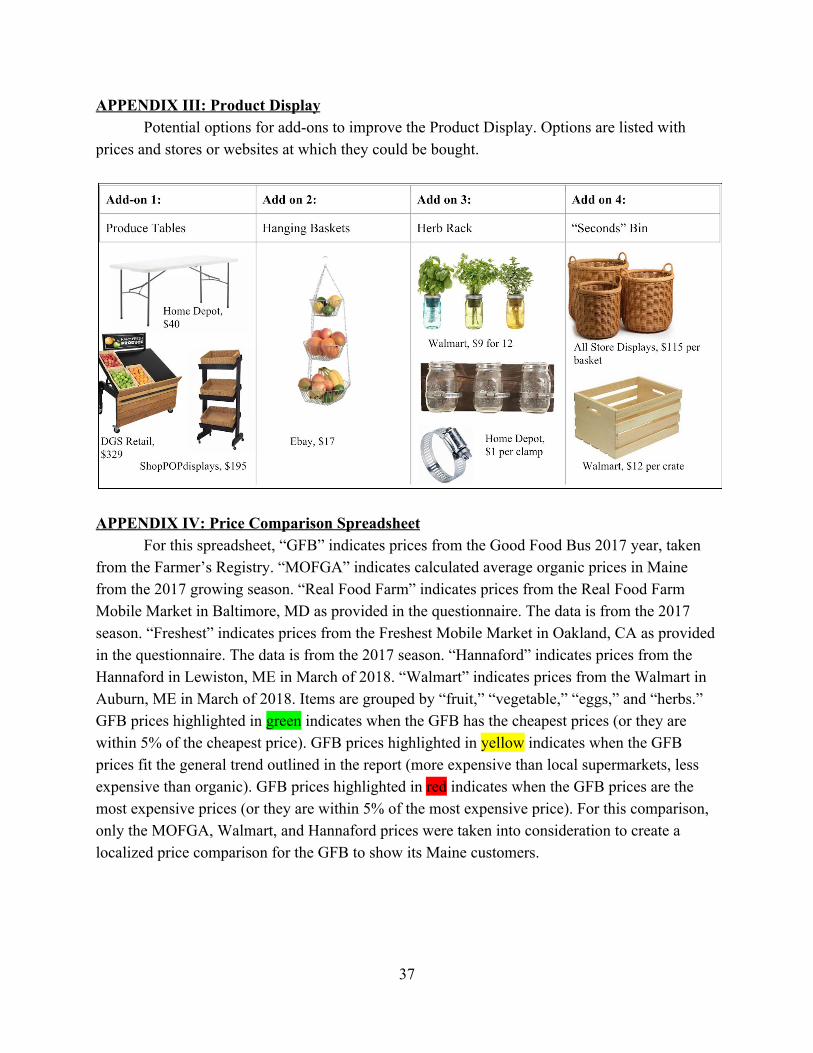
APPENDIX III: Product Display Potential options for add-ons to improve the Product Display. Options are listed with
prices and stores or websites at which they could be bought.
APPENDIX IV: Price Comparison Spreadsheet
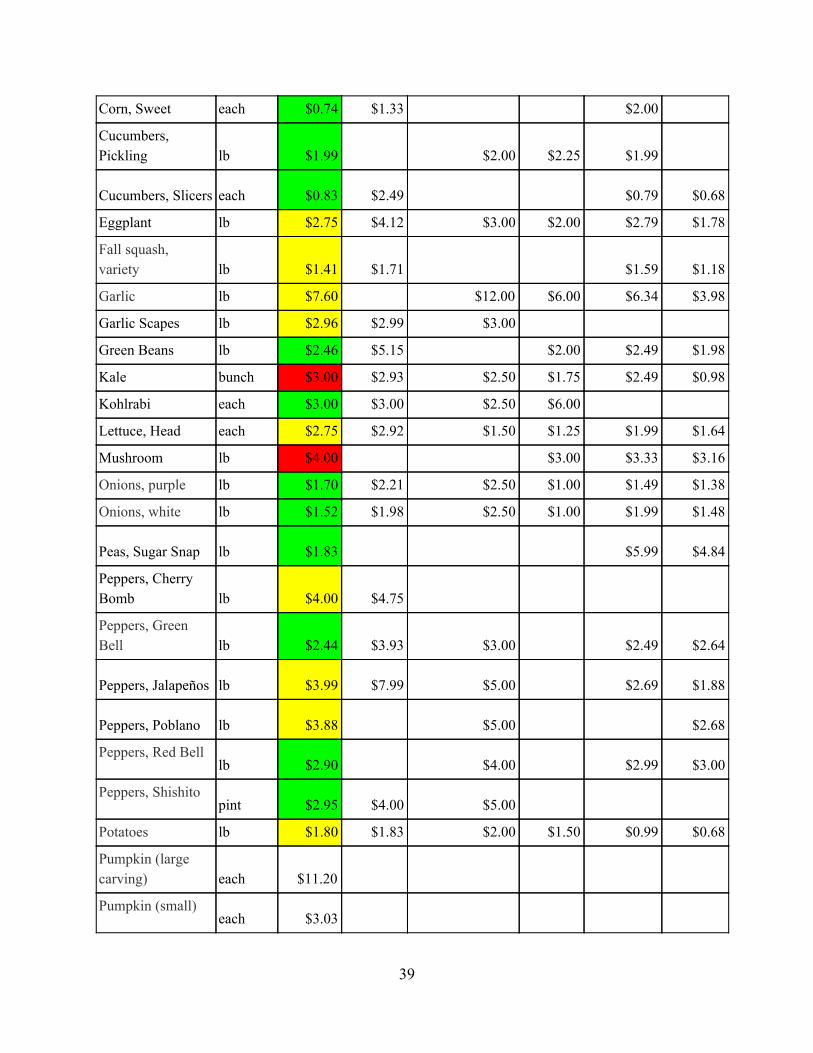
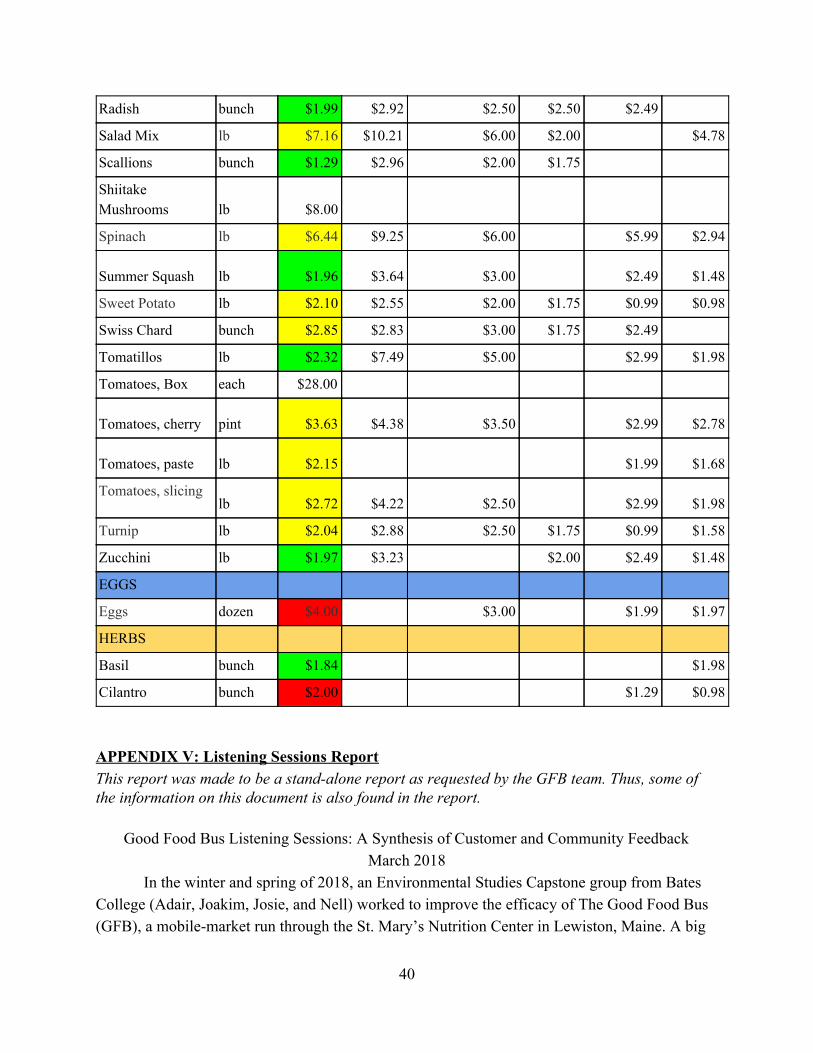
For this spreadsheet, “GFB” indicates prices from the Good Food Bus 2017 year, taken from the Farmer’s Registry. “MOFGA” indicates calculated average organic prices in Maine from the 2017 growing season. “Real Food Farm” indicates prices from the Real Food Farm Mobile Market in Baltimore, MD as provided in the questionnaire. The data is from the 2017 season. “Freshest” indicates prices from the Freshest Mobile Market in Oakland, CA as provided in the questionnaire. The data is from the 2017 season. “Hannaford” indicates prices from the Hannaford in Lewiston, ME in March of 2018. “Walmart” indicates prices from the Walmart in Auburn, ME in March of 2018. Items are grouped by “fruit,” “vegetable,” “eggs,” and “herbs.” GFB prices highlighted in green indicates when the GFB has the cheapest prices (or they are within 5% of the cheapest price). GFB prices highlighted in yellow indicates when the GFB prices fit the general trend outlined in the report (more expensive than local supermarkets, less expensive than organic). GFB prices highlighted in red indicates when the GFB prices are the most expensive prices (or they are within 5% of the most expensive price). For this comparison, only the MOFGA, Walmart, and Hannaford prices were taken into consideration to create a localized price comparison for the GFB to show its Maine customers.
37
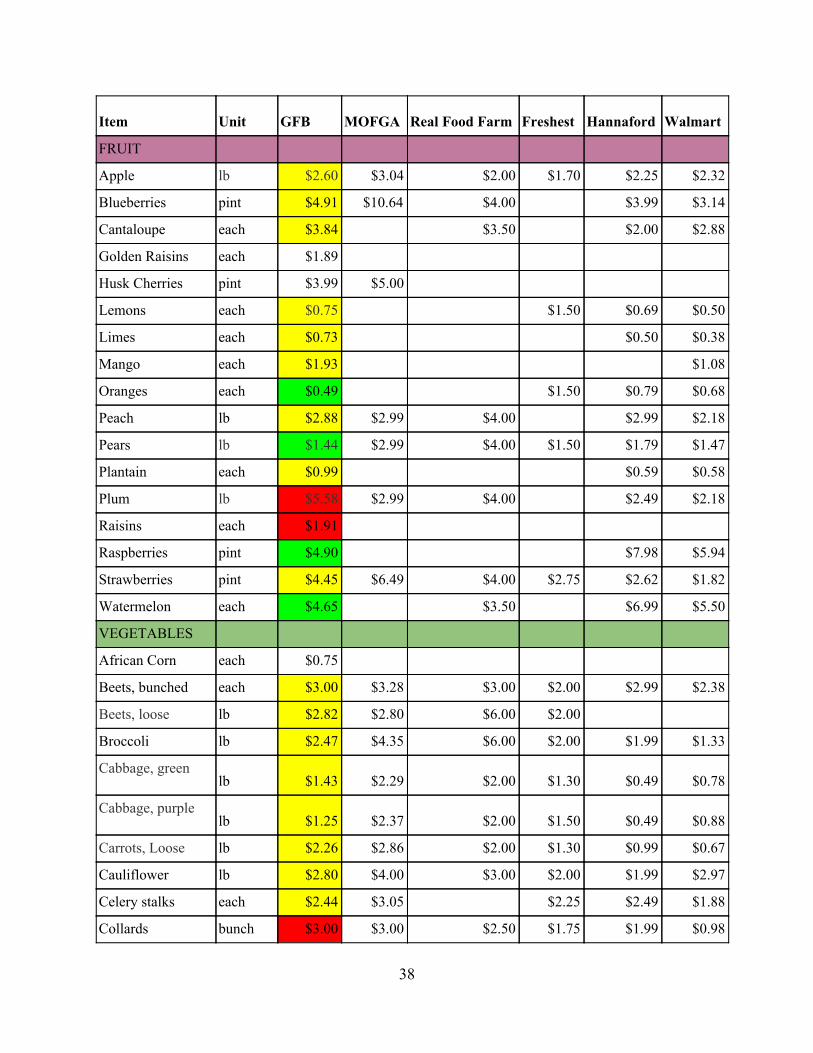
Item Unit GFB MOFGA Real Food Farm Freshest Hannaford Walmart
FRUIT
Apple lb $2.60 $3.04 $2.00 $1.70 $2.25 $2.32
Blueberries pint $4.91 $10.64 $4.00 $3.99 $3.14
Cantaloupe each $3.84 $3.50 $2.00 $2.88
Golden Raisins each $1.89
Husk Cherries pint $3.99 $5.00
Lemons each $0.75 $1.50 $0.69 $0.50
Limes each $0.73 $0.50 $0.38
Mango each $1.93 $1.08
Oranges each $0.49 $1.50 $0.79 $0.68
Peach lb $2.88 $2.99 $4.00 $2.99 $2.18
Pears lb $1.44 $2.99 $4.00 $1.50 $1.79 $1.47
Plantain each $0.99 $0.59 $0.58
Plum lb $5.58 $2.99 $4.00 $2.49 $2.18
Raisins each $1.91
Raspberries pint $4.90 $7.98 $5.94
Strawberries pint $4.45 $6.49 $4.00 $2.75 $2.62 $1.82
Watermelon each $4.65 $3.50 $6.99 $5.50
VEGETABLES
African Corn each $0.75
Beets, bunched each $3.00 $3.28 $3.00 $2.00 $2.99 $2.38
Beets, loose lb $2.82 $2.80 $6.00 $2.00
Broccoli lb $2.47 $4.35 $6.00 $2.00 $1.99 $1.33
Cabbage, green lb $1.43 $2.29 $2.00 $1.30 $0.49 $0.78
Cabbage, purple lb $1.25 $2.37 $2.00 $1.50 $0.49 $0.88
Carrots, Loose lb $2.26 $2.86 $2.00 $1.30 $0.99 $0.67
Cauliflower lb $2.80 $4.00 $3.00 $2.00 $1.99 $2.97
Celery stalks each $2.44 $3.05 $2.25 $2.49 $1.88
Collards bunch $3.00 $3.00 $2.50 $1.75 $1.99 $0.98
38
Corn, Sweet each $0.74 $1.33 $2.00
Cucumbers, Pickling lb $1.99 $2.00 $2.25 $1.99
Cucumbers, Slicers each $0.83 $2.49 $0.79 $0.68
Eggplant lb $2.75 $4.12 $3.00 $2.00 $2.79 $1.78
Fall squash, variety lb $1.41 $1.71 $1.59 $1.18
Garlic lb $7.60 $12.00 $6.00 $6.34 $3.98
Garlic Scapes lb $2.96 $2.99 $3.00
Green Beans lb $2.46 $5.15 $2.00 $2.49 $1.98
Kale bunch $3.00 $2.93 $2.50 $1.75 $2.49 $0.98
Kohlrabi each $3.00 $3.00 $2.50 $6.00
Lettuce, Head each $2.75 $2.92 $1.50 $1.25 $1.99 $1.64
Mushroom lb $4.00 $3.00 $3.33 $3.16
Onions, purple lb $1.70 $2.21 $2.50 $1.00 $1.49 $1.38
Onions, white lb $1.52 $1.98 $2.50 $1.00 $1.99 $1.48
Peas, Sugar Snap lb $1.83 $5.99 $4.84
Peppers, Cherry Bomb lb $4.00 $4.75
Peppers, Green Bell lb $2.44 $3.93 $3.00 $2.49 $2.64
Peppers, Jalapeños lb $3.99 $7.99 $5.00 $2.69 $1.88
Peppers, Poblano lb $3.88 $5.00 $2.68
Peppers, Red Bell lb $2.90 $4.00 $2.99 $3.00
Peppers, Shishito pint $2.95 $4.00 $5.00
Potatoes lb $1.80 $1.83 $2.00 $1.50 $0.99 $0.68
Pumpkin (large carving) each $11.20
Pumpkin (small) each $3.03
39
Radish bunch $1.99 $2.92 $2.50 $2.50 $2.49
Salad Mix lb $7.16 $10.21 $6.00 $2.00 $4.78
Scallions bunch $1.29 $2.96 $2.00 $1.75
Shiitake Mushrooms lb $8.00
Spinach lb $6.44 $9.25 $6.00 $5.99 $2.94
Summer Squash lb $1.96 $3.64 $3.00 $2.49 $1.48
Sweet Potato lb $2.10 $2.55 $2.00 $1.75 $0.99 $0.98
Swiss Chard bunch $2.85 $2.83 $3.00 $1.75 $2.49
Tomatillos lb $2.32 $7.49 $5.00 $2.99 $1.98
Tomatoes, Box each $28.00
Tomatoes, cherry pint $3.63 $4.38 $3.50 $2.99 $2.78
Tomatoes, paste lb $2.15 $1.99 $1.68
Tomatoes, slicing lb $2.72 $4.22 $2.50 $2.99 $1.98
Turnip lb $2.04 $2.88 $2.50 $1.75 $0.99 $1.58
Zucchini lb $1.97 $3.23 $2.00 $2.49 $1.48
EGGS
Eggs dozen $4.00 $3.00 $1.99 $1.97
HERBS
Basil bunch $1.84 $1.98
Cilantro bunch $2.00 $1.29 $0.98
APPENDIX V: Listening Sessions Report This report was made to be a stand-alone report as requested by the GFB team. Thus, some of the information on this document is also found in the report.
Good Food Bus Listening Sessions: A Synthesis of Customer and Community Feedback March 2018
In the winter and spring of 2018, an Environmental Studies Capstone group from Bates College (Adair, Joakim, Josie, and Nell) worked to improve the efficacy of The Good Food Bus (GFB), a mobile-market run through the St. Mary’s Nutrition Center in Lewiston, Maine. A big
40
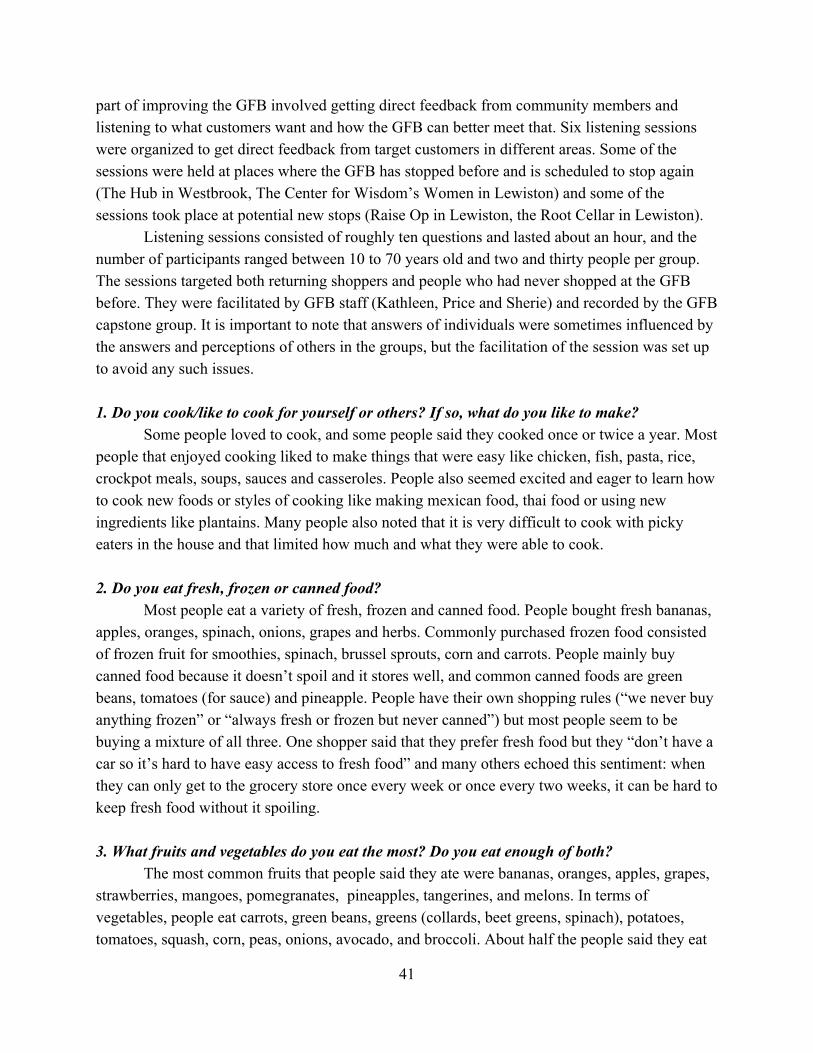
part of improving the GFB involved getting direct feedback from community members and listening to what customers want and how the GFB can better meet that. Six listening sessions were organized to get direct feedback from target customers in different areas. Some of the sessions were held at places where the GFB has stopped before and is scheduled to stop again (The Hub in Westbrook, The Center for Wisdom’s Women in Lewiston) and some of the sessions took place at potential new stops (Raise Op in Lewiston, the Root Cellar in Lewiston).
Listening sessions consisted of roughly ten questions and lasted about an hour, and the number of participants ranged between 10 to 70 years old and two and thirty people per group. The sessions targeted both returning shoppers and people who had never shopped at the GFB before. They were facilitated by GFB staff (Kathleen, Price and Sherie) and recorded by the GFB capstone group. It is important to note that answers of individuals were sometimes influenced by the answers and perceptions of others in the groups, but the facilitation of the session was set up to avoid any such issues. 1. Do you cook/like to cook for yourself or others? If so, what do you like to make?
Some people loved to cook, and some people said they cooked once or twice a year. Most people that enjoyed cooking liked to make things that were easy like chicken, fish, pasta, rice, crockpot meals, soups, sauces and casseroles. People also seemed excited and eager to learn how to cook new foods or styles of cooking like making mexican food, thai food or using new ingredients like plantains. Many people also noted that it is very difficult to cook with picky eaters in the house and that limited how much and what they were able to cook. 2. Do you eat fresh, frozen or canned food?
Most people eat a variety of fresh, frozen and canned food. People bought fresh bananas, apples, oranges, spinach, onions, grapes and herbs. Commonly purchased frozen food consisted of frozen fruit for smoothies, spinach, brussel sprouts, corn and carrots. People mainly buy canned food because it doesn’t spoil and it stores well, and common canned foods are green beans, tomatoes (for sauce) and pineapple. People have their own shopping rules (“we never buy anything frozen” or “always fresh or frozen but never canned”) but most people seem to be buying a mixture of all three. One shopper said that they prefer fresh food but they “don’t have a car so it’s hard to have easy access to fresh food” and many others echoed this sentiment: when they can only get to the grocery store once every week or once every two weeks, it can be hard to keep fresh food without it spoiling. 3. What fruits and vegetables do you eat the most? Do you eat enough of both?
The most common fruits that people said they ate were bananas, oranges, apples, grapes, strawberries, mangoes, pomegranates, pineapples, tangerines, and melons. In terms of vegetables, people eat carrots, green beans, greens (collards, beet greens, spinach), potatoes, tomatoes, squash, corn, peas, onions, avocado, and broccoli. About half the people said they eat
41
enough fruits and veggies, and about half the people said they don’t eat enough fruits and veggies. Often, those who said they ate enough fruits and vegetables also mainly ate fresh vegetables. 4. Where do you shop for groceries?
Most people shopped at the nearest and cheapest grocery store. Almost all customers at the Hub in Westbrook went to Hannafords because they were within walking distance and didn’t have access to cars. In Lewiston, where grocery stores are fewer and far between, shoppers went to Hannafords, Shaws, Walmart, Save-A-Lot, B.J.’s, Blackies and sometimes the Farmer’s Markets. Some people bought most of their food at Walmart but would “never buy fresh produce there” while others never have problems with the veggies at Walmart. People at the Lewiston focus groups tended to be more excited about the idea of buying staples (rice, pasta, spices) at the GFB because it could save them a trip to the store. Customers in Westbrook with easy access to Hannafords seemed uninterested in buying staples from the GFB because they would be able to get the same foods for cheaper prices at hannafords. 5. Have you heard of the GFB before? How?
Most people had heard of the GFB through a person or organization, some people had seen it, and some people hadn’t heard of it at all. Advertisements such as flyers and bulletins seemed like the most effective strategies for raising awareness. People also mentioned hearing about it through Facebook and in the newspaper AD.
Some people who had seen it before had confusion about what it was: they thought it was a mobile food pantry and were unaware of who it served. People also mentioned that they would have shopped there if they had known the schedule. 6. Are the times and location convenient?
A lot of people recommend a stop in Kennedy Park to make it more visible in the community. People at the Root Cellar and Raise Op said they would most likely shop if there was a stop at the Root Cellar in the morning. Some people said if it came closer to them they would be more likely to stop and shop. People think that they would be more likely to go if they had reminders: either emails from community organizers, text reminders, facebook posts, GFB fridge magnets, or shopping bags. Some people mentioned that because the stops were short if they had a meeting they would miss the whole stop for that week, and that maybe spanning two hours would make it more accessible. 7. Did you/would you buy anchor meals?
Most people either liked using them or liked the idea of buying them. Some people pointed out that it caters more to families than to individuals or picky eaters. One user commented that they “would be great for someone who doesn’t know how to cook to learn to
42
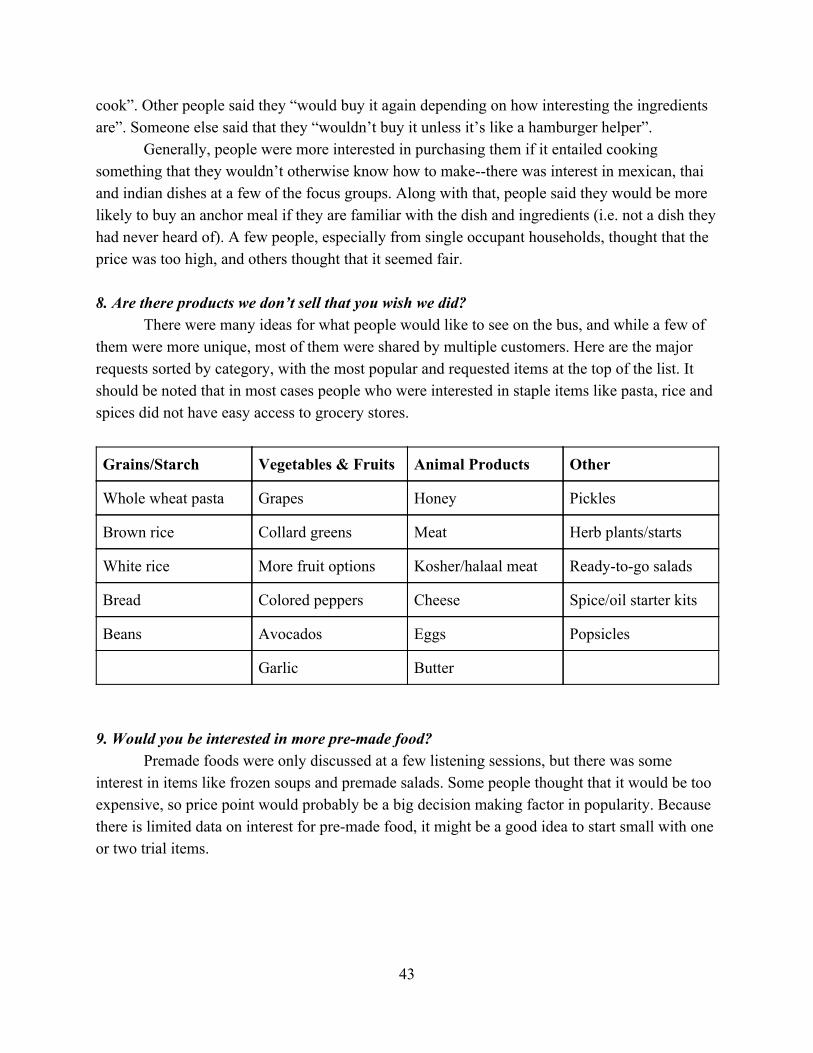
cook”. Other people said they “would buy it again depending on how interesting the ingredients are”. Someone else said that they “wouldn’t buy it unless it’s like a hamburger helper”.
Generally, people were more interested in purchasing them if it entailed cooking something that they wouldn’t otherwise know how to make--there was interest in mexican, thai and indian dishes at a few of the focus groups. Along with that, people said they would be more likely to buy an anchor meal if they are familiar with the dish and ingredients (i.e. not a dish they had never heard of). A few people, especially from single occupant households, thought that the price was too high, and others thought that it seemed fair. 8. Are there products we don’t sell that you wish we did?
There were many ideas for what people would like to see on the bus, and while a few of them were more unique, most of them were shared by multiple customers. Here are the major requests sorted by category, with the most popular and requested items at the top of the list. It should be noted that in most cases people who were interested in staple items like pasta, rice and spices did not have easy access to grocery stores.
Grains/Starch Vegetables & Fruits Animal Products Other
Whole wheat pasta Grapes Honey Pickles
Brown rice Collard greens Meat Herb plants/starts
White rice More fruit options Kosher/halaal meat Ready-to-go salads
Bread Colored peppers Cheese Spice/oil starter kits
Beans Avocados Eggs Popsicles
Garlic Butter
9. Would you be interested in more pre-made food?
Premade foods were only discussed at a few listening sessions, but there was some interest in items like frozen soups and premade salads. Some people thought that it would be too expensive, so price point would probably be a big decision making factor in popularity. Because there is limited data on interest for pre-made food, it might be a good idea to start small with one or two trial items.
43
10. Do you know about Maine Harvest Bucks? Would you like ½ off discount or MHB coupons?
Almost all shoppers knew about harvest bucks and used them when the could. Many people mentioned that they still have Harvest Bucks left over from last year at their house, indicating that it might not be the most efficient and effective system. When offered the option of an instant ½ off option, many people were very enthusiastic. The general consensus is that customers should have the option at the register to choose either the ½ discount or the coupons-for-later discount. 11. Would you be interested in a membership program?
There was a lot of popularity around the idea of having a membership card. Having a number or name that you could look up from the register would eliminate the chances of someone forgetting their physical card. However, some people liked the idea of having a physical card--so maybe the best option would to give people a membership card when they join and then have the ability to look them up by name or number when they come to visit. People seemed more interested in smaller discounts each time they shop instead of larger discounts only a few times.
12. Would you be interested in buying “seconds”?
There was a lot of enthusiasm around seconds. People seemed willing and eager to buy food if it was cheaper regardless of what it looked like. There was a lot of positive support around this!
Takeaways
For the most part, past and potential GFB customers are pleased with how things are going and excited for improvements in future years. A few questions at the beginning of the listening sessions went over basic information about participants, and there were few answers or ideas that pointed in new directions: for the most part, the first few questions confirmed that what the GFB is doing and selling align with what customers want. More ideas for change and improvement came with questions regarding programs, discounts and outreach. Below, sorted by focus area, are key takeaways from these sessions. The category “other” didn’t map on cleanly to any focus area because they lie outside the realm of work that we were tasked with, but they still provide important feedback for the GFB team. Finally, there were many discussions on pricing and the inherent cost of locally sourced food. Below we provide suggestions for ways to mitigate these costs, but it is important to note that customers acknowledge this cost and are often understanding of the ramifications of lowering costs too much. Thus, the programs discussed in the paragraph below in Focus Area C and those mentioned above in the section of Focus Area C seek to address these costs while ensuring a fair prices for all involved.
44
Focus Area A: Product Storage and Waste Management Pre-Order Option
One idea that came up in focus groups was the option of an order-ahead system that allows shoppers to place an order at the beginning of the week and pick it up when the bus stops in their neighborhood. This essentially ensures that the shoppers participating know exactly what they can get ahead of time, thus giving them the consistency of a grocery store experience that comes to them. This program could help enhance the feeling of “food security” in neighborhoods--if they have consistent access to the foods they need and want they can avoid needing to shop at other places. However, this project has the potential to be a lot of work, so it might make sense to test out the program on a few willing and enthusiastic customers before you offer it to everyone.
Stop-Specific Selection
Another finding is that the GFB serves many different types of communities and it might make sense to cater to those communities in different ways. For example, some stops are near grocery stores (Westbrook is a 5 minute walk from Hannaford) and customers at those stops seemed totally uninterested in buying staple foods like rice and pasta at the GFB if they could get it at the grocery store instead. However, several groups in Lewiston expressed interest in the same staple items because of their limited access to stores. This means that depending on the stop, customers are using the GFB for different purposes, and it makes sense to cater to the needs of the specific community when possible. When looking at the options of possible goods, it is important to keep proximity to grocery stores in mind when deciding what items to add for each stop. Focus Area B: Product Display Signage On & Around the GFB
There was some confusion about what the GFB actually did to those who had never used it. Some people had seen it but thought it was a mobile food pantry, and others had never seen it at all. Both of these problems could be easily fixed by clearer and more widespread signage on and around the GFB. First, the addition of a sign that clearly indicates that the GFB is a mobile market would add clarity to the purpose of the bus. Second, signs around town and near stops could help advertise in communities that might not know about the GFB. As outlined in Focus Area B, new signage could also enhance the aesthetic appearance of the GFB. Chalkboard Inventory
Another point of confusion among customers was the inventory of what was actually on the bus. A few times in listening sessions participants asked for specific items only to find out that the GFB sold them--they just didn't know it. This was especially true with items like Hotties
45
and other items that were kept in the freezer or out of site. Additional and more detailed inventory chalkboards would help clarify confusion around what the GFB is actually selling. Focus Area C: Access and Affordability Membership Program
The membership program was met with enthusiasm all across the board people seemed excited to join as soon as possible. A system that keeps track of what people are buying and who is coming back from week to week would give the GFB a ton of data on customer habits, and membership discounts would both incentivise shoppers to return to the GFB in addition to making the food more affordable. People liked the idea of having both a physical card and a number or name you could look up, and people said they would be most excited about regular small discounts each time they shop. ½ off Harvest Bucks Option
Another question discussed at the listening sessions was how to most effectively utilise the Harvest Bucks discount. Harvest Bucks are a Maine state sponsored healthy eating initiative. For people purchasing their food with SNAP/EBT, they get a dollar coupon for every dollar that they spend on fresh and local fruits and vegetables. In years past, the GFB has used Harvest Bucks in their traditional form: at the cash register, if a customer bought $5 worth of vegetables, they would get a $5 coupon for their next trip. In listening sessions, participants showed interest in changing that system--instead of getting coupons for next time, some participants would prefer the discount to be applied instantly (paying $2.50 and receiving no coupon). This system allows for shoppers who don’t frequent the GFB weekly to still receive the benefits of the Harvest Bucks program, and it also eliminates the chance that customers lose their Harvest Bucks before they can use them. The general consensus from the listening sessions was that the customer should choose their prefered option of an instant discount or coupons for later as they check out at the point of sale. Selling “Seconds”
The idea of selling seconds (similar to gleaned food; or a “second harvest”) came up in a few focus groups and there was a lot of positive momentum behind it. People seemed enthusiastic about the idea of cheaper prices for high quality locally sourced food regardless of how it looks. This would be a relatively easy program to start, but it would have to happen with conversations between the GFB in the farmers providing the seconds to ensure that all parties are supportive of this plan. Additionally, it would be important to keep the seconds in clearly marked bins separate from the normal display to ensure that there is no confusion between the seconds and the regular produce.
46
Other Findings New Items
In the listening sessions, customers requested new items that they would like to see on the bus. While some of them were niche and unique to individual shoppers, a few of them were shared by multiple customers (for a full list of requested items, see question 8). The most commonly requested item was honey; it came up at almost every listening session. Pickles and assorted pickled vegetables were frequently requested: this could be something to consider alongside the waste-management practice of value added processing. Additionally, the idea of meat, especially chicken, was pretty popular. Rice and pasta were popular at stops in Lewiston where residents didn’t have easy access to grocery stores. Finally, there was a general request for a wider variety of fruits, but that might also be addressed with clearer signage of the daily selection. Flyers and Ads
As addressed above, it was made clear that the ambiguity around what the GFB is and does had partly to do with a lack of signage and advertisement. Flyers around central areas would help raise awareness in the general public, but fliers in buildings and community spaces would also be helpful in educating people about the GFB. There was a lot of support behind this idea from listening session participants--people seemed eager to spread the word. One customer said “If you give me your flyers I will make sure they get hung up” and many others echoed this sentiment. Additionally, ads in the newspaper and TV could help target new customers that might not otherwise hear about the bus. Reminder Systems
One reason people said they didn’t shop at the bus was because they simply forgot when it came or that it existed at all. This problem would be simply fixed with text or email reminders. Many neighborhoods have community listservs and/or text message alerts, and the GFB could use these platforms to remind people when the GFB comes. This can be organized on a stop-by-stop basis through community organizers. Additionally, items like GFB fridge magnets or reusable shopping bags could help remind people on a daily basis.
47