Embed Size (px)
Citation preview

Dr. BRIAN RUSH and TEAM
VIRGO PLANNING AND EVALUATION CONSULTANTS INC.
TORONTO, ONTARIO
Final Report
March 31, 2018
Please do not cite or circulate without permission
Improving Access and Coordination of
Mental Health and Addiction
Services: A Provincial Strategy for all
Manitobans
Report Appendices
ii
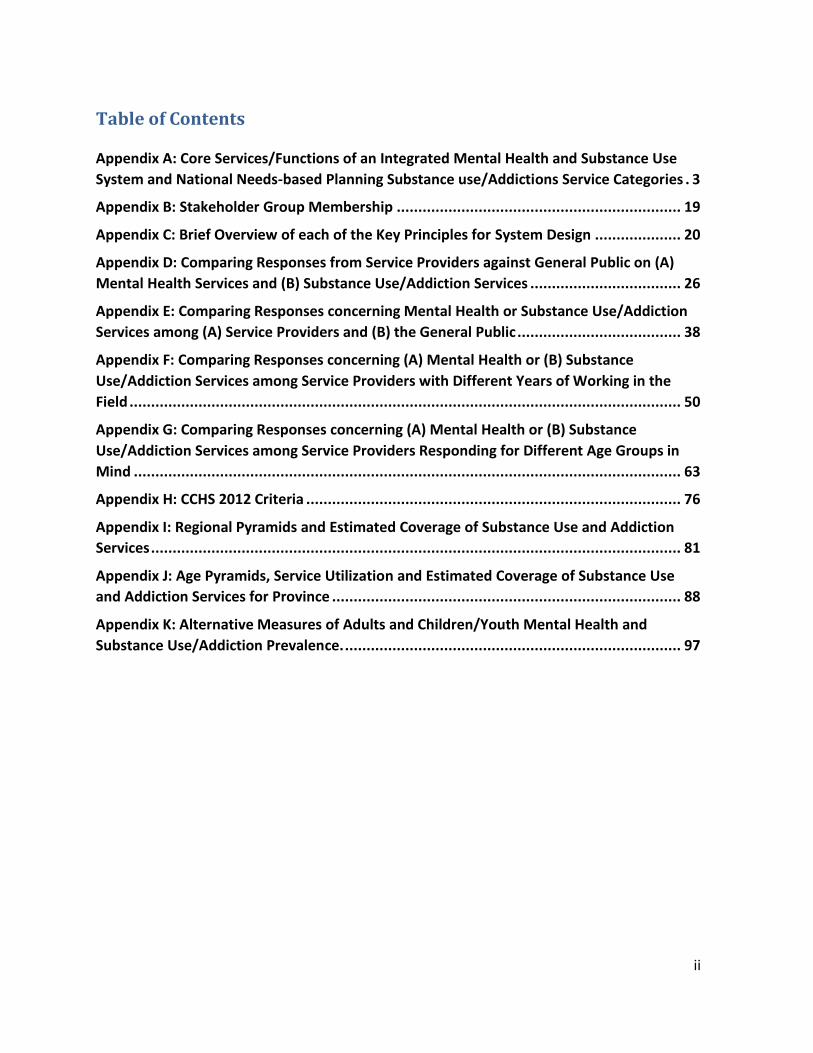
Table of Contents
Appendix A: Core Services/Functions of an Integrated Mental Health and Substance Use
System and National Needs-based Planning Substance use/Addictions Service Categories . 3
Appendix B: Stakeholder Group Membership .................................................................. 19
Appendix C: Brief Overview of each of the Key Principles for System Design .................... 20
Appendix D: Comparing Responses from Service Providers against General Public on (A)
Mental Health Services and (B) Substance Use/Addiction Services ................................... 26
Appendix E: Comparing Responses concerning Mental Health or Substance Use/Addiction
Services among (A) Service Providers and (B) the General Public ...................................... 38
Appendix F: Comparing Responses concerning (A) Mental Health or (B) Substance
Use/Addiction Services among Service Providers with Different Years of Working in the
Field ................................................................................................................................ 50
Appendix G: Comparing Responses concerning (A) Mental Health or (B) Substance
Use/Addiction Services among Service Providers Responding for Different Age Groups in
Mind ............................................................................................................................... 63
Appendix H: CCHS 2012 Criteria ....................................................................................... 76
Appendix I: Regional Pyramids and Estimated Coverage of Substance Use and Addiction
Services ........................................................................................................................... 81
Appendix J: Age Pyramids, Service Utilization and Estimated Coverage of Substance Use
and Addiction Services for Province ................................................................................. 88
Appendix K: Alternative Measures of Adults and Children/Youth Mental Health and
Substance Use/Addiction Prevalence. .............................................................................. 97

3
Appendix A: Core Services/Functions of an Integrated Mental Health and Substance Use System and National
Needs-based Planning Substance use/Addictions Service Categories
Core Services/Functions of an Integrated Mental Health and Substance Use
1 The use of word ‘typically’ does not imply that this is the current practice in all jurisdictions, but rather the way these functions are operationalized when implemented.
FUNCTIONS TYPICALLY1 OFFERED THROUGH EARLY INTERVENTION, ACCESS AND TREATMENT PLANNING & CRISIS MANAGEMENT SERVICES
(COMMUNITY OR HOSPITAL SETTINGS)
A1 A2 A3
Functions Providing information and
response to crisis
Providing information, engagement and linkage
supports, including outreach to specific populations
Providing identification and assessment
of strengths and needs, and
individualized treatment and support
planning
Examples of
service delivery
Crisis services (including crisis
phone lines and mobile crisis
response teams) Emergency
Psychiatry departments,
Emergency departments,
Emergency shelters
Central/Coordinated Access models, Case
Management Services, System Navigators, Peer
Support Services, Treatment Engagement
Specialists, Online Health Communities, Web-based
information services (chat services)
Central/Coordinated Access models,
Screening, Assessment and Referral
Services
Examples of
interventions
Short-term crisis intervention
(immediate assessment, triage
and problem, identification and
brief intervention)
Information and Referral, Case Management,
Supportive Counselling, Motivational Interviewing,
Screening and Triage, Transitional Supports
Technology-delivered brief
interventions, Motivational
Interviewing, Standardized screening
and assessment, Transitional Supports

4
FUNCTIONS TYPICALLY2 OFFERED THROUGH HEALTH CARE, HOUSING, SOCIAL, AND RECOVERY SUPPORT SERVICES
B1 B2 B3 B4
Functions Providing treatment and support
for physical health needs,
including those related to mental
health and/or substance use
Providing permanent or
transitional housing with or
without recovery-oriented
services such as supportive
counseling, life skills training
and social skills training, as well
as client-centered care and
individualized support
Providing support for basic needs
other than housing with a focus on
social determinants, transportation,
child care, mental health promotion,
rehabilitation and recovery
Providing continuity of care,
and monitoring to support long-
term recovery goals
Examples of
service
delivery
Primary care, Community Health
Centers, Nurse-Practitioner led
clinics, Family Health Teams,
Hospital-based health services,
Opioid Replacement Services
Housing First, Continuum of
supportive housing (e.g.
transitional or long-term
shelter; low-barrier housing for
long-term homeless people;
subsidized Housing; harm-
reduction homes)
Food banks, transportation support
services, income supports, child care
services, employment services,
training/education services, justice-
related services such as legal aid,
diversion and court support
Recovery support services, such
as peer support and case
management services; Internet-
based supports; mutual aid
groups, structured follow-up
services; Clubhouse
Example of
interventions
Provision of health care, Needle
and syringe exchange,
Motivational interviewing, Opiate
Replacement Therapy,
Transitional Supports
Transitional Supports Life skills
training, Community re-
integration, Psychosocial
Support Services such as,
employment, education,
vocational training
Community gardening, psychosocial
rehabilitation supports, employment
support, education support
Recovery Monitoring Check-
ups, transitional supports,
mutual aid and peer support
2 The use of word ‘typically’ does not imply that this is the current practice in all jurisdictions, but rather the way these functions are operationalized when implemented.
5
3 The use of word ‘typically’ does not imply that this is the current practice in all jurisdictions, but rather the way these functions are operationalized when implemented.
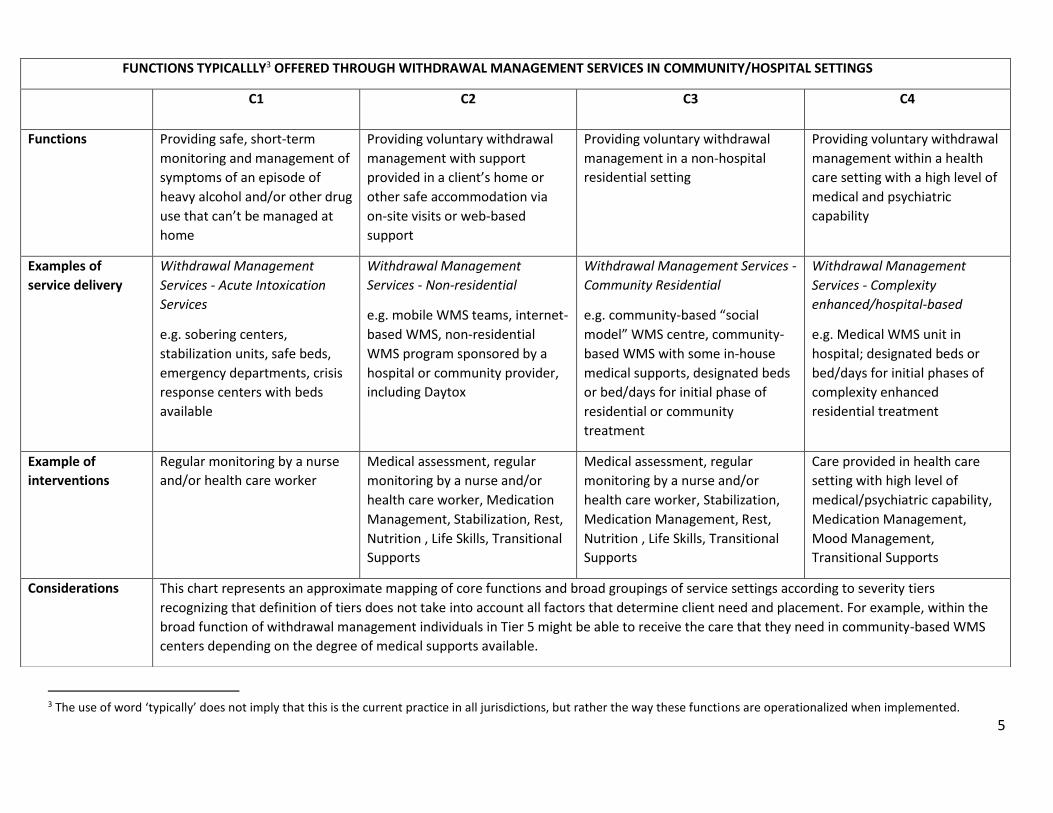
FUNCTIONS TYPICALLLY3 OFFERED THROUGH WITHDRAWAL MANAGEMENT SERVICES IN COMMUNITY/HOSPITAL SETTINGS
C1 C2 C3 C4
Functions Providing safe, short-term
monitoring and management of
symptoms of an episode of
heavy alcohol and/or other drug
use that can’t be managed at
home
Providing voluntary withdrawal
management with support
provided in a client’s home or
other safe accommodation via
on-site visits or web-based
support
Providing voluntary withdrawal
management in a non-hospital
residential setting
Providing voluntary withdrawal
management within a health
care setting with a high level of
medical and psychiatric
capability
Examples of
service delivery
Withdrawal Management
Services - Acute Intoxication
Services
e.g. sobering centers,
stabilization units, safe beds,
emergency departments, crisis
response centers with beds
available
Withdrawal Management
Services - Non-residential
e.g. mobile WMS teams, internet-
based WMS, non-residential
WMS program sponsored by a
hospital or community provider,
including Daytox
Withdrawal Management Services -
Community Residential
e.g. community-based “social
model” WMS centre, community-
based WMS with some in-house
medical supports, designated beds
or bed/days for initial phase of
residential or community
treatment
Withdrawal Management
Services - Complexity
enhanced/hospital-based
e.g. Medical WMS unit in
hospital; designated beds or
bed/days for initial phases of
complexity enhanced
residential treatment
Example of
interventions
Regular monitoring by a nurse
and/or health care worker
Medical assessment, regular
monitoring by a nurse and/or
health care worker, Medication
Management, Stabilization, Rest,
Nutrition , Life Skills, Transitional
Supports
Medical assessment, regular
monitoring by a nurse and/or
health care worker, Stabilization,
Medication Management, Rest,
Nutrition , Life Skills, Transitional
Supports
Care provided in health care
setting with high level of
medical/psychiatric capability,
Medication Management,
Mood Management,
Transitional Supports
Considerations This chart represents an approximate mapping of core functions and broad groupings of service settings according to severity tiers
recognizing that definition of tiers does not take into account all factors that determine client need and placement. For example, within the
broad function of withdrawal management individuals in Tier 5 might be able to receive the care that they need in community-based WMS
centers depending on the degree of medical supports available.

6
4 The use of word ‘typically’ does not imply that this is the current practice in all jurisdictions, but rather the way these functions are operationalized when implemented.
FUNCTIONS TYPICALLY4 OFFERED THROUGH OUTPATIENT/NON-RESIDENTIAL SERVICES (COMMUNITY OR HOSPITAL SETTINGS)
D1 D2 D3 D4 D5
Functions Providing feedback on
current substance use
and risk of potential
problems related to
current or increased use,
and offering activities
that motivate or build
relationships with at-risk
individuals and provide
advice or otherwise
facilitate connection to
treatment or support
services
Providing brief and
structured intervention
services that ask about
substance use, identifies
current level of risk and
encourages clients to
create a plan of action for
addressing their
substance use problems
Providing screening,
assessment and delivery of
individualized treatment and
support plans that includes
either short-term or
extended counselling or
other therapeutic
interventions
Providing short-term,
intensive, structured
treatment and support for
moderate to severe
mental illness and/or
substance use problems,
while the person lives at
home or another safe
setting
Providing longer-term,
intensive treatment and
support for moderate to
severe mental illness
and possibly co-
occurring substance use
problems, while the
person lives at home or
another safe setting
Examples of
service
delivery
Feedback and
Engagement Services,
e.g. Crisis services and
helplines with minimal or
no structured and
formalized screening and
assessment processes;
outreach services offered
in a wide range of
settings such as walk-in
clinics, schools, youth
hubs, hostels, peer
support and street
services, social
Structured, Brief
Intervention Services, e.g.
Centralized/coordinated
access services including
crisis services and
helplines that follow a
structured screening and
assessment protocol;
Screening and Brief
Intervention and Referral
to Treatment (SBIRT);
structured brief screening
and intervention for
pregnant women; brief,
Structured Comprehensive
Intervention Services, e.g.
Specialized non-residential
substance use services in a
hospital or community
setting, designated substance
use or cross-trained workers
in integrated mental health
and substance use services;
designated substance use or
cross-trained workers in
collaborative/shared care
health care or other
community services; ORT
Intensive Complexity-
Enhanced Intervention
Services, e.g. Day/evening
programs (consisting of a
minimum of 9 or more
hours of structured
activities a week for adults
or 6 or more hours a week
for adolescents
respectively with a focus
on treatment of clients
with more complex needs
than can be supported in
Brief or Comprehensive
Intensive case
management programs,
Assertive Community
Treatment (ACT),
Flexible Assertive
Community Treatment
(FACT

7
assistance, justice
settings, and
collaborative/shared care
services in health care
settings such as primary
care, community health
centers and emergency
departments
structured on-line
applications; telephone
or face-to-face Recovery
Monitoring Check-ups
services with clear provision
for psychosocial supports; in-
reach or out-reach case
management services
Intervention Services),
Intensive land-based
Aboriginal program
Example of
interventions
Information and referral Psychotherapy, Cognitive
Behavioural
Therapy (CBT -individual or
group or over the internet),
Dialectical behavior therapy
(DBT), Trauma-informed
therapy, Employment and
Education Support,
Transitional Supports,
culture-based supports
Family Education Groups,
Relapse Prevention
Education Groups for
clients, Individual or Family
Therapy, Medically
Assisted Treatment, life
skills, Transitional Supports
Medication
management,
Counselling, Life skills,
Case management ,
Transitional Supports,
culture-based supports
Considerations This chart represents an approximate mapping of core functions and broad groupings of service settings according to severity tiers recognizing
that definition of tiers does not take into account all factors that determine client need and placement. For example, within the broad function
of outpatient/non-residential individuals across all Tiers need feedback and engagement services. Similarly, individuals in Tier 2, 3 and 4 need
SBIRT but at varying degree of intensity. These nuances also need to be considered for individuals in Tier 4 and 5 using services available at
day/evening programs.

8
FUNCTIONS TYPICALLY5 OFFERED THROUGH INPATIENT/RESIDENTIAL SERVICES
IN COMMUNITY OR HOSPITAL SETTINGS
E1 E2 E3 E4 E5 E6
Functions Providing pre-
treatment support
for physical, social
and psychological
stabilization,
preparation and
readiness for
substance use
treatment in a safe
residential
environment
external to home
Providing
accommodation in a
stable, recovery-
oriented environment
and offering support for
longer-term supported
recovery and living
skills, often following
intensive substance use
treatment, in a safe
residential environment
external to home
Providing structured,
scheduled program
of interventions and
activities with access
to 24-hour support
and an alcohol and
drug-free residential
treatment milieu
Providing structured,
intensive and short-
term substance use
treatment, with
significant medical/
psychiatric
management, in a safe
residential
environment external
to home
Providing intensive,
and time-limited
psychiatric and
medical treatment for
acute mental illness,
including needs
related to specific
mental disorders, in a
safe residential
environment external
to home
Providing long-
term, psychiatric
and medical
treatment and
support for
chronic and
severe mental
illness, including
needs related to
specific mental
disorders, in a
safe residential
environment
external to home
Examples of
service delivery
Residential
Stabilization/Transit
ion Services, e.g.
Stand-alone
stabilization units or
“safe beds” beds in
a designated
residential
treatment facility
Residential Supportive
Recovery Services, e.g.
Halfway or ¾-way
House, Recovery Home,
Residential Managed
Alcohol Program,
Stabilization and
Transitional Living
Residences or STLRs,
Substance Use
Supported Housing with
in-house supports
Community Intensive
Residential
Treatment Services,
e.g. Intensive
Residential
Treatment Centers
Hospital/complexity-
Enhanced Residential
Services
Residential, hospital-
based acute-care
psychiatric treatment
services. Disorder-
specific settings may
focus on psychotic
disorders, mood and
anxiety and/or eating
disorders, for example;
Forensic (short-term)
Residential
services offered
through
psychiatric
hospitals;
Forensic (long-
term)
5 The use of word ‘typically’ does not imply that this is the current practice in all jurisdictions, but rather the way these functions are operationalized when implemented.

9
Example of
interventions
Assessment, Care
planning, Respite,
Nutrition,
Counselling,
Motivational
Interviewing,
Transitional
Supports
Life skills training,
Community re-
integration, Mutual Aid
Supports, Counseling,
Case Management,
Employment Supports,
Transitional Supports
Individual/Group
Counselling, Peer
Support, Psycho-
Social Education,
Life-Skills Training
Recreation Therapy,
Transitional Supports
Individualized medical
or psychiatric care, 24-
hour access to
residential support
and medication
management,
Transitional Supports
Psychiatric
Consultation and
Assessment,
supported by Nursing,
Psychology, Social
Work, Concurrent
Disorders,
Occupational Therapy,
and Recreational
Therapy Services,
Transitional Supports
Comprehensive
psychological,
medical and
medication
monitoring;
Social, functional
and family
assessments;
Therapeutic
activity groups
(including CBT
and Concurrent
disorder groups),
Social and
Vocational
Rehabilitation,
Transitional
Supports
Considerations This chart represents an approximate mapping of core functions and broad groupings of service settings according to severity tiers recognizing
that definition of tiers does not take into account all factors that determine client need and placement. For example, within the broad function
of inpatient/residential services individuals in Tier 3, 4 and 5 need stabilization services but at varying degree of intensity. Similarly, residential
supportive recovery services may offer services to individuals in Tier 3, 4 and 5 depending on the degree of supports available.
10
2016-18 National Needs-based Planning Substance use/Addictions Service
Categories
A. Withdrawal Management (WM) and Support Services
These services assist with voluntary, safe withdrawal from substances and are provided at four
levels of care – acute intoxication; non-residential; community residential; and
hospital/complexity enhanced residential.
While some aspects of the definitions of these sub-categories are clear, for example, with or
without beds other aspects are, however, a matter of degree, for example, the nature and
scope of medical support that may exist in a community residential withdrawal management
program (e.g., nurse practitioner and back up physician support) versus a hospital/complexity-
enhanced program with a broader multi-disciplinary team including psychiatry.
Precise definitions are also challenged by the fact that there are several key principles that one
expects to be reflected in all types of substance use services (e.g., recovery orientation, harm
reduction, trauma-informed) as well as key functions towards which all services should have
some role, however limited in scope due to their mandate (e.g., linkage and engagement
support, screening/identification, assessment and treatment planning, support for social
determinants and transitions). All these key principles and functions are articulated in separate
draft reports from the National Needs-Based Planning Project (contact information:
[email protected]). These are all important factors for estimating staffing and other resource
requirements.
With these challenges in mind the following definitions are offered for the four levels of
withdrawal management. Some examples follow each definition that illustrates how this type
of service has been operationalized in some Canadian jurisdictions.

11
i. Acute Intoxication Services: This involves providing safe, short-term monitoring and
management of symptoms of an episode of heavy alcohol and/or other drug use that
can’t be managed at home. Length of stay can be relatively brief, typically less than 24
hours depending on individual circumstances. This service is offered to clients that do
not have an apparent medical or psychiatric condition necessitating emergency
interventions.
Examples include: Sobering centers, stabilization units, safe beds, emergency
departments, crisis response centres with beds available.
ii. Non-residential WM Services: This involves voluntary withdrawal management with
support provided in a client’s home or other safe accommodation via on-site visits or
web-based support. It may also involve visits to a central location (e.g., addictions
program, “safe home” in the community) during the day, while returning home at night.
This service may involve a medical assessment by a physician and regular monitoring by
a nurse and health care worker during the withdrawal process to provide medical
management and support. Before the client is “discharged”, case workers work
collaboratively to support the client and/or those supporting the client to connect to
post-withdrawal management services (e.g. treatment, housing, other supports).
Examples include: Mobile WMS teams, Internet-based WMS, non-residential WMS
program sponsored by a hospital or community provider, including Daytox.
iii. Community Residential WM Services: This involves voluntary withdrawal management
in a non-hospital residential setting. These services, however, are typically sponsored or
otherwise administratively linked to a hospital for quick access to medical emergencies,
the services provided are largely non-medical in nature. That being said, this may
involve a medical assessment by a physician and monitoring by a nurse or other health
care worker during the withdrawal process to provide medical management and
support as needed, The intensity of the monitoring may vary by setting. Withdrawal can
be supported with or without medication management. Before the client is
“discharged”, case workers work collaboratively to support the client and/or those

12
supporting the client to connect to post-withdrawal management services (e.g.
treatment, housing, other supports).
Examples include: Community-based “social model” WMS centre, community-based
WMS with some in-house medical supports, designated beds or bed/days for initial
phase of residential or community treatment.
iv. Hospital/complexity-Enhanced Residential WM Services: This involves assistance with
voluntary withdrawal management where care is provided within the structure of a
health care setting with a high level of medical and psychiatric capability. This typically
involved the use of designated hospital beds and with medication management, for
example, to assist with physical stabilization and withdrawal, and/or co-occurring
mental disorders. Before the client is discharged, case workers ensure that the client
and/or those supporting the client are connected to other substance use treatment
services.
Examples include: Medical WMS unit in hospital; designated beds or bed/days for initial
phases of complexity enhanced residential treatment
B. Community/Non-Residential Services and Supports
These substance use services are both office and non-office based and fall into four sub-
categories – feedback and engagement services; structured brief intervention services;
structured comprehensive intervention services and intensive/complexity enhanced
intervention services.
As with withdrawal management, many aspects of the definitions of these sub-categories are a
matter of degree based on duration and intensity of the interventions offered, for example, the
typical time of an encounter or appointment and the numbers of hours or days of a very
structured day or evening program. They may be delivered by hospital or community-based

13
services and therefore offer varying levels of, or access to medical supports. The distinguishing
feature of Community Services and Supports is that there is no residential component although
arrangements may be made for accommodation while the person participates in a program,
structured day treatment for example.
Also, as with withdrawal management precise definitions are also challenged by the fact that
there are several key principles that one expects to be reflected in all types of substance use
services (e.g., recovery orientation, harm reduction, trauma-informed) as well as key functions
towards which all services should have some role, however limited in scope due to their
mandate (e.g., linkage and engagement support, screening/identification, assessment and
treatment planning, support for social determinants and transitions). All of these key principles
and functions are articulated in separate draft reports from the National Needs-Based Planning
Project (contact information: [email protected]). There are all important factors for
estimating staffing and other resource requirements.
With these challenges in mind the following definitions are offered for the four levels of
Community Services and Supports. Some examples follow each definition that illustrate how
this type of service has been operationalized in some Canadian jurisdictions
i. Feedback and Engagement Services: These services provide feedback on current
substance use and risk of potential problems related to current or increased use. They
also offer activities aimed at motivating or building relationships with at-risk individuals
and provide advice or otherwise facilitate connection to treatment or support services.
Examples include: Crisis services and helplines but with minimal or no structured and
formalized screening and assessment processes; outreach services offered in a wide
range of settings such as walk-in clinics, schools, youth hubs, hostels, peer support and
street services, social assistance, justice settings, and collaborative/shared care services

14
in health care settings such as primary care, community health centres and emergency
departments.
ii. Structured, Brief Intervention Services: This involves brief and structured efforts that
ask about substance use, identify current level of risk and encourages clients to create a
plan of action for addressing their substance use problems (e.g., to reduce use, seek
further assessment and treatment). This may include brief structured, readiness-based
intervention for clients already screened and determined to be unmotivated at present
for further treatment and support.
Examples include: Centralized/coordinated access services including crisis services and
helplines that follow a structured screening and assessment protocol; Screening and
Brief Intervention and Referral to Treatment (SBIRT); structured brief screening and
intervention for pregnant women; brief, structured on-line applications; telephone or
face-to-face Recovery Monitoring Check-ups; addiction liaison staff located in health
care settings following a defined case identification and referral protocol (i.e., more
extensive than a feedback and engagement service).
iii. Structured Comprehensive Intervention Services: These services offer structured
efforts to provide screening, assessment and delivery of individualized treatment and
support plans that includes either short-term or extended counselling or other
therapeutic interventions. This typically involves a scheduled course of one – two hour
sessions of counselling for substance use and related problems substance use-specific
counseling in group sessions or individual formats. Case management also falls into this
category as does Opioid Replacement Treatment (ORT) following evidence-based
practice for provision of psychosocial supports.
Examples include: Specialized non-residential substance use services in a hospital or
community setting, designated substance use or cross-trained clinicians in integrated
mental health and substance use services; designated substance use or cross-trained
clinicians in collaborative/shared care health care or other community services; ORT

15
services with clear provision for psychosocial supports; in-reach or out-reach case
management services.
iv. Intensive Complexity-Enhanced Intervention Services: These services consist of a
minimum of 9 or more hours of structured activities a week for adults or 6 or more
hours a week for adolescents respectively with a focus on treatment of clients with
more complex needs than can be supported in Brief or Comprehensive Intervention
Services (see above). These offer a range of individual or group programs, including
psycho-educational, relapse prevention, stress management, skills development
programs. Services may be offered during the day, before or after work or school, in the
evening, and/or on weekends.
Examples include: Day/Evening programs
C. Residential Services and Supports
The essential characteristic for these substance use services is that clients temporarily reside in
an environment where substance use treatment interventions are provided in-house. They may
be delivered by hospital or community-based services and, therefore, offer varying levels of, or
access to, medical supports depending on the degree of challenges related to co-occurring
mental and physical health conditions among the targeted client population.
As with Withdrawal Management and Community Non-residential Services and Supports
precise definitions are challenged by the fact that there are several key principles that one
expects to be reflected in all types of substance use services (e.g., recovery orientation, harm
reduction, trauma-informed) as well as key functions towards which all services should have
some role, however limited in scope due to their mandate (e.g., linkage and engagement
support, screening/identification, assessment and treatment planning, support for social
determinants and transitions). All of these key principles and functions are articulated in
separate draft reports from the National Needs-Based Planning Project (contact information:

16
[email protected]). There are all important factors for estimating staffing and other resource
requirements.
There are four levels of residential services and supports; Stabilization/Transition Services,
Supportive Recovery Services, Community Intensive Residential Treatment, and
Hospital/complexity-Enhanced Residential Services
i. Stabilization/Transition Services: These residential services offer a variable length stay
up to a maximum of 30 days of support (as a guideline) for physical, social and
psychological stabilization. A key distinguishing characteristic is that there is minimal in-
house programming given the focus on rest and stabilization. This focus allows the
resident to plan for entering a residential or non-residential treatment service (e.g.,
while on a wait list post-withdrawal management). Stabilization/transition beds may
also be used to help the person make the transition from a residential service to a
community non-residential service, for example when housing in the community has
stabilized. This may also be a distinct phase of treatment in some residential treatment
services.
Examples include: Stand-alone Stabilization Unit including those with involuntary youth
beds in some Canadian jurisdictions; stabilization or “safe beds” beds in a designated
residential treatment facility, such as STAR beds in BC; “Phase 1” beds of a designated
residential treatment program.
ii. Supportive Recovery Services: These services typically provide accommodation in a
stable, recovery-oriented environment. Although the large majority of such services are
alcohol/drug free, “Harm Reduction Homes” or Residential Managed Alcohol Programs
are also included. Activities typically include coaching for daily living focusing on
eventual community reintegration, participating in mutual aid supports (e.g., AA). Highly
17
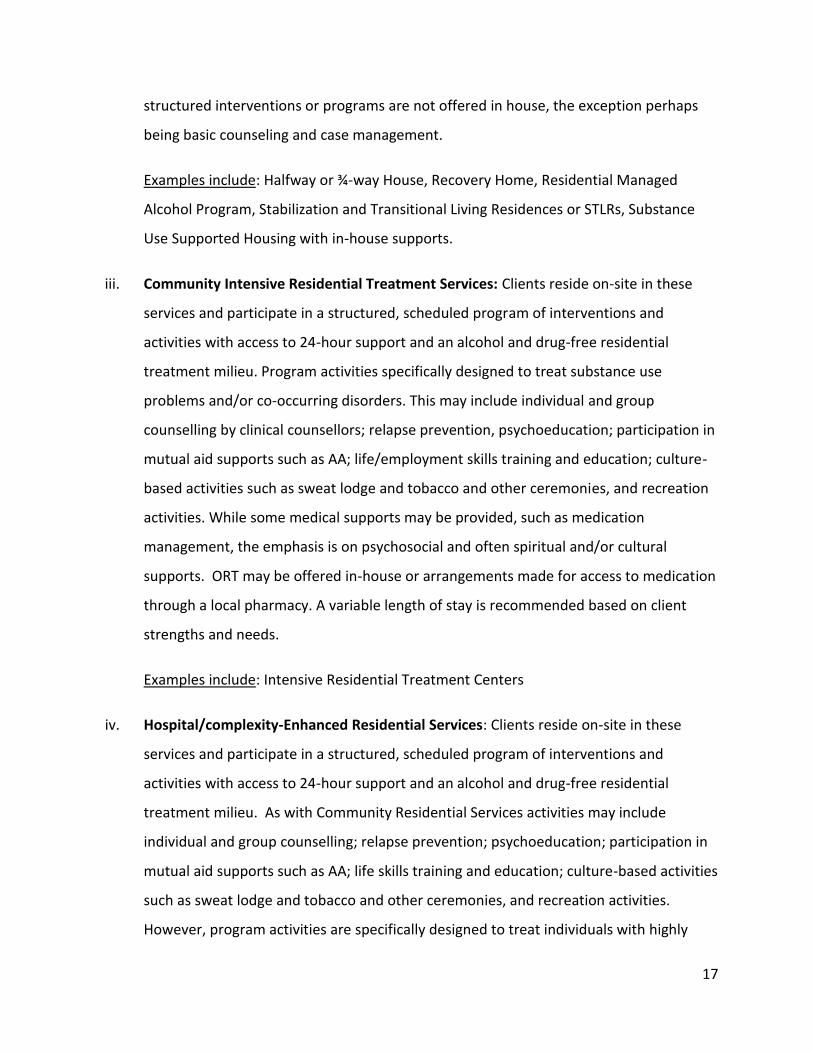
structured interventions or programs are not offered in house, the exception perhaps
being basic counseling and case management.
Examples include: Halfway or ¾-way House, Recovery Home, Residential Managed
Alcohol Program, Stabilization and Transitional Living Residences or STLRs, Substance
Use Supported Housing with in-house supports.
iii. Community Intensive Residential Treatment Services: Clients reside on-site in these
services and participate in a structured, scheduled program of interventions and
activities with access to 24-hour support and an alcohol and drug-free residential
treatment milieu. Program activities specifically designed to treat substance use
problems and/or co-occurring disorders. This may include individual and group
counselling by clinical counsellors; relapse prevention, psychoeducation; participation in
mutual aid supports such as AA; life/employment skills training and education; culture-
based activities such as sweat lodge and tobacco and other ceremonies, and recreation
activities. While some medical supports may be provided, such as medication
management, the emphasis is on psychosocial and often spiritual and/or cultural
supports. ORT may be offered in-house or arrangements made for access to medication
through a local pharmacy. A variable length of stay is recommended based on client
strengths and needs.
Examples include: Intensive Residential Treatment Centers
iv. Hospital/complexity-Enhanced Residential Services: Clients reside on-site in these
services and participate in a structured, scheduled program of interventions and
activities with access to 24-hour support and an alcohol and drug-free residential
treatment milieu. As with Community Residential Services activities may include
individual and group counselling; relapse prevention; psychoeducation; participation in
mutual aid supports such as AA; life skills training and education; culture-based activities
such as sweat lodge and tobacco and other ceremonies, and recreation activities.
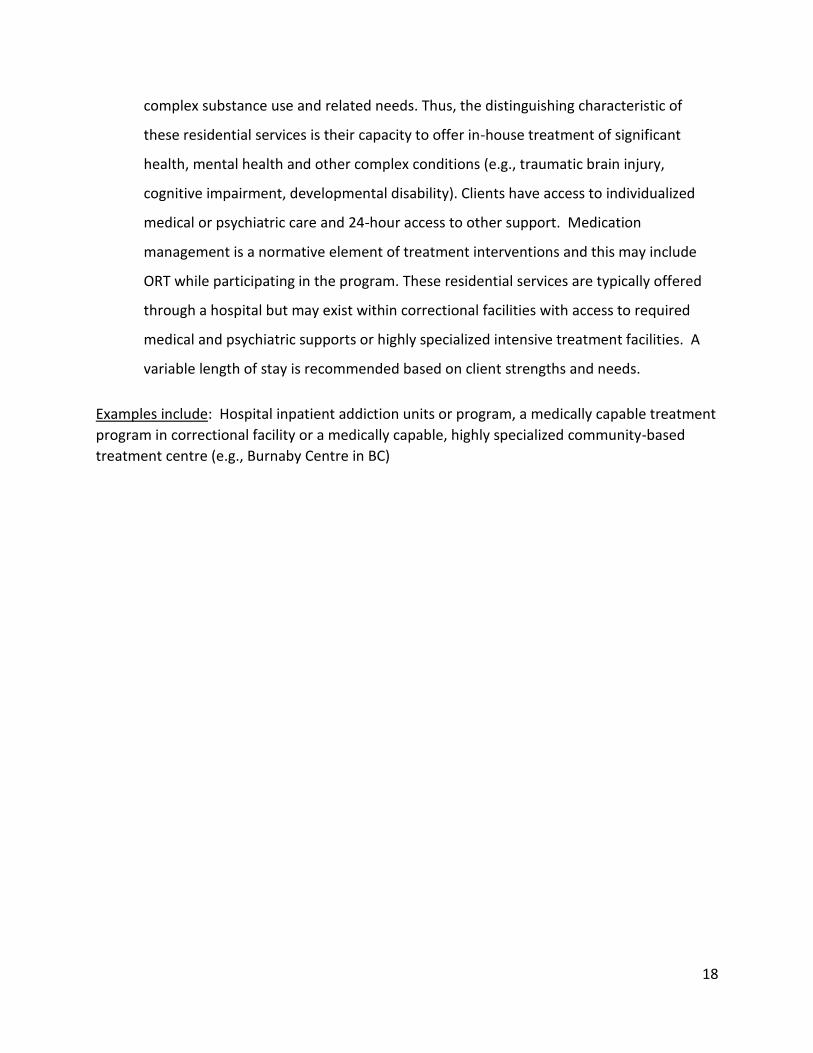
However, program activities are specifically designed to treat individuals with highly
18
complex substance use and related needs. Thus, the distinguishing characteristic of
these residential services is their capacity to offer in-house treatment of significant
health, mental health and other complex conditions (e.g., traumatic brain injury,
cognitive impairment, developmental disability). Clients have access to individualized
medical or psychiatric care and 24-hour access to other support. Medication
management is a normative element of treatment interventions and this may include
ORT while participating in the program. These residential services are typically offered
through a hospital but may exist within correctional facilities with access to required
medical and psychiatric supports or highly specialized intensive treatment facilities. A
variable length of stay is recommended based on client strengths and needs.
Examples include: Hospital inpatient addiction units or program, a medically capable treatment
program in correctional facility or a medically capable, highly specialized community-based
treatment centre (e.g., Burnaby Centre in BC)

19
Appendix B: Stakeholder Group Membership
Reference Group
Cook, Catherine WRHA
Cooper, Marion CMHA
Fry, Ben AFM
Gilson, Penny Prairie Mountain Health (PMH)
Graceffo, Greg Justice
Keeper, Florence
Lapointe, Laura
Middendorp, Lori MATC
Perron, Jill MHRC
Rattray, Jennifer Families
Santos, Rob MET-HCMO
Sareen, Jitender Professor and Head
Department of Psychiatry, University of Manitoba -
Medical Director, WRHA Mental Health Program
Thomson, Marcia ADM, Mental Health & Addictions, Primary Health Care & Seniors
Van Denakker, Ron Interlake-Eastern RHA
Zloty, Richard Chief Provincial Psychiatrist, Mental Health & Addictions,
Primary Health Care & Seniors
Logistics Committee
Wasilewski, Barbara MHA Strategy and Logistics - Lead
Executive Director, Primary Health Care
Leggett, Sean Program & Policy Analyst, Mental Health & Addictions
Dudok, Stephanie Program & Policy Analyst, Mental Health & Addictions
Loewen, Stephanie Director, Mental Health & Addictions

20
Appendix C: Brief Overview of each of the Key Principles for System
Design
Principle 1 calls for a broad recovery-oriented systems approach in order to address the range of
mental health problems and illnesses and substance use/addiction and related problems in the
community as a whole, including but not limited to severe and enduring mental illness, in order
to achieve a population-level impact.
Treatment and support systems must be planned on the basis of population health, not solely
on the basis of those seeking assistance at a given point in time. This approach demands
consideration of the strengths and needs of the entire community and across the full spectrum
of risks and harms associated with mental health, substance use and gambling, including, but
not limited to, severe addiction/dependence. A correspondingly broad community “whole
systems response” is required to respond effectively and efficiently to the full spectrum of
acute, chronic, and complex needs. The distribution of need is reflected in “severity tiers” of a
population health pyramid, an approach that has now served as the foundation for the tiered
model for system planning in the vast majority of Canadian provinces and territories6, including
Manitoba. In the full gap analysis new data developed for Manitoba will be utilized. A similar
approach can be applied for children and youth, although currently the data are not as strong
for estimating the full spectrum of need.
Based on the population health pyramid the scope and intensity of service-related needs in a
population are inverse to the proportion affected, such that the highest levels of problem
severity and complexity, and in need of the most specialized and intensive treatment and
recovery plans, are associated with the fewest number of people. They do, however, contribute
the highest proportion of system costs. Those with lower levels of problem severity and
complexity are more numerous and their needs can be met by less intensive or less specialized
services, which can be made more widely available in a variety of health and social service
contexts. The bottom of the “population pyramid” reflects people at no or low risk; the target
population for secondary and primary prevention. Importantly, this locates the considerations
of public health and prevention into the same frame as planning for treatment and recovery
supports and vice versa. This includes public education and efforts to reduce stigma and
discrimination. The goal of the whole system response is to improve overall population health,
including across all levels of risk and need.
6 Rush, B. (2010). Tiered frameworks for planning substance use service delivery systems: origins and key principles. Nordic Studies on Alcohol and Drugs, 27, 617-636.

21
Principle 2 articulates the importance of collaboration across multiple stakeholders as a necessary condition for enhancing accessibility and effectiveness of services.
Generally stated, the purpose of collaboration is to increase the chances of achieving some
objective(s) compared to acting alone. Expected benefits include improved access, earlier
detection and intervention, improved transitions and continuity of care, and improved client
outcomes, particularly for those with more complex conditions. Consistent with a broad
systems approach, it has now become commonplace in the planning, delivery and evaluation of
mental health and substance use/addiction services to look to “collaboration” as a potential
solution, or at least a partial solution, to challenges in providing timely access and continuity of
services. The drive toward greater collaboration with other health care services, especially
primary care, criminal justice, child protection and other social services reflects the recognition
of common, co-occurring health and social problems, such that no single service provider can
effectively address the full array of complex and persistent challenges
Although there is no single standard definition, it is helpful to think of collaboration as varying
along a continuum from communication, through to fully co-located and integrated services7.
The literature on health service integration also distinguishes between several types of
integration. A common distinction is structural versus functional integration, the former
referring to arrangements for shared administrative and governance functions and (typically)
co-location, while functional integration refers to cross-organizational arrangements that
support the delivery of integrated services (e.g., models of shared care, integrated care
pathways, shared medical records). Normative or cultural integration is less well-known and
refers to convergence of values, norms, and approaches to day-to-day business, critically
important for improving relationships among mental health, substance use/addiction and
health service providers given the divergence of service and organizational culture that are
deeply entrenched within these sectors. Integration can also take place at the level of specific
programs and interventions and/or at a system level, for example, joint planning.
Principle 3 concerns the system supports needed to facilitate and ensure the effective delivery of recovery-oriented services; supports such as policy, funding and planning models, performance measurement and evaluation systems, and support for knowledge transfer and implementation of evidence-informed practices.
7Kates, M., Mazowita, G., Lemire, F., Jayabarathan, A., Bland, R., et al. (2011). The evolution of collaborative mental health in Canada: A shared vision for the future. Canadian Journal of Psychiatry, 56(5), 1-10.

22
One of the strengths of the tiered model for planning mental health and substance
use/addiction treatment and recovery support systems is the distinction drawn between the
functions and services needed for people at different levels of severity and the system supports
required to ensure adequate infrastructure (Rush, 2010). These system supports include but are
not limited to:
Planning and funding, for example, funding that is proportionate to the level of need; multi-
sectoral partnerships, engagement of people with lived experience.
Governance and leadership, for example, ensuring governance structures facilitate an effective
response to individual and community complexity and bio-psycho-social-spiritual/cultural
interventions.
Workforce health and competencies, for example, ensuring workforce wellness, workplace
safety, role clarity, and an adequate supply of trained and competent managers and staff.
Performance measurement and information management, for example, ensuring appropriate
accountability and performance metrics, and application in quality improvement; sharing of
information through e-health platforms.
implementation of evidence-based practices (EBPs), including means to identify, pilot test and
scale up effective interventions and ensuring all approaches meet basic requirements for
appropriateness, effectiveness and efficiency.
Research and knowledge exchange/translation, including, surveillance systems, and research
and evaluation and efforts to translate findings into usable program and policy development.
Principle 4 articulates the importance of recognizing the unique strengths and needs of Indigenous people with respect to mental health problems and illnesses, substance use/addiction and related problems with a focus on enhanced physical, mental, emotional and spiritual health, and the benefit of services that blend principles and practices of “western medicine” with those based on traditional healing.
Among Indigenous populations worldwide, the elevated prevalence of mental health problems
and illnesses and high-risk substance use and addiction is well established, with causal factors
rooted in socio-political and environmental determinants of health. These determinants stem
from the many stages and facets of colonization, including (but not limited to) residential
schools (in Canada) and widespread displacement, which have resulted in intergenerational
trauma. These facts notwithstanding, there is huge variation in both the strengths and
challenges experienced in Indigenous communities during and after colonization.

23
The importance of articulating a separate principle for treatment system design for Indigenous
peoples, as opposed to their inclusion in a general principle related to diversity and equity (see
principle #5 below), is founded on the legislated and treaty-based rights of Indigenous peoples
within colonized territory. While in most jurisdictions Indigenous rights to land, water, fishing,
hunting and traditional cultural practices have eroded over time, they remain extremely
relevant for mental health and substance use/addiction treatment systems in many counties.
Important issues include, for example, the locus of responsibility and governance of health
care, housing, and other community services, service provision in semi-remote or remote
communities, and acceptance of culture-based healing practices. The United Nations has
reaffirmed the basic universal rights of Indigenous peoples globally, including their right to
traditional medicine. Increasingly these practices are offered alongside, or integrated with,
western-based approaches to psychotherapy and medication-assisted treatment, with bi-
culturally competence encouraged among both practitioners and clients.
Principle 5 calls for consideration of evidence and issues related to developmental age, gender, equity and diversity in designing effective treatment and support systems.
The development of mental health and substance use/addiction challenges involves the
complex interplay between individual biology and broader social structural factors, which over
time deflect an individual’s developmental trajectory toward or away from manifesting these
challenges. As a result, a person seeking and possibly entering treatment brings with them the
host of strengths and challenges that have amassed over their life course. In addition to
experiencing poverty, criminalization, racism, and other forms of social marginalization, many
(if not the majority) have a history of trauma. In addition to impacting on health, these factors
affect people’s abilities to access care. Treatment outcomes can be expected to be maximized
to the extent that services are able to attend to these issues through the provision of culturally
and developmentally appropriate care.
A host of sociodemographic characteristics are used to evaluate equity in mental health and
substance use treatment and recovery support systems (e.g., gender, gender identity, sexual
orientation, age and developmental stage, race, ethno-cultural background, immigrant/refugee
status, socioeconomic status). Such factors affect the types of barriers that people encounter
when trying to access services, as well as their experiences of these services. Rates of treatment
completion have been shown to vary by ethno-cultural background and socioeconomic status.
Among other broad trends affecting treatment systems, we can expect increasing demand for
services by older people in the coming years. This will impact the system in many ways; for
instance, potentially increasing demand for services related to medications such as
24
benzodiazepines and opioids and raising accessibility and clinical challenges related to physical
health comorbidities and cognitive impairment.
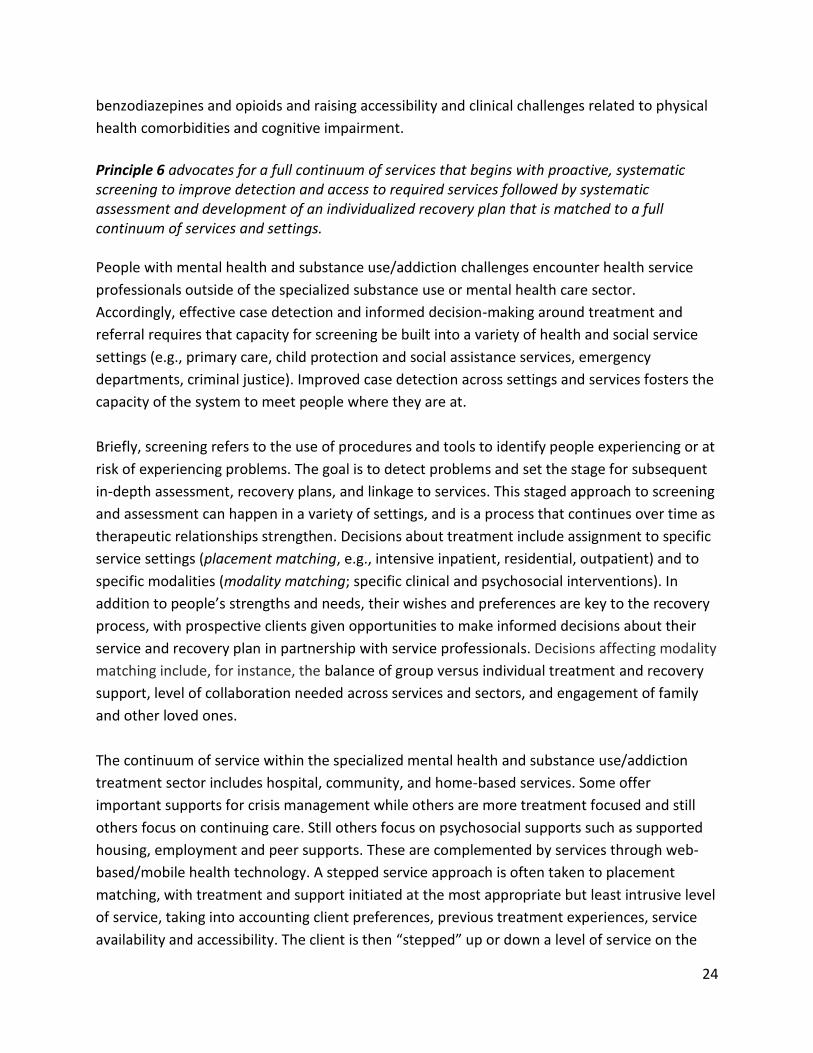
Principle 6 advocates for a full continuum of services that begins with proactive, systematic screening to improve detection and access to required services followed by systematic assessment and development of an individualized recovery plan that is matched to a full continuum of services and settings. People with mental health and substance use/addiction challenges encounter health service
professionals outside of the specialized substance use or mental health care sector.
Accordingly, effective case detection and informed decision-making around treatment and
referral requires that capacity for screening be built into a variety of health and social service
settings (e.g., primary care, child protection and social assistance services, emergency
departments, criminal justice). Improved case detection across settings and services fosters the
capacity of the system to meet people where they are at.
Briefly, screening refers to the use of procedures and tools to identify people experiencing or at
risk of experiencing problems. The goal is to detect problems and set the stage for subsequent
in-depth assessment, recovery plans, and linkage to services. This staged approach to screening
and assessment can happen in a variety of settings, and is a process that continues over time as
therapeutic relationships strengthen. Decisions about treatment include assignment to specific
service settings (placement matching, e.g., intensive inpatient, residential, outpatient) and to
specific modalities (modality matching; specific clinical and psychosocial interventions). In
addition to people’s strengths and needs, their wishes and preferences are key to the recovery
process, with prospective clients given opportunities to make informed decisions about their
service and recovery plan in partnership with service professionals. Decisions affecting modality
matching include, for instance, the balance of group versus individual treatment and recovery
support, level of collaboration needed across services and sectors, and engagement of family
and other loved ones.
The continuum of service within the specialized mental health and substance use/addiction
treatment sector includes hospital, community, and home-based services. Some offer
important supports for crisis management while others are more treatment focused and still
others focus on continuing care. Still others focus on psychosocial supports such as supported
housing, employment and peer supports. These are complemented by services through web-
based/mobile health technology. A stepped service approach is often taken to placement
matching, with treatment and support initiated at the most appropriate but least intrusive level
of service, taking into accounting client preferences, previous treatment experiences, service
availability and accessibility. The client is then “stepped” up or down a level of service on the
25
basis of progress toward their recovery goals. Effective use of this continuum requires supports
for people to encourage self-reflection and help-seeking, as well as supports to promote
smooth transitions between services and assist with system navigation.
Principle 7 calls for the use of evidence-informed psychosocial and clinical interventions within these service delivery settings as the basis for effective treatment and recovery.
Evidence supports a variety of bio-medical and psychotherapeutic approaches and peer
support, to emergent approaches such as traditional medicine and the use of psychedelics. A
consistent finding from the evidence base evaluating mental health and substance
use/addiction treatment is that no single intervention works for everyone, highlighting the
need for comprehensive assessment and recovery planning so as to accommodate people’s
strengths, needs, and preferences. Broad groupings of interventions can include:
1. Group or individual psychotherapies
2. Pharmacological treatment
3. Self-help, mutual aid, and peer support
4. Traditional medicine
26
Appendix D: Comparing Responses from Service Providers against
General Public on (A) Mental Health Services and (B) Substance
Use/Addiction Services

27
5.0
39.2
15.0
30.1
9.7
1.02.9
20.4
12.0
38.2
26.0
.5
0.0
5.0
10.0
15.0
20.0
25.0
30.0
35.0
40.0
45.0
StronglyAgree
Agree NeitherAgree
norDisagree
Disagree StronglyDisagree
Don'tKnow
Pe
rce
nta
ge
Figure D1 - Mental Health - Information about mental health services and supports is readily available and accessible
Service Providers
General Public
2.4
16.511.6
44.7
23.5
1.31.3
9.6 7.6
33.9
46.6
1.0
0.05.0
10.015.020.025.030.035.040.045.050.0
StronglyAgree
Agree NeitherAgree
norDisagree
Disagree StronglyDisagree
Don'tKnow
Pe
rce
nta
ge
Figure D2 - Mental Health - Regardless of the kind of services or supports (such as mental health clinic, doctor’s office)
people start with, they are able to access other services or supports without too much difficulty
Service Providers
General Public
1.0
7.3 7.6
39.043.6
1.51.14.3 5.5
26.5
60.8
1.8
.0
10.0
20.0
30.0
40.0
50.0
60.0
70.0
StronglyAgree
Agree NeitherAgree
norDisagree
Disagree StronglyDisagree
Don'tKnow
Pe
rce
nta
ge
Figure D3 - Mental Health - People are able to access the services and supports they seek without unnecessary delays
or long wait times
Service Providers
General Public2.1
24.3
15.0
33.7
22.9
2.11.5
15.3 14.5
27.6
37.1
3.9
0.0
5.0
10.0
15.0
20.0
25.0
30.0
35.0
40.0
StronglyAgree
Agree NeitherAgree
norDisagree
Disagree StronglyDisagree
Don'tKnow
Pe
rce
nta
ge
Figure D4 - Mental Health - People are able to access most services and supports they require in or near their home
community
Service Providers
General Public
Figure D1 to D20 (A) Mental Health Services

28
2.8
25.526.8
25.7
12.9
6.4
2.2
13.5
23.2
20.018.7
22.5
0.0
5.0
10.0
15.0
20.0
25.0
30.0
StronglyAgree
Agree NeitherAgree
norDisagree
Disagree StronglyDisagree
Don'tKnow
Pe
rce
nta
ge
Figure D8 - Mental Health - People are able to obtain services and supports that are sensitive and appropriate to their
cultural needs
Service Providers
General Public
4.4
36.6
16.5
26.8
13.5
2.11.6
19.2
12.4
31.8 32.7
2.4
0.0
5.0
10.0
15.0
20.0
25.0
30.0
35.0
40.0
StronglyAgree
Agree NeitherAgree
norDisagree
Disagree StronglyDisagree
Don'tKnow
Pe
rce
nta
ge
Figure D6 - Mental Health - People are able to obtain services and supports that are appropriate for the kinds of problems
they are experiencing (such as mood or anxiety related challenges)
Service Providers
General Public
3.0
24.4
17.0
33.6
20.3
1.61.6
12.0 11.5
30.7
41.4
2.8
0.0
5.0
10.0
15.0
20.0
25.0
30.0
35.0
40.0
45.0
StronglyAgree
Agree NeitherAgree
norDisagree
Disagree StronglyDisagree
Don'tKnow
Pe
rce
nta
ge
Figure D7 - Mental Health - People are able to obtain services and supports that are appropriate for the severity
(seriousness) of the problems they are experiencing
Service Providers
General Public
5.5
38.9
19.221.3
10.6
4.54.0
26.0
18.3 19.0 18.9
13.8
0.0
5.0
10.0
15.0
20.0
25.0
30.0
35.0
40.0
45.0
StronglyAgree
Agree NeitherAgree
norDisagree
Disagree StronglyDisagree
Don'tKnow
Pe
rce
nta
ge
Figure D5 - Mental Health - People are able to access services and supports without being limited by factors such as
language, gender, sexual orientation or age
Service Providers
General Public

29
1.8
12.414.4
37.3
31.3
2.81.3
7.39.7
30.0
47.3
4.5
0.0
5.0
10.0
15.0
20.0
25.0
30.0
35.0
40.0
45.0
50.0
StronglyAgree
Agree NeitherAgree
norDisagree
Disagree StronglyDisagree
Don'tKnow
Pe
rce
nta
ge
Figure D12 - Mental Health - There is a wide range of mental health services and supports to meet the diverse (different)
needs of people at RISK for mental health challenges
Service Providers
General Public10.0
40.5
24.4
12.3
4.6
8.3
3.0
29.5
25.6
18.8
12.510.6
0.0
5.0
10.0
15.0
20.0
25.0
30.0
35.0
40.0
45.0
StronglyAgree
Agree NeitherAgree
norDisagree
Disagree StronglyDisagree
Don'tKnow
Pe
rce
nta
ge
Figure D11 - Mental Health - People receiving services and supports are able to set their own goals
Service Providers
General Public
8.7
47.4
20.8
8.9
4.6
9.7
2.6
30.8
23.1
18.2
13.711.6
0.0
5.0
10.0
15.0
20.0
25.0
30.0
35.0
40.0
45.0
50.0
StronglyAgree
Agree NeitherAgree
norDisagree
Disagree StronglyDisagree
Don'tKnow
Pe
rce
nta
ge
Figure D10 - Mental Health - Service providers (such as counselors) are able to explain the reasons for the practices
they follow or recommend
Service Providers
General Public
2.6
21.1
17.0
33.7
22.2
3.41.3
13.3 13.0
30.8
38.3
3.2
0.0
5.0
10.0
15.0
20.0
25.0
30.0
35.0
40.0
45.0
StronglyAgree
Agree NeitherAgree
norDisagree
Disagree StronglyDisagree
Don'tKnow
Pe
rce
nta
geFigure D9 - Mental Health - Out of the available services and
supports, people are able to choose from a range of approaches (such as different kinds of counseling or self-help)
to help address their mental health-related challenges
Service Providers
General Public

30
3.1
25.5
22.3
27.9
16.8
4.31.7
12.6
15.8
30.332.4
7.2
0.0
5.0
10.0
15.0
20.0
25.0
30.0
35.0
StronglyAgree
Agree NeitherAgree
norDisagree
Disagree StronglyDisagree
Don'tKnow
Pe
rce
nta
ge
Figure D16 - Mental Health - The agencies or programs that provide different types of mental health services work well
together to help people access the services they need/ want at any given point in time
Service Providers
General Public5.4
39.3
23.4
17.4
8.95.5
3.0
23.4 23.2 22.6
18.2
9.7
0.0
5.0
10.0
15.0
20.0
25.0
30.0
35.0
40.0
45.0
StronglyAgree
Agree NeitherAgree
norDisagree
Disagree StronglyDisagree
Don'tKnow
Pe
rce
nta
ge
Figure D15 - Mental Health - Service providers (such as counselors) are well-informed about the different types of
services and supports offered in your region
Service Providers
General Public
1.1
10.314.5
37.9
31.0
5.11.2
6.39.9
27.7
48.6
6.3
0.0
10.0
20.0
30.0
40.0
50.0
60.0
StronglyAgree
Agree NeitherAgree
norDisagree
Disagree StronglyDisagree
Don'tKnow
Pe
rce
nta
ge
Figure D14 - Mental Health - There is a wide range of services and supports to meet the diverse (different) needs of people (such as families or other loved ones) who are AFFECTED by
someone else’s mental health challenges
Service Providers
General Public
2.4
19.0
15.1
34.9
27.5
1.21.3
9.3 9.7
30.1
46.3
3.3
0.0
5.0
10.0
15.0
20.0
25.0
30.0
35.0
40.0
45.0
50.0
StronglyAgree
Agree NeitherAgree
norDisagree
Disagree StronglyDisagree
Don'tKnow
Pe
rce
nta
geFigure D13 - Mental Health - There is a wide range of mental health services and supports to meet the diverse (different)
needs of people EXPERIENCING mental health challenges
Service Providers
General Public
31
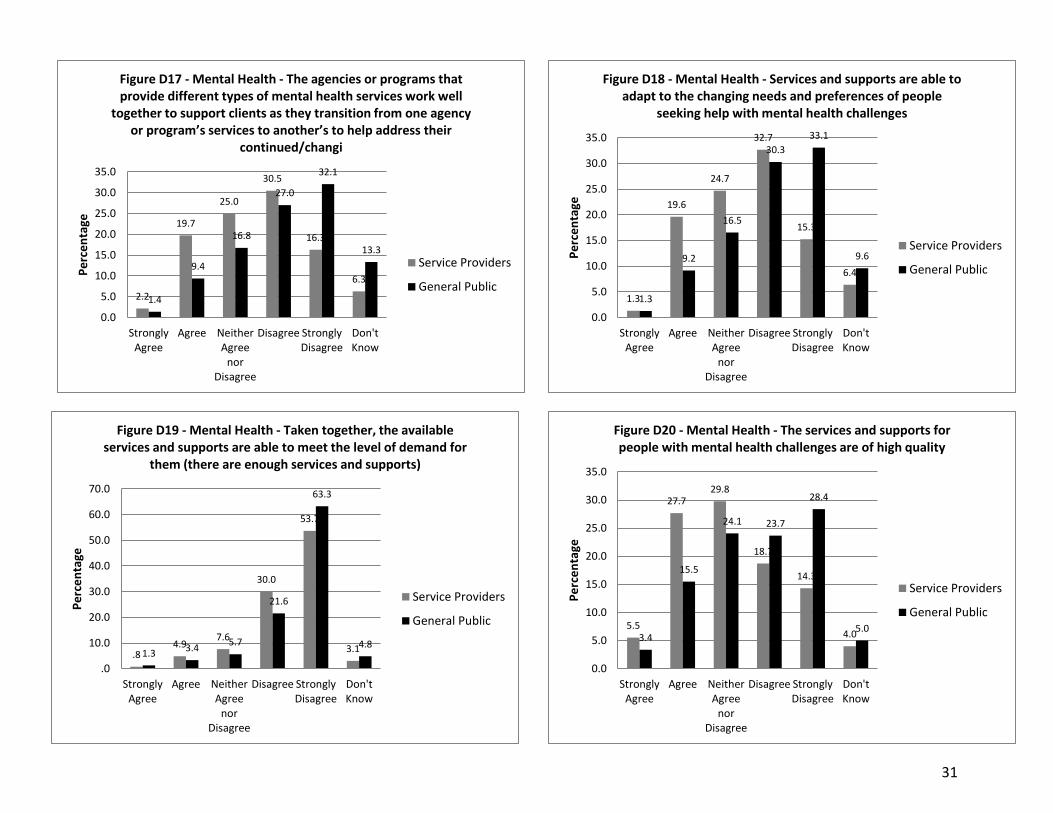
5.5
27.729.8
18.7
14.3
4.03.4
15.5
24.1 23.7
28.4
5.0
0.0
5.0
10.0
15.0
20.0
25.0
30.0
35.0
StronglyAgree
Agree NeitherAgree
norDisagree
Disagree StronglyDisagree
Don'tKnow
Pe
rce
nta
ge
Figure D20 - Mental Health - The services and supports for people with mental health challenges are of high quality
Service Providers
General Public
.84.9
7.6
30.0
53.7
3.11.33.4
5.7
21.6
63.3
4.8
.0
10.0
20.0
30.0
40.0
50.0
60.0
70.0
StronglyAgree
Agree NeitherAgree
norDisagree
Disagree StronglyDisagree
Don'tKnow
Pe
rce
nta
ge
Figure D19 - Mental Health - Taken together, the available services and supports are able to meet the level of demand for
them (there are enough services and supports)
Service Providers
General Public
1.3
19.6
24.7
32.7
15.3
6.4
1.3
9.2
16.5
30.3
33.1
9.6
0.0
5.0
10.0
15.0
20.0
25.0
30.0
35.0
StronglyAgree
Agree NeitherAgree
norDisagree
Disagree StronglyDisagree
Don'tKnow
Pe
rce
nta
ge
Figure D18 - Mental Health - Services and supports are able to adapt to the changing needs and preferences of people
seeking help with mental health challenges
Service Providers
General Public
2.2
19.7
25.0
30.5
16.3
6.3
1.4
9.4
16.8
27.0
32.1
13.3
0.0
5.0
10.0
15.0
20.0
25.0
30.0
35.0
StronglyAgree
Agree NeitherAgree
norDisagree
Disagree StronglyDisagree
Don'tKnow
Pe
rce
nta
geFigure D17 - Mental Health - The agencies or programs that provide different types of mental health services work well
together to support clients as they transition from one agency or program’s services to another’s to help address their
continued/changi
Service Providers
General Public

32
1.2
15.0 16.4
34.0
30.2
3.21.8
13.311.5
26.3
41.6
5.5
0.0
5.0
10.0
15.0
20.0
25.0
30.0
35.0
40.0
45.0
StronglyAgree
Agree NeitherAgree
norDisagree
Disagree StronglyDisagree
Don'tKnow
Pe
rce
nta
ge
Figure D24 - Substance Use - People are able to access most services and supports in or near their home community
Service Providers
General Public
.86.5 7.3
35.1
46.1
4.11.7 3.7 6.2
24.2
59.4
4.9
.0
10.0
20.0
30.0
40.0
50.0
60.0
70.0
StronglyAgree
Agree NeitherAgree
norDisagree
Disagree StronglyDisagree
Don'tKnow
Pe
rce
nta
ge
Figure D23 - Substance Use - People are able to access the services and supports they seek without unnecessary delays or
long wait times
Service Providers
General Public
7.0
43.0
14.2
24.4
10.6
.84.8
29.7
13.4
28.8
21.0
2.3
0.05.0
10.015.020.025.030.035.040.045.050.0
StronglyAgree
Agree NeitherAgree
norDisagree
Disagree StronglyDisagree
Don'tKnow
Pe
rce
nta
ge
Figure D21 - Substance Use - Information about substance use/addiction services and supports is readily available and
accessible
Service Providers
General Public2.1
14.711.0
38.3
30.7
3.22.0
8.5 8.6
30.0
45.3
5.6
0.05.0
10.015.020.025.030.035.040.045.050.0
StronglyAgree
Agree NeitherAgree
norDisagree
Disagree StronglyDisagree
Don'tKnow
Pe
rce
nta
ge
Figure D22 - Substance Use - Regardless of the kind of services or supports (detox, treatment program, doctor’s office) people
start with, they are able to access other services or supports without too much difficulty
Service Providers
General Public
Figures D21 to D41 (B) Substance Use/Addiction Services
33
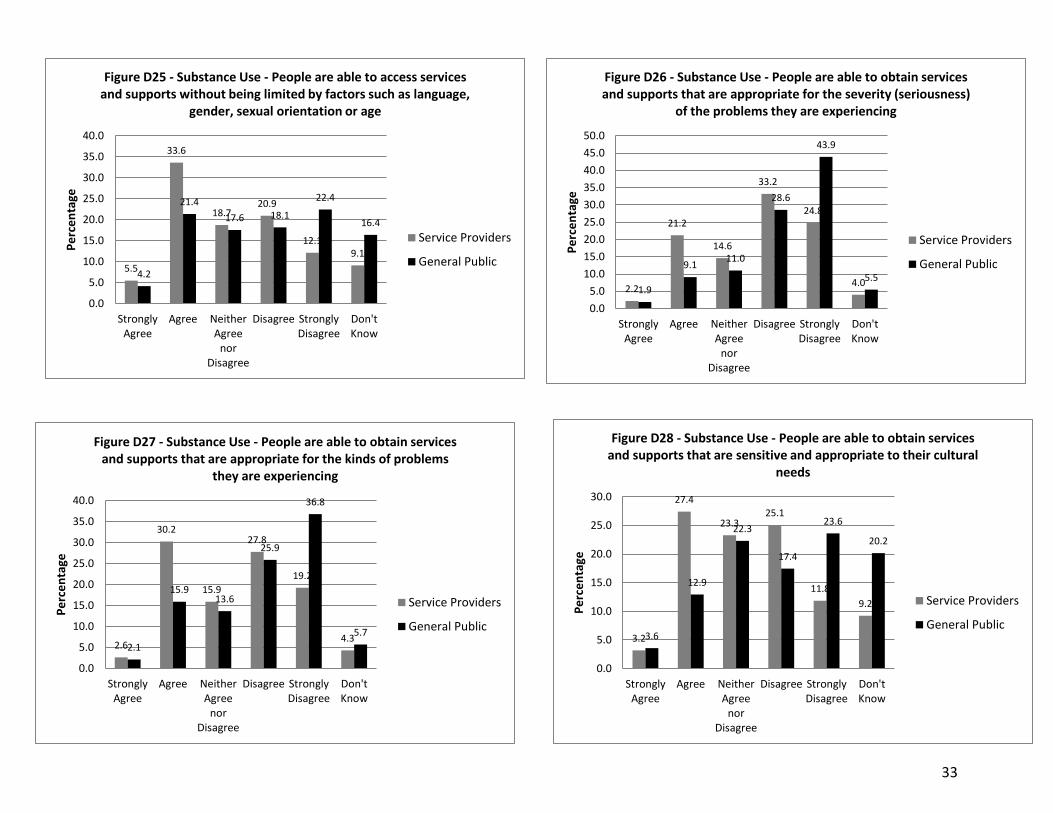
3.2
27.4
23.325.1
11.8
9.2
3.6
12.9
22.3
17.4
23.6
20.2
0.0
5.0
10.0
15.0
20.0
25.0
30.0
StronglyAgree
Agree NeitherAgree
norDisagree
Disagree StronglyDisagree
Don'tKnow
Pe
rce
nta
ge
Figure D28 - Substance Use - People are able to obtain services and supports that are sensitive and appropriate to their cultural
needs
Service Providers
General Public
2.2
21.2
14.6
33.2
24.8
4.01.9
9.111.0
28.6
43.9
5.5
0.0
5.0
10.0
15.0
20.0
25.0
30.0
35.0
40.0
45.0
50.0
StronglyAgree
Agree NeitherAgree
norDisagree
Disagree StronglyDisagree
Don'tKnow
Pe
rce
nta
ge
Figure D26 - Substance Use - People are able to obtain services and supports that are appropriate for the severity (seriousness)
of the problems they are experiencing
Service Providers
General Public
2.6
30.2
15.9
27.8
19.2
4.32.1
15.913.6
25.9
36.8
5.7
0.0
5.0
10.0
15.0
20.0
25.0
30.0
35.0
40.0
StronglyAgree
Agree NeitherAgree
norDisagree
Disagree StronglyDisagree
Don'tKnow
Pe
rce
nta
ge
Figure D27 - Substance Use - People are able to obtain services and supports that are appropriate for the kinds of problems
they are experiencing
Service Providers
General Public
5.5
33.6
18.720.9
12.19.1
4.2
21.4
17.6 18.1
22.4
16.4
0.0
5.0
10.0
15.0
20.0
25.0
30.0
35.0
40.0
StronglyAgree
Agree NeitherAgree
norDisagree
Disagree StronglyDisagree
Don'tKnow
Pe
rce
nta
geFigure D25 - Substance Use - People are able to access services
and supports without being limited by factors such as language, gender, sexual orientation or age
Service Providers
General Public
34
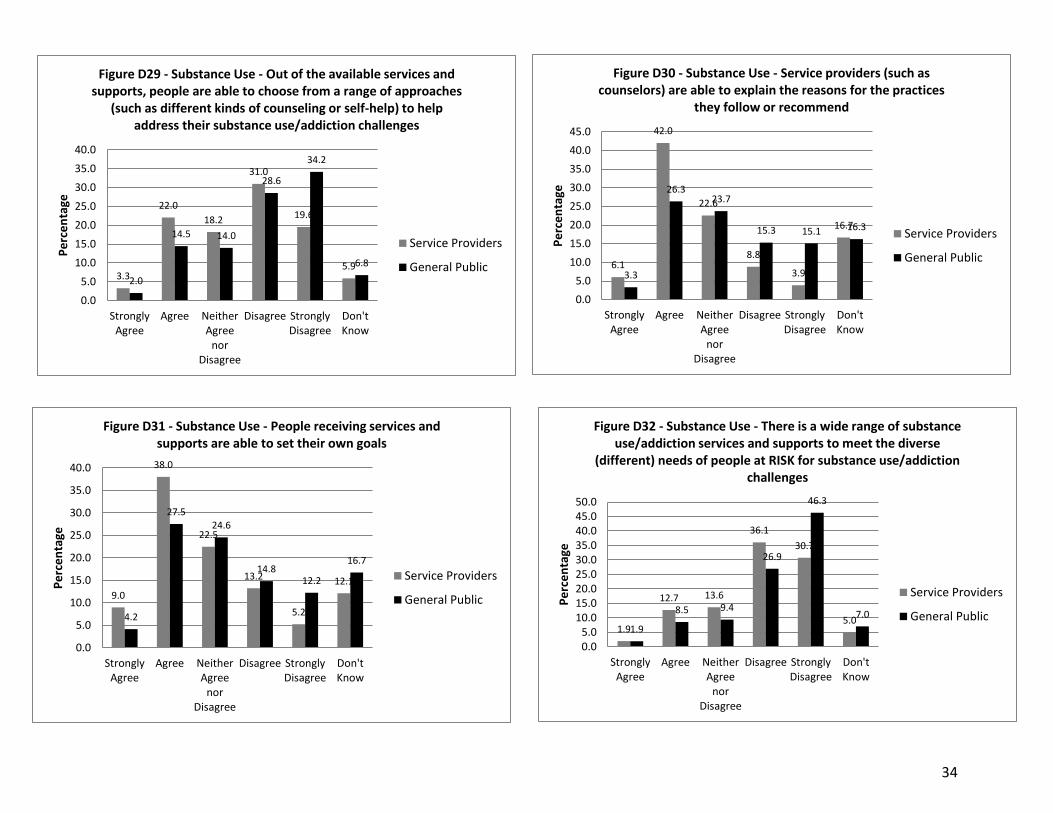
3.3
22.0
18.2
31.0
19.6
5.9
2.0
14.5 14.0
28.6
34.2
6.8
0.0
5.0
10.0
15.0
20.0
25.0
30.0
35.0
40.0
StronglyAgree
Agree NeitherAgree
norDisagree
Disagree StronglyDisagree
Don'tKnow
Pe
rce
nta
geFigure D29 - Substance Use - Out of the available services and
supports, people are able to choose from a range of approaches (such as different kinds of counseling or self-help) to help
address their substance use/addiction challenges
Service Providers
General Public 6.1
42.0
22.6
8.8
3.9
16.7
3.3
26.323.7
15.3 15.1 16.3
0.0
5.0
10.0
15.0
20.0
25.0
30.0
35.0
40.0
45.0
StronglyAgree
Agree NeitherAgree
norDisagree
Disagree StronglyDisagree
Don'tKnow
Pe
rce
nta
ge
Figure D30 - Substance Use - Service providers (such as counselors) are able to explain the reasons for the practices
they follow or recommend
Service Providers
General Public
9.0
38.0
22.5
13.2
5.2
12.1
4.2
27.524.6
14.812.2
16.7
0.0
5.0
10.0
15.0
20.0
25.0
30.0
35.0
40.0
StronglyAgree
Agree NeitherAgree
norDisagree
Disagree StronglyDisagree
Don'tKnow
Pe
rce
nta
ge
Figure D31 - Substance Use - People receiving services and supports are able to set their own goals
Service Providers
General Public
1.9
12.7 13.6
36.1
30.7
5.01.9
8.5 9.4
26.9
46.3
7.0
0.05.0
10.015.020.025.030.035.040.045.050.0
StronglyAgree
Agree NeitherAgree
norDisagree
Disagree StronglyDisagree
Don'tKnow
Pe
rce
nta
ge
Figure D32 - Substance Use - There is a wide range of substance use/addiction services and supports to meet the diverse
(different) needs of people at RISK for substance use/addiction challenges
Service Providers
General Public

35
2.2
18.0
12.8
31.8 32.2
2.92.0
8.7 8.8
26.1
48.5
5.9
0.0
10.0
20.0
30.0
40.0
50.0
60.0
StronglyAgree
Agree NeitherAgree
norDisagree
Disagree StronglyDisagree
Don'tKnow
Pe
rce
nta
geFigure D33 - Substance Use - There is a wide range of services and supports to meet the diverse (different) needs of people
EXPERIENCING substance use/addiction challenges
Service Providers
General Public
1.7
16.0 15.0
33.3
28.0
6.1
2.3
10.7 11.6
27.0
42.5
5.9
0.0
5.0
10.0
15.0
20.0
25.0
30.0
35.0
40.0
45.0
StronglyAgree
Agree NeitherAgree norDisagree
Disagree StronglyDisagree
Don'tKnow
Pe
rce
nta
ge
Figure D34 - Substance Use - There is a wide range of services and supports to meet the diverse (different) needs of people
(such as families, other loved ones) who are AFFECTED by someone else’s substance use/addiction challenges
Service Providers
General Public
5.8
36.4
21.119.7
8.4 8.7
3.3
24.422.8
18.3 19.0
12.2
0.0
5.0
10.0
15.0
20.0
25.0
30.0
35.0
40.0
StronglyAgree
Agree NeitherAgree
norDisagree
Disagree StronglyDisagree
Don'tKnow
Pe
rce
nta
ge
Figure D35 - Substance Use - Service providers (such as counselors, intake workers) are well informed about other
services and supports offered in the region
Service Providers
General Public4.1
22.925.5
23.7
15.0
8.8
2.1
13.8
17.6
24.8
30.2
11.5
0.0
5.0
10.0
15.0
20.0
25.0
30.0
35.0
StronglyAgree
Agree NeitherAgree
norDisagree
Disagree StronglyDisagree
Don'tKnow
Pe
rce
nta
ge
Figure D36 - Substance Use - The agencies or programs that provide different types of substance use/addiction services work well together to help people access the services they
need/ want at any given point in time
Service Providers
General Public

36
2.9
19.822.9
28.1
16.3
10.1
2.1
11.5
17.9
25.128.7
14.6
0.0
5.0
10.0
15.0
20.0
25.0
30.0
35.0
StronglyAgree
Agree NeitherAgree
norDisagree
Disagree StronglyDisagree
Don'tKnow
Pe
rce
nta
geFigure D37 - Substance Use - The agencies or programs that provide different types of substance use/addiction services
work well together to support clients as they transition from one agency or program’s services to another’s to help address
their contin
Service Providers
General Public 1.8
17.4
23.6
30.3
17.4
9.6
1.8
9.4
19.1
25.4
31.1
13.3
0.0
5.0
10.0
15.0
20.0
25.0
30.0
35.0
StronglyAgree
Agree NeitherAgree
norDisagree
Disagree StronglyDisagree
Don'tKnow
Pe
rce
nta
ge
Figure D38 - Substance Use - Services and supports are able to adapt to the changing needs and preferences of people seeking
help with substance use/addiction challenges
Service Providers
General Public
.66.1 8.0
30.6
50.3
4.51.7
5.3 7.5
18.7
59.8
7.0
.0
10.0
20.0
30.0
40.0
50.0
60.0
70.0
StronglyAgree
Agree NeitherAgree
norDisagree
Disagree StronglyDisagree
Don'tKnow
Pe
rce
nta
ge
Figure D39 - Substance Use - Taken together, the available services and supports are able to meet the level of demand for
them (there are enough services and supports)
Service Providers
General Public2.6
24.727.0
20.0
15.2
10.6
4.3
13.6
21.220.0
30.1
10.7
0.0
5.0
10.0
15.0
20.0
25.0
30.0
35.0
StronglyAgree
Agree NeitherAgree
norDisagree
Disagree StronglyDisagree
Don'tKnow
Pe
rce
nta
ge
Figure D40 - Substance Use - The services and supports for people with substance use/addiction challenges are of high
quality
Service Providers
General Public
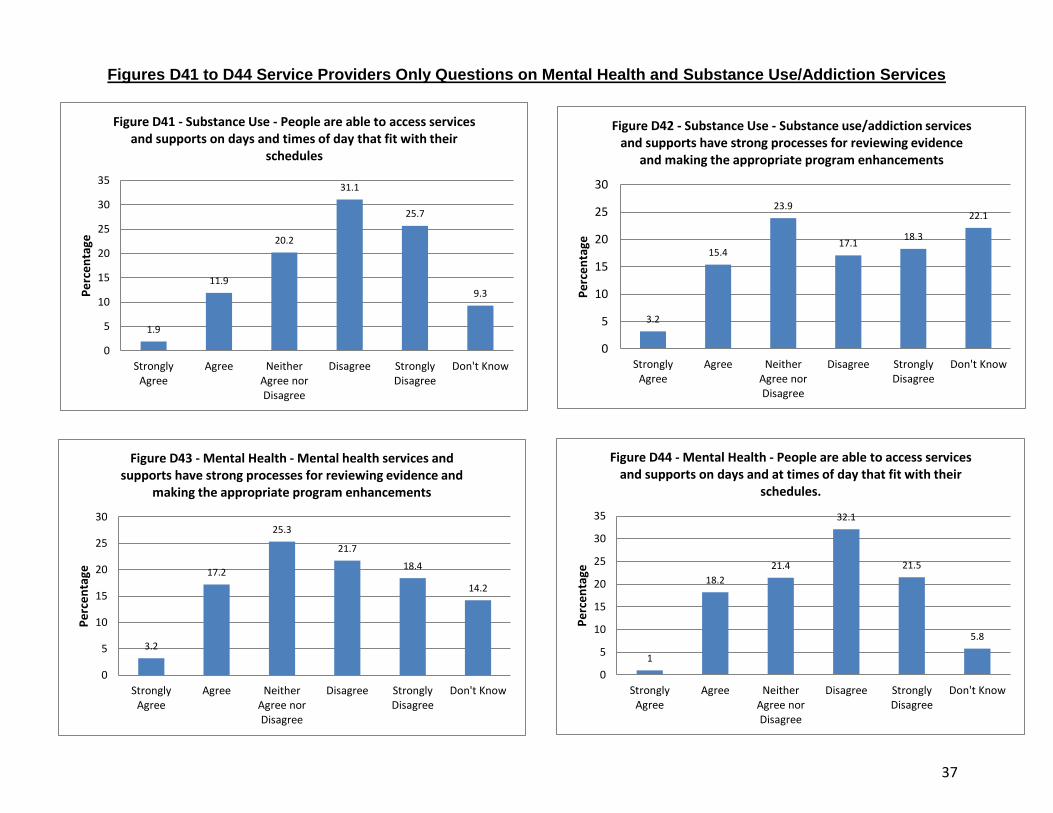
37
3.2
15.4
23.9
17.118.3
22.1
0
5
10
15
20
25
30
StronglyAgree
Agree NeitherAgree norDisagree
Disagree StronglyDisagree
Don't Know
Pe
rce
nta
ge
Figure D42 - Substance Use - Substance use/addiction services and supports have strong processes for reviewing evidence
and making the appropriate program enhancements
1.9
11.9
20.2
31.1
25.7
9.3
0
5
10
15
20
25
30
35
StronglyAgree
Agree NeitherAgree norDisagree
Disagree StronglyDisagree
Don't Know
Pe
rce
nta
ge
Figure D41 - Substance Use - People are able to access services and supports on days and times of day that fit with their
schedules
3.2
17.2
25.3
21.7
18.4
14.2
0
5
10
15
20
25
30
StronglyAgree
Agree NeitherAgree norDisagree
Disagree StronglyDisagree
Don't Know
Pe
rce
nta
ge
Figure D43 - Mental Health - Mental health services and supports have strong processes for reviewing evidence and
making the appropriate program enhancements
1
18.2
21.4
32.1
21.5
5.8
0
5
10
15
20
25
30
35
StronglyAgree
Agree NeitherAgree norDisagree
Disagree StronglyDisagree
Don't Know
Pe
rce
nta
ge
Figure D44 - Mental Health - People are able to access services and supports on days and at times of day that fit with their
schedules.
Figures D41 to D44 Service Providers Only Questions on Mental Health and Substance Use/Addiction Services

38
Appendix E: Comparing Responses concerning Mental Health or
Substance Use/Addiction Services among (A) Service Providers and (B)
the General Public
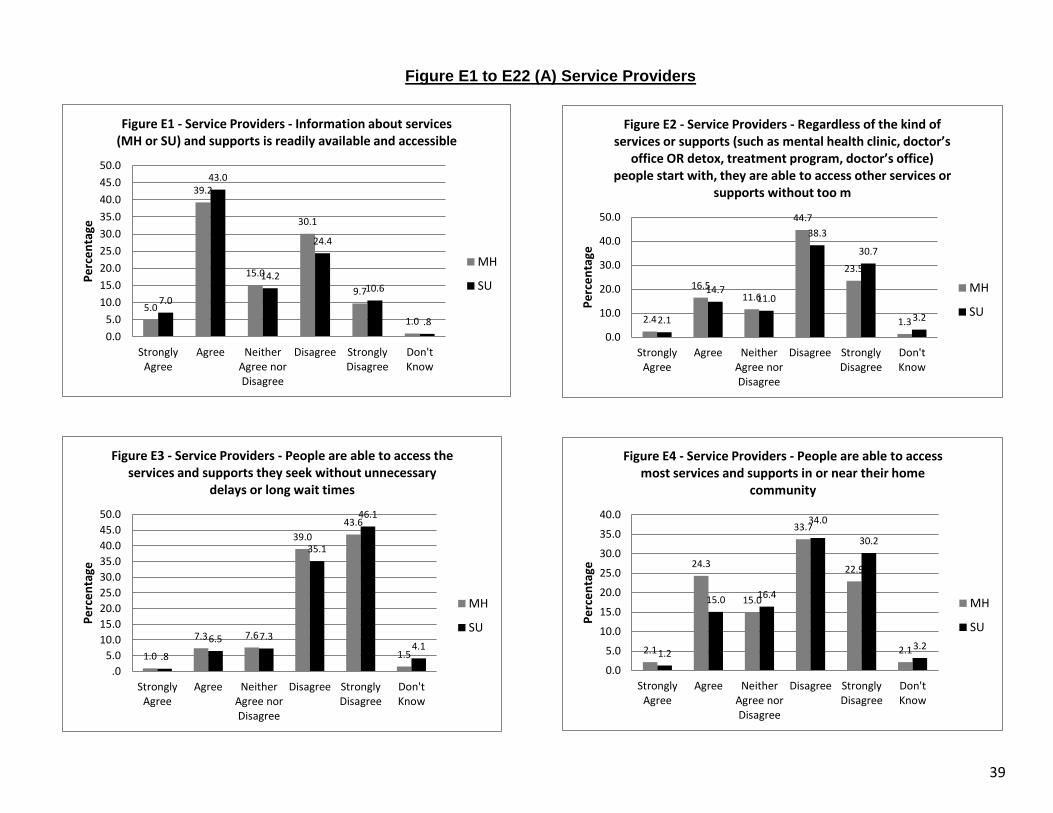
39
2.4
16.511.6
44.7
23.5
1.32.1
14.711.0
38.3
30.7
3.2
0.0
10.0
20.0
30.0
40.0
50.0
StronglyAgree
Agree NeitherAgree norDisagree
Disagree StronglyDisagree
Don'tKnow
Pe
rce
nta
ge
Figure E2 - Service Providers - Regardless of the kind of services or supports (such as mental health clinic, doctor’s
office OR detox, treatment program, doctor’s office) people start with, they are able to access other services or
supports without too m
MH
SU
1.0
7.3 7.6
39.0
43.6
1.5.8
6.5 7.3
35.1
46.1
4.1
.0
5.0
10.0
15.0
20.0
25.0
30.0
35.0
40.0
45.0
50.0
StronglyAgree
Agree NeitherAgree norDisagree
Disagree StronglyDisagree
Don'tKnow
Pe
rce
nta
ge
Figure E3 - Service Providers - People are able to access the services and supports they seek without unnecessary
delays or long wait times
MH
SU
2.1
24.3
15.0
33.7
22.9
2.11.2
15.0 16.4
34.0
30.2
3.2
0.0
5.0
10.0
15.0
20.0
25.0
30.0
35.0
40.0
StronglyAgree
Agree NeitherAgree norDisagree
Disagree StronglyDisagree
Don'tKnow
Pe
rce
nta
ge
Figure E4 - Service Providers - People are able to access most services and supports in or near their home
community
MH
SU
5.0
39.2
15.0
30.1
9.7
1.0
7.0
43.0
14.2
24.4
10.6
.8
0.0
5.0
10.0
15.0
20.0
25.0
30.0
35.0
40.0
45.0
50.0
StronglyAgree
Agree NeitherAgree norDisagree
Disagree StronglyDisagree
Don'tKnow
Pe
rce
nta
ge
Figure E1 - Service Providers - Information about services (MH or SU) and supports is readily available and accessible
MH
SU
Figure E1 to E22 (A) Service Providers

40
5.5
38.9
19.221.3
10.6
4.55.5
33.6
18.720.9
12.19.1
0.0
5.0
10.0
15.0
20.0
25.0
30.0
35.0
40.0
45.0
StronglyAgree
Agree NeitherAgree
norDisagree
Disagree StronglyDisagree
Don'tKnow
Pe
rce
nta
ge
Figure E5 - Service Providers - People are able to access services and supports without being limited by factors
such as language, gender, sexual orientation or age
MH
SU
4.4
36.6
16.5
26.8
13.5
2.12.6
30.2
15.9
27.8
19.2
4.3
0.0
5.0
10.0
15.0
20.0
25.0
30.0
35.0
40.0
StronglyAgree
Agree NeitherAgree norDisagree
Disagree StronglyDisagree
Don'tKnow
Pe
rce
nta
ge
Figure E6 - Service Providers - People are able to obtain services and supports that are appropriate for the kinds of
problems they are experiencing
MH
SU
3.0
24.4
17.0
33.6
20.3
1.62.2
21.2
14.6
33.2
24.8
4.0
0.0
5.0
10.0
15.0
20.0
25.0
30.0
35.0
40.0
StronglyAgree
Agree NeitherAgree
norDisagree
Disagree StronglyDisagree
Don'tKnow
Pe
rce
nta
ge
Figure E7 - Service Providers - People are able to obtain services and supports that are appropriate for the
severity (seriousness) of the problems they are experiencing
MH
SU
2.8
25.526.8
25.7
12.9
6.4
3.2
27.4
23.325.1
11.8
9.2
0.0
5.0
10.0
15.0
20.0
25.0
30.0
StronglyAgree
Agree NeitherAgree norDisagree
Disagree StronglyDisagree
Don'tKnow
Pe
rce
nta
ge
Figure E8 - Service Providers - People are able to obtain services and supports that are sensitive and appropriate to
their cultural needs
MH
SU
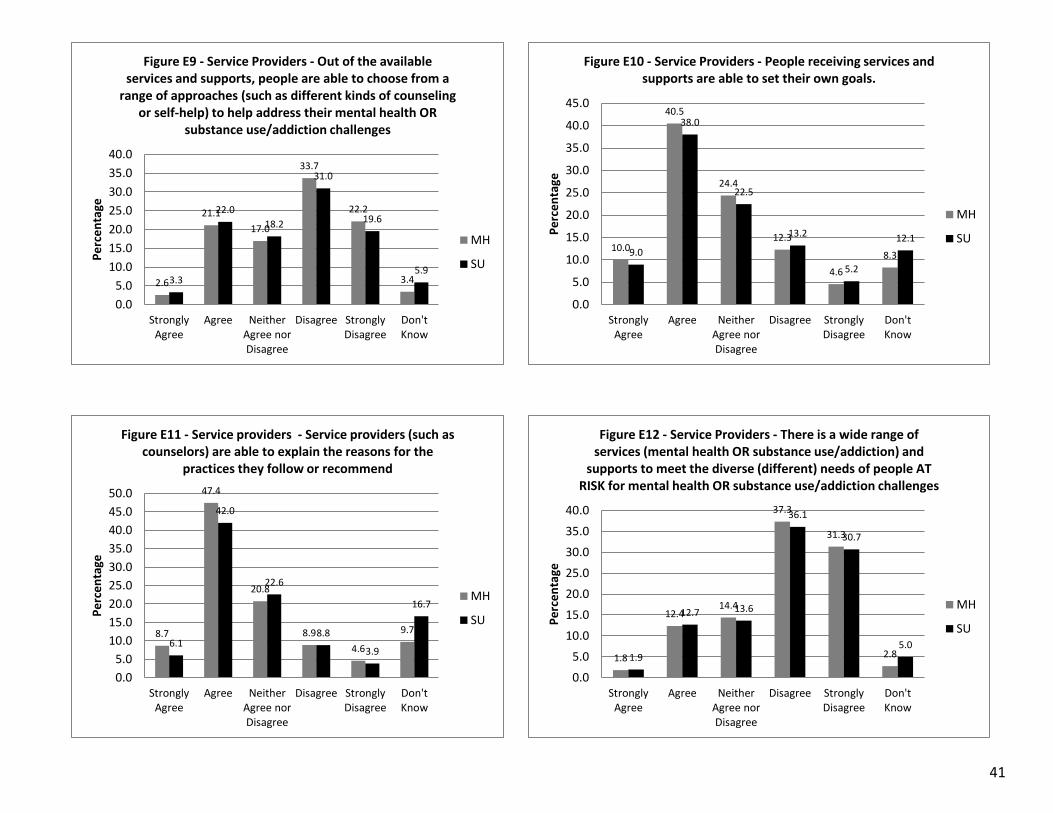
41
2.6
21.1
17.0
33.7
22.2
3.43.3
22.0
18.2
31.0
19.6
5.9
0.0
5.0
10.0
15.0
20.0
25.0
30.0
35.0
40.0
StronglyAgree
Agree NeitherAgree norDisagree
Disagree StronglyDisagree
Don'tKnow
Pe
rce
nta
ge
Figure E9 - Service Providers - Out of the available services and supports, people are able to choose from a
range of approaches (such as different kinds of counseling or self-help) to help address their mental health OR
substance use/addiction challenges
MH
SU
8.7
47.4
20.8
8.9
4.6
9.7
6.1
42.0
22.6
8.8
3.9
16.7
0.0
5.0
10.0
15.0
20.0
25.0
30.0
35.0
40.0
45.0
50.0
StronglyAgree
Agree NeitherAgree norDisagree
Disagree StronglyDisagree
Don'tKnow
Pe
rce
nta
ge
Figure E11 - Service providers - Service providers (such as counselors) are able to explain the reasons for the
practices they follow or recommend
MH
SU
10.0
40.5
24.4
12.3
4.6
8.39.0
38.0
22.5
13.2
5.2
12.1
0.0
5.0
10.0
15.0
20.0
25.0
30.0
35.0
40.0
45.0
StronglyAgree
Agree NeitherAgree norDisagree
Disagree StronglyDisagree
Don'tKnow
Pe
rce
nta
ge
Figure E10 - Service Providers - People receiving services and supports are able to set their own goals.
MH
SU
1.8
12.414.4
37.3
31.3
2.81.9
12.7 13.6
36.1
30.7
5.0
0.0
5.0
10.0
15.0
20.0
25.0
30.0
35.0
40.0
StronglyAgree
Agree NeitherAgree norDisagree
Disagree StronglyDisagree
Don'tKnow
Pe
rce
nta
ge
Figure E12 - Service Providers - There is a wide range of services (mental health OR substance use/addiction) and
supports to meet the diverse (different) needs of people AT RISK for mental health OR substance use/addiction challenges
MH
SU

42
2.4
19.0
15.1
34.9
27.5
1.22.2
18.0
12.8
31.8 32.2
2.9
0.0
5.0
10.0
15.0
20.0
25.0
30.0
35.0
40.0
StronglyAgree
Agree NeitherAgree norDisagree
Disagree StronglyDisagree
Don'tKnow
Pe
rce
nta
ge
Figure E13 - Service Provider - There is a wide range of services and supports to meet the diverse (different)
needs of people EXPERIENCING mental health OR substance use/addiction challenges
MH
SU
1.1
10.3
14.5
37.9
31.0
5.1
1.7
16.0 15.0
33.3
28.0
6.1
0.0
5.0
10.0
15.0
20.0
25.0
30.0
35.0
40.0
StronglyAgree
Agree NeitherAgree norDisagree
Disagree StronglyDisagree
Don'tKnow
Pe
rce
nta
ge
Figure E14 - Service Providers - There is a wide range of services and supports to meet the diverse (different) needs of people (such as families, other loved ones) who are AFFECTED by someone else’s mental health OR substance use/addiction
challenges
MH
SU
5.4
39.3
23.4
17.4
8.9
5.55.8
36.4
21.119.7
8.4 8.7
0.0
5.0
10.0
15.0
20.0
25.0
30.0
35.0
40.0
45.0
StronglyAgree
Agree NeitherAgree norDisagree
Disagree StronglyDisagree
Don'tKnow
Pe
rce
nta
ge
Figure E15 - Service Providers - Service providers (such as counselors, intake workers) are well informed about other
services and supports offered in the region.
MH
SU
3.1
25.5
22.3
27.9
16.8
4.34.1
22.9
25.523.7
15.0
8.8
0.0
5.0
10.0
15.0
20.0
25.0
30.0
StronglyAgree
Agree NeitherAgree norDisagree
Disagree StronglyDisagree
Don'tKnow
Pe
rce
nta
ge
Figure E16 - Service Providers - The agencies or programs that provide different types of mental health OR substance
use/addiction services work well together to help people access the services they need/ want at any given point in time
MH
SU

43
2.2
19.7
25.0
30.5
16.3
6.32.9
19.822.9
28.1
16.3
10.1
0.0
5.0
10.0
15.0
20.0
25.0
30.0
35.0
StronglyAgree
Agree NeitherAgree norDisagree
Disagree StronglyDisagree
Don'tKnow
Pe
rce
nta
ge
Figure E17 - Service Providers - The agencies or programs that provide different types of mental health OR substance
use/addiction services work well together to support clients as they transition from one agency or program’s
services to another’s to help
MH
SU1.3
19.6
24.7
32.7
15.3
6.4
1.8
17.4
23.6
30.3
17.4
9.6
0.0
5.0
10.0
15.0
20.0
25.0
30.0
35.0
StronglyAgree
Agree NeitherAgree norDisagree
Disagree StronglyDisagree
Don'tKnow
Pe
rce
nta
ge
Figure E18 - Service Providers - Services and supports are able to adapt to the changing needs and preferences of people seeking help with mental health OR substance
use/addiction challenges
MH
SU
.84.9
7.6
30.0
53.7
3.1.6
6.18.0
30.6
50.3
4.5
.0
10.0
20.0
30.0
40.0
50.0
60.0
StronglyAgree
Agree NeitherAgree norDisagree
Disagree StronglyDisagree
Don'tKnow
Pe
rce
nta
ge
Figure E19 - Service Providers - Taken together, the available services and supports are able to meet the level
of demand for them (there are enough services and supports)
MH
SU
5.5
27.729.8
18.7
14.3
4.02.6
24.7
27.0
20.0
15.2
10.6
0.0
5.0
10.0
15.0
20.0
25.0
30.0
35.0
StronglyAgree
Agree NeitherAgree norDisagree
Disagree StronglyDisagree
Don'tKnow
Pe
rce
nta
ge
Figure E20 - Service Providers - The services and supports for people with mental health OR substance use/addiction
challenges are of high quality
MH
SU

44
1
18.2
21.4
32.1
21.5
5.8
1.9
11.9
20.2
31.1
25.7
9.3
0
5
10
15
20
25
30
35
StronglyAgree
Agree NeitherAgree norDisagree
Disagree StronglyDisagree
Don'tKnow
Pe
rce
nta
ge
Figure E22* - Service Providers - People are able to access services and supports on days and times of day that fit
with their schedules
MH
SU
3.2
17.2
25.3
21.7
18.4
14.2
3.2
15.4
23.9
17.118.3
22.1
0
5
10
15
20
25
30
StronglyAgree
Agree NeitherAgree norDisagree
Disagree StronglyDisagree
Don'tKnow
Pe
rce
nta
geFigure E21* - Service Providers - Mental health OR
substance use/addiction services and supports have strong processes for reviewing evidence and making the
appropriate program enhancements
MH
SU
*Figures E21 and E22 record responses for questions that were asked only to service providers

45
2.9
20.4
12.0
38.2
26.0
.5
4.8
29.7
13.4
28.8
21.0
2.3
0.0
5.0
10.0
15.0
20.0
25.0
30.0
35.0
40.0
45.0
StronglyAgree
Agree NeitherAgree norDisagree
Disagree StronglyDisagree
Don'tKnow
Pe
rce
nta
geFigure E23 - General Public - Information about mental
health OR substance use/addiction services and supports is readily available and accessible
MH
SU
1.3
9.6 7.6
33.9
46.6
1.02.0
8.5 8.6
30.0
45.3
5.6
0.05.0
10.015.020.025.030.035.040.045.050.0
StronglyAgree
Agree NeitherAgree norDisagree
Disagree StronglyDisagree
Don'tKnow
Pe
rce
nta
ge
Figure E24 - General Public - Regardless of the kind of services or supports (such as mental health clinic, detox,
treatment program, doctor’s office) people start with, they are able to access other services or supports without
too much difficulty
MH
SU
1.14.3 5.5
26.5
60.8
1.81.7 3.76.2
24.2
59.4
4.9
0.0
10.0
20.0
30.0
40.0
50.0
60.0
70.0
StronglyAgree
Agree NeitherAgree norDisagree
Disagree StronglyDisagree
Don'tKnow
Pe
rce
nta
ge
Figure E25 - General Public - People are able to access the services and supports they seek without unnecessary
delays or long wait times
MH
SU
1.5
15.3 14.5
27.6
37.1
3.91.8
13.311.5
26.3
41.6
5.5
0.0
5.0
10.0
15.0
20.0
25.0
30.0
35.0
40.0
45.0
StronglyAgree
Agree NeitherAgree norDisagree
Disagree StronglyDisagree
Don'tKnow
Pe
rce
nta
ge
Figure E26 - General Public - People are able to access most services and supports in or near their home community
MH
SU
Figure E23 to E42 (B) General Public

46
4.0
26.0
18.3 19.0 18.9
13.8
4.2
21.4
17.6 18.1
22.4
16.4
0.0
5.0
10.0
15.0
20.0
25.0
30.0
StronglyAgree
Agree NeitherAgree norDisagree
Disagree StronglyDisagree
Don'tKnow
Pe
rce
nta
ge
Figure E27 - General Public - People are able to access services and supports without being limited by factors such
as language, gender, sexual orientation or age
MH
SU
1.6
19.2
12.4
31.8 32.7
2.42.1
15.913.6
25.9
36.8
5.7
0.0
5.0
10.0
15.0
20.0
25.0
30.0
35.0
40.0
StronglyAgree
Agree NeitherAgree norDisagree
Disagree StronglyDisagree
Don'tKnow
Pe
rce
nta
ge
Figure E28 - General Public - People are able to obtain services and supports that are appropriate for the kinds of problems they are experiencing (such as mood or anxiety
related challenges)
MH
SU
1.6
12.0 11.5
30.7
41.4
2.81.9
9.111.0
28.6
43.9
5.5
0.0
5.0
10.0
15.0
20.0
25.0
30.0
35.0
40.0
45.0
50.0
StronglyAgree
Agree NeitherAgree norDisagree
Disagree StronglyDisagree
Don'tKnow
Pe
rce
nta
ge
Figure E29 - General Public - People are able to obtain services and supports that are appropriate for the severity
(seriousness) of the problems they are experiencing
MH
SU
2.2
13.5
23.2
20.018.7
22.5
3.6
12.9
22.3
17.4
23.6
20.2
0.0
5.0
10.0
15.0
20.0
25.0
StronglyAgree
Agree NeitherAgree norDisagree
Disagree StronglyDisagree
Don'tKnow
Pe
rce
nta
ge
Figure E30 - General Public - People are able to obtain services and supports that are sensitive and appropriate to
their cultural needs
MH
SU

47
1.3
13.3 13.0
30.8
38.3
3.22.0
14.5 14.0
28.6
34.2
6.8
0.0
5.0
10.0
15.0
20.0
25.0
30.0
35.0
40.0
45.0
StronglyAgree
Agree NeitherAgree norDisagree
Disagree StronglyDisagree
Don'tKnow
Pe
rce
nta
ge
Figure E31 - General Public - Out of the available services and supports, people are able to choose from a range of approaches (such as different kinds of counseling or self-help) to help address their mental health OR substance
use/addiction challenges
MH
SU
2.6
30.8
23.1
18.2
13.711.6
3.3
26.3
23.7
15.3 15.116.3
0.0
5.0
10.0
15.0
20.0
25.0
30.0
35.0
StronglyAgree
Agree NeitherAgree norDisagree
Disagree StronglyDisagree
Don'tKnow
Pe
rce
nta
ge
Figure E33 - General Public - Service providers (such as counselors) are able to explain the reasons for the practices
they follow or recommend
MH
SU
3.0
29.5
25.6
18.8
12.510.6
4.2
27.5
24.6
14.8
12.2
16.7
0.0
5.0
10.0
15.0
20.0
25.0
30.0
35.0
StronglyAgree
Agree NeitherAgree norDisagree
Disagree StronglyDisagree
Don'tKnow
Pe
rce
nta
ge
Figure E32 - General Public - People receiving services and supports are able to set their own goals
MH
SU
1.3
7.39.7
30.0
47.3
4.51.9
8.5 9.4
26.9
46.3
7.0
0.0
5.0
10.0
15.0
20.0
25.0
30.0
35.0
40.0
45.0
50.0
StronglyAgree
Agree NeitherAgree norDisagree
Disagree StronglyDisagree
Don'tKnow
Pe
rce
nta
ge
Figure E34 - General Public - There is a wide range of mental health OR substance use/addiction services and supports to
meet the diverse (different) needs of people at RISK for mental health OR substance use/addiction challenges
MH
SU

48
1.3
9.3 9.7
30.1
46.3
3.32.0
8.7 8.8
26.1
48.5
5.9
0.0
10.0
20.0
30.0
40.0
50.0
60.0
StronglyAgree
Agree NeitherAgree norDisagree
Disagree StronglyDisagree
Don'tKnow
Pe
rce
nta
ge
Figure E35 - General Public - There is a wide range of services and supports to meet the diverse (different) needs of people
EXPERIENCING mental health OR substance use/addiction challenges
MH
SU
1.26.3
9.9
27.7
48.6
6.32.3
10.7 11.6
27.0
42.5
5.9
0.0
10.0
20.0
30.0
40.0
50.0
60.0
StronglyAgree
Agree NeitherAgree norDisagree
Disagree StronglyDisagree
Don'tKnow
Pe
rce
nta
ge
Figure E36 - General Public - There is a wide range of services and supports to meet the diverse (different) needs of people
(such as families, other loved ones) who are AFFECTED by someone else’s mental health OR substance use/addiction
challenges
MH
SU
3.0
23.4 23.2 22.6
18.2
9.7
3.3
24.422.8
18.3 19.0
12.2
0.0
5.0
10.0
15.0
20.0
25.0
30.0
StronglyAgree
Agree NeitherAgree norDisagree
Disagree StronglyDisagree
Don'tKnow
Pe
rce
nta
ge
Figure E37 - General Public - Service providers (such as counselors, intake workers) are well informed about other
services and supports offered in the region
MH
SU
1.7
12.615.8
30.332.4
7.2
2.1
13.8
17.6
24.8
30.2
11.5
0.0
5.0
10.0
15.0
20.0
25.0
30.0
35.0
StronglyAgree
Agree NeitherAgree norDisagree
Disagree StronglyDisagree
Don'tKnow
Pe
rce
nta
ge
Figure E38 - General Public - The agencies or programs that provide different types of mental health OR substance
use/addiction services work well together to help people access the services they need/ want at any given point in
time
MH
SU

49
1.4
9.4
16.8
27.0
32.1
13.3
2.1
11.5
17.9
25.1
28.7
14.6
0.0
5.0
10.0
15.0
20.0
25.0
30.0
35.0
StronglyAgree
Agree NeitherAgree norDisagree
Disagree StronglyDisagree
Don'tKnow
Pe
rce
nta
ge
Figure E39 - General Public - The agencies or programs that provide different types of mental health OR substance use/addiction services work well together to support
clients as they transition from one agency or program’s services to another’s to help ad
MH
SU
1.3
9.2
16.5
30.3
33.1
9.6
1.8
9.4
19.1
25.4
31.1
13.3
0.0
5.0
10.0
15.0
20.0
25.0
30.0
35.0
StronglyAgree
Agree NeitherAgree norDisagree
Disagree StronglyDisagree
Don'tKnow
Pe
rce
nta
ge
Figure E40 - General Public - Services and supports are able to adapt to the changing needs and preferences of people
seeking help with mental health OR substance use/addiction challenges
MH
SU
1.33.4
5.7
21.6
63.3
4.81.7
5.37.5
18.7
59.8
7.0
0.0
10.0
20.0
30.0
40.0
50.0
60.0
70.0
StronglyAgree
Agree NeitherAgree norDisagree
Disagree StronglyDisagree
Don'tKnow
Pe
rce
nta
ge
Figure E41 - General Public - Taken together, the available services and supports are able to meet the level of
demand for them (there are enough services and supports)
MH
SU
3.4
15.5
24.1 23.7
28.4
5.04.3
13.6
21.220.0
30.1
10.7
0.0
5.0
10.0
15.0
20.0
25.0
30.0
35.0
StronglyAgree
Agree NeitherAgree norDisagree
Disagree StronglyDisagree
Don'tKnow
Pe
rce
nta
ge
Figure E42 - General Public - The services and supports for people with mental health OR substance use/addiction
challenges are of high quality
MH
SU

50
Appendix F: Comparing Responses concerning (A) Mental Health or (B)
Substance Use/Addiction Services among Service Providers with Different
Years of Working in the Field

51
16.2 17.9
65.8
12.9
23.3
63.5
.3
11.5
18.8
69.1
.6
0.0
10.0
20.0
30.0
40.0
50.0
60.0
70.0
80.0
Children andYouth (17
and Under)
Adults (18and over)
All AgeGroups
No answerprovided
Pe
rce
nt
Figure F1 - Mental Health - In responding to the questions do you have a particular age group in mind?
2 years or less
3 to 10 Years
11 years or more 3.4
38.5
19.7
29.9
6.02.63.0
40.8
14.2
33.2
8.1
.8
6.7
38.3
14.7
27.9
11.7
.7
0.0
5.0
10.0
15.0
20.0
25.0
30.0
35.0
40.0
45.0
StronglyAgree
Agree NeitherAgree
norDisagree
Disagree StronglyDisagree
Don'tKnow
Pe
rce
nta
ge
Figure F2 - Mental Health - Information about mental health services and supports is readily available and accessible
2 years or less
3 to 10 Years
11 years or more
Years' Experience
3.4
12.8 13.7
58.1
11.1
.91.0
15.910.6
45.6
25.1
1.83.2
17.711.9
41.1
25.1
1.1
0.0
10.0
20.0
30.0
40.0
50.0
60.0
70.0
StronglyAgree
Agree NeitherAgree
norDisagree
Disagree StronglyDisagree
Don'tKnow
Pe
rce
nta
ge
Figure F3 - Mental Health - Regardless of the kind of services or supports (such as mental health clinic, doctor’s office)
people start with, they are able to access other services or supports without too much difficulty
2 years or less
3 to 10 Years
11 years or more
Years' Experience
.9
6.0
15.4
41.9
34.2
1.7.8
6.69.1
34.4
47.3
1.81.1
8.24.8
41.6 42.9
1.3
.0
5.0
10.0
15.0
20.0
25.0
30.0
35.0
40.0
45.0
50.0
StronglyAgree
Agree NeitherAgree
norDisagree
Disagree StronglyDisagree
Don'tKnow
Pe
rce
nta
ge
Figure F4 - Mental Health - People are able to access the services and supports they seek without unnecessary delays
or long wait times
2 years or less
3 to 10 Years
11 years or more
Years' Experience
Figure F1 to F23 (A) Mental Health Questions
Years’ Experience

52
1.7
33.3
19.7
30.8
14.5
2.3
23.5
17.2
32.2
22.0
2.82.0
22.9
12.3
35.5
25.3
2.0
0.0
5.0
10.0
15.0
20.0
25.0
30.0
35.0
40.0
StronglyAgree
Agree NeitherAgree
norDisagree
Disagree StronglyDisagree
Don'tKnow
Pe
rce
nta
geFigure F5 - Mental Health - People are able to access most services and supports they require in or near their home
community
2 years or less
3 to 10 Years
11 years or more
Years' Experience
2.6
27.4
19.7
31.6
13.7
5.1
1.0
17.5
23.8
29.4
20.5
7.8
.6
16.7
20.1
34.2
24.0
4.5
0.0
5.0
10.0
15.0
20.0
25.0
30.0
35.0
40.0
StronglyAgree
Agree NeitherAgree
norDisagree
Disagree StronglyDisagree
Don'tKnow
Pe
rce
nta
ge
Figure F6* - Mental Health - People are able to access services and supports on days and at times of day that fit with their
schedules
2 years or less
3 to 10 Years
11 years or more
Years' Experience
10.3
47.0
17.1 16.2
5.1 4.35.8
37.7
17.5
22.0
11.6
5.34.3
37.9
21.0 21.9
11.0
3.9
0.0
5.0
10.0
15.0
20.0
25.0
30.0
35.0
40.0
45.0
50.0
StronglyAgree
Agree NeitherAgree norDisagree
Disagree StronglyDisagree
Don'tKnow
Pe
rce
nta
ge
Figure F7 - Mental Health - People are able to access services and supports without being limited by factors such as language,
gender, sexual orientation or age
2 years or less
3 to 10 Years
11 years or more
Years' Experience
4.3
49.6
16.2
22.2
6.01.7
3.6
35.4
17.3
28.2
11.7
3.85.0
34.8
16.0
26.8
16.5
.9
0.0
10.0
20.0
30.0
40.0
50.0
60.0
StronglyAgree
Agree NeitherAgree norDisagree
Disagree StronglyDisagree
Don'tKnow
Pe
rce
nta
ge
Figure F8 - Mental Health - People are able to obtain services and supports that are appropriate for the kinds of problems
they are experiencing (such as mood or anxiety related challenges)
2 years or less
3 to 10 Years
11 years or more
Years' Experience

53
3.4
31.6
21.4
31.6
11.1
.92.5
22.8
19.5
33.7
19.0
2.53.3
24.0
14.3
34.0
23.2
1.1
0.0
5.0
10.0
15.0
20.0
25.0
30.0
35.0
40.0
StronglyAgree
Agree NeitherAgree
norDisagree
Disagree StronglyDisagree
Don'tKnow
Pe
rce
nta
geFigure F9 - Mental Health - People are able to obtain services
and supports that are appropriate for the severity (seriousness) of the problems they are experiencing
2 years or less
3 to 10 Years
11 years or more
Years' Experience
6.0
31.6
26.5
23.1
8.5
4.32.8
26.825.3
23.8
12.9
8.4
2.0
23.2
27.9 27.7
13.8
5.4
0.0
5.0
10.0
15.0
20.0
25.0
30.0
35.0
StronglyAgree
Agree NeitherAgree
norDisagree
Disagree StronglyDisagree
Don'tKnow
Pe
rce
nta
ge
Figure F10 - Mental Health - People are able to obtain services and supports that are sensitive and appropriate to their
cultural needs
2 years or less
3 to 10 Years
11 years or more
Years' Experience
2.6
23.9
18.8
34.2
14.5
6.0
2.5
20.8
17.5
34.2
21.8
3.32.6
20.8
16.2
33.3
24.2
3.0
0.0
5.0
10.0
15.0
20.0
25.0
30.0
35.0
40.0
StronglyAgree
Agree NeitherAgree norDisagree
Disagree StronglyDisagree
Don'tKnow
Pe
rce
nta
ge
Figure F11 - Mental Health - Out of the available services and supports, people are able to choose from a range of approaches
(such as different kinds of counseling or self-help) to help address their mental health-related challenges
2 years or less
3 to 10 Years
11 years or more
Years' Experience
11.1
55.6
13.7
3.4 4.3
12.07.8
48.1
21.5
9.14.6
8.98.7
45.2
21.7
9.9
4.6
9.9
0.0
10.0
20.0
30.0
40.0
50.0
60.0
StronglyAgree
Agree NeitherAgree
norDisagree
Disagree StronglyDisagree
Don'tKnow
Pe
rce
nta
ge
Figure F12 - Mental Health - Service providers (such as counselors) are able to explain the reasons for the practices
they follow or recommend
2 years or less
3 to 10 Years
11 years or more
Years' Experience

54
10.3
52.1
18.8
9.4
.9
8.510.6
40.0
25.6
12.9
4.36.6
9.5
38.3
24.7
12.5
5.69.5
0.0
10.0
20.0
30.0
40.0
50.0
60.0
StronglyAgree
Agree NeitherAgree norDisagree
Disagree StronglyDisagree
Don'tKnow
Pe
rce
nta
geFigure F13 - Mental Health - People receiving services and
supports are able to set their own goals
2 years or less
3 to 10 Years
11 years or more
Years' Experience
1.7
18.8
13.7
33.3
29.1
3.42.0
9.4
16.5
36.7
31.1
4.31.7
13.2 13.0
38.7
32.0
1.5
0.0
5.0
10.0
15.0
20.0
25.0
30.0
35.0
40.0
45.0
StronglyAgree
Agree NeitherAgree
norDisagree
Disagree StronglyDisagree
Don'tKnow
Pe
rce
nta
ge
Figure F14 - Mental Health - There is a wide range of mental health services and supports to meet the diverse (different)
needs of people at RISK for mental health challenges
2 years or less
3 to 10 Years
11 years or more
Years' Experience
2.6
26.5
17.1
36.8
14.5
2.62.8
15.7 16.2
34.7
28.6
2.02.0
19.7
13.8
34.6
29.4
.4
0.0
5.0
10.0
15.0
20.0
25.0
30.0
35.0
40.0
StronglyAgree
Agree NeitherAgree
norDisagree
Disagree StronglyDisagree
Don'tKnow
Pe
rce
nta
ge
Figure F15 - Mental Health - There is a wide range of mental health services and supports to meet the diverse (different)
needs of people EXPERIENCING mental health challenges
2 years or less
3 to 10 Years
11 years or more
Years' Experience
2.6
12.0
18.8
36.8
25.6
4.31.0
11.4
15.9
35.7
30.6
5.3
.9
9.112.5
39.8
32.5
5.2
0.0
5.0
10.0
15.0
20.0
25.0
30.0
35.0
40.0
45.0
StronglyAgree
Agree NeitherAgree
norDisagree
Disagree StronglyDisagree
Don'tKnow
Pe
rcn
tage
Figure F16 - Mental Health - There is a wide range of services and supports to meet the diverse (different) needs of people (such as families or other loved ones) who are AFFECTED by
someone else’s mental health challenges
2 years or less
3 to 10 Years
11 years or more
Years' Experience

55
4.3
47.9
20.5
13.7
6.0 7.74.8
41.5
22.5
16.7
8.46.16.1
35.9
24.7
18.8
9.9
4.6
0.0
10.0
20.0
30.0
40.0
50.0
60.0
StronglyAgree
Agree NeitherAgree
norDisagree
Disagree StronglyDisagree
Don'tKnow
Pe
rce
nta
geFigure F17 - Mental Health - Service providers (such as
counselors) are well-informed about the different types of services and supports offered in your region
2 years or less
3 to 10 Years
11 years or more
Years' Experience
4.3
27.6
19.0
26.7
18.1
4.33.5
26.324.1 24.6
17.0
4.62.6
24.521.7
30.7
16.4
4.1
0.0
5.0
10.0
15.0
20.0
25.0
30.0
35.0
StronglyAgree
Agree NeitherAgree
norDisagree
Disagree StronglyDisagree
Don'tKnow
Pe
rce
nta
ge
Figure F18 - Mental Health - The agencies or programs that provide different types of mental health services work well
together to help people access the services they need/ want at any given point in time
2 years or less
3 to 10 Years
11 years or more
Years' Experience
3.4
21.6
25.924.1
15.5
9.5
2.0
18.2
25.3
32.4
14.9
7.1
2.0
20.4
24.5
30.5
17.5
5.0
0.0
5.0
10.0
15.0
20.0
25.0
30.0
35.0
StronglyAgree
Agree NeitherAgree
norDisagree
Disagree StronglyDisagree
Don'tKnow
Pe
rce
nta
ge
Figure F19 - Mental Health - The agencies or programs that provide different types of mental health services work well
together to support clients as they transition from one agency or program’s services to another’s to help address their
continued/changi
2 years or less
3 to 10 Years
11 years or more
Years' Experience
1.7
27.6 27.6
21.6
10.3 11.2
1.3
20.3
25.6
32.4
15.2
5.3
1.3
17.5
23.4
35.3
16.4
6.1
0.0
5.0
10.0
15.0
20.0
25.0
30.0
35.0
40.0
StronglyAgree
Agree NeitherAgree norDisagree
Disagree StronglyDisagree
Don'tKnow
Pe
rce
nta
ge
Figure F20 - Mental Health - Services and supports are able to adapt to the changing needs and preferences of people seeking
help with mental health challenges
2 years or less
3 to 10 Years
11 years or more
Years' Experience

56
.9
6.9 6.9
31.9
50.0
3.4.3
4.1
8.6
27.8
54.4
4.81.1
5.07.1
31.2
53.9
1.7
.0
10.0
20.0
30.0
40.0
50.0
60.0
StronglyAgree
Agree NeitherAgree
norDisagree
Disagree StronglyDisagree
Don'tKnow
Pe
rce
nta
geFigure F21 - Mental Health - Taken together, the available
services and supports are able to meet the level of demand for them (there are enough services and supports)
2 years or less
3 to 10 Years
11 years or more
Years' Experience
4.3
25.024.1
19.8
9.5
17.2
2.8
15.4
28.4
19.017.5 17.0
3.3
16.7
23.224.2
21.0
11.5
0.0
5.0
10.0
15.0
20.0
25.0
30.0
StronglyAgree
Agree NeitherAgree
norDisagree
Disagree StronglyDisagree
Don'tKnow
Pe
rce
nta
ge
Figure F22* - Mental Health - Mental health services and supports have strong processes for reviewing evidence and
making the appropriate program enhancements
2 years or less
3 to 10 Years
11 years or more
Years' Experience
7.8
29.3
32.8
16.4
7.86.0
4.8
25.6
31.1
19.5
14.4
4.65.6
28.9 28.1
18.6
15.6
3.2
0.0
5.0
10.0
15.0
20.0
25.0
30.0
35.0
StronglyAgree
Agree NeitherAgree
norDisagree
Disagree StronglyDisagree
Don'tKnow
Pe
rce
nta
ge
Figure F23 - Mental Health - The services and supports for people with mental health challenges are of high quality
2 years or less
3 to 10 Years
11 years or more
Years' Experience
*Figures F6 and F22 record responses to questions asked only to
Service Providers

57
7.813.0
79.2
6.7
22.2
71.1
7.4
15.8
76.6
.30.0
10.0
20.0
30.0
40.0
50.0
60.0
70.0
80.0
90.0
Children andYouth (17 and
Under)
Adults (18 andover)
All Age Groups No answerprovided
Pe
rce
nta
ge
Figure F24 - Substance Use - In responding to the questions do you have a particular age group in mind?
2 years or less
3 to 10 Years
11 years or more
Years' Experience
9.1
54.5
11.7
18.2
5.21.3
5.6
44.4
14.4
25.6
9.6
.4
7.7
39.6
14.5
24.8
12.4
1.1
0.0
10.0
20.0
30.0
40.0
50.0
60.0
StronglyAgree
Agree NeitherAgree
norDisagree
Disagree StronglyDisagree
Don'tKnow
Pe
cen
tage
Figure F25 - Substance Use - Information about substance use/addiction services and supports is readily available and
accessible
2 years or less
3 to 10 Years
11 years or more
Years' Experience
1.3
22.1
13.0
39.0
15.6
9.1
1.5
17.0
10.4
37.0
31.9
2.22.6
11.6 11.1
39.1
33.0
2.6
0.0
5.0
10.0
15.0
20.0
25.0
30.0
35.0
40.0
45.0
StronglyAgree
Agree NeitherAgree norDisagree
Disagree StronglyDisagree
Don'tKnow
Pe
rce
nta
ge
Figure F26 - Substance Use - Regardless of the kind of services or supports (detox, treatment program, doctor’s office)
people start with, they are able to access other services or supports without too much difficulty
2 years or less
3 to 10 Years
11 years or more
Years' Experience
9.1 9.1
37.7 39.0
5.2
.7
5.99.3
31.9
48.1
4.11.1
6.3 5.5
36.9
46.2
4.0
0.0
10.0
20.0
30.0
40.0
50.0
60.0
StronglyAgree
Agree NeitherAgree norDisagree
Disagree StronglyDisagree
Don'tKnow
Pe
rce
nta
ge
Figure F27 - Substance Use - People are able to access the services and supports they seek without unnecessary delays
or long wait times
2 years or less
3 to 10 Years
11 years or more
Years' Experience
Figure F24 to F46 (B) Substance Use Questions
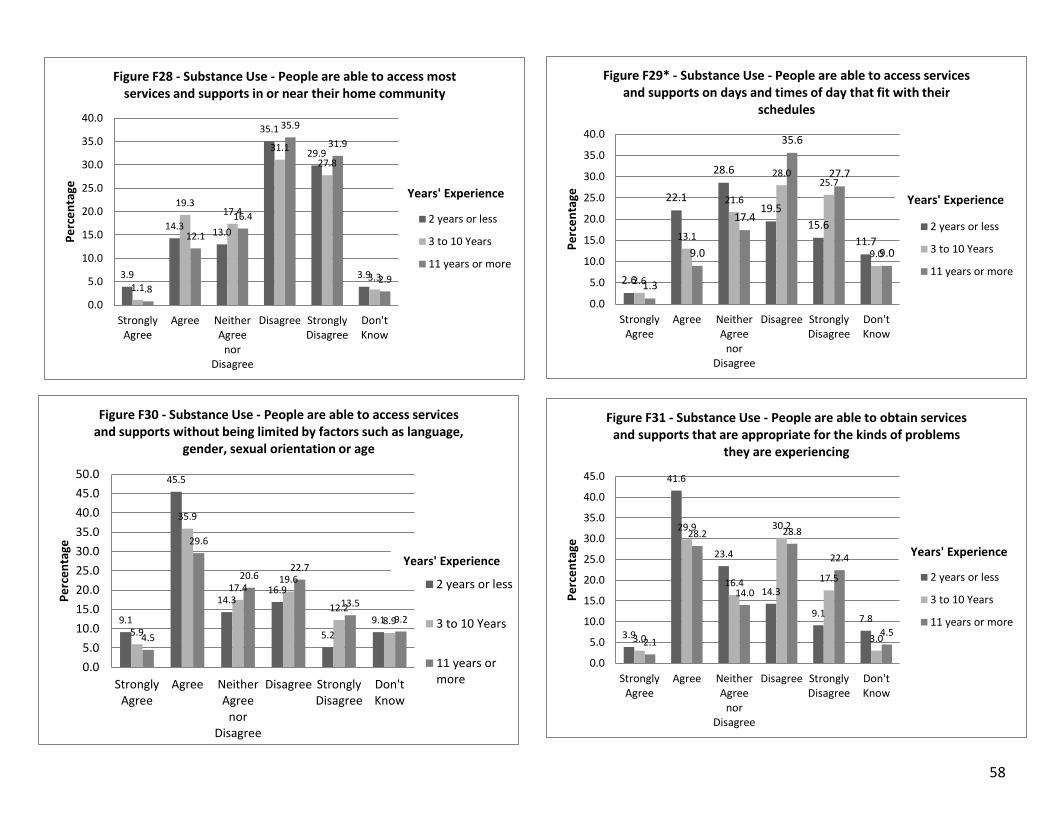
58
3.9
14.313.0
35.1
29.9
3.91.1
19.317.4
31.1
27.8
3.3.8
12.1
16.4
35.9
31.9
2.9
0.0
5.0
10.0
15.0
20.0
25.0
30.0
35.0
40.0
StronglyAgree
Agree NeitherAgree
norDisagree
Disagree StronglyDisagree
Don'tKnow
Pe
rce
nta
geFigure F28 - Substance Use - People are able to access most
services and supports in or near their home community
2 years or less
3 to 10 Years
11 years or more
Years' Experience
2.6
22.1
28.6
19.5
15.6
11.7
2.6
13.1
21.6
28.025.7
9.0
1.3
9.0
17.4
35.6
27.7
9.0
0.0
5.0
10.0
15.0
20.0
25.0
30.0
35.0
40.0
StronglyAgree
Agree NeitherAgree
norDisagree
Disagree StronglyDisagree
Don'tKnow
Pe
rce
nta
ge
Figure F29* - Substance Use - People are able to access services and supports on days and times of day that fit with their
schedules
2 years or less
3 to 10 Years
11 years or more
Years' Experience
9.1
45.5
14.316.9
5.2
9.15.9
35.9
17.419.6
12.28.9
4.5
29.6
20.622.7
13.5
9.2
0.0
5.0
10.0
15.0
20.0
25.0
30.0
35.0
40.0
45.0
50.0
StronglyAgree
Agree NeitherAgree
norDisagree
Disagree StronglyDisagree
Don'tKnow
Pe
rce
nta
ge
Figure F30 - Substance Use - People are able to access services and supports without being limited by factors such as language,
gender, sexual orientation or age
2 years or less
3 to 10 Years
11 years ormore
Years' Experience
3.9
41.6
23.4
14.3
9.17.8
3.0
29.9
16.4
30.2
17.5
3.02.1
28.2
14.0
28.8
22.4
4.5
0.0
5.0
10.0
15.0
20.0
25.0
30.0
35.0
40.0
45.0
StronglyAgree
Agree NeitherAgree
norDisagree
Disagree StronglyDisagree
Don'tKnow
Pe
rce
nta
ge
Figure F31 - Substance Use - People are able to obtain services and supports that are appropriate for the kinds of problems
they are experiencing
2 years or less
3 to 10 Years
11 years or more
Years' Experience

59
2.6
29.9
23.4
32.5
6.55.2
2.6
20.017.8
33.0
22.6
4.11.8
20.3
10.6
33.5
30.1
3.7
0.0
5.0
10.0
15.0
20.0
25.0
30.0
35.0
40.0
StronglyAgree
Agree NeitherAgree
norDisagree
Disagree StronglyDisagree
Don'tKnow
Pe
rce
nta
geFigure F32 - Substance Use - People are able to obtain services
and supports that are appropriate for the severity (seriousness) of the problems they are experiencing
2 years or less
3 to 10 Years
11 years or more
Years' Experience
7.8
44.2
15.6
22.1
2.6
7.8
3.0
28.5
23.721.9
14.1
8.9
2.4
23.2 24.528.0
12.19.8
0.0
5.0
10.0
15.0
20.0
25.0
30.0
35.0
40.0
45.0
50.0
StronglyAgree
Agree NeitherAgree norDisagree
Disagree StronglyDisagree
Don'tKnow
Pe
rce
nta
ge
Figure F33 - Substance Use - People are able to obtain services and supports that are sensitive and appropriate to their cultural
needs
2 years or less
3 to 10 Years
11 years or more
Years' Experience
5.2
26.0
22.119.5 18.2
9.1
2.6
23.3
19.6
28.5
22.2
3.73.4
20.3
16.4
35.1
17.9
6.9
0.0
5.0
10.0
15.0
20.0
25.0
30.0
35.0
40.0
StronglyAgree
Agree NeitherAgree
norDisagree
Disagree StronglyDisagree
Don'tKnow
Pe
rce
nta
ge
Figure F34 - Substance Use - Out of the available services and supports, people are able to choose from a range of approaches
(such as different kinds of counseling or self-help) to help address their substance use/addiction challenges
2 years or less
3 to 10 Years
11 years or more
Years' Experience
10.4
48.1
22.1
2.6 1.3
15.6
5.9
47.0
19.6
6.74.4
16.3
5.3
37.2
24.8
11.6
4.0
17.2
0.0
10.0
20.0
30.0
40.0
50.0
60.0
StronglyAgree
Agree NeitherAgree
norDisagree
Disagree StronglyDisagree
Don'tKnow
Pe
rce
nta
ge
Figure F35 - Substance Use - Service providers (such as counselors) are able to explain the reasons for the practices they
follow or recommend
2 years or less
3 to 10 Years
11 years or more
Years' Experience
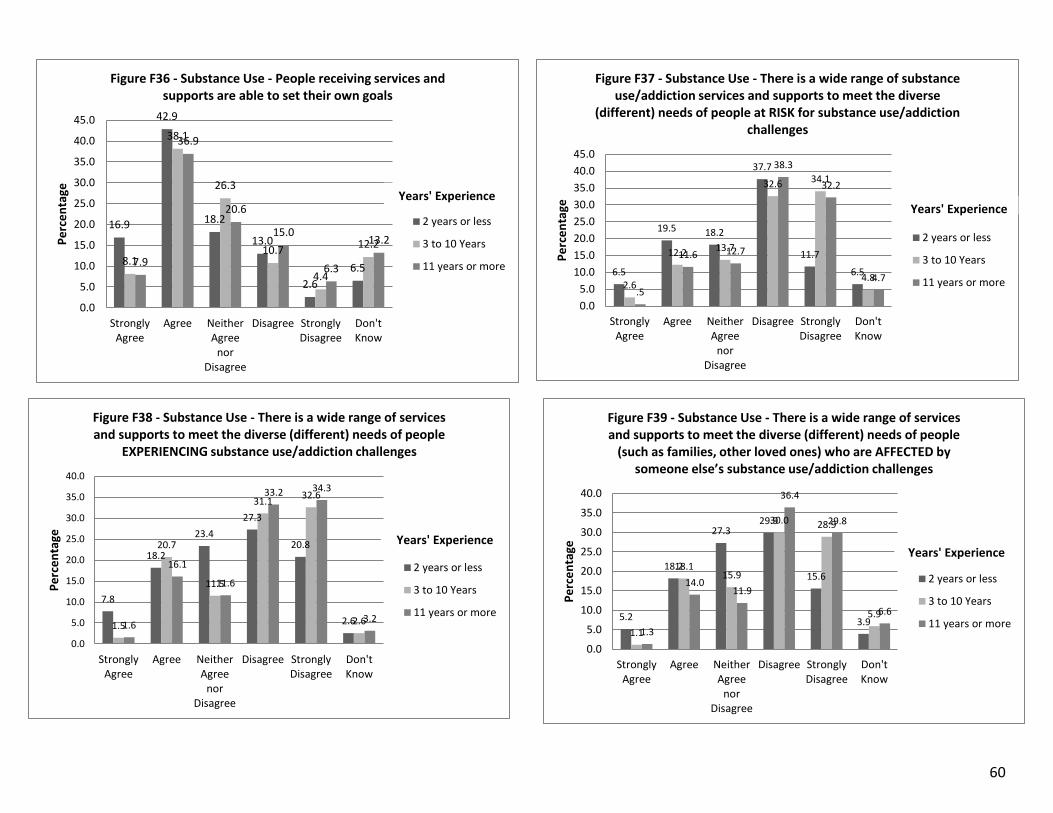
60
16.9
42.9
18.2
13.0
2.6
6.58.1
38.1
26.3
10.7
4.4
12.2
7.9
36.9
20.6
15.0
6.3
13.2
0.0
5.0
10.0
15.0
20.0
25.0
30.0
35.0
40.0
45.0
StronglyAgree
Agree NeitherAgree
norDisagree
Disagree StronglyDisagree
Don'tKnow
Pe
rce
nta
ge
Figure F36 - Substance Use - People receiving services and supports are able to set their own goals
2 years or less
3 to 10 Years
11 years or more
Years' Experience
6.5
19.5 18.2
37.7
11.7
6.52.6
12.2 13.7
32.6 34.1
4.8
.5
11.6 12.7
38.3
32.2
4.7
0.0
5.0
10.0
15.0
20.0
25.0
30.0
35.0
40.0
45.0
StronglyAgree
Agree NeitherAgree
norDisagree
Disagree StronglyDisagree
Don'tKnow
Pe
rce
nta
ge
Figure F37 - Substance Use - There is a wide range of substance use/addiction services and supports to meet the diverse
(different) needs of people at RISK for substance use/addiction challenges
2 years or less
3 to 10 Years
11 years or more
Years' Experience
7.8
18.2
23.4
27.3
20.8
2.61.5
20.7
11.5
31.132.6
2.61.6
16.1
11.6
33.2 34.3
3.2
0.0
5.0
10.0
15.0
20.0
25.0
30.0
35.0
40.0
StronglyAgree
Agree NeitherAgree
norDisagree
Disagree StronglyDisagree
Don'tKnow
Pe
rce
nta
ge
Figure F38 - Substance Use - There is a wide range of services and supports to meet the diverse (different) needs of people
EXPERIENCING substance use/addiction challenges
2 years or less
3 to 10 Years
11 years or more
Years' Experience
5.2
18.2
27.329.9
15.6
3.91.1
18.115.9
30.0 28.9
5.9
1.3
14.011.9
36.4
29.8
6.6
0.0
5.0
10.0
15.0
20.0
25.0
30.0
35.0
40.0
StronglyAgree
Agree NeitherAgree
norDisagree
Disagree StronglyDisagree
Don'tKnow
Pe
rce
nta
ge
Figure F39 - Substance Use - There is a wide range of services and supports to meet the diverse (different) needs of people
(such as families, other loved ones) who are AFFECTED by someone else’s substance use/addiction challenges
2 years or less
3 to 10 Years
11 years or more
Years' Experience

61
9.1
39.0
19.516.9
6.59.1
7.0
39.3
18.119.6
7.4 8.5
4.2
33.8
23.520.3
9.5 8.7
0.0
5.0
10.0
15.0
20.0
25.0
30.0
35.0
40.0
45.0
StronglyAgree
Agree NeitherAgree
norDisagree
Disagree StronglyDisagree
Don'tKnow
Pe
rce
nta
ge
Figure F40 - Substance Use - Service providers (such as counselors, intake workers) are well informed about other
services and supports offered in the region
2 years or less
3 to 10 Years
11 years or more
Years' Experience
3.9
35.1
23.420.8
9.1 7.84.4
26.3 25.623.0
13.7
7.04.0
17.9
25.9 24.8
17.2
10.3
0.0
5.0
10.0
15.0
20.0
25.0
30.0
35.0
40.0
StronglyAgree
Agree NeitherAgree
norDisagree
Disagree StronglyDisagree
Don'tKnow
Pe
rce
nta
ge
Figure F41 - Substance Use - The agencies or programs that provide different types of substance use/addiction services work well together to help people access the services they
need/ want at any given point in time
2 years or less
3 to 10 Years
11 years or more
Years' Experience
1.3
22.124.7
28.6
14.3
9.1
3.3
21.123.7
27.8
14.8
9.3
2.9
18.5
21.9
28.2
17.7
10.8
0.0
5.0
10.0
15.0
20.0
25.0
30.0
StronglyAgree
Agree NeitherAgree
norDisagree
Disagree StronglyDisagree
Don'tKnow
Pe
rce
nta
ge
Figure F42 - Substance Use - The agencies or programs that provide different types of substance use/addiction services
work well together to support clients as they transition from one agency or program’s services to another’s to help address
their contin
2 years or less
3 to 10 Years
11 years or more
Years' Experience
1.3
33.8
26.0
19.5
9.110.4
1.5
18.5
23.3
27.4
18.9
10.4
2.1
13.2
23.2
34.6
17.9
9.0
0.0
5.0
10.0
15.0
20.0
25.0
30.0
35.0
40.0
StronglyAgree
Agree NeitherAgree
norDisagree
Disagree StronglyDisagree
Don'tKnow
Pe
rce
nta
ge
Figure F43 - Substance Use - Services and supports are able to adapt to the changing needs and preferences of people seeking
help with substance use/addiction challenges
2 years or less
3 to 10 Years
11 years or more
Years' Experience

62
3.96.5
14.3
24.7
45.5
5.27.8 7.8
31.5
48.9
4.1.3
4.76.9
31.1
52.2
4.7
0.0
10.0
20.0
30.0
40.0
50.0
60.0
StronglyAgree
Agree NeitherAgree norDisagree
Disagree StronglyDisagree
Don'tKnow
Pe
rce
nta
ge
Figure F44 - Substance Use - Taken together, the available services and supports are able to meet the level of demand for
them (there are enough services and supports)
2 years or less
3 to 10 Years
11 years ormore
Years' Experience
3.9
31.2
22.1
18.2
9.1
15.6
3.7
16.0
25.3
11.2
17.1
26.8
2.6
11.9
23.221.1 21.1
20.1
0.0
5.0
10.0
15.0
20.0
25.0
30.0
35.0
StronglyAgree
Agree NeitherAgree norDisagree
Disagree StronglyDisagree
Don'tKnow
Pe
rce
nta
ge
Figure F45* - Substance Use - Substance use/addiction services and supports have strong processes for reviewing evidence and
making the appropriate program enhancements
2 years or less
3 to 10 Years
11 years or more
Years' Experience
5.2
31.2
27.3
16.9
7.8
11.7
2.2
23.0
31.5
15.9 15.9
11.5
2.4
24.5 23.7 23.5
16.1
9.8
0.0
5.0
10.0
15.0
20.0
25.0
30.0
35.0
StronglyAgree
Agree NeitherAgree
norDisagree
Disagree StronglyDisagree
Don'tKnow
Pe
rce
nta
ge
Figure F46 - Substance Use - The services and supports for people with substance use/addiction challenges are of high
quality
2 years or less
3 to 10 Years
11 years or more
Years' Experience
*Figures F29 and F45 record responses to questions asked only to
Service Providers

63
Appendix G: Comparing Responses concerning (A) Mental Health or (B)
Substance Use/Addiction Services among Service Providers Responding
for Different Age Groups in Mind

64
5.3
45.5
12.9
28
6.8
1.54.7
48.1
13.6
25.2
8.45
35.4
15.9
32.1
10.4
1.1
0
10
20
30
40
50
60
StronglyAgree
Agree NeitherAgree norDisagree
Disagree StronglyDisagree
Don'tKnow
Pe
rce
nta
ge
Figure G1 - Mental Health - Information about mental health services and supports is readily available and accessible
Children and Youth(17 and Under)
Adults (18 andover)
All Age Groups
3.0
15.911.4
49.2
18.2
2.34.2
18.7
12.6
43.0
20.6
.91.7
16.011.3
44.4
25.3
1.3
0.0
10.0
20.0
30.0
40.0
50.0
60.0
StronglyAgree
Agree NeitherAgree norDisagree
Disagree StronglyDisagree
Don'tKnow
Pe
rce
nta
ge
Figure G2 - Mental Health - Regardless of the kind of services or supports (such as mental health clinic, doctor’s office) people start with, they are able to access other services or supports
without too much difficulty
Children andYouth (17 andUnder)
Adults (18 andover)
All AgeGroups
1.5
6.8 5.3
35.6
48.5
2.32.3
13.1
7.9
41.6
35.0
.4
5.7 7.7
39.0
45.3
1.9
0.0
10.0
20.0
30.0
40.0
50.0
60.0
StronglyAgree
Agree NeitherAgree norDisagree
Disagree StronglyDisagree
Don'tKnow
Pe
rce
nta
ge
Figure G3 - Mental Health - People are able to access the services and supports they seek without unnecessary delays or long wait
times
Children andYouth (17 andUnder)
Adults (18 andover)
All Age Groups
2.3
18.9 19.7
31.8
25.8
1.54.2
32.2
14.0
29.9
17.3
2.31.4
23.0
14.3
35.1
24.0
2.1
0.0
5.0
10.0
15.0
20.0
25.0
30.0
35.0
40.0
StronglyAgree
Agree NeitherAgree norDisagree
Disagree StronglyDisagree
Don'tKnow
Pe
rce
nta
ge
Figure G4 - Mental Health - People are able to access most services and supports they require in or near their home
community
Children and Youth (17and Under)
Adults (18 and over)
All Age Groups
Figure G1 to G22 (A) Mental Health Services

65
22.720.5
32.6
19.7
4.52.8
23.421.5
29.9
16.8
5.6
.6
15.9
21.6
32.6
23.3
6.1
0.0
5.0
10.0
15.0
20.0
25.0
30.0
35.0
StronglyAgree
Agree NeitherAgree norDisagree
Disagree StronglyDisagree
Don'tKnow
Pe
rce
nta
ge
Figure G5* - Mental Health - People are able to access services and supports on days and at times of day that fit with their
schedules
Children and Youth (17and Under)
Adults (18 and over)
All Age Groups6.8
46.2
15.9
18.2
9.13.8
5.6
46.3
15.9
21.0
8.9
2.35.3
35.4
20.7 22.0
11.3
5.3
0.0
5.0
10.0
15.0
20.0
25.0
30.0
35.0
40.0
45.0
50.0
StronglyAgree
Agree NeitherAgree norDisagree
Disagree StronglyDisagree
Don'tKnow
Pe
rce
nta
ge
Figure G6 - Mental Health - People are able to access services and supports without being limited by factors such as language,
gender, sexual orientation or age
Children and Youth (17and Under)
Adults (18 and over)
All Age Groups
7.6
42.4
12.1
28.8
9.16.1
42.5
11.2
25.2
13.1
1.93.3
33.9
18.6
27.0
14.4
2.6
0.0
5.0
10.0
15.0
20.0
25.0
30.0
35.0
40.0
45.0
StronglyAgree
Agree NeitherAgree
norDisagree
Disagree StronglyDisagree
Don'tKnow
Pe
rce
nta
ge
Figure G7 - Mental Health - People are able to obtain services and supports that are appropriate for the kinds of problems they
are experiencing (such as mood or anxiety related challenges)
Children andYouth (17 andUnder)
Adults (18 andover)
All Age Groups5.3
28.8
16.7
33.3
15.2
.8
5.1
31.3
15.4
30.8
16.8
.52.0
21.4
17.6
34.7
22.1
2.1
0.0
5.0
10.0
15.0
20.0
25.0
30.0
35.0
40.0
StronglyAgree
Agree NeitherAgree norDisagree
Disagree StronglyDisagree
Don'tKnow
Pe
rce
nta
ge
Figure G8 - Mental Health - People are able to obtain services and supports that are appropriate for the severity (seriousness) of the
problems they are experiencing
Children and Youth(17 and Under)Adults (18 andover)All Age Groups

66
1.5
33.3
30.3
19.7
12.1
3.05.1
33.2
25.7
22.0
9.3
4.7
2.3
21.9
26.428.0
13.9
7.6
0.0
5.0
10.0
15.0
20.0
25.0
30.0
35.0
StronglyAgree
Agree NeitherAgree norDisagree
Disagree StronglyDisagree
Don'tKnow
Pe
rce
nta
geFigure G9 - Mental Health - People are able to obtain services
and supports that are sensitive and appropriate to their cultural needs
Children and Youth(17 and Under)
Adults (18 andover)
All Age Groups
2.3
25.0
15.9
37.9
16.7
2.32.8
25.7
14.0
34.6
20.6
2.32.6
19.1 18.1
32.6
23.6
4.0
0.0
5.0
10.0
15.0
20.0
25.0
30.0
35.0
40.0
StronglyAgree
Agree NeitherAgree norDisagree
Disagree StronglyDisagree
Don't Know
Pe
rce
nta
ge
Figure G10 - Mental Health - Out of the available services and supports, people are able to choose from a range of approaches
(such as different kinds of counseling or self-help) to help address their mental health-related challenges
Children andYouth (17 andUnder)Adults (18 andover)
All Age Groups
9.8
44.7
21.2
7.6
3.0
13.69.3
51.9
16.8
9.8
3.3
8.98.3
46.7
21.7
8.95.1
9.3
0.0
10.0
20.0
30.0
40.0
50.0
60.0
StronglyAgree
Agree NeitherAgree
norDisagree
Disagree StronglyDisagree
Don'tKnow
Pe
rce
nta
ge
Figure G11 - Mental Health - Service providers (such as counselors) are able to explain the reasons for the practices
they follow or recommend
Children and Youth(17 and Under)
Adults (18 and over)
All Age Groups 11.4
43.9
20.5
14.4
1.5
8.3
14.5
42.1
19.6
13.1
5.1 5.68.4
39.4
26.6
11.7
4.9
9.0
0.0
5.0
10.0
15.0
20.0
25.0
30.0
35.0
40.0
45.0
50.0
StronglyAgree
Agree NeitherAgree norDisagree
Disagree StronglyDisagree
Don'tKnow
Pe
rce
nta
ge
Figure G12 - Mental Health - People receiving services and supports are able to set their own goals
Children andYouth (17 andUnder)
Adults (18 andover)
All Age Groups
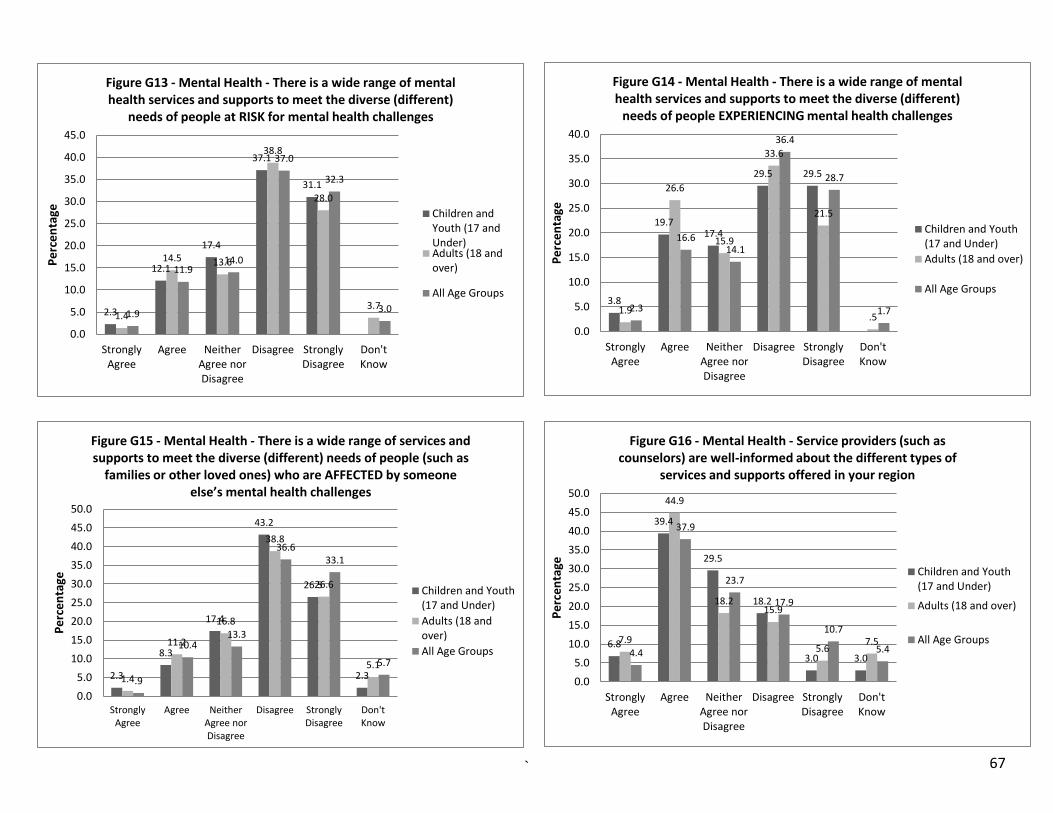
67
2.3
12.1
17.4
37.1
31.1
1.4
14.5 13.6
38.8
28.0
3.71.9
11.914.0
37.0
32.3
3.0
0.0
5.0
10.0
15.0
20.0
25.0
30.0
35.0
40.0
45.0
StronglyAgree
Agree NeitherAgree norDisagree
Disagree StronglyDisagree
Don'tKnow
Pe
rce
nta
ge
Figure G13 - Mental Health - There is a wide range of mental health services and supports to meet the diverse (different)
needs of people at RISK for mental health challenges
Children andYouth (17 andUnder)Adults (18 andover)
All Age Groups3.8
19.717.4
29.5 29.5
1.9
26.6
15.9
33.6
21.5
.52.3
16.614.1
36.4
28.7
1.7
0.0
5.0
10.0
15.0
20.0
25.0
30.0
35.0
40.0
StronglyAgree
Agree NeitherAgree norDisagree
Disagree StronglyDisagree
Don'tKnow
Pe
rce
nta
ge
Figure G14 - Mental Health - There is a wide range of mental health services and supports to meet the diverse (different)
needs of people EXPERIENCING mental health challenges
Children and Youth(17 and Under)
Adults (18 and over)
All Age Groups
2.3
8.3
17.4
43.2
26.5
2.31.4
11.2
16.8
38.8
26.6
5.1
.9
10.413.3
36.633.1
5.7
0.0
5.0
10.0
15.0
20.0
25.0
30.0
35.0
40.0
45.0
50.0
StronglyAgree
Agree NeitherAgree norDisagree
Disagree StronglyDisagree
Don'tKnow
Pe
rce
nta
ge
Figure G15 - Mental Health - There is a wide range of services and supports to meet the diverse (different) needs of people (such as
families or other loved ones) who are AFFECTED by someone else’s mental health challenges
Children and Youth(17 and Under)
Adults (18 andover)
All Age Groups6.8
39.4
29.5
18.2
3.0 3.0
7.9
44.9
18.215.9
5.67.5
4.4
37.9
23.7
17.9
10.7
5.4
0.0
5.0
10.0
15.0
20.0
25.0
30.0
35.0
40.0
45.0
50.0
StronglyAgree
Agree NeitherAgree norDisagree
Disagree StronglyDisagree
Don'tKnow
Pe
rce
nta
ge
Figure G16 - Mental Health - Service providers (such as counselors) are well-informed about the different types of
services and supports offered in your region
Children and Youth(17 and Under)
Adults (18 and over)
All Age Groups
`

68
3.8
25.8
22.7
31.1
14.4
2.33.3
32.2
21.0
27.1
13.1
3.33.0
23.622.4
27.7
18.1
5.0
0.0
5.0
10.0
15.0
20.0
25.0
30.0
35.0
StronglyAgree
Agree NeitherAgree norDisagree
Disagree StronglyDisagree
Don'tKnow
Pe
rce
nta
ge
Figure G17 - Mental Health - The agencies or programs that provide different types of mental health services work well
together to help people access the services they need/ want at any given point in time
Children and Youth(17 and Under)
Adults (18 and over)
All Age Groups
1.5
17.4
28.0
34.1
13.6
5.33.3
25.223.4
30.4
14.5
3.32.0
18.6
24.9
29.9
17.1
7.4
0.0
5.0
10.0
15.0
20.0
25.0
30.0
35.0
40.0
StronglyAgree
Agree NeitherAgree
norDisagree
Disagree StronglyDisagree
Don'tKnow
Pe
rce
nta
ge
Figure G18 - Mental Health - The agencies or programs that provide different types of mental health services work well
together to support clients as they transition from one agency or program’s services to another’s to help address their
continued/changi
Children and Youth (17and Under)
Adults (18 and over)
All Age Groups
3.0
17.4
28.8
34.1
10.6
6.1
1.4
25.2
21.5
33.2
13.6
5.1
1.0
18.3
24.9
32.4
16.4
6.9
0.0
5.0
10.0
15.0
20.0
25.0
30.0
35.0
40.0
StronglyAgree
Agree NeitherAgree norDisagree
Disagree StronglyDisagree
Don'tKnow
Pe
rce
nta
ge
Figure G19 - Mental Health - Services and supports are able to adapt to the changing needs and preferences of people seeking
help with mental health challenges
Children and Youth(17 and Under)Adults (18 and over)
All Age Groups
3.8
9.8
32.6
51.5
2.31.9
7.0 7.9
29.4
50.0
3.7.6
4.47.0
29.7
55.1
3.0
0.0
10.0
20.0
30.0
40.0
50.0
60.0
StronglyAgree
Agree NeitherAgree norDisagree
Disagree StronglyDisagree
Don'tKnow
Pe
rce
nta
ge
Figure G20 - Mental Health - Taken together, the available services and supports are able to meet the level of demand for
them (there are enough services and supports)
Children and Youth(17 and Under)
Adults (18 and over)
All Age Groups

69
3.8
19.7
30.3
23.5
9.8
12.9
2.8
22.4 22.924.3
15.9
11.7
3.3
15.0
24.9
20.7 20.7
15.3
0.0
5.0
10.0
15.0
20.0
25.0
30.0
35.0
StronglyAgree
Agree NeitherAgree norDisagree
Disagree StronglyDisagree
Don'tKnow
Pe
rce
nta
ge
Figure G21* - Mental Health - Mental health services and supports have strong processes for reviewing evidence and making the
appropriate program enhancements
Children and Youth(17 and Under)
Adults (18 and over)
All Age Groups
7.6
28.0
31.1
19.7
9.1
4.56.5
36.9
22.0
18.7
13.6
2.3
4.9
24.7
31.9
18.6
15.3
4.4
0.0
5.0
10.0
15.0
20.0
25.0
30.0
35.0
40.0
StronglyAgree
Agree NeitherAgree
norDisagree
Disagree StronglyDisagree
Don'tKnow
Pe
rce
nta
ge
Figure G22 - Mental Health - The services and supports for people with mental health challenges are of high quality
Children and Youth(17 and Under)
Adults (18 and over)
All Age Groups
*Figures G5 and G21 record responses to questions asked only to Service Providers
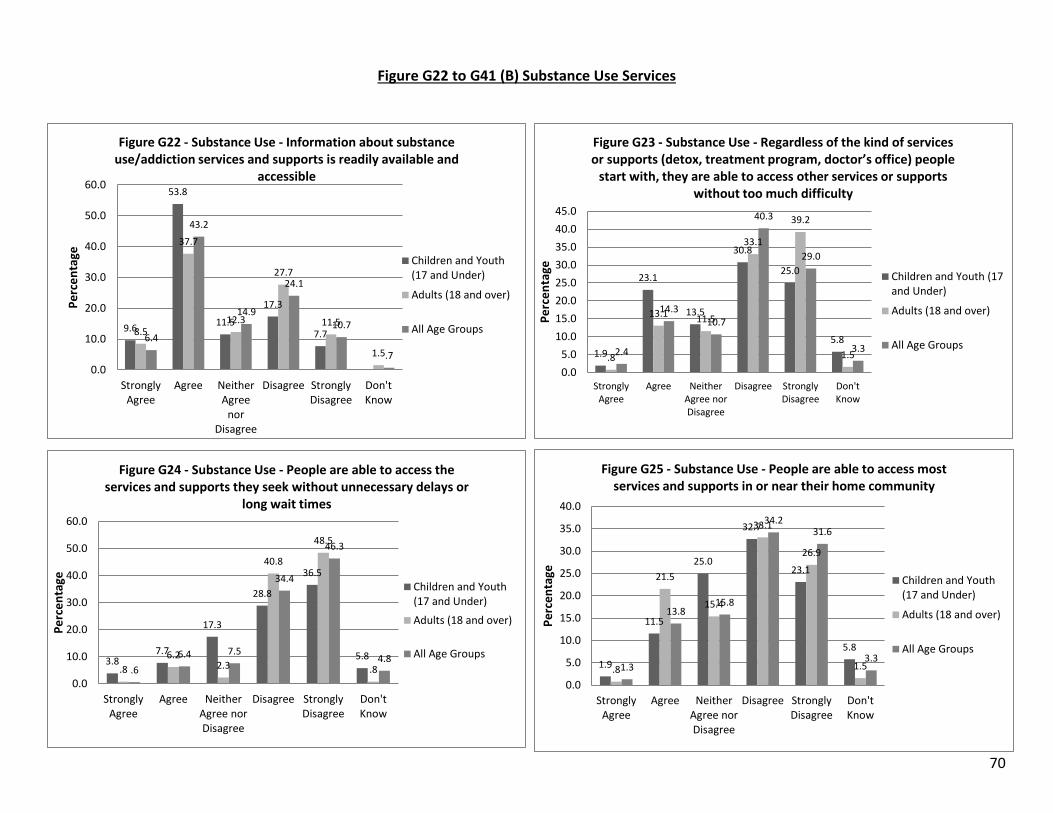
70
9.6
53.8
11.5
17.3
7.78.5
37.7
12.3
27.7
11.5
1.5
6.4
43.2
14.9
24.1
10.7
.7
0.0
10.0
20.0
30.0
40.0
50.0
60.0
StronglyAgree
Agree NeitherAgree
norDisagree
Disagree StronglyDisagree
Don'tKnow
Pe
rce
nta
ge
Figure G22 - Substance Use - Information about substance use/addiction services and supports is readily available and
accessible
Children and Youth(17 and Under)
Adults (18 and over)
All Age Groups
1.9
23.1
13.5
30.8
25.0
5.8
.8
13.111.5
33.1
39.2
1.52.4
14.310.7
40.3
29.0
3.3
0.0
5.0
10.0
15.0
20.0
25.0
30.0
35.0
40.0
45.0
StronglyAgree
Agree NeitherAgree norDisagree
Disagree StronglyDisagree
Don'tKnow
Pe
rce
nta
ge
Figure G23 - Substance Use - Regardless of the kind of services or supports (detox, treatment program, doctor’s office) people
start with, they are able to access other services or supports without too much difficulty
Children and Youth (17and Under)
Adults (18 and over)
All Age Groups
3.87.7
17.3
28.8
36.5
5.8
.8
6.22.3
40.8
48.5
.8.6
6.4 7.5
34.4
46.3
4.8
0.0
10.0
20.0
30.0
40.0
50.0
60.0
StronglyAgree
Agree NeitherAgree norDisagree
Disagree StronglyDisagree
Don'tKnow
Pe
rce
nta
ge
Figure G24 - Substance Use - People are able to access the services and supports they seek without unnecessary delays or
long wait times
Children and Youth(17 and Under)
Adults (18 and over)
All Age Groups1.9
11.5
25.0
32.7
23.1
5.8
.8
21.5
15.4
33.1
26.9
1.51.3
13.815.8
34.231.6
3.3
0.0
5.0
10.0
15.0
20.0
25.0
30.0
35.0
40.0
StronglyAgree
Agree NeitherAgree norDisagree
Disagree StronglyDisagree
Don'tKnow
Pe
rce
nta
ge
Figure G25 - Substance Use - People are able to access most services and supports in or near their home community
Children and Youth(17 and Under)
Adults (18 and over)
All Age Groups
Figure G22 to G41 (B) Substance Use Services

71
5.8
11.5
30.8
26.9
17.3
5.8
1.5
12.3
21.5
27.7
30.8
5.4
1.7
11.8
18.8
32.0
25.2
10.5
0.0
5.0
10.0
15.0
20.0
25.0
30.0
35.0
StronglyAgree
Agree NeitherAgree norDisagree
Disagree StronglyDisagree
Don't Know
Pe
rce
nta
ge
Figure G26* - Substance Use - People are able to access services and supports on days and times of day that fit with their
schedules
Children and Youth(17 and Under)
Adults (18 andover)
All Age Groups 9.6
38.5
26.9
11.5
5.87.7
2.3
40.0
16.9
20.8
10.88.5
5.9
31.6
18.4
21.9
12.9
9.4
0.0
5.0
10.0
15.0
20.0
25.0
30.0
35.0
40.0
45.0
StronglyAgree
Agree NeitherAgree norDisagree
Disagree StronglyDisagree
Don'tKnow
Pe
rce
nta
ge
Figure G27 - Substance Use - People are able to access services and supports without being limited by factors such as language,
gender, sexual orientation or age
Children and Youth(17 and Under)
Adults (18 and over)
All Age Groups
1.9
38.5
17.3 17.3 17.3
5.8
1.5
28.5
13.8
31.5
20.0
3.82.9
29.8
16.2
27.6
19.1
4.2
0.0
5.0
10.0
15.0
20.0
25.0
30.0
35.0
40.0
45.0
StronglyAgree
Agree NeitherAgree norDisagree
Disagree StronglyDisagree
Don't Know
Pe
rce
nta
ge
Figure G28 - Substance Use - People are able to obtain services and supports that are appropriate for the kinds of problems
they are experiencing
Children andYouth (17 andUnder)
Adults (18 andover)
All Age Groups
3.8
21.2
26.925.0
17.3
5.8
2.3
23.1
9.2
36.2
26.2
2.32.0
20.6
14.7
33.3
25.2
4.2
0.0
5.0
10.0
15.0
20.0
25.0
30.0
35.0
40.0
StronglyAgree
Agree NeitherAgree norDisagree
Disagree StronglyDisagree
Don'tKnow
Pe
rce
nta
ge
Figure G29 - Substance Use - People are able to obtain services and supports that are appropriate for the severity (seriousness)
of the problems they are experiencing
Children and Youth(17 and Under)
Adults (18 and over)
All Age Groups

72
1.9
25.0
34.6
23.1
7.7 7.7
3.1
30.0
19.2
28.5
11.5
6.9
3.3
27.0
23.2 24.3
12.39.9
0.0
5.0
10.0
15.0
20.0
25.0
30.0
35.0
40.0
StronglyAgree
Agree NeitherAgree norDisagree
Disagree StronglyDisagree
Don'tKnow
Pe
rce
nta
ge
Figure G30 - Substance Use - People are able to obtain services and supports that are sensitive and appropriate to their cultural
needs
Children and Youth(17 and Under)
Adults (18 and over)
All Age Groups
1.9
21.2
25.0
28.8
17.3
5.8
2.3
20.8
16.9
31.5
22.3
5.43.7
22.4
17.8
30.9
19.1
6.1
0.0
5.0
10.0
15.0
20.0
25.0
30.0
35.0
StronglyAgree
Agree NeitherAgree norDisagree
Disagree StronglyDisagree
Don'tKnow
Pe
rce
nta
ge
Figure G31 - Substance Use - Out of the available services and supports, people are able to choose from a range of approaches
(such as different kinds of counseling or self-help) to help address their substance use/addiction challenges
Children and Youth(17 and Under)
Adults (18 and over)
All Age Groups
9.6
44.2
25.0
3.81.9
15.4
4.6
43.8
17.7
10.0
3.1
20.0
6.1
41.2
23.5
9.0
4.2
16.0
0.0
5.0
10.0
15.0
20.0
25.0
30.0
35.0
40.0
45.0
50.0
StronglyAgree
Agree NeitherAgree norDisagree
Disagree StronglyDisagree
Don'tKnow
Pe
rce
nta
ge
Figure G32 - Substance Use - Service providers (such as counselors) are able to explain the reasons for the practices
they follow or recommend
Children and Youth (17and Under)
Adults (18 and over)
All Age Groups 17.3
40.4
19.2
5.83.8
13.5
6.9
38.5
20.8
14.6
8.510.0
8.6
37.5
23.2
13.6
4.6
12.5
0.0
5.0
10.0
15.0
20.0
25.0
30.0
35.0
40.0
45.0
StronglyAgree
Agree NeitherAgree norDisagree
Disagree StronglyDisagree
Don'tKnow
Pe
rce
nta
ge
Figure G33 - Substance Use - People receiving services and supports are able to set their own goals
Children and Youth(17 and Under)
Adults (18 and over)
All Age Groups

73
1.9
28.8
19.2
23.125.0
1.9.8
17.7
12.3
33.1 33.8
1.52.6
17.1
12.3
32.2 32.5
3.3
0.0
5.0
10.0
15.0
20.0
25.0
30.0
35.0
40.0
StronglyAgree
Agree NeitherAgree norDisagree
Disagree StronglyDisagree
Don'tKnow
Pe
rrce
nta
ge
Figure G35 - Substance Use - There is a wide range of services and supports to meet the diverse (different) needs of people
EXPERIENCING substance use/addiction challenges
Children and Youth(17 and Under)
Adults (18 andover)
All Age Groups
23.1
17.3
30.8
26.9
1.9
12.3 13.1
37.7
31.5
4.62.2
16.2 15.3
32.4
27.2
6.8
0.0
5.0
10.0
15.0
20.0
25.0
30.0
35.0
40.0
StronglyAgree
Agree NeitherAgree norDisagree
Disagree StronglyDisagree
Don'tKnow
Pe
rce
nta
ge
Figure G36 - Substance Use - There is a wide range of services and supports to meet the diverse (different) needs of people (such as families, other loved ones) who are AFFECTED by someone else’s
substance use/addiction challenges
Children and Youth (17and Under)
Adults (18 and over)
All Age Groups7.7
36.5
23.121.2
5.8 5.86.9
39.2
19.2 18.5
6.98.5
5.3
35.7
21.119.9
9.0 9.0
0.0
5.0
10.0
15.0
20.0
25.0
30.0
35.0
40.0
45.0
StronglyAgree
Agree NeitherAgree norDisagree
Disagree StronglyDisagree
Don'tKnow
Pe
rce
nta
ge
Figure G37 - Substance Use - Service providers (such as counselors, intake workers) are well informed about other
services and supports offered in the region
Children and Youth(17 and Under)
Adults (18 and over)
All Age Groups
3.8
17.3
21.2
36.5
17.3
3.81.5
7.7
13.8
40.8
31.5
3.81.8
13.4 12.9
34.731.8
5.3
0.0
5.0
10.0
15.0
20.0
25.0
30.0
35.0
40.0
45.0
StronglyAgree
Agree NeitherAgree
norDisagree
Disagree StronglyDisagree
Don'tKnow
Pe
rce
nta
ge
Figure G34 - Substance Use - There is a wide range of substance use/addiction services and supports to meet the diverse
(different) needs of people at risk for substance use/addiction challenges
Children and Youth (17and Under)
Adults (18 and over)
All Age Groups

74
7.7
25.0
17.3
23.1
15.4
11.5
2.3
19.2
33.8
24.6
15.4
3.84.2
23.5 24.1 23.5
14.9
9.7
0.0
5.0
10.0
15.0
20.0
25.0
30.0
35.0
40.0
StronglyAgree
Agree NeitherAgree norDisagree
Disagree StronglyDisagree
Don'tKnow
Pe
rce
nta
geFigure G38 - Substance Use - The agencies or programs that provide different types of substance use/addiction services work well together to help people access the services they
need/ want at any given point in time
Children and Youth(17 and Under)
Adults (18 andover)
All Age Groups7.7
15.4
19.2
28.8
15.413.5
1.5
18.5
21.5
30.8
18.5
8.5
2.8
20.6
23.5
27.2
15.8
10.1
0.0
5.0
10.0
15.0
20.0
25.0
30.0
35.0
StronglyAgree
Agree NeitherAgree norDisagree
Disagree StronglyDisagree
Don'tKnow
Pe
rce
nta
ge
Figure G39 - Substance Use - The agencies or programs that provide different types of substance use/addiction services
work well together to support clients as they transition from one agency or program’s services to another’s to help address
their contin
Children and Youth(17 and Under)
Adults (18 and over)
All Age Groups
3.8
19.2
23.1
34.6
9.6 9.6
.8
18.5
23.825.4
22.3
8.5
1.8
16.9
23.5
30.9
16.9
9.9
0.0
5.0
10.0
15.0
20.0
25.0
30.0
35.0
40.0
StronglyAgree
Agree NeitherAgree norDisagree
Disagree StronglyDisagree
Don'tKnow
Pe
rce
nta
ge
Figure G40 - Substance Use - Services and supports are able to adapt to the changing needs and preferences of people seeking
help with substance use/addiction challenges
Children and Youth(17 and Under)
Adults (18 and over)
All Age Groups 9.6
15.4
34.636.5
3.8.8
4.6 5.4
31.5
54.6
2.3.6
6.17.9
30.0
50.4
5.1
0.0
10.0
20.0
30.0
40.0
50.0
60.0
StronglyAgree
Agree NeitherAgree
norDisagree
Disagree StronglyDisagree
Don'tKnow
Pe
rce
nta
ge
Figure G41 - Substance Use - Taken together, the available services and supports are able to meet the level of demand for
them (there are enough services and supports)
Children and Youth(17 and Under)
Adults (18 and over)
All Age Groups
`
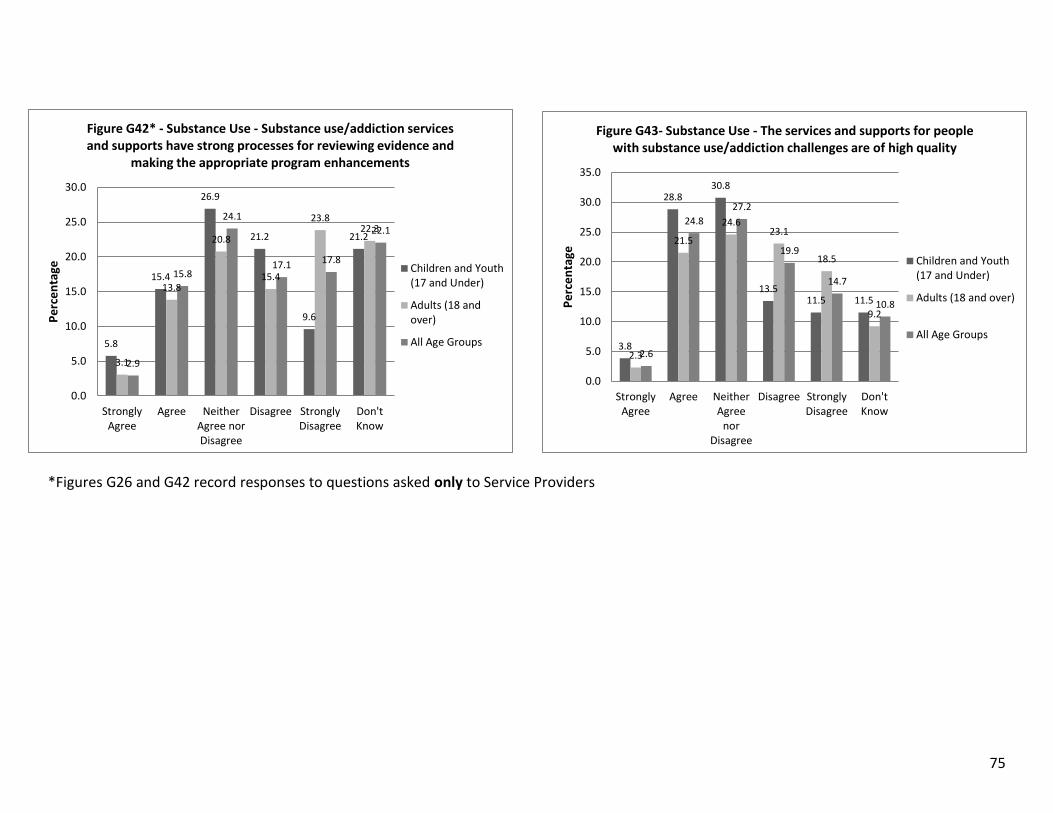
75
5.8
15.4
26.9
21.2
9.6
21.2
3.1
13.8
20.8
15.4
23.822.3
2.9
15.8
24.1
17.1 17.8
22.1
0.0
5.0
10.0
15.0
20.0
25.0
30.0
StronglyAgree
Agree NeitherAgree norDisagree
Disagree StronglyDisagree
Don'tKnow
Pe
rce
nta
ge
Figure G42* - Substance Use - Substance use/addiction services and supports have strong processes for reviewing evidence and
making the appropriate program enhancements
Children and Youth(17 and Under)
Adults (18 andover)
All Age Groups 3.8
28.830.8
13.511.5 11.5
2.3
21.5
24.623.1
18.5
9.2
2.6
24.8
27.2
19.9
14.7
10.8
0.0
5.0
10.0
15.0
20.0
25.0
30.0
35.0
StronglyAgree
Agree NeitherAgree
norDisagree
Disagree StronglyDisagree
Don'tKnow
Pe
rce
nta
ge
Figure G43- Substance Use - The services and supports for people with substance use/addiction challenges are of high quality
Children and Youth(17 and Under)
Adults (18 and over)
All Age Groups
*Figures G26 and G42 record responses to questions asked only to Service Providers

76
Appendix H: CCHS 2012 Criteria
Level of Need
Definitions for Mental Health and Substance Use
Definitions for Substance Use
Tier 1
No CIDI disorder -and- No perceived need for care -and- Drinking below (our approximation to) the low-risk guidelines: Men: Up to 15 drinks per week; Up to 3 drinks per day most days Women: Up to 10 drinks per week; Up to 2 drinks per day most days -and- No non-cannabis illicit drug use -and- Prescription drug use only as prescribed -and- Cannabis use: never, -or- just once (past 12m or lifetime), -or- more than once > 12m ago, -or- more than once in the past 12m and frequency was less than once a month.
No CIDI alcohol -or- drug disorder -and- No perceived need for care -and- Drinking below (our approximation to) the low-risk guidelines: Men: Up to 15 drinks per week; Up to 3 drinks per day most days Women: Up to 10 drinks per week; Up to 2 drinks per day most days -and- No non-cannabis illicit drug use -and- Prescription drug use only as prescribed -and- Cannabis use: never, -or- just once (past 12m or lifetime), -or- more than once > 12m ago, -or- more than once in the past 12m and frequency was less than once a month.
Tier 2
One alcohol problem (out of 11)
OR Binge drinking (5+ drinks on one occasion), less than once a month (but not never)
OR Drinking above the (approximate) LRDG: Men: (> 3 drinks per day on most days
-or- >15 drinks per week) Women: (>2 drinks per day on most days
-or- >10 drinks per week)
One alcohol problem (out of 11)
OR Binge drinking (5+ drinks on one occasion), less than once a month (but not never).
OR Drinking above the (approximate) LRDG: Men: (> 3 drinks per day on most days
-or- >15 drinks per week) Women: (>2 drinks per day on most days
-or- >10 drinks per week)
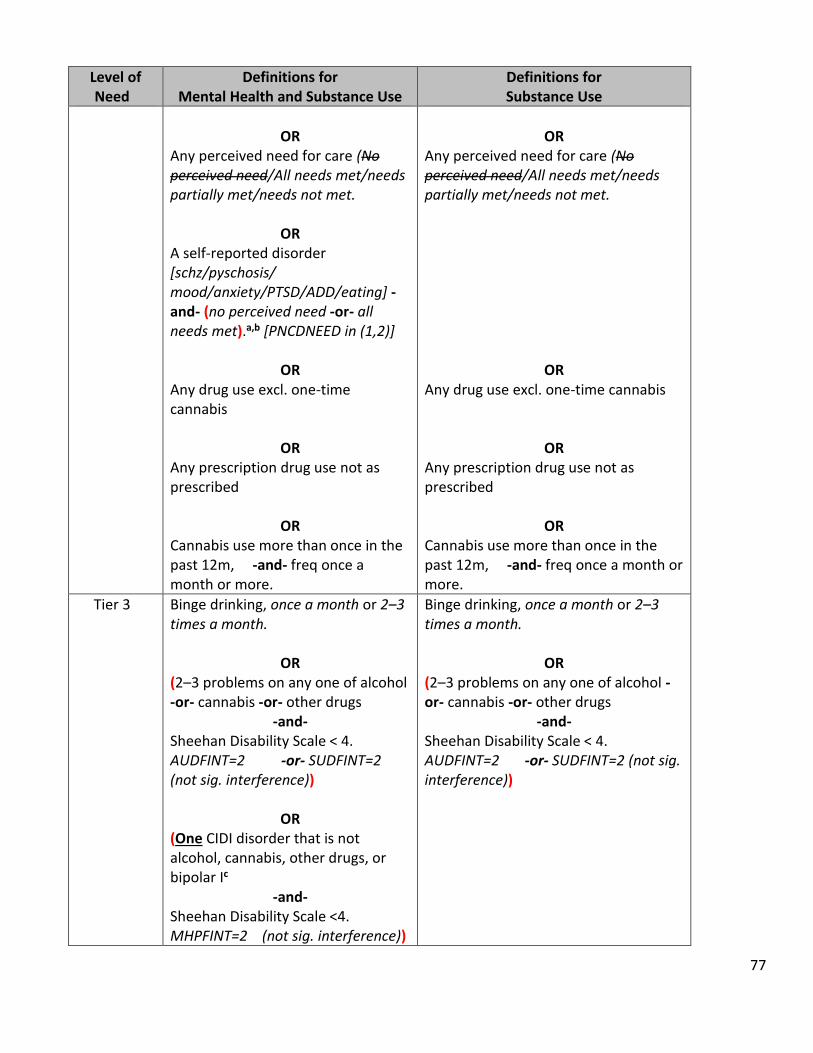
77
Level of Need
Definitions for Mental Health and Substance Use
Definitions for Substance Use
OR
Any perceived need for care (No perceived need/All needs met/needs partially met/needs not met.
OR A self-reported disorder [schz/pyschosis/ mood/anxiety/PTSD/ADD/eating] -and- (no perceived need -or- all needs met).a,b [PNCDNEED in (1,2)]
OR Any drug use excl. one-time cannabis
OR Any prescription drug use not as prescribed
OR Cannabis use more than once in the past 12m, -and- freq once a month or more.
OR
Any perceived need for care (No perceived need/All needs met/needs partially met/needs not met.
OR
Any drug use excl. one-time cannabis
OR
Any prescription drug use not as prescribed
OR Cannabis use more than once in the past 12m, -and- freq once a month or more.
Tier 3
Binge drinking, once a month or 2–3 times a month.
OR (2–3 problems on any one of alcohol -or- cannabis -or- other drugs
-and- Sheehan Disability Scale < 4. AUDFINT=2 -or- SUDFINT=2 (not sig. interference))
OR
(One CIDI disorder that is not alcohol, cannabis, other drugs, or bipolar Ic
-and- Sheehan Disability Scale <4. MHPFINT=2 (not sig. interference))
Binge drinking, once a month or 2–3 times a month.
OR (2–3 problems on any one of alcohol -or- cannabis -or- other drugs
-and- Sheehan Disability Scale < 4. AUDFINT=2 -or- SUDFINT=2 (not sig. interference))
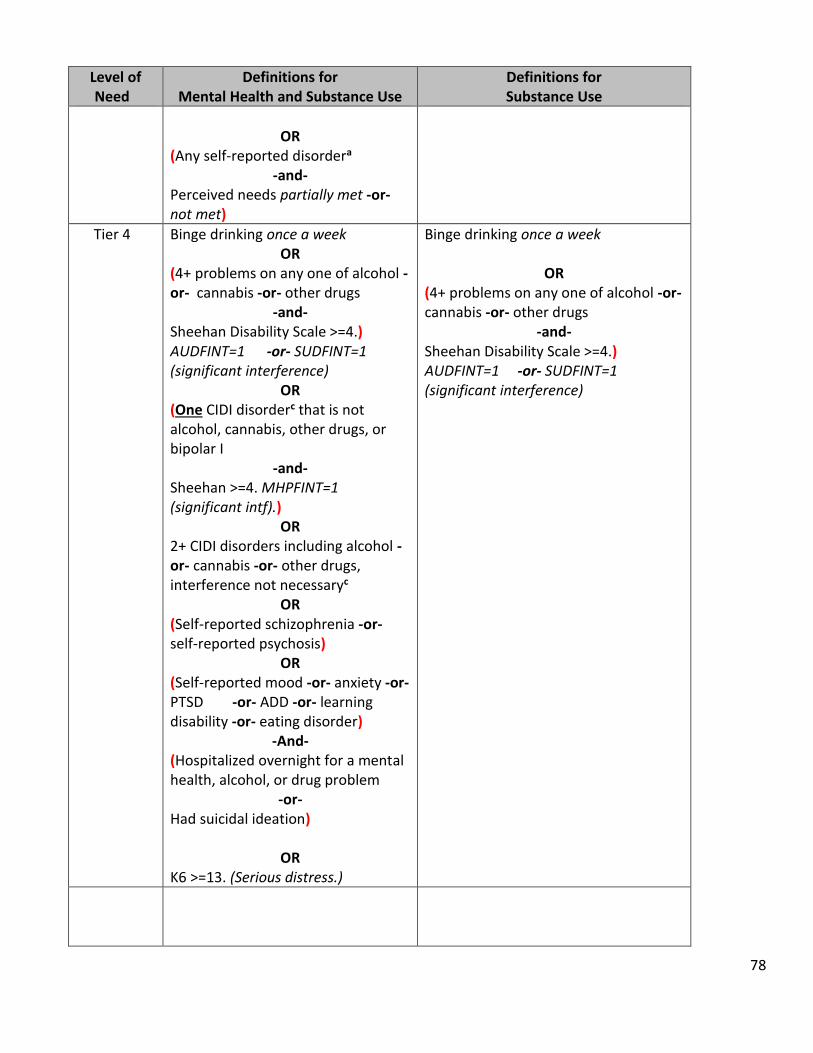
78
Level of Need
Definitions for Mental Health and Substance Use
Definitions for Substance Use
OR
(Any self-reported disordera -and-
Perceived needs partially met -or- not met)
Tier 4
Binge drinking once a week OR
(4+ problems on any one of alcohol -or- cannabis -or- other drugs
-and- Sheehan Disability Scale >=4.) AUDFINT=1 -or- SUDFINT=1 (significant interference)
OR (One CIDI disorderc that is not alcohol, cannabis, other drugs, or bipolar I
-and- Sheehan >=4. MHPFINT=1 (significant intf).)
OR 2+ CIDI disorders including alcohol -or- cannabis -or- other drugs, interference not necessaryc
OR (Self-reported schizophrenia -or- self-reported psychosis)
OR (Self-reported mood -or- anxiety -or- PTSD -or- ADD -or- learning disability -or- eating disorder)
-And- (Hospitalized overnight for a mental health, alcohol, or drug problem
-or- Had suicidal ideation)
OR K6 >=13. (Serious distress.)
Binge drinking once a week
OR (4+ problems on any one of alcohol -or- cannabis -or- other drugs
-and- Sheehan Disability Scale >=4.) AUDFINT=1 -or- SUDFINT=1 (significant interference)

79
Level of Need
Definitions for Mental Health and Substance Use
Definitions for Substance Use
Tier 5
Four stand-alone sets below, separated by ‘OR’: [(Binge drinking, more than once a week)
-or- (4+ problems on any one of alcohol -or- cannabis -or- drugs
-and- Sheehan Disability Scale >=4.) (AUDFINT=1 -or- SUDFINT=1 (signif. interference)
-And-
(2+ CIDI disordersc that are not alcohol or cannabis or drugs
-and- Sheehan Disability Scale >=4.) MHPFINT=1 (signif. interference)
-And-
(1+ chronic condition (out of 7) -or-
WHO_DAS=high (90th pctile))]
OR [(2+ CIDI disordersc that are not alcohol or cannabis or drugs
-and- Sheehan Disability Scale >=4]. MHPFINT=1 (signif. interference))
-And- (1+ chronic condition (out of 7)
-or- WHO_DAS=high (90th pctile))]
OR [(Self-reported schizophrenia
-or-
Drinking or problems is required, and then either one of the two sets after AND, separated by -OR-, is required: {[(Binge drinking, more than once a week)
-or- (4+ problems on any one of alcohol -or- cannabis -or- drugs
-and- Sheehan Disability Scale >=4.) (AUDFINT=1 -or- SUDFINT=1 (signif. interference)
AND
(2+ CIDI disordersc that are not alcohol or cannabis or drugs
-and- Sheehan Disability Scale >=4). MHPFINT=1 (signif. interference)
-And-
(1+ chronic condition (out of 7) -or-
WHO_DAS=high (90th pctile))
-OR- [(Self-reported schizophrenia
-or-

80
Level of Need
Definitions for Mental Health and Substance Use
Definitions for Substance Use
Tier 5, contd
Self-reported psychosis -or-
CIDI Bipolar I) -And-
(1+ chronic condition (out of 7) -or-
WHO_DAS=high (90th pctile))].
OR [(Binge drinking, more than once a week)
-or- (4+ problems on any one of alcohol -or- cannabis -or- drugs
-and- Sheehan Disability Scale >=4.) (AUDFINT=1 -or- SUDFINT=1 (signif. interference)
-And-
(Self-reported schizophrenia -or-
Self-reported psychosis -or-
CIDI Bipolar I)
-And- (1+ chronic condition (out of 7)
-or- WHO_DAS=high (90th pctile))]
Self-reported psychosis -or-
CIDI Bipolar I) -And-
(1+ chronic condition (out of 7) -or-
WHO_DAS=high (90th pctile))]}.
a. Self-reported disorders: schizophrenia, any other psychosis, a mood disorder, an anxiety disorder, PTSD, attention deficit disorder, learning disability, or an eating disorder. b. Perceived need: Overall perceived need for mental health care: No perceived need/All perceived needs met/Perceived needs partially met/Perceived needs not met/Not stated. c. CIDI disorders: Major depressive episode, hypomania, bipolar I, bipolar II, generalized anxiety disorder.

81
Appendix I: Regional Pyramids and Estimated Coverage of Substance Use and
Addiction Services Figure I1. Substance Use/Addiction Population Health Pyramids for Manitoba Adults, 15+ Over, by Region
Tier 1
Tier 2
Tier 3
Tier 4
40.5%N=254,256
37.1%N=232,500
16.1%N=100,751
5.9%N=37,291
0.4%N=2,416
WRHA (n = 627,214)
Tier
Tier 1
Tier 2
Tier 3
Tier 4
37.8%N=19,691
37.5%N=19,581
17.4%N=9,087
6.8%N=3,533
0.5%N=269
NHRA (n = 52,621)
Tier
Tier 1
Tier 2
Tier 3
Tier 4
42.9%N=45,579
36.3%N=38,489
14.9%N=15,770
5.6%N=5,958
0.3%N=362
IERHA (n = 106,159)
Tier
Tier 1
Tier 2
Tier 3
Tier 4
42.5%N=57,560
36.1%N=48,931
15.1%N=20,400
5.9%N=7,935
0.4%N=536
PMH (n = 135,361)
Tier
Tier 1
Tier 2
Tier 3
Tier 4
40.5%N=60,737
37.2%N=55,789
16.2%N=24,314
5.8%N=8,734
0.4%N=535
SH-SS (n = 150,109)
Tier

82
Tier 1
Tier 2
Tier 3
Tier 4
32.2%N=43,594
29%N=39,248
20.1%N=27,142
17.4%N=23,569
1.3%N=1,808
PMH (n = 135,361)
Tier 5
Figure I2. Mental Health and Substance Use/Addiction Population Health Pyramids for Manitoba Adults, 15+
Over, by Region
Tier 1
Tier 2
Tier 3
Tier 4
35.9%N=224,982
29.4%N=184,114
21.1%N=132,426
12.3%N=76,861
1.4%N=8,831
WRHA (n = 627,214)
Tier 5
Tier 1
Tier 2
Tier 3
Tier 4
37.7%N=39,988
29%N=30,737
20.3%N=21,555
11.6%N=12,308
1.5%N=1,570
IERHA (n = 106,159)
Tier 5
Tier 1
Tier 2
Tier 3
Tier 4
35.4%N=53,176
29.3%N=43,968
21.5%N=32,300
12.2%N=18,292
1.6%N=2,373
SH-SS (n = 150,109)
Tier 5
Tier 1
Tier 2
Tier 3
Tier 4
33.8%N=17.615
30.1%N=15,693
21.5%N=11,230
13.3%N=6,947
1.3%N=676
NHRA (n = 52,621)
Tier

83
Estimated Coverage of Substance Use/Addiction Services
Table I1. Estimated Coverage of Substance Use/Addiction Services for the WRHA Population, Aged 15 and Over.
Tier
Percentage
in need
Estimated number of
individual in-need
5 0.4 2,416
4 5.9 37,291
3 16.0 100,751
2 37.1 232,500
1 40.5 254,526
*Tiers 3-5 22.4 140,458
**Tiers 2-5 59.5 372,958
Table I2. Estimated Coverage of Mental Health and Substance Use/Addiction Services for the WRHA Population, Aged 15 and Over.
Tier
Percentage
in need
Estimated number of
individual in-need
5 1.4 8,831
4 12.3 76,861
3 21.1 132,426
2 29.4 184,114
1 35.9 224,982
*Tiers 3-5 34.8 218,118
**Tiers 2-5 64.2 402,232
In-need:
372,958
Current
services:
20,938
Coverage:
5.6%
Current
services:
20,938
Coverage:
14.9%
In-need:
140,458
*
**
Current
services:
169,975
Coverage:
77.9%
In-need:
218,118
In-need:
402,232
Current
services:
169,975
Coverage:
42.3%
**
*

84
Table I3. Estimated Coverage of Substance Use/Addiction Services for the IERHA Population, Aged 15 and Over.
Tier
Percentage
in need
Estimated number of
individual in-need
5 0.3 362
4 5.6 5,958
3 14.9 15,770
2 36.3 38,489
1 42.9 45,579
*Tiers 3-5 20.8 22,090
**Tiers 2-5 57.1 60,579
Table I4. Estimated Coverage of Mental Health and Substance Use/Addiction Services for the IERHA Population, Aged 15 and Over.
Tier
Percentage
in need
Estimated number of
individual in-need
5 1.5 1,570
4 11.6 12,308
3 20.3 21,555
2 29.0 30,737
1 37.7 39,988
*Tiers 3-5 33.4 35,433
**Tiers 2-5 62.4 66,170
In-need:
60,579
Current
services:
1,498
Coverage:
2.5%
Current
services:
1,498
Coverage:
6.8%
In-need:
22,090
**
*
In-need:
66,170
Current
services:
15,010
Coverage:
22.7%
Current
services:
15,010
Coverage:
42.4%
In-need:
35,433
**
*
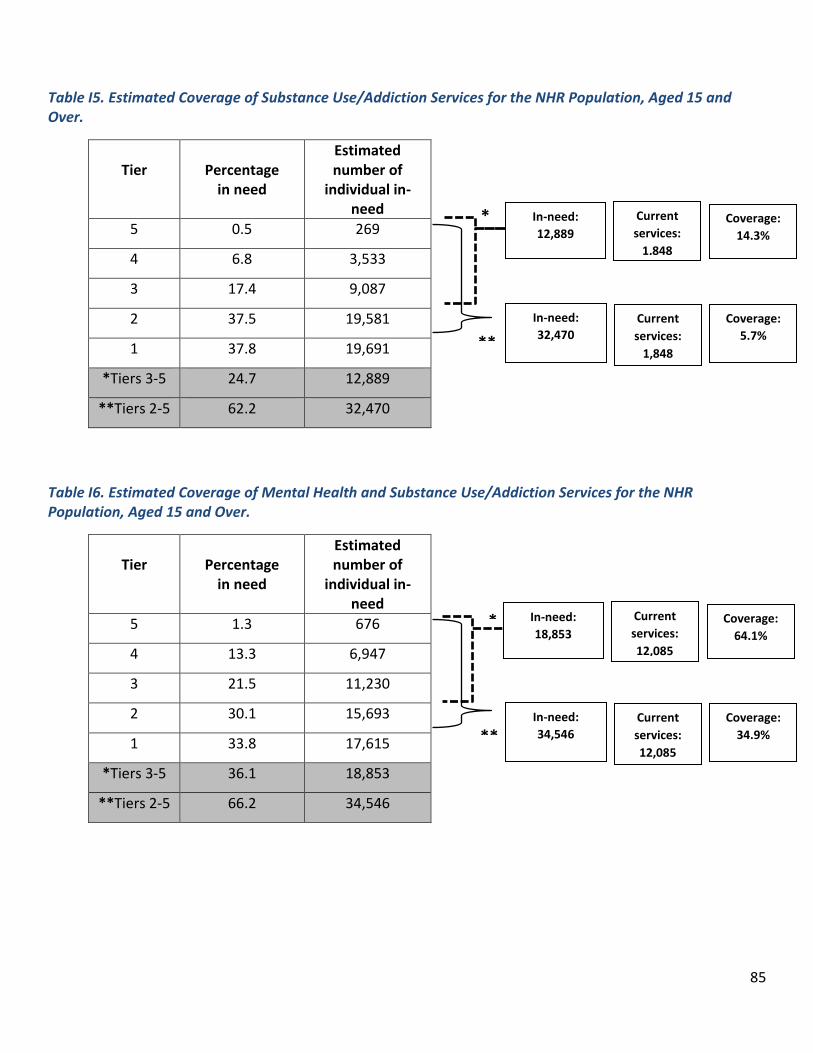
85
Table I5. Estimated Coverage of Substance Use/Addiction Services for the NHR Population, Aged 15 and Over.
Tier
Percentage
in need
Estimated number of
individual in-need
5 0.5 269
4 6.8 3,533
3 17.4 9,087
2 37.5 19,581
1 37.8 19,691
*Tiers 3-5 24.7 12,889
**Tiers 2-5 62.2 32,470
Table I6. Estimated Coverage of Mental Health and Substance Use/Addiction Services for the NHR Population, Aged 15 and Over.
Tier
Percentage
in need
Estimated number of
individual in-need
5 1.3 676
4 13.3 6,947
3 21.5 11,230
2 30.1 15,693
1 33.8 17,615
*Tiers 3-5 36.1 18,853
**Tiers 2-5 66.2 34,546
In-need:
32,470
Current
services:
1,848
Coverage:
5.7%
Current
services:
1,848
Coverage:
14.3%
In-need:
12,889
*
**
In-need:
34,546
Current
services:
12,085
Coverage:
34.9%
Current
services:
12,085
Coverage:
64.1%
In-need:
18,853
*
**

86
Table I7. Estimated Coverage of Substance Use/Addiction Services for the PMH Population, Aged 15 and Over.
Tier
Percentage
in need
Estimated number of
individual in-need
5 0.4 536
4 5.9 7,935
3 15.1 20,400
2 36.1 48,931
1 42.5 57,560
*Tiers 3-5 21.4 28,871
**Tiers 2-5 57.5 77,802
Table I8. Estimated Coverage of Mental Health and Substance Use/Addiction Services for the PMH Population, Aged 15 and Over.
Tier
Percentage
in need
Estimated number of
individual in-need
5 1.3 1,808
4 17.4 23,569
3 20.1 27,142
2 29.0 39,248
1 32.2 43,594
*Tiers 3-5 38.8 52,519
**Tiers 2-5 67.8 91,767
In-need:
77,802
Current
services:
4,477
Coverage:
5.8%
Current
services:
4,477
Coverage:
15.5%
In-need:
28,871
*
**
In-need:
91,767
Current
services:
28,935
Coverage:
31.5%
Current
services:
28,935
Coverage:
55.1%
In-need:
52,519
**
*

87
Table I9. Estimated Coverage of Substance Use/Addiction Services for the SH-SS Population, Aged 15 and Over.
Tier
Percentage
in need
Estimated number of
individual in-need
5 0.4 4,535
4 5.8 8,734
3 16.2 24,314
2 37.2 55,789
1 40.5 60,737
*Tiers 3-5 22.4 33,583
**Tiers 2-5 59.6 89,372
Table I10. Estimated Coverage of Mental Health and Substance Use/Addiction Services for the SH-SS Population, Aged 15 and Over.
Tier
Percentage
in need
Estimated number of
individual in-need
5 1.6 2,373
4 12.2 18,292
3 21.5 32,300
2 29.3 43,968
1 35.4 53,179
*Tiers 3-5 35.3 52,965
**Tiers 2-5 64.6 96,933
In-need:
89,372
Current
services:
1,372
Coverage:
1.5%
Current
services:
1,372
Coverage:
4.1% In-need:
33,583
**
*
In-need:
96,933
Current
services:
16,212
Coverage:
16.7%
Current
services:
16,212
Coverage:
30.6%
In-need:
52,968
**
*

88
Tier 1
Tier 2
Tier 3
Tier 4
31.0%N=62,274
36.6%N=73,552
23.0%N=46,159
8.6%N=17,311
0.7%N=1,461
Ages 15-25 (n = 200,757)
Tier 5
Tier 1
Tier 2
Tier 3
Tier 4
35.8%N=240,938
40.2%N=269,878
17.3%N=116,601
6.3%N=42,065
0.4%N=2,629
Ages 26-64 (n = 672,111)
Tier 5
Tier 1
Tier 2
Tier 3
Tier 4
67.9%N=134,611
26.2%N=51,859
3.8%N=7,562
2.1%N=4,075
0.01%N=28
Ages 65+ (n = 198,316)
Tier 5
Figure J1. Substance Use/Addiction Population
Health Pyramids, Manitoba Adults, broken by age
group
Tier 1
Tier 2
Tier 3
Tier 4
26.5%N=53,165
30.8%N=61,865
24.4%N=48,912
17.2%N=34,625
1.1%N=2,190
Ages 15-25 (n = 200,757)
Tier 5
Tier 1
Tier 2
Tier 3
Tier 4
31.2%N=209,911
30.8%N=206,705
23.4%N=157,583
12.8%N=86,055
1.8%N=11,777
Ages 26-64 (n = 672,111)
Tier 5
Figure J2. Mental Health and Substance Use/Addiction
Population Health Pyramids, Manitoba Adults, broken by
age group
Appendix J: Age Pyramids, Service Utilization and Estimated Coverage of Substance
Use and Addiction Services for Province
Tier 1
Tier 2
Tier 3
Tier 4
58.6%N=116,199
22.8%N=45,191
9.2%N=18,157
8.7%N=17,298
0.7%N=1,291
Ages 65+ (n = 198,316)
Tier 5

89
Estimated substance use service utilization rates for three sub-categories of
adults 15 and over – Table J1: 15 to 25; Table J2: 26-64 and Table J3: 65+
Table J1. Adults (15 to 25) Substance Use Service Utilization, Estimated Annual Caseload 2016-2017, by Region of Residence
Type of Service Region of Client Residence1
IERHA NHR PMH SH-SS WHRA Total
Withdrawal Management
Acute Intoxication2 - - - - 113 113
Community Residential WMS3 2 2 - - 297 301
Complexity Enhanced/Hospital Based WMS4
- - - - 28 28
Residential Services
Stabilization/Transitional5 - - - - 1 1
Supportive Recovery6 - - - - 15 15
Community Intensive Residential7 28 45 48 25 324 470
Hospital/Complexity Enhanced Residential8 15 3 2 3 15 38
Non-Residential Services
Outreach - Feedback and Engagement (e.g. Outreach, Harm Reduction, etc.)9
- - - - 395 395
Outpatient - Structured Brief Intervention10 157 221 357 199 1,209 2,143
Outpatient - Structured Comprehensive Intervention11
91 100 242 65 775 1,273
Day/Evening - Intensive Complexity Enhanced12
- 1 2 1 13 17
Non-Specialized
Hospital Inpatient13 45 154 146 37 308 690
Physician Services14 111 78 141 49 1,009 1,388
Emergency and Crisis15 - - - 108 1,653 1,761
Community Mental Health - - 104 - - 104
Total Duplicated Cases16 449 601 1,042 487 6,155 8,737
Total Estimated Unduplicated Cases 356 438 778 309 3,820 5,701

90
1 With the exception of AFM, currently based on location of service 2 Main Street IPDA 3 Main Street, AFM and YASU 4 HSC Medical WMS 5 Main Street and selected housing services 6 Primarily contracted addiction service providers 7 Primarily AFM and contracted addiction service providers 8 Selkirk Mental Health Centre 9 Primarily Resource Assistance for Youth (RaY) and Klinic 10 Primarily AFM and RaY 1 Primarily AFM and MATC 12 AFM Day Treatment, MATC and contracted addiction agencies 13 Cases reported in hospital statistics 14 Cases reported in medical claims 15 Primarily ED services and crisis 16 Duplication removed where possible, may over-estimate service utilization across service providers and/or
regions.

91
Table J2. Adults (25 to 64) Substance Use Service Utilization, Estimated Annual Caseload 2016-2017, by Region of Residence
Type of Service Region of Client Residence1
IERHA NHR PMH SH-SS WHRA Total
Withdrawal Management
Acute Intoxication - - - - - -
Community Residential WMS2 3 34 1 - 873 911
Complexity Enhanced/Hospital Based WMS3
- - - - 47 47
Residential Services
Stabilization/Transitional4 - - - - 48 48
Supportive Recovery5 - - - - 146 146
Community Intensive Residential6 85 163 89 70 1,116 1,523
Hospital/Complexity Enhanced Residential - - - - - -
Non-Residential Services
Outreach - Feedback and Engagement (e.g. Outreach, Harm Reduction, etc.)7
- - - - 2,188 2,188
Outpatient - Structured Brief Intervention8 226 433 706 268 1,975 3,608
Outpatient - Structured Comprehensive Intervention9
131 250 556 111 1,871 2,919
Day/Evening - Intensive Complexity Enhanced10
2 3 16 3 108 132
Non-Specialized
Hospital Inpatient11 183 300 409 157 1,170 2,219
Physician Services12 468 555 631 274 5,570 7,498
Emergency and Crisis13 - - - 159 2,781 2,940
Community Mental Health - - 236 - - 236
Total Duplicated Cases14 1,098 1,738 2,644 1,042 17,893 24,415
Total Estimated Unduplicated Cases 917 1,000 1,996 705 13,201 17,819
92
1 With the exception of AFM, currently based on location of service 2 Main Street, AFM and YASU 3 HSC Medical WMS 4 Main Street and selected housing services 5 Primarily contracted addiction service providers 6 Primarily AFM and contracted addiction service providers 7 Primarily Resource Assistance for Youth (RaY) and Klinic 8 Primarily AFM and RaY 9 Primarily AFM and MATC 10 AFM Day Treatment, MATC and contracted addiction agencies 11 Cases reported in hospital statistics 12 Cases reported in medical claims 13 Primarily ED services and crisis 14 Duplication removed where possible, may over-estimate service utilization across service providers and/or
regions.

93
Table J3. Adults (65+) Substance Use Service Utilization, Estimated Annual Caseload 2016-2017, by Region of Residence
Type of Service Region of Client Residence1
IERHA NHR PMH SH-SS WHRA Total
Withdrawal Management
Acute Intoxication - - - - - -
Community Residential WMS2 - - - - 8 8
Complexity Enhanced/Hospital Based WMS3
- - - - 11 11
Residential Services
Stabilization/Transitional4 - - - - 1 1
Supportive Recovery5 - - - - 15 15
Community Intensive Residential6 28 45 48 25 324 470
Hospital/Complexity Enhanced Residential7 15 3 2 3 15 38
Non-Residential Services
Outreach - Feedback and Engagement (e.g. Outreach, Harm Reduction, etc.)
- - - - - -
Outpatient - Structured Brief Intervention8 10 3 14 4 38 69
Outpatient - Structured Comprehensive Intervention9
10 - 10 1 39 60
Day/Evening - Intensive Complexity Enhanced10
- - - - 1 1
Non-Specialized
Hospital Inpatient11 45 31 77 40 303 496
Physician Services12 34 5 66 17 555 677
Emergency and Crisis13 - - - - 187 187
Community Mental Health - - 49 - - 49
Total Duplicated Cases14 142 87 266 90 1,497 2,082
Total Estimated Unduplicated Cases 91 37 197 60 902 1,347
94
1 With the exception of AFM, currently based on location of service 2 Main Street, AFM and YASU 3 HSC Medical WMS 4 Main Street and selected housing services 5 Primarily contracted addiction service providers 6 Primarily AFM and contracted addiction service providers 7 Selkirk Mental Health Centre 8 Primarily AFM and RaY 9 Primarily AFM and MATC 10 AFM Day Treatment, MATC and contracted addiction agencies 11 Cases reported in hospital statistics 12 Cases reported in medical claims 13 Primarily ED services and crisis 14 Duplication removed where possible, may over-estimate service utilization across service providers and/or
regions.
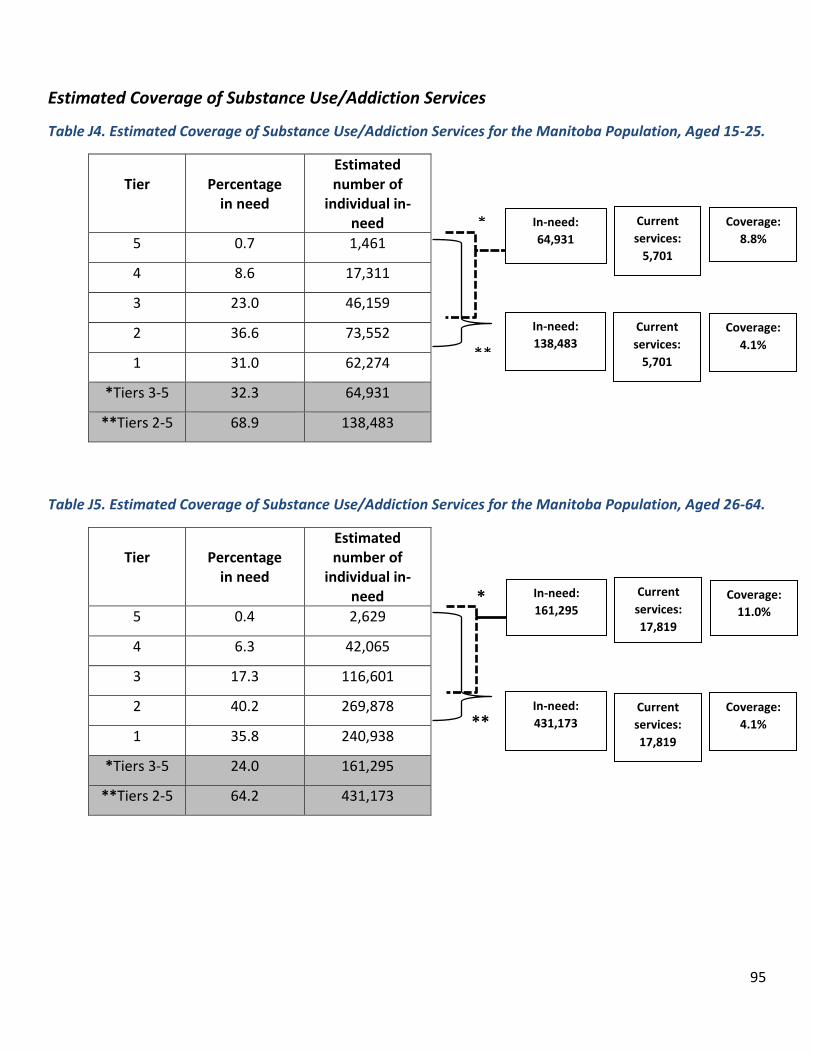
95
Estimated Coverage of Substance Use/Addiction Services
Table J4. Estimated Coverage of Substance Use/Addiction Services for the Manitoba Population, Aged 15-25.
Tier
Percentage
in need
Estimated number of
individual in-need
5 0.7 1,461
4 8.6 17,311
3 23.0 46,159
2 36.6 73,552
1 31.0 62,274
*Tiers 3-5 32.3 64,931
**Tiers 2-5 68.9 138,483
Table J5. Estimated Coverage of Substance Use/Addiction Services for the Manitoba Population, Aged 26-64.
Tier
Percentage
in need
Estimated number of
individual in-need
5 0.4 2,629
4 6.3 42,065
3 17.3 116,601
2 40.2 269,878
1 35.8 240,938
*Tiers 3-5 24.0 161,295
**Tiers 2-5 64.2 431,173
In-need:
138,483
Current
services:
5,701
Coverage:
4.1%
Current
services:
5,701
Coverage:
8.8%
In-need:
64,931
In-need:
431,173
Current
services:
17,819
Coverage:
4.1%
Current
services:
17,819
Coverage:
11.0%
In-need:
161,295
**
*
**
*

96
Table J6. Estimated Coverage of Substance Use/Addiction Services for the Manitoba Population, Aged 65 and Over.
Tier
Percentage
in need
Estimated number of
individual in-need
5 0.01 28
4 2.1 4,075
3 3.8 7,562
2 26.2 51,859
1 67.9 134,611
*Tiers 3-5 5.9 11,665
**Tiers 2-5 32.1 63,524
In-need:
63,524
Current
services:
1,347
Coverage:
2.1% **
Current
services:
1,347
Coverage:
11.5%
In-need:
11,665
*

97
Appendix K: Alternative Measures of Adults and Children/Youth Mental Health and Substance Use/Addiction
Prevalence.
Table x.x: Summary of Diagnostic Prevalence of Mental and Neurodegenerative Disorders and Rates of Suicidal Behaviours in Adults in Manitoba, 2010/11-2014/15
Age- and sex-adjusted, five-year time period
18-24 25-44 45-64 65+ 18-24 25-44 45-64 65+ Urban Rural
Psychotic Disorders (%) 2.33 1.11 1.30 2.41 9.32 2.58 2.18 2.70 7.73 No difference
Schizophrenia (%) 0.91 0.79 0.86 1.54 1.61 1.84 1.80 1.88 1.24 Urban higher
Personality Disorders (%) 0.95 2.06 1.52 1.42 2.27 1.07 1.12 1.09 1.73 Urban higher
Substance Use Disorders (%) 5.88 4.73 6.41 5.91 2.50 5.63 7.98 7.78 4.41 Urban higher
Mood and Anxiety Disorders (%) 23.16 32.92 36.56 36.32 30.45 18.06 21.39 22.32 22.82 Urban higher
Any Mental Disorder† (%) 27.57 36.11 41.78 41.65 37.17 22.73 28.56 30.16 31.26 Urban higher
Hospitalization for attempted suicidea (per 100,000) 262.15 474.20 364.19 304.04 253.94 326.51 257.30 257.35 289.25 Rural higher
Suicideb (per 100,000) 88.19 165.64 78.44 81.14 57.56 117.29 114.44 159.14 116.36 No difference
55-64 65-74 75-84 85+ 55-64 65-74 75-84 85+
10.34 3.31 13.60 41.79 59.47 3.02 11.49 40.56 64.19 No difference
a Females have a higher rate of hospitalizations for attempted suicide than males when all ages are combined (340 versus 281 per 100,000).
b Females have a lower suicide rate than males when all ages are combined (88 versus 126 per 100,000).
† Any Mental Disorder includes the following disorders: psychotic, personality, substance use, and mood and anxiety
* a linear trend test was conducted to determine if prevalence increases or decreases with each increase in income. ↑ means prevalence increased as income decreased. ↓ means
prevalence decreased as income decreased.
Income Gradient*
Mental Disorders
Suicidal Behaviours
Neurodegenerative Disorders
Dementia (%)
Age - Female Age - MaleMental Health Indicators
Manitoba
Overall
Urban vs.
Rural
Table K1. Summary of Diagnostic Prevalence of Mental and Neurodegenerative Disorders and Rates of Suicidal Behaviours in Adults in Manitoba, 2010/11-2014/15, Age- and Sex-adjusted, Five-year Time Period.

98
Mental Health Indicators Manitoba Overall
Age Groups (years)** Sex Urban vs. Rural Low Income vs High Income‡
0-5 6-12 13-19 Boys Girls Urban Rural
Mental Disorders (four-year prevalence)
Any Mental Disorder (%) 14.0 n/a 1.8 17.0 17.6† 13.3 Urban higher Low income higher No difference
Externalizing Disorders (%) 8.5 n/a 9.7 7.5 11† 5.7 Urban higher Low income higher No difference
Attention-Deficit Hyperactivity Disorder (%) 6.8* n/a 8.7 4.8 8.7† 3.5 Urban higher Low income higher High income higher
Conduct Disorder (%) 1.5 n/a 2.1 1.1 1.7† 1.2 Urban higher Low income higher No difference
Substance Use Disorders (%) 2.6 n/a n/a 2.6 2.4 2.9 Rural Higher Low income higher Low income higher
Mood and Anxiety Disorders (%) 7.3* n/a 2.2 12.0 7.2† 9.5 Urban higher Low income higher No difference
Psychotic Disorders (%) 0.75 n/a n/a 0.75 0.88† 0.55 No difference Low income higher Low income higher
Schizophrenia (%) 0.34 n/a n/a 0.34 0.45† 0.19 No difference Low income higher No difference
Suicidal Behaviours (four-year prevalence)
Suicide(per 100,00) 74 n/a n/a 74 66 84 n/a Low income higher
Attempted Suicide (per 100,00) 459 n/a n/a 459 213* 729 Rural higher Low income higher Low income higher
Developmental Disorders (lifetime prevalence)
Developmental Disorders (%) 2.9* 2.5 3.2 2.9 3.6† 1.6 Urban higher Low income higher No difference
Autism Spectrum Disorder (%) 1.4* 1.4 1.5 1.2 2.1† 0.6 Urban higher Low income higher High income higher
*indicates statistical increase from first time period (2005/06-2008/09) to second time period (2009/10-2012/13). **no testing was conducted to determine differences between age groups. †Indicates a statistical difference between boys and girls. ‡ a linear trend test was conducted to determine if prevalence increases or decreases with each increase in income. Note: n/a indicates not available for that indicator
Table K2. Summary of Diagnostic Prevalence of Mental and Developmental Disorders and Rates of Suicidal Behaviours in Children in Manitoba, 2009/10-2012/13, Age-and Sex-adjusted, Four-year Time Period
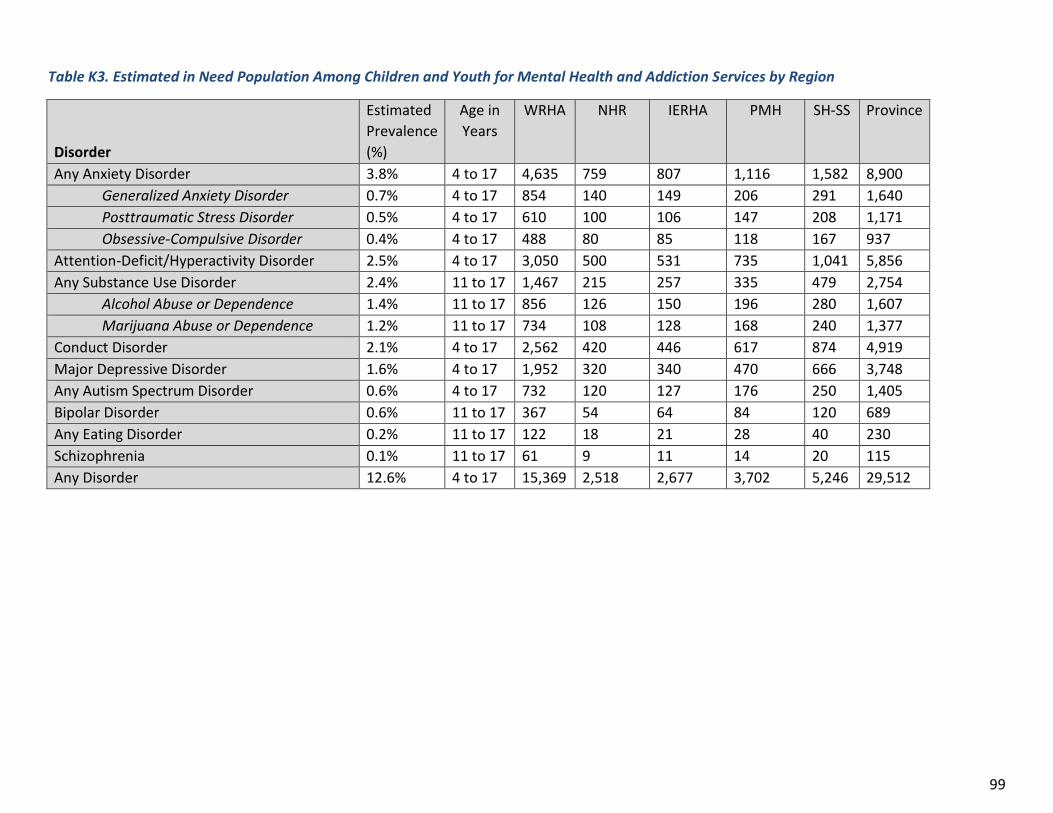
99
Table K3. Estimated in Need Population Among Children and Youth for Mental Health and Addiction Services by Region
Disorder
Estimated
Prevalence
(%)
Age in
Years
WRHA NHR IERHA PMH SH-SS Province
Any Anxiety Disorder 3.8% 4 to 17 4,635 759 807 1,116 1,582 8,900
Generalized Anxiety Disorder 0.7% 4 to 17 854 140 149 206 291 1,640
Posttraumatic Stress Disorder 0.5% 4 to 17 610 100 106 147 208 1,171
Obsessive-Compulsive Disorder 0.4% 4 to 17 488 80 85 118 167 937
Attention-Deficit/Hyperactivity Disorder 2.5% 4 to 17 3,050 500 531 735 1,041 5,856
Any Substance Use Disorder 2.4% 11 to 17 1,467 215 257 335 479 2,754
Alcohol Abuse or Dependence 1.4% 11 to 17 856 126 150 196 280 1,607
Marijuana Abuse or Dependence 1.2% 11 to 17 734 108 128 168 240 1,377
Conduct Disorder 2.1% 4 to 17 2,562 420 446 617 874 4,919
Major Depressive Disorder 1.6% 4 to 17 1,952 320 340 470 666 3,748
Any Autism Spectrum Disorder 0.6% 4 to 17 732 120 127 176 250 1,405
Bipolar Disorder 0.6% 11 to 17 367 54 64 84 120 689
Any Eating Disorder 0.2% 11 to 17 122 18 21 28 40 230
Schizophrenia 0.1% 11 to 17 61 9 11 14 20 115
Any Disorder 12.6% 4 to 17 15,369 2,518 2,677 3,702 5,246 29,512