Embed Size (px)
Citation preview

Better Schools, Better Citizens, Better Belize...It’s Everybody’s Business! MINISTRY OF EDUCATION, BELIZE
Improving access, quality and governance of education in Belize
EDUCATION SECTOR STRATEGY 2011 – 2016
March 2012

Better Schools, Better Citizens, Better Belize...It’s Everybody’s Business! MINISTRY OF EDUCATION, BELIZE
288830 D 1
07 November 2011
Improving access, quality and governance of education in Belize
EDUCATION SECTOR STRATEGY 2011 – 2016
March 2012


Better Schools, Better Citizens, Better Belize...It’s Everybody’s Business! MINISTRY OF EDUCATION, BELIZE
Improving access, quality and governance of education in Belize

Better Schools, Better Citizens, Better Belize...It’s Everybody’s Business! MINISTRY OF EDUCATION, BELIZE
Improving access, quality and governance of education in Belize
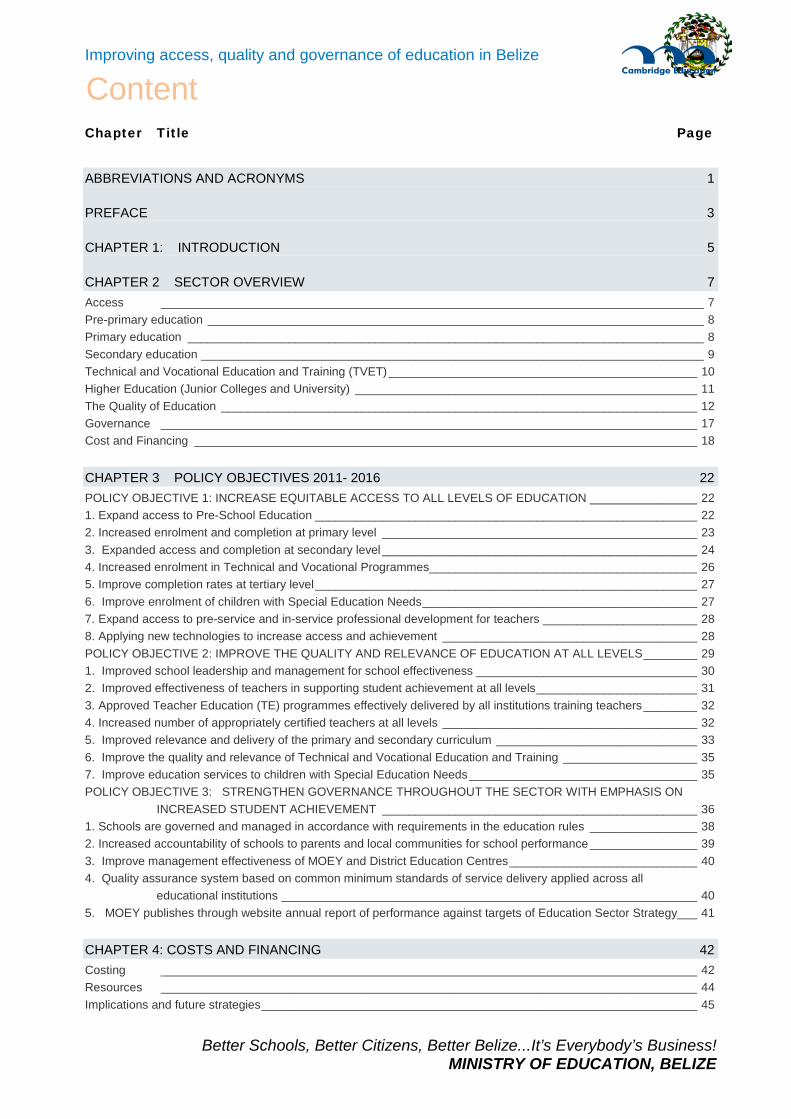
Chapter Title Page
ABBREVIATIONS AND ACRONYMS 1
PREFACE 3
CHAPTER 1: INTRODUCTION 5
CHAPTER 2 SECTOR OVERVIEW 7 Access _________________________________________________________________________________ 7 Pre-primary education __________________________________________________________________________ 8 Primary education _____________________________________________________________________________ 8 Secondary education ___________________________________________________________________________ 9 Technical and Vocational Education and Training (TVET) ______________________________________________ 10 Higher Education (Junior Colleges and University) ___________________________________________________ 11 The Quality of Education _______________________________________________________________________ 12 Governance ________________________________________________________________________________ 17 Cost and Financing ___________________________________________________________________________ 18
CHAPTER 3 POLICY OBJECTIVES 2011- 2016 22 POLICY OBJECTIVE 1: INCREASE EQUITABLE ACCESS TO ALL LEVELS OF EDUCATION ________________ 22 1. Expand access to Pre-School Education _________________________________________________________ 22 2. Increased enrolment and completion at primary level _______________________________________________ 23 3. Expanded access and completion at secondary level _______________________________________________ 24 4. Increased enrolment in Technical and Vocational Programmes________________________________________ 26 5. Improve completion rates at tertiary level _________________________________________________________ 27 6. Improve enrolment of children with Special Education Needs _________________________________________ 27 7. Expand access to pre-service and in-service professional development for teachers _______________________ 28 8. Applying new technologies to increase access and achievement ______________________________________ 28 POLICY OBJECTIVE 2: IMPROVE THE QUALITY AND RELEVANCE OF EDUCATION AT ALL LEVELS ________ 29 1. Improved school leadership and management for school effectiveness _________________________________ 30 2. Improved effectiveness of teachers in supporting student achievement at all levels ________________________ 31 3. Approved Teacher Education (TE) programmes effectively delivered by all institutions training teachers ________ 32 4. Increased number of appropriately certified teachers at all levels ______________________________________ 32 5. Improved relevance and delivery of the primary and secondary curriculum ______________________________ 33 6. Improve the quality and relevance of Technical and Vocational Education and Training ____________________ 35 7. Improve education services to children with Special Education Needs __________________________________ 35 POLICY OBJECTIVE 3: STRENGTHEN GOVERNANCE THROUGHOUT THE SECTOR WITH EMPHASIS ON
INCREASED STUDENT ACHIEVEMENT _______________________________________________ 36 1. Schools are governed and managed in accordance with requirements in the education rules ________________ 38 2. Increased accountability of schools to parents and local communities for school performance ________________ 39 3. Improve management effectiveness of MOEY and District Education Centres ____________________________ 40 4. Quality assurance system based on common minimum standards of service delivery applied across all
educational institutions ______________________________________________________________ 40 5. MOEY publishes through website annual report of performance against targets of Education Sector Strategy___ 41
CHAPTER 4: COSTS AND FINANCING 42 Costing ________________________________________________________________________________ 42 Resources ________________________________________________________________________________ 44 Implications and future strategies _________________________________________________________________ 45
Content

Better Schools, Better Citizens, Better Belize...It’s Everybody’s Business! MINISTRY OF EDUCATION, BELIZE
Improving access, quality and governance of education in Belize
CHAPTER 5: IMPLEMENTATION ARRANGEMENTS, MONITORING and RISKS 47 Implementation _______________________________________________________________________________ 47 The Monitoring and Reporting Chain ______________________________________________________________ 48 Monitoring Framework _________________________________________________________________________ 48 Risks ________________________________________________________________________________ 50
ANNEX A: Summary Framework - Policy Objectives 51
ANNEX B: M&E Evaluation Framework 52
ANNEX C: Selected Digest Stats 53
ANNEX D: List of the Key documents 54
ANNEX E: Breakdown of capital expenditure by type and subsector 55
ANNEX F: Number of infrastructure required by the main subsectors 56

Better Schools, Better Citizens, Better Belize...It’s Everybody’s Business! MINISTRY OF EDUCATION, BELIZE
1
Improving access, quality and governance of education in Belize
BBTE Belize Board of Teacher Education BJAT Belize Junior Achievement Test CCSLC Caribbean Certificate of Secondary Level Competencies CDB Caribbean Development Bank CEO Chief Executive Officer CEdO Chief Education Officer CPA Country Poverty Assessment CPD Continuing Professional Development CSB Community School Board CSEC Caribbean Secondary Examination Certificate DEC District Education Centre DM District Manager ECD Early Childhood Development ECED Early Childhood Education and Development EDUSAT Sistema de Televisión Educativa (Education Television System) ESS Education Sector Strategy ETA Education and Training Act ETES Employment and Technical Education Services FTI Fast Track Initiative GDP Gross Domestic Product GER Gross Enrolment Ratio GOB Government of Belize HGIOS How Good Is Our School? HRDS Human Resource Development Strategy IADB Inter American Development Bank ITVET Institute for Technical and Vocational Education and Training JC Junior College LSMS Living Standards Monitoring Survey MA Managing Agency MDG Millennium Development Goal MOEY Ministry of Education and Youth MTBF Medium Term Budget Framework NCTVET National Council for Technical and Vocational Education and Training NER Net Enrolment Ratio NPEAP National Poverty Eradication Action Plan NQSF National Quality School Framework NQT Newly Qualified Teacher NVQ National Vocational Qualification OECD Organisation for Economic Cooperation and Development PEFA Public Expenditure and Financial Accountability PPU Policy and Planning Unit PSE Primary School Examination PTA Parent Teacher Association PTR Pupil Teacher Ratio QADS Quality Assurance and Development Services QCFSI Quality Child Friendly School Initiative SaT Science and Technology SC School Council SEN Special Educational Needs SIB Statistical Institute of Belize SP School Principal SRS School Resourcing Services
ABBREVIATIONS AND ACRONYMS

Better Schools, Better Citizens, Better Belize...It’s Everybody’s Business! MINISTRY OF EDUCATION, BELIZE
2
Improving access, quality and governance of education in Belize
TE Teacher Education TEDS Teacher Education and Development Services TPSACES Tertiary, Post-Secondary and Adult and Continuing Education Services TSC Teaching Service Commission TRE Total Recurrent Expenditure TVET Technical and Vocational Education and Training UB University of Belize UDP United Democratic Party UWI University of West Indies

Better Schools, Better Citizens, Better Belize...It’s Everybody’s Business! MINISTRY OF EDUCATION, BELIZE
3
Improving access, quality and governance of education in Belize
I think most people will agree with me that when it comes to the potential for improving our individual and collective lives, for forming better persons and better communities, for contributing to social and economic development there are no greater expectations of any other sector than of the education sector. Indeed it is for this reason that governments across the world invest heavily in education. In Belize, where we invest in excess of 25% of our national budget in the education sector, we are certainly no exception to this rule. Compared to Costa Rica, Cuba and Barbados, Belize is the biggest spender on education and well above the international FTI benchmark of 20% of recurrent budget and has remained constant at around 6.5% of GDP over the last few years. Therefore, we are certainly at the high end of the education investment scale when we consider our education budget as a proportion of our economy. This signals the priority that the Government of Belize continues to give to the education sector.
Yet, even as we congratulate ourselves on our high standing in terms of how much we spend on education there is the simultaneous expectation, even the demand, that we should be spending more. But any honest discussion on how much we spend and how much more we may think we ought to be spending demands a sober reflection on what we are getting in return. Therefore, even as we champion education’s transformative potential, honesty demands that we question whether education is or has been truly transformative? ...And if so, for whom?
On several occasions in the past, I have made the point that many of the issues and challenges that faced us in the education sector twenty years ago remain with us today.
Today we have almost 100 thousand students enrolled in our schools at all levels—almost twice what we had in 1990, we have almost 5,000 teachers—more than twice what we had in 1990, we have 541 schools—more than twice what we had in 1990 and yes, we are spending far more on education a 190million—almost five times what we were spending in 1990.
Yet the increased spending has not been proportionately matched by increased outputs and outcomes. Many of those enrolled in our schools will repeat or dropout before graduating. Many of our children are still not achieving satisfactory levels of performance. There remains chronic shortages of trained and qualified teachers at all levels of the system. Rising costs and inadequate planning and management remain significant challenges. These very same issues were lamented more than twenty years ago in 1990 by a former Minister of Education.
Furthermore, we have been faced for some time now with the long-standing challenges of crime, violence and poverty that have continued to plague us for many years now. With media images and reports, not to mention personal experiences giving us a regular dose of crime and violence for many, many years now, can we say that education is truly transformative? With the 2009 Country Poverty Assessment showing that poverty increased by nearly 10% over about a ten year period, can we say that education is truly transformative?
On the face of it, I think we would be hard-pressed to conclude that education is or has been truly transformative for many, many years now.
In response to this apparent disconnect between education and transformative results it is easy to conclude that we are not investing enough. Yet, the record will show—as I pointed out earlier—that education expenditure has not only increased significantly over the years but has also enjoyed the lion’s share of the national budget without consequential results. And thus, it begs the question: How do we justify the continued heavy investment in education if such investment is not leading to the transformative results we desire?
PREFACE

Better Schools, Better Citizens, Better Belize...It’s Everybody’s Business! MINISTRY OF EDUCATION, BELIZE
4
Improving access, quality and governance of education in Belize
The answer to this question is that education can be truly transformative and so the challenge is not so much about investing more as it is about doing things differently! Therefore, education in Belize will be truly transformative only if we transform education. That means not investing in a more expensive status quo but changing the status quo! Any additional investment in education must be aimed at changing the status quo!
Over the last three to four years, we in the Ministry of Education and Youth, along with education stakeholders have embarked on a process of transforming the education system so that it can yield the transformative results we so desire. These initiatives have focused on ensuring every child starts school ready to learn, getting and keeping young people in schools for more years of learning, improving achievement and quality assurance and investing in teacher education and professionalization. We have made significant strides but as Fenton Whelan reminds us in his book Lesson’s Learned: How Good Policies Produce Better Schools,‘education reform is a long game—both because the process of change takes time, and because it is often decades before the benefits of improved schooling are felt in the economy or society as a whole…’ and therefore the major reforms we have initiated require sustained effort or as Michael Barber, quoted in the same book puts it, require ‘Stubborn persistence, relentless monotony, attention to detail, and glorifying in routine…’
We have come a long way! But we have a long way to go! And like any good school it is worthwhile to periodically assess how we are doing, to ask ‘how do we know?’ and then to ask ‘what we are going to do about it?’
It is in this regard that with support from the Caribbean Development Bank, we embarked on a sector diagnosis and the preparation of this Education Sector Strategy 2011-2016. The financial support from Caribbean Development Bank allowed us to secure technical assistance from Cambridge Education to assist us with this work. This strategy is a response to the education sector diagnosis which included an examination of education statistics, feedback from stakeholders (both users and providers) and an analysis of education finances.
I am sure you will agree with me when I reiterate that we do not wish to have a more expensive status quo and therefore this strategy must be about transforming the education system so that we may achieve transformative results. It must therefore be about increasing equitable access to education at all levels, about improving the quality, relevance and efficiency of education and about improving governance and accountability; in short, it must be about excellence and fairness. Let us make this sector strategy about making better schools, better citizens, and a better Belize—it’s everybody’s business!
Hon. Patrick Faber
Minister of Education, Youth and Sports

Better Schools, Better Citizens, Better Belize...It’s Everybody’s Business! MINISTRY OF EDUCATION, BELIZE
5
Improving access, quality and governance of education in Belize
Belize has made modest progress in both expanding access and improving the quality of its education system over the past ten years. The early promise of achieving the Millennium Development Goal of Universal Primary Education, though close, is no nearer now than it was in 2000, the Primary NER in 2010 is 94% compared to 95% in 2001. The much needed increase in enrolment in secondary education has not taken place, the NER in 2010 is 49% compared to 44% in 2004. Participation in tertiary education remains low compared to regional averages, and despite significant investment in technical and vocational education, participation rates there remain very low. Although there is little hard evidence regarding educational quality, there is a commonly held view that it is low: performance in national examinations at the end of the primary and secondary cycles have reached a plateau over the past decade, with small annual variations. The teaching force is largely untrained and there is much room for improvement in its management; the church -state system of management and delivery of education fails to reach its full potential and makes a common approach to establishing standards and raising quality is difficult to achieve. Despite a healthy level of investment in the sector that compares favourably with countries in the region, the overall outcomes are disappointing. The education system of Belize ought to do a lot better.
Belize enjoys a unique position in the Central America and Caribbean region: it has a small population with the lowest density on the Central American isthmus; it is the only English speaking nation in Central America, being both a member of CARICOM and the Commonwealth. It is ethnically, culturally, and linguistically diverse, though it remains peaceful and has sustained a functional parliamentary democracy since gaining full independence in 1981. Despite these potential advantages, inequality and poverty persist and Belize currently faces economic challenges, having one of the highest debt to GDP ratios. Though economic growth has been satisfactory at around 4% per annum, high unemployment constrains both economic and social development; there is a worrying increase in crime, particularly in pockets of the old capital.
It is against this backdrop of under-performance in the education sector and the need to improve human capital to increase economic growth, reduce poverty and inequality and promote greater social development and stability, that the need for a new Education Sector Strategy emerged. The present United Democratic Party government has set out in its Manifesto (2008-2013) an agenda for change committed to “improving the quality and accessibility of education”1 .
Source: United Democratic Party Manifesto 2008
The process of developing this Education Sector Strategy (ESS) was supported by the Caribbean Development Bank (CDB) and facilitated by a team of external consultants during the period April to November 2011. The strategy is based on the findings of a diagnosis of the education sector, undertaken by the team at the start of the process. This included review of recent reports and documents, analysis of latest data, consultations with key stakeholders, and school observations in each of Belize’s six districts.
_________________________ 1 Imagine the Possibilities, UDP Manifesto 2008
CHAPTER 1: INTRODUCTION

Better Schools, Better Citizens, Better Belize...It’s Everybody’s Business! MINISTRY OF EDUCATION, BELIZE
6
Improving access, quality and governance of education in Belize
The strategy itself has been produced by key stakeholders representing the wide constituency of providers and beneficiaries in education in Belize. Its formulation has centred around a series of workshops involving these stakeholders in which the key findings of the diagnosis and latest policy pronouncements led to the identification of the key policy objectives. The approach of bringing the diverse range of providers and stakeholders together through a series of workshops was adopted in response to the recognition in the diagnosis of the overly “siloed” modus operandi of MOEY, whereby the key Service Areas – already physically separated across eight different sites in the locations of Belize City and Belmopan – work relatively independently of each other. The approach adopted required close collaboration amongst the service areas as they developed common targets, strategies, and action plans to achieve the broad policy objectives. This was followed by identifying the key outputs and targets that contribute to the achievement of those policy objectives. These were then developed into specific strategies that defined the necessary approaches and actions required. Work was commenced, but is not yet finalised, by each of the central MOEY Service Areas and Districts in preparing outline Action Plans indicating how they will adopt the strategies and contribute to achieving the ESS targets.
In the following Chapter 2, a brief overview of the sector is presented, drawn from the diagnosis undertaken at the start of the process. The ESS is structured around the three policy objectives that were identified through the participatory process described above. These, together with the outputs, targets, and strategies through which they will be achieved are described in Chapter 3. Chapter 4 presents the Costs and Financing of the ESS, and the arrangements for implementation are presented in Chapter 5. The summary Policy Framework (in tabular form) is given at Annex A, and the Performance Monitoring Tables at Annex B. Select statistics are presented at Annex C and a short bibliography of key reference documents is at Annex D.

Better Schools, Better Citizens, Better Belize...It’s Everybody’s Business! MINISTRY OF EDUCATION, BELIZE
7
Improving access, quality and governance of education in Belize
The following section presents a broad overview of the education sector, summarising the key findings of the sector diagnosis and other recent commentary. It is structured around four thematic areas: access, quality, governance and financing. Equity is treated as a cross cutting theme, and gender and geographical disaggregation of data and information is used throughout.
Access
There have been significant gains in total enrolment at each level of education over the past decade (see Table 1 below), expansion keeping in line with the growth in population, though the NERs at primary and secondary level have seen little change. Tertiary level enrolment has increased by over 140%, pre-primary by 85% and secondary by 40%. Opportunities to access education are not uniform across Belize: where you live and to some extent your gender, ethnicity and, more strongly, your economic status will strongly influence those opportunities, particularly at pre-primary and post primary levels. The overwhelming majority of children in Belize go to primary school, though according to the 2010 census there remain an estimated 2235 children between the ages of 5 and 12 who are not enrolled in school, three quarters of whom live in rural areas, and half of whom are aged five. Crude counts of gender parity across basic (primary and secondary) education shows a reasonable balance; the small difference in favour of boys at the primary level is largely explained by their higher repetition rates. At the secondary level, girls start to outnumber boys (53:47) and this phenomenon widens at the tertiary level (62:38).The gradual departure of boys from formal education poses a major challenge in Belize, as it does in many countries of the region, the consequences of which are felt in terms of high levels of unemployment and rising rates of crime. Table 1: Enrolment Trends by level of education 2000-2009
2000 2001 2002 2003 2004 2005 2006 2007 2008 2009 PRE-PRIM 3559 3542 3791 3765 4412 4861 4983 5801 6034 6596
PRIMARY 56559 56794 60056 62109 63474 64516 65474 66007 66735 67008
SECONDARY 13143 13799 14630 15359 16150 16696 17321 17107 17615 18422
TERTIARY 2904 3107 3246 3254 3464 4083 5412 6972 7008
Enrolment rates show quite wide variation between Belize’s six districts, with Belize and Stann Creek showing the highest GERs at all three levels of schooling. Stann Creek’s high ranking is perhaps in part attributable to rates of repetition, but also may be influenced by the subsidy which has increased opportunity for many poorer students. The predominantly rural district of Toledo shows the greatest challenges with regard to access, currently being the only district with a primary GER below 100%.
ENROLMENT BY LEVEL OF EDUCATION 2000-2009
01000020000300004000050000600007000080000
2000 2001 2002 2003 2004 2005 2006 2007 2008 2009
PRE-PRIMPRIMARYSECONDARYTERTIARY
CHAPTER 2 SECTOR OVERVIEW
Better Schools, Better Citizens, Better Belize...It’s Everybody’s Business! MINISTRY OF EDUCATION, BELIZE
8
Improving access, quality and governance of education in Belize
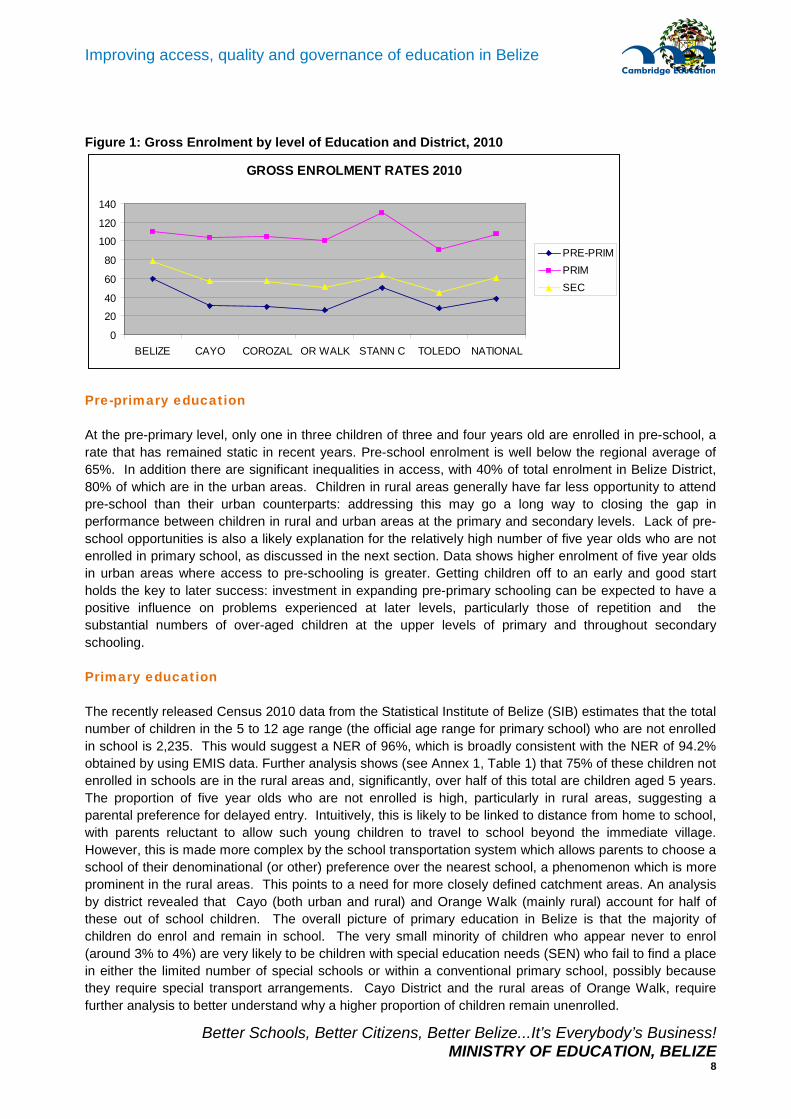
Figure 1: Gross Enrolment by level of Education and District, 2010
Pre-primary education
At the pre-primary level, only one in three children of three and four years old are enrolled in pre-school, a rate that has remained static in recent years. Pre-school enrolment is well below the regional average of 65%. In addition there are significant inequalities in access, with 40% of total enrolment in Belize District, 80% of which are in the urban areas. Children in rural areas generally have far less opportunity to attend pre-school than their urban counterparts: addressing this may go a long way to closing the gap in performance between children in rural and urban areas at the primary and secondary levels. Lack of pre-school opportunities is also a likely explanation for the relatively high number of five year olds who are not enrolled in primary school, as discussed in the next section. Data shows higher enrolment of five year olds in urban areas where access to pre-schooling is greater. Getting children off to an early and good start holds the key to later success: investment in expanding pre-primary schooling can be expected to have a positive influence on problems experienced at later levels, particularly those of repetition and the substantial numbers of over-aged children at the upper levels of primary and throughout secondary schooling.
Primary education
The recently released Census 2010 data from the Statistical Institute of Belize (SIB) estimates that the total number of children in the 5 to 12 age range (the official age range for primary school) who are not enrolled in school is 2,235. This would suggest a NER of 96%, which is broadly consistent with the NER of 94.2% obtained by using EMIS data. Further analysis shows (see Annex 1, Table 1) that 75% of these children not enrolled in schools are in the rural areas and, significantly, over half of this total are children aged 5 years. The proportion of five year olds who are not enrolled is high, particularly in rural areas, suggesting a parental preference for delayed entry. Intuitively, this is likely to be linked to distance from home to school, with parents reluctant to allow such young children to travel to school beyond the immediate village. However, this is made more complex by the school transportation system which allows parents to choose a school of their denominational (or other) preference over the nearest school, a phenomenon which is more prominent in the rural areas. This points to a need for more closely defined catchment areas. An analysis by district revealed that Cayo (both urban and rural) and Orange Walk (mainly rural) account for half of these out of school children. The overall picture of primary education in Belize is that the majority of children do enrol and remain in school. The very small minority of children who appear never to enrol (around 3% to 4%) are very likely to be children with special education needs (SEN) who fail to find a place in either the limited number of special schools or within a conventional primary school, possibly because they require special transport arrangements. Cayo District and the rural areas of Orange Walk, require further analysis to better understand why a higher proportion of children remain unenrolled.
GROSS ENROLMENT RATES 2010
0
20
40
60
80
100
120
140
BELIZE CAYO COROZAL OR WALK STANN C TOLEDO NATIONAL
PRE-PRIMPRIMSEC

Better Schools, Better Citizens, Better Belize...It’s Everybody’s Business! MINISTRY OF EDUCATION, BELIZE
9
Improving access, quality and governance of education in Belize
The very recent release of the results of the 2010 Census, and in particular the availability of new age specific data, has enabled a recalibration of both the Gross (GER) and Net Enrolment Rates (NER) from those that informed the sector diagnosis. Based on the latest available Statistical Institute of Belize (SIB) data, the Primary GER is 107.0% (previously reported as 93%) and a Primary NER of 94.2% (previously reported as 84%). The trend therefore over the past decade is static in terms of the NER (95% in 2001), though the GER shows an increase (from 101% in 2001), reflecting the continuing problem with repetition in the system, though again the overall repetition rates have declined steadily from 9.7% to 7.2% over the past decade. There is no major variation between boys and girls in terms of access to primary education; boys marginally outnumber girls (51% to 49%) with a gender parity index of 0.96. The difference is uniform across all districts. The difference is explained by the higher repetition rates experienced by boys than girls; boys having an overall repetition rate of 8.4% compared to 6.0% for girls. In terms of district variation, only Toledo shows a GER of less than 100%.
Issues of access to the various levels of education in Belize are not so much to do with a lack of places, though there are clearly some remaining inequalities of opportunity between districts at the secondary level, but more an issue of progression and retention. What characterises enrolment at both the primary and secondary level is high levels of repetition and, at the secondary level, high levels of drop out. Table 2 Primary school repetition rate by district and grades 2008-2009
Inf. I Inf. II Std. 1 Std.2 Std. 3 Std. 4 Std. 5 Std. 6 Total
Belize 11.9 5.9 5.4 5.0 4.0 4.5 0.7 2.2 5.0
Cayo 10.2 6.6 7.1 4.8 6.1 2.9 3.5 1.0 5.5
Corozal 13.7 8.2 6.9 7.5 8.3 7.2 7.0 0.1 7.5
Orange Walk 14.8 10.1 9.1 6.5 8.8 8.5 5.2 1.7 8.4
Stann Creek 12.0 6.6 7.0 5.8 6.4 4.9 4.1 0.4 6.2
Toledo 17.1 13.2 10.5 9.5 11.3 3.4 8.5 2.1 10.0
Average 13.28 8.34 7.67 6.52 7.48 5.23 4.83 1.25 7.10 Source: Policy and Planning Unit, MoEY, 2011
Currently, only two in every five children complete primary school in the stipulated eight years. There is significant variation in repetition between districts, as well as between grades, and boys repeat more than girls. Higher repetition rates are experienced in the early grades (14% in Infant 1) and decline gradually to their lowest in Standard 6 (average 1.3%), suggesting the need for increased Early Childhood Education programmes. The net result of this is that by the end of the primary cycle over half the children are overage, and 20% are at least two years older than the official age. More information is needed on early year’s repetition, including investigating reported practices of a nine year primary cycle offered in some schools, and reporting kindergarten and Infant 1 as a single year.
Secondary education
As with the primary sub-sector, the recently released 2010 Census data has enabled a revision of the GER and NER for the secondary level. Based on the latest SIB data the secondary GER is 63.5% (previously reported using 2008/09 EMIS as 53%) and the NER is 48.9% (previously reported using 2008/09 EMIS as 40.7%). Using these revised rates, the overall trend over the past decade has been one of marginal increase, the GER and NER improving from 59.2% and 45.1% respectively since 2003/4. Even with revised statistics,, the desired policy to increase secondary enrolment espoused in the National Poverty Eradication and Action Plan (NPEAP) 2008-2011 has not yet been fully realised, though transition rates from primary to secondary have improved, reaching 89.2% in 2009/10.

Better Schools, Better Citizens, Better Belize...It’s Everybody’s Business! MINISTRY OF EDUCATION, BELIZE
10
Improving access, quality and governance of education in Belize
There is marked variation between districts in terms of the GER: Belize has the highest GER at 82%, with Orange Walk now showing the lowest at 50% and Toledo at 51% (2009/10 EMIS data). There is an equally significant difference between rural and urban areas in terms of access, though the data is not an accurate predictor as the school transportation programme provides free bus routes for rural students to attend schools in the main towns. Despite Belize’s predominantly rural population, the location of schools is skewed towards the urban centres. The table below summarises the coverage showing the number of secondary aged students in the population (note: not enrolment) per school. This shows that the young people in the rural areas of Toledo, Stann Creek and Orange Walk are the least well served, whilst all urban areas other than Corozal are better served than any rural area. Table 3. Average number of secondary aged students per school
BEL CAY COR ORW STC TOL NAT
RURAL 555 755 543 919 1176 1347 786
URBAN 355 540 871 270 501 463 417
Despite good transition rates from the primary to secondary levels, averaging 89.2% nationally (2009/10), there is both high drop out and high repetition at the secondary level. Figure 2 shows the difference in enrolment across the four forms of secondary schooling and highlights the problem of drop out - total enrolment in Form 4 is only 57% of that of Form 1. While there are clearly equity issues regarding opportunities of access to secondary education, the bigger problem is what happens to students during the secondary cycle, so that by Form 3, almost 60% of students are over age, half of whom are two years older than the prescribed age. This is likely to have a significant impact on student attitude to school and explain the resistance shown by older students to what school has to offer - to school rules and authority. Further research is clearly needed here to understand practices and policies around repetition, and how it is monitored and managed in schools. The new Secondary School Financing Policy can be expected to change attitudes to drop out and repetition in schools. Figure 2: Enrolment by Form at Secondary level
Source: MOEY Statistical Digest 2009/10
Technical and Vocational Education and Training (TVET)
The provision of Technical and Vocational Education and Training (TVET) in Belize remains problematic, and despite substantial investment, increases in enrolment have been disappointing. The four centres that were already established in 2001 have seen no increase in enrolment - the national increase is attributable to the opening of new centres in Orange Walk and Stann Creek. The facilities at the six ITVETs are good, but are under-utilised. In two cases, Toledo and Stann Creek, this may be explained by the location of the ITVET centres, which are outside the main towns – in the case of Toledo, significantly so (26 miles), making the centre difficult to access, though there is a free bus service from Punta Gorda. Each of the six
3091
2264
1839
1470
3169
2503
2180
1748
0
500
1000
1500
2000
2500
3000
3500
FORM 1 FORM 2 FORM 3 FORM 4
MALE
FEMALE

Better Schools, Better Citizens, Better Belize...It’s Everybody’s Business! MINISTRY OF EDUCATION, BELIZE
11
Improving access, quality and governance of education in Belize
centres has a national capacity for 200 full –time students, which, with some more creative planning and timetabling could be increased.
Access to ITVET is either following completion of Form 4, for full time National Vocational Qualification (NVQ) programmes, or from various stages of education for entry to the pre-vocational programmes, designed to provide the necessary levels of prior learning and knowledge needed to access NVQ programmes.
The broader issue regarding TVET is the sub-sector’s articulation with secondary education, and the prevalent and persistent view that TVET options are for the less academically inclined student, who must opt for this as a last resort having failed to secure a place in a junior college, or in regular secondary school. Table 4: TVET Enrolment 2000/1 – 2008/09
2000/01 2001/02 2002/03 2003/04 2004/05 2005/06 2006/07 2007/08 2008/09
Belize 287 277 229 240 248 196 253 256 296
Male 243 247 200 218 222 175 199 150 187
Female 44 30 29 22 26 21 54 106 109
Cayo 191 158 103 109 91 101 217 230 184
Male 110 91 72 77 63 73 146 147 114
Female 81 67 31 32 28 28 71 83 70
Corozal 57 43 42 153 122 32 24 35 60
Male 32 28 29 77 69 17 5 13 28
Female 25 15 13 76 53 15 19 22 32 Orange Walk 0 0 0 0 0 0 93 119 117
Male 0 0 0 0 0 0 79 104 98
Female 0 0 0 0 0 0 14 15 19
Stann Creek 0 0 0 0 0 0 0 87 102
Male 0 0 0 0 0 0 0 43 59
Female 0 0 0 0 0 0 0 44 43
Toledo 57 30 55 31 28 40 78 33 38
Male 46 19 33 21 18 30 59 22 37
Female 11 11 22 10 10 10 19 11 1
Total 592 508 429 533 489 369 665 760 797 Male 431 385 334 393 372 295 488 479 523
Female 161 123 95 140 117 74 177 281 274
Source: Policy & Planning Unit, MOEY
Higher Education (Junior Colleges and University)
There has been a steady increase in enrolments at the tertiary level, showing a 66% increase between 2004, when total enrolment was 4,200, and 2009/10 when it passed 7,000. Females outnumber males in the ratio of 62:38 at the tertiary level. Enrolment in Junior Colleges, which offer the Associate Degree programmes, has doubled over the past decade, largely as a result of an increase from six to ten in the number of Junior Colleges. Enrolment favours the urban areas where the majority of colleges are situated. Rural students are disadvantaged in having to find both transport and accommodation costs if they attend urban colleges away from their home.

Better Schools, Better Citizens, Better Belize...It’s Everybody’s Business! MINISTRY OF EDUCATION, BELIZE
12
Improving access, quality and governance of education in Belize
Similarly, university enrolment has continued to expand annually, with enrolment passing 4,000 in the 2009-2010 academic year. The University of Belize accounts for by far the largest share of enrolment (3,714) with the private Galen University having an enrolment of 288. These two universities make up 90% of Belize’s total university enrolment, the rest either pursuing open and distance courses, largely with the University of the West Indies (UWI), or at universities outside Belize. Females dominate enrolment, accounting for two-thirds of the total. Even in programmes that traditionally tend to be male dominated, such as business and natural sciences, girls outnumber boys.
Despite this progress, gross enrolment rates estimated at between 10% and 13% are at best still less than half that of the regional average (27%) and on par with Central American neighbours Honduras and El Salvador. There are several reasons for such low participation rates. Relatively low completion rates at the secondary level, coupled with poor levels of learning achievement fail to generate enough qualified demand for higher education. Cost is also a significant factor, as despite support from MOEY, the cost of attending university full-time is beyond the reach of the majority. Access favours those who live closest, so rural populations are further disadvantaged by additional costs associated with travel and accommodation. It is striking that open and distance approaches to higher education qualifications are not being developed in Belize; this is clearly a potential role for the University of Belize.
The Quality of Education
The quality of an education system is generally judged nationally through student performance in national examinations and internationally through participation in global studies and surveys, such as PISA and TIMMS2. Belize does not participate in any of the global surveys although it is a member of the Caribbean Examinations Council (CXC). There are no recent comparisons of performance across the region and CXC itself does not publish summary reports.
At the Primary level, there is no evidence of significant change in performance over the past decade. Average scores are higher in urban areas, though a third of children who sit the PSE score less than 50%. This rises to 40% in rural areas. Orange Walk urban has the highest achievement, with only 13% failing to score 50%, whereas rural Cayo, Stann Creek and Toledo all have in excess of 40% failing to achieve the 50% mark. Although, overall, the performance of the southern districts of Stann Creek and Toledo lag behind the rest of Belize, rural students there perform equally well, or equally badly, as rural pupils elsewhere.
_________________________ 2 PISA TIMMS
Better Schools, Better Citizens, Better Belize...It’s Everybody’s Business! MINISTRY OF EDUCATION, BELIZE
13
Improving access, quality and governance of education in Belize
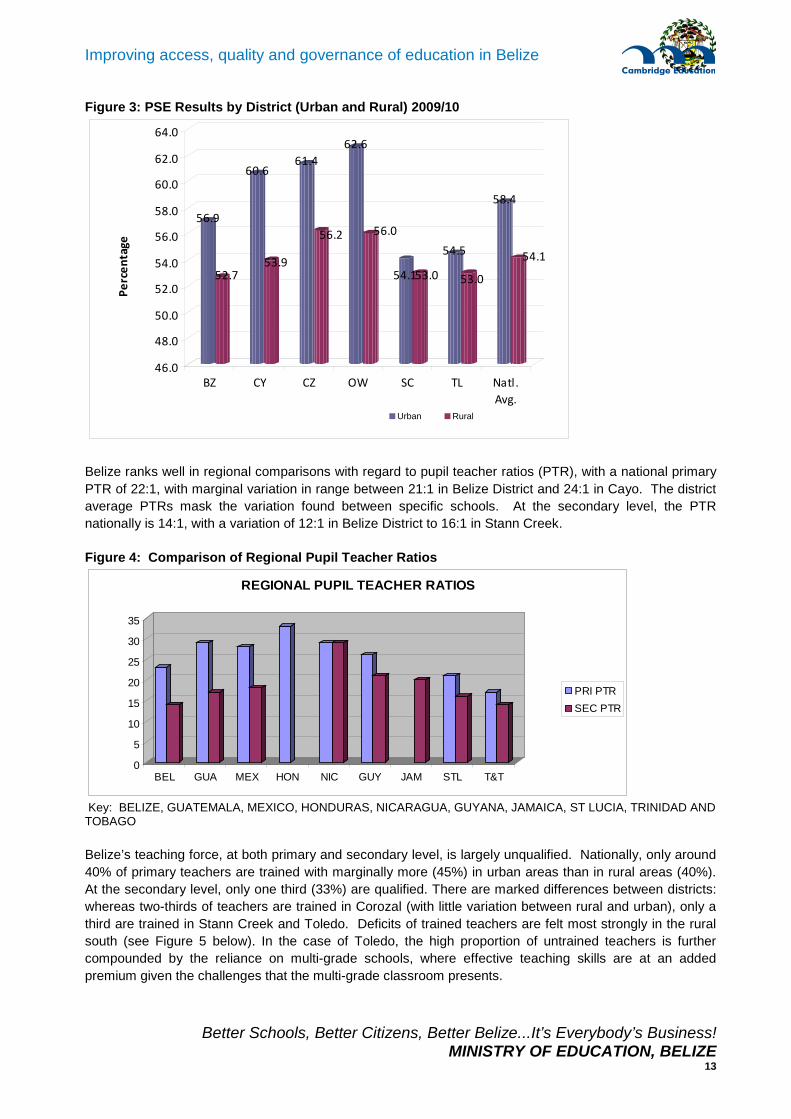
Figure 3: PSE Results by District (Urban and Rural) 2009/10
Belize ranks well in regional comparisons with regard to pupil teacher ratios (PTR), with a national primary PTR of 22:1, with marginal variation in range between 21:1 in Belize District and 24:1 in Cayo. The district average PTRs mask the variation found between specific schools. At the secondary level, the PTR nationally is 14:1, with a variation of 12:1 in Belize District to 16:1 in Stann Creek. Figure 4: Comparison of Regional Pupil Teacher Ratios
Key: BELIZE, GUATEMALA, MEXICO, HONDURAS, NICARAGUA, GUYANA, JAMAICA, ST LUCIA, TRINIDAD AND TOBAGO
Belize’s teaching force, at both primary and secondary level, is largely unqualified. Nationally, only around 40% of primary teachers are trained with marginally more (45%) in urban areas than in rural areas (40%). At the secondary level, only one third (33%) are qualified. There are marked differences between districts: whereas two-thirds of teachers are trained in Corozal (with little variation between rural and urban), only a third are trained in Stann Creek and Toledo. Deficits of trained teachers are felt most strongly in the rural south (see Figure 5 below). In the case of Toledo, the high proportion of untrained teachers is further compounded by the reliance on multi-grade schools, where effective teaching skills are at an added premium given the challenges that the multi-grade classroom presents.
56.9
52.7
60.6
53.9
61.4
56.2
62.6
56.0
54.153.0
54.5
53.0
58.4
54.1
46.0
48.0
50.0
52.0
54.0
56.0
58.0
60.0
62.0
64.0Pe
rcen
tage
BZ CY CZ OW SC TL Natl.Avg.
Urban Rural
0
5
10
15
20
25
30
35
BEL GUA MEX HON NIC GUY JAM STL T&T
REGIONAL PUPIL TEACHER RATIOS
PRI PTRSEC PTR

Better Schools, Better Citizens, Better Belize...It’s Everybody’s Business! MINISTRY OF EDUCATION, BELIZE
14
Improving access, quality and governance of education in Belize
Figure 5: Ratio of Trained Primary Teachers per Pupil by District 2009/10
At the primary level, a quarter of all schools are multi-grade, with Toledo having over half of its primary schools designated multi-grade. Multi-grade teaching poses significant challenges which are compounded by high numbers of untrained teachers, most of whom will have received no special training in the skills required for these schools. Whereas multi-grade schools are frequently inevitable in small, remote rural communities, the way primary schools are established and managed by the various church denominations exacerbates problems and challenges. This is because a number of small, differently managed schools are allowed to co-exist in close proximity to each other.
Added to these complexities, is a school transportation policy that supports a relatively high degree of choice for parents as to where they school their children. Parental choice is largely expressed on denominational grounds, though perceptions of school quality and cost are also likely to be factors. Poorer parents are most likely to select schools with lower fees. Any changes to the transportation policy leading to restriction of the free bus service to the nearest school needs to be accompanied by action on fees so that poorer parents are not disadvantaged.
There is a strong interrelationship between access and the quality and relevance of education. The characteristics noted regarding access, particularly those of repetition and drop out, are directly related to the quality of education. Children repeat years because they have failed to achieve a requisite standard to progress to the next level and are held back by schools in the hope that another year will resolve the under-achievement. The efficacy of this policy is generally contested and there is some global evidence from developing education systems to suggest that such an approach has little impact in improving achievement. There is no valid research from within Belize on the impact of frequent repetition.
The National Curriculum has been in place in primary schools since 2002 although there is uncertainty regarding the degree of compliance expected by MOEY. Equally, schools are uncertain about the degree to which the curriculum can be adapted to meet the specific needs of their students. A number of key issues emerged in the sector diagnosis which were more to do with the delivery of the curriculum rather than curriculum itself. The aims of the Belizean National Curriculum are aligned with current international thinking around a 21st century curriculum in promoting learners who have skills, knowledge, competencies, and attitudes that enable them to adapt to the changes around them and to process and manage information in a myriad of forms. Such is the aspiration, but not the practice. Teachers, principals and managers place heavy focus on coverage of the content and information rather than the development of skills and competencies. There is too great an emphasis placed on planning and reporting on curriculum coverage, with insufficient attention being paid to what pupils are actually learning and making the curriculum stimulating, relevant and accessible to the full range of pupils. Testing casts a heavy shadow over the later years of primary schooling. With the PSE looming, teaching narrows to examination preparation, limiting time spent on other aspects of the curriculum. In addition, there is a lack of capacity in
RATIO OF TRAINED PRIMARY TEACHERS PER PUPIL
0
20
40
60
80
100
BEL CAY COR OWK STC TOL NAT
URBANRURAL

Better Schools, Better Citizens, Better Belize...It’s Everybody’s Business! MINISTRY OF EDUCATION, BELIZE
15
Improving access, quality and governance of education in Belize
many schools to approach the curriculum in such a way to create opportunities for learners to experience vocational and practical curricular opportunities. Vocational and practical subjects are under valued and this has a negative impact on attitudes and perceptions that affect engagement with and transfer into vocational education. Realism in terms of what teachers are able to handle, with a focus on the basic core responsibilities – particularly on literacy and numeracy at the primary level – is the building block for subsequent success and diversification.
Curriculum articulation within and between school phases – primary to secondary - is generally weak. Curriculum implementation is highly dependent upon the skills and interests of individual teachers, especially in schools where there is infrequent or ineffective monitoring by school leaders or district personnel. This results in discontinuity in curriculum coverage and lack of engagement for some students because the curriculum is not differentiated to meet their needs.
There is generally a lack of appropriate assessment skills and techniques and the use of assessment information to improve learning, whether of the individual student or of the school as a whole. At present, the national curriculum framework does not make explicit the link between curriculum and assessment. This, more than revision of the curricular content, needs urgent attention and action. The system is very reliant on summative testing as opposed to formative assessment, and as yet places no emphasis upon, and provides little incentive for, the use of the latter. As a result teachers lack the necessary skills in ongoing and systematic assessment of what their pupils are actually learning and what skills they are developing. There is little effective use of learning assessment information and data, either at the school level or on a national scale, to inform programmes and teaching.
At the secondary level, the curriculum is modelled around the CSEC examinations. It is thus formed around a group of subjects with a heavy academic bias. There is no common national examination or graduation certificate in Belize; anecdotal evidence from consultations during the diagnostic study suggests a degree of frustration amongst poorer secondary students who miss the CSEC examinations because of the high fees. There is very weak articulation between the academic courses of secondary schools and the more practical, work-oriented programmes associated with the TVET programmes. A few senior technical schools, such as Julian Cho in Toledo, are attempting to offer a balanced curriculum but appear to struggle with a lack of resources, though the new financing formula should start to address this problem. As previously noted , access to ITVET following Form 4 completion, where it competes with the academic Associate Degree programmes of the Junior Colleges and Universities, is generally perceived as an inferior option. This may partly explain their low enrolment and high drop out rates. ITVETs also offer a range of pre-vocational programmes, largely targeting young people who have prematurely left formal schooling. Although these programmes on completion offer preparation to full TVET courses, they remain associated with a sense of academic failure and the notion of a ‘last resort’ option.
The Quality Child Friendly School Initiative (QCFSI) aims to strengthen school leadership through increased autonomy, responsibility, and accountability and improve the quality of student experience. The underlying concepts, principles, and processes have been derived from the Scottish framework of school accountability: How Good is our School? (HGIOS) Effective school self evaluation and accountability is seen as central to school improvement and effectiveness policy in Scotland, England, Australia and some districts in the USA.
Although it is too soon to know whether outcomes from the QCFSI pilot show a benefit to the quality of the students’ educational experience and achievements, feedback from principals who engaged in the pilot phase was very positive. They valued the opportunity to have some autonomy to modify the curriculum, make choices about resources and to work collaboratively with other schools and district personnel. The initiative has much to recommend it, starting as it does with the well researched premise that the most successful schools know what they do well and can identify areas for improvement. Managed through

Better Schools, Better Citizens, Better Belize...It’s Everybody’s Business! MINISTRY OF EDUCATION, BELIZE
16
Improving access, quality and governance of education in Belize
clear objectives and well defined success criteria, the initiative has the potential for building capacity in school leadership and improving the quality of education in Belize. Successful schools, where leadership is established and outcome-focused, can be used to assist others. Support, such as coaching and mentoring, from credible, successful peers is a proven and cost-effective strategy for building capacity and establishing consistency across Belizean schools. Successful schools may become centres of good practice and could be used to support the training and development of teachers. However, all of this is predicated on success criteria for the initiative so that stakeholders are clear about the aims of the project, how they will be achieved and, importantly, what success will look like. Transparency is important so that all schools know why schools have been included in the initiative and what they are expected to achieve.
MoEY is aware that a process of change management in schools and districts is a pre-requisite to implementation. As the initiative rolls out to its next phase, very detailed planning is needed so that the principles are underpinned by a sound operational and budgetary structure. The pace of growth for this initiative should be in proportion to the level of resource available to support it. Operational support as well as robust monitoring and evaluation strategies are essential if it is to achieve its aim.
Little work has been done to understand the impact that Belize’s diverse language background has on educational processes and achievements. Less than one in every twenty-five Belizeans has English as their mother tongue, yet English is the official language (and Creole is the lingua franca) and, most significantly, the language of instruction throughout education. Anecdotal evidence suggests that English medium education is attractive to Hispanic speakers and a pull factor from neighbouring countries, and that Spanish speakers generally acquire English quickly in school and develop strong second language proficiency. Conversely, Creole speakers appear to struggle more with English, in all probability because of Creole’s close proximity to English which allows for easy establishment of oral communication. Unusually, Belizean Creole has a written form, though it is unwise to speculate on the extent to which this may or may not impede the later development of written accuracy in English needed in school programmes. International evidence points strongly towards the advantage of establishing early literacy in a child’s mother tongue which becomes the basis for developing skills in second and further languages. This does not happen in Belize, at least not formally, though during field visits undertaken in preparation of this strategy there was some evidence of bilingual (English and Spanish) approaches being used by teachers in early grades. It should be noted, however, that teachers have no formal training in such methods. In conclusion, language needs further research from which a better understanding can be gained regarding the impact of Belize’s diversity upon an English language education system. School level data can be used to assess the extent to which language impacts learning, from this policy and strategy can be built to maximise the benefits and minimise the consequences of multilingualism and its impact on learning achievement.
There is little current evidence of ICT being used effectively and productively across the education system. Currently, very few primary schools and not all secondary schools have internet connectivity and the availability of ICT facilities in schools is neither systematic nor standardised, frequently being the result of donation of dated equipment. Whilst there is a general acknowledgement in Belize of the potential benefits of ICT in education, policy remains unclear and understandably ambivalent given the likely scale of both initial investment and on-going costs. International evidence is variable, though the OECD reported in 2005 on the benefits of more dynamic interactions between schools and teachers, increased teamwork, improved self monitoring of learning by students and improved problem solving. Evidence in Scotland has pointed to improved achievement, particularly of boys. What is clear is that young people need ICT skills and familiarity with a range of applications to be able to function fully in modern society. For the better off, much of this is gained outside of school, adding a digital divide to an existing social divide. Schools therefore have a potentially important role to play in promoting greater equity in terms of ICT skills. ICT has great potential to reach into remote locations and reach under-served communities (e.g. support to multi-grade schools or access to secondary courses). ICT is also a great untapped resource in terms of work
Better Schools, Better Citizens, Better Belize...It’s Everybody’s Business! MINISTRY OF EDUCATION, BELIZE
17
Improving access, quality and governance of education in Belize
force training through continuous professional development programmes delivered at home or in the work place through on line, radio, televised or electronically recorded media. Video conferencing facilities at each DEC would save considerable time and cost in travel by officers to centrally convened meetings.
Governance
The legislative and policy context for education in Belize is governed by the Education and Training Act of 2010. However, the education act, while covering roles and responsibilities, does not set out any sets of values, principles or priorities for delivery of education. As yet the provisions of the new act have not yet been fully interpreted in regulations, resulting in continuing poor coordination and lack of clarity around standards, which makes it difficult to effectively manage and monitor performance.
A number of potentially important bodies are beginning to play a more influential role in helping deliver a better education service. The Teaching Services Commission and the recently constituted Belize Board of Teacher Education (BBTE) are beginning to play a more effective role in Belize’s effort to improve its education system. The BBTE has, for example, already drafted all important standards for school leadership in response to the acknowledged weakness in this area.
The delivery of education in Belize is dominated by a church and state system, with only 15% of pre-primary, 19% of primary and 33% of secondary schools being solely managed by government. Whilst such partnership is potentially a highly effective way of sharing responsibility and cost, current arrangements are insufficiently robust, resulting in very poor levels of accountability, no application of common standards, and poor monitoring of school performance. In particular, it is the lack of accountability that hinders efforts to improve the quality of education. This is manifest at several levels, in particular between MOEY, who provide the majority of the financing for basic education, and school managers. There is little control over the decisions on where to open schools, no consistent merit-based criteria applied to the appointment of principals, or indeed to the selection of managers, no coherent way of monitoring school performance against common standards and no way in which individual schools are held accountable for performance by either their management or MOEY. Equally there is weak accountability between schools and parents, despite the cost sharing arrangements whereby parents contribute substantially to running costs.

Better Schools, Better Citizens, Better Belize...It’s Everybody’s Business! MINISTRY OF EDUCATION, BELIZE
18
Improving access, quality and governance of education in Belize
Figure 6: Number of schools by Management 2009/10
Monitoring and supervision of schools is undertaken by the DECs. This largely focuses on primary schools, DECs having less authority and influence over secondary schools. Belize is moving toward the establishment of an inspectorate and a Chief and Deputy Chief Inspector have been identified who will develop inspection framework and processes and train teams of school inspectors to be contracted for conducting school inspections. Currently, the function of school supervision is performed by DECs, who undertake a full supervision of schools once every three years and “spot checks” once a term. Whilst this process seems to have shifted from a “judgemental”
form of inspection to more supportive supervision – and a good relationship between DECs and schools is much in evidence in Belize – there is no coherent or publicly available record of school performance and no capacity to formally monitor progress against standards or targets over time. Other than examination results, which in themselves only tell part of the story, there is no coherent way of knowing, year on year, how the system is doing. In recent years the QCFSI has attempted to define common standards, and this initiative is being gradually extended to all primary schools in Belize. Evaluation results of the initial pilot are expected soon, but it is clear that this initiative needs to be more widely owned across key parts of the system, most significantly by those involved in teacher training and professional development. The underlying concept of a single set of minimum standards needs to be more rapidly applied across all schools, and form the basis on which greater accountability can be achieved in the system.
Leadership emerges at all levels of the system as a weakness, and nowhere is this more important or more acutely felt than at the school level. Teachers are in any system the key agents that can drive change: teacher salaries take up the dominant share of the budget, and day in day out it is the interface between pupils and teachers that is central to learning achievement. Yet management of the teaching force is weak, with no effective monitoring and only the basic level of controls of conduct applied at school level. Observation and anecdotal evidence suggests there are some very good principals in Belize, but equally there are less effective ones. Very few have received any special training, there are no widely held or applied standards applied to the cadre, though as indicated above BBTE has defined these, and there are no systematic checks applied by school managers who tend to focus on administrative tasks rather than managing the quality of education in their schools and taking an active role in supporting improvement. There is currently no training in school leadership.
Cost and Financing
The GOB’s commitment to education has been strong over the last decade. Actual education expenditure as a proportion of total recurrent expenditure has exceeded 22% for the last nine years (CPA, 2009). More recently, education’s share has risen and remained constant at 26% with an annual real growth rate of six per cent - in 2010 actual expenditure was BZ$ 180 million up by BZ$5 million on the year before. In the region, Belize is the biggest spender on education3, higher than Costa Rica, Cuba, and Barbados and well above the FTI benchmark of 20%. As a proportion of GDP, education expenditure has remained constant
_________________________ 3 Based on the data available in the UIS 2011 for the country grouping North America for the year 2009
Source: MOEY Education Statistical Digest 2009/10
28 5617
123211 25
4230
10
0%
10%
20%
30%
40%
50%
60%
70%
80%
90%
100%
PRE-PRI PRIM SEC
PVT
GOV-AID
GOV
Better Schools, Better Citizens, Better Belize...It’s Everybody’s Business! MINISTRY OF EDUCATION, BELIZE
19
Improving access, quality and governance of education in Belize
at around six and a half per cent over the last few years, marginally lower than Saint Vincent and the Grenadines and Barbados (in 2009).
Capital expenditure accounts for a small and reducing share of total education expenditure: falling from 10 to one per cent between 2007 and 2010. This is due to i) the small and shrinking allocation of the capital budget to the education sector, ii) in nominal terms, the overall reduction in the GOB’s capital investment programme and iii) the reduction in the number of externally financed projects. However, the funds which were allocated to the education sector were fully disbursed and went largely to the secondary (33%) and TVET sectors (23%) in 2009.
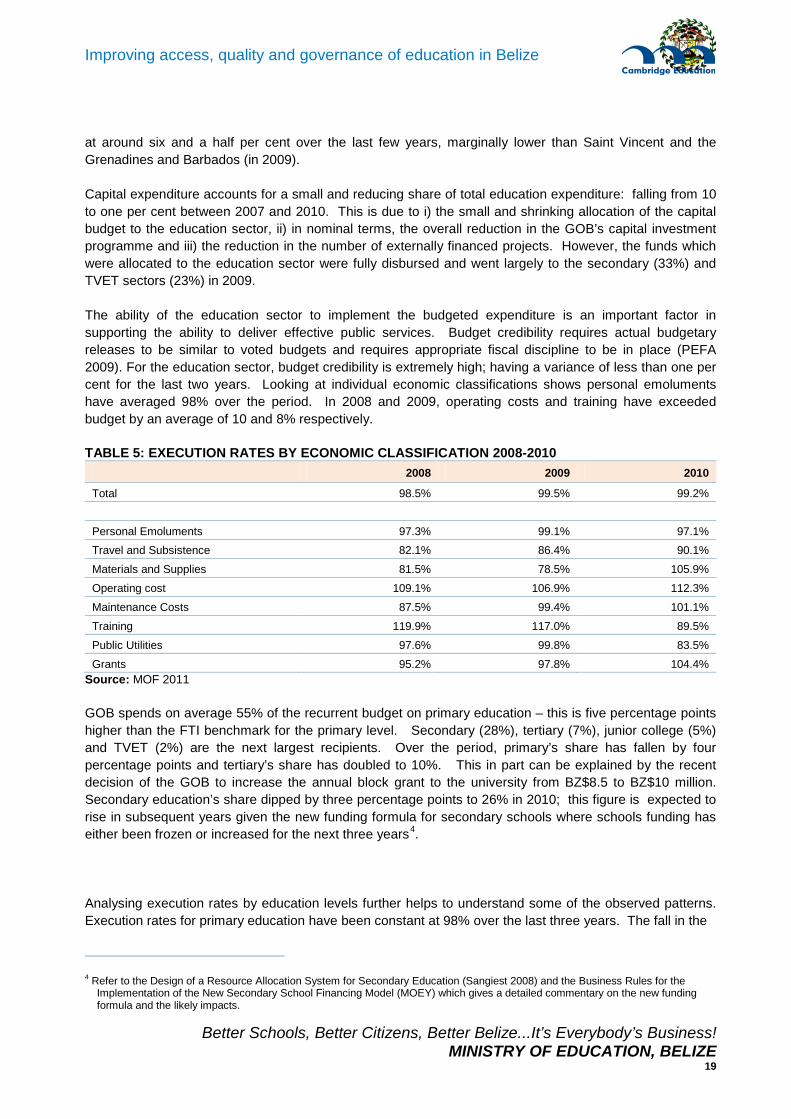
The ability of the education sector to implement the budgeted expenditure is an important factor in supporting the ability to deliver effective public services. Budget credibility requires actual budgetary releases to be similar to voted budgets and requires appropriate fiscal discipline to be in place (PEFA 2009). For the education sector, budget credibility is extremely high; having a variance of less than one per cent for the last two years. Looking at individual economic classifications shows personal emoluments have averaged 98% over the period. In 2008 and 2009, operating costs and training have exceeded budget by an average of 10 and 8% respectively. TABLE 5: EXECUTION RATES BY ECONOMIC CLASSIFICATION 2008-2010
2008 2009 2010
Total 98.5% 99.5% 99.2%
Personal Emoluments 97.3% 99.1% 97.1% Travel and Subsistence 82.1% 86.4% 90.1%
Materials and Supplies 81.5% 78.5% 105.9%
Operating cost 109.1% 106.9% 112.3%
Maintenance Costs 87.5% 99.4% 101.1%
Training 119.9% 117.0% 89.5%
Public Utilities 97.6% 99.8% 83.5%
Grants 95.2% 97.8% 104.4% Source: MOF 2011
GOB spends on average 55% of the recurrent budget on primary education – this is five percentage points higher than the FTI benchmark for the primary level. Secondary (28%), tertiary (7%), junior college (5%) and TVET (2%) are the next largest recipients. Over the period, primary’s share has fallen by four percentage points and tertiary’s share has doubled to 10%. This in part can be explained by the recent decision of the GOB to increase the annual block grant to the university from BZ$8.5 to BZ$10 million. Secondary education’s share dipped by three percentage points to 26% in 2010; this figure is expected to rise in subsequent years given the new funding formula for secondary schools where schools funding has either been frozen or increased for the next three years4.
Analysing execution rates by education levels further helps to understand some of the observed patterns. Execution rates for primary education have been constant at 98% over the last three years. The fall in the
_________________________ 4 Refer to the Design of a Resource Allocation System for Secondary Education (Sangiest 2008) and the Business Rules for the
Implementation of the New Secondary School Financing Model (MOEY) which gives a detailed commentary on the new funding formula and the likely impacts.
Better Schools, Better Citizens, Better Belize...It’s Everybody’s Business! MINISTRY OF EDUCATION, BELIZE
20
Improving access, quality and governance of education in Belize
nominal primary expenditure value in 2010 can be explained by the 2% variance. However, when we look at the primary approved commitments we see that this is the main driver for the reduction in primary
expenditure, BZ$0.8 million being removed from the 2010 allocation compared to the 2009. Secondary education commitments are high – due to the secondary education financing reform but actual expenditure was low in comparison to 2009 due to the low disbursement rates. A further explanation may be tighter monitoring of inflated budgets that are not based on actual need.
A minimum of two-thirds of sub-sector expenditure is spent on personal emoluments. Personal emolument rates for both primary and SEN have been consistently above 80%. In 2010, personal emoluments rates for primary and secondary rose by three and four percent, respectively.
As it is the case throughout the region, public spending on education tends to be more skewed toward the upper levels. The region spends, on average, three times more per student at the post secondary level than at the primary. By contrast, in some OECD countries, spending at lower levels of education exceeds that spent at the tertiary level - equity concerns follow; countries with expenditures concentrated at lower levels of education tend to have lower education Gini coefficients, thus indicating that support to education throughout their respective societies is more equitably distributed (IDB, 2006: 23).
In Belize, spending per student has been increasing over the period. The costs of tertiary increased by 64%5, the highest change compared to other levels; it now costs the GOB BZ$4,206 per annum to educate a higher education student. The cost of educating a primary and junior college student rose by same percentage (13%), in absolute terms it now costs BZ$ 1,427 and BZ$2,620, respectively. The cost of a pre school student is less than the 2007 level.
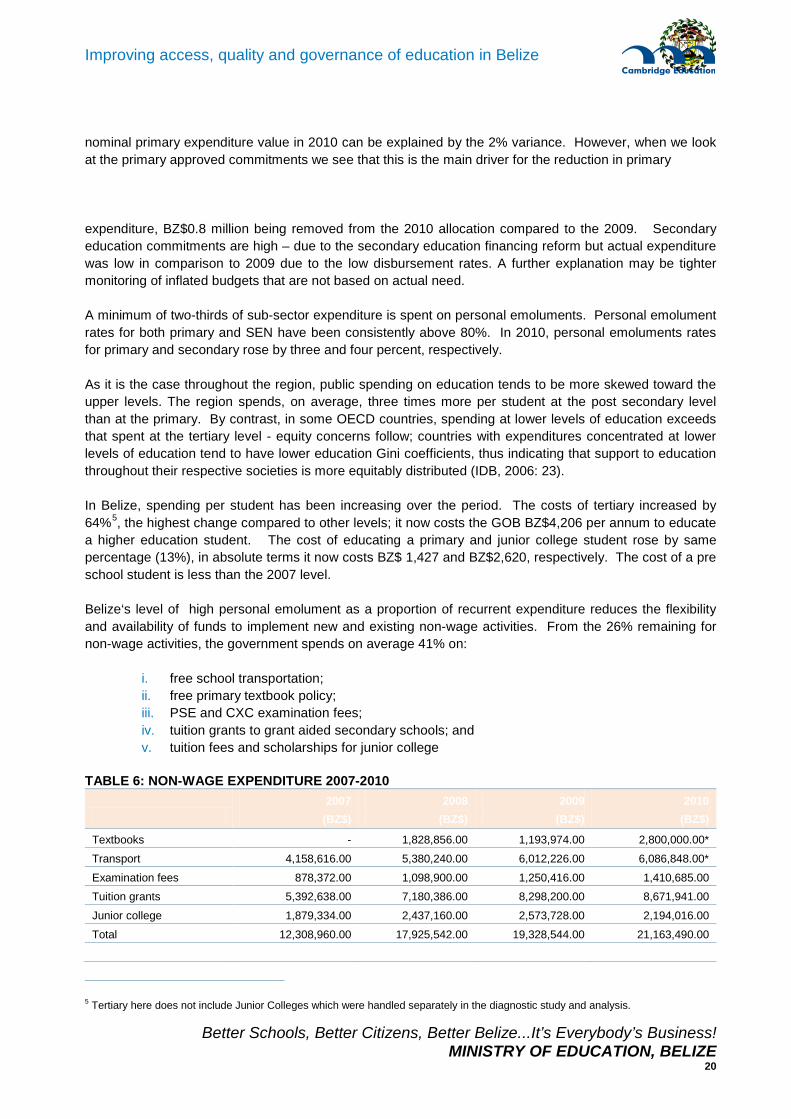
Belize‘s level of high personal emolument as a proportion of recurrent expenditure reduces the flexibility and availability of funds to implement new and existing non-wage activities. From the 26% remaining for non-wage activities, the government spends on average 41% on:
i. free school transportation; ii. free primary textbook policy; iii. PSE and CXC examination fees; iv. tuition grants to grant aided secondary schools; and v. tuition fees and scholarships for junior college
TABLE 6: NON-WAGE EXPENDITURE 2007-2010
2007
(BZ$) 2008
(BZ$) 2009
(BZ$) 2010
(BZ$)
Textbooks - 1,828,856.00 1,193,974.00 2,800,000.00*
Transport 4,158,616.00 5,380,240.00 6,012,226.00 6,086,848.00*
Examination fees 878,372.00 1,098,900.00 1,250,416.00 1,410,685.00 Tuition grants 5,392,638.00 7,180,386.00 8,298,200.00 8,671,941.00
Junior college 1,879,334.00 2,437,160.00 2,573,728.00 2,194,016.00
Total 12,308,960.00 17,925,542.00 19,328,544.00 21,163,490.00
_________________________ 5 Tertiary here does not include Junior Colleges which were handled separately in the diagnostic study and analysis.

Better Schools, Better Citizens, Better Belize...It’s Everybody’s Business! MINISTRY OF EDUCATION, BELIZE
21
Improving access, quality and governance of education in Belize
2007
(BZ$) 2008
(BZ$) 2009
(BZ$) 2010
(BZ$)
Total as % of TRE 8% 11% 11% 12%
Total as % non-wage 37% 39% 42% 46% Source: MOF 2011 * 2010 Approved budget figures
With just less than one-third of non-wage expenditure going on the free school transportation scheme, BZ$6 million, it is pertinent to ask whether the scheme is delivering the intended results given the high commitment from the GOB. Students from Stann Creek, Toledo and Belize Districts are the biggest users of the scheme, taking 33%, 25% and 23% of the total usage respectively. In these districts, pupils at secondary level use the service marginally more than primary pupils. In the other districts, it is generally targeted to ascertain identified level: Orange Walk, 100% of users are primary pupils; conversely, secondary pupils are the sole users in Toledo District.
Education is not entirely free in Belize. Government funding covers 100% of teacher salaries except in government aided secondary schools and junior colleges. Schools are, however, responsible for the non-funded proportion as well as all operation and maintenance costs. User fees are thus essential for the operation of the school system and schools are able to charge the fees that they consider to be justified. There are no regulations or requirements of managing authorities to make direct contributions to the running of schools, neither is there any common fee structure that determines levels of fees charged, though work is on-going, with IADB support, to examine this.
While these fees are largely nominal, especially for primary schooling, they nevertheless cause financial difficulties for many households, particularly in rural areas where cash incomes tend to be much lower – types of fees include book rental, PE uniform, computer, and registration. Some schools make allowance for this by waiving fees in exceptional circumstances – field visits confirmed that approximately 40% of pupils do not pay school fees, and a significant proportion pay only a small part of the chargeable fee. In the majority of cases, parents have to pay for their children’s uniforms, textbooks and school lunches (CPA, 2009).
The Design of Resource Allocation for Secondary Education Proposal (Sangiest, 2008) undertook an analysis of the burden of out-of-pocket school costs on households by comparing the prevailing spending with the household budget and quintile using the LSMS 2002. They concluded that the poorest households spend annually BZ$1,691 on education, which represented over 30% of their total household expenditure, while richest families spend 40% more than the poor, BZ$2,268 but that accounts for only 8% of their total household expenditure. By disaggregating education expenditure by category against quintile, they showed expenditure on textbooks is the most expensive item, ranging from 30 to 40% – consistent with extraordinary revenue from the sale of textbooks. In per capita terms, the poorest and the richest spent almost the same, BZ$272, but it represented 16% of the total poorest household expenditure compared to 3% for the richest households.
Similarly, poorer households spent twice as much of their household expenditure on transportation costs compared to the richest families, 4% and 2% respectively. The richest households spent 2% of household expenditure on education fees, compared to 9% for the poor. However, fees as a percentage of household education expenditure for the two groups are comparable at 30%.

Better Schools, Better Citizens, Better Belize...It’s Everybody’s Business! MINISTRY OF EDUCATION, BELIZE
22
Improving access, quality and governance of education in Belize
In response to the diagnosis three overarching policy objectives guide the ESS: 1. Increase equitable access to all levels of education 2. Improve the quality and relevance of education at all levels 3. Strengthen governance throughout the sector with emphasis on increased accountability for student
achievement.
Each of these policy objectives is discussed below. A summary of each with outputs, targets and strategies is presented as a Summary Framework in Annex A.
POLICY OBJECTIVE 1: INCREASE EQUITABLE ACCESS TO ALL LEVELS OF EDUCATION
We have seen that there are significant disparities in enrolment across the six districts of Belize, and in particular, between urban and rural areas. In addition to raising overall enrolment in each of the sub-sectors, the ESS aims to reduce the inequalities among districts. Rather than use national targets, which continue to mask the district and rural/urban variations, the strategy expresses targets in terms of minimum levels of enrolment in each of the districts. During the plan period, MOEY is committed to achieving the following major enrolment targets: Ensure a pre-primary GER of at least 50% in both urban and rural areas of all districts Ensure that the MDG of Universal Primary Education is achieved by 2015, evidenced by a NER of
100%. Raise GER at secondary level to at least 70% in each district Ensure that each of the six Institutes of Technical and Vocational Education and Training (ITVET)
operate at a minimum of 90% capacity, thus raising overall enrolment to close to 1,100 full time students
Improve completion rates at the tertiary level and reduce the gender enrolment gap.
1. Expand access to Pre-School Education
The Government is committed to a “Start Strong” policy of improving access to pre-primary education. BY 2016 the number of children aged three and four (the pre-primary school age group) will have grown to almost 17,500 (from the 2010 Census figure of 15,376). Reaching the overall target will require the addition of in excess of 2,600 new pre-
primary places and the hiring of an additional 145 teachers if the existing pupil teacher ratio of 16:1 is to be maintained.
There is already a marked difference in access to pre-schooling between urban and rural areas, with the latter lagging far behind. Thus, in order to establish greater equity, priority will be given to rural areas, with the creation of over 2,000 new places. Currently Cayo, (31%), Toledo (30%) and Orange Walk (26%) Districts experience the lowest enrolments, so these will take priority. Based on a target enrolment rate of 50% in each district, and the baseline enrolment of 2009/10, the anticipated number of new places per district is shown in the table below. Further disaggregation of data is necessary at the planning stage to further target expansion to redress the imbalance between rural and urban areas. Priority also needs to be afforded on other grounds, including provision in areas of high crime, such as Belize City as a strategy for building more stable communities.
CHAPTER 3 POLICY OBJECTIVES 2011- 2016
TARGETS
• GER of at least 50% in both rural and urban areas of each district.

Better Schools, Better Citizens, Better Belize...It’s Everybody’s Business! MINISTRY OF EDUCATION, BELIZE
23
Improving access, quality and governance of education in Belize
Table 7: Enrolment Targets for Pre-Primary Schooling by 2015/16
ENROLMENT PROJECTIONS BELIZE CAYO COROZAL O WALK STANN C TOLEDO TOTAL
2010 AGE SPECIFIC POP'N 4001 3488 2015 2353 1647 1872 15376
2016 AGE SPECIFIC POP 4681 4081 2357 2753 1927 2190 17989
DESIRED ENROLMENT RATE 50% 50% 50% 50% 50% 50% 0.5
TARGET ENROLMENT 2340 2040 1179 1376 963 1095 8995
EXISTING ENROLMENT 2577 1080 850 623 896 570 6596
ADDITIONAL ENROLMENT 960 329 753 67 525 2635
EXISTING ENROLMENT RATE 0.64 0.31 0.42 0.26 0.54 0.30 0.43
Districts will take responsibility for developing plans to achieve these targets. A key strategy will be the opening of pre-primary classes in selected primary schools. The Districts of Cayo, Orange Walk and Toledo face the biggest challenge in terms of new enrolments and will receive priority. As noted in the diagnosis, urban children are currently greatly advantaged in terms of access to pre-school; in order to redress this, districts will prioritise rural areas to ensure greater equity. Government will maintain and extend partnerships with the churches and with the private sector to share the costs of this expansion. The active participation of communities in the establishment and running of pre-schools is vitally important and is to be promoted. Alternative strategies will also be identified for establishing pre-primary experiences for children; for example, supporting village mothers to be at the centre of ECED development in remote rural communities, further supported as a cooperative venture with cross cutting ECD support structures for health and nutrition – the World Bank Health and Nutrition project for Toledo can provide an initial structural model for such an approach. Also to be considered is establishing a cadre of peripatetic pre-school teachers who can work with such groups within a geographical area. School feeding programmes will be established in poorer areas to promote enrolment, participation, and the health of children.
2. Increased enrolment and completion at primary level
The previous chapter has shown that the target of universal primary enrolment is within reach, though global experience shows that enrolling the last 5% is often very difficult and requires different strategies for the hardest to reach. The policy to increase access at the pre-primary level is expected to have a positive impact on ensuring that children start school at the right age and are adequately prepared to progress and succeed in primary school. There also needs to be focussed action that
brings five year olds into school. This will require close collaboration between schools and their communities, through the agency of the Parent Teacher Associations (PTA) and other bodies, to identify the out of school children, to better understand the reasons behind non-enrolment and to the value and benefits of schooling. Special arrangements need to be made to reach out to older primary aged children who have either dropped out or who have never enrolled in school. This can be done through special school based programmes, run out of normal school hours, that aim to re-integrate such children back into formal schooling. Incentives should be offered to teachers to run such programmes. The University of Belize community service programme may provide another option to reach these children. School principals will be provided with training and support to be able to more effectively mobilise communities.
In addition to bringing the remaining out of school children into school, there is a need to improve progression through primary school. The previous chapter highlighted the extent and characteristics of repetition. The impact of achieving the targeted 50% reduction in repetition will have a beneficial impact on the system: it will help free up space and resources, reduce overcrowding and ease the pupil teacher ratio. Schools will be encouraged through their respective Managing Authorities (MA) and the District Education Centres (DEC) to more effectively monitor and manage repetition. Whilst a policy of automatic promotion is not being forcefully introduced, it is desirable and can only be achieved when the underlying causes of
TARGETS
• 100% Net Enrolment Rate • 75% of Primary Schools in
each district have reduced repetition rate by at least 50%, with no increase in drop out.

Better Schools, Better Citizens, Better Belize...It’s Everybody’s Business! MINISTRY OF EDUCATION, BELIZE
24
Improving access, quality and governance of education in Belize
repetition are addressed. There is little sense in promoting children towards certain failure: the important issue to ensure they are ready to progress. The key strategy in this regard is to improve the quality of teaching so that all teachers are better able to support children who start to fail through better capacity for formative assessment and skills in remedial teaching. These are dealt with in the later section on education quality.
Access to primary schooling (as well as to secondary) has been enhanced by the Governments’ policy of providing free transport that offsets private costs associated with distance, particularly in Belize’s rural areas. There is however a substantial cost to this; the school bus service costs in excess of BZ$140,000 per week. Furthermore, the service is used by parents to send their children to their school of choice rather than the nearest school. The school bus service will continue, but with closer scrutiny of routes and users who use the service to travel beyond their nearest school. Costs have to be kept in mind, and choices made in terms of where priorities lie.
MOEY will continue to provide a number of demand side services that support enrolment and attendance at both primary and secondary levels, including the textbook scheme, school transportation and, in the case of secondary students, examination subsidy. The provision of textbooks is one service that offsets the cost of schooling and improves equity by ensuring that no child is denied access to essential texts on account of family income. But there are significant costs associated with this, as well as other demand side measures, and MOEY will assess the impact of the current textbook scheme and look for ways to revise the scheme to reduce cost whilst safeguarding quality and coverage, including the efficacy of the practice of providing workbooks. The review will include assessing the feasibility of electronic alternatives to textbooks. If considered viable, some pilot applications will be initiated. In addition, school feeding programmes will continue and be encouraged along with other support services (including fee waivers) to help poorer families offset the demand side costs of schooling and to provide incentives for enrolment and attendance.
3. Expanded access and completion at secondary level
The secondary aged population (13 to 16 year olds) in Belize can be expected to grow by almost 4,000 from the current 29,000 to almost 33,000 by 2016. In order to keep pace with population growth and expand access to achieve the 70% GER target in each district, an additional 4,670 students will need to be enrolled. Much of this enrolment can be achieved through reducing the high drop-out rates that persist at the secondary level, and additional space can be found by reducing repetition rates. Transfer rates from primary to secondary have improved steadily and reached 89.2% in 2009/10, up from 84.7% the previous year. Subsequent retention is the key problem.
As shown in the previous chapter, there is a marked variation in access across districts, with Belize District already having a GER of 78% compared to 45% in Toledo. In order to improve geographical equity at the secondary level, priority will be given to the districts and areas that are furthest from the target. In addition, there is a need to focus attention on boys in Belize Urban: keeping boys in school is an important strategy in reducing the escalating crime problem in the city. Table 12 below shows the indicative enrolment targets for each district, based on the target 70% GER and the projected 13-16 year old populations in 20166. _________________________ 6 Population calculations used are given in Annex 1.
TARGETS
• Increase the GER to a minimum of 74% in each district
• Reduce both the repetition rate and drop out rate by 50% in each district
• Increase by 10% the number of Form 4 graduates in all districts
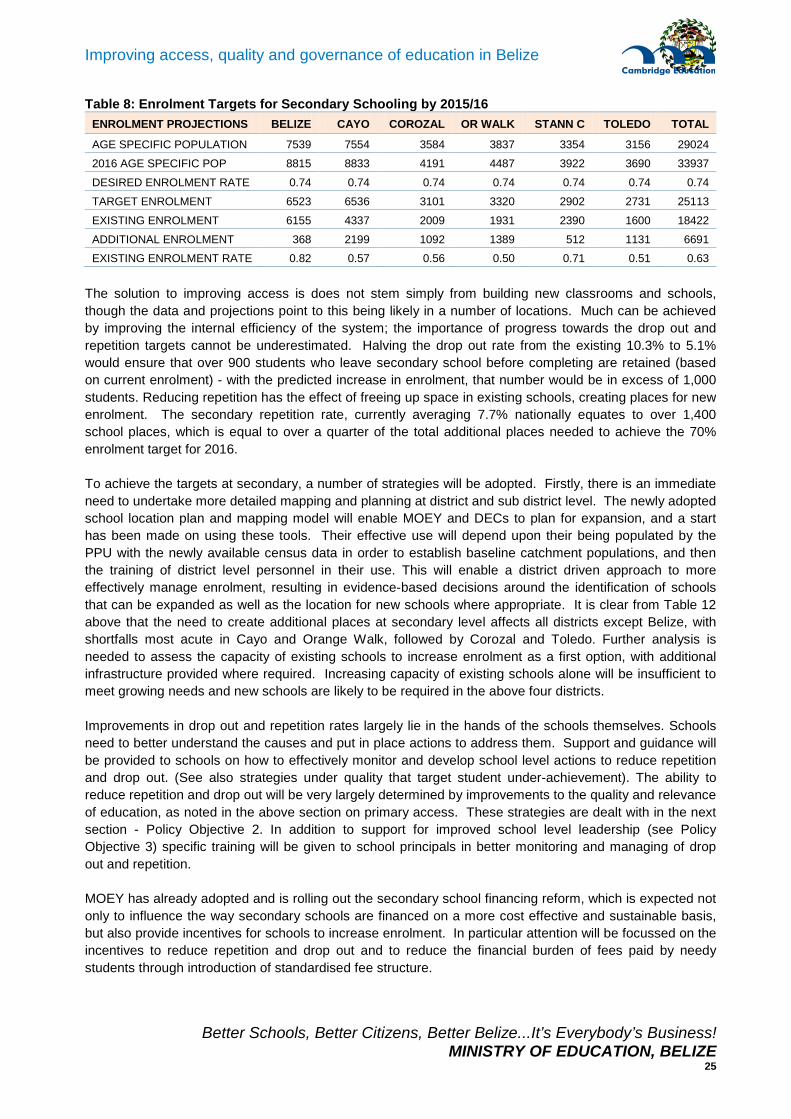
Better Schools, Better Citizens, Better Belize...It’s Everybody’s Business! MINISTRY OF EDUCATION, BELIZE
25
Improving access, quality and governance of education in Belize
Table 8: Enrolment Targets for Secondary Schooling by 2015/16
ENROLMENT PROJECTIONS BELIZE CAYO COROZAL OR WALK STANN C TOLEDO TOTAL
AGE SPECIFIC POPULATION 7539 7554 3584 3837 3354 3156 29024
2016 AGE SPECIFIC POP 8815 8833 4191 4487 3922 3690 33937
DESIRED ENROLMENT RATE 0.74 0.74 0.74 0.74 0.74 0.74 0.74
TARGET ENROLMENT 6523 6536 3101 3320 2902 2731 25113
EXISTING ENROLMENT 6155 4337 2009 1931 2390 1600 18422
ADDITIONAL ENROLMENT 368 2199 1092 1389 512 1131 6691 EXISTING ENROLMENT RATE 0.82 0.57 0.56 0.50 0.71 0.51 0.63
The solution to improving access is does not stem simply from building new classrooms and schools, though the data and projections point to this being likely in a number of locations. Much can be achieved by improving the internal efficiency of the system; the importance of progress towards the drop out and repetition targets cannot be underestimated. Halving the drop out rate from the existing 10.3% to 5.1% would ensure that over 900 students who leave secondary school before completing are retained (based on current enrolment) - with the predicted increase in enrolment, that number would be in excess of 1,000 students. Reducing repetition has the effect of freeing up space in existing schools, creating places for new enrolment. The secondary repetition rate, currently averaging 7.7% nationally equates to over 1,400 school places, which is equal to over a quarter of the total additional places needed to achieve the 70% enrolment target for 2016.
To achieve the targets at secondary, a number of strategies will be adopted. Firstly, there is an immediate need to undertake more detailed mapping and planning at district and sub district level. The newly adopted school location plan and mapping model will enable MOEY and DECs to plan for expansion, and a start has been made on using these tools. Their effective use will depend upon their being populated by the PPU with the newly available census data in order to establish baseline catchment populations, and then the training of district level personnel in their use. This will enable a district driven approach to more effectively manage enrolment, resulting in evidence-based decisions around the identification of schools that can be expanded as well as the location for new schools where appropriate. It is clear from Table 12 above that the need to create additional places at secondary level affects all districts except Belize, with shortfalls most acute in Cayo and Orange Walk, followed by Corozal and Toledo. Further analysis is needed to assess the capacity of existing schools to increase enrolment as a first option, with additional infrastructure provided where required. Increasing capacity of existing schools alone will be insufficient to meet growing needs and new schools are likely to be required in the above four districts.
Improvements in drop out and repetition rates largely lie in the hands of the schools themselves. Schools need to better understand the causes and put in place actions to address them. Support and guidance will be provided to schools on how to effectively monitor and develop school level actions to reduce repetition and drop out. (See also strategies under quality that target student under-achievement). The ability to reduce repetition and drop out will be very largely determined by improvements to the quality and relevance of education, as noted in the above section on primary access. These strategies are dealt with in the next section - Policy Objective 2. In addition to support for improved school level leadership (see Policy Objective 3) specific training will be given to school principals in better monitoring and managing of drop out and repetition.
MOEY has already adopted and is rolling out the secondary school financing reform, which is expected not only to influence the way secondary schools are financed on a more cost effective and sustainable basis, but also provide incentives for schools to increase enrolment. In particular attention will be focussed on the incentives to reduce repetition and drop out and to reduce the financial burden of fees paid by needy students through introduction of standardised fee structure.

Better Schools, Better Citizens, Better Belize...It’s Everybody’s Business! MINISTRY OF EDUCATION, BELIZE
26
Improving access, quality and governance of education in Belize
4. Increased enrolment in Technical and Vocational Programmes
Currently, the ITVETs are generally underutilised, unit costs of educating a TVET student are high and vary considerably between ITVETs, largely as a result of the under utilisation. As stated in the overview section, TVET remains in the public image as the poorer relative of an academic schooling and its position and perceived status needs to be changed. The overarching policy being pursued is one of alignment following UNESCO’s Secondary Education Reform model of Convergence of
Knowledge Acquisition and Skill Development.7There is a need to re-brand TVET in terms of a successful pathway to employment through skills and experience building that leads to certification that holds a value in the employment market. A key task will therefore be to develop a strong communication strategy that builds the credibility of TVET.
Access to TVET programmes will be improved by three other key strategies. Firstly to improve the coordination and collaboration between High Schools and ITVETs, so that ITVETs are used wherever practicable to deliver relevant courses to HS students, including pre vocational programmes. Equally, MOEY will examine options for ITVET students to access courses offered at secondary schools. The programme offerings at ITVETs will be better adapted to suit particular local economic and employment opportunities. Their offerings will also include a wider range of programmes, more flexibly delivered through evening and summer programmes, which target the employed or semi-employed worker as well as those seeking to build or diversify their skills.
Secondly, TVET programmes will be set within a clear and coherent National Qualifications Framework through which they will be more closely articulated with the secondary school system. This, as well as the issue of curriculum – critical to attraction of TVET - is dealt with in the subsequent section on education quality.
Finally, TVET will be more closely linked to local industry and commerce (see also strategy in next section on HRD Strategy and Labour Market Survey). This will enable a much more tangible connection between training and the workplace, an easier transition between training and the world of work , as well as opportunities for ITVET staff themselves to become more knowledgeable and skilled in particular areas. Options to deliver programmes or parts of programmes, in the workplace will also be explored.
_________________________ 7 UNESCO 2005
TARGETS
• All ITVETs operate at minimum 90% capacity for full-time programmes
• All ITVET offer customised part-time courses

Better Schools, Better Citizens, Better Belize...It’s Everybody’s Business! MINISTRY OF EDUCATION, BELIZE
27
Improving access, quality and governance of education in Belize
5. Improve completion rates at tertiary level
The key challenge faced at the tertiary level in Belize is to continue to increase access to bring Belize more into line with regional and other comparable countries. Higher numbers of graduates, particularly in key economic sectors, provide an important basis to further enhance the human capital required for national development and economic diversification. As described in the following section, MOEY will lead the process of developing a comprehensive Human Resource Development Strategy, which will inform the future development and design of tertiary level programmes, as well as those at TVET and secondary levels. As the number and quality of secondary school leavers increases, there will be increased demand for places in tertiary institutions.
A further challenge is to better target enrolment into priority subject areas, in particular the applied sciences, technology, and agriculture. There is also a need to stem the relatively high drop out rates from associate degree programmes. MOEY will explore options to develop incentives to be applied to attract applicants into priority areas. This will include examining the way tertiary courses are financed, looking at ways to prioritise priority subjects over over-subscribed options. Equally, incentives need to be applied to secure a better gender balance at the tertiary level, though much will depend upon changes at the secondary level where the roots of this imbalance largely lie.
Resources are finite and expansion cannot place an increased burden on public funds, so MOEY will continue to develop cost sharing options. The existing loan arrangements run through the Development Finance Corporation may be better replaced with a fully-fledged student loan scheme, models of which are found in many developed countries. More significantly, the use of ICT in developing open and distance programmes will be explored to expand access to those who, for various reasons, are unable to access intra-mural, full-time programmes.
6. Improve enrolment of children with Special Education Needs
International evidence suggests that when NERs reach into the 90% and above, a substantial proportion of the children who remain out of school are those with Special Educational Needs (SEN). Achieving the education MDGs is not possible without the inclusion of these children. Developing strategies to ensure that a greater number of SEN children
are enrolled involves the collaboration of a number of Ministries and Departments. The initial requirement will be to more accurately ascertain demand for education amongst this group of children and to improve the referral services and maintain an up to date register of SEN children. Anecdotal evidence suggests that many children with SEN remain “invisible”, hidden within their homes and communities and are not enrolled in schools. Programmes to sensitise communities to be more open with regard to children with SEN and to enrol them in school will be put in place. Support also needs to be given to schools to better accommodate children with SEN, and training and support given to teachers to integrate them into their classrooms. Teachers’ skills in identifying children with SEN will also be enhanced, in co-operation with the Ministry of Human Development and the Ministry of Health, both of which have access to children, through immunisation programmes for example, which provides screening opportunities. Information will be better shared. The target is to ensure that all children referred as SEN are found places in schools. Special attention needs to be provided to multi-grade schools, where the additional challenge of the inclusion of children with SEN needs will require additional support.
TARGETS
• Annual increase of 10% of Form 4 graduates gaining access to tertiary institutions
• Reduce drop out rates at Associate Degree level by 50% in each centre
• Reduce current gender disparity in tertiary education from 2:1 (female to male) to 3:2
• Increase level of costs sharing
TARGETS
• All referred SEN children enrolled in school

Better Schools, Better Citizens, Better Belize...It’s Everybody’s Business! MINISTRY OF EDUCATION, BELIZE
28
Improving access, quality and governance of education in Belize
7. Expand access to pre-service and in-service professional development for teachers
The expansion of access envisaged over the coming five years, will require more than 700 additional teachers. In addition, Belize has a high number of untrained teachers, and therefore a key strategy is to increase opportunities for serving as well as aspiring teachers to become fully trained. Further details are given under Policy Objective 2,
Output 2.4 which speaks to the targets and strategies for this.
Existing capacity at Colleges of Education needs to be expanded to accommodate the increased numbers of trainees. Options for new and alternative delivery points will be examined, and the application of suitable technologies will be considered to both reduce the costs associated with conventional intra-mural programmes and to increase the throughput of trainees. Details of the changes and reforms to Teacher Education programmes are given under Policy Objective 2 below.
In addition, greater access of teachers to Continuous Professional Development programmes (CPD) will be developed by increasing the capacity of Colleges of Education to meet this need. Again, the application of new technologies will be examined and developed where appropriate to enable serving teachers to upgrade their skills and knowledge.
8. Applying new technologies to increase access and achievement
MOEY recognises that ICT has a potentially important role to play in providing a wider and better education service. ICTs can be applied to augment, and in certain contexts even replace, existing modalities; on-line teacher training programmes, language learning programmes, as well as a range of subjects at school and college level. This can include
core and optional secondary subjects, as well as Adult and Continuing Education Programmes delivered through learning centres with facilitators. ICT offers potentially cost effective options for reaching greater numbers at reduced cost, whilst still providing a quality service. ICTs can also be used to develop wholly new approaches, and may be the only viable option for reaching certain individuals and groups, including people with special needs, those who cannot take time away from employment or family responsibilities, those living in remote areas without the time or wherewithal to commit to travel or lodging away from home, and those who live in highly populated areas where there is simply insufficient capacity within existing institutions to accommodate their needs.
There are few opportunities for continuing education in Belize for the many young people who have missed out on secondary education. Equally, full time attendance at secondary school may not be either a cost effective or practical option for a number of young people. Thus a substantial segment of the population remains underqualified and lacking in the basic skills and competencies for employment, particularly in the reality of a changing environment that requires a high degree of flexibility and a constant need to acquire new skills, knowledge, and abilities.
During this period MOEY will examine the feasibility and initiate pilot programmes that, if successful can be taken to scale. It is essential that policy decisions with regard to the application of ICT in education are approached with caution; that they are adequately appraised, tested and monitored to ensure effectiveness. There are substantial costs associated with infrastructure, hardware and software, providing training and orientation etc. MOEY will examine relevant regional experiences of ICT application which will include Barbados’s Edutech project, Trinidad and Tobago’s laptop programme as well as the Central American Telesecundaria/EDUSAT model.
TARGETS
Pre-primary, primary and secondary programmes available in all three regions
TARGETS
Increased number of educational programmes delivered through on-line or multi-media alternatives
Better Schools, Better Citizens, Better Belize...It’s Everybody’s Business! MINISTRY OF EDUCATION, BELIZE
29
Improving access, quality and governance of education in Belize
POLICY OBJECTIVE 2: IMPROVE THE QUALITY AND RELEVANCE OF EDUCATION AT ALL LEVELS
Defining what both quality and relevance mean in an education system is not straightforward. The quality of an education system may ultimately be judged by what it produces in terms of those graduating at various stages. The simplest and standard measures for this are formal assessment scores or examination results that reflect learning achievement. Relevance is arguably more complex, and reflects the capacity of the system to produce the level and type of human capital required for broader social and economic advancement.
The world’s highest performing education systems rarely stand still; there is constant adjustment in the quest for continued improvement. Such systems are characterised by having in place a very strong system of standards that identify what poor, fair, good and excellent performance looks like, and have strong capacity to both assess and manage performance against those standards. The coordination of the key components that directly drive the quality of education is critical; thus the articulation of the curriculum, the presence and use of resources to enable effective teaching and learning, the skills of the teaching profession, as well as a school environment that actively promotes success are all necessary to ensure a quality education. Above all, good education systems invest in strong leadership at all levels.
The actions proposed in the ESS to drive up the quality of education will strengthen each of these key components. By the end of the strategy period, the following key targets will have been achieved: All school principals and vice principals will be certified in school leadership Three quarters of all schools will be deemed effective, as measured annually against key criteria on
school report cards Three quarters of all teachers will demonstrate effective classroom competencies measured on a new
competency framework Three quarters of all schools will show an annual improvement in public examination performance All Teacher Education programmes will meet new national standards At least a quarter of pre-primary, half of secondary teachers, and three-quarters of primary teachers in
all districts will be appropriately licensed The national curriculum will be effectively delivered in all schools as measured by the new National
Quality Schools Framework. The secondary curriculum will be revised, standardized and adopted in all secondary schools, with a
sharing of appropriate programmes with ITVETs wherever possible Opportunities at ITVETS will be expanded More children with Special Education Needs will be enrolled.
Belize’s Quality Schools Initiative
Belize has made a promising start on the journey to improving the quality of its schools. The Quality Schools Task Force based in QADS is piloting an approach that integrates the development of good governance, effective leadership, competent and committed teachers, effective delivery of the curriculum, and quality assurance. This has underpinned much of what appears in this Education Sector Strategy.

Better Schools, Better Citizens, Better Belize...It’s Everybody’s Business! MINISTRY OF EDUCATION, BELIZE
30
Improving access, quality and governance of education in Belize
1. Improved school leadership and management for school effectiveness
Effective leaders are key to a school’s success and continual improvement. Training and high quality professional development are essential elements in ensuring that school leaders have an understanding of what they need to do to drive improvement and have the skills to support teachers, students, and other members of the school community , including parents, in their endeavours. MOEY will establish a programme of certification of school leaders, based on a dual approach of ensuring school leaders are both versed in current theory of effective leadership and, more importantly, are able to demonstrate leadership in their schools: greater emphasis will be placed on actual
practice. The starting point will be to use the National Standards for School Leadership endorsed by BBTE (2010) as the basis for certification. Using these, a rapid baseline assessment will be undertaken to inform the detail of the programme. Training will be offered to all serving and aspiring principals, and will be delivered largely through an open and distance modality, augmented with intra-mural and practical training session. By the end of the ESS period, all school principals and vice principals will be certified in school leadership.
An essential part of this programme will be increasing school leaders’ capacity to use data to track changes and monitor for improvement is essential to school improvement. Leaders will need training in the use and management of data so that the data collected will provide a detailed picture of which groups are doing well and why, and where improvement is needed. To this end, training in the use of data is an integral part of leadership training and such training will be extended to district personnel so they are able to better support their schools in using data to improve performance. District personnel would then be well placed to have an overview of which schools are doing well and to develop the CPD framework around this needs analysis. This will be undertaken in association with Colleges of Education, who will take responsibility for developing appropriate need-based CPD programmes.
Success criteria for measuring the impact of this initiative are important. The MOEY will draw upon international best practice in providing the requisite challenge and support for school leaders. Experience shows that separating these two functions – monitoring and support- is important in maintaining the integrity of the accountability measures.
School effectiveness will be monitored through the adoption of a simple school report card covering selected key performance indicators including access and retention, curriculum delivery, learning achievement as well as the physical and social environment. Summarising the outcomes annually for each school on a report card is a means of showing and sharing the data from each school. Emphasis will be placed on self assessment, independently validated by DECs. The emphasis will be on continual improvement. This can be used to track progress across districts and to build a national picture. A report card is also useful for engaging parents and demonstrating transparency. It is expected that by 2015/16, three quarters of all schools will be rated as effective and showing year on year improvement through this system.
TARGETS
• All school administrators (principals and vice principals) certified in school leadership
• 75% of schools demonstrate satisfactory level of effectiveness as measured on school report card.

Better Schools, Better Citizens, Better Belize...It’s Everybody’s Business! MINISTRY OF EDUCATION, BELIZE
31
Improving access, quality and governance of education in Belize
2. Improved effectiveness of teachers in supporting student achievement at all levels
The MOEY will define, using national and international research and best practice, the features of effective pedagogy and practice. This will take the form of a competency framework that captures levels of proficiency across a number of key areas. Once established, those involved in the training, support, management and monitoring of teachers - most significantly principals, vice principals, managers and district staff will be trained in first hand observational strategies, such as classroom observation, so that they are equipped to manage actual teacher performance within the competency framework. Members of PTAs will also be targeted for training in what makes a good school, as part of the drive to improve school-parent accountability (see later under Objective 3). Providing informed professional feedback in discussion with teachers, supporting them to set goals for improvement and linking these to individual, whole school and possibly district wide professional development are key components of continuous improvement. The target is to ensure that by 2015/16 three quarters of all Belize’s teachers are able to demonstrate a desired level of
competency in their teaching.
In order to improve their effectiveness teachers will also need to be trained in assessment for learning, using both formative and summative assessment techniques. This will be approached through a district-led initiative, so that there is consistency of practice and standards, as so that monitoring strategies are built into training. Strengthening practice in formative assessment, setting goals and measuring for impact against goals is an essential element in achieving the goals for external examinations and BJAT.
Special emphasis will be placed on improving the teaching and learning of the sciences at both primary and secondary levels. Success in improving primary science can be expected to increase the subsequent take up of science options at secondary level and beyond. Strategies will involve both teacher training and orientation towards a more practical approach to basic science and through the development and use of everyday materials in classrooms that stimulates enquiry and experimentation and provides the essential base for further understanding scientific knowledge and process. Similarly, intensive in-service programmes will be made available for secondary teachers to improve performance in science subjects with the expected result that more secondary graduates will opt to pursue science subjects at higher levels of education.
_________________________ 8 Satisfactory remains to be defined for BJAT, for PSE and for CSEC
TARGETS
• 75% of teachers demonstrate appropriate classroom competencies, including skills in formative assessment
• Yearly improvement in examination performance in 75% of schools, measured by :
• Increased examination entry (percentage of enrolled who sit examination)
• Improved examination performance (no. of pupils who achieve satisfactory8status)
• Improved BJAT scores in 75% of primary schools

Better Schools, Better Citizens, Better Belize...It’s Everybody’s Business! MINISTRY OF EDUCATION, BELIZE
32
Improving access, quality and governance of education in Belize
3. Approved Teacher Education (TE) programmes effectively delivered by all institutions training teachers
The TEDS have achieved much in establishing the expectation of a fully qualified profession. Compliance to this expectation has been a significant step and now the focus is on the quality of the training provided. The newly established Belize Board of Teacher Education (BBTE) has a pivotal role in setting and maintaining standards of teacher training. Belize is currently preparing a TE strategy (with support from the IADB) that aims to continue to raise the quality of Belize’s teaching profession. An initial action will be to review all TE programmes in order
to benchmark these against regional and international standards. This will be the precursor to establishing national standards for TE programmes to ensure consistency across all delivery institutions. These standards will be aligned to the teacher competency framework described above.
To ensure that standards are maintained and constantly improved, MOEY will, through the BBTE and TEDS develop a robust system of quality assurance for all TE institutions. Once established this will form the basis of regular monitoring and reporting. Information from this monitoring will be used to identify areas of both strength and weakness, the latter in turn forming the basis of Continuous Professional Development (CPD) programmes targeting teacher educators as well as an important driver of continuous improvement . Such programmes will be aligned with and informed by data from other sources, including from the school report cards and from teacher competency monitoring.
The inclusion of children with Special Educational Needs is to be given priority under the ESS. All TE programmes will include some basic training on meeting the needs of such children within the mainstream classroom, thus all teachers graduating from TE programmes will have a basis that can subsequently be built upon through specific CPD programmes. This will also be reflected in the teacher competency framework.
4. Increased number of appropriately certified teachers at all levels
Belize’s teaching cadre currently consists of too many unqualified teachers. The aspiration remains to move to a fully qualified – and competent – teaching force whereby the qualified teacher is the norm, not the exception. The new TE strategy will put forward a structured career pathway for teachers that will recognise and reward good performance with progression and promotion to positions of greater responsibility. This will include providing teachers with the incentives and opportunity to specialise in priority areas. A recognised career structure can act as a strong incentive for teachers to not only gain appropriate qualification but also to demonstrate proficiency, when advancement is linked to these. A system where advancement is clearly based on merit rather than length of service is expected to be seen as a more attractive career option for younger people and will help to further professionalise the teaching service. The starting point for
raising teacher quality lies with recruitment, using clear criteria to attract into the profession those with appropriate academic qualifications and aptitudes for teaching. Options to provide incentives to attract high performers into teaching, particularly in priority subjects or disadvantaged areas will be considered.
For practicing, unqualified teachers, MOEY will continue to apply incentives for them to undergo appropriate training. Efforts will be made to identify schools where there is demonstrably good practice and
TARGETS
All TE programmes comply with established minimum professional standards.
All TE staff have appropriate qualifications and experience required to deliver courses
TARGETS
• 25% of pre-primary teachers with full ECE teaching licence in all districts
• 75% of primary teachers with full teaching licence in all districts
• 50% of secondary teachers with full secondary level teaching licence in all districts
• All newly qualified teachers engaged in appropriate induction

Better Schools, Better Citizens, Better Belize...It’s Everybody’s Business! MINISTRY OF EDUCATION, BELIZE
33
Improving access, quality and governance of education in Belize
where quality coaching and mentoring can be provided. Designated schools close to TE institutions will act as “demonstration schools”, geared up to support teacher training and in which trainees will become exposed to good practice, research and development. The existing licensing framework will be used to award full licences to teachers who display the requisite competencies at all levels.
Newly qualified teachers need adequate induction; it is acknowledged that no matter how good teacher training programmes are, the post qualification year is crucial in turning a newly qualified teacher into a good teaching practitioner. Responsibility for support for the development and management of performance of newly qualified teachers, as well as those on placement during training, rests with schools and is an important aspect of training. Ensuring that school leaders and managers take this responsibility seriously and have the appropriate skills and knowledge to supervise induction effectively will be part of leadership certification, as well as part of the school monitoring and supervision process. Capacity to coach and mentor will be seen as an important part of the career pathway, attracting additional responsibility, for trainee practicums and teacher induction for example, as well as increments on the pay scale.
5. Improved relevance and delivery of the primary and secondary curriculum
Emphasis will be placed on improving the delivery of the curriculum in all of Belize’s primary and secondary schools, as well as better aligning the curriculum that is offered in secondary schools and ITVETs. Whilst there is a need to undertake a review of the primary and secondary curriculum to assess its currency and relevance, a major revision is not intended, though gaps and aspects identified as weak will be changed. The review will critically examine how the curriculum is delivered in schools: its management, the support materials used, and how teachers handle it.
To ensure a greater degree of curriculum compliance in schools, the learning outcomes will be reviewed for each year (grade) of the school system in all subject areas, starting with the essential “core” subjects: English, Maths, Basic Science, Social Science and subsequently including all other subjects. Following on from this a series of improved curriculum resource materials will be produced to support teachers in
their teaching of the curriculum; these will contain a range of “how to” ideas to support teachers in developing a meaningful school curriculum and teaching plans at the classroom level that make learning come alive rather than focus on coverage. Guides will strike a balance between promoting compliance with the curriculum and supporting teachers to “localise” the curriculum, helping them to diversify and adapt its delivery to the specific social and cultural context. It is this latter aspect that is identified as a current weakness and where teachers need the greatest support. Thus, curriculum resource materials will move away from being overly prescriptive and will help teachers and schools develop capacity to interpret curriculum learning outcomes and plan relevant curriculum and activities at school and classroom level. They will contain imaginative examples that will be stimulating and encouraging to schools to break away from the prescriptive approaches that currently exist.
At the primary level, pupils will experience more hands-on, active learning (e.g. in basic science, art and craft) in order to acquire more practical skills that can form a good foundation for developing interest and skills for technical and vocational fields. The emphasis will be on creativity and construction: doing and making things. This will build greater awareness of the relevance of technical and vocational options so that pupils can make more informed choices at secondary transfer.
TARGETS
• All schools assessed as performing at satisfactory level or above on the National Quality Schools Framework (see 3.4.2) in area of curriculum delivery, pedagogy and student achievement
• Appropriate language support programmes in place in all schools.
• Revised secondary curriculum based around core and options adopted in all secondary schools and ITVETs

Better Schools, Better Citizens, Better Belize...It’s Everybody’s Business! MINISTRY OF EDUCATION, BELIZE
34
Improving access, quality and governance of education in Belize
A communication strategy will make explicit the curriculum outcomes so that parents know what students are expected to know, understand and do at each age and stage of schooling. A programme of training for teachers, as well as principals and teacher trainers, will be developed to support these changes. These new approaches and materials will be used to inform TE programmes described in the previous sections.
Critical to the successful delivery of the curriculum in schools is the capacity of school leaders to better manage learning in their schools. Training and support will include developing their skills in observational assessment as a key component of the leadership training programmes described under output 2.1 above. An essential part of this will be to provide training and support for teachers in developing their capacity for formative assessment, improving their ability to systematically and constantly check learning, breaking away from the current practice of simply recording what has been taught to what has been learned, measured against the desired curriculum outcomes. This will involve building the skills of teachers to be better able to plan the delivery of the curriculum at the school and classroom level; skills that will include the ability to constantly assess pupils’ attainment .This is expected to result in a much improved monitoring of curriculum delivery and learning at the school level.
Though emphasis is to be placed on supporting teachers in the on-going, formative assessment of pupils’ learning, which will be a key strategy in reducing failure and avoiding repetition, there is also a need to develop better summative instruments, such as the PSE, so that these provide consistent and reliable assessments of learning achievement and can thus be used to gauge overall, year on year progress more reliably than at present.
Educators need to better understand the impact that language diversity has on the learning experiences of children in Belize’s schools. A national survey will examine the status of learners’ English language proficiency at all levels, the status of instructional programmes and how teachers manage language issues in school. This early work will identify possible policy options and recommendations for actions to ensure more effective approaches to language development in schools, especially in a multilingual context where the teacher may only have competence in at best two languages. Using this as a basis, programmes of professional development in teaching English language to learners whose first language is not English will be developed and introduced; these will be incorporated into initial teacher training and CPD, school based programmes for teachers. These programmes will be supported by the development and dissemination of appropriate materials.
At the secondary level, the curriculum will be rationalised into “core” and “option” categories. Core will be defined as essential subjects to include English, Maths, Spirituality, Personal Development, Basic Science and Social Science. All schools will offer these subjects to all students. In addition, schools may offer a number of options, depending on demand and their ability to resource them in terms of facilities and staffing. The concept of “Centres of Excellence” will be explored whereby certain schools will be identified and resourced to offer specialisation in agreed options.
Greater alignment between the curriculum offered at secondary schools and ITVETs will be achieved through the development of shared responsibility for courses. Flexible arrangements will be developed whereby students registered at secondary schools will be able to pursue certain options courses at ITVETs, and vice versa. The establishment of this flexible working will require collaborative planning and scheduling between ITVETs and participating secondary schools, with timetables developed on a block model. Changes to the ITVET curriculum will also be undertaken (see next section). The closer alignment of curriculum between secondary schools and ITVET will be articulated through the development of a National Qualifications Framework. Levels of attainment and competencies will be defined for each stage (or level) and the proposed National Secondary School Certification System (see next paragraph) and the Certificate of Vocational Qualification (CVQ) will be aligned through the NQF.
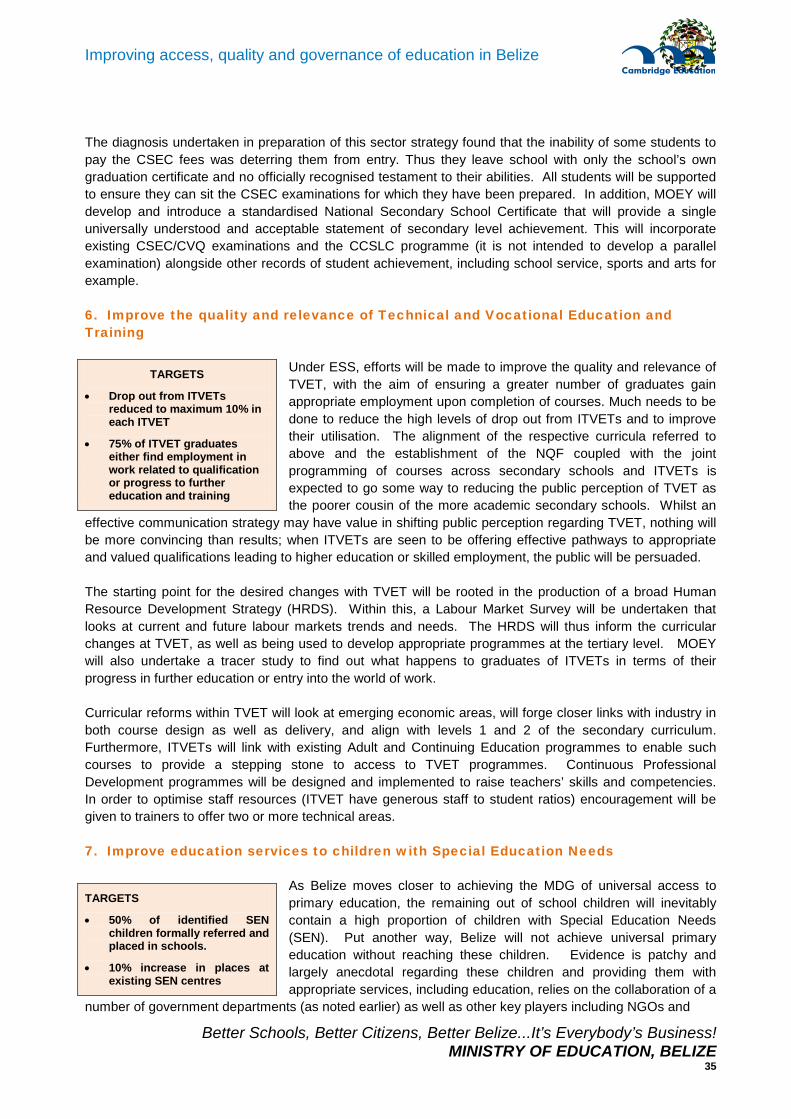
Better Schools, Better Citizens, Better Belize...It’s Everybody’s Business! MINISTRY OF EDUCATION, BELIZE
35
Improving access, quality and governance of education in Belize
The diagnosis undertaken in preparation of this sector strategy found that the inability of some students to pay the CSEC fees was deterring them from entry. Thus they leave school with only the school’s own graduation certificate and no officially recognised testament to their abilities. All students will be supported to ensure they can sit the CSEC examinations for which they have been prepared. In addition, MOEY will develop and introduce a standardised National Secondary School Certificate that will provide a single universally understood and acceptable statement of secondary level achievement. This will incorporate existing CSEC/CVQ examinations and the CCSLC programme (it is not intended to develop a parallel examination) alongside other records of student achievement, including school service, sports and arts for example.
6. Improve the quality and relevance of Technical and Vocational Education and Training
Under ESS, efforts will be made to improve the quality and relevance of TVET, with the aim of ensuring a greater number of graduates gain appropriate employment upon completion of courses. Much needs to be done to reduce the high levels of drop out from ITVETs and to improve their utilisation. The alignment of the respective curricula referred to above and the establishment of the NQF coupled with the joint programming of courses across secondary schools and ITVETs is expected to go some way to reducing the public perception of TVET as the poorer cousin of the more academic secondary schools. Whilst an
effective communication strategy may have value in shifting public perception regarding TVET, nothing will be more convincing than results; when ITVETs are seen to be offering effective pathways to appropriate and valued qualifications leading to higher education or skilled employment, the public will be persuaded.
The starting point for the desired changes with TVET will be rooted in the production of a broad Human Resource Development Strategy (HRDS). Within this, a Labour Market Survey will be undertaken that looks at current and future labour markets trends and needs. The HRDS will thus inform the curricular changes at TVET, as well as being used to develop appropriate programmes at the tertiary level. MOEY will also undertake a tracer study to find out what happens to graduates of ITVETs in terms of their progress in further education or entry into the world of work.
Curricular reforms within TVET will look at emerging economic areas, will forge closer links with industry in both course design as well as delivery, and align with levels 1 and 2 of the secondary curriculum. Furthermore, ITVETs will link with existing Adult and Continuing Education programmes to enable such courses to provide a stepping stone to access to TVET programmes. Continuous Professional Development programmes will be designed and implemented to raise teachers’ skills and competencies. In order to optimise staff resources (ITVET have generous staff to student ratios) encouragement will be given to trainers to offer two or more technical areas.
7. Improve education services to children with Special Education Needs
As Belize moves closer to achieving the MDG of universal access to primary education, the remaining out of school children will inevitably contain a high proportion of children with Special Education Needs (SEN). Put another way, Belize will not achieve universal primary education without reaching these children. Evidence is patchy and largely anecdotal regarding these children and providing them with appropriate services, including education, relies on the collaboration of a
number of government departments (as noted earlier) as well as other key players including NGOs and
TARGETS
• Drop out from ITVETs reduced to maximum 10% in each ITVET
• 75% of ITVET graduates either find employment in work related to qualification or progress to further education and training
TARGETS
• 50% of identified SEN children formally referred and placed in schools.
• 10% increase in places at existing SEN centres

Better Schools, Better Citizens, Better Belize...It’s Everybody’s Business! MINISTRY OF EDUCATION, BELIZE
36
Improving access, quality and governance of education in Belize
churches. The commitment under the ESS is to identify all SEN children and to ensure that at least half of these are placed in schools. Access to services generally favours the better off and urban over rural dwellers, so programmes need to redress these inevitable inequities by targeting the rural poor: children with SEN in these communities will be amongst the most deprived and disadvantaged in Belize.
The first step in addressing this problem will be to undertake a national study of SEN status and provision. This will be accompanied by the development of clear policy and procedures for the identification and support for students who have SEN, in collaboration with health services; including students with sensory impairment, physical disability, speech and language delay, and severe and profound learning disabilities. A critical decision is to determine within the policy appropriate levels of inclusion within mainstream schools. The option of using peripatetic teachers who work with parents to support home-based schooling will be considered. This will be clearly communicated to school managers, principals, teachers and parents.
Procedures for identification of students with special educational needs will be improved by training education officials, including DEC staff, school managers, NGOs and community workers to be able to assess level of need and to work with teachers, students and parents. The support of the wider community will be solicited in making better provision for children with SEN by establishing volunteer networks and appealing to business for corporate philanthropy. Basic SEN training will be part of all TE programmes (see above). In-service programmes will provide training and support for teachers both in the identification of students with SEN and for managing students in mainstream classes. Specialisation in SEN will be encouraged through CPD programmes and form part of the career pathway discussed earlier.
Those students whose needs fall outside the agreed limits for inclusion in mainstream schools, will continue to be accommodated in existing SEN centres, and it is expected to increase enrolment in these centres by 10% over the ESS period.
POLICY OBJECTIVE 3: STRENGTHEN GOVERNANCE THROUGHOUT THE SECTOR WITH EMPHASIS ON INCREASED STUDENT ACHIEVEMENT
The sector overview points to a need to build greater capacity to effectively manage the education system, and in particular to improve accountability for results. Responsibility for effective delivery of education ultimately resides with what happens in schools, though there are a diverse range of other stakeholders all of whom exert influence on what happens in schools. Where those responsibilities are not clearly defined or understood, and where they are poorly monitored and managed, accountability for performance is lost. Frequently accountability is simply for actions and not for results.
The new ESS therefore sees improved accountability for learning achievement as the basis that must underpin how the system is managed. At the heart of this are the formal rules and regulations that spell out roles, responsibilities, standards and expectations on which all parts of the system operate. This framework allows all agents to be able to define their respective roles and actions in terms of how they contribute to the achievement of the overall policy objectives. It also provides the underpinnings for systems of ensuring compliance, without which regulations can be avoided and ignored.

Better Schools, Better Citizens, Better Belize...It’s Everybody’s Business! MINISTRY OF EDUCATION, BELIZE
37
Improving access, quality and governance of education in Belize
Much has been written on the theme of governance and the importance of good governance for effective delivery of services is now widely recognised. Conversely, poor governance impedes effective service delivery, the consequences of which are felt most by the poor, who are least able to influence the process and who do not have the resources to buy into alternatives. Countries that have invested in improving governance tend to have more efficient and effective public
services.
In developing the ESS, MOEY have been guided by the United Nations framework that defines governance in terms of eight characteristics each of which contributes to a notion of “good” when present. The development of each of these finds a place in the strategies put forward in the ESS to improve overall sector governance. Improvement will be achieved through a series of strategies around five key outputs: Schools are governed and managed in accordance with requirements in the education rules (Follows
the rule of law) Increased accountability of schools to parents and local communities for school performance
(Accountable, Responsive, Consensus oriented) Improve management effectiveness of MOEY and District Education Centres (Efficient and Effective,
Responsive) Quality assurance system based on common minimum standards of service delivery applied across all
educational institutions (Accountable, Equitable and Inclusive) MOEY publishes through website annual report of performance against targets of Education Sector
Strategy (Transparent)
International evidence points very clearly to the importance of defining clear and unequivocal standards of what each part of the system will do, alongside targets of what can be expected in terms of performance. Those education systems in the world that continue to improve, do so because they set standards and they repeatedly and systematically monitor performance against those standards, making public reports and results. Most importantly they respond to what that information tells them with actions that bring about improvement. They use evidence to determine policy and action.
There are many different routes to improved educational achievement. Hong Kong and Singapore consistently feature near the top of any international league tables on education performance. They produce similar, seemingly ever improving, levels of achievement and though their outcomes are almost identical, the way in which their respective systems are organised are widely and fundamentally different. Singapore’s education system is highly centralised, with all facets and resources controlled by central government. In contrast, Hong Kong is highly decentralised with 95% of students being educated in privately operated schools which have complete autonomy over what they do, including the hiring and firing of teachers and the curriculum. There are few central regulations and policies; however central government

Better Schools, Better Citizens, Better Belize...It’s Everybody’s Business! MINISTRY OF EDUCATION, BELIZE
38
Improving access, quality and governance of education in Belize
provides almost all the funding which is tied to performance9. Belize’s education system falls somewhere between the two, there is considerable devolution of responsibility to the denominational managers, funding is predominantly from central government with schools free to levy fees, yet there remains quite strong.
central authority, with the bulk of finance, including teacher salaries, coming from central government. However, enforcement of standards by central authority on devolved managers is weak with few, if any, incentives or sanctions to challenge under performance or reward success.
Through the ESS MOEY is committed to improving the overall governance of the education sector so that it becomes more accountable for the principle outcome: learning achievement. A series of outputs and targets are proposed, each with a number of strategies that will bring about a system transformation.
1. Schools are governed and managed in accordance with requirements in the education rules
The Education Act 2010 has yet to be interpreted through new regulations, and without these the provisions of the Act cannot be operationalised. Delivery of policy and the legal requirements of the education system can only be effectively monitored and managed against clear descriptions of responsibilities and standards. There is therefore an urgent need to revise the existing Handbook of Policies and Procedures for School Services in light of the 2010 Education Act. This process has already commenced and once complete will underpin the drive for improved accountability and performance. Once complete, these will be disseminated to all offices and school managers, with appropriate sensitisation and orientation programmes.
In order to better inform the design and execution of programmes, especially those associated with school leadership (see output 2.1 above), a comprehensive national survey of school management will be undertaken. Based on the new regulations, and on-going work under
the QCFS programme, common standards for school management will be agreed and will be used as the basis for annually assessing the performance of every school. The responsibility for assessing school performance will rest firstly with Managing Authorities. Reports will be validated through independent inspection. Schools will also undertake an annual audit of their accounts. All reports, both on management performance and audit, will be made public.
The contract between Managing Authorities and the Ministry of Education will be reviewed, and the conditions for grant-in-aid brought into line with the ESS to ensure that schools are managed in a way that will meet the overall policy objectives and maintain the basic standards established under the Quality Schools Framework. The purpose is to improve the performance of all schools, and in order to better achieve this MOEY will develop and put in place procedures that give special support to schools that fail to meet the grant-in-aid conditions. The grant-in-aid conditions will more clearly define the roles and responsibilities of Managing Authorities and the District Education Centres and will require improved reporting by managing Authorities to District Education Centres.
_________________________ 9 For a fascinating and highly readable survey of recent international education reform, read Fenton Whelan’s “Lessons Learned: How
good policies produce better schools” MPG Books 2009. [Doubt this belongs in a Strategy document, however interesting!]
TARGETS
• New regulations established to support Education and Training Act 2010
• 90% compliance by General and Local managers, Schools administrators with requirements of education rules.
• All school principals appointed have at least minimum agreed qualifications and experience
• 75% of schools rated as satisfactory or above against national school performance standards

Better Schools, Better Citizens, Better Belize...It’s Everybody’s Business! MINISTRY OF EDUCATION, BELIZE
39
Improving access, quality and governance of education in Belize
2. Increased accountability of schools to parents and local communities for school performance
The first line of accountability is between the provider and the user – between the school and its community of parents and children. Over the next five years, Belize is committed to improving the accountability of schools to parents. Parents and their children are the prime stakeholders and beneficiaries of the education system. They rightly have expectations and whether through indirect taxation or through the payment of fees may feel a certain entitlement to an expected level of service. Currently there are low levels of public expectation regarding performance and weak links between schools and their communities.
Improvement will be achieved by firstly clarifying the regulations around school and community roles and the formation and functioning of school parent bodies. This will cover the preferred membership of such bodies, their Terms of Reference and requirements in terms of meeting and reporting. To facilitate this, training and guidance will be provided to school principals and district as well as National Associations of school
and community and parent bodies will be established. It is expected that the formation of such bodies will help promote better practice through shared experiences.
In order to improve specific accountability of schools to parents, all parents can expect at least two individual parent-teacher consultations per year at which the progress of each pupil will be discussed. This will be supported by an improved and standardised termly reporting system, in which a narrative assessment of a child’s progress and attainment will be given. MOEY will develop a standardised report form. Currently, such reporting is formulaic, often simply giving only a grade without comment. These changes will require the support of the Managing Authorities, who will take responsibility to see that all schools are able to meet these expectations.
Emphasis will be placed on each school making considered judgements about their own performance. Support will be given to school managers, principals and, most importantly, to parent representatives in the form of training and guidelines, in collecting and using information and data on school performance. Managing Authorities will take responsibility to see that all schools produce an annual report according to a standard format produced by MOEY; these will be made available at the school and, through the DECs, on the MOEY website.
TARGETS
• All schools have active PTAs (or School Councils) that meet once per term and fulfil functions other than fund raising.
• All schools hold parent-class teacher consultations twice per year
• All parents receive personalised qualitative termly written report of their child’s progress
• All schools publish annual report of performance against key indicators.

Better Schools, Better Citizens, Better Belize...It’s Everybody’s Business! MINISTRY OF EDUCATION, BELIZE
40
Improving access, quality and governance of education in Belize
3. Improve management effectiveness of MOEY and District Education Centres
The starting point for improving management effectiveness will be the undertaking of a full institutional appraisal of MOEY and DECs that assesses mandates, staffing and skills and examines how performance is currently managed. Out of this appraisal will be developed a comprehensive HRD plan and capacity development programme, aimed at raising performance in terms of delivering on the ESS objectives. Once developed this plan will be rolled out across MOEY and DECs.
Performance of all staff can only be effectively managed and improved if expectations are clearly stated. In order to improve effectiveness, job descriptions and terms of reference will be developed for all posts. These will form the basis of a process of annual objective setting and staff appraisal through mid year and end of year performance reviews. Individual as well as Departmental work plans will be developed and aligned to achievement of the policy objectives, outputs and targets of the ESS. The focus will shift from description of actions to achievement of results, and a performance management system that persistently
demands greater accountability for these. This theme is picked up in more detail in Chapter 5 that deals with implementation and monitoring of the ESS.
MOEY will improve its internal reporting procedures, and institute a system of regular and focussed reporting using simple pro-formas that track performance towards ESS targets. A regular quarterly performance progress meeting of all District Managers and Service Area Heads will be chaired by the CEO, prior to a quarterly report to the Minister.
Effective monitoring of performance against clearly stated outcomes is essential to improvement, and effective monitoring relies on the timely collection and use of data and information. In this regard the Policy and Planning Unit (PPU) of MOEY has the critical role to play and attention will be focussed on reshaping its role and building its capacity to better fulfil its functions to provide the national leadership in planning, monitoring and information management.
4. Quality assurance system based on common minimum standards of service delivery applied across all educational institutions
A robust quality assurance system is at the centre of the drive to improve the effectiveness of the education system. Work is already underway on developing a single National Quality Schools Framework that encompasses the five dimensions that contribute to an effective school or college: basic infrastructure and facilities, staffing, the teaching and learning processes, management and relationships with the community. This will be further developed and rolled out to all schools.
Under the ESS school supervision procedures will be reviewed and revised, and a common standardised system introduced nationally using a common reporting format. Day to day supervision and support will remain the responsibilities of the DECs, with a strengthen role of School Managers. Thus training and support will be provided to all supervisors, including DEC staff as well as School Managers. MOEY is in the process of establishing an autonomous schools inspectorate,
TARGETS
• All officers at all levels have annually agreed objectives, linked to policy objectives, which are used as basis for annual performance assessment.
• 90% of all MA, DEC and Central MOEY personnel perform at satisfactory standard or above on new annual performance appraisal system by 2013.
• Annual education statistics uploaded onto MOEY website by start of Term 3 of school year.
• Quarterly performance reviews held by SMT using ESS performance framework.
TARGETS
• All schools, junior colleges, and ITVETS receive at least one full supervision every three years
• All schools, junior colleges, and ITVETS receive at least one support visit (spot check) per annum.
Better Schools, Better Citizens, Better Belize...It’s Everybody’s Business! MINISTRY OF EDUCATION, BELIZE
41
Improving access, quality and governance of education in Belize
following a widely used practice in much of the world. The inspectorate will take on the critical role of training, supporting and managing inspection teams. School inspection reports will be made public through the MOEY website.
The formal school supervision process will be carefully aligned to the other quality assurance and reporting processes, principally the school report card system that will be developed around the QSF. The formal supervision process will be used to validate the school-based self assessment described earlier.
5. MOEY publishes through website annual report of performance against targets of Education Sector Strategy
A major step in improving governance is increasing transparency – putting into the public domain information about the education system. Public disclosure of key information, particularly where this refers to performance, sends a strong signal by providers to users that there is a degree of seriousness about the desire to improve. Such information
can have a beneficial impact on the system as a whole, inducing a sense of competition as well as recognition of achievement. It can also act as a deterrent to complacency by drawing attention to poor performance. It helps raise public awareness and expectation which in turn exerts pressure on providers to deliver better services. However, care needs to be taken in not using increased information to depress performance and apportion blame for apparent failures.
MOEY will invest in updating the official website through which all key information on the education system will be published. This will include: Annual departmental progress reports, which will report specifically on progress against the objectives
and targets of the ESS School supervision reports and annual school report cards Managing Authority reports
MOEY will produce an annual report of overall progress on implementation of the ESS using the performance framework in Chapter 6 below.
TARGETS
• All reports uploaded onto MOEY website within one month of submission

Better Schools, Better Citizens, Better Belize...It’s Everybody’s Business! MINISTRY OF EDUCATION, BELIZE
42
Improving access, quality and governance of education in Belize
This chapter sets out the expenditure and financing requirements, disaggregated by subsector, to meet the policy objectives set out in the 2011-2016 Education Sector Strategy (ESS). The projections were made using a demographic simulation model which was developed for Belize10. The full list of projections and the base year data are available as a separate annex to the ESS. This chapter projects a significant but manageable financing gap and sets out the implications for resource allocation over the ESS period.
Costing
The objectives and strategies outlined in the ESS are projected to cost a total of BZ$ 1.5 billion over the six years, an average of BZ$ 243 million per year. These expenditure requirements are driven by increased enrolment at pre-primary, primary, and secondary levels, an aggressive education quality campaign and a governance reform programme. Efficiency initiatives have been modelled to ensure domestic resources are firstly more effectively and efficiently utilised before the GOB draws requests additional external resources to bridge the funding gap. Efficiency initiatives incorporated in the model include: Increase in the teacher contact time;11 Increase in pupil-to- classroom ratio; Reduction in repetition and dropout rates; Reduction in teaching and non-teaching staff attrition rates; Increase in textbook renewal practice. Figure 7: Allocation by subsector, 2011-16
Projected funding allocations to primary education will increase, in nominal terms, from BZ$87 million in 2010 to BZ$120 million in 2016. This responds to higher volumes of pupils enrolled in primary education, 10,374 additional pupils over the ESS period, as well as quality improvements. Pre-school education share of the total education budget, has increased by two percentage points, and will be consistently at 3% throughout the ESP period - the policy objective of increasing the GER by seven percentage points (from 43 to 50%) will result in 2,473 additional pupils entering the system (public and private) education system.
_________________________ 10 UNESCO’s Epssim model was used. The accuracy of the projected outcomes and costs are determined by the accuracy and
reliability of the base year information, 2009/10. 11 from average 15 to 20 hrs per week at secondary
0.0%
10.0%
20.0%
30.0%
40.0%
50.0%
60.0%
2011 2012 2013 2014 2015 2016
Pre-primary
Primary education
Special education needs
Secondary education
ITVET
Higher Education
Cross-cutting expenditure
CHAPTER 4: COSTS AND FINANCING
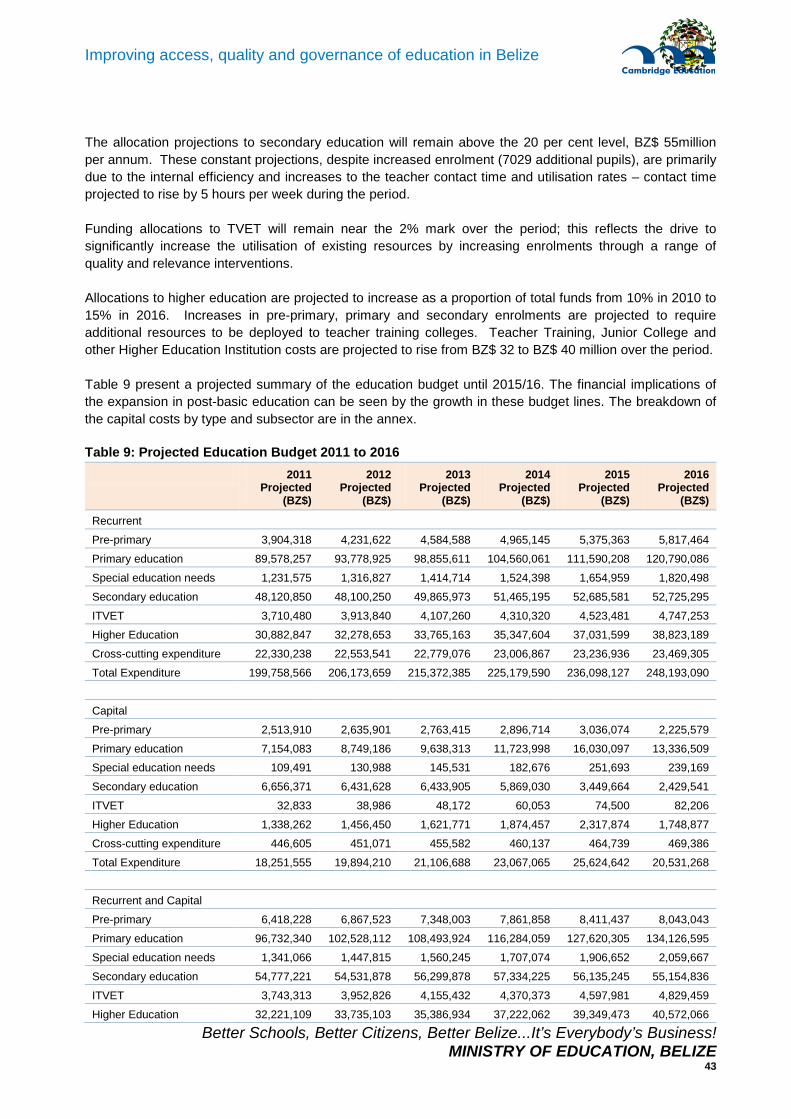
Better Schools, Better Citizens, Better Belize...It’s Everybody’s Business! MINISTRY OF EDUCATION, BELIZE
43
Improving access, quality and governance of education in Belize
The allocation projections to secondary education will remain above the 20 per cent level, BZ$ 55million per annum. These constant projections, despite increased enrolment (7029 additional pupils), are primarily due to the internal efficiency and increases to the teacher contact time and utilisation rates – contact time projected to rise by 5 hours per week during the period.
Funding allocations to TVET will remain near the 2% mark over the period; this reflects the drive to significantly increase the utilisation of existing resources by increasing enrolments through a range of quality and relevance interventions.
Allocations to higher education are projected to increase as a proportion of total funds from 10% in 2010 to 15% in 2016. Increases in pre-primary, primary and secondary enrolments are projected to require additional resources to be deployed to teacher training colleges. Teacher Training, Junior College and other Higher Education Institution costs are projected to rise from BZ$ 32 to BZ$ 40 million over the period.
Table 9 present a projected summary of the education budget until 2015/16. The financial implications of the expansion in post-basic education can be seen by the growth in these budget lines. The breakdown of the capital costs by type and subsector are in the annex. Table 9: Projected Education Budget 2011 to 2016
2011 Projected
(BZ$)
2012 Projected
(BZ$)
2013 Projected
(BZ$)
2014 Projected
(BZ$)
2015 Projected
(BZ$)
2016 Projected
(BZ$)
Recurrent
Pre-primary 3,904,318 4,231,622 4,584,588 4,965,145 5,375,363 5,817,464
Primary education 89,578,257 93,778,925 98,855,611 104,560,061 111,590,208 120,790,086
Special education needs 1,231,575 1,316,827 1,414,714 1,524,398 1,654,959 1,820,498
Secondary education 48,120,850 48,100,250 49,865,973 51,465,195 52,685,581 52,725,295
ITVET 3,710,480 3,913,840 4,107,260 4,310,320 4,523,481 4,747,253
Higher Education 30,882,847 32,278,653 33,765,163 35,347,604 37,031,599 38,823,189
Cross-cutting expenditure 22,330,238 22,553,541 22,779,076 23,006,867 23,236,936 23,469,305
Total Expenditure 199,758,566 206,173,659 215,372,385 225,179,590 236,098,127 248,193,090
Capital
Pre-primary 2,513,910 2,635,901 2,763,415 2,896,714 3,036,074 2,225,579
Primary education 7,154,083 8,749,186 9,638,313 11,723,998 16,030,097 13,336,509 Special education needs 109,491 130,988 145,531 182,676 251,693 239,169
Secondary education 6,656,371 6,431,628 6,433,905 5,869,030 3,449,664 2,429,541
ITVET 32,833 38,986 48,172 60,053 74,500 82,206
Higher Education 1,338,262 1,456,450 1,621,771 1,874,457 2,317,874 1,748,877
Cross-cutting expenditure 446,605 451,071 455,582 460,137 464,739 469,386
Total Expenditure 18,251,555 19,894,210 21,106,688 23,067,065 25,624,642 20,531,268
Recurrent and Capital
Pre-primary 6,418,228 6,867,523 7,348,003 7,861,858 8,411,437 8,043,043
Primary education 96,732,340 102,528,112 108,493,924 116,284,059 127,620,305 134,126,595
Special education needs 1,341,066 1,447,815 1,560,245 1,707,074 1,906,652 2,059,667
Secondary education 54,777,221 54,531,878 56,299,878 57,334,225 56,135,245 55,154,836
ITVET 3,743,313 3,952,826 4,155,432 4,370,373 4,597,981 4,829,459
Higher Education 32,221,109 33,735,103 35,386,934 37,222,062 39,349,473 40,572,066

Better Schools, Better Citizens, Better Belize...It’s Everybody’s Business! MINISTRY OF EDUCATION, BELIZE
44
Improving access, quality and governance of education in Belize
2011 Projected
(BZ$)
2012 Projected
(BZ$)
2013 Projected
(BZ$)
2014 Projected
(BZ$)
2015 Projected
(BZ$)
2016 Projected
(BZ$)
Cross-cutting expenditure 22,776,843 23,004,612 23,234,658 23,467,004 23,701,674 23,938,691 Total Expenditure 218,010,121 226,067,869 236,479,074 248,246,655 261,722,769 268,724,358
Cross cutting expenditure (costs for central MOEY and DEC administration, transport etc) is expected to rise from 8% (in 2010) to 10% (in 2011). This increase in the funds will support the governance reforms and capacity building programmes to be implemented at central and district levels.
In 2010 recurrent expenditure accounted for 99% of the total education sector budget; this is projected to fall as capital expenditure increases from 8% in 2011 to 10% in 2015, see figure 8. Within recurrent expenditure, personal emoluments in 2010 were 74% of the recurrent budget; during ESS implementation, personal emoluments are expected to rise significantly to 83% of the recurrent expenditure. Figure 8 : Projected recurrent, capital and total expenditure framework by subsector, 2011-2016
Resources
Since the fiscal year of 2010/11, the Ministry of Finance has been projecting multi-year budget estimates and forecast for both revenue and expenditure. Four pilot line ministries, including the Ministry of Education, have been given budgetary allocations for the medium-term (MTBF), 2011/12 to 2013/14 period, based on projected revenue, economic growth, and debt commitment figures and national priorities. The full multi-year estimates can be found in the annex; below are the key assumptions from the MTBF pertaining to the education sector: Average annual GDP growth rate at 3% (nominal terms); Average annual Tax revenue as percentage of GDP at 23.5%; Average annual government debt as percentage of GDP at 64.7%; Annual education share of the total recurrent budget at 26%; Annual education share of the total capital budget at 2.3%.
In addition, forecasts have been calculated on the level and likelihood of external donor support – on and off-budget activities, in-kind contributions have also been projected. However, given limited fiscal space, high debt ratio, and growing amortisation payments for the GOB and donor’s own resource constraints, the amount of ODA from development partners, particularly loans, available to Belize have been conservatively forecasted.
0
50,000,000
100,000,000
150,000,000
200,000,000
250,000,000
300,000,000
2011 2012 2013 2014 2015 2016
Capital
Recurrent
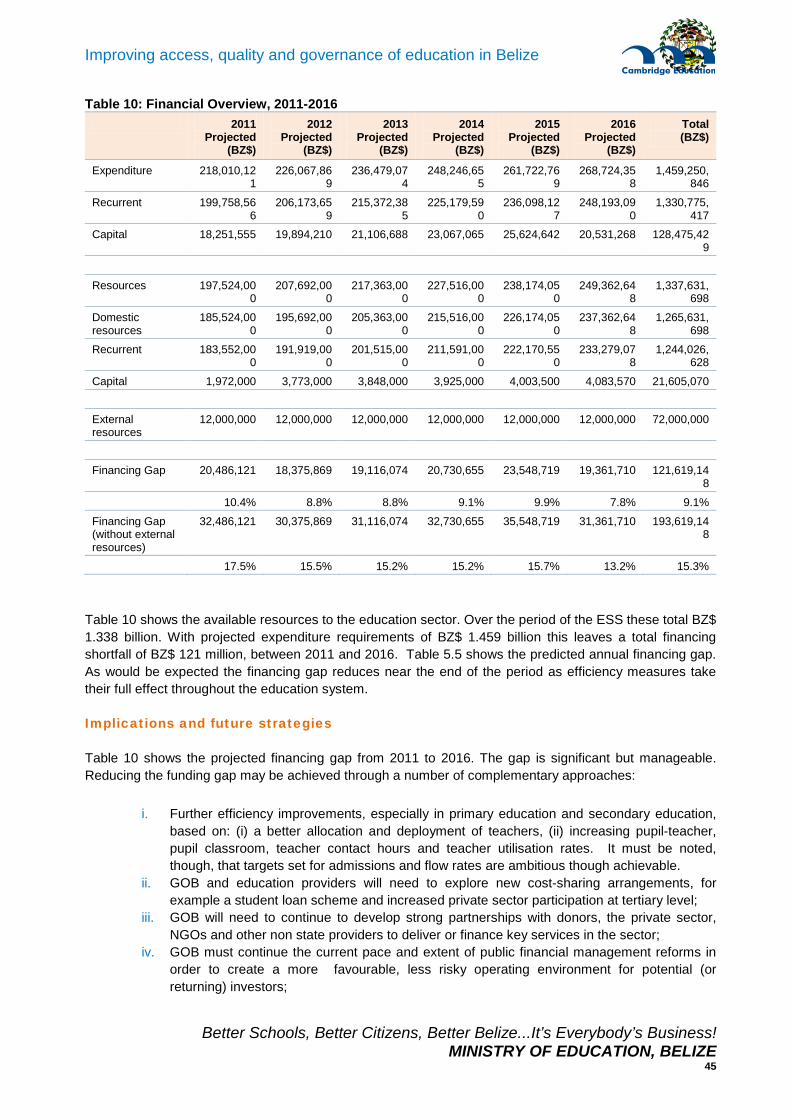
Better Schools, Better Citizens, Better Belize...It’s Everybody’s Business! MINISTRY OF EDUCATION, BELIZE
45
Improving access, quality and governance of education in Belize
Table 10: Financial Overview, 2011-2016
2011 Projected
(BZ$)
2012 Projected
(BZ$)
2013 Projected
(BZ$)
2014 Projected
(BZ$)
2015 Projected
(BZ$)
2016 Projected
(BZ$)
Total (BZ$)
Expenditure 218,010,121
226,067,869
236,479,074
248,246,655
261,722,769
268,724,358
1,459,250,846
Recurrent 199,758,566
206,173,659
215,372,385
225,179,590
236,098,127
248,193,090
1,330,775,417
Capital 18,251,555 19,894,210 21,106,688 23,067,065 25,624,642 20,531,268 128,475,429
Resources 197,524,000
207,692,000
217,363,000
227,516,000
238,174,050
249,362,648
1,337,631,698
Domestic resources
185,524,000
195,692,000
205,363,000
215,516,000
226,174,050
237,362,648
1,265,631,698
Recurrent 183,552,000
191,919,000
201,515,000
211,591,000
222,170,550
233,279,078
1,244,026,628
Capital 1,972,000 3,773,000 3,848,000 3,925,000 4,003,500 4,083,570 21,605,070
External resources
12,000,000 12,000,000 12,000,000 12,000,000 12,000,000 12,000,000 72,000,000
Financing Gap 20,486,121 18,375,869 19,116,074 20,730,655 23,548,719 19,361,710 121,619,148
10.4% 8.8% 8.8% 9.1% 9.9% 7.8% 9.1%
Financing Gap (without external resources)
32,486,121 30,375,869 31,116,074 32,730,655 35,548,719 31,361,710 193,619,148
17.5% 15.5% 15.2% 15.2% 15.7% 13.2% 15.3%
Table 10 shows the available resources to the education sector. Over the period of the ESS these total BZ$ 1.338 billion. With projected expenditure requirements of BZ$ 1.459 billion this leaves a total financing shortfall of BZ$ 121 million, between 2011 and 2016. Table 5.5 shows the predicted annual financing gap. As would be expected the financing gap reduces near the end of the period as efficiency measures take their full effect throughout the education system.
Implications and future strategies
Table 10 shows the projected financing gap from 2011 to 2016. The gap is significant but manageable. Reducing the funding gap may be achieved through a number of complementary approaches:
i. Further efficiency improvements, especially in primary education and secondary education, based on: (i) a better allocation and deployment of teachers, (ii) increasing pupil-teacher, pupil classroom, teacher contact hours and teacher utilisation rates. It must be noted, though, that targets set for admissions and flow rates are ambitious though achievable.
ii. GOB and education providers will need to explore new cost-sharing arrangements, for example a student loan scheme and increased private sector participation at tertiary level;
iii. GOB will need to continue to develop strong partnerships with donors, the private sector, NGOs and other non state providers to deliver or finance key services in the sector;
iv. GOB must continue the current pace and extent of public financial management reforms in order to create a more favourable, less risky operating environment for potential (or returning) investors;
Better Schools, Better Citizens, Better Belize...It’s Everybody’s Business! MINISTRY OF EDUCATION, BELIZE
46
Improving access, quality and governance of education in Belize
Nonetheless, there is a considerable risk that this gap may not be bridged, calling for prioritisation of funding, at the cost of not fully meeting all of the policy objectives outlined in this ESP. The costings used in this framework are based on achieving an ambitious set of policy outcomes. However, a less challenging scenario, wherein increases in performance over the existing baselines are more modest, is described below to illustrate what can be achieved with fewer resources and a smaller financing gap: 46 % GER at pre-primary level; PTR of 25 at primary level; 55% of teachers certified at primary level; 71% GER at secondary level; 41% of teachers certified at secondary level; ITVET at 70% capacity; Average funding gap of 5% per annum (including external support).
Given the economic constraints on the GOB, there is a need to periodically review spending plans and the MTBF as more accurate information becomes available. This will be done through the annual planning and budgeting process, and the implications for the delivery of the ESS priorities will be reviewed annually. MOEY will continue to take steps to improve the accuracy of forecasting through reviewing unit costs and baseline data and developing staff skills in finance and planning, both centrally and at district level.

Better Schools, Better Citizens, Better Belize...It’s Everybody’s Business! MINISTRY OF EDUCATION, BELIZE
47
Improving access, quality and governance of education in Belize
This chapter sets out how the ESS will be implemented, describes the monitoring and reporting arrangements that will be put in place, presents a monitoring framework and finally identifies the key risks with their mitigating measures.
Implementation
The ESS will be implemented through the existing structures of MOEY and other bodies, including most importantly the Managing Authorities and other affiliated bodies, such as the Belize Board of Teacher Education, that take on key roles in the delivery of education. Effective implementation of policy can only be achieved when a number of pre-requisites are met. These include: Expectations are clearly stated Responsibilities are clearly defined People are held to account Progress is regularly monitored Capacity exists Resources are available
As we have seen in Chapter 3, MOEY has set out an agenda for improving the overall governance of the sector (Policy Objective 3) which is expected to improve capacity to deliver results.
One of the key constraints identified in the sector diagnosis, and consistently verified in consultations during the development of the ESS, is the “siloed” culture of working that exists within MOEY. Delivery of successful outcomes in education is heavily dependent on the inter-relationship between various players or departments; the most obvious being the essential interplay between curriculum, teacher training, resource production and procurement and assessment. In addition there may be discord or lack of coordination and understanding between central authority, district agencies as well as the non-state providers, including the churches. The way the ESS has been developed, the way responsibilities have been assigned and the way it is proposed to manage and monitor progress are expected to counter this “silo” culture by forging more results focussed partnership between various parts of the system. This is described below.
The ESS sets out expectations through a series of outputs and targets: the picture of what the education system will look like in 2015/16 is clearly stated. There will be many more children in schools, all schools will be doing better in terms of their performance, and all who are involved in providing a service will be far more accountable for what they do. Central to this, and to the subsequent issues of responsibility and accountability, are the formal rules that govern the system. These are under revision and will be finalised early in the ESS period. Expectation is very much about standards: agreed levels of service and performance that users can expect from the system. Throughout the ESS emphasis is placed on defining standards: what a good school should looks like, what a good teacher does, what service school leaders should provide etc. Agreed standards that are communicated openly and widely define form the basis of defining expectations. Leadership, at all levels, is critically important and much attention is given in the ESS to improving the capabilities of education leaders. The system will produce, publish and use much more information about performance, through regular reporting of progress and achievement will be improved which will be clearly and consistently measured: not only are expectations clearly stated, these expectations will be far more widely shared and known.
The ESS assigns responsibility for results. In developing the ESS, each output has an assigned output owner who will assume strategic oversight of all actions that take place under each strategy that
CHAPTER 5: IMPLEMENTATION ARRANGEMENTS, MONITORING and RISKS

Better Schools, Better Citizens, Better Belize...It’s Everybody’s Business! MINISTRY OF EDUCATION, BELIZE
48
Improving access, quality and governance of education in Belize
contributes to the achievement of the output. The output owner does not do everything, though many will also have very specific operational roles. The output owner’s role is to coordinate, monitor, quality assure and report on progress. Thus there are clear and specific lines of responsibility for each of the outputs essential for delivering the policy objectives. Each strategy identifies the individual or entity (Service Area, District Education Centre or group of individuals such as Managing Authorities) who are expected to assume the lead role in taking forward that strategy. The ESS also identifies the other players who have a role to play in each strategy. These are identified in the Policy Framework at Annex 1. Output owners will be responsible for drawing up an annual workplan that sets out the actions to be undertaken against each of the strategies proposed in the ESS and against which progress will be monitored. This is described further below.
There is considerable attention paid in the ESS to improving accountability. Assigning responsibility means little unless systems of accountability are in place. This weakness in the existing system was identified as the critical area by those who worked on governance issues in developing the ESS. The emphasis throughout the outputs and strategies of Policy Objective 3 are all grounded in a drive to improve accountability. These include: Re-examining the grant-in-aid arrangements to link funding to delivery against policy objectives and
maintenance of agreed standards Publication of audits of school accounts Improved performance management system linked to ESS outputs
During ESS there will be far greater disclosure of information relating to performance, from individual child reports at the school level to the publication of an annual National Education Report.
Accountability can only be improved if the system is adequately monitored. A comprehensive performance monitoring framework has been established for the ESS. This will be used as the basis to drive an internal system of progress checking through regular reporting of progress.
The Monitoring and Reporting Chain
National level oversight of ESS resides with Senior Management Team at MOEY. The Senior Management team, under the direction of the Chief Executive Officer (CEO) will through quarterly meetings review progress based on reports received from output owners.
A central role will be taken by the Policy and Planning Unit (PPU) in driving a robust planning, reporting and review process. Under this process all Output Owners will be required to produce annual work plans that detail the activities they will undertake in order to deliver on the strategies agreed in the ESS. Work plans will be expressed on a pro-forma that mirrors the policy framework contained in the ESS (ref ESS Annex 1). Care will be taken in the design of this monitoring and reporting protocol not to make it overelaborate, to focus on key actions and on progress towards the desired results and targets. The key question will be: “Are we on track”?
Monitoring Framework
A comprehensive series of performance and monitoring tables have been prepared to track progress of the ESS. The monitoring table for the high level Policy Objectives is presented as Table 6.1 below below. The full set of monitoring tables is given at Annex XX.
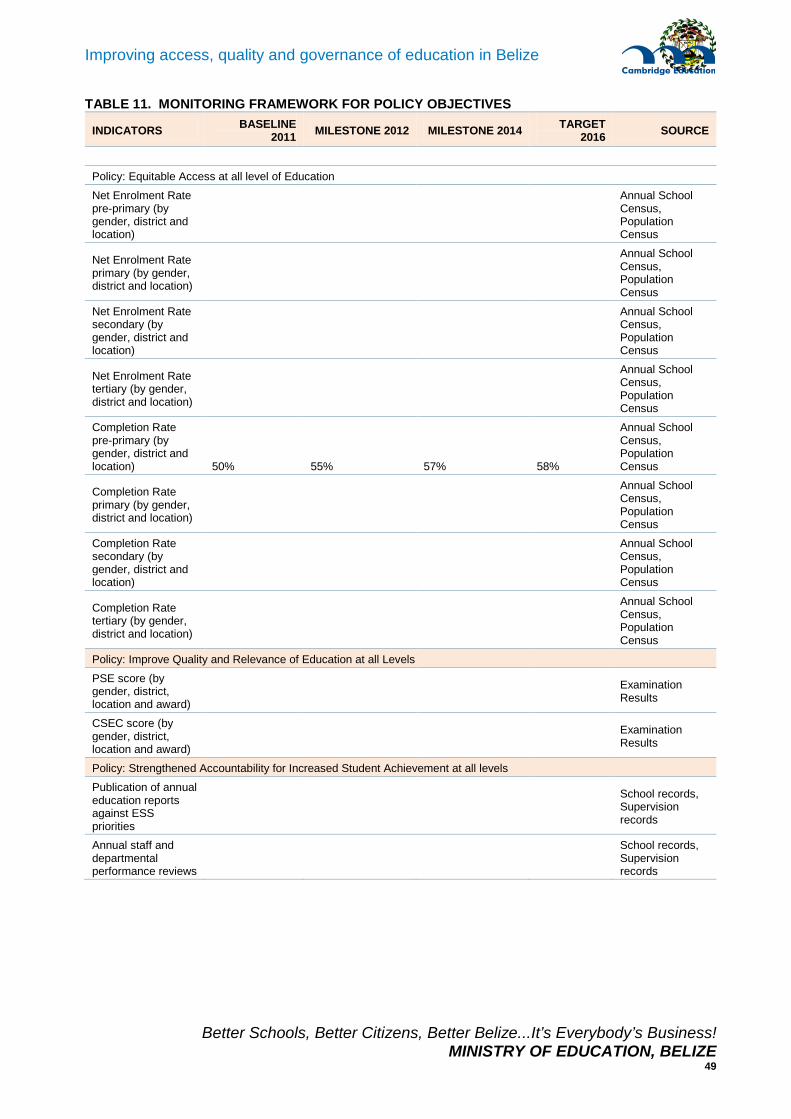
Better Schools, Better Citizens, Better Belize...It’s Everybody’s Business! MINISTRY OF EDUCATION, BELIZE
49
Improving access, quality and governance of education in Belize
TABLE 11. MONITORING FRAMEWORK FOR POLICY OBJECTIVES
INDICATORS BASELINE 2011 MILESTONE 2012 MILESTONE 2014 TARGET
2016 SOURCE
Policy: Equitable Access at all level of Education
Net Enrolment Rate pre-primary (by gender, district and location)
Annual School Census, Population Census
Net Enrolment Rate primary (by gender, district and location)
Annual School Census, Population Census
Net Enrolment Rate secondary (by gender, district and location)
Annual School Census, Population Census
Net Enrolment Rate tertiary (by gender, district and location)
Annual School Census, Population Census
Completion Rate pre-primary (by gender, district and location) 50% 55% 57% 58%
Annual School Census, Population Census
Completion Rate primary (by gender, district and location)
Annual School Census, Population Census
Completion Rate secondary (by gender, district and location)
Annual School Census, Population Census
Completion Rate tertiary (by gender, district and location)
Annual School Census, Population Census
Policy: Improve Quality and Relevance of Education at all Levels
PSE score (by gender, district, location and award)
Examination Results
CSEC score (by gender, district, location and award)
Examination Results
Policy: Strengthened Accountability for Increased Student Achievement at all levels
Publication of annual education reports against ESS priorities
School records, Supervision records
Annual staff and departmental performance reviews
School records, Supervision records
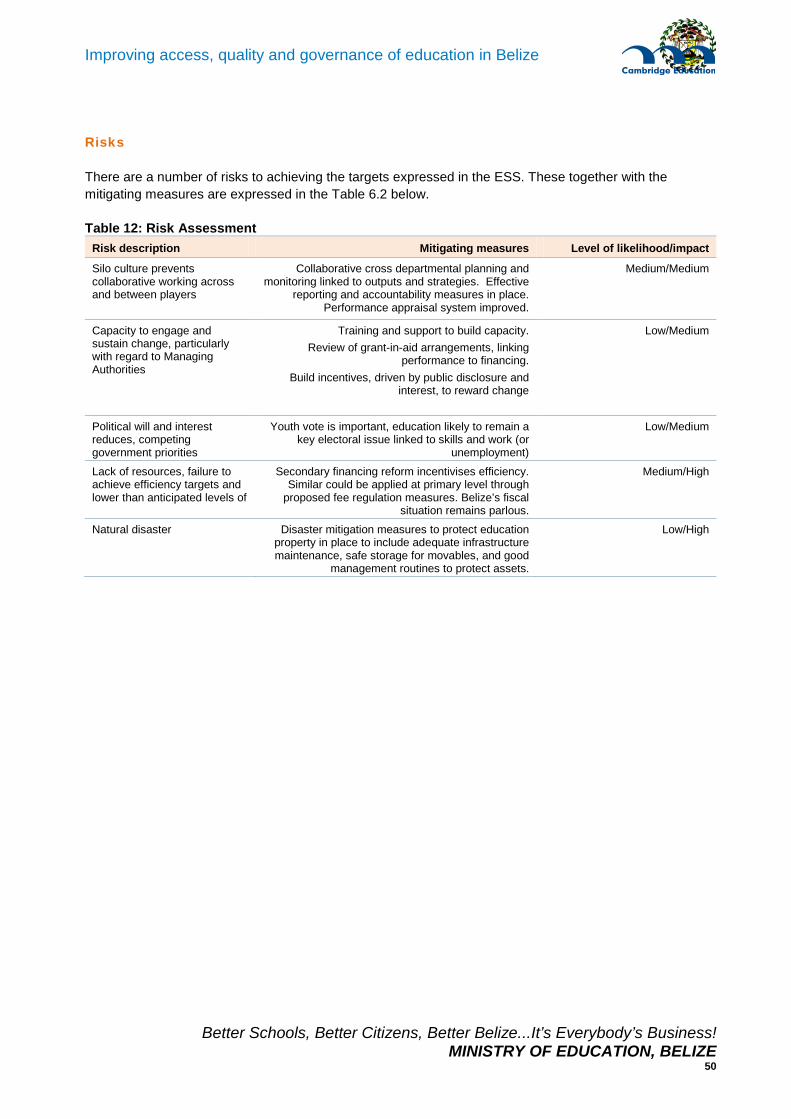
Better Schools, Better Citizens, Better Belize...It’s Everybody’s Business! MINISTRY OF EDUCATION, BELIZE
50
Improving access, quality and governance of education in Belize
Risks
There are a number of risks to achieving the targets expressed in the ESS. These together with the mitigating measures are expressed in the Table 6.2 below. Table 12: Risk Assessment
Risk description Mitigating measures Level of likelihood/impact
Silo culture prevents collaborative working across and between players
Collaborative cross departmental planning and monitoring linked to outputs and strategies. Effective
reporting and accountability measures in place. Performance appraisal system improved.
Medium/Medium
Capacity to engage and sustain change, particularly with regard to Managing Authorities
Training and support to build capacity. Review of grant-in-aid arrangements, linking
performance to financing. Build incentives, driven by public disclosure and
interest, to reward change
Low/Medium
Political will and interest reduces, competing government priorities
Youth vote is important, education likely to remain a key electoral issue linked to skills and work (or
unemployment)
Low/Medium
Lack of resources, failure to achieve efficiency targets and lower than anticipated levels of
Secondary financing reform incentivises efficiency. Similar could be applied at primary level through
proposed fee regulation measures. Belize’s fiscal situation remains parlous.
Medium/High
Natural disaster Disaster mitigation measures to protect education property in place to include adequate infrastructure maintenance, safe storage for movables, and good
management routines to protect assets.
Low/High
Better Schools, Better Citizens, Better Belize...It’s Everybody’s Business! MINISTRY OF EDUCATION, BELIZE
51
Improving access, quality and governance of education in Belize
Please see document attached
ANNEX A: Summary Framework - Policy Objectives

Better Schools, Better Citizens, Better Belize...It’s Everybody’s Business! MINISTRY OF EDUCATION, BELIZE
52
Improving access, quality and governance of education in Belize
Please see document attached
ANNEX B: M&E Evaluation Framework
Better Schools, Better Citizens, Better Belize...It’s Everybody’s Business! MINISTRY OF EDUCATION, BELIZE
53
Improving access, quality and governance of education in Belize
Please see document attached
ANNEX C: Selected Digest Stats
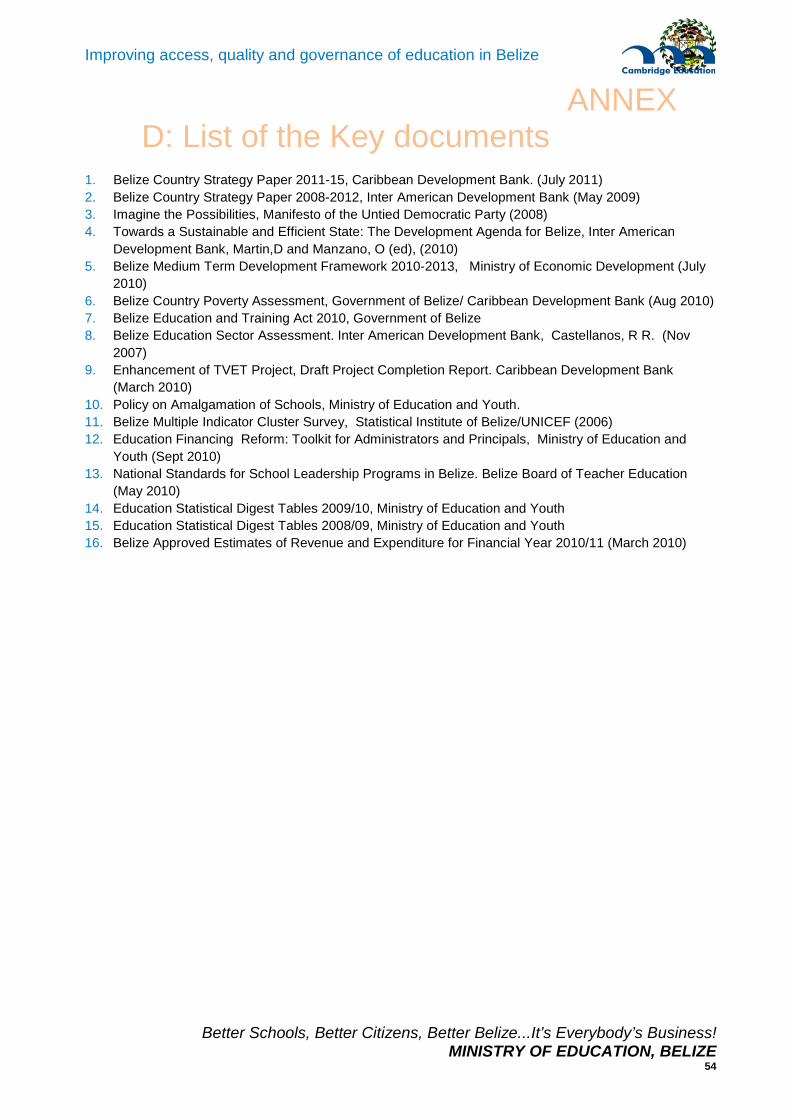
Better Schools, Better Citizens, Better Belize...It’s Everybody’s Business! MINISTRY OF EDUCATION, BELIZE
54
Improving access, quality and governance of education in Belize
ANNEX D: List of the Key documents
1. Belize Country Strategy Paper 2011-15, Caribbean Development Bank. (July 2011) 2. Belize Country Strategy Paper 2008-2012, Inter American Development Bank (May 2009) 3. Imagine the Possibilities, Manifesto of the Untied Democratic Party (2008) 4. Towards a Sustainable and Efficient State: The Development Agenda for Belize, Inter American
Development Bank, Martin,D and Manzano, O (ed), (2010) 5. Belize Medium Term Development Framework 2010-2013, Ministry of Economic Development (July
2010) 6. Belize Country Poverty Assessment, Government of Belize/ Caribbean Development Bank (Aug 2010) 7. Belize Education and Training Act 2010, Government of Belize 8. Belize Education Sector Assessment. Inter American Development Bank, Castellanos, R R. (Nov
2007) 9. Enhancement of TVET Project, Draft Project Completion Report. Caribbean Development Bank
(March 2010) 10. Policy on Amalgamation of Schools, Ministry of Education and Youth. 11. Belize Multiple Indicator Cluster Survey, Statistical Institute of Belize/UNICEF (2006) 12. Education Financing Reform: Toolkit for Administrators and Principals, Ministry of Education and
Youth (Sept 2010) 13. National Standards for School Leadership Programs in Belize. Belize Board of Teacher Education
(May 2010) 14. Education Statistical Digest Tables 2009/10, Ministry of Education and Youth 15. Education Statistical Digest Tables 2008/09, Ministry of Education and Youth 16. Belize Approved Estimates of Revenue and Expenditure for Financial Year 2010/11 (March 2010)
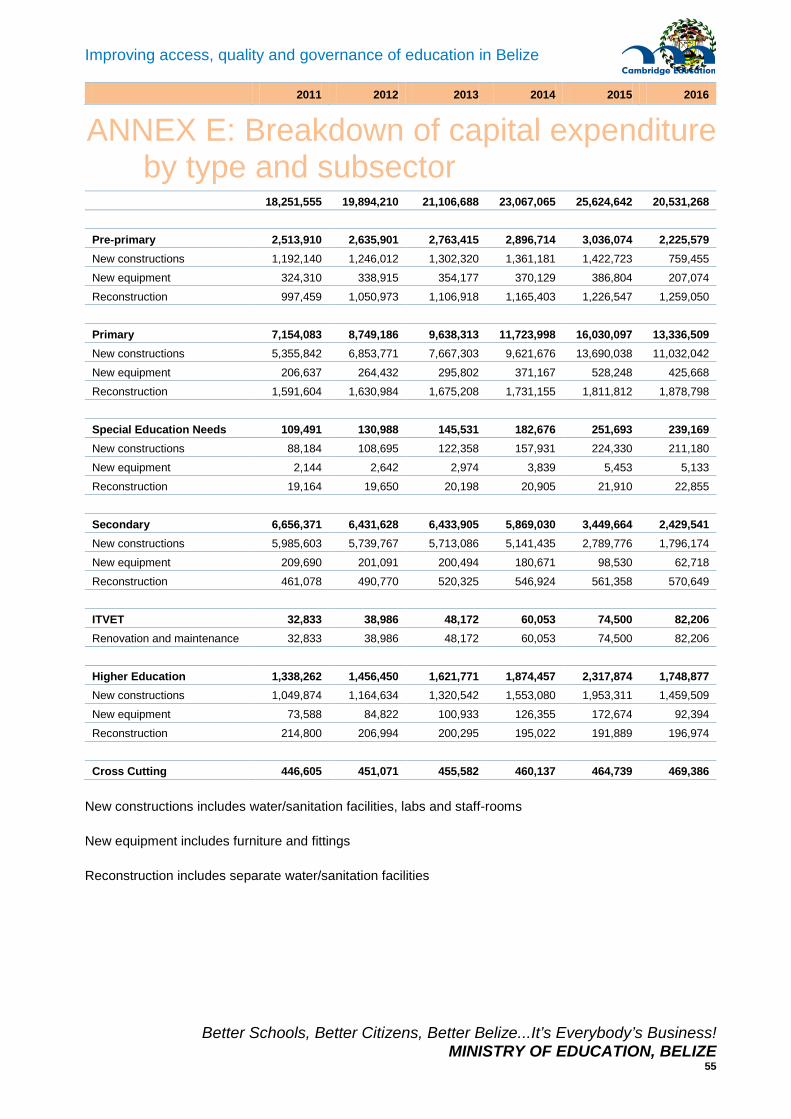
Better Schools, Better Citizens, Better Belize...It’s Everybody’s Business! MINISTRY OF EDUCATION, BELIZE
55
Improving access, quality and governance of education in Belize
2011 2012 2013 2014 2015 2016
18,251,555 19,894,210 21,106,688 23,067,065 25,624,642 20,531,268
Pre-primary 2,513,910 2,635,901 2,763,415 2,896,714 3,036,074 2,225,579 New constructions 1,192,140 1,246,012 1,302,320 1,361,181 1,422,723 759,455
New equipment 324,310 338,915 354,177 370,129 386,804 207,074
Reconstruction 997,459 1,050,973 1,106,918 1,165,403 1,226,547 1,259,050
Primary 7,154,083 8,749,186 9,638,313 11,723,998 16,030,097 13,336,509 New constructions 5,355,842 6,853,771 7,667,303 9,621,676 13,690,038 11,032,042
New equipment 206,637 264,432 295,802 371,167 528,248 425,668
Reconstruction 1,591,604 1,630,984 1,675,208 1,731,155 1,811,812 1,878,798
Special Education Needs 109,491 130,988 145,531 182,676 251,693 239,169 New constructions 88,184 108,695 122,358 157,931 224,330 211,180
New equipment 2,144 2,642 2,974 3,839 5,453 5,133
Reconstruction 19,164 19,650 20,198 20,905 21,910 22,855
Secondary 6,656,371 6,431,628 6,433,905 5,869,030 3,449,664 2,429,541 New constructions 5,985,603 5,739,767 5,713,086 5,141,435 2,789,776 1,796,174
New equipment 209,690 201,091 200,494 180,671 98,530 62,718
Reconstruction 461,078 490,770 520,325 546,924 561,358 570,649
ITVET 32,833 38,986 48,172 60,053 74,500 82,206 Renovation and maintenance 32,833 38,986 48,172 60,053 74,500 82,206
Higher Education 1,338,262 1,456,450 1,621,771 1,874,457 2,317,874 1,748,877 New constructions 1,049,874 1,164,634 1,320,542 1,553,080 1,953,311 1,459,509
New equipment 73,588 84,822 100,933 126,355 172,674 92,394
Reconstruction 214,800 206,994 200,295 195,022 191,889 196,974
Cross Cutting 446,605 451,071 455,582 460,137 464,739 469,386
New constructions includes water/sanitation facilities, labs and staff-rooms
New equipment includes furniture and fittings
Reconstruction includes separate water/sanitation facilities
ANNEX E: Breakdown of capital expenditure by type and subsector

Better Schools, Better Citizens, Better Belize...It’s Everybody’s Business! MINISTRY OF EDUCATION, BELIZE
56
Improving access, quality and governance of education in Belize
2011 2012 2013 2014 2015 2016
Pre-primary Classrooms 8 9 9 10 10 6
Staffrooms 4 4 5 5 5 3
Toilets 4 4 5 5 5 3
Primary Classrooms 46 58 65 82 116 93
Staffrooms 5 7 7 9 13 11
Toilets 10 14 16 22 33 31
Other 11 14 15 19 28 23
Secondary Classrooms 48 46 46 41 22 14
Labs 10 9 9 8 4 3
Staffrooms 4 3 3 3 2 1
Toilets 5 5 5 4 2 1
Other 5 5 5 4 2 1
ANNEX F: Number of infrastructure required by the main subsectors

1
GOVERNMENT OF BELIZE
MINISTRY OF EDUCATION AND YOUTH
POLICY AND PLANNING UNIT
BELIZE EDUCATION SECTOR STRATEGY
2011-2016 To be implemented in the five school years 2011/2 to 2015/16
SUMMARY FRAMEWORK
NOTES
Each output has an OUTPUT OWNER, an individual who will assume overall responsibility for planning and coordinating activities as well as monitoring and reporting on progress against the targets for that specific output.
Each strategy has the RESPONSIBILITY for action allocated in squared [] brackets. The first entry in each bracket is given in bold and underlined. This denotes the LEAD responsibility. Subsequent entries also have responsibilities under that lead.

2
POLICY OBJECTIVE 1:
INCREASE EQUITABLE ACCESS AT ALL LEVELS OF EDUCATION
Policy objective indicators:
Net Enrolment Rates (by gender, district, urban/rural)
Completion rates (by gender, district, urban/rural)
Outputs Targets by 2016 Strategies [Responsibility] Source/verification
1.1 Expand access to Pre-School Education (3-4 yr olds)
Output Owner:
District Managers
1.1.1 Reach 50% GER in both rural and urban areas of each district 1.
1.1.1 Using mapping model, undertake detailed mapping exercise in each district to determine supply and demand, results of which will provide basis for expansion. [DM, MA]
1.1.2 Attach pre schools to existing primary schools prioritising the most needy, least well served locations based on socio-economic and poverty/deprivation indicators [DM, MA, MOEY]
1.1.3 Encourage and facilitate the establishment of community and private pre-schools, prioritising the most needy, least well served locations based on socio-economic and poverty/deprivation indicators [DM, MA, MOEY]
1.1.4 Establish new separate pre-schools in remote rural communities where attachment to primary school is not an option. [DM, MA, MOEY]
DEC Access and Infrastrcutre Masterplan
DEC Annual workplans
Register of Schools
Approval of licence of school
EMIS reports
MOEY Pre-School Unit
1.2 Increased enrolment and completion at primary level
1.2.1 100% NER in both rural and urban areas of each district
1.2.1 Primary schools work with PTAs and community to identify out of school and neediest children and provide awareness and sensitisation to enrol missing
DEC Access and Infrastrcutre Masterplan
1 Focus will be on rural areas as most urban areas are close to or above the target. [Is there any difficulty about rural/urban boundary definitions? Dispute
potential?]

3
Output Owner:
District Managers
1.2.2 Repetition rate reduced by 50% in all districts, with no increase in drop out rate.
children. [SP, DEC Truancy Unit, DM]
1.2.2 Sensitisation of households to the value and benefits of education to 5 year olds and where facilities exist encourage enrolment of children in ECED programmes and pre-schools [DM, School Principals]
1.2.3 Provide support and guidance to schools on how to effectively monitor and develop school level actions to reduce repetition (see also strategies under quality that target under-achievement) [ DEC, MA]
1.2.4 Establish and implement a National School Feeding Programme that targets the poorest, most vulnerable children and communities [ESS]
1.2.5 Collaborate with Ministry of Human Resource Development and Social Transformation in the promotion of the BOOST programme on conditional cash transfers to needy households for school attendance[DM, MA, ESS]
1.2.6 Undertake a review of MOEY free textbook policy, specifically looking at cost and coverage and value for money and looking at more cost effective options [PPU]
1.2.7 Based on above, develop and implement (through initial pilots if appropriate) revised textbook policy. [PPU]
DEC Annual workplans
Register of Schools
Approval of licence of school
EMIS reports
1.3 Expanded access and increased completion rates at the secondary level.
1.3.1 Increase GER to minimum of 74% in each district
1.3.2 Increase NER to 60% in each district
1.3.3 Drop out rate
1.3.1 Using mapping model, conduct school mapping exercise to determine supply and demand, with specific focus on the major under-served rural areas (e.g. Toledo, Cayo, Corozal and Orange Walk) [PPU, DM]
1.3.2 Identify schools suitable for expansion [PPU,
DEC Access and Infrastrcutre Masterplan
DEC Annual workplans

4
Output Owner:
District Managers
halved in each district
1.3.4 Repetition rate halved in each district
DM]
1.3.3 Identify sites for new secondary schools [PPU, DM]
1.3.4 Continue to support the implementation of the secondary school financing reform [CEO, CEdO]
1.3.5 Roll out the implementation of the ‘performance’ aspect of the financing reform equation. [CEO]
1.3.6 Provide support and guidance to schools on how to effectively monitor and develop school level actions to reduce repetition and drop out. (See also strategies under quality that target student under-achievement) [ DEC, MA]
1.3.7 Maximise the incentives applied through the Secondary Financing Reform to reduce repetition and drop out [MA]
1.3.8 Reduce financial burden of fees paid by needy students through introduction of standardised fee structure under the Secondary School Financing Reform [ESS, CEO]
1.3.9 Undertake a review of MOEY textbook loan scheme, specifically looking at cost and coverage and value for money and looking at more cost effective options [PPU].
Register of Schools
Approval of licence of school
EMIS reports
1.4 Increased enrolment in technical and vocational programmes
1.4.1 All ITVETs operate at minimum 90% capacity2 for full time programmes, including pre-vocational.
1.4.1 Raise public awareness of value of TVET. [ETES]
Include TVET options with secondary school curriculum [ETES]
1.4.2 Improve the collaboration through establishing
EMIS reports
ETES reports
2 Current capacity is regarded as 200 full time day students per ITVET.

5
Output Owner:
Head of ETES
1.4.2 All ITVETs offer customised courses (part-time) for minimum 100 trainees per year
working parties between High Schools and ITVETs to increase opportunities to deliver relevant courses to HS students, including pre vocational programmes. [ETES, ITVETs]
1.4.3 Increase program offering at ITVET to suit particular local economic and employment opportunities [ETES, ITVETs]
1.4.4 Strengthen capacity of ITVETs to offer pre-vocational programmes [ETES, ITVETs]
(see also strategy in next section on HRD Strategy and Labour Market Survey
1.4.5 Strengthen the linkages between ITVETs and industry in order to [ITVETS, ETES, NCTVET]:
• promote greater and more localised relevance of TVET courses
• use locally available industry and commerce persons and companies to support the delivery of courses
• provide opportunities for ITVET staff to improve their skills and competencies
• maximise industry placements and work experience for ITVET students
• explore options for off-site (e.g. industry or agriculture based) delivery of special courses
1.4.6 Support ITVETs to offer evening and summer programmes [ETES, ITVETs]
1.4.7 Provide incentives for more flexible deployment of trainers with key skills [ETES, IVETs]
1.5 Improve completion 1.5.1 Annual increase of 10% of Form 4
1.5.1 Develop incentives (target subsidies) to attract applicants, particularly male applicants, into under-
EMIS reports

6
rates at tertiary3 level.
Output Owner:
TPSACES
graduates gaining access to tertiary institutions.
1.5.2 Reduce drop out rates at associate degree level by 50% in each centre.
1.5.3 Reduce the current gender disparity in tertiary education from 2:1 (female : male) to 3:2
1.5.4 Increased cost sharing
subscribed subject areas, particularly applied science, technology and agriculture courses [TPSACES, UB, JC]
1.5.2 Develop further ICT-based open and distance learning programmes [UB, JC]
1.5.3 Undertake assessment of current status of tertiary education financing, with emphasis on financial barriers to access of poorer students, and consider options for improved and more equitable cost sharing through Development Finance Corporation [TPSACES]
JC and UB reports
1.6 Improve enrolment of children with Special Education Needs
Output Owner:
ESS
1.6.1 All referred SEN children enrolled in school.
1.6.1 Work with Health and other government departments to identify SEN children [DMs]
1.6.2 Improve referral services [ESS with other Government Departments, DEC]
1.6.3 Maintain register of SEN children [DEC]
1.6.4 Allocate referred children to best placed school. [DEC]
1.6.5 Ensure transport provision where necessary [DEC]
1.6.6 Sensitise schools and communities to SEN;
DEC and ESS reports
EMIS reports
TEDS data
3 Tertiary in the context of Belize refers to both Junior College (Associate Degree) and University level (Associate and Bachelors degree). It does not include
TVET, though entry to full time ITVET programmes (not including pre-vocational) requires completion of Form 4 with a High School certificate.

7
work to reduce “hiding” and stigma. [ESS, DEC, MA, SP]]
1.6.7 Provide all teachers with the knowledge and skills required to identify a child who might require special assistance and make the referral [ESS, TEDS]
1.6.8 Introduce a systematic training programme for SEN specialists [TEDS]
1.7 Expand access to pre-service and in-service professional development for teachers
Output Owner:
TEDS
1.7 Pre-primary, primary and secondary programmes available in all three regions
1.7.1 Identify support infra-structure and new delivery centres to expand delivery of all teacher education programmes [TEDS, CEO]
1.7.2 Give special focus to increasing the number of delivery points for pre-primary and secondary teacher education programmes [TEDS, CEO]
1.7.3 Suitable technologies identified to enable online and blended delivery of programmes [TEDS, CEO]
1.7.4 Expand pool of CPDs by establishing mechanism through which teacher training institutions can offer CPDs [TEDS, BBTE]
TEDS reports
JC and UB reports
1.8 Applying new technologies to increase access and achievement
Output Owner:
PPU/SRS
1.8 Increased number of educational programmes delivered through on-line or multi-media alternatives
1.8.1 Undertake feasibility study of use of ICT (electronic book) alternatives to textbooks. If feasible develop and run pilot programme to test application. [PPU, ICT Unit]
1.8.2 Examine options (including looking at the ESUSAT model)for open schooling (open centres) via ICT for certain subjects in rural areas as well as for school age children who are not in school. [PPU, UB]
1.8.3 Examine opportunities to deliver in-service training programmes through on-line or multi-
PPU/ICT and QAFS reports

8
media modalities. [QADS,TEDS, ETES, SRS]
1.8.4 Examine opportunities to delivery part or all of core and option secondary curriculum using ICT.[QADS, PPU]
1.8.5 Develop on-line or multi-media programmes for Adult and Continuing Education [TPSACE]
1.8.6 As part of textbook review, consider ICT alternatives [PPU/SRS, QADS]
1.8.5 Use ICT for teacher resources [QADS, TEDS]
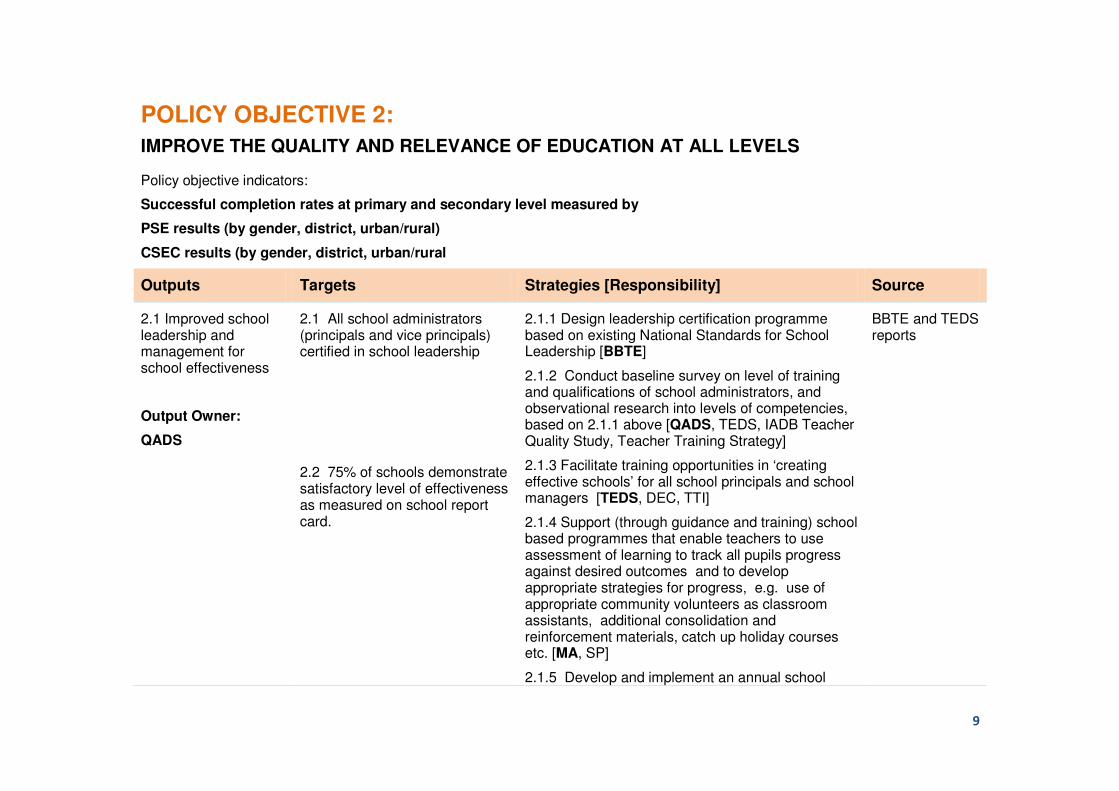
9
POLICY OBJECTIVE 2:
IMPROVE THE QUALITY AND RELEVANCE OF EDUCATION AT ALL LEVELS
Policy objective indicators:
Successful completion rates at primary and secondary level measured by
PSE results (by gender, district, urban/rural)
CSEC results (by gender, district, urban/rural
Outputs Targets Strategies [Responsibility] Source
2.1 Improved school leadership and management for school effectiveness
Output Owner:
QADS
2.1 All school administrators (principals and vice principals) certified in school leadership
2.2 75% of schools demonstrate satisfactory level of effectiveness as measured on school report card.
2.1.1 Design leadership certification programme based on existing National Standards for School Leadership [BBTE]
2.1.2 Conduct baseline survey on level of training and qualifications of school administrators, and observational research into levels of competencies, based on 2.1.1 above [QADS, TEDS, IADB Teacher Quality Study, Teacher Training Strategy]
2.1.3 Facilitate training opportunities in ‘creating effective schools’ for all school principals and school managers [TEDS, DEC, TTI]
2.1.4 Support (through guidance and training) school based programmes that enable teachers to use assessment of learning to track all pupils progress against desired outcomes and to develop appropriate strategies for progress, e.g. use of appropriate community volunteers as classroom assistants, additional consolidation and reinforcement materials, catch up holiday courses etc. [MA, SP]
2.1.5 Develop and implement an annual school
BBTE and TEDS reports
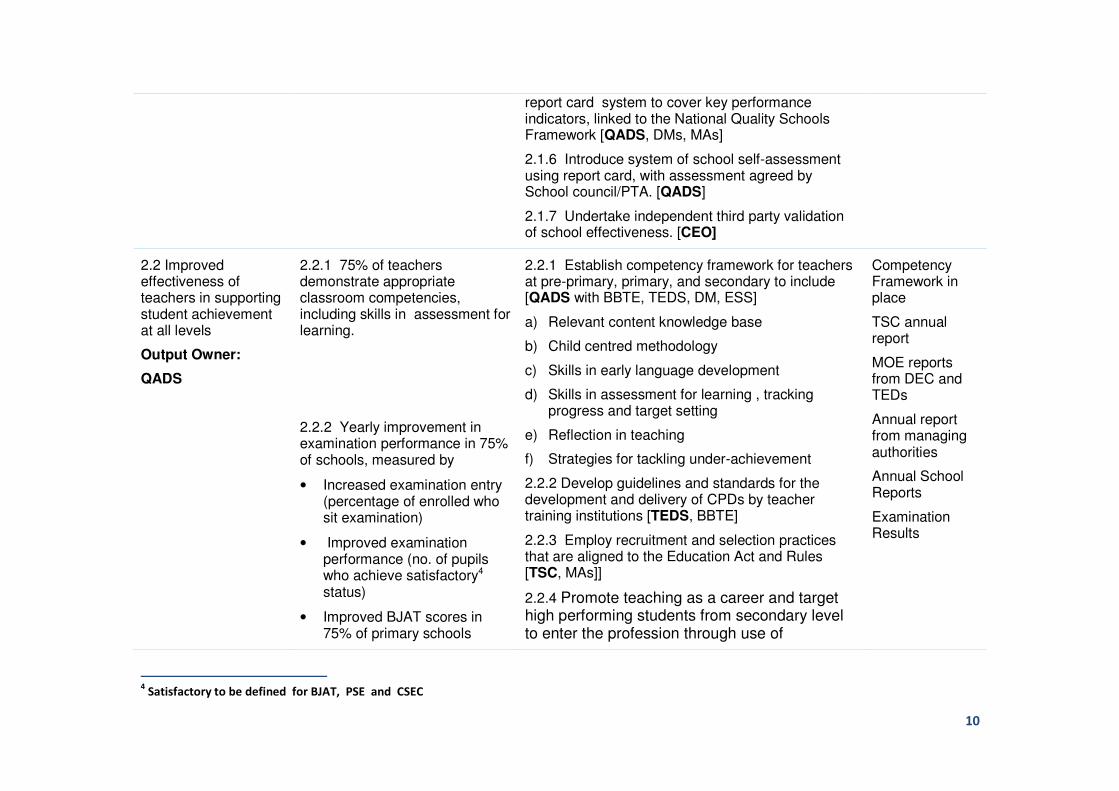
10
report card system to cover key performance indicators, linked to the National Quality Schools Framework [QADS, DMs, MAs]
2.1.6 Introduce system of school self-assessment using report card, with assessment agreed by School council/PTA. [QADS]
2.1.7 Undertake independent third party validation of school effectiveness. [CEO]
2.2 Improved effectiveness of teachers in supporting student achievement at all levels
Output Owner:
QADS
2.2.1 75% of teachers demonstrate appropriate classroom competencies, including skills in assessment for learning.
2.2.2 Yearly improvement in examination performance in 75% of schools, measured by
• Increased examination entry (percentage of enrolled who sit examination)
• Improved examination performance (no. of pupils who achieve satisfactory4 status)
• Improved BJAT scores in 75% of primary schools
2.2.1 Establish competency framework for teachers at pre-primary, primary, and secondary to include [QADS with BBTE, TEDS, DM, ESS]
a) Relevant content knowledge base
b) Child centred methodology
c) Skills in early language development
d) Skills in assessment for learning , tracking progress and target setting
e) Reflection in teaching
f) Strategies for tackling under-achievement
2.2.2 Develop guidelines and standards for the development and delivery of CPDs by teacher training institutions [TEDS, BBTE]
2.2.3 Employ recruitment and selection practices that are aligned to the Education Act and Rules [TSC, MAs]]
2.2.4 Promote teaching as a career and target high performing students from secondary level to enter the profession through use of
Competency Framework in place
TSC annual report
MOE reports from DEC and TEDs
Annual report from managing authorities
Annual School Reports
Examination Results
4 Satisfactory to be defined for BJAT, PSE and CSEC

11
2.2.3 Increase in the number of young people opting for and qualifying in science and technology (SaT) subjects at CSEC, and opting for SaT courses at Associate Degree and Bachelors level.
incentives(TEDS)
2.2.4 Strengthen school monitoring, support, and supervision, so that teachers are adequately supported in ensuring that students are learning.[SP, DEC, MA, ETES]
2.2.5 Strengthen teaching of primary science through teacher training and improved materials [TEDS, QADS]
2.3.6 Develop in-service programmes for all secondary SaT teachers. [TEDS]
2.2.7 Ensure all primary and secondary leavers are given the opportunity to sit the PSE and CSEC examinations [MA, ESS]
2.2.8 Establish cluster schools through which teachers engage in lesson studies and jointly develop approaches to deal with curriculum delivery [QADS]
2.2.9 Develop an after school programme to assist students in need [ESS, MA, SPS]
2.3 Approved Teacher Education (TE) programmes effectively delivered by all institutions training teachers
Output Owner:
BBTE
2.3.1 All TE programmes comply with established minimum professional standards, including use of appropriate resources.
2.3.2 All TE staff have appropriate qualifications and experience required to deliver courses
2.3.1 Develop a TE strategy [TEDS, BBTE]
2.3.2 Review all TE programmes for currency and relevance to agreed international/regional standards. [BBTE, TEDS]
2.3.3 Establish standards for teacher education programmes at pre-primary, primary, and secondary levels aligned to the teacher competency framework. [BBTE, TEDS]
2.3.4 Develop and implement Quality Assurance
Program Specifications and standards
TE profiles in place
TE database
Programme reports
Annual

12
mechanisms with minimum professional standards to monitor the delivery of approved teacher education programmes at the pre-primary, primary, and secondary levels [BBTE, TEDS]
2.3.5 Regularly monitor all TE programmes to ensure compliance to minimum professional and academic qualifications for teacher educators [BBTE, TEDS]
2.3.6 Facilitate regular access to relevant professional development opportunities for teacher education staff , linked to agreed national, district and school priorities. [TEDS]
2.3.7 Ensure alignment between TEd programmes and all QA procedures and instruments (e.g. school supervision) [QADS, TEDS, BBTE]
2.3.8 Develop and introduce components into all TE programmes that prepare teachers to support the achievement of children with SEN [TEDS, ESS]
2.3.9 Develop partnerships with cooperating and demonstration schools to expand exposure of student-teachers to school environment prior to the internship [TEDS]
professional development calendar
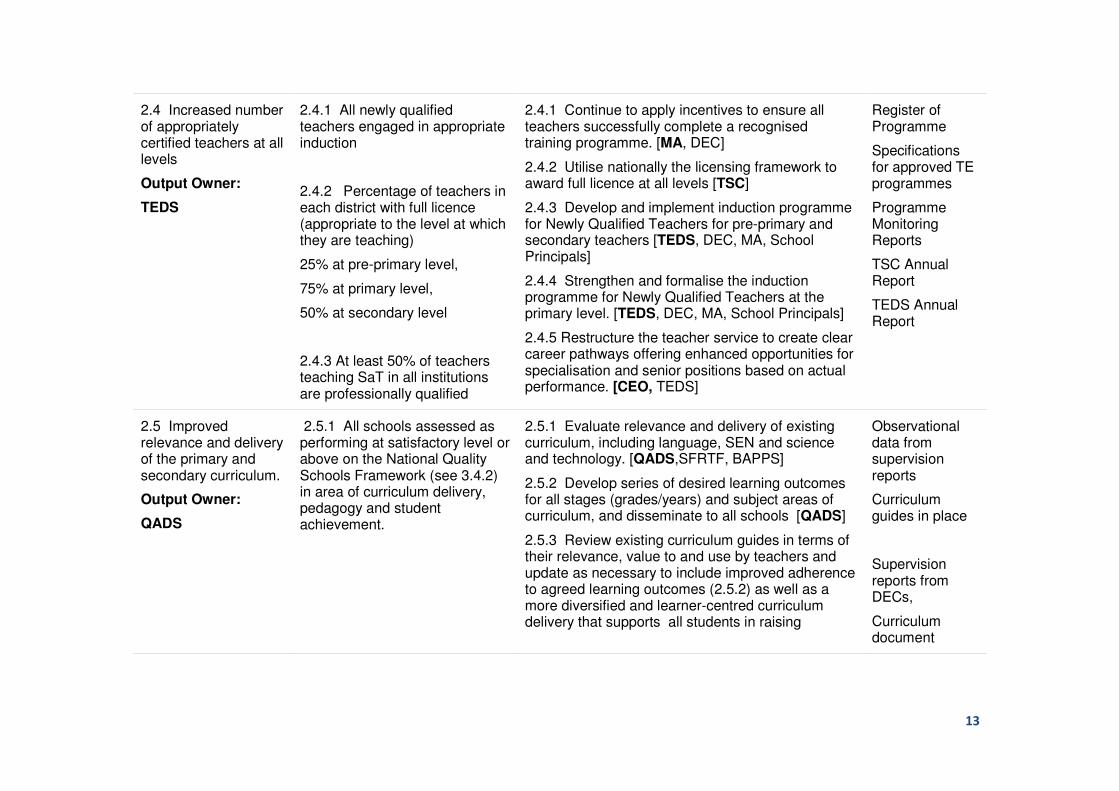
13
2.4 Increased number of appropriately certified teachers at all levels
Output Owner:
TEDS
2.4.1 All newly qualified teachers engaged in appropriate induction
2.4.2 Percentage of teachers in each district with full licence (appropriate to the level at which they are teaching)
25% at pre-primary level,
75% at primary level,
50% at secondary level
2.4.3 At least 50% of teachers teaching SaT in all institutions are professionally qualified
2.4.1 Continue to apply incentives to ensure all teachers successfully complete a recognised training programme. [MA, DEC]
2.4.2 Utilise nationally the licensing framework to award full licence at all levels [TSC]
2.4.3 Develop and implement induction programme for Newly Qualified Teachers for pre-primary and secondary teachers [TEDS, DEC, MA, School Principals]
2.4.4 Strengthen and formalise the induction programme for Newly Qualified Teachers at the primary level. [TEDS, DEC, MA, School Principals]
2.4.5 Restructure the teacher service to create clear career pathways offering enhanced opportunities for specialisation and senior positions based on actual performance. [CEO, TEDS]
Register of Programme
Specifications for approved TE programmes
Programme Monitoring Reports
TSC Annual Report
TEDS Annual Report
2.5 Improved relevance and delivery of the primary and secondary curriculum.
Output Owner:
QADS
2.5.1 All schools assessed as performing at satisfactory level or above on the National Quality Schools Framework (see 3.4.2) in area of curriculum delivery, pedagogy and student achievement.
2.5.1 Evaluate relevance and delivery of existing curriculum, including language, SEN and science and technology. [QADS,SFRTF, BAPPS]
2.5.2 Develop series of desired learning outcomes for all stages (grades/years) and subject areas of curriculum, and disseminate to all schools [QADS]
2.5.3 Review existing curriculum guides in terms of their relevance, value to and use by teachers and update as necessary to include improved adherence to agreed learning outcomes (2.5.2) as well as a more diversified and learner-centred curriculum delivery that supports all students in raising
Observational data from supervision reports
Curriculum guides in place
Supervision reports from DECs,
Curriculum document

14
2.5.2 Appropriate language support programmes in place in all schools.
2.5.3 Revised secondary curriculum based around core and options adopted in all secondary schools and ITVETs
achievement [QADS]
2.5.4 Provide training to teachers in the use and localisation5 of curriculum, and assessment, during in service training[QADS, DEC]
2.5.5 Introduce more practical experiences and early technical and vocational opportunities into the existing primary curriculum in order to build pupils’ skills, aptitude and appreciation of practical subjects. [QADS, ETES]
2.5.6 Provide training to school leaders in the support and monitoring of more effective and localised curriculum delivery.[TEDs, DECs]
2.5.7 Provide training to teacher educators in the use of curriculum guides and the more effective delivery of curriculum, including its localisation [TEDs, DECs]
2.5.8 Monitor the effective delivery of curriculum in schools, including teachers ability in formative assessment of pupil progress. [DECs, MAs]
2.5.9 Review the PSE and look to improve its utility to provide consistent year on year achievement data [QADS]
2.5.9 Train school principals and supervisors in observational skills to effectively monitor and support curriculum delivery. [TEDS]
2.5.10 Undertake a national survey into the status of learners’ English Language proficiency, using school based data; the status of instructional programmes; and the impact English proficiency has on overall
School based data
Surveys
Curriculum documents
NQF document
CSEC reports
5 Localisation here refers to the capacity of teachers to adapt the curriculum to both the particular social, cultural and economic context of learners as well
as the interests and ability range of learners
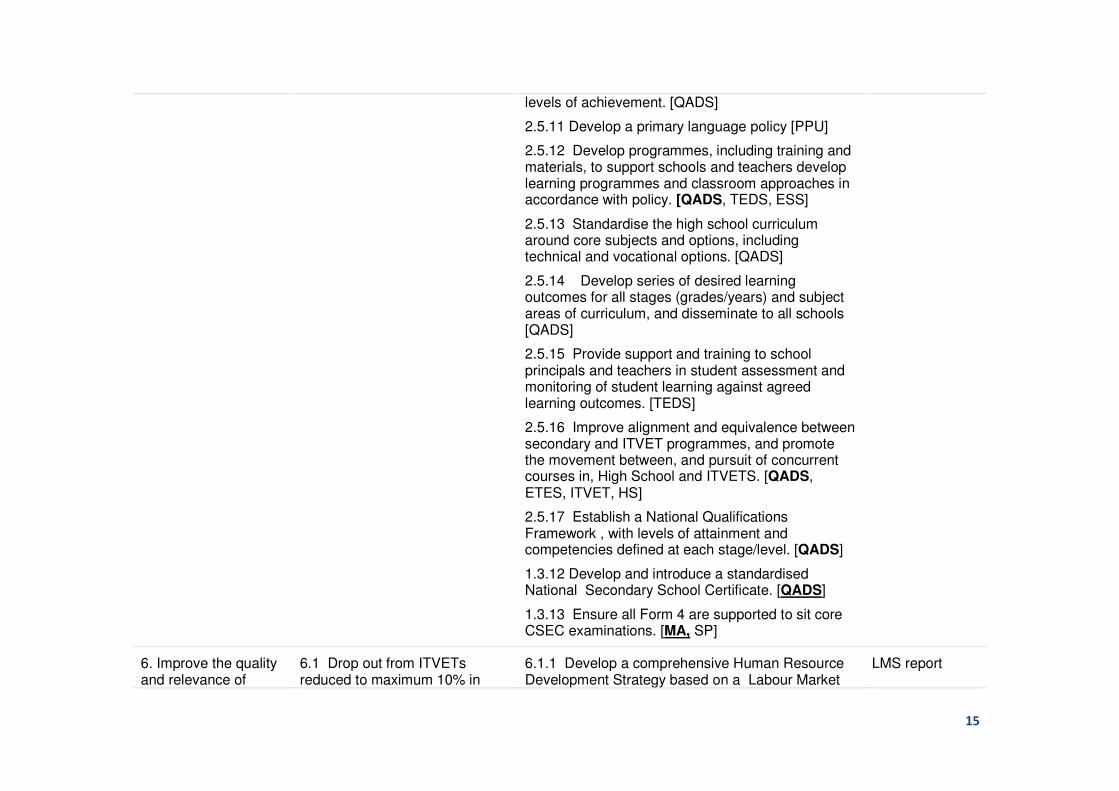
15
levels of achievement. [QADS]
2.5.11 Develop a primary language policy [PPU]
2.5.12 Develop programmes, including training and materials, to support schools and teachers develop learning programmes and classroom approaches in accordance with policy. [QADS, TEDS, ESS]
2.5.13 Standardise the high school curriculum around core subjects and options, including technical and vocational options. [QADS]
2.5.14 Develop series of desired learning outcomes for all stages (grades/years) and subject areas of curriculum, and disseminate to all schools [QADS]
2.5.15 Provide support and training to school principals and teachers in student assessment and monitoring of student learning against agreed learning outcomes. [TEDS]
2.5.16 Improve alignment and equivalence between secondary and ITVET programmes, and promote the movement between, and pursuit of concurrent courses in, High School and ITVETS. [QADS, ETES, ITVET, HS]
2.5.17 Establish a National Qualifications Framework , with levels of attainment and competencies defined at each stage/level. [QADS]
1.3.12 Develop and introduce a standardised National Secondary School Certificate. [QADS]
1.3.13 Ensure all Form 4 are supported to sit core CSEC examinations. [MA, SP]
6. Improve the quality and relevance of
6.1 Drop out from ITVETs reduced to maximum 10% in
6.1.1 Develop a comprehensive Human Resource Development Strategy based on a Labour Market
LMS report

16
Technical and Vocational Education and Training
Output Owner:
ETES
each ITVET
6.2 75% of ITVET graduates either find employment in work related to qualification or progress to further education and training
Survey that examines current and predicts future labour market trends and opportunities (in Belize and the region). Use outcomes as basis to re-orient tertiary programmes to economic opportunities and examine options to incentivise take up of programmes in emerging economic areas. [TPSACES, UB ETES]
6.1.2 Undertake a tracer study to identify employment pathways of ITVET graduates. [ETES]
6.1.3 Develop closer links with industry in course design and delivery [ IVETS, ETES]
6.1.4 Provide pre-service and in-service Professional Development to all teachers, focus of on both content skills and pedagogy, including competency based assessment [ETES]
6.1.5 Update TVET curricula to align with NVQ and ensure alignment of levels 1 and 2 with secondary curriculum. Support and monitor teachers in delivery of curriculum [ETES]
6.1.6 Introduce new programmes in emerging economic areas [IVETS]
6.1.7 Select trainers who offer combination of skills in two or more technical/vocational areas [ETES, IVETS]
6.1.8 Link existing Adult and Continuing Education programmes to ITVETs, providing recognition of ACE as entry to TVET programmes. [TPSACES, ETES, QADS] (see also NQF at 2.5.9 above)
6.1.9 Introduce institutional certification based on application of agreed standards of CVQ. [ETES]
ITVET reports
Tracer study

17
7. Improve education services to children with SEN
Output Owner:
ESS
7.1 50% of identified SEN children formally referred and placed in schools.
7.2 10% increase in places at existing SEN centres
7.1 .1 Undertake national study of SEN status and provision. [ESS]
7.1.2 Ongoing comprehensive training for principals and teachers for inclusion, SEN [ESS]
7.1.3 Provide teachers and principals with required resources to support inclusions, e.g. manuals, kits, batteries, real-time access to expertise [ESS, DEC]
7.1.4 Develop standards for existing centres [ESS]
7.1.5 Monitor services for existing centres based on standards for improvement [ESS, DEC]
7.1.6 Examine supply and demand for expanding existing centres and/or opening new centres [ESS, DEC]
7.1.7 Develop links with NGO providers [ESS, DEC]
7.1.8 Seek corporate sponsorship [ESS]
ESS Annual Report
DEC Annual Report
EMIS data
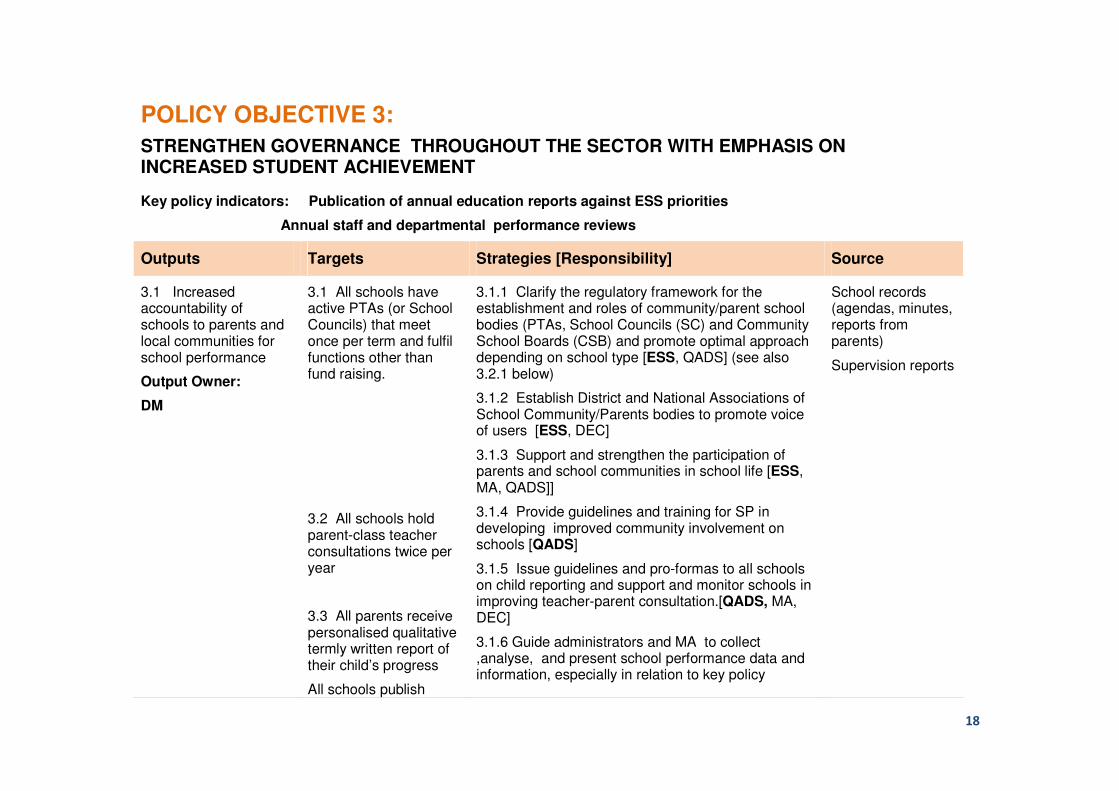
18
POLICY OBJECTIVE 3:
STRENGTHEN GOVERNANCE THROUGHOUT THE SECTOR WITH EMPHASIS ON INCREASED STUDENT ACHIEVEMENT
Key policy indicators: Publication of annual education reports against ESS priorities
Annual staff and departmental performance reviews
Outputs Targets Strategies [Responsibility] Source
3.1 Increased accountability of schools to parents and local communities for school performance
Output Owner:
DM
3.1 All schools have active PTAs (or School Councils) that meet once per term and fulfil functions other than fund raising.
3.2 All schools hold parent-class teacher consultations twice per year
3.3 All parents receive personalised qualitative termly written report of their child’s progress
All schools publish
3.1.1 Clarify the regulatory framework for the establishment and roles of community/parent school bodies (PTAs, School Councils (SC) and Community School Boards (CSB) and promote optimal approach depending on school type [ESS, QADS] (see also 3.2.1 below)
3.1.2 Establish District and National Associations of School Community/Parents bodies to promote voice of users [ESS, DEC]
3.1.3 Support and strengthen the participation of parents and school communities in school life [ESS, MA, QADS]]
3.1.4 Provide guidelines and training for SP in developing improved community involvement on schools [QADS]
3.1.5 Issue guidelines and pro-formas to all schools on child reporting and support and monitor schools in improving teacher-parent consultation.[QADS, MA, DEC]
3.1.6 Guide administrators and MA to collect ,analyse, and present school performance data and information, especially in relation to key policy
School records (agendas, minutes, reports from parents)
Supervision reports
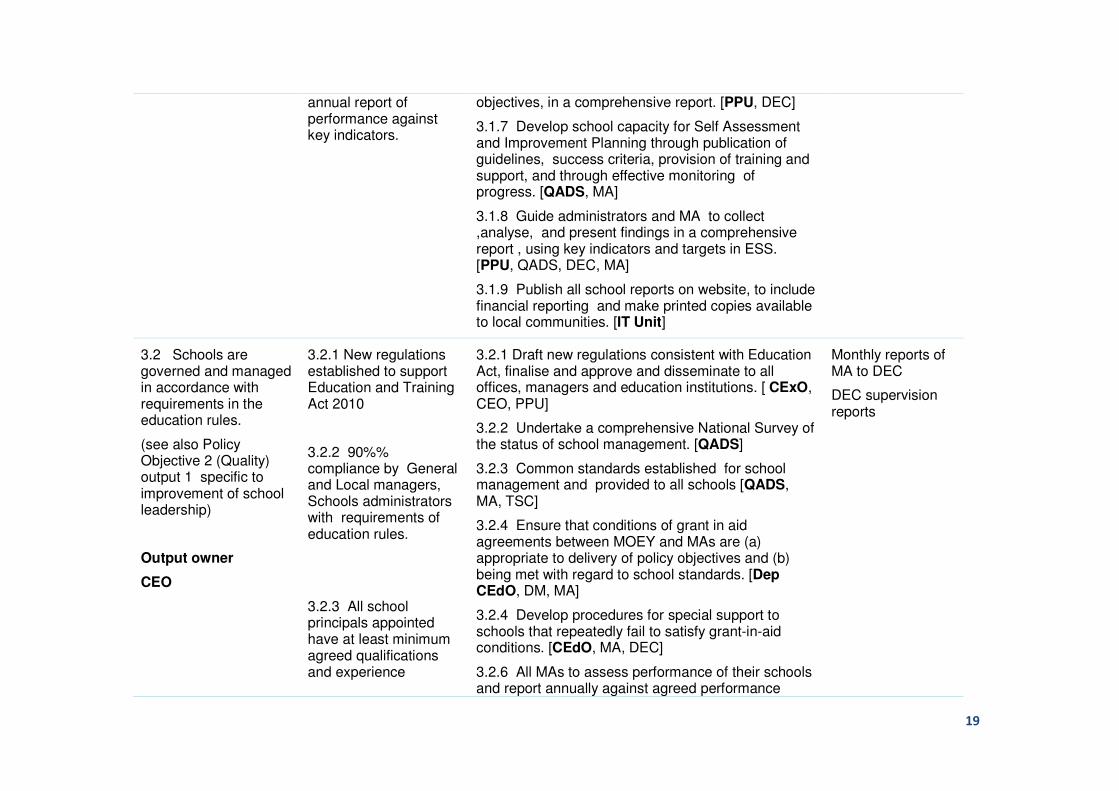
19
annual report of performance against key indicators.
objectives, in a comprehensive report. [PPU, DEC]
3.1.7 Develop school capacity for Self Assessment and Improvement Planning through publication of guidelines, success criteria, provision of training and support, and through effective monitoring of progress. [QADS, MA]
3.1.8 Guide administrators and MA to collect ,analyse, and present findings in a comprehensive report , using key indicators and targets in ESS. [PPU, QADS, DEC, MA]
3.1.9 Publish all school reports on website, to include financial reporting and make printed copies available to local communities. [IT Unit]
3.2 Schools are governed and managed in accordance with requirements in the education rules.
(see also Policy Objective 2 (Quality) output 1 specific to improvement of school leadership)
Output owner
CEO
3.2.1 New regulations established to support Education and Training Act 2010
3.2.2 90%% compliance by General and Local managers, Schools administrators with requirements of education rules.
3.2.3 All school principals appointed have at least minimum agreed qualifications and experience
3.2.1 Draft new regulations consistent with Education Act, finalise and approve and disseminate to all offices, managers and education institutions. [ CExO, CEO, PPU]
3.2.2 Undertake a comprehensive National Survey of the status of school management. [QADS]
3.2.3 Common standards established for school management and provided to all schools [QADS, MA, TSC]
3.2.4 Ensure that conditions of grant in aid agreements between MOEY and MAs are (a) appropriate to delivery of policy objectives and (b) being met with regard to school standards. [Dep CEdO, DM, MA]
3.2.4 Develop procedures for special support to schools that repeatedly fail to satisfy grant-in-aid conditions. [CEdO, MA, DEC]
3.2.6 All MAs to assess performance of their schools and report annually against agreed performance
Monthly reports of MA to DEC
DEC supervision reports
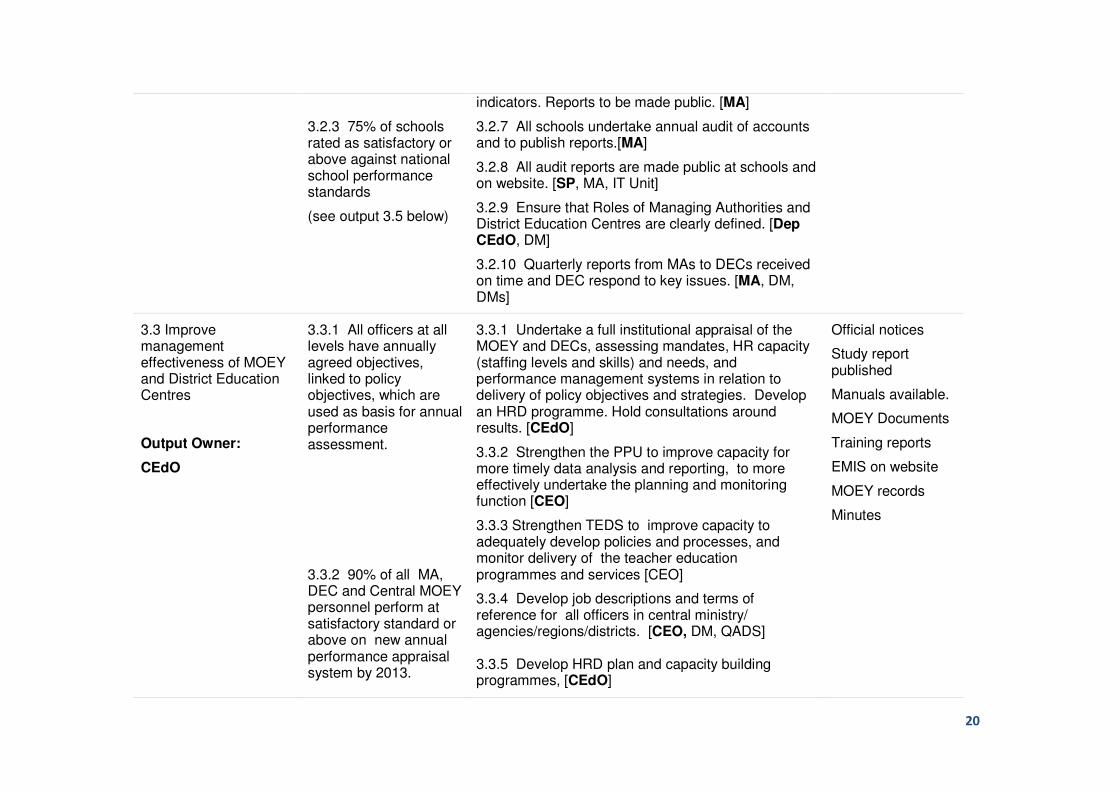
20
3.2.3 75% of schools rated as satisfactory or above against national school performance standards
(see output 3.5 below)
indicators. Reports to be made public. [MA]
3.2.7 All schools undertake annual audit of accounts and to publish reports.[MA]
3.2.8 All audit reports are made public at schools and on website. [SP, MA, IT Unit]
3.2.9 Ensure that Roles of Managing Authorities and District Education Centres are clearly defined. [Dep CEdO, DM]
3.2.10 Quarterly reports from MAs to DECs received on time and DEC respond to key issues. [MA, DM, DMs]
3.3 Improve management effectiveness of MOEY and District Education Centres
Output Owner:
CEdO
3.3.1 All officers at all levels have annually agreed objectives, linked to policy objectives, which are used as basis for annual performance assessment.
3.3.2 90% of all MA, DEC and Central MOEY personnel perform at satisfactory standard or above on new annual performance appraisal system by 2013.
3.3.1 Undertake a full institutional appraisal of the MOEY and DECs, assessing mandates, HR capacity (staffing levels and skills) and needs, and performance management systems in relation to delivery of policy objectives and strategies. Develop an HRD programme. Hold consultations around results. [CEdO]
3.3.2 Strengthen the PPU to improve capacity for more timely data analysis and reporting, to more effectively undertake the planning and monitoring function [CEO]
3.3.3 Strengthen TEDS to improve capacity to adequately develop policies and processes, and monitor delivery of the teacher education programmes and services [CEO]
3.3.4 Develop job descriptions and terms of reference for all officers in central ministry/ agencies/regions/districts. [CEO, DM, QADS] 3.3.5 Develop HRD plan and capacity building programmes, [CEdO]
Official notices
Study report published
Manuals available.
MOEY Documents
Training reports
EMIS on website
MOEY records
Minutes
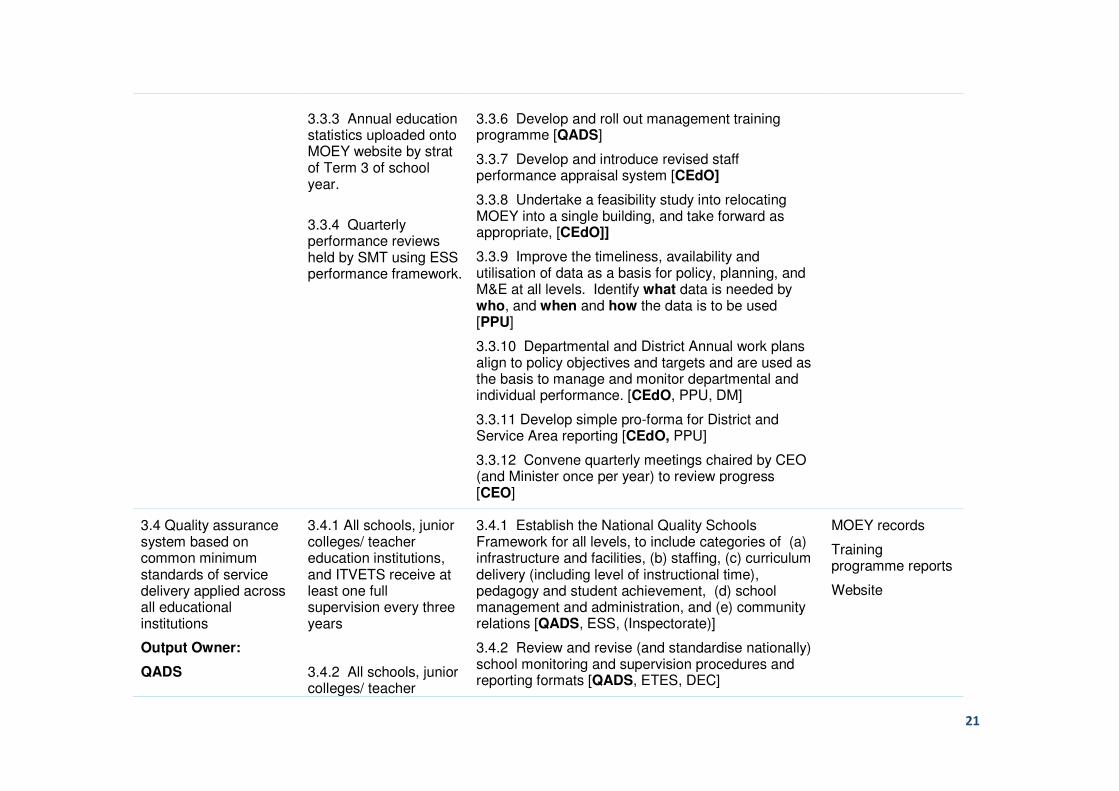
21
3.3.3 Annual education statistics uploaded onto MOEY website by strat of Term 3 of school year.
3.3.4 Quarterly performance reviews held by SMT using ESS performance framework.
3.3.6 Develop and roll out management training programme [QADS]
3.3.7 Develop and introduce revised staff performance appraisal system [CEdO]
3.3.8 Undertake a feasibility study into relocating MOEY into a single building, and take forward as appropriate, [CEdO]]
3.3.9 Improve the timeliness, availability and utilisation of data as a basis for policy, planning, and M&E at all levels. Identify what data is needed by who, and when and how the data is to be used [PPU]
3.3.10 Departmental and District Annual work plans align to policy objectives and targets and are used as the basis to manage and monitor departmental and individual performance. [CEdO, PPU, DM]
3.3.11 Develop simple pro-forma for District and Service Area reporting [CEdO, PPU]
3.3.12 Convene quarterly meetings chaired by CEO (and Minister once per year) to review progress [CEO]
3.4 Quality assurance system based on common minimum standards of service delivery applied across all educational institutions
Output Owner:
QADS
3.4.1 All schools, junior colleges/ teacher education institutions, and ITVETS receive at least one full supervision every three years
3.4.2 All schools, junior colleges/ teacher
3.4.1 Establish the National Quality Schools Framework for all levels, to include categories of (a) infrastructure and facilities, (b) staffing, (c) curriculum delivery (including level of instructional time), pedagogy and student achievement, (d) school management and administration, and (e) community relations [QADS, ESS, (Inspectorate)]
3.4.2 Review and revise (and standardise nationally) school monitoring and supervision procedures and reporting formats [QADS, ETES, DEC]
MOEY records
Training programme reports
Website

22
education institutions, and ITVETS receive at least one support visit (spot check) per annum.
3.4.3 Provide CPD to all supervisors [QADS]
3.4.4 Publish supervision reports on website [PPU, IT Unit]
3.4.5 Establish a programme monitoring framework for Teacher Education programmes (BBTE, TEDS)
3.5 MOEY publishes through website annual report of performance against targets of Education Sector Strategy.
Output Owner:
PPU
3.5.1 All reports uploaded onto MOEY website within one month of submission
3.5.1 Upgrade the MOEY website [PPU, IT] 3.5.2 All departments produce annual reports by December of following school year to include progress against targets in areas of responsibility defined in ESS [CEdO] 3.5.3 MOEY produces Annual Report [PPU]
Website

POLICY OUTPUT TARGET INDICATORS BASELINE
2011
MILESTONE
2012
MILESTONE
2014
TARGET 2016 SOURCE
Equitable Access at all level of Education
Net Enrolment Rate pre-primary (by gender, district and location)
Annual School Census, Population Census
Net Enrolment Rate primary (by gender, district and location)
Annual School Census, Population Census
Net Enrolment Rate secondary (by gender, district and location)
Annual School Census, Population Census
Net Enrolment Rate tertiary (by gender, district and location)
Annual School Census, Population Census
Completion Rate pre-primary (by gender, district and location)
50% 55% 57% 58% Annual School Census, Population Census
Completion Rate primary (by gender, district and location)
Annual School Census, Population Census
Completion Rate secondary (by gender, district and location)
Annual School Census, Population Census
Completion Rate tertiary (by gender, district and location)
Annual School Census, Population Census
1.1 Expand access to Pre-School Education (3-4 yr olds)
Gross Enrolment Rate pre-primary (by gender, district and location)
43% 48% 49% 50% Annual School Census, Population Census
Net Enrolment Rate pre-primary (by gender, district and location)
Annual School Census, Population Census
1.1.1 Reach 50% GER in both rural and urban areas of each district
Gross Enrolment Rate pre-primary (by gender, district and location)
43% 48% 49% 50% Annual School Census, Population Census
1.2 Increased enrolment and completion at primary level
Gross Enrolment Rate primary (by gender, district and location)
106% 103% 103% 105% Annual School Census, Population Census
Net Enrolment Rate primary (by gender, district and location)
Annual School Census, Population Census
Completion Rate primary (by gender, district and location)
Annual School Census, Population Census
1.2.1 100% NER in both rural and urban areas of each district
Net Enrolment Rate primary (by gender, district and location)
100% Annual School Census, Population Census
1.2.2 Repetition rate Repetition rate primary (by gender, district and 6% 5% 4% 3% Annual School Census, Population

POLICY OUTPUT TARGET INDICATORS BASELINE
2011
MILESTONE
2012
MILESTONE
2014
TARGET 2016 SOURCE
reduced by 50% in all districts, with no increase in drop out rate.
location) Census
Drop-out rate primary (by gender, district and location)
1% 1% 1% 1% Annual School Census, Population Census
1.3 Expanded access and increased completion rates at the secondary level.
Gross Enrolment Rate secondary (by gender, district and location)
63% 68% 73% 74% Annual School Census, Population Census
Net Enrolment Rate secondary (by gender, district and location)
Annual School Census, Population Census
Completion Rate secondary (by gender, district and location)
Annual School Census, Population Census
1.3.1 Increase GER to minimum of 70% in each district
Gross Enrolment Rate secondary (by gender, district and location)
63% 68% 73% 74% Annual School Census, Population Census
1.3.2 Increase NER to 60% in each district
Net Enrolment Rate secondary (by gender, district and location)
60% Annual School Census, Population Census
1.3.3 Drop-out rate halved in each district
Drop-out rate secondary (by gender, district and location)
11% 9% 7% 5% Annual School Census, Population Census
1.3.4 Repetition rate halved in each district
Repetition rate secondary (by gender, district and location)
10% 8% 7% 5% Annual School Census, Population Census
1.4 Increased enrolment in technical and vocational programmes
Gross Enrolment Rate tvet (by gender and district)
Annual School Census, Population Census
Completion Rate tvet (by gender and district) Annual School Census, Population Census
1.4.1 All ITVETs operate at minimum 90% capacity for full time programmes, including pre-vocational.
Full-time enrolled pupils over full-time net capacity % (by district and gender)
48% 54% 69% 90% Annual School Census, Population Census
1.4.2 All ITVETS offer customised courses (part-time) for minimum 100 trainees per year
number of trainees enrolled on customised courses per year
? 100 100 100 Annual School Census, Population Census

POLICY OUTPUT TARGET INDICATORS BASELINE
2011
MILESTONE
2012
MILESTONE
2014
TARGET 2016 SOURCE
1.5 Improve completion rates at tertiary level.
Completion Rate tertiary (by gender, district and location)
Annual School Census, Population Census
Gross Enrolment Rate tertiary (be gender, district and location)
Annual School Census, Population Census
1.5.1 Annual increase of 10% of Form 4 graduates gaining access to tertiary institutions.
Transition Rate secondary (by gender) Annual School Census, Population Census
1.5.2 Reduce drop-out rates at associate degree level by 50% in each centre.
Drop-out rate tertiary (by gender and centre) Annual School Census, Population Census
1.5.3 Reduce the current gender disparity in tertiary education from 2:1 (female : male) to 3:2
Gender Parity Index 2:1 3:1 Annual School Census, Population Census
1.5.4 Increased cost sharing
Private(household) expenditure to public subsidies
Annual Budget, LSMS and other surveys
1.6 Improve enrolment of children with Special Education Needs
SEN referred pupils enrolled % (by gender) 100% Annual School Census, Population Census
1.6.1 All referred SEN children enrolled in school.
SEN referred pupils enrolled % (by gender) 100% Annual School Census, Population Census
1.7 Expand access to pre-service and in-service professional development for teachers
1.7.1Pre-primary, primary and secondary programmes available in all three regions
Trainees enrolled on pre-service courses
Teachers enrolled on in-service courses
CoE records
1.8 Apply new technologies to increase access and achievement
1.8.1 Increased number of educational programmes delivered through on-line or multi-media alternatives
Students and educators enrolled Institutional records from training providers
Improve Quality and Relevance of
PSE score (by gender, district, location and award)
Examination Results

POLICY OUTPUT TARGET INDICATORS BASELINE
2011
MILESTONE
2012
MILESTONE
2014
TARGET 2016 SOURCE
Education at all Levels
CSEC score (by gender, district, location and award)
Examination Results
2.1 Improved school leadership and management for school effectiveness
Schools with annual school report card % (by district, location and subsector)
Competency Framework in place, TSC annual report, MOE reports from DEC and TEDs, Annual report from managing authorities, Annual School Reports, Examination Results
Schools with a minimum statisfactory performance % (by district, location and subsector)
Competency Framework in place, TSC annual report, MOE reports from DEC and TEDs, Annual report from managing authorities, Annual School Reports, Examination Results
Number of school administrators certified (by district, location and type of school)
Competency Framework in place, TSC annual report, MOE reports from DEC and TEDs, Annual report from managing authorities, Annual School Reports, Examination Results
2.1 All school administrators (principals and vice principals) certified in school leadership
Number of school administrators certified (by district, location and subsectorl)
Competency Framework in place, TSC annual report, MOE reports from DEC and TEDs, Annual report from managing authorities, Annual School Reports, Examination Results
2.2 75% of schools demonstrate satisfactory level of effectiveness as measured on school report card.
Schools with a minimum statisfactory performance % (by district, location and subsector)
75% Competency Framework in place, TSC annual report, MOE reports from DEC and TEDs, Annual report from managing authorities, Annual School Reports, Examination Results
2.2 Improved effectiveness of teachers in supporting student achievement at all levels
Teachers demonstrating appropriate/statisfactory competencies (by gender, location, district and subsector)
Competency Framework in place, TSC annual report, MOE reports from DEC and TEDs, Annual report from managing authorities, Annual School Reports, Examination Results
Enrolled pupils sitting the PSE and CSEC exam % (by gender, district, location and type of school)
Competency Framework in place, TSC annual report, MOE reports from DEC and TEDs, Annual report from managing authorities, Annual School Reports, Examination Results
Pupils achieving a minimum statisfactory PSE Competency Framework in place,
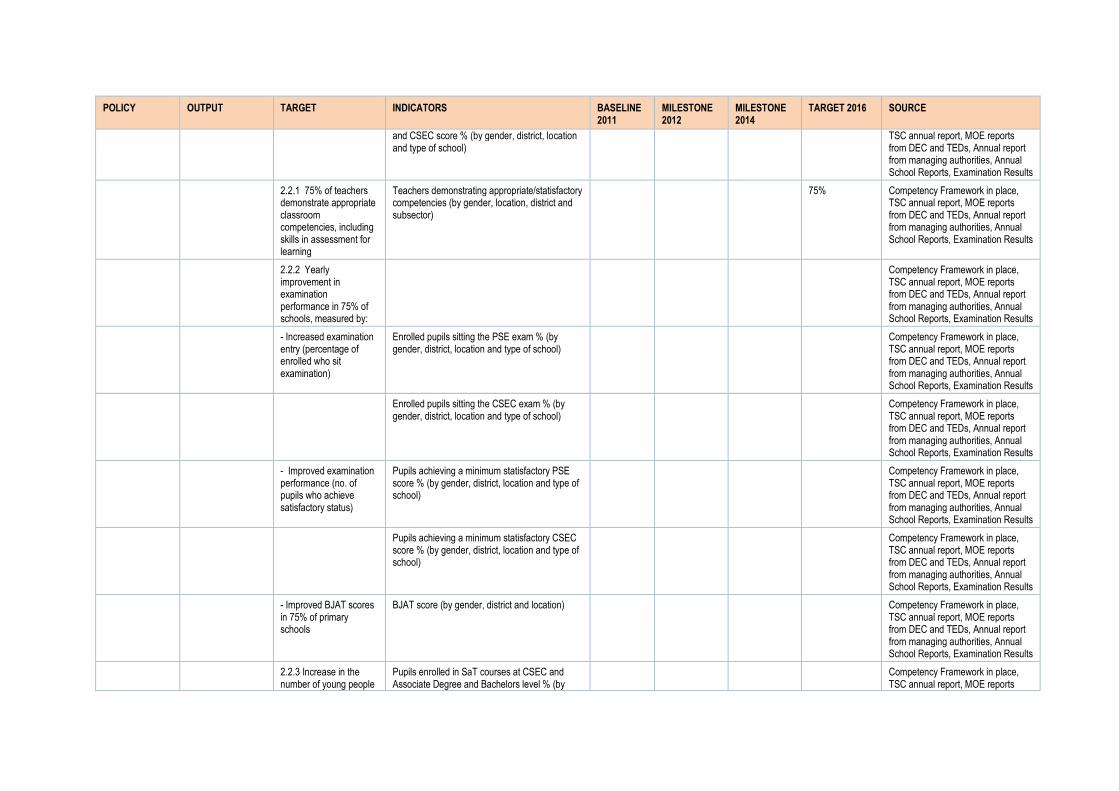
POLICY OUTPUT TARGET INDICATORS BASELINE
2011
MILESTONE
2012
MILESTONE
2014
TARGET 2016 SOURCE
and CSEC score % (by gender, district, location and type of school)
TSC annual report, MOE reports from DEC and TEDs, Annual report from managing authorities, Annual School Reports, Examination Results
2.2.1 75% of teachers demonstrate appropriate classroom competencies, including skills in assessment for learning
Teachers demonstrating appropriate/statisfactory competencies (by gender, location, district and subsector)
75% Competency Framework in place, TSC annual report, MOE reports from DEC and TEDs, Annual report from managing authorities, Annual School Reports, Examination Results
2.2.2 Yearly improvement in examination performance in 75% of schools, measured by:
Competency Framework in place, TSC annual report, MOE reports from DEC and TEDs, Annual report from managing authorities, Annual School Reports, Examination Results
- Increased examination entry (percentage of enrolled who sit examination)
Enrolled pupils sitting the PSE exam % (by gender, district, location and type of school)
Competency Framework in place, TSC annual report, MOE reports from DEC and TEDs, Annual report from managing authorities, Annual School Reports, Examination Results
Enrolled pupils sitting the CSEC exam % (by gender, district, location and type of school)
Competency Framework in place, TSC annual report, MOE reports from DEC and TEDs, Annual report from managing authorities, Annual School Reports, Examination Results
- Improved examination performance (no. of pupils who achieve satisfactory status)
Pupils achieving a minimum statisfactory PSE score % (by gender, district, location and type of school)
Competency Framework in place, TSC annual report, MOE reports from DEC and TEDs, Annual report from managing authorities, Annual School Reports, Examination Results
Pupils achieving a minimum statisfactory CSEC score % (by gender, district, location and type of school)
Competency Framework in place, TSC annual report, MOE reports from DEC and TEDs, Annual report from managing authorities, Annual School Reports, Examination Results
- Improved BJAT scores in 75% of primary schools
BJAT score (by gender, district and location) Competency Framework in place, TSC annual report, MOE reports from DEC and TEDs, Annual report from managing authorities, Annual School Reports, Examination Results
2.2.3 Increase in the number of young people
Pupils enrolled in SaT courses at CSEC and Associate Degree and Bachelors level % (by
Competency Framework in place, TSC annual report, MOE reports

POLICY OUTPUT TARGET INDICATORS BASELINE
2011
MILESTONE
2012
MILESTONE
2014
TARGET 2016 SOURCE
opting for and qualifying in science and technology (SaT) subjects at CSEC, and opting for SaT courses at Associate Degree and Bachelors level.
gender and district) from DEC and TEDs, Annual report from managing authorities, Annual School Reports, Examination Results
Pupils graduated in SaT courses at CSEC and Associate Degree and Bachelors level % (by gender and district)
Competency Framework in place, TSC annual report, MOE reports from DEC and TEDs, Annual report from managing authorities, Annual School Reports, Examination Results
2.3 Approved Teacher Education (TE) programmes effectively delivered by all institutions training teachers
Approved Teacher Education Programmes % (by subsector and centre)
Program Specifications and standards, TE profiles in place, TE database, Programme reports, Annual professional development calendar
2.3.1 All TE programmes comply with established minimum professional standards.
Programmes non-compliant with minimum professional standards % (by subsector)
0 Program Specifications and standards, TE profiles in place, TE database, Programme reports, Annual professional development calendar
2.3.2 All TE staff have appropriate experience, skills and qualifications required to deliver courses
Teacher educators with appropriate experience and skills %
Program Specifications and standards, TE profiles in place, TE database, Programme reports, Annual professional development calendar
2.4 Increased number of appropriately certified teachers at all levels
Certified teachers % (by subsector, gender, district and location)
Register of Programme, Specifications for approved TE programmes, Programme Monitoring Reports, TSC Annual Report, TEDS Annual Report
Teacher Attrition Rate Register of Programme, Specifications for approved TE programmes, Programme Monitoring Reports, TSC Annual Report, TEDS Annual Report
2.4.1 All newly qualified teachers engaged in appropriate induction
NQT teachers successfully completing induction % (be gender and subsector)
Register of Programme, Specifications for approved TE programmes, Programme Monitoring Reports, TSC Annual Report, TEDS
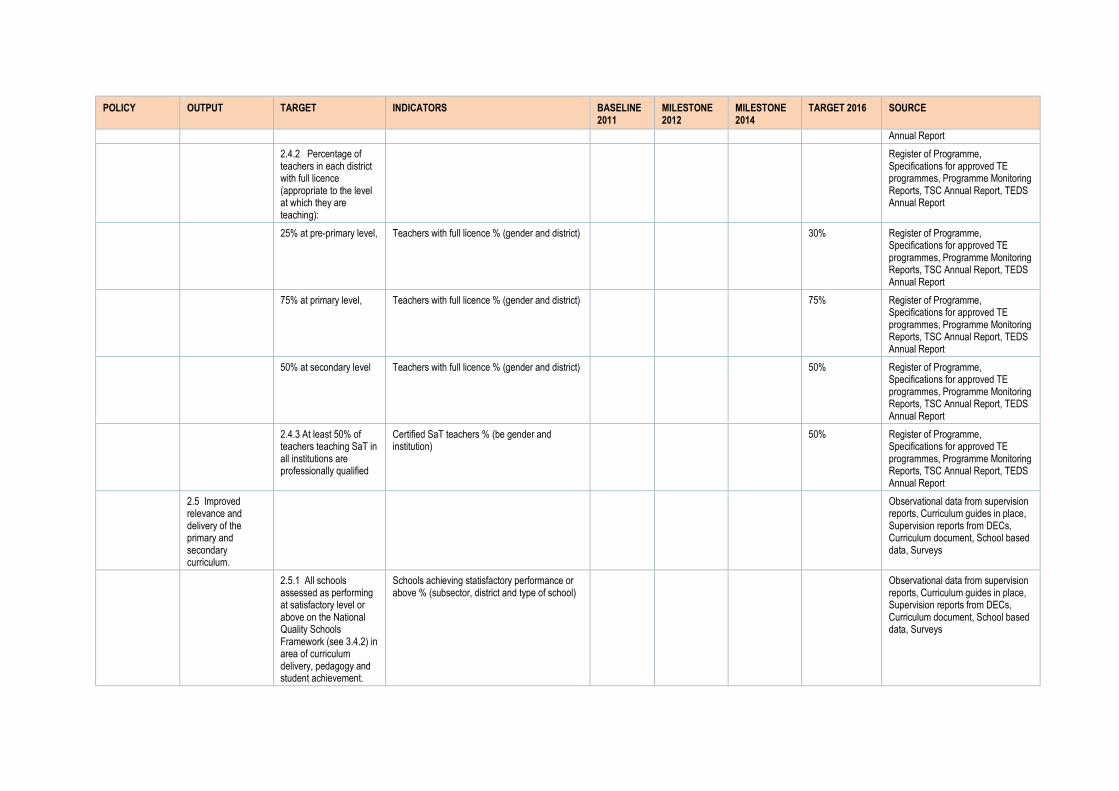
POLICY OUTPUT TARGET INDICATORS BASELINE
2011
MILESTONE
2012
MILESTONE
2014
TARGET 2016 SOURCE
Annual Report
2.4.2 Percentage of teachers in each district with full licence (appropriate to the level at which they are teaching):
Register of Programme, Specifications for approved TE programmes, Programme Monitoring Reports, TSC Annual Report, TEDS Annual Report
25% at pre-primary level, Teachers with full licence % (gender and district) 30% Register of Programme, Specifications for approved TE programmes, Programme Monitoring Reports, TSC Annual Report, TEDS Annual Report
75% at primary level, Teachers with full licence % (gender and district) 75% Register of Programme, Specifications for approved TE programmes, Programme Monitoring Reports, TSC Annual Report, TEDS Annual Report
50% at secondary level Teachers with full licence % (gender and district) 50% Register of Programme, Specifications for approved TE programmes, Programme Monitoring Reports, TSC Annual Report, TEDS Annual Report
2.4.3 At least 50% of teachers teaching SaT in all institutions are professionally qualified
Certified SaT teachers % (be gender and institution)
50% Register of Programme, Specifications for approved TE programmes, Programme Monitoring Reports, TSC Annual Report, TEDS Annual Report
2.5 Improved relevance and delivery of the primary and secondary curriculum.
Observational data from supervision reports, Curriculum guides in place, Supervision reports from DECs, Curriculum document, School based data, Surveys
2.5.1 All schools assessed as performing at satisfactory level or above on the National Quality Schools Framework (see 3.4.2) in area of curriculum delivery, pedagogy and student achievement.
Schools achieving statisfactory performance or above % (subsector, district and type of school)
Observational data from supervision reports, Curriculum guides in place, Supervision reports from DECs, Curriculum document, School based data, Surveys

POLICY OUTPUT TARGET INDICATORS BASELINE
2011
MILESTONE
2012
MILESTONE
2014
TARGET 2016 SOURCE
2.5.2 Appropriate language support programmes in place in all schools.
Schools identified to receive language support % (by district and type of school)
Curriculum documents
Schools receiving language support % (by district and type of school)
Curriculum documents
2.5.3 Revised secondary curriculum based around core and options adopted in all secondary schools and ITVETs
Schools implementing the revised curriculum % (district, subsector and type of school)
NQF document
School Report Cards
School Managers Reports
School Supervision Reports
6. Improve the quality and relevance of Technical and Vocational Education and Training
Completion rate (by centre) LMS report, ITVET reports, Tracer study
TVET graduates have the skills required by industry
LMS report, ITVET reports, Tracer study
6.1 Drop out from ITVETs reduced to maximum 10% in each ITVET
Drop-out rate tvet (by centre) 10% LMS report, ITVET reports, Tracer study
6.2 75% of ITVET graduates either find employment in work related to qualification or progress to further education and training
TEVT graduates in employment, education or training %
75% LMS report, ITVET reports, Tracer study
7. Improve education services to children with SEN
Referred children in school % (by gender) ESS Annual Report, DEC Annual Report, EMIS data
Net capacity ESS Annual Report, DEC Annual Report, EMIS data
7.1 50% of identified SEN children formally referred and placed in schools.
Referred children in school % (by gender) 50% ESS Annual Report, DEC Annual Report, EMIS data
7.2 10% increase in Net capacity 10% ESS Annual Report, DEC Annual
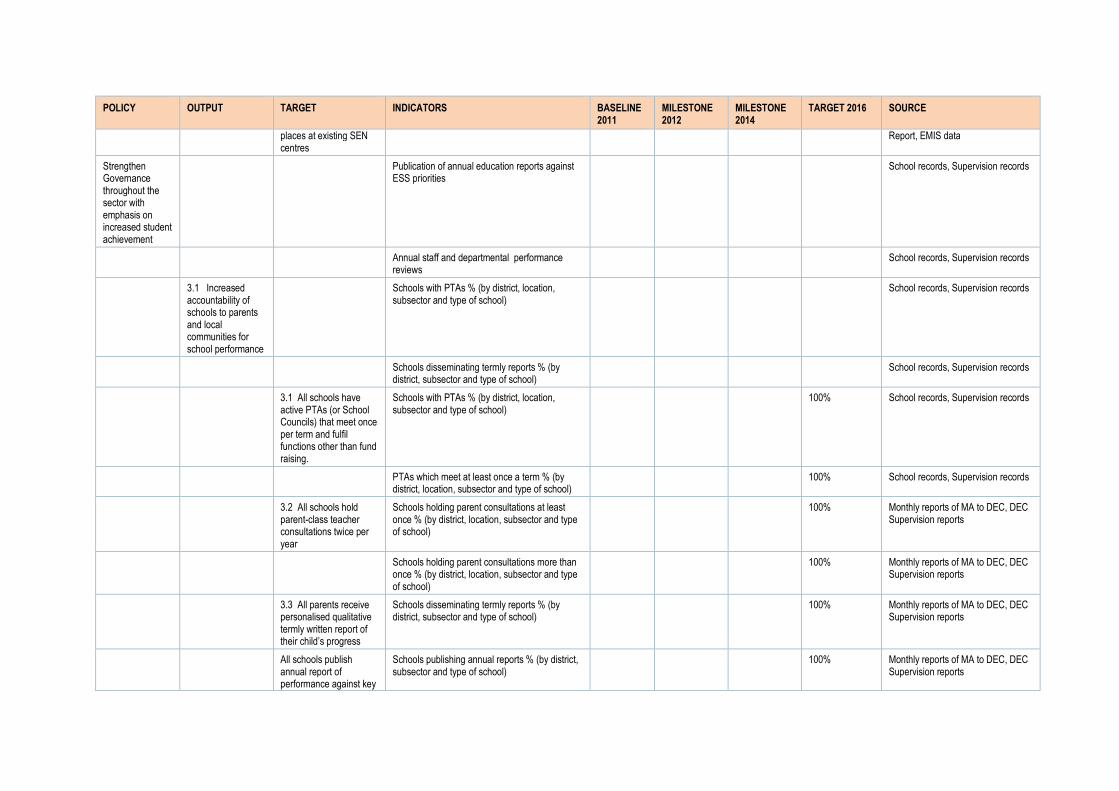
POLICY OUTPUT TARGET INDICATORS BASELINE
2011
MILESTONE
2012
MILESTONE
2014
TARGET 2016 SOURCE
places at existing SEN centres
Report, EMIS data
Strengthen Governance throughout the sector with emphasis on increased student achievement
Publication of annual education reports against ESS priorities
School records, Supervision records
Annual staff and departmental performance reviews
School records, Supervision records
3.1 Increased accountability of schools to parents and local communities for school performance
Schools with PTAs % (by district, location, subsector and type of school)
School records, Supervision records
Schools disseminating termly reports % (by district, subsector and type of school)
School records, Supervision records
3.1 All schools have active PTAs (or School Councils) that meet once per term and fulfil functions other than fund raising.
Schools with PTAs % (by district, location, subsector and type of school)
100% School records, Supervision records
PTAs which meet at least once a term % (by district, location, subsector and type of school)
100% School records, Supervision records
3.2 All schools hold parent-class teacher consultations twice per year
Schools holding parent consultations at least once % (by district, location, subsector and type of school)
100% Monthly reports of MA to DEC, DEC Supervision reports
Schools holding parent consultations more than once % (by district, location, subsector and type of school)
100% Monthly reports of MA to DEC, DEC Supervision reports
3.3 All parents receive personalised qualitative termly written report of their child’s progress
Schools disseminating termly reports % (by district, subsector and type of school)
100% Monthly reports of MA to DEC, DEC Supervision reports
All schools publish annual report of performance against key
Schools publishing annual reports % (by district, subsector and type of school)
100% Monthly reports of MA to DEC, DEC Supervision reports

POLICY OUTPUT TARGET INDICATORS BASELINE
2011
MILESTONE
2012
MILESTONE
2014
TARGET 2016 SOURCE
indicators.
3.2 Schools are governed and managed in accordance with requirements in the education rules.
Schools compliant with education rules % (by district, subsector and type of school)
Monthly reports of MA to DEC, DEC Supervision reports
3.2.1 New regulations established to support Education and Training Act 2010
Establishment of ETA act Monthly reports of MA to DEC, DEC Supervision reports
3.2.2 90% compliance by General and Local managers, Schools administrators with requirements of education rules.
Schools compliant with education rules % (by district, subsector and type of school)
90% Monthly reports of MA to DEC, DEC Supervision reports
3.2.3 All school principals appointed have at least minimum agreed qualifications and experience
School principals with minimum qualifications % (by district, type of school and subsector)
100% Monthly reports of MA to DEC, DEC Supervision reports
3.2.3 75% of schools rated as satisfactory or above against national school performance standards
Schools rated satisfactory or above % (by district, type of school and subsector)
75% Monthly reports of MA to DEC, DEC Supervision reports
3.3 Improve management effectiveness of MOEY and District Education Centres
Annual performance assessment completed % (by department and unit)
Official notices, study reports, EMIS, MOEY records, minutes
3.3.1 All officers at all levels have annually agreed objectives, linked to policy objectives, which are used as basis for annual performance assessment.
Officers with annual targets % (by department and unit)
90% Official notices, study reports, EMIS, MOEY records, minutes
Annual performance assessment completed % (by department and unit)
100% Official notices, study reports, EMIS, MOEY records, minutes

POLICY OUTPUT TARGET INDICATORS BASELINE
2011
MILESTONE
2012
MILESTONE
2014
TARGET 2016 SOURCE
3.3.2 90% of all MA, DEC and Central MOEY personnel perform at satisfactory standard or above on new annual performance appraisal system by 2013.
Personnel achieving at least satisfactory in annual performance %
75% Official notices, study reports, EMIS, MOEY records, minutes
3.3.3 Annual education statistics uploaded onto MOEY website by start of Term 3 of school year.
AES on website Term 3 Official notices, study reports, EMIS, MOEY records, minutes
3.3.4 Quarterly performance reviews held by SMT using ESS performance framework.
Number of QTR meetings per year Official notices, study reports, EMIS, MOEY records, minutes
3.4 Quality assurance system based on common minimum standards of service delivery applied across all educational institutions
Publish supervision reports on website % (by district, type of school and subsector)
MOEY records, training programme reports, Website
3.4.1 All schools, junior colleges, ITVETS and TE institutions receive at least one full supervision every three years
Supervision visits per year % (by district, type of school and subsector)
100% MOEY records, training programme reports, Website
3.4.2 All schools, junior colleges, ITVETS and TE institutions receive at least one support visit (spot check) per annum.
Support visits per year % (by district, type of school and subsector)
MOEY records, training programme reports, Website
3.5 MOEY publishes through website annual report of performance against targets of Education Sector Strategy.
Annual report of performance against targets of Education Sector Strategy
Annual on time Website
3.5.1 All reports Website uploading rate Monthly Website
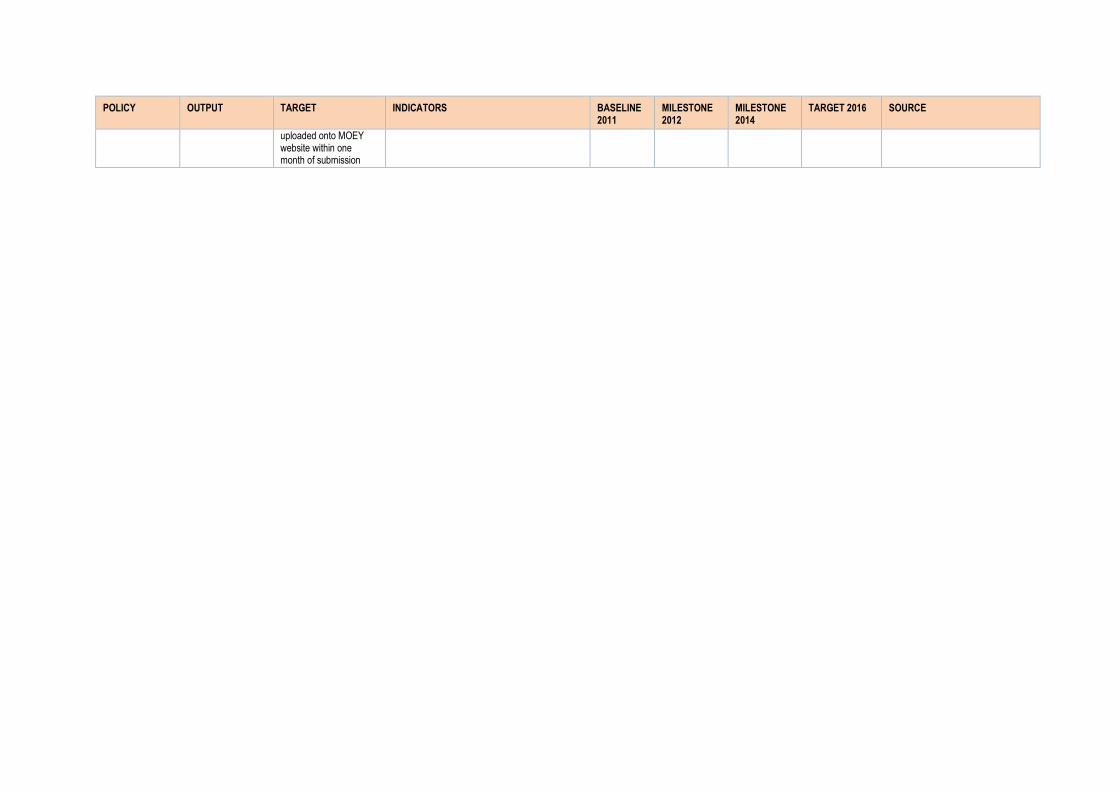
POLICY OUTPUT TARGET INDICATORS BASELINE
2011
MILESTONE
2012
MILESTONE
2014
TARGET 2016 SOURCE
uploaded onto MOEY website within one month of submission
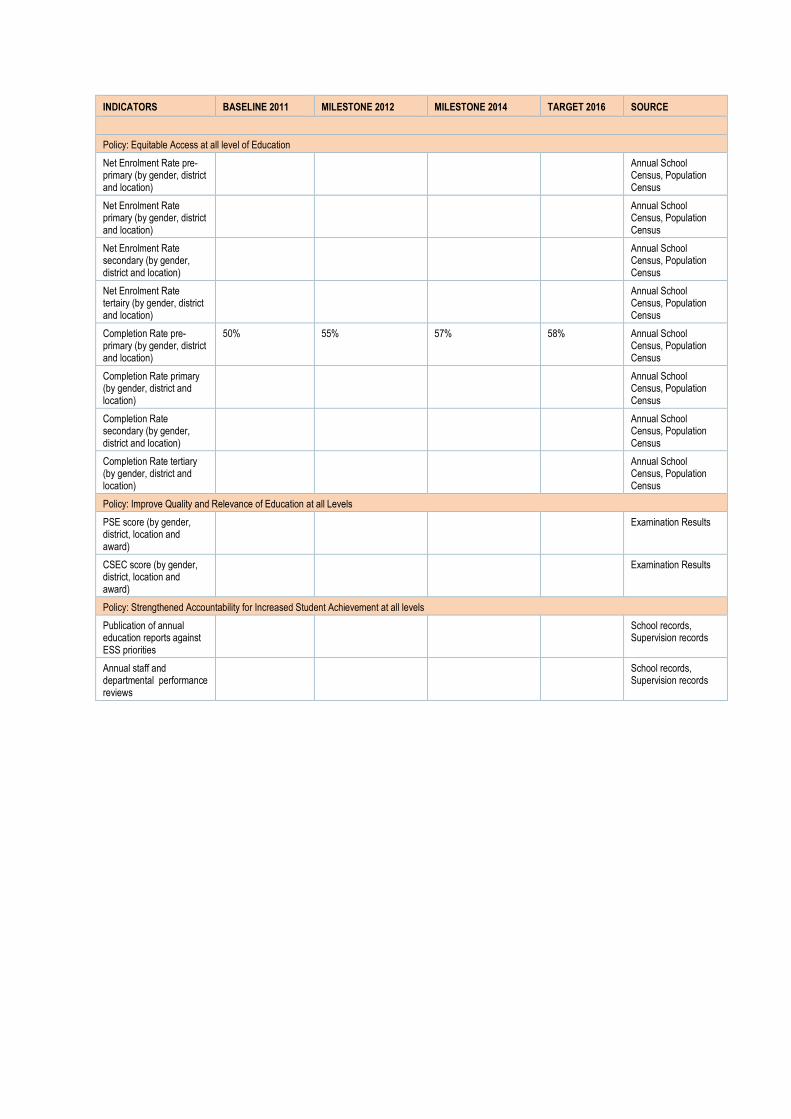
INDICATORS BASELINE 2011 MILESTONE 2012 MILESTONE 2014 TARGET 2016 SOURCE
Policy: Equitable Access at all level of Education
Net Enrolment Rate pre-primary (by gender, district and location)
Annual School Census, Population Census
Net Enrolment Rate primary (by gender, district and location)
Annual School Census, Population Census
Net Enrolment Rate secondary (by gender, district and location)
Annual School Census, Population Census
Net Enrolment Rate tertairy (by gender, district and location)
Annual School Census, Population Census
Completion Rate pre-primary (by gender, district and location)
50% 55% 57% 58% Annual School Census, Population Census
Completion Rate primary (by gender, district and location)
Annual School Census, Population Census
Completion Rate secondary (by gender, district and location)
Annual School Census, Population Census
Completion Rate tertiary (by gender, district and location)
Annual School Census, Population Census
Policy: Improve Quality and Relevance of Education at all Levels
PSE score (by gender, district, location and award)
Examination Results
CSEC score (by gender, district, location and award)
Examination Results
Policy: Strengthened Accountability for Increased Student Achievement at all levels
Publication of annual education reports against ESS priorities
School records, Supervision records
Annual staff and departmental performance reviews
School records, Supervision records

OUTPUT INDICATORS BASELINE
2011
MILESTONE
2012
MILESTONE
2014
TARGET
2016
SOURCE
Policy: Equitable Access at all level of Education
1.1 Expand access to Pre-School Education (3-4 yr olds)
Gross Enrolment Rate pre-primary (by gender, district and location)
43% 48% 49% 50% Annual School Census, Population Census
Net Enrolment Rate pre-primary (by gender, district and location)
Annual School Census, Population Census
1.2 Increased enrolment and completion at primary level
Gross Enrolment Rate primary (by gender, district and location)
106% 103% 103% 105% Annual School Census, Population Census
Net Enrolment Rate primary (by gender, district and location)
Annual School Census, Population Census
Completion Rate primary (by gender, district and location)
Annual School Census, Population Census
1.3 Expanded access and increased completion rates at the secondary level.
Gross Enrolment Rate secondary (by gender, district and location)
63% 68% 73% 74% Annual School Census, Population Census
Net Enrolment Rate secondary (by gender, district and location)
Annual School Census, Population Census
Completion Rate secondary (by gender, district and location)
Annual School Census, Population Census
1.4 Increased enrolment in technical and vocational programmes
Gross Enrolment Rate tvet (by gender and district)
Annual School Census, Population Census
Completion Rate tvet (by gender and disrict)
Annual School Census, Population Census
1.5 Improve completion rates at tertiary level.
Completion Rate tertiary (by gender, district and location)
Annual School Census, Population Census
Gross Enrolment Rate tertiary (be gender, district and location)
Annual School Census, Population Census
1.6 Improve enrolment of children with Special Education Needs
SEN referred pupils enrolled % (by gender)
100% Annual School Census, Population Census
Policy: Improve Quality and Relevance of Education at all Levels
2.1 Improved school leadership and management for school effectiveness
Schools with annual school report card % (by district, location and subsector)
Competency Framework in place, TSC annual report, MOE reports from DEC and TEDs, Annual report from managing authorities, Annual School Reports, Examination Results
Schools with a minimum statisfactory performance % (by district, location and subsector)
Competency Framework in place, TSC annual report, MOE reports from DEC and TEDs, Annual report from managing authorities, Annual School Reports, Examination Results
2.2 Improved effectiveness of teachers in supporting student achievement at all levels
Teachers demonstrating appropriate/statisfactory competencies (by gender, location, district and subsector)
Competency Framework in place, TSC annual report, MOE reports from DEC and TEDs, Annual report from managing authorities, Annual School Reports, Examination Results
Enrolled pupils sitting the PSE and CSEC exam % (by gender, district, location and type of
Competency Framework in place, TSC annual report, MOE reports from DEC and TEDs, Annual

OUTPUT INDICATORS BASELINE
2011
MILESTONE
2012
MILESTONE
2014
TARGET
2016
SOURCE
school) report from managing authorities, Annual School Reports, Examination Results
Pupils achieving a minimum statisfactory PSE and CSEC score % (by gender, district, location and type of school)
Competency Framework in place, TSC annual report, MOE reports from DEC and TEDs, Annual report from managing authorities, Annual School Reports, Examination Results
2.3 Approved Teacher Education (TE) programmes effectively delivered by all institutions training teachers
Approved Teacher Education Programes % (by subsector and centre)
Program Specifications and standards, TE profiles in place, TE database, Programme reports, Annual professional development calendar
2.4 Increased number of appropriately certified teachers at all levels
Certifed teachers % (by subsector, gender, district and location)
Register of Programme, Specifications for approved TE programmes, Programme Monitoring Reports, TSC Annual Report, TEDS Annual Report
Teacher Attrition Rate Register of Programme, Specifications for approved TE programmes, Programme Monitoring Reports, TSC Annual Report, TEDS Annual Report
2.5 Improved relevance and delivery of the primary and secondary curriculum.
Observational data from supervision reports, Curriculum guides in place, Supervision reports from DECs, Curriculum document, School based data, Surveys
6. Improve the quality and relevance of Technical and Vocational Education and Training
Completion rate (by centre) LMS report, ITVET reports, Tracer study
TVET graduates have the skills required by industry
LMS report, ITVET reports, Tracer study
7. Improve education services to children with SEN
Referred children in school % (by gender)
ESS Annual Report, DEC Annual Report, EMIS data
Net capacity ESS Annual Report, DEC Annual Report, EMIS data
3.1 Increased accountability of schools to parents and local communities for school performance
Schools with PTAs % (by district, location, subsector and type of school)
School records, Supervision records
Schools dissimenating termly reports % (by district, subsector and type of school)
School records, Supervision records
3.2 Schools are governed and managed in accordance with requirements in the education rules.
Schools compliant with education rules % (by district, subsector and type of school)
Monthly reports of MA to DEC, DEC Supervision reports
3.3 Improve Annual performance Offical notices, study reports,

OUTPUT INDICATORS BASELINE
2011
MILESTONE
2012
MILESTONE
2014
TARGET
2016
SOURCE
management effectiveness of MOEY and District Education Centres
assessment completed % (by depatment and unit)
EMIS, MOEY records, minutes
3.4 Quality assurance system based on common minimum standards of service delivery applied across all educational institutions
Publish supervision reports on website % (by district, type of school and subsector)
MOEY records, training programme reports, Website
3.5 MOEY publishes through website annual report of performance against targets of Education Sector Strategy.
Annual report of performance against targets of Education Sector Strategy
Annual on time
Website
Policy: Strengthened Accountability for Increased Student Achievement at all levels
3.1 Increased accountability of schools to parents and local communities for school performance
Schools with PTAs % (by district, location, subsector and type of school)
School records, Supervision records
Schools dissimenating termly reports % (by district, subsector and type of school)
School records, Supervision records
3.2 Schools are governed and managed in accordance with requirements in the education rules.
Schools compliant with education rules % (by district, subsector and type of school)
Monthly reports of MA to DEC, DEC Supervision reports
3.3 Improve management effectiveness of MOEY and District Education Centres
Annual performance assessment completed % (by depatment and unit)
Offical notices, study reports, EMIS, MOEY records, minutes
3.4 Quality assurance system based on common minimum standards of service delivery applied across all educational institutions
Publish supervision reports on website % (by district, type of school and subsector)
MOEY records, training programme reports, Website
Supervison visits per year % (by district, type of school and subsector)
100% MOEY records, training programme reports, Website
Support visits per year % (by district, type of school and subsector)
MOEY records, training programme reports, Website
3.5 MOEY publishes through website annual report of performance against targets of Education Sector Strategy.
Annual report of performance against targets of Education Sector Strategy
Annual on time
Website
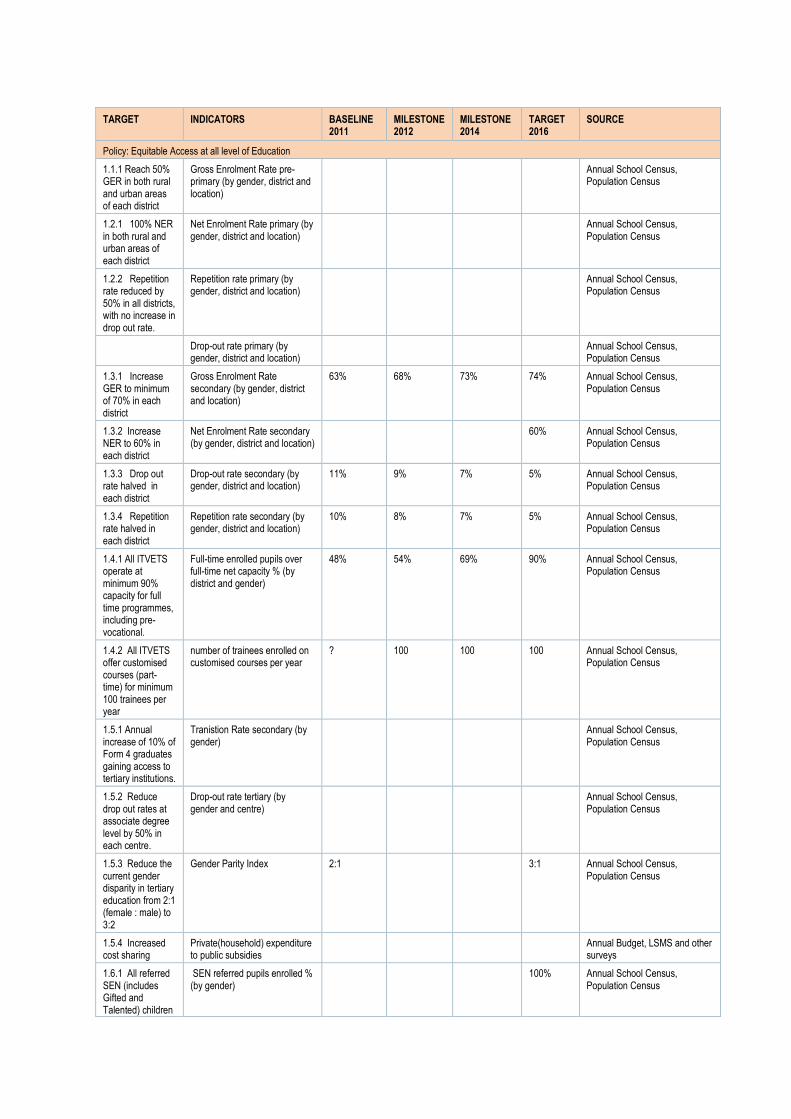
TARGET INDICATORS BASELINE
2011
MILESTONE
2012
MILESTONE
2014
TARGET
2016
SOURCE
Policy: Equitable Access at all level of Education
1.1.1 Reach 50% GER in both rural and urban areas of each district
Gross Enrolment Rate pre-primary (by gender, district and location)
Annual School Census, Population Census
1.2.1 100% NER in both rural and urban areas of each district
Net Enrolment Rate primary (by gender, district and location)
Annual School Census, Population Census
1.2.2 Repetition rate reduced by 50% in all districts, with no increase in drop out rate.
Repetition rate primary (by gender, district and location)
Annual School Census, Population Census
Drop-out rate primary (by gender, district and location)
Annual School Census, Population Census
1.3.1 Increase GER to minimum of 70% in each district
Gross Enrolment Rate secondary (by gender, district and location)
63% 68% 73% 74% Annual School Census, Population Census
1.3.2 Increase NER to 60% in each district
Net Enrolment Rate secondary (by gender, district and location)
60% Annual School Census, Population Census
1.3.3 Drop out rate halved in each district
Drop-out rate secondary (by gender, district and location)
11% 9% 7% 5% Annual School Census, Population Census
1.3.4 Repetition rate halved in each district
Repetition rate secondary (by gender, district and location)
10% 8% 7% 5% Annual School Census, Population Census
1.4.1 All ITVETS operate at minimum 90% capacity for full time programmes, including pre-vocational.
Full-time enrolled pupils over full-time net capacity % (by district and gender)
48% 54% 69% 90% Annual School Census, Population Census
1.4.2 All ITVETS offer customised courses (part-time) for minimum 100 trainees per year
number of trainees enrolled on customised courses per year
? 100 100 100 Annual School Census, Population Census
1.5.1 Annual increase of 10% of Form 4 graduates gaining access to tertiary institutions.
Tranistion Rate secondary (by gender)
Annual School Census, Population Census
1.5.2 Reduce drop out rates at associate degree level by 50% in each centre.
Drop-out rate tertiary (by gender and centre)
Annual School Census, Population Census
1.5.3 Reduce the current gender disparity in tertiary education from 2:1 (female : male) to 3:2
Gender Parity Index 2:1 3:1 Annual School Census, Population Census
1.5.4 Increased cost sharing
Private(household) expenditure to public subsidies
Annual Budget, LSMS and other surveys
1.6.1 All referred SEN (includes Gifted and Talented) children
SEN referred pupils enrolled % (by gender)
100% Annual School Census, Population Census

TARGET INDICATORS BASELINE
2011
MILESTONE
2012
MILESTONE
2014
TARGET
2016
SOURCE
enrolled in school.
Policy: Improve Quality and Relevance of Education at all Levels
2.2.1 75% of teachers demonstrate appropriate classroom competencies, including skills in assessment for learning
Teachers demonstrating appropriate/statisfactory competencies (by gender, location, district and subsector)
75% Competency Framework in place, TSC annual report, MOE reports from DEC and TEDs, Annual report from managing authorities, Annual School Reports, Examination Results
2.2.2 Yearly improvement in examination performance in 75% of schools, measured by:
Competency Framework in place, TSC annual report, MOE reports from DEC and TEDs, Annual report from managing authorities, Annual School Reports, Examination Results
- Increased examination entry (percentage of enrolled who sit examination)
Enrolled pupils sitting the PSE exam % (by gender, district, location and type of school)
Competency Framework in place, TSC annual report, MOE reports from DEC and TEDs, Annual report from managing authorities, Annual School Reports, Examination Results
Enrolled pupils sitting the CSEC exam % (by gender, district, location and type of school)
Competency Framework in place, TSC annual report, MOE reports from DEC and TEDs, Annual report from managing authorities, Annual School Reports, Examination Results
- Improved examination performance (no. of pupils who achieve satisfactory status)
Pupils achieving a minimum statisfactory PSE score % (by gender, district, location and type of school)
Competency Framework in place, TSC annual report, MOE reports from DEC and TEDs, Annual report from managing authorities, Annual School Reports, Examination Results
Pupils achieving a minimum statisfactory CSEC score % (by gender, district, location and type of school)
Competency Framework in place, TSC annual report, MOE reports from DEC and TEDs, Annual report from managing authorities, Annual School Reports, Examination Results
- Improved BJAT scores in 75% of primary schools
BJAT score (by gender, district and location)
Competency Framework in place, TSC annual report, MOE reports from DEC and TEDs, Annual report from managing authorities, Annual School Reports, Examination Results
2.2.3 Increase in the number of young people opting for and qualifying in science and technology (SaT) subjects at CSEC, and opting for SaT courses at Associate Degree and Bachelors level.
Pupils enrolled in SaT courses at CSEC and Associate Degree and Bachelors level % (by gender and district)
Competency Framework in place, TSC annual report, MOE reports from DEC and TEDs, Annual report from managing authorities, Annual School Reports, Examination Results
Pupils graduated in SaT courses at CSEC and Associate Degree and Bachelors level % (by gender and district)
Competency Framework in place, TSC annual report, MOE reports from DEC and TEDs, Annual report from managing authorities, Annual School Reports, Examination Results
2.3.2 All TE Programmes non-compliant 0 Program Specifications and
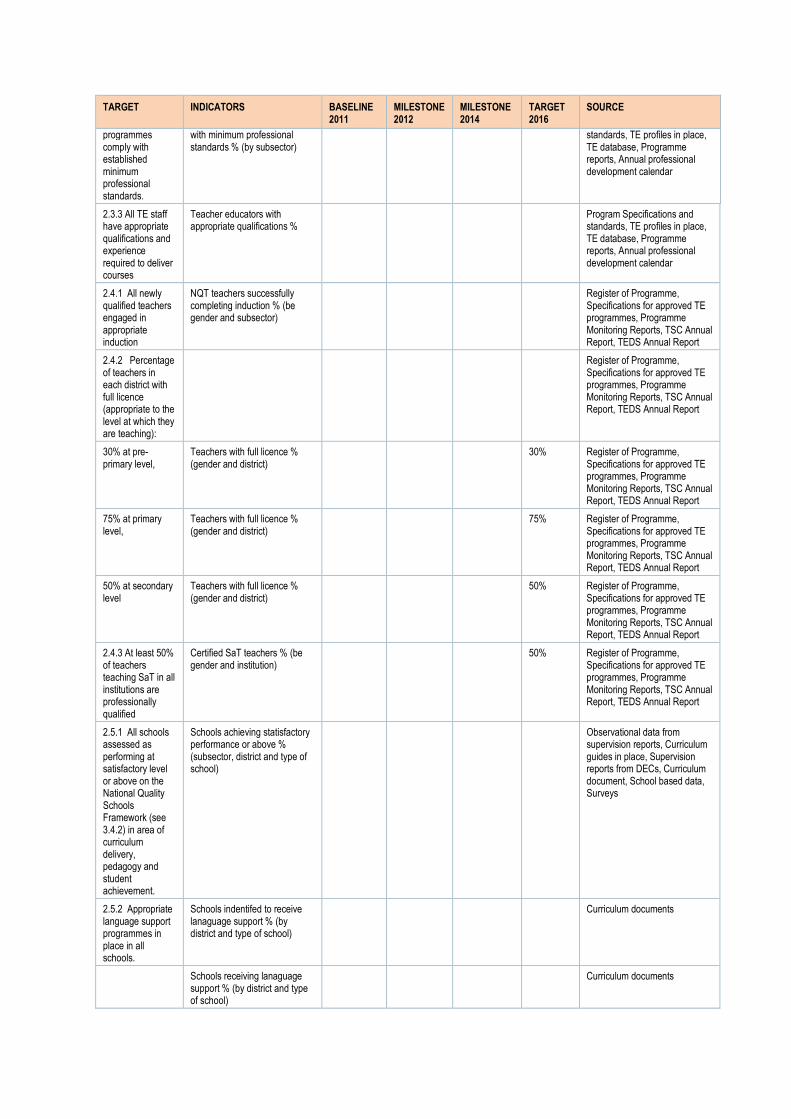
TARGET INDICATORS BASELINE
2011
MILESTONE
2012
MILESTONE
2014
TARGET
2016
SOURCE
programmes comply with established minimum professional standards.
with minimum professional standards % (by subsector)
standards, TE profiles in place, TE database, Programme reports, Annual professional development calendar
2.3.3 All TE staff have appropriate qualifications and experience required to deliver courses
Teacher educators with appropriate qualifications %
Program Specifications and standards, TE profiles in place, TE database, Programme reports, Annual professional development calendar
2.4.1 All newly qualified teachers engaged in appropriate induction
NQT teachers successfully completing induction % (be gender and subsector)
Register of Programme, Specifications for approved TE programmes, Programme Monitoring Reports, TSC Annual Report, TEDS Annual Report
2.4.2 Percentage of teachers in each district with full licence (appropriate to the level at which they are teaching):
Register of Programme, Specifications for approved TE programmes, Programme Monitoring Reports, TSC Annual Report, TEDS Annual Report
30% at pre-primary level,
Teachers with full licence % (gender and district)
30% Register of Programme, Specifications for approved TE programmes, Programme Monitoring Reports, TSC Annual Report, TEDS Annual Report
75% at primary level,
Teachers with full licence % (gender and district)
75% Register of Programme, Specifications for approved TE programmes, Programme Monitoring Reports, TSC Annual Report, TEDS Annual Report
50% at secondary level
Teachers with full licence % (gender and district)
50% Register of Programme, Specifications for approved TE programmes, Programme Monitoring Reports, TSC Annual Report, TEDS Annual Report
2.4.3 At least 50% of teachers teaching SaT in all institutions are professionally qualified
Certified SaT teachers % (be gender and institution)
50% Register of Programme, Specifications for approved TE programmes, Programme Monitoring Reports, TSC Annual Report, TEDS Annual Report
2.5.1 All schools assessed as performing at satisfactory level or above on the National Quality Schools Framework (see 3.4.2) in area of curriculum delivery, pedagogy and student achievement.
Schools achieving statisfactory performance or above % (subsector, district and type of school)
Observational data from supervision reports, Curriculum guides in place, Supervision reports from DECs, Curriculum document, School based data, Surveys
2.5.2 Appropriate language support programmes in place in all schools.
Schools indentifed to receive lanaguage support % (by district and type of school)
Curriculum documents
Schools receiving lanaguage support % (by district and type of school)
Curriculum documents
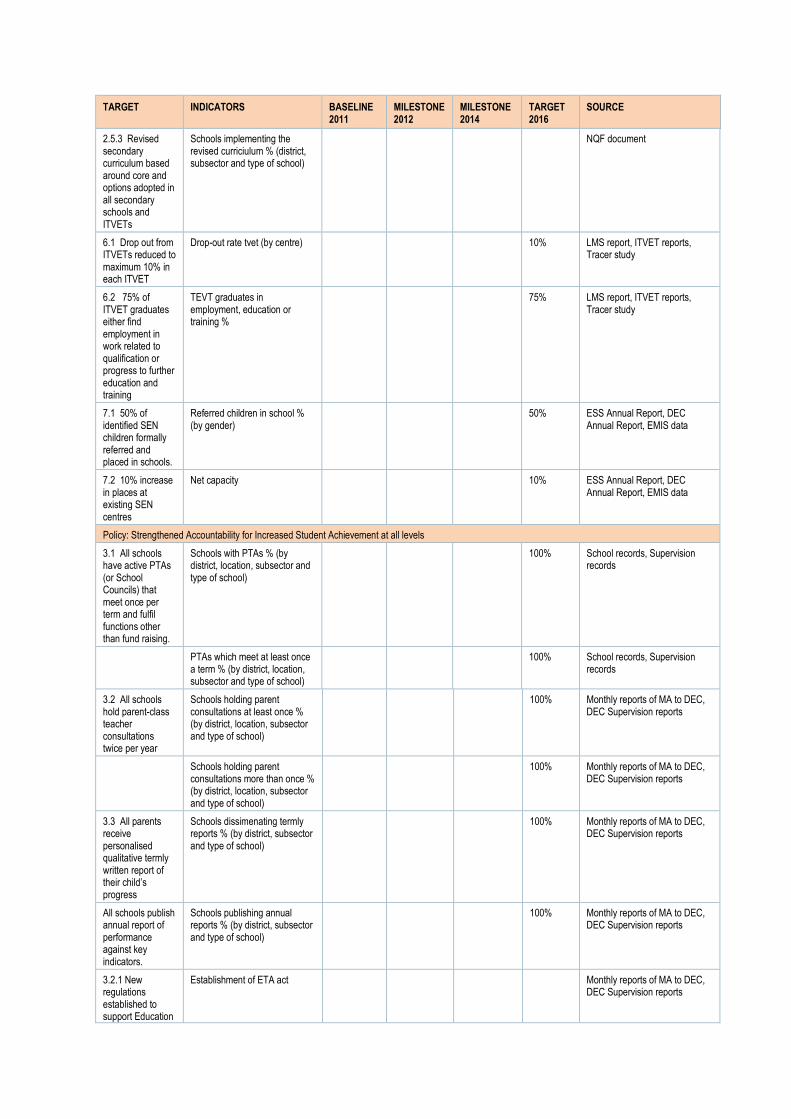
TARGET INDICATORS BASELINE
2011
MILESTONE
2012
MILESTONE
2014
TARGET
2016
SOURCE
2.5.3 Revised secondary curriculum based around core and options adopted in all secondary schools and ITVETs
Schools implementing the revised curriciulum % (district, subsector and type of school)
NQF document
6.1 Drop out from ITVETs reduced to maximum 10% in each ITVET
Drop-out rate tvet (by centre) 10% LMS report, ITVET reports, Tracer study
6.2 75% of ITVET graduates either find employment in work related to qualification or progress to further education and training
TEVT graduates in employment, education or training %
75% LMS report, ITVET reports, Tracer study
7.1 50% of identified SEN children formally referred and placed in schools.
Referred children in school % (by gender)
50% ESS Annual Report, DEC Annual Report, EMIS data
7.2 10% increase in places at existing SEN centres
Net capacity 10% ESS Annual Report, DEC Annual Report, EMIS data
Policy: Strengthened Accountability for Increased Student Achievement at all levels
3.1 All schools have active PTAs (or School Councils) that meet once per term and fulfil functions other than fund raising.
Schools with PTAs % (by district, location, subsector and type of school)
100% School records, Supervision records
PTAs which meet at least once a term % (by district, location, subsector and type of school)
100% School records, Supervision records
3.2 All schools hold parent-class teacher consultations twice per year
Schools holding parent consultations at least once % (by district, location, subsector and type of school)
100% Monthly reports of MA to DEC, DEC Supervision reports
Schools holding parent consultations more than once % (by district, location, subsector and type of school)
100% Monthly reports of MA to DEC, DEC Supervision reports
3.3 All parents receive personalised qualitative termly written report of their child’s progress
Schools dissimenating termly reports % (by district, subsector and type of school)
100% Monthly reports of MA to DEC, DEC Supervision reports
All schools publish annual report of performance against key indicators.
Schools publishing annual reports % (by district, subsector and type of school)
100% Monthly reports of MA to DEC, DEC Supervision reports
3.2.1 New regulations established to support Education
Establishment of ETA act Monthly reports of MA to DEC, DEC Supervision reports

TARGET INDICATORS BASELINE
2011
MILESTONE
2012
MILESTONE
2014
TARGET
2016
SOURCE
and Training Act 2010
3.2.2 90% compliance by General and Local managers, Schools administrators with requirements of education rules.
Schools compliant with education rules % (by district, subsector and type of school)
90% Monthly reports of MA to DEC, DEC Supervision reports
3.2.3 All school principals appointed have at least minimum agreed qualifications and experience
School principals with minimum qualifications % (by district, type of school and subsector)
100% Monthly reports of MA to DEC, DEC Supervision reports
3.2.3 75% of schools rated as satisfactory or above against national school performance standards
Schools rated satisfatory or above % (by district, type of school and subsector)
75% Monthly reports of MA to DEC, DEC Supervision reports
3.3.1 All officers at all levels have annually agreed objectives, linked to policy objectives, which are used as basis for annual performance assessment.
Officers with annnal targets % (by department and unit)
100% Offical notices, study reports, EMIS, MOEY records, minutes
Annual performance assessment completed % (by department and unit)
100% Offical notices, study reports, EMIS, MOEY records, minutes
3.3.2 90% of all MA, DEC and Central MOEY personnel perform at satisfactory standard or above on new annual performance appraisal system by 2013.
Personnel achieving at least statisfactory in annual performance %
90% Offical notices, study reports, EMIS, MOEY records, minutes
3.3.3 Annual education statistics uploaded onto MOEY website by start of Term 3 of school year.
AES on website Term 3 Offical notices, study reports, EMIS, MOEY records, minutes
3.3.4 Quarterly performance reviews held by SMT using ESS performance framework.
Number of QTR meetings per year
Offical notices, study reports, EMIS, MOEY records, minutes
3.4.1 All schools, junior colleges, and ITVETS receive at least one full supervision every three years
Supervison visits per year % (by district, type of school and subsector)
100% MOEY records, training programme reports, Website
3.4.2 All schools, Support visits per year % (by MOEY records, training

TARGET INDICATORS BASELINE
2011
MILESTONE
2012
MILESTONE
2014
TARGET
2016
SOURCE
junior colleges, and ITVETS receive at least one support visit (spot check) per annum.
district, type of school and subsector)
programme reports, Website
3.5.1 All reports uploaded onto MOEY website within one month of submission
Website uploading rate Monthly Website
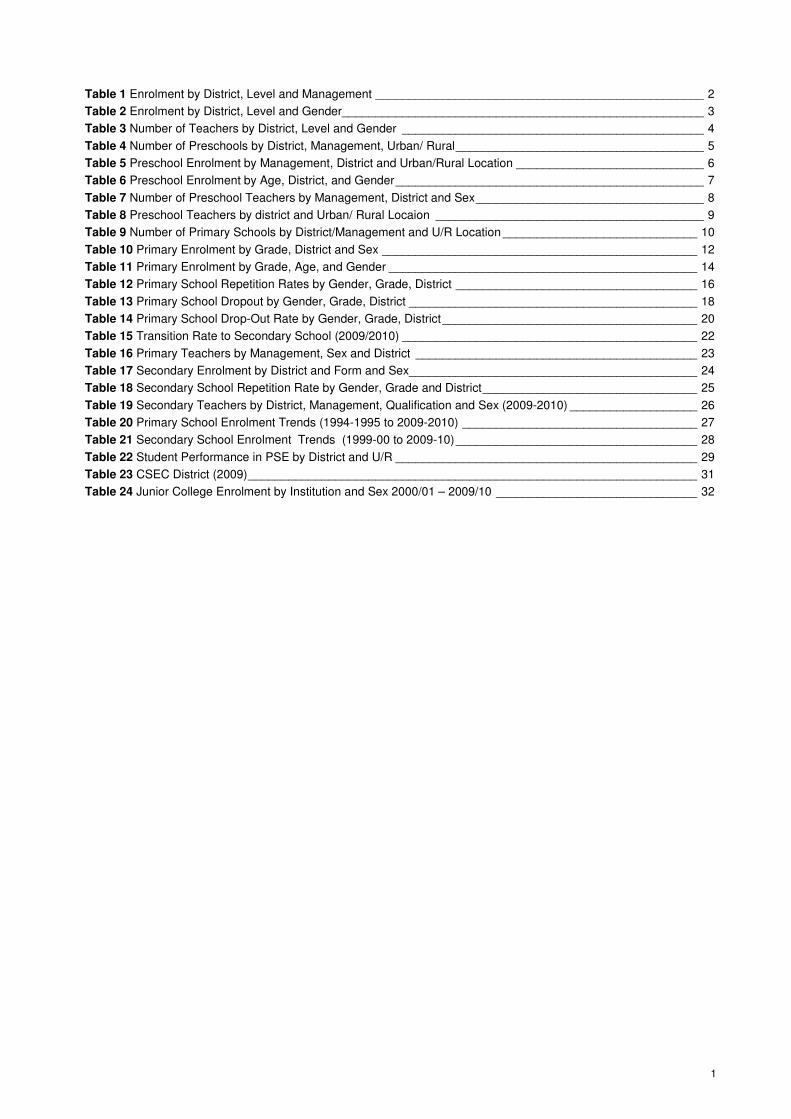
1
Table 1 Enrolment by District, Level and Management _________________________________________________ 2
Table 2 Enrolment by District, Level and Gender ______________________________________________________ 3
Table 3 Number of Teachers by District, Level and Gender _____________________________________________ 4
Table 4 Number of Preschools by District, Management, Urban/ Rural _____________________________________ 5
Table 5 Preschool Enrolment by Management, District and Urban/Rural Location ____________________________ 6
Table 6 Preschool Enrolment by Age, District, and Gender ______________________________________________ 7
Table 7 Number of Preschool Teachers by Management, District and Sex __________________________________ 8
Table 8 Preschool Teachers by district and Urban/ Rural Locaion ________________________________________ 9
Table 9 Number of Primary Schools by District/Management and U/R Location _____________________________ 10
Table 10 Primary Enrolment by Grade, District and Sex _______________________________________________ 12
Table 11 Primary Enrolment by Grade, Age, and Gender ______________________________________________ 14
Table 12 Primary School Repetition Rates by Gender, Grade, District ____________________________________ 16
Table 13 Primary School Dropout by Gender, Grade, District ___________________________________________ 18
Table 14 Primary School Drop-Out Rate by Gender, Grade, District ______________________________________ 20
Table 15 Transition Rate to Secondary School (2009/2010) ____________________________________________ 22
Table 16 Primary Teachers by Management, Sex and District __________________________________________ 23
Table 17 Secondary Enrolment by District and Form and Sex___________________________________________ 24
Table 18 Secondary School Repetition Rate by Gender, Grade and District ________________________________ 25
Table 19 Secondary Teachers by District, Management, Qualification and Sex (2009-2010) ___________________ 26
Table 20 Primary School Enrolment Trends (1994-1995 to 2009-2010) ___________________________________ 27
Table 21 Secondary School Enrolment Trends (1999-00 to 2009-10) ____________________________________ 28
Table 22 Student Performance in PSE by District and U/R _____________________________________________ 29
Table 23 CSEC District (2009) ___________________________________________________________________ 31
Table 24 Junior College Enrolment by Institution and Sex 2000/01 – 2009/10 ______________________________ 32

2
Table 1 Enrolment by District, Level and Management
LEVEL TOTAL
District and
Management
Pre-school Primary Secondary Junior
College Tertiary
2008-09
2009-10
2008-09
2009-10
2008-09
2009-10
2008-09
2009-10
2008-09
2009-10
2008-09
2009-10
Belize 54 55 66 68 19 18 3 3 1 1 143 145
Government 9 7 7 7 7 7 0 0 0 0 23 21
Government Aided 26 30 50 50 9 9 3 3 0 0 88 92
Private \Sp. Assisted 19 18 9 11 3 2 0 0 1 1 32 32
Cayo 32 34 64 65 12 12 2 2 2 2 112 115
Government 7 6 15 15 2 2 1 1 1 1 26 25
Government Aided 15 17 42 43 6 6 1 1 0 0 64 67
Private \Sp. Assisted 10 11 7 7 4 4 0 0 1 1 22 23
Corozal 29 32 42 42 6 6 3 3 0 0 80 83
Government 4 5 5 6 1 1 1 1 0 0 11 13
Government Aided 20 25 35 34 4 4 2 2 0 0 61 65
Private \Sp. Assisted 5 2 2 2 1 1 0 0 0 0 8 5
Orange Walk 20 21 37 37 7 7 1 1 0 0 65 66
Government 4 5 12 12 2 2 0 0 0 0 18 19
Government Aided 10 12 20 22 3 3 1 1 0 0 34 38
Private \Sp. Assisted 6 4 5 3 2 2 0 0 0 0 13 9
Stann Creek 27 29 35 35 4 5 2 2 0 0 68 71
Government 4 3 5 6 2 3 1 1 0 0 12 13
Government Aided 18 22 26 26 2 2 1 1 0 0 47 51
Private \Sp. Assisted 5 4 4 3 0 0 0 0 0 0 9 7
Toledo 20 22 50 50 3 4 0 0 0 0 73 76
Government 2 2 9 10 1 2 0 0 0 0 12 14
Government Aided 15 17 37 36 1 1 0 0 0 0 53 54
Private \Sp. Assisted 3 3 4 4 1 1 0 0 0 0 8 8
TOTAL 182 193 294 297 51 52 11 11 3 3 541 556
Government 30 28 53 56 15 17 3 3 1 1 102 105
Government Aided 104 123 210 211 25 25 8 8 0 0 347 367
Private \Sp. Assisted 48 42 31 30 11 10 0 0 2 2 92 84
Source: Policy & Planning Unit, MOE

3
Table 2 Enrolment by District, Level and Gender
LEVEL
District &
Gender
Pre-school Primary Secondary Jr. College Tertiary TOTAL
2008-09
2009-10
2008-09 2009-10 2008-09 2009-10
2008-09
2009-10
2008-09
2009-10
2008-09
2009-10
Belize 2,413 2,577 18,057 17,866 5,905 6,155 1,482 1,008 1,097 1,259 28,954 28,865
Male 1,235 1243 9,210 9,075 2,707 2,816 524 433 361 414 14,037 13,981
Female 1,178 1334 8,847 8,791 3,198 3,339 958 575 736 845 14,917 14,884
Cayo 1,067 1,080 16,803 17,062 4,194 4,337 481 484 2,294 2,399 24,839 25,362
Male 536 549 8,510 8,702 2,003 2,014 201 208 860 850 12,110 12,323
Female 531 531 8,293 8,360 2,191 2,323 280 276 1,434 1,549 12,729 13,039
Corozal 609 850 7,601 7,554 2,040 2,009 644 690 0 0 10,894 11,103
Male 305 406 3,822 3,789 987 960 271 300 0 0 5,385 5,455
Female 304 444 3,779 3,765 1,053 1,049 373 390 0 0 5,509 5,648
Orange Walk 601 623 8,502 8,738 1,946 1,931 470 450 0 32 11,519 11,774
Male 320 300 4,397 4,449 954 947 226 212 0 8 5,897 5,916
Female 281 323 4,105 4,289 992 984 244 238 0 24 5,622 5,858
Stann Creek 822 896 9,214 9,157 2,125 2,390 314 374 0 0 12,475 12,817
Male 395 442 4,738 4,738 1,010 1,161 105 151 0 0 6,248 6,492
Female 427 454 4,476 4,419 1,115 1,229 209 223 0 0 6,227 6,325
Toledo 522 570 6,558 6,631 1,405 1,600 0 0 190 312 8,675 9,113
Male 259 285 3,329 3,345 747 848 0 0 60 110 4,395 4,588
Female 263 285 3,229 3,286 658 752 0 0 130 202 4,280 4,525
TOTAL 6,034 6,596 66,735 67,008 17,615 18,422 3,391 3,006 3,581 4,002 97,356 99,034
Male 3,050 3,225 34,006 34,098 8,408 8,746 1,327 1,304 1,281 1,382 48,072 48,755
Female 2,984 3,371 32,729 32,910 9,207 9,676 2,064 1,702 2,300 2,620 49,284 50,279
Source: Policy & Planning Unit, MOE
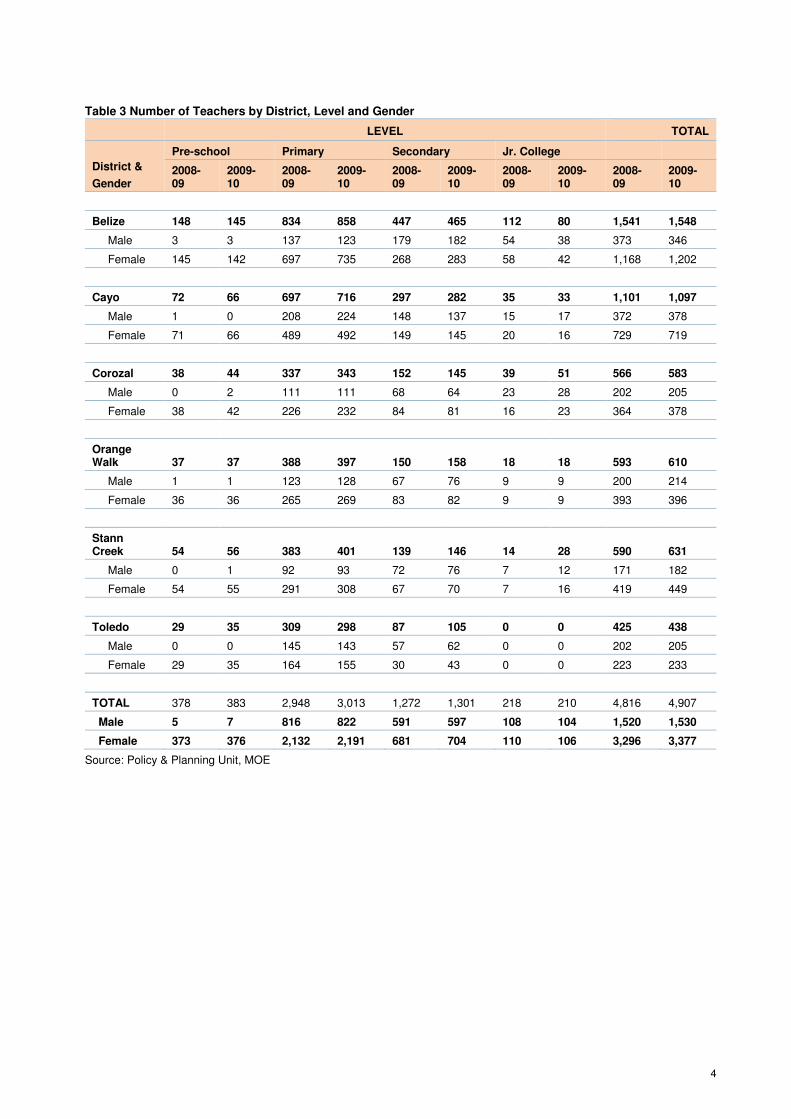
4
Table 3 Number of Teachers by District, Level and Gender
LEVEL TOTAL
District &
Gender
Pre-school Primary Secondary Jr. College
2008-09
2009-10
2008-09
2009-10
2008-09
2009-10
2008-09
2009-10
2008-09
2009-10
Belize 148 145 834 858 447 465 112 80 1,541 1,548
Male 3 3 137 123 179 182 54 38 373 346
Female 145 142 697 735 268 283 58 42 1,168 1,202
Cayo 72 66 697 716 297 282 35 33 1,101 1,097
Male 1 0 208 224 148 137 15 17 372 378
Female 71 66 489 492 149 145 20 16 729 719
Corozal 38 44 337 343 152 145 39 51 566 583
Male 0 2 111 111 68 64 23 28 202 205
Female 38 42 226 232 84 81 16 23 364 378
Orange Walk 37 37 388 397 150 158 18 18 593 610
Male 1 1 123 128 67 76 9 9 200 214
Female 36 36 265 269 83 82 9 9 393 396
Stann Creek 54 56 383 401 139 146 14 28 590 631
Male 0 1 92 93 72 76 7 12 171 182
Female 54 55 291 308 67 70 7 16 419 449
Toledo 29 35 309 298 87 105 0 0 425 438
Male 0 0 145 143 57 62 0 0 202 205
Female 29 35 164 155 30 43 0 0 223 233
TOTAL 378 383 2,948 3,013 1,272 1,301 218 210 4,816 4,907
Male 5 7 816 822 591 597 108 104 1,520 1,530
Female 373 376 2,132 2,191 681 704 110 106 3,296 3,377
Source: Policy & Planning Unit, MOE
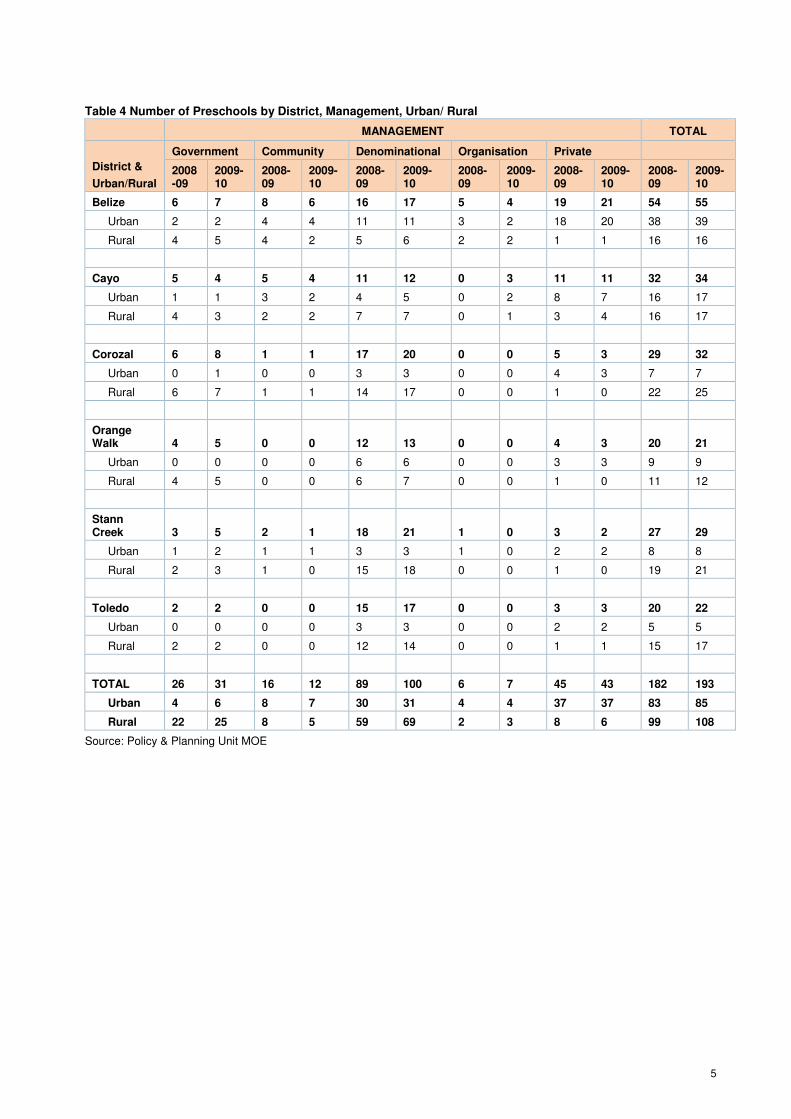
5
Table 4 Number of Preschools by District, Management, Urban/ Rural
MANAGEMENT TOTAL
District &
Urban/Rural
Government Community Denominational Organisation Private
2008-09
2009-10
2008-09
2009-10
2008-09
2009-10
2008-09
2009-10
2008-09
2009-10
2008-09
2009-10
Belize 6 7 8 6 16 17 5 4 19 21 54 55
Urban 2 2 4 4 11 11 3 2 18 20 38 39
Rural 4 5 4 2 5 6 2 2 1 1 16 16
Cayo 5 4 5 4 11 12 0 3 11 11 32 34
Urban 1 1 3 2 4 5 0 2 8 7 16 17
Rural 4 3 2 2 7 7 0 1 3 4 16 17
Corozal 6 8 1 1 17 20 0 0 5 3 29 32
Urban 0 1 0 0 3 3 0 0 4 3 7 7
Rural 6 7 1 1 14 17 0 0 1 0 22 25
Orange Walk 4 5 0 0 12 13 0 0 4 3 20 21
Urban 0 0 0 0 6 6 0 0 3 3 9 9
Rural 4 5 0 0 6 7 0 0 1 0 11 12
Stann Creek 3 5 2 1 18 21 1 0 3 2 27 29
Urban 1 2 1 1 3 3 1 0 2 2 8 8
Rural 2 3 1 0 15 18 0 0 1 0 19 21
Toledo 2 2 0 0 15 17 0 0 3 3 20 22
Urban 0 0 0 0 3 3 0 0 2 2 5 5
Rural 2 2 0 0 12 14 0 0 1 1 15 17
TOTAL 26 31 16 12 89 100 6 7 45 43 182 193
Urban 4 6 8 7 30 31 4 4 37 37 83 85
Rural 22 25 8 5 59 69 2 3 8 6 99 108
Source: Policy & Planning Unit MOE

6
Table 5 Preschool Enrolment by Management, District and Urban/Rural Location
MANAGEMENT TOTAL
District and
Urban/Rural
Government Community Denominational Organization Private
2008/09 2009/10 2008/09 2009/10 2008/09 2009/10 2008/09 2009/10 2008/09 2009/10 2008/09 2009/10
M F M F M F M F M F M F M F M F M F M F M F T M F T
Belize 110 108 107 137 211 220 188 190 267 268 335 351 165 175 149 147 426 463 464 509 1,179 1,234 2,413 1,243 1,334 2,577
Urban 49 43 43 56 166 157 163 149 219 217 274 270 149 161 107 101 404 440 449 501 987 1,018 2,005 1,036 1,077 2,113
Rural 61 65 64 81 45 63 25 41 48 51 61 81 16 14 42 46 22 23 15 8 192 216 408 207 257 464
Cayo 64 82 73 64 154 130 122 116 160 179 190 208 17 14 38 36 136 131 126 107 531 536 1,067 549 531 1,080
Urban 12 6 25 17 111 97 89 93 83 88 99 112 17 14 31 23 105 88 69 60 328 293 621 313 305 618
Rural 52 76 48 47 43 33 33 23 77 91 91 96 0 0 7 13 31 43 57 47 203 243 446 236 226 462
Corozal 60 46 77 72 0 0 7 14 227 246 267 291 0 0 0 0 17 13 55 67 304 305 609 406 444 850
Urban 0 0 12 7 0 0 0 0 64 63 69 69 0 0 0 0 17 13 55 67 81 76 157 136 143 279
Rural 60 46 65 65 0 0 7 14 163 183 198 222 0 0 0 0 0 0 0 0 223 229 452 270 301 571
Orange Walk 67 69 83 82 0 0 0 0 181 220 192 220 0 0 0 0 33 31 25 21 281 320 601 300 323 623
Urban 0 0 0 0 0 0 0 0 106 131 103 145 0 0 0 0 28 23 25 21 134 154 288 128 166 294
Rural 67 69 83 82 0 0 0 0 75 89 89 75 0 0 0 0 5 8 0 0 147 166 313 172 157 329
Stann Creek 34 50 62 69 29 26 22 28 281 240 323 319 22 20 0 0 61 59 35 38 427 395 822 442 454 896
Urban 17 26 33 33 18 13 22 28 45 55 50 60 22 20 0 0 43 38 35 38 145 152 297 140 159 299
Rural 17 24 29 36 11 13 0 0 236 185 273 259 0 0 0 0 18 21 0 0 282 243 525 302 295 597
Toledo 17 22 15 23 0 0 0 0 201 194 224 218 0 0 0 0 45 43 46 44 263 259 522 285 285 570
Urban 0 0 0 0 0 0 0 0 27 31 28 39 0 0 0 0 40 37 36 41 67 68 135 64 80 144
Rural 17 22 15 23 0 0 0 0 174 163 196 179 0 0 0 0 5 6 10 3 196 191 387 221 205 426
TOTAL 352 377 417 447 394 376 339 348 1,317 1,347 1,531 1,607 204 209 187 183 718 740 751 786 2,985 3,049 6,034 3,225 3,371 6,596
Urban 78 75 113 113 295 267 274 270 544 585 623 695 188 195 138 124 637 639 669 728 1,742 1,761 3,503 1,817 1,930 3,747
Rural 274 302 304 334 99 109 65 78 773 762 908 912 16 14 49 59 81 101 82 58 1,243 1,288 2,531 1,408 1,441 2,849
Source: Policy & Planning Unit, MOE
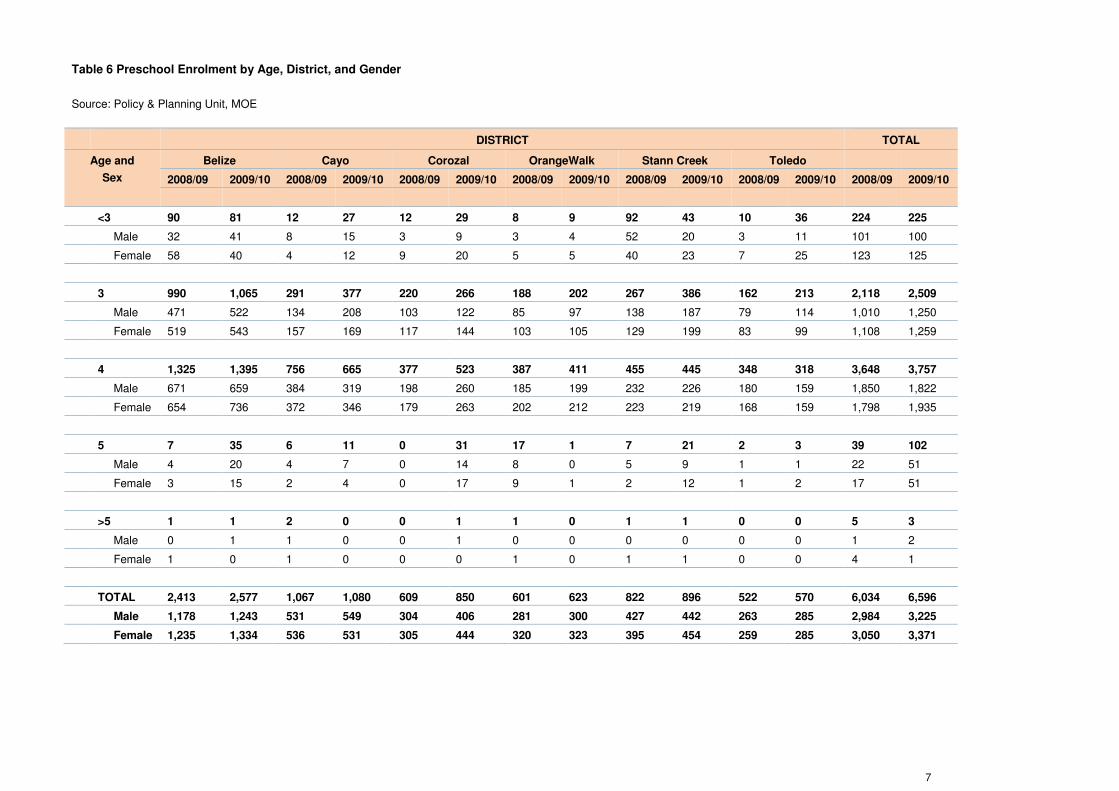
7
Table 6 Preschool Enrolment by Age, District, and Gender
Source: Policy & Planning Unit, MOE
DISTRICT TOTAL
Age and
Sex
Belize Cayo Corozal OrangeWalk Stann Creek Toledo
2008/09 2009/10 2008/09 2009/10 2008/09 2009/10 2008/09 2009/10 2008/09 2009/10 2008/09 2009/10 2008/09 2009/10
<3 90 81 12 27 12 29 8 9 92 43 10 36 224 225
Male 32 41 8 15 3 9 3 4 52 20 3 11 101 100
Female 58 40 4 12 9 20 5 5 40 23 7 25 123 125
3 990 1,065 291 377 220 266 188 202 267 386 162 213 2,118 2,509
Male 471 522 134 208 103 122 85 97 138 187 79 114 1,010 1,250
Female 519 543 157 169 117 144 103 105 129 199 83 99 1,108 1,259
4 1,325 1,395 756 665 377 523 387 411 455 445 348 318 3,648 3,757
Male 671 659 384 319 198 260 185 199 232 226 180 159 1,850 1,822
Female 654 736 372 346 179 263 202 212 223 219 168 159 1,798 1,935
5 7 35 6 11 0 31 17 1 7 21 2 3 39 102
Male 4 20 4 7 0 14 8 0 5 9 1 1 22 51
Female 3 15 2 4 0 17 9 1 2 12 1 2 17 51
>5 1 1 2 0 0 1 1 0 1 1 0 0 5 3
Male 0 1 1 0 0 1 0 0 0 0 0 0 1 2
Female 1 0 1 0 0 0 1 0 1 1 0 0 4 1
TOTAL 2,413 2,577 1,067 1,080 609 850 601 623 822 896 522 570 6,034 6,596
Male 1,178 1,243 531 549 304 406 281 300 427 442 263 285 2,984 3,225
Female 1,235 1,334 536 531 305 444 320 323 395 454 259 285 3,050 3,371

8
Table 7 Number of Preschool Teachers by Management, District and Sex
MANAGEMENT TOTAL
District and
Sex
Government Community Denominational Organization Private
2008/09 2009/10 2008/09 2009/10 2008/09 2009/10 2008/09 2009/10 2008/09 2009/10 2008/09 2009/10
Belize 12 13 24 22 34 36 16 18 62 56 148 145
Male 0 0 0 0 0 0 3 3 3 3
Female 12 13 24 22 34 36 16 18 59 53 145 142
Cayo 7 7 16 13 22 20 3 9 24 17 72 66
Male 0 0 0 0 0 0 1 0 1 0
Female 7 7 16 13 22 20 3 9 23 17 71 66
Corozal 8 9 1 1 22 28 0 0 7 6 38 44
Male 0 0 0 0 2 0 0 0 0 2
Female 8 9 1 1 22 26 0 0 7 6 38 42
Orange Walk 7 9 0 0 22 22 0 0 8 6 37 37
Male 0 1 0 1 0 0 0 0 1 1
Female 7 8 0 0 21 22 0 0 8 6 36 36
Stann Creek 4 5 4 2 35 39 1 2 10 8 54 56
Male 0 0 0 0 1 0 0 0 0 1
Female 4 5 4 2 35 38 1 2 10 8 54 55
Toledo 2 2 0 0 21 27 0 0 6 6 29 35
Male 0 0 0 0 0 0 0 0 0 0
Female 2 2 0 0 21 27 0 0 6 6 29 35
TOTAL 40 45 45 38 156 172 20 29 117 99 378 383
Male 0 1 0 0 1 3 0 0 4 3 5 7
Female 40 44 45 38 155 169 20 29 113 96 373 376
Source: Policy & Planning Unit, MOE

9
Table 8 Preschool Teachers by district and Urban/ Rural Locaion
District 2008/09 2009/10
Urban Rural Total Urban Rural Total
Belize 113 35 148 113 32 145
Cayo 45 27 72 41 25 66
Corozal 10 28 38 12 32 44
Orange Walk 21 16 37 19 18 37
Stann Creek 18 36 54 19 37 56
Toledo 9 20 29 10 25 35
TOTAL 216 162 378 214 169 383
Source: Policy & Planning Unit, MOE
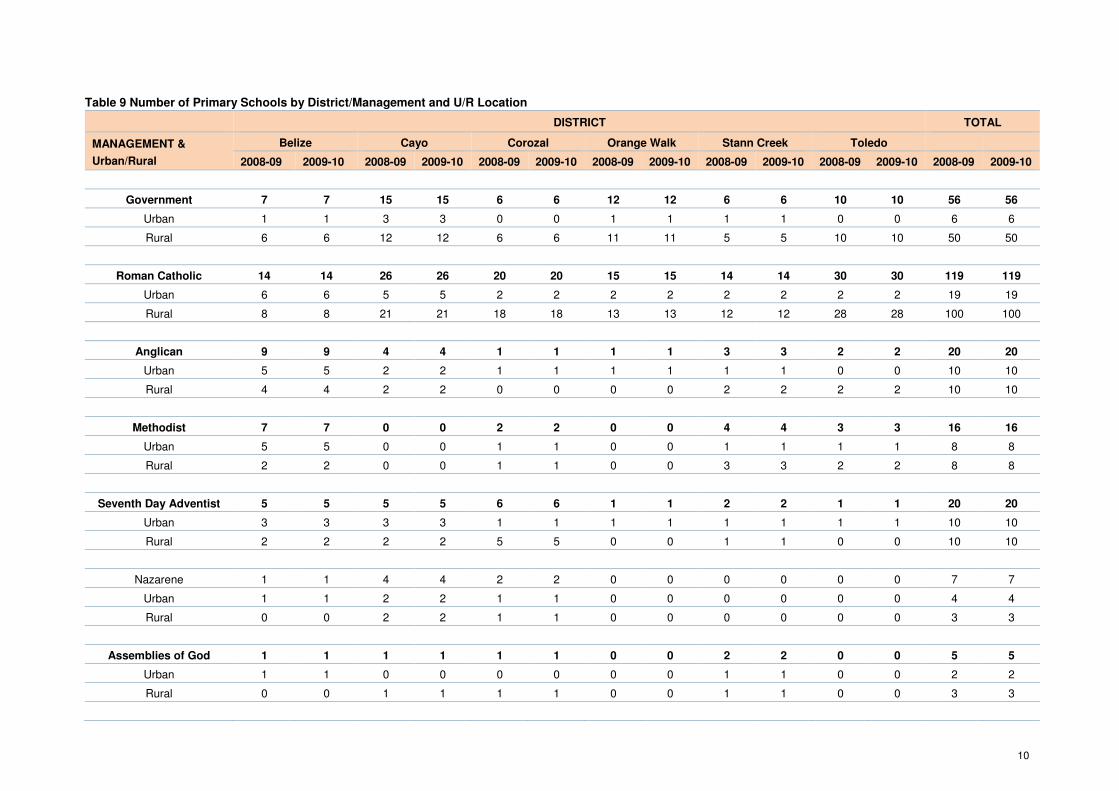
10
Table 9 Number of Primary Schools by District/Management and U/R Location
DISTRICT TOTAL
MANAGEMENT &
Urban/Rural
Belize Cayo Corozal Orange Walk Stann Creek Toledo
2008-09 2009-10 2008-09 2009-10 2008-09 2009-10 2008-09 2009-10 2008-09 2009-10 2008-09 2009-10 2008-09 2009-10
Government 7 7 15 15 6 6 12 12 6 6 10 10 56 56
Urban 1 1 3 3 0 0 1 1 1 1 0 0 6 6
Rural 6 6 12 12 6 6 11 11 5 5 10 10 50 50
Roman Catholic 14 14 26 26 20 20 15 15 14 14 30 30 119 119
Urban 6 6 5 5 2 2 2 2 2 2 2 2 19 19
Rural 8 8 21 21 18 18 13 13 12 12 28 28 100 100
Anglican 9 9 4 4 1 1 1 1 3 3 2 2 20 20
Urban 5 5 2 2 1 1 1 1 1 1 0 0 10 10
Rural 4 4 2 2 0 0 0 0 2 2 2 2 10 10
Methodist 7 7 0 0 2 2 0 0 4 4 3 3 16 16
Urban 5 5 0 0 1 1 0 0 1 1 1 1 8 8
Rural 2 2 0 0 1 1 0 0 3 3 2 2 8 8
Seventh Day Adventist 5 5 5 5 6 6 1 1 2 2 1 1 20 20
Urban 3 3 3 3 1 1 1 1 1 1 1 1 10 10
Rural 2 2 2 2 5 5 0 0 1 1 0 0 10 10
Nazarene 1 1 4 4 2 2 0 0 0 0 0 0 7 7
Urban 1 1 2 2 1 1 0 0 0 0 0 0 4 4
Rural 0 0 2 2 1 1 0 0 0 0 0 0 3 3
Assemblies of God 1 1 1 1 1 1 0 0 2 2 0 0 5 5
Urban 1 1 0 0 0 0 0 0 1 1 0 0 2 2
Rural 0 0 1 1 1 1 0 0 1 1 0 0 3 3

11
Private 9 10 3 3 0 0 3 3 1 1 2 2 18 19
Urban 9 10 1 1 0 0 0 0 1 1 0 0 11 12
Rural 0 0 2 2 0 0 3 3 0 0 2 2 7 7
Other 13 14 6 7 4 4 5 5 3 3 2 2 33 35
Urban 8 9 2 3 1 1 2 2 0 0 0 0 13 15
Rural 5 5 4 4 3 3 3 3 3 3 2 2 20 20
TOTAL 66 68 64 65 42 42 37 37 35 35 50 50 294 297
Urban 39 41 18 19 7 7 7 7 8 8 4 4 83 86
Rural 27 27 46 46 35 35 30 30 27 27 46 46 211 211
Source: Policy & Planning Unit, MOE
New Schools
Horizon Academy
Arms of Love
United Presbyterian (New to our database)

12
Table 10 Primary Enrolment by Grade, District and Sex
DISTRICT TOTAL
Grade &
Sex
Belize Cayo Corozal Orange Walk Stann Creek Toledo
2008-09 2009-10 2008-09 2009-10 2008-09 2009-10 2008-09 2009-10 2008-09 2009-10 2008-09 2009-10 2008-09 2009-10
Special Ed. 139 142 16 22 12 12 30 38 25 23 27 18 249 255
Male 98 99 12 15 6 6 19 23 16 16 17 10 168 169
Female 41 43 4 7 6 6 11 15 9 7 10 8 81 86
Beginners 91 121 131 59 51 19 25 50 0 2 30 17 328 268
Male 46 55 57 30 27 10 11 27 0 2 16 9 157 133
Female 45 66 74 29 24 9 14 23 0 0 14 8 171 135
Infant 1 2,352 2,343 2,265 2,358 1,023 1,025 1,187 1,229 1,284 1,170 995 963 9,106 9,088
Male 1,236 1,195 1,185 1,213 544 515 618 647 646 605 501 498 4,730 4,673
Female 1,116 1,148 1,080 1,145 479 510 569 582 638 565 494 465 4,376 4,415
Infant 2 2,299 2,192 2,260 2,115 963 970 1,084 1,109 1,174 1,197 878 943 8,658 8,526
Male 1,170 1,138 1,160 1,098 501 527 546 559 611 598 468 476 4,456 4,396
Female 1,129 1,054 1,100 1,017 462 443 538 550 563 599 410 467 4,202 4,130
Standard 1 2,418 2,290 2,378 2,278 980 947 1,181 1,106 1,265 1,177 888 864 9,110 8,662
Male 1,203 1,160 1,217 1,190 491 475 597 549 663 609 455 438 4,626 4,421
Female 1,215 1,130 1,161 1,088 489 472 584 557 602 568 433 426 4,484 4,241
Standard 2 2,307 2,378 2,212 2,374 1,036 971 1,111 1,166 1,286 1,251 852 853 8,804 8,993
Male 1,185 1,187 1,156 1,222 509 472 569 585 680 671 443 448 4,542 4,585
Female 1,122 1,191 1,056 1,152 527 499 542 581 606 580 409 405 4,262 4,408
Standard 3 2,175 2,214 2,118 2,217 941 1,032 1,101 1,118 1,197 1,251 844 896 8,376 8,728
Male 1,136 1,140 1,112 1,130 474 515 587 558 615 650 394 441 4,318 4,434
Female 1,039 1,074 1,006 1,087 467 517 514 560 582 601 450 455 4,058 4,294
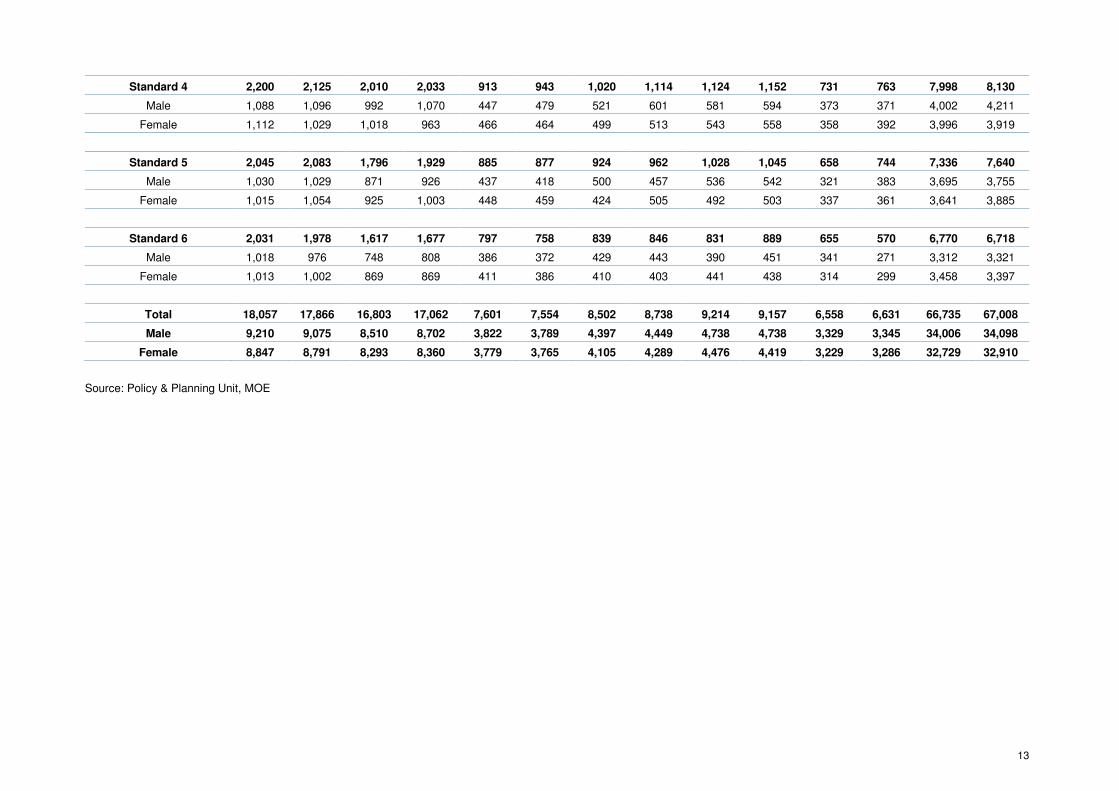
13
Standard 4 2,200 2,125 2,010 2,033 913 943 1,020 1,114 1,124 1,152 731 763 7,998 8,130
Male 1,088 1,096 992 1,070 447 479 521 601 581 594 373 371 4,002 4,211
Female 1,112 1,029 1,018 963 466 464 499 513 543 558 358 392 3,996 3,919
Standard 5 2,045 2,083 1,796 1,929 885 877 924 962 1,028 1,045 658 744 7,336 7,640
Male 1,030 1,029 871 926 437 418 500 457 536 542 321 383 3,695 3,755
Female 1,015 1,054 925 1,003 448 459 424 505 492 503 337 361 3,641 3,885
Standard 6 2,031 1,978 1,617 1,677 797 758 839 846 831 889 655 570 6,770 6,718
Male 1,018 976 748 808 386 372 429 443 390 451 341 271 3,312 3,321
Female 1,013 1,002 869 869 411 386 410 403 441 438 314 299 3,458 3,397
Total 18,057 17,866 16,803 17,062 7,601 7,554 8,502 8,738 9,214 9,157 6,558 6,631 66,735 67,008
Male 9,210 9,075 8,510 8,702 3,822 3,789 4,397 4,449 4,738 4,738 3,329 3,345 34,006 34,098
Female 8,847 8,791 8,293 8,360 3,779 3,765 4,105 4,289 4,476 4,419 3,229 3,286 32,729 32,910
Source: Policy & Planning Unit, MOE
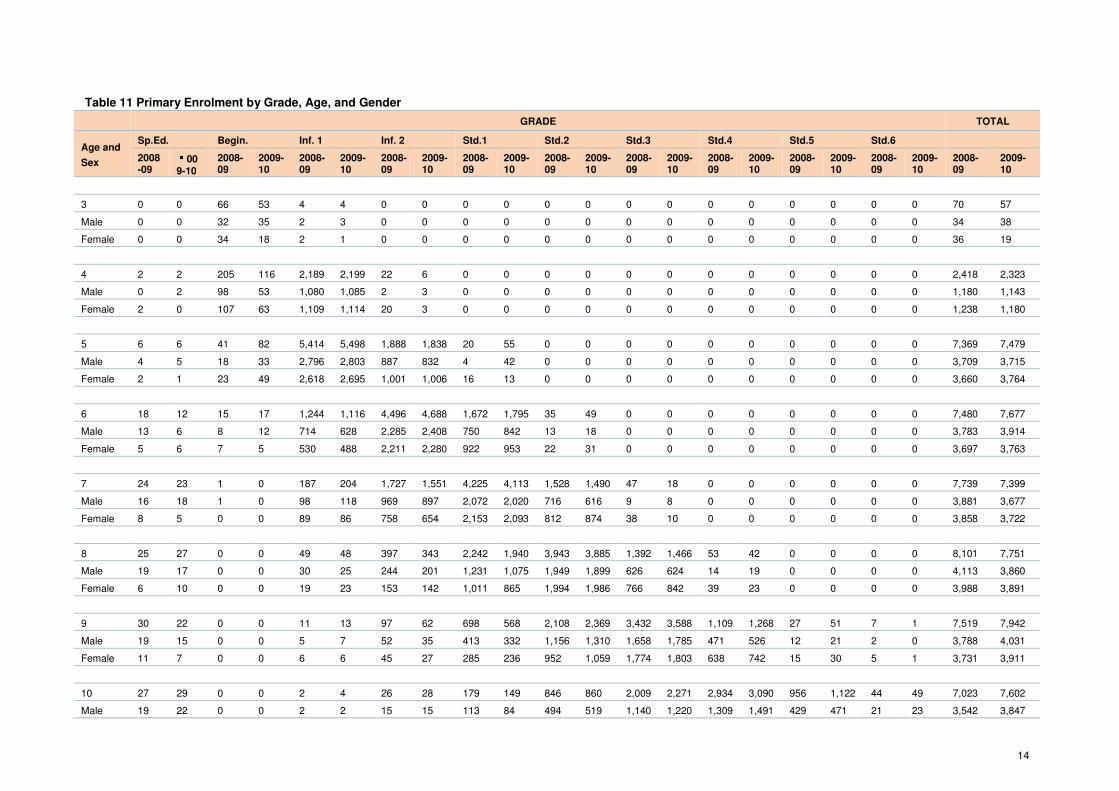
14
Table 11 Primary Enrolment by Grade, Age, and Gender
GRADE TOTAL
Age and
Sex
Sp.Ed. Begin. Inf. 1 Inf. 2 Std.1 Std.2 Std.3 Std.4 Std.5 Std.6
2008-09
����009-10
2008-09
2009-10
2008-09
2009-10
2008-09
2009-10
2008-09
2009-10
2008-09
2009-10
2008-09
2009-10
2008-09
2009-10
2008-09
2009-10
2008-09
2009-10
2008-09
2009-10
3 0 0 66 53 4 4 0 0 0 0 0 0 0 0 0 0 0 0 0 0 70 57
Male 0 0 32 35 2 3 0 0 0 0 0 0 0 0 0 0 0 0 0 0 34 38
Female 0 0 34 18 2 1 0 0 0 0 0 0 0 0 0 0 0 0 0 0 36 19
4 2 2 205 116 2,189 2,199 22 6 0 0 0 0 0 0 0 0 0 0 0 0 2,418 2,323
Male 0 2 98 53 1,080 1,085 2 3 0 0 0 0 0 0 0 0 0 0 0 0 1,180 1,143
Female 2 0 107 63 1,109 1,114 20 3 0 0 0 0 0 0 0 0 0 0 0 0 1,238 1,180
5 6 6 41 82 5,414 5,498 1,888 1,838 20 55 0 0 0 0 0 0 0 0 0 0 7,369 7,479
Male 4 5 18 33 2,796 2,803 887 832 4 42 0 0 0 0 0 0 0 0 0 0 3,709 3,715
Female 2 1 23 49 2,618 2,695 1,001 1,006 16 13 0 0 0 0 0 0 0 0 0 0 3,660 3,764
6 18 12 15 17 1,244 1,116 4,496 4,688 1,672 1,795 35 49 0 0 0 0 0 0 0 0 7,480 7,677
Male 13 6 8 12 714 628 2,285 2,408 750 842 13 18 0 0 0 0 0 0 0 0 3,783 3,914
Female 5 6 7 5 530 488 2,211 2,280 922 953 22 31 0 0 0 0 0 0 0 0 3,697 3,763
7 24 23 1 0 187 204 1,727 1,551 4,225 4,113 1,528 1,490 47 18 0 0 0 0 0 0 7,739 7,399
Male 16 18 1 0 98 118 969 897 2,072 2,020 716 616 9 8 0 0 0 0 0 0 3,881 3,677
Female 8 5 0 0 89 86 758 654 2,153 2,093 812 874 38 10 0 0 0 0 0 0 3,858 3,722
8 25 27 0 0 49 48 397 343 2,242 1,940 3,943 3,885 1,392 1,466 53 42 0 0 0 0 8,101 7,751
Male 19 17 0 0 30 25 244 201 1,231 1,075 1,949 1,899 626 624 14 19 0 0 0 0 4,113 3,860
Female 6 10 0 0 19 23 153 142 1,011 865 1,994 1,986 766 842 39 23 0 0 0 0 3,988 3,891
9 30 22 0 0 11 13 97 62 698 568 2,108 2,369 3,432 3,588 1,109 1,268 27 51 7 1 7,519 7,942
Male 19 15 0 0 5 7 52 35 413 332 1,156 1,310 1,658 1,785 471 526 12 21 2 0 3,788 4,031
Female 11 7 0 0 6 6 45 27 285 236 952 1,059 1,774 1,803 638 742 15 30 5 1 3,731 3,911
10 27 29 0 0 2 4 26 28 179 149 846 860 2,009 2,271 2,934 3,090 956 1,122 44 49 7,023 7,602
Male 19 22 0 0 2 2 15 15 113 84 494 519 1,140 1,220 1,309 1,491 429 471 21 23 3,542 3,847

15
Female 8 7 0 0 0 2 11 13 66 65 352 341 869 1,051 1,625 1,599 527 651 23 26 3,481 3,755
11 27 33 0 0 5 0 2 5 50 32 254 231 1,049 924 2,169 2,078 2,583 2,648 926 952 7,065 6,903
Male 18 20 0 0 2 0 1 3 31 21 164 153 608 510 1,167 1,180 1,195 1,191 404 413 3,590 3,491
Female 9 13 0 0 3 0 1 2 19 11 90 78 441 414 1,002 898 1,388 1,457 522 539 3,475 3,412
12 29 29 0 0 1 1 2 4 17 7 70 85 331 345 1,157 1,188 1,997 2,182 2,324 2,369 5,928 6,210
Male 18 21 0 0 1 1 1 1 7 5 40 58 215 225 674 700 1,009 1,110 1,052 1,073 3,017 3,194
Female 11 8 0 0 0 0 1 3 10 2 30 27 116 120 483 488 988 1,072 1,272 1,296 2,911 3,016
13 28 29 0 0 0 1 1 1 7 1 14 18 97 93 452 364 1,276 1,177 2,019 1,925 3,894 3,609
Male 22 14 0 0 0 1 0 1 5 0 7 9 49 48 284 228 731 668 1,027 987 2,125 1,956
Female 6 15 0 0 0 0 1 0 2 1 7 9 48 45 168 136 545 509 992 938 1,769 1,653
14 21 22 0 0 0 0 0 0 0 2 5 4 16 21 100 90 403 387 1,049 1,083 1,594 1,609
Male 11 15 0 0 0 0 0 0 0 0 3 3 11 13 63 58 255 248 566 623 909 960
Female 10 7 0 0 0 0 0 0 0 2 2 1 5 8 37 32 148 139 483 460 685 649
15+ 12 21 0 0 0 0 0 0 0 0 1 2 3 2 24 10 94 73 401 339 535 447
Male 9 14 0 0 0 0 0 0 0 0 0 0 2 1 20 9 64 46 240 202 335 272
Female 3 7 0 0 0 0 0 0 0 0 1 2 1 1 4 1 30 27 161 137 200 175
Total 249 255 328 268 9,106 9,088 8,658 8,526 9,110 8,662 8,804 8,993 8,376 8,728 7,998 8,130 7,336 7,640 6,770 6,718 66,735 67,008
Male 168 169 157 133 4,730 4,673 4,456 4,396 4,626 4,421 4,542 4,585 4,318 4,434 4,002 4,211 3,695 3,755 3,312 3,321 34,006 34,098
Female 81 86 171 135 4,376 4,415 4,202 4,130 4,484 4,241 4,262 4,408 4,058 4,294 3,996 3,919 3,641 3,885 3,458 3,397 32,729 32,910

16
Table 12 Primary School Repetition Rates by Gender, Grade, District
Grade and
Sex
DISTRICT
PERCENT REPEAT Belize Cayo Corozal Orange Walk Stann Creek Toledo
2007-08 2008-09 2007-08 2008-09 2007-08 2008-09 2007-08 2008-09 2007-08 2008-09 2007-08 2008-09 2007-08 2008-09
No % No % No % No % No % No % No % No % No % No % No % No % No % No %
Beginners 4 2.8 3 3.3 2 8.3 1 0.8 11 73.3 0 0.0 2 22.2 4 16.0 14 35.0 0 0.0 1 20.0 9 30.0 34 14.5 17 5.2
Male 0 0.0 2 4.3 1 9.1 0 0.0 5 83.3 0 0.0 2 33.3 1 9.1 0 0.0 0 0.0 0 0.0 2 12.5 8 6.1 5 3.2
Female 4 6.9 1 2.2 1 7.7 1 1.4 6 66.7 0 0.0 0 0.0 3 21.4 14 87.5 0 0.0 1 20.0 7 50.0 26 25.0 12 7.0
Infant 1 278 11.1 279 11.9 291 12.4 230 10.2 161 15.3 140 13.7 158 13.7 176 14.8 240 18.9 154 12.0 191 19.4 170 17.1 1319 14.2 1149 12.6
Male 186 14.2 169 13.7 183 14.9 134 11.3 98 17.8 77 14.2 85 14.4 105 17.0 149 22.1 85 13.2 106 19.9 101 20.2 807 16.5 671 14.2
Female 92 7.8 110 9.9 108 9.6 96 8.9 63 12.6 63 13.2 73 12.9 71 12.5 91 15.2 69 10.8 85 18.7 69 14.0 512 11.6 478 10.9
Infant 2 125 5.3 135 5.9 204 8.7 150 6.6 71 7.3 79 8.2 105 8.8 109 10.1 91 7.4 78 6.6 76 8.4 116 13.2 672 7.5 667 7.7
Male 73 6.3 87 7.4 127 10.5 81 7.0 46 9.5 49 9.8 54 9.2 64 11.7 56 8.8 36 5.9 38 8.2 76 16.2 394 8.7 393 8.8
Female 52 4.3 48 4.3 77 6.8 69 6.3 25 5.1 30 6.5 51 8.4 45 8.4 35 5.9 42 7.5 38 8.5 40 9.8 278 6.2 274 6.5
Standard 1 144 6.1 130 5.4 222 10.1 170 7.1 84 8.1 68 6.9 103 9.0 107 9.1 131 10.3 88 7.0 72 8.0 93 10.5 756 8.5 656 7.2
Male 90 7.3 80 6.7 120 10.4 120 9.9 50 9.6 38 7.7 58 9.8 70 11.7 81 12.3 53 8.0 44 9.4 55 12.1 443 9.6 416 9.0
Female 54 4.7 50 4.1 102 9.7 50 4.3 34 6.5 30 6.1 45 8.1 37 6.3 50 8.2 35 5.8 28 6.5 38 8.8 313 7.3 240 5.4
Standard 2 105 4.6 116 5.0 174 8.2 107 4.8 62 6.7 78 7.5 75 6.8 72 6.5 104 8.5 75 5.8 69 8.2 81 9.5 589 6.9 529 6.0
Male 71 5.9 70 5.9 103 9.4 70 6.1 33 7.1 45 8.8 46 7.6 45 7.9 71 11.0 47 6.9 45 11.3 48 10.8 369 8.4 325 7.2
Female 34 3.2 46 4.1 71 6.9 37 3.5 29 6.3 33 6.3 29 5.8 27 5.0 33 5.7 28 4.6 24 5.4 33 8.1 220 5.4 204 4.8
Standard 3 69 3.2 88 4.0 146 7.3 129 6.1 66 7.0 78 8.3 74 6.9 97 8.8 76 6.5 77 6.4 87 10.6 95 11.3 518 6.4 564 6.7
Male 49 4.5 66 5.8 91 9.1 79 7.1 37 8.0 47 9.9 39 7.3 56 9.5 47 7.8 45 7.3 40 9.7 42 10.7 303 7.4 335 7.8
Female 20 1.9 22 2.1 55 5.5 50 5.0 29 6.1 31 6.6 35 6.5 41 8.0 29 5.2 32 5.5 47 11.6 53 11.8 215 5.3 229 5.6
Standard 4 92 4.4 99 4.5 139 7.6 58 2.9 36 4.0 66 7.2 53 5.4 87 8.5 61 5.7 55 4.9 36 4.9 25 3.4 417 5.5 390 4.9
Male 63 6.0 52 4.8 75 8.2 42 4.2 19 4.3 43 9.6 34 6.6 57 10.9 37 6.6 29 5.0 22 6.1 9 2.4 250 6.5 232 5.8
Female 29 2.8 47 4.2 64 7.0 16 1.6 17 3.8 23 4.9 19 4.1 30 6.0 24 4.7 26 4.8 14 3.8 16 4.5 167 4.4 158 4.0
Standard 5 81 3.7 45 2.2 118 6.5 63 3.5 39 4.5 62 7.0 54 5.6 48 5.2 63 6.8 42 4.1 39 5.5 56 8.5 394 5.3 316 4.3
Male 46 4.2 26 2.5 60 6.9 32 3.7 17 4.0 31 7.1 35 7.0 31 6.2 35 7.9 27 5.0 26 7.0 33 10.3 219 5.9 180 4.9
Female 35 3.2 19 1.9 58 6.0 31 3.4 22 4.9 31 6.9 19 4.2 17 4.0 28 5.7 15 3.0 13 3.8 23 6.8 175 4.6 136 3.7
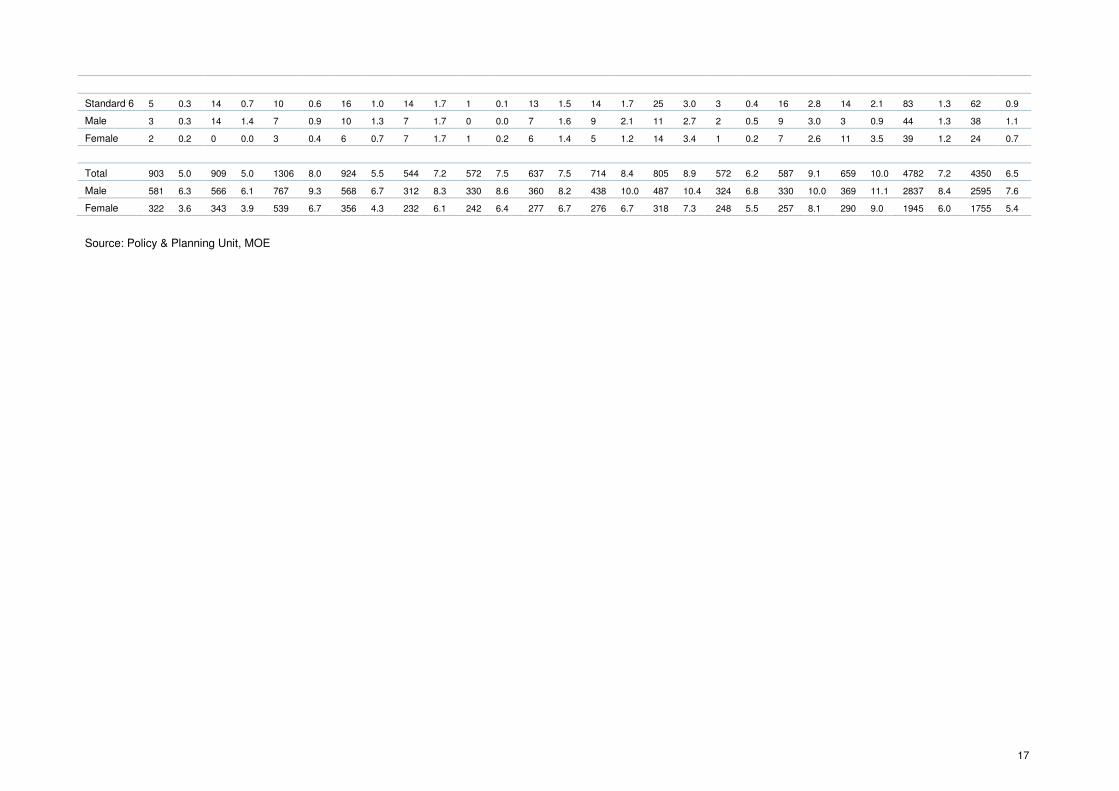
17
Standard 6 5 0.3 14 0.7 10 0.6 16 1.0 14 1.7 1 0.1 13 1.5 14 1.7 25 3.0 3 0.4 16 2.8 14 2.1 83 1.3 62 0.9
Male 3 0.3 14 1.4 7 0.9 10 1.3 7 1.7 0 0.0 7 1.6 9 2.1 11 2.7 2 0.5 9 3.0 3 0.9 44 1.3 38 1.1
Female 2 0.2 0 0.0 3 0.4 6 0.7 7 1.7 1 0.2 6 1.4 5 1.2 14 3.4 1 0.2 7 2.6 11 3.5 39 1.2 24 0.7
Total 903 5.0 909 5.0 1306 8.0 924 5.5 544 7.2 572 7.5 637 7.5 714 8.4 805 8.9 572 6.2 587 9.1 659 10.0 4782 7.2 4350 6.5
Male 581 6.3 566 6.1 767 9.3 568 6.7 312 8.3 330 8.6 360 8.2 438 10.0 487 10.4 324 6.8 330 10.0 369 11.1 2837 8.4 2595 7.6
Female 322 3.6 343 3.9 539 6.7 356 4.3 232 6.1 242 6.4 277 6.7 276 6.7 318 7.3 248 5.5 257 8.1 290 9.0 1945 6.0 1755 5.4
Source: Policy & Planning Unit, MOE
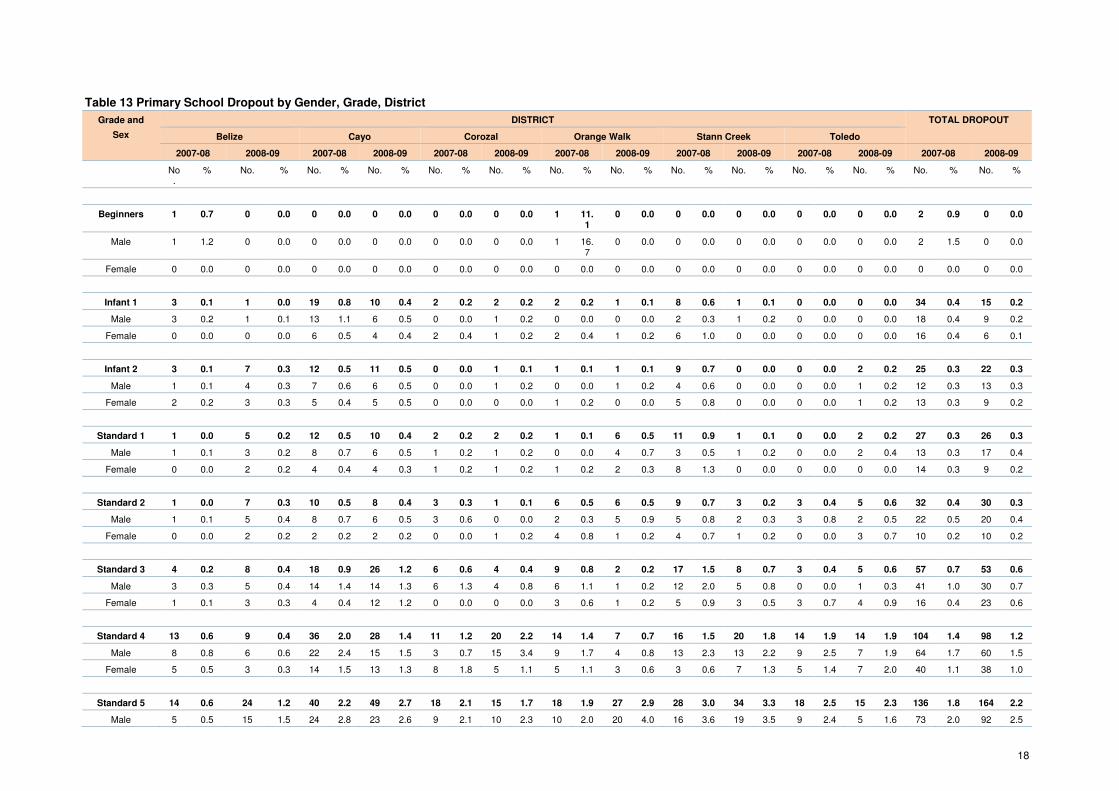
18
Table 13 Primary School Dropout by Gender, Grade, District
Grade and
Sex
DISTRICT TOTAL DROPOUT
Belize Cayo Corozal Orange Walk Stann Creek Toledo
2007-08 2008-09 2007-08 2008-09 2007-08 2008-09 2007-08 2008-09 2007-08 2008-09 2007-08 2008-09 2007-08 2008-09
No.
% No. % No. % No. % No. % No. % No. % No. % No. % No. % No. % No. % No. % No. %
Beginners 1 0.7 0 0.0 0 0.0 0 0.0 0 0.0 0 0.0 1 11.1
0 0.0 0 0.0 0 0.0 0 0.0 0 0.0 2 0.9 0 0.0
Male 1 1.2 0 0.0 0 0.0 0 0.0 0 0.0 0 0.0 1 16.7
0 0.0 0 0.0 0 0.0 0 0.0 0 0.0 2 1.5 0 0.0
Female 0 0.0 0 0.0 0 0.0 0 0.0 0 0.0 0 0.0 0 0.0 0 0.0 0 0.0 0 0.0 0 0.0 0 0.0 0 0.0 0 0.0
Infant 1 3 0.1 1 0.0 19 0.8 10 0.4 2 0.2 2 0.2 2 0.2 1 0.1 8 0.6 1 0.1 0 0.0 0 0.0 34 0.4 15 0.2
Male 3 0.2 1 0.1 13 1.1 6 0.5 0 0.0 1 0.2 0 0.0 0 0.0 2 0.3 1 0.2 0 0.0 0 0.0 18 0.4 9 0.2
Female 0 0.0 0 0.0 6 0.5 4 0.4 2 0.4 1 0.2 2 0.4 1 0.2 6 1.0 0 0.0 0 0.0 0 0.0 16 0.4 6 0.1
Infant 2 3 0.1 7 0.3 12 0.5 11 0.5 0 0.0 1 0.1 1 0.1 1 0.1 9 0.7 0 0.0 0 0.0 2 0.2 25 0.3 22 0.3
Male 1 0.1 4 0.3 7 0.6 6 0.5 0 0.0 1 0.2 0 0.0 1 0.2 4 0.6 0 0.0 0 0.0 1 0.2 12 0.3 13 0.3
Female 2 0.2 3 0.3 5 0.4 5 0.5 0 0.0 0 0.0 1 0.2 0 0.0 5 0.8 0 0.0 0 0.0 1 0.2 13 0.3 9 0.2
Standard 1 1 0.0 5 0.2 12 0.5 10 0.4 2 0.2 2 0.2 1 0.1 6 0.5 11 0.9 1 0.1 0 0.0 2 0.2 27 0.3 26 0.3
Male 1 0.1 3 0.2 8 0.7 6 0.5 1 0.2 1 0.2 0 0.0 4 0.7 3 0.5 1 0.2 0 0.0 2 0.4 13 0.3 17 0.4
Female 0 0.0 2 0.2 4 0.4 4 0.3 1 0.2 1 0.2 1 0.2 2 0.3 8 1.3 0 0.0 0 0.0 0 0.0 14 0.3 9 0.2
Standard 2 1 0.0 7 0.3 10 0.5 8 0.4 3 0.3 1 0.1 6 0.5 6 0.5 9 0.7 3 0.2 3 0.4 5 0.6 32 0.4 30 0.3
Male 1 0.1 5 0.4 8 0.7 6 0.5 3 0.6 0 0.0 2 0.3 5 0.9 5 0.8 2 0.3 3 0.8 2 0.5 22 0.5 20 0.4
Female 0 0.0 2 0.2 2 0.2 2 0.2 0 0.0 1 0.2 4 0.8 1 0.2 4 0.7 1 0.2 0 0.0 3 0.7 10 0.2 10 0.2
Standard 3 4 0.2 8 0.4 18 0.9 26 1.2 6 0.6 4 0.4 9 0.8 2 0.2 17 1.5 8 0.7 3 0.4 5 0.6 57 0.7 53 0.6
Male 3 0.3 5 0.4 14 1.4 14 1.3 6 1.3 4 0.8 6 1.1 1 0.2 12 2.0 5 0.8 0 0.0 1 0.3 41 1.0 30 0.7
Female 1 0.1 3 0.3 4 0.4 12 1.2 0 0.0 0 0.0 3 0.6 1 0.2 5 0.9 3 0.5 3 0.7 4 0.9 16 0.4 23 0.6
Standard 4 13 0.6 9 0.4 36 2.0 28 1.4 11 1.2 20 2.2 14 1.4 7 0.7 16 1.5 20 1.8 14 1.9 14 1.9 104 1.4 98 1.2
Male 8 0.8 6 0.6 22 2.4 15 1.5 3 0.7 15 3.4 9 1.7 4 0.8 13 2.3 13 2.2 9 2.5 7 1.9 64 1.7 60 1.5
Female 5 0.5 3 0.3 14 1.5 13 1.3 8 1.8 5 1.1 5 1.1 3 0.6 3 0.6 7 1.3 5 1.4 7 2.0 40 1.1 38 1.0
Standard 5 14 0.6 24 1.2 40 2.2 49 2.7 18 2.1 15 1.7 18 1.9 27 2.9 28 3.0 34 3.3 18 2.5 15 2.3 136 1.8 164 2.2
Male 5 0.5 15 1.5 24 2.8 23 2.6 9 2.1 10 2.3 10 2.0 20 4.0 16 3.6 19 3.5 9 2.4 5 1.6 73 2.0 92 2.5

19
Female 9 0.8 9 0.9 16 1.7 26 2.8 9 2.0 5 1.1 8 1.8 7 1.7 12 2.5 15 3.0 9 2.7 10 3.0 63 1.7 72 2.0
Standard 6 26 1.4 23 1.1 36 2.2 24 1.5 28 3.4 26 3.3 28 3.3 8 1.0 14 1.7 23 2.8 30 5.3 20 3.1 162 2.5 124 1.8
Male 12 1.3 21 2.1 16 2.0 13 1.7 18 4.5 11 2.8 16 3.8 6 1.4 5 1.2 11 2.8 14 4.7 8 2.3 81 2.5 70 2.1
Female 14 1.5 2 0.2 20 2.5 11 1.3 10 2.4 15 3.6 12 2.8 2 0.5 9 2.2 12 2.7 16 5.9 12 3.8 81 2.5 54 1.6
Total 66 0.4 84 0.5 183 1.1 166 1.0 70 0.9 71 0.9 80 0.9 58 0.7 112 1.2 90 1.0 68 1.0 63 1.0 579 0.9 532 0.8
Male 35 0.4 60 0.7 112 1.4 89 1.0 40 1.1 43 1.1 44 1.0 41 0.9 60 1.3 52 1.1 35 1.1 26 0.8 326 1.0 311 0.9
Female 31 0.4 24 0.3 71 0.9 77 0.9 30 0.8 28 0.7 36 0.9 17 0.4 52 1.2 38 0.8 33 1.0 37 1.1 253 0.8 221 0.7
Source: Policy & Planning Unit, MOE

20
Table 14 Primary School Drop-Out Rate by Gender, Grade, District
Grade and
DISTRICT
TOTAL DROPOUT Belize Cayo Corozal Orange Walk Stann Creek Toledo
Sex 2007-08 2008-09 2007-08 2008-09 2007-08 2008-09 2007-08 2008-09 2007-08 2008-09 2007-08 2008-09 2007-08 2008-09
No. % No. % No. % No. % No. % No. % No. % No. % No. % No. % No. % No. % No. % No. %
Beginners 1 0.7 0 0.0 0 0.0 0 0.0 0 0.0 0 0.0 1 11.1 0 0.0 0 0.0 0 0.0 0 0.0 0 0.0 2 0.9 0 0.0
Male 1 1.2 0 0.0 0 0.0 0 0.0 0 0.0 0 0.0 1 16.7 0 0.0 0 0.0 0 0.0 0 0.0 0 0.0 2 1.5 0 0.0
Female 0 0.0 0 0.0 0 0.0 0 0.0 0 0.0 0 0.0 0 0.0 0 0.0 0 0.0 0 0.0 0 0.0 0 0.0 0 0.0 0 0.0
Infant 1 3 0.1 1 0.0 19 0.8 10 0.4 2 0.2 2 0.2 2 0.2 1 0.1 8 0.6 1 0.1 0 0.0 0 0.0 34 0.4 15 0.2
Male 3 0.2 1 0.1 13 1.1 6 0.5 0 0.0 1 0.2 0 0.0 0 0.0 2 0.3 1 0.2 0 0.0 0 0.0 18 0.4 9 0.2
Female 0 0.0 0 0.0 6 0.5 4 0.4 2 0.4 1 0.2 2 0.4 1 0.2 6 1.0 0 0.0 0 0.0 0 0.0 16 0.4 6 0.1
Infant 2 3 0.1 7 0.3 12 0.5 11 0.5 0 0.0 1 0.1 1 0.1 1 0.1 9 0.7 0 0.0 0 0.0 2 0.2 25 0.3 22 0.3
Male 1 0.1 4 0.3 7 0.6 6 0.5 0 0.0 1 0.2 0 0.0 1 0.2 4 0.6 0 0.0 0 0.0 1 0.2 12 0.3 13 0.3
Female 2 0.2 3 0.3 5 0.4 5 0.5 0 0.0 0 0.0 1 0.2 0 0.0 5 0.8 0 0.0 0 0.0 1 0.2 13 0.3 9 0.2
Standard 1 1 0.0 5 0.2 12 0.5 10 0.4 2 0.2 2 0.2 1 0.1 6 0.5 11 0.9 1 0.1 0 0.0 2 0.2 27 0.3 26 0.3
Male 1 0.1 3 0.2 8 0.7 6 0.5 1 0.2 1 0.2 0 0.0 4 0.7 3 0.5 1 0.2 0 0.0 2 0.4 13 0.3 17 0.4
Female 0 0.0 2 0.2 4 0.4 4 0.3 1 0.2 1 0.2 1 0.2 2 0.3 8 1.3 0 0.0 0 0.0 0 0.0 14 0.3 9 0.2
Standard 2 1 0.0 7 0.3 10 0.5 8 0.4 3 0.3 1 0.1 6 0.5 6 0.5 9 0.7 3 0.2 3 0.4 5 0.6 32 0.4 30 0.3
Male 1 0.1 5 0.4 8 0.7 6 0.5 3 0.6 0 0.0 2 0.3 5 0.9 5 0.8 2 0.3 3 0.8 2 0.5 22 0.5 20 0.4
Female 0 0.0 2 0.2 2 0.2 2 0.2 0 0.0 1 0.2 4 0.8 1 0.2 4 0.7 1 0.2 0 0.0 3 0.7 10 0.2 10 0.2
Standard 3 4 0.2 8 0.4 18 0.9 26 1.2 6 0.6 4 0.4 9 0.8 2 0.2 17 1.5 8 0.7 3 0.4 5 0.6 57 0.7 53 0.6
Male 3 0.3 5 0.4 14 1.4 14 1.3 6 1.3 4 0.8 6 1.1 1 0.2 12 2.0 5 0.8 0 0.0 1 0.3 41 1.0 30 0.7
Female 1 0.1 3 0.3 4 0.4 12 1.2 0 0.0 0 0.0 3 0.6 1 0.2 5 0.9 3 0.5 3 0.7 4 0.9 16 0.4 23 0.6
Standard 4 13 0.6 9 0.4 36 2.0 28 1.4 11 1.2 20 2.2 14 1.4 7 0.7 16 1.5 20 1.8 14 1.9 14 1.9 104 1.4 98 1.2
Male 8 0.8 6 0.6 22 2.4 15 1.5 3 0.7 15 3.4 9 1.7 4 0.8 13 2.3 13 2.2 9 2.5 7 1.9 64 1.7 60 1.5
Female 5 0.5 3 0.3 14 1.5 13 1.3 8 1.8 5 1.1 5 1.1 3 0.6 3 0.6 7 1.3 5 1.4 7 2.0 40 1.1 38 1.0
Standard 5 14 0.6 24 1.2 40 2.2 49 2.7 18 2.1 15 1.7 18 1.9 27 2.9 28 3.0 34 3.3 18 2.5 15 2.3 136 1.8 164 2.2
Male 5 0.5 15 1.5 24 2.8 23 2.6 9 2.1 10 2.3 10 2.0 20 4.0 16 3.6 19 3.5 9 2.4 5 1.6 73 2.0 92 2.5
Female 9 0.8 9 0.9 16 1.7 26 2.8 9 2.0 5 1.1 8 1.8 7 1.7 12 2.5 15 3.0 9 2.7 10 3.0 63 1.7 72 2.0
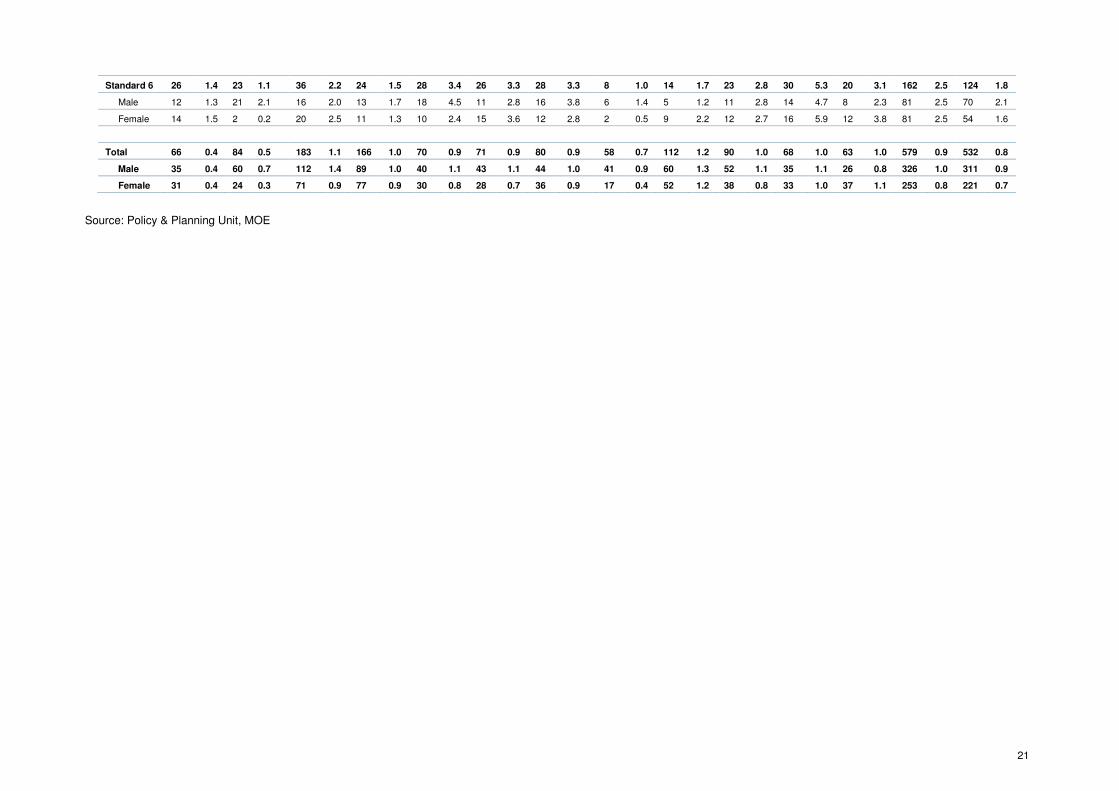
21
Standard 6 26 1.4 23 1.1 36 2.2 24 1.5 28 3.4 26 3.3 28 3.3 8 1.0 14 1.7 23 2.8 30 5.3 20 3.1 162 2.5 124 1.8
Male 12 1.3 21 2.1 16 2.0 13 1.7 18 4.5 11 2.8 16 3.8 6 1.4 5 1.2 11 2.8 14 4.7 8 2.3 81 2.5 70 2.1
Female 14 1.5 2 0.2 20 2.5 11 1.3 10 2.4 15 3.6 12 2.8 2 0.5 9 2.2 12 2.7 16 5.9 12 3.8 81 2.5 54 1.6
Total 66 0.4 84 0.5 183 1.1 166 1.0 70 0.9 71 0.9 80 0.9 58 0.7 112 1.2 90 1.0 68 1.0 63 1.0 579 0.9 532 0.8
Male 35 0.4 60 0.7 112 1.4 89 1.0 40 1.1 43 1.1 44 1.0 41 0.9 60 1.3 52 1.1 35 1.1 26 0.8 326 1.0 311 0.9
Female 31 0.4 24 0.3 71 0.9 77 0.9 30 0.8 28 0.7 36 0.9 17 0.4 52 1.2 38 0.8 33 1.0 37 1.1 253 0.8 221 0.7
Source: Policy & Planning Unit, MOE

22
Table 15 Transition Rate to Secondary School (2009/2010)
STANDARD 6 NEW
ENTRANTS TRANSITION
RATE
District and
Sex
Enrolment Repeaters Dropouts Graduates Form 1 & Prep
2007-08
2008-
09 2007-
08 2008-
09 200
7-08 200
8-09 2007-
08 2008-
09 2008-
09 2009-
10 2008-
09 2009-10
Belize 1,843 2,031 5 14 26 23 1,812 1,994 1,724 1,940 95.1% 97.3%
Male 927 1,018 3 14 12 21 912 983 841 950 92.2% 96.6%
Female 916 1,013 2 0 14 2 900 1,011 883 990 98.1% 97.9%
Cayo 1,608 1,617 10 16 36 24 1,562 1,577 1,325 1,361 84.8% 86.3%
Male 798 748 7 10 16 13 775 725 645 636 83.2% 87.7%
Female 810 869 3 6 20 11 787 852 680 725 86.4% 85.1%
Corozal 823 797 14 1 28 26 781 770 582 594 74.5% 77.1%
Male 401 386 7 0 18 11 376 375 293 291 77.9% 77.6%
Female 422 411 7 1 10 15 405 395 289 303 71.4% 76.7%
Orange Walk 851 839 13 14 28 8 810 817 576 611 71.1% 74.8%
Male 425 429 7 9 16 6 402 414 294 315 73.1% 76.1%
Female 426 410 6 5 12 2 408 403 282 296 69.1% 73.4%
Stann Creek 825 831 25 3 14 23 786 805 628 740 79.9% 91.9%
Male 413 390 11 2 5 11 397 377 298 348 75.1% 92.3%
Female 412 441 14 1 9 12 389 428 330 392 84.8% 91.6%
Toledo 571 655 16 14 30 20 525 621 481 625 91.6% 100.6%
Male 307 341 9 3 14 8 284 330 258 349 90.8% 105.8%
Female 264 314 7 11 16 12 241 291 223 276 92.5% 94.8%
Total 6,521 6,770 83 62 162 124 6,276 6,584 5,316 5,871 84.7% 89.2%
Male 3,271 3,312 44 38 81 70 3,146 3,204 2,629 2,889 83.6% 90.2%
Female 3,250 3,458 39 24 81 54 3,130 3,380 2,687 2,982 85.8% 88.2%
Source: Policy & Planning Unit, MOE

23
Table 16 Primary Teachers by Management, Sex and District
DISTRICT TOTAL
Management
and Sex
Belize Cayo Corozal Orange Walk
Stann Creek Toledo
2008-09
2009-10
2008-09
2009-10
2008-09
2009-10
2008-09
2009-10
2008-09
2009-10
2008-09
2009-10
2008-09
2009-10
Government 48 51 154 160 41 40 138 143 83 90 37 37 501 521
Male 8 5 48 46 10 12 45 49 19 22 16 16 146 150
Female 40 46 106 114 31 28 93 94 64 68 21 21 355 371
Roman Catholic 267 266 338 337 187 184 163 165 178 179 220 210 1,353 1,341
Male 46 43 100 108 72 69 56 52 43 43 112 109 429 424
Female 221 223 238 229 115 115 107 113 135 136 108 101 924 917
Anglican 134 142 29 34 9 9 16 18 32 31 6 5 226 239
Male 22 21 4 5 0 0 2 2 7 7 2 2 37 37
Female 112 121 25 29 9 9 14 16 25 24 4 3 189 202
Methodist 98 97 0 0 22 25 0 0 32 32 19 20 171 174
Male 10 11 0 0 6 6 0 0 7 7 5 5 28 29
Female 88 86 0 0 16 19 0 0 25 25 14 15 143 145
SDA 38 39 35 44 39 41 9 10 15 15 6 6 142 155
Male 7 4 7 12 9 9 3 3 4 2 2 3 32 33
Female 31 35 28 32 30 32 6 7 11 13 4 3 110 122
Nazarene 8 9 61 64 13 13 0 0 0 0 0 0 82 86
Male 1 1 17 20 4 4 0 0 0 0 0 0 22 25
Female 7 8 44 44 9 9 0 0 0 0 0 0 60 61
Assemblies
of God 10 9 8 8 4 4 0 0 23 28 0 0 45 49
Male 2 1 4 4 1 2 0 0 9 8 0 0 16 15
Female 8 8 4 4 3 2 0 0 14 20 0 0 29 34
Private 88 96 12 10 0 0 16 16 6 6 14 12 136 140
Male 11 11 4 3 0 0 2 3 0 0 5 3 22 20
Female 77 85 8 7 0 0 14 13 6 6 9 9 114 120
Other 143 149 60 59 22 27 46 45 14 20 7 8 292 308
Male 30 26 24 26 9 9 15 19 3 4 3 5 84 89
Female 113 123 36 33 13 18 31 26 11 16 4 3 208 219
Total 834 858 697 716 337 343 388 397 383 401 309 298 2,948 3,013
Male 137 123 208 224 111 111 123 128 92 93 145 143 816 822
Female 697 735 489 492 226 232 265 269 291 308 164 155 2,132 2,191
Source: Policy & Planning Unit, MOE
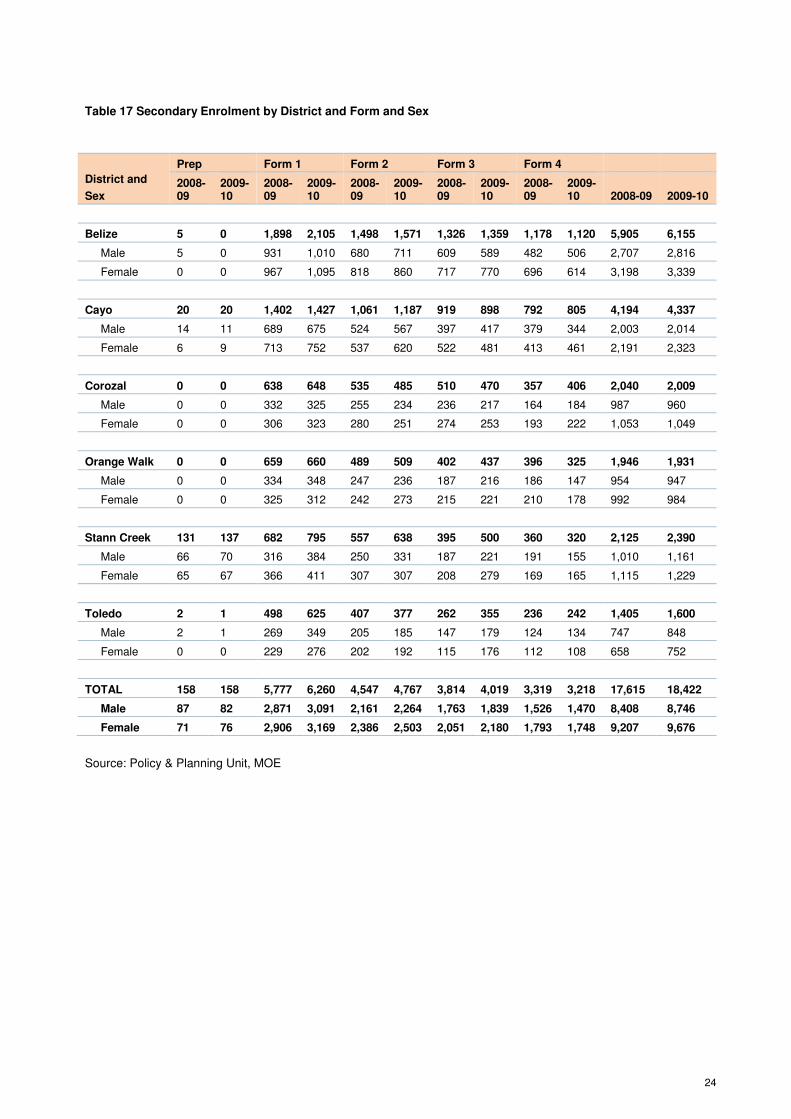
24
Table 17 Secondary Enrolment by District and Form and Sex
Source: Policy & Planning Unit, MOE
District and
Sex
Prep Form 1 Form 2 Form 3 Form 4
2008-09
2009-10
2008-09
2009-10
2008-09
2009-10
2008-09
2009-10
2008-09
2009-10 2008-09 2009-10
Belize 5 0 1,898 2,105 1,498 1,571 1,326 1,359 1,178 1,120 5,905 6,155
Male 5 0 931 1,010 680 711 609 589 482 506 2,707 2,816
Female 0 0 967 1,095 818 860 717 770 696 614 3,198 3,339
Cayo 20 20 1,402 1,427 1,061 1,187 919 898 792 805 4,194 4,337
Male 14 11 689 675 524 567 397 417 379 344 2,003 2,014
Female 6 9 713 752 537 620 522 481 413 461 2,191 2,323
Corozal 0 0 638 648 535 485 510 470 357 406 2,040 2,009
Male 0 0 332 325 255 234 236 217 164 184 987 960
Female 0 0 306 323 280 251 274 253 193 222 1,053 1,049
Orange Walk 0 0 659 660 489 509 402 437 396 325 1,946 1,931
Male 0 0 334 348 247 236 187 216 186 147 954 947
Female 0 0 325 312 242 273 215 221 210 178 992 984
Stann Creek 131 137 682 795 557 638 395 500 360 320 2,125 2,390
Male 66 70 316 384 250 331 187 221 191 155 1,010 1,161
Female 65 67 366 411 307 307 208 279 169 165 1,115 1,229
Toledo 2 1 498 625 407 377 262 355 236 242 1,405 1,600
Male 2 1 269 349 205 185 147 179 124 134 747 848
Female 0 0 229 276 202 192 115 176 112 108 658 752
TOTAL 158 158 5,777 6,260 4,547 4,767 3,814 4,019 3,319 3,218 17,615 18,422
Male 87 82 2,871 3,091 2,161 2,264 1,763 1,839 1,526 1,470 8,408 8,746
Female 71 76 2,906 3,169 2,386 2,503 2,051 2,180 1,793 1,748 9,207 9,676

25
Table 18 Secondary School Repetition Rate by Gender, Grade and District
District
PERCENT REPEAT Belize Cayo Corozal Orange Walk Stann Creek Toledo
2007-08 2008-09 2007-08 2008-09 2007-08 2008-09 2007-08 2008-09 2007-08 2008-09 2007-08 2008-09 2007-08 2008-09
No. % No. % No. % No. % No. % No. % No. % No. % No. % No. % No. % No. % No. % No. %
Prep 0 0.0 0 0.0 1 5.6 0 0.0 0 0.0 0 0.0 0 0.0 0 0.0 3 2.5 17 13.0 0 0.0 0 0.0 4 2.7 17 10.8
Male 0 0.0 0 0.0 0 0.0 0 0.0 0 0.0 0 0.0 0 0.0 0 0.0 0 0.0 11 16.7 0 0.0 0 0.0 0 0.0 11 12.6
Female 0 0.0 0 0.0 1 7.7 0 0.0 0 0.0 0 0.0 0 0.0 0 0.0 3 4.7 6 9.2 0 0.0 0 0.0 4 5.0 6 8.5
Form 1 165 9.2 213 11.2 100 7.7 109 7.8 60 9.3 69 10.8 81 13.3 89 13.5 73 10.4 72 10.6 24 5.0 63 12.7 503 9.1 615 10.6
Male 87 10.1 110 11.8 62 9.0 63 9.1 40 12.2 39 11.7 38 12.4 50 15.0 41 12.0 44 13.9 17 6.9 45 16.7 285 10.3 351 12.2
Female 78 8.4 103 10.7 38 6.2 46 6.5 20 6.3 30 9.8 43 14.2 39 12.0 32 8.9 28 7.7 7 2.9 18 7.9 218 7.9 264 9.1
Form 2 102 7.0 120 8.0 94 9.2 123 11.6 52 9.7 58 10.8 50 10.3 56 11.5 28 6.7 55 9.9 22 6.8 21 5.2 348 8.2 433 9.5
Male 50 7.5 59 8.7 51 11.2 66 12.6 29 12.1 35 13.7 36 14.6 26 10.5 16 7.9 35 14.0 12 6.5 12 5.9 194 9.7 233 10.8
Female 52 6.5 61 7.5 43 7.6 57 10.6 23 7.7 23 8.2 14 5.9 30 12.4 12 5.6 20 6.5 10 7.3 9 4.5 154 6.9 200 8.4
Form 3 102 7.4 125 9.4 94 10.3 73 7.9 48 10.9 56 11.0 37 8.3 68 16.9 44 10.3 30 7.6 8 2.9 11 4.2 333 8.5 363 9.5
Male 60 9.9 64 10.5 46 10.6 26 6.5 23 11.2 26 11.0 19 9.1 33 17.6 19 8.6 14 7.5 4 2.7 8 5.4 171 9.3 171 9.7
Female 42 5.4 61 8.5 48 9.9 47 9.0 25 10.6 30 10.9 18 7.6 35 16.3 25 12.2 16 7.7 4 3.1 3 2.6 162 7.8 192 9.4
Form 4 39 3.5 40 3.4 40 5.4 46 5.8 15 3.4 15 4.2 11 2.9 24 6.1 23 6.1 18 5.0 6 2.3 7 3.0 134 4.1 150 4.5
Male 12 2.7 15 3.1 26 7.7 23 6.1 11 5.3 7 4.3 9 5.1 10 5.4 17 9.0 12 6.3 2 1.5 6 4.8 77 5.2 73 4.8
Female 27 4.2 25 3.6 14 3.5 23 5.6 4 1.7 8 4.1 2 1.0 14 6.7 6 3.2 6 3.6 4 3.1 1 0.9 57 3.2 77 4.3
Total 408 7.1 498 8.4 329 8.3 351 8.4 175 8.5 198 9.7 179 9.3 237 12.2 171 8.4 192 9.0 60 4.4 102 7.3 1,322 7.7 1578 9.0
Male 209 8.1 248 9.2 185 9.7 178 8.9 103 10.4 107 10.8 102 10.9 119 12.5 93 9.2 116 11.5 35 4.9 71 9.5 727 8.9 839 10.0
Female 199 6.3 250 7.8 144 7.0 173 7.9 72 6.6 91 8.6 77 7.9 118 11.9 78 7.6 76 6.8 25 3.9 31 4.7 595 6.7 739 8.0
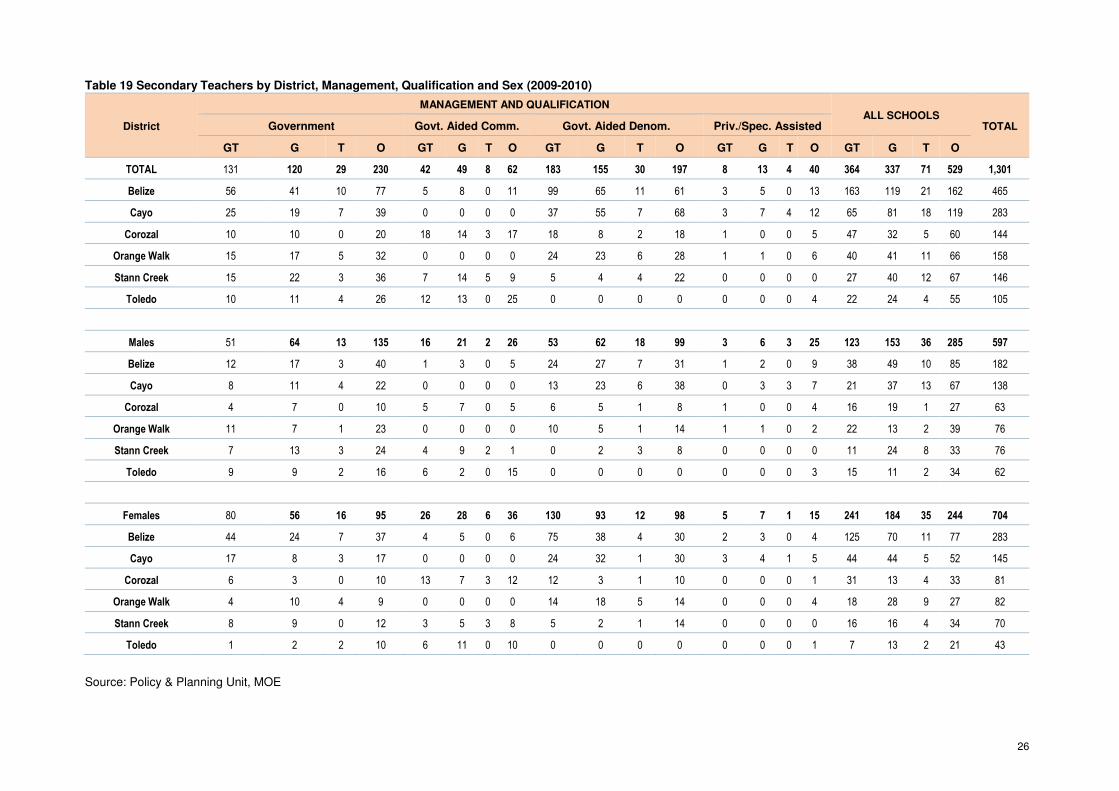
26
Table 19 Secondary Teachers by District, Management, Qualification and Sex (2009-2010)
District
MANAGEMENT AND QUALIFICATION ALL SCHOOLS
TOTAL Government Govt. Aided Comm. Govt. Aided Denom. Priv./Spec. Assisted
GT G T O GT G T O GT G T O GT G T O GT G T O
TOTAL 131 120 29 230 42 49 8 62 183 155 30 197 8 13 4 40 364 337 71 529 1,301
Belize 56 41 10 77 5 8 0 11 99 65 11 61 3 5 0 13 163 119 21 162 465
Cayo 25 19 7 39 0 0 0 0 37 55 7 68 3 7 4 12 65 81 18 119 283
Corozal 10 10 0 20 18 14 3 17 18 8 2 18 1 0 0 5 47 32 5 60 144
Orange Walk 15 17 5 32 0 0 0 0 24 23 6 28 1 1 0 6 40 41 11 66 158
Stann Creek 15 22 3 36 7 14 5 9 5 4 4 22 0 0 0 0 27 40 12 67 146
Toledo 10 11 4 26 12 13 0 25 0 0 0 0 0 0 0 4 22 24 4 55 105
Males 51 64 13 135 16 21 2 26 53 62 18 99 3 6 3 25 123 153 36 285 597
Belize 12 17 3 40 1 3 0 5 24 27 7 31 1 2 0 9 38 49 10 85 182
Cayo 8 11 4 22 0 0 0 0 13 23 6 38 0 3 3 7 21 37 13 67 138
Corozal 4 7 0 10 5 7 0 5 6 5 1 8 1 0 0 4 16 19 1 27 63
Orange Walk 11 7 1 23 0 0 0 0 10 5 1 14 1 1 0 2 22 13 2 39 76
Stann Creek 7 13 3 24 4 9 2 1 0 2 3 8 0 0 0 0 11 24 8 33 76
Toledo 9 9 2 16 6 2 0 15 0 0 0 0 0 0 0 3 15 11 2 34 62
Females 80 56 16 95 26 28 6 36 130 93 12 98 5 7 1 15 241 184 35 244 704
Belize 44 24 7 37 4 5 0 6 75 38 4 30 2 3 0 4 125 70 11 77 283
Cayo 17 8 3 17 0 0 0 0 24 32 1 30 3 4 1 5 44 44 5 52 145
Corozal 6 3 0 10 13 7 3 12 12 3 1 10 0 0 0 1 31 13 4 33 81
Orange Walk 4 10 4 9 0 0 0 0 14 18 5 14 0 0 0 4 18 28 9 27 82
Stann Creek 8 9 0 12 3 5 3 8 5 2 1 14 0 0 0 0 16 16 4 34 70
Toledo 1 2 2 10 6 11 0 10 0 0 0 0 0 0 0 1 7 13 2 21 43
Source: Policy & Planning Unit, MOE

27
Table 20 Primary School Enrolment Trends (1994-1995 to 2009-2010)
Year TOTAL Annual %
GradeBEGIN. INF. 1 INF. 2 STD. 1 STD. 2 STD. 3 STD. 4 STD. 5 STD. 6 TOTAL Increase
1993-94 1,953 7,692 6,694 6,521 6,439 5,779 5,506 5,117 4,590 50,291 0.0
1994-95 1,899 7,895 6,965 6,611 6,370 6,061 5,622 5,190 4,764 51,377 2.2
1995-96 1,738 8,244 7,193 6,863 6,671 6,040 6,038 5,282 4,925 52,994 3.1
1996-97 1,366 8,035 7,336 7,126 6,775 6,388 5,837 5,385 4,862 53,110 0.2
1997-98 1,260 8,020 7,048 7,215 6,866 6,537 6,003 5,257 4,912 53,118 0.0
1998-99 1,074 8,494 7,336 7,277 7,065 6,620 6,314 5,534 4,902 54,616 2.8
1999-00 1,041 8,381 7,523 7,226 7,158 6,849 6,540 5,845 5,137 55,700 2.0
2000-01 929 8,444 7,605 7,485 7,220 6,815 6,696 6,077 5,111 56,382 1.2
2001-02 724 8,402 7,772 7,542 7,258 6,906 6,550 6,160 5,238 56,552 0.3
2002-03 563 8,877 8,138 7,987 7,705 7,427 7,053 6,454 5,726 59,930 6.0
2003-04 397 9,175 8,407 8,420 7,995 7,726 7,273 6,670 5,875 61,938 3.4
2004-05 548 9,474 8,449 8,295 8,258 7,719 7,504 7,092 5,943 63,282 2.2
2005-06 490 9,918 8,760 8,461 8,001 8,179 7,577 6,986 6,033 64,405 1.8
2006-07 549 9,644 8,986 8,588 8,344 7,826 7,839 7,246 6,298 65,320 1.4
2007-08 235 9,314 9,009 8,933 8,501 8,139 7,619 7,492 6,521 65,763 0.7
2008-09 328 9,106 8,658 9,110 8,804 8,376 7,998 7,336 6,770 66,486 1.1
2009-10 268 9,088 8,526 8,662 8,993 8,728 8,130 7,640 6,718 66,753 0.4

28
Table 21 Secondary School Enrolment Trends (1999-00 to 2009-10)
Year Form Total Annual %
Prep Form 1 Form 2 Form 3 Form 4 Enrolment Increase
2000-01 90 4,555 3,363 2,848 2,287 13,143 7.3
2001-02 74 4,689 3,713 3,026 2,297 13,799 5.0
2002-03 105 4,854 3,898 3,255 2,518 14,630 6.0
2003-04 86 4,984 4,052 3,569 2,668 15,359 5.0
2004-05 24 5,194 4,252 3,699 2,981 16,150 5.2
2005-06 112 5,104 4,415 3,842 3,223 16,696 3.4
2006-07 157 5,200 4,304 3,993 3,289 16,943 1.5
2007-08 150 5,522 4,245 3,896 3,294 17,107 1.0
2008-09 158 5,777 4,547 3,814 3,319 17,615 3.0
2009-10 158 6,260 4,767 4,019 3,218 18,422 4.6
Source: Policy & Planning Unit, MOE
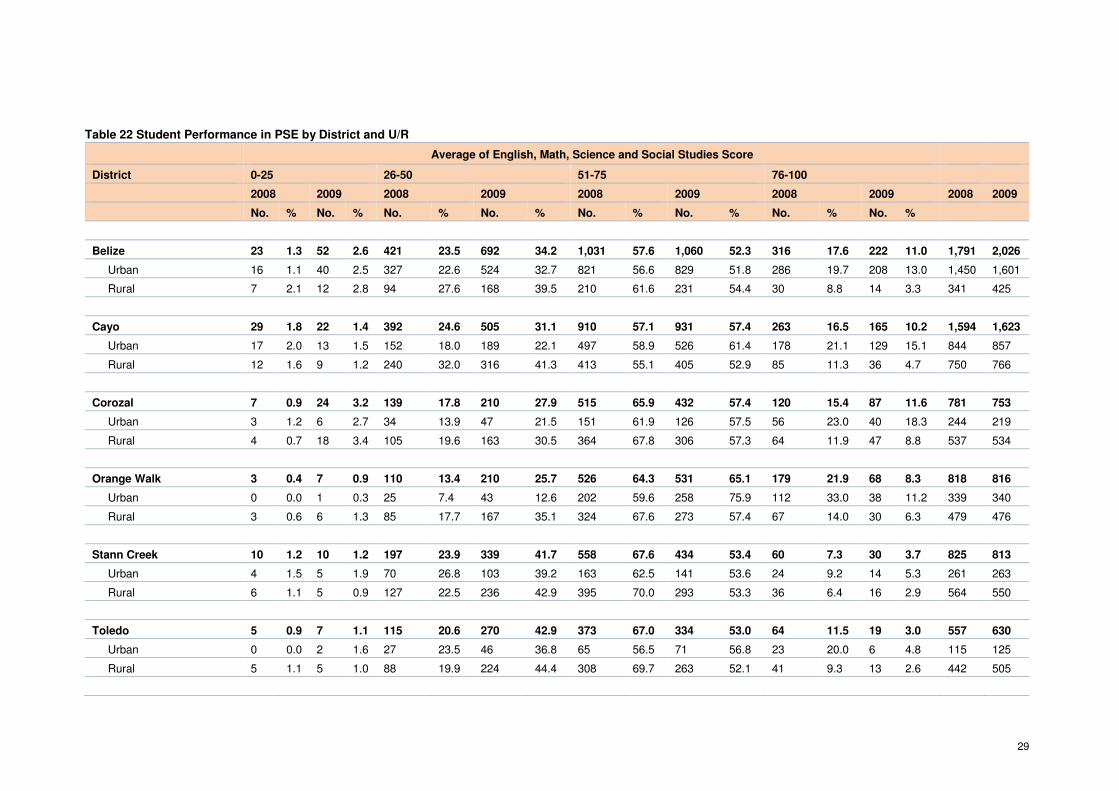
29
Table 22 Student Performance in PSE by District and U/R
Average of English, Math, Science and Social Studies Score
District 0-25 26-50 51-75 76-100
2008 2009 2008 2009 2008 2009 2008 2009 2008 2009
No. % No. % No. % No. % No. % No. % No. % No. %
Belize 23 1.3 52 2.6 421 23.5 692 34.2 1,031 57.6 1,060 52.3 316 17.6 222 11.0 1,791 2,026
Urban 16 1.1 40 2.5 327 22.6 524 32.7 821 56.6 829 51.8 286 19.7 208 13.0 1,450 1,601
Rural 7 2.1 12 2.8 94 27.6 168 39.5 210 61.6 231 54.4 30 8.8 14 3.3 341 425
Cayo 29 1.8 22 1.4 392 24.6 505 31.1 910 57.1 931 57.4 263 16.5 165 10.2 1,594 1,623
Urban 17 2.0 13 1.5 152 18.0 189 22.1 497 58.9 526 61.4 178 21.1 129 15.1 844 857
Rural 12 1.6 9 1.2 240 32.0 316 41.3 413 55.1 405 52.9 85 11.3 36 4.7 750 766
Corozal 7 0.9 24 3.2 139 17.8 210 27.9 515 65.9 432 57.4 120 15.4 87 11.6 781 753
Urban 3 1.2 6 2.7 34 13.9 47 21.5 151 61.9 126 57.5 56 23.0 40 18.3 244 219
Rural 4 0.7 18 3.4 105 19.6 163 30.5 364 67.8 306 57.3 64 11.9 47 8.8 537 534
Orange Walk 3 0.4 7 0.9 110 13.4 210 25.7 526 64.3 531 65.1 179 21.9 68 8.3 818 816
Urban 0 0.0 1 0.3 25 7.4 43 12.6 202 59.6 258 75.9 112 33.0 38 11.2 339 340
Rural 3 0.6 6 1.3 85 17.7 167 35.1 324 67.6 273 57.4 67 14.0 30 6.3 479 476
Stann Creek 10 1.2 10 1.2 197 23.9 339 41.7 558 67.6 434 53.4 60 7.3 30 3.7 825 813
Urban 4 1.5 5 1.9 70 26.8 103 39.2 163 62.5 141 53.6 24 9.2 14 5.3 261 263
Rural 6 1.1 5 0.9 127 22.5 236 42.9 395 70.0 293 53.3 36 6.4 16 2.9 564 550
Toledo 5 0.9 7 1.1 115 20.6 270 42.9 373 67.0 334 53.0 64 11.5 19 3.0 557 630
Urban 0 0.0 2 1.6 27 23.5 46 36.8 65 56.5 71 56.8 23 20.0 6 4.8 115 125
Rural 5 1.1 5 1.0 88 19.9 224 44.4 308 69.7 263 52.1 41 9.3 13 2.6 442 505

30
Total 77 1.2 122 1.8 1,374 21.6 2,226 33.4 3,913 61.5 3,722 55.9 1,002 15.7 591 8.9 6,366 6,661
Urban 40 1.2 67 2.0 635 19.5 952 28.0 1,899 58.4 1,951 57.3 679 20.9 435 12.8 3,253 3,405
Rural 37 1.2 55 1.7 739 23.7 1,274 39.1 2,014 64.7 1,771 54.4 323 10.4 156 4.8 3,113 3,256
Source: Policy & Planning Unit, MOE
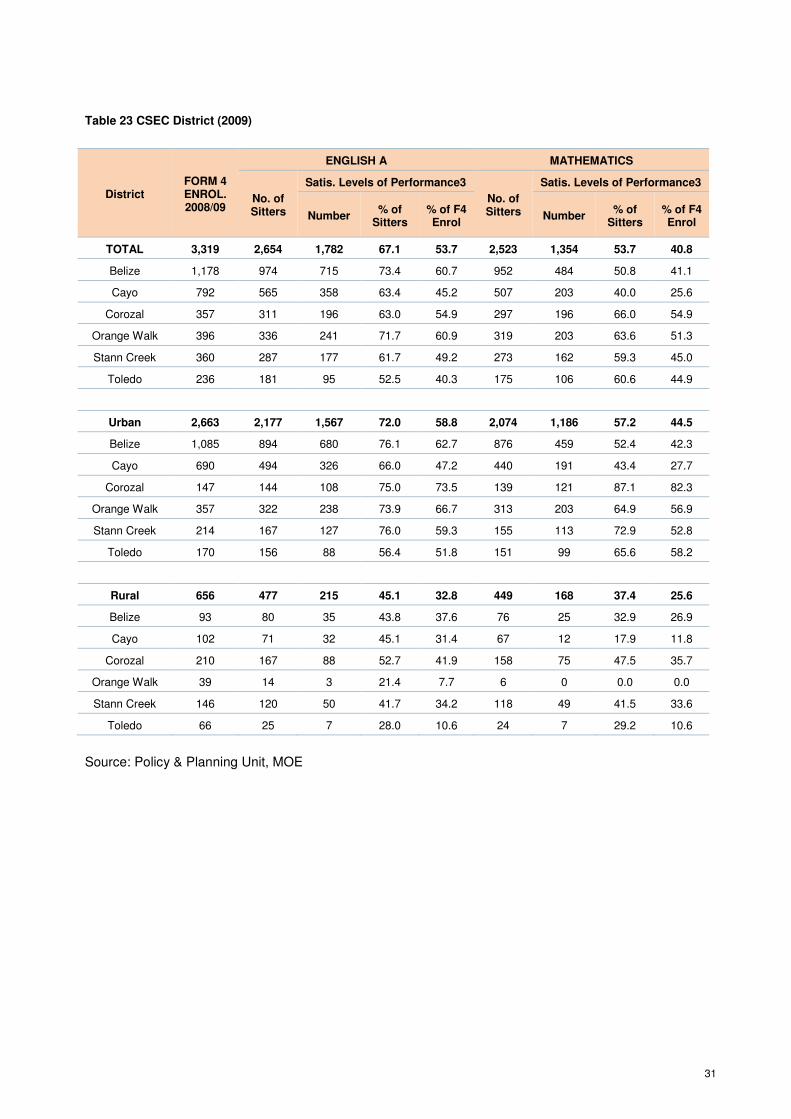
31
Table 23 CSEC District (2009)
Source: Policy & Planning Unit, MOE
District FORM 4 ENROL. 2008/09
ENGLISH A MATHEMATICS
No. of Sitters
Satis. Levels of Performance3
No. of Sitters
Satis. Levels of Performance3
Number % of
Sitters % of F4 Enrol
Number % of
Sitters % of F4 Enrol
TOTAL 3,319 2,654 1,782 67.1 53.7 2,523 1,354 53.7 40.8
Belize 1,178 974 715 73.4 60.7 952 484 50.8 41.1
Cayo 792 565 358 63.4 45.2 507 203 40.0 25.6
Corozal 357 311 196 63.0 54.9 297 196 66.0 54.9
Orange Walk 396 336 241 71.7 60.9 319 203 63.6 51.3
Stann Creek 360 287 177 61.7 49.2 273 162 59.3 45.0
Toledo 236 181 95 52.5 40.3 175 106 60.6 44.9
Urban 2,663 2,177 1,567 72.0 58.8 2,074 1,186 57.2 44.5
Belize 1,085 894 680 76.1 62.7 876 459 52.4 42.3
Cayo 690 494 326 66.0 47.2 440 191 43.4 27.7
Corozal 147 144 108 75.0 73.5 139 121 87.1 82.3
Orange Walk 357 322 238 73.9 66.7 313 203 64.9 56.9
Stann Creek 214 167 127 76.0 59.3 155 113 72.9 52.8
Toledo 170 156 88 56.4 51.8 151 99 65.6 58.2
Rural 656 477 215 45.1 32.8 449 168 37.4 25.6
Belize 93 80 35 43.8 37.6 76 25 32.9 26.9
Cayo 102 71 32 45.1 31.4 67 12 17.9 11.8
Corozal 210 167 88 52.7 41.9 158 75 47.5 35.7
Orange Walk 39 14 3 21.4 7.7 6 0 0.0 0.0
Stann Creek 146 120 50 41.7 34.2 118 49 41.5 33.6
Toledo 66 25 7 28.0 10.6 24 7 29.2 10.6
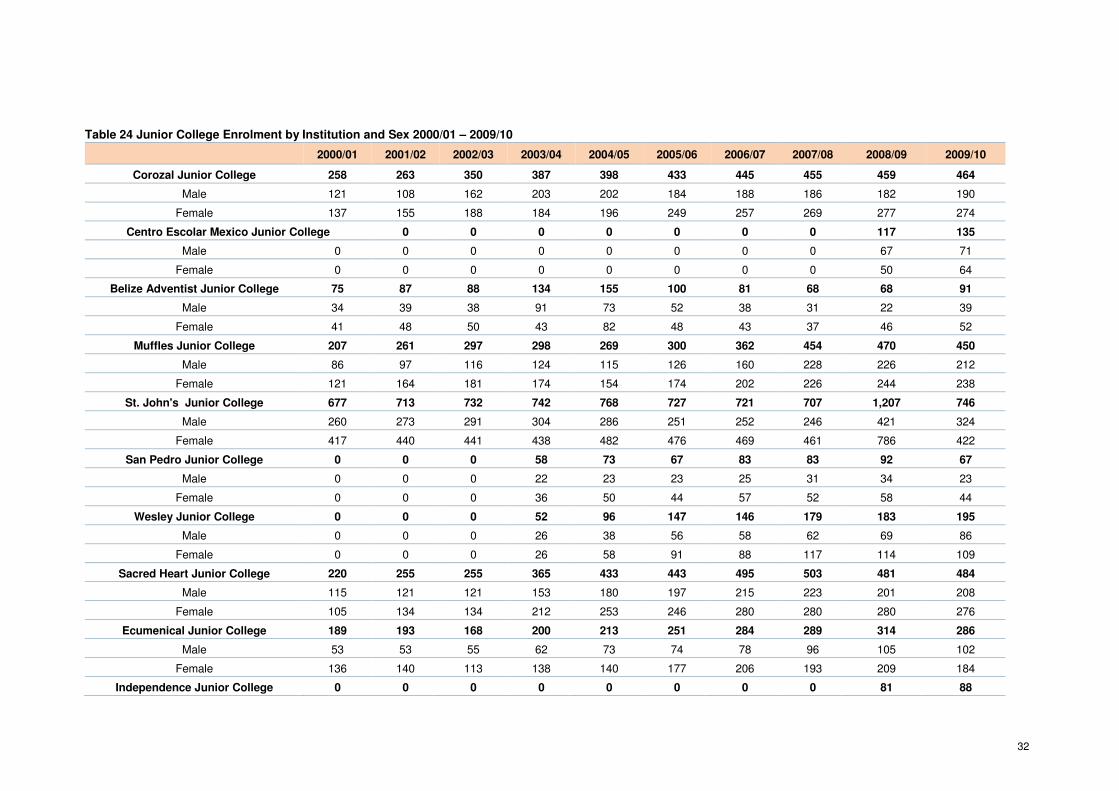
32
Table 24 Junior College Enrolment by Institution and Sex 2000/01 – 2009/10
2000/01 2001/02 2002/03 2003/04 2004/05 2005/06 2006/07 2007/08 2008/09 2009/10
Corozal Junior College 258 263 350 387 398 433 445 455 459 464
Male 121 108 162 203 202 184 188 186 182 190
Female 137 155 188 184 196 249 257 269 277 274
Centro Escolar Mexico Junior College 0 0 0 0 0 0 0 117 135
Male 0 0 0 0 0 0 0 0 67 71
Female 0 0 0 0 0 0 0 0 50 64
Belize Adventist Junior College 75 87 88 134 155 100 81 68 68 91
Male 34 39 38 91 73 52 38 31 22 39
Female 41 48 50 43 82 48 43 37 46 52
Muffles Junior College 207 261 297 298 269 300 362 454 470 450
Male 86 97 116 124 115 126 160 228 226 212
Female 121 164 181 174 154 174 202 226 244 238
St. John's Junior College 677 713 732 742 768 727 721 707 1,207 746
Male 260 273 291 304 286 251 252 246 421 324
Female 417 440 441 438 482 476 469 461 786 422
San Pedro Junior College 0 0 0 58 73 67 83 83 92 67
Male 0 0 0 22 23 23 25 31 34 23
Female 0 0 0 36 50 44 57 52 58 44
Wesley Junior College 0 0 0 52 96 147 146 179 183 195
Male 0 0 0 26 38 56 58 62 69 86
Female 0 0 0 26 58 91 88 117 114 109
Sacred Heart Junior College 220 255 255 365 433 443 495 503 481 484
Male 115 121 121 153 180 197 215 223 201 208
Female 105 134 134 212 253 246 280 280 280 276
Ecumenical Junior College 189 193 168 200 213 251 284 289 314 286
Male 53 53 55 62 73 74 78 96 105 102
Female 136 140 113 138 140 177 206 193 209 184
Independence Junior College 0 0 0 0 0 0 0 0 81 88

33
Male 0 0 0 0 0 0 0 0 55 49
Female 0 0 0 0 0 0 0 0 26 39
Total 1,626 1,772 1,890 2,236 2,405 2,468 2,617 2,738 3,472 3,006
Male 669 691 783 985 990 963 1,014 1,103 1,382 1,304
Female 957 1,081 1,107 1,251 1,415 1,505 1,602 1,635 2,090 1,702
Source: Policy & Planning Unit, MOE