Embed Size (px)
Citation preview
Improving business intelligence data quality in sales insight area
Ari Anturaniemi
Thesis
Master of Business Administration
Business Information Technology
24.9.2012
Tiivistelmä
24.9.2012
Tekijä tai tekijät Ari Anturaniemi
Ryhmätunnus tai aloitusvuosi 2011
Raportin nimi Improving business intelligence data quality in sales insight area, suom. Liiketoimintatiedon laadun parantaminen myynnin analytii-kan alueella
Sivu- ja lii-tesivumäärä 92+42
Opettajat tai ohjaajat Arvo Lipitsäinen, Haaga-Helia
Liiketoimintatiedon (eng. Business intelligence, BI) hallinta on organisaation kyky kerä-tä ja analysoida keräämäänsä tietoa liiketoiminnastaan ja liiketoimintaympäristöstään, ja luoda informaation ja sen analysoinnin kautta uutta tietämystä ja näkemystä organisaa-tion ohjaamiseksi. Yksi keskeisistä asioista liiketoiminta-analytiikan kehittämisessä ja tiedon käytössä on ymmärtää tiedon laadun merkitys ja sille asetettava tavoite, samoin kuin kuinka hyvin tiedon laatuvaatimukset täyttyvät eri käyttötapojen suhteen. Liiketoimintatiedon käyttö raportoinnin ja analytiikan tarpeisiin edellyttää eri tapahtu-mapohjaisten tietojen ja perus- sekä referenssitietojen mallintamista, hallinnointia ja yhdistämistä liiketoimintaa tukeviksi mittareiksi. Kun organisaation tavoitteet on liitetty osaksi mittaristoa, mittareiden avulla voidaan seurata liiketoiminnan operatiivista onnis-tumista ja organisaation kilpailukykyä ja -etua. Tiedon laatuvaatimustavoitteiden ja laatumittareiden suhde liiketoiminnan tulos- ja suorituskykymittareihin on läheinen, erityisesti niiden mittareiden osalta, jotka organi-saatio näkee avainmittareiksi. Tämä vaatii mittareiden taustalla olevien käsitteiden ja niiden määritelmien yhteismitallisuutta. Kun käsitteet ja niiden merkitys ovat nimen-omaisesti hyväksyttyjä, määriteltyjä ja sovittu otettavaksi yrityksen liiketoimintaympäris-tössä käyttöön, ensimmäinen askel yhteisen tietämyksen jakamisen tiellä on saavutettu yrityksen ontologian kautta. Tässä kuvailevassa tapaustutkimuksessa on esitetty kohdealueen eli liiketoimintatiedon tiedon laadun parantamiseen liittyviä tekijöitä erityisesti myynnin näkökulmasta. Esityk-sessä on kuvattu liiketoimintatiedon olemusta, ja kuinka se voidaan nähdä tiedon, in-formaation ja tietämyksen jakamisen kautta osana yrityksen strategista varallisuutta. Tietojoukkojen luokittelun, määrittämisen ja tietomallinnuksen avulla voidaan hallita käytössä olevia tietovarantoja. Tiedon laadun parantamisessa keskeisellä sijalla on käsi-teltävän tiedon semantiikka ja ontologia, ja panostamalla näiden asioiden huomioonot-tamiseen organisaatiot voivat hyvinkin yksinkertaisin keinoin parantaa tiedon laadun edellytyksiä ontologian kehittämisen keinoin.
Asiasanat Liiketoiminta, Tiedon laatu, Semantiikka, Ontologia, Tietomallinnus
Abstract 24.9.2012
Authors Ari Anturaniemi
Group or year of entry 2011
The title of thesis Improving business intelligence data quality in sales insight area
Number of pag-es and appen-dices 92+42
Supervisor(s) Arvo Lipitsäinen, Haaga-Helia
Business intelligence (BI) management is an ability of a business organization to gather and analyze systematically information about its business operations and the business environment it is having business in, and turn that information and analysis of the in-formation as knowledge and insight for the business organization. One of the key top-ics in the business intelligence development and usage situation is to understand what is the data quality level needed to create new knowledge and understand how well those quality targets are met. To be able to provide business intelligence for reporting and analytics purposes, differ-ent kind of transactional data along with master and reference data needs to be mod-eled, managed and aggregated as business metrics. When business organization is hav-ing targets for its execution, it can use the calculated and shared information and met-rics to enhance its operations and competitive advantage. Data quality targets and metrics have a close relationship to organizational perfor-mance and result indicators, especially those which are the most important for the or-ganization as key performance/result indicators. This requires clearly defined concepts and semantics to be in place behind performance and result indicators so the metrics can be understood semantically consistently as well. In the business environment when concepts are explicitly defined, shared and agreed inside an organization, the first ground work of having a common capability for knowledge sharing has been reached and when creating a common ontology for the company. In this descriptive case study research, theoretical framework for business intelligence data quality topics are covered by going through the semantics of business intelligence and how it is related to data, information and knowledge sharing as well as different data categories and modeling techniques. End result of this study is, that when improv-ing data quality for business intelligence, it is crucial to focus on information semantic and ontology and to improve overall organizational data quality and knowledge sharing culture. This can be achieved by taking actually very simple principles of ontology crea-tion in operational use.
Key words Business, Data Quality, Semantics, Ontology, Data modeling
1
Table of contents
Abbreviations............................................................................................................................. 4
1 Introduction .......................................................................................................................... 5
1.1 Research background .................................................................................................. 5
1.2 Research questions and purpose of the research .................................................... 5
1.3 Research strategy ......................................................................................................... 6
1.3.1 Motivation for the research study ................................................................. 6
1.3.2 Hypothesis and qualitative measurement variables .................................... 7
1.3.3 Source of evidence .......................................................................................... 8
1.4 Thesis project and it’s linkage to related capability development work and
program ................................................................................................................................. 9
1.5 Report structure ........................................................................................................... 9
2 Research strategy ................................................................................................................ 10
2.1 Case study approach as a research method ........................................................... 10
2.2 Theoretic-oriented case study research .................................................................. 11
2.3 Practice-oriented case study research ..................................................................... 12
2.4 Case study success criteria ........................................................................................ 15
2.4.1 Construct validity ........................................................................................... 16
2.4.2 Internal validity .............................................................................................. 16
2.4.3 External validity ............................................................................................. 17
2.4.4 Reliability ........................................................................................................ 17
3 Theoretical framework ...................................................................................................... 17
3.1 Business intelligence ................................................................................................. 17
3.2 Leading and lagging indicators ................................................................................ 18
3.3 Data categories .......................................................................................................... 19
3.3.1 Definition of data .......................................................................................... 19
3.3.2 Master data ..................................................................................................... 20
3.3.3 Transactional data .......................................................................................... 21
3.3.4 Metadata – data about data .......................................................................... 22
3.4 Information modeling methodologies and approaches ....................................... 24
3.4.1 Modeling techniques and notations ............................................................ 24
3.4.2 Conceptual data modeling ............................................................................ 26
2
3.4.3 Logical data modeling ................................................................................... 28
3.4.4 Physical data modeling .................................................................................. 29
3.4.5 Data granularity ............................................................................................. 30
3.4.6 Dimensional data modeling ......................................................................... 31
3.4.7 Business intelligence and master data modeling complexity ................... 32
3.4.8 Linking concepts, information and knowledge together with ontology 35
3.5 Insight creation .......................................................................................................... 36
3.5.1 Knowledge creation ...................................................................................... 37
3.5.2 Reporting and insight differentiation .......................................................... 38
3.5.3 Reporting and analytics capability creation ................................................ 39
3.6 Data quality ................................................................................................................ 40
3.6.1 Definition of quality ...................................................................................... 41
3.6.2 Dimensions of data quality ........................................................................... 42
3.6.3 Data quality measurement, targets and linkage to business performance
indicators .................................................................................................................... 44
3.6.4 Statistical process control in data quality management ............................ 47
3.6.5 Data governance ............................................................................................ 48
3.7 Improving business intelligence data quality capabilities ..................................... 50
3.8 Supporting business intelligence creation with semantic business information
modeling and ontologies ................................................................................................... 51
3.9 Summary of theoretical framework ........................................................................ 52
4 Results and findings ........................................................................................................... 56
4.1 How better data semantics and ontology can improve business intelligence data
quality? ................................................................................................................................. 56
4.1.1 Role of conceptual data modeling in creating better data semantics and
ontology ...................................................................................................................... 59
4.1.2 Analysis of difficulties to agree semantics and ontology in practice ...... 60
4.2 Data quality linkage to KPI structures and dimensional modeling .................... 61
4.3 Improving business intelligence data quality: organizational viewpoint ............ 63
5 Thesis work results discussion ......................................................................................... 64
5.1 Conclusion of case study success criteria ............................................................... 64
5.2 Personal evaluation of the value of research project ............................................ 65
5.3 Further research topics to be considered ............................................................... 65

3
Bibliography ............................................................................................................................. 67
6 Attachments ........................................................................................................................ 73
6.1 Attachment 1: Theoretical framework as RDF/OWL presentation .................. 73
6.2 Attachment 2: Data modeling methodology notation comparison by Scott
Ambler (Ambler 2006) ...................................................................................................... 92
6.3 Attachment 3 (confidential): Empirical part of case study .................................. 93
4
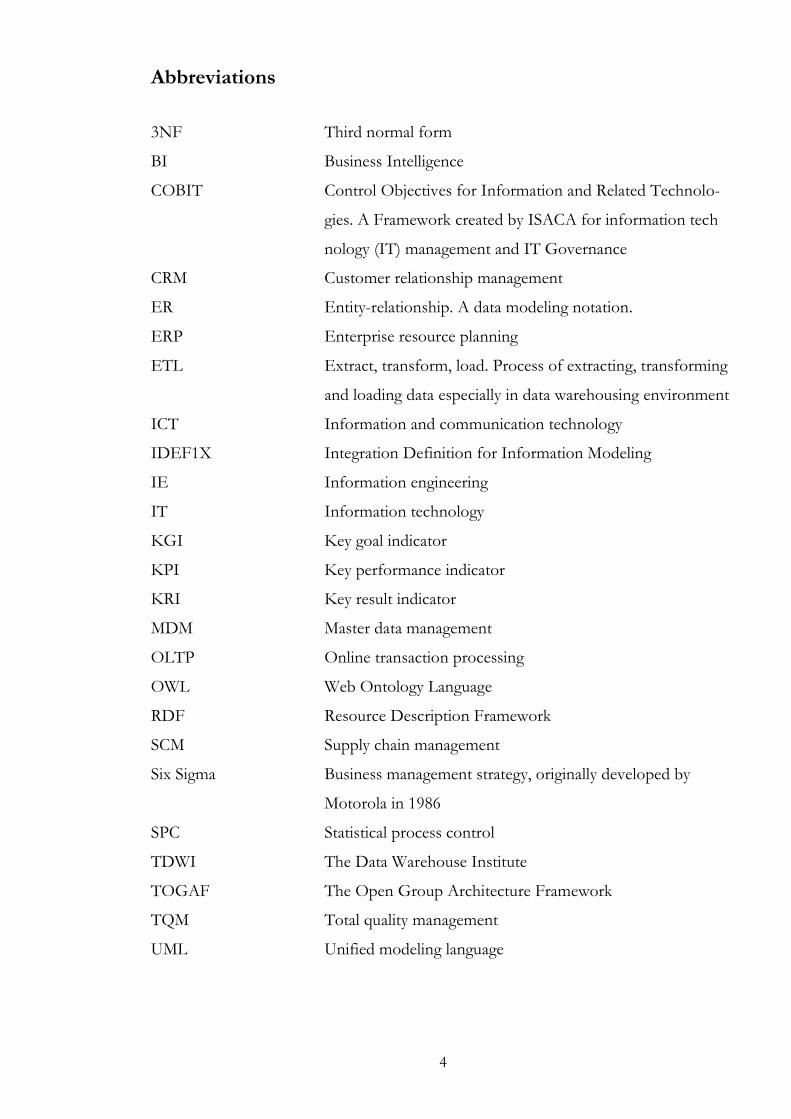
Abbreviations
3NF Third normal form
BI Business Intelligence
COBIT Control Objectives for Information and Related Technolo-
gies. A Framework created by ISACA for information tech
nology (IT) management and IT Governance
CRM Customer relationship management
ER Entity-relationship. A data modeling notation.
ERP Enterprise resource planning
ETL Extract, transform, load. Process of extracting, transforming
and loading data especially in data warehousing environment
ICT Information and communication technology
IDEF1X Integration Definition for Information Modeling
IE Information engineering
IT Information technology
KGI Key goal indicator
KPI Key performance indicator
KRI Key result indicator
MDM Master data management
OLTP Online transaction processing
OWL Web Ontology Language
RDF Resource Description Framework
SCM Supply chain management
Six Sigma Business management strategy, originally developed by
Motorola in 1986
SPC Statistical process control
TDWI The Data Warehouse Institute
TOGAF The Open Group Architecture Framework
TQM Total quality management
UML Unified modeling language
5
1 Introduction
1.1 Research background
Business intelligence (BI) is an ability of a business organization to gather and analyze
systematically information about its business operations and environment, and turn
that information into knowledge for the business organization decision making and
operational processes. Goal is to use information and analyze it to make better deci-
sions and achieve better results than the competitors. In analytically leading companies,
this can be achieved by basing the decisions on facts. Having right set of qualified data
turned into meaningful facts and dimensions around the facts is also the basis for
knowledge sharing and insight creation.
Amount of business data as well as raw performance level of the IT systems enabling
to crunch and manage masses of data has increased enormously in the past years. De-
spite of this, having a lot of data or technological computational power do not remove
the fact that data quality is becoming increasingly more and more important topic. If
the data gathered cannot be trusted, matched, linked or integrated with other data sets,
or if the meaning of the data cannot be ensured across the enterprise, reliability and
lack of trust in the data can become a major problem in the decision making process
and in every-day operational execution.
1.2 Research questions and purpose of the research
Different kind of things can influence in data quality, like IT systems, human, process
or cultural phenomenon in the area of data management. The focus of this thesis work
and research is to analyze and define how business semantics and ontologies influence
on data quality. Many times IT organizations are trying fiercely to solve data quality
problems as a technological issue, but if business rules, data definitions, taxonomies
and ontologies are missing, systematic approach for data quality corrections is difficult
or even impossible to accomplish.
6
The purpose of this case study research is to describe business intelligence data quality
topics and to explain those potential issues if information semantics are missing or they
are conflicting to each other.
The main research question was this:
How better data semantics and ontology can improve the data quality regarding
master data related quality issues?
Following sub-questions related to main research question were researched as well:
What is the role of conceptual data modeling to lead towards better data seman-
tics and ontology?
Why it is difficult to agree and to have common data definitions to be used
across an organization?
1.3 Research strategy
The research strategy was based on case study research using practice-oriented descrip-
tive approach. In practice-oriented case study work, research project phases consists of
searching literature of the subject area as well as using existing information available
and having discussions and interviews with the practitioners who deal with the topic in
an organization to identify the problems and prioritization of the research topics (Dul
& Hak 2008, 33-34). Because the researcher was already having a joint effort with spe-
cific business and IT capability development programs and projects during the research
working time, practice-oriented case study approach was a natural choice for research
method.
1.3.1 Motivation for the research study
Sales information of the products and services (service can be seen as a product itself)
and their success is ultimately in everybody’s interest in any company. Without having
good profitable revenue growth companies cannot succeed or even exist. Therefore
sales business data and data around the sales is foundational data for any business or-
ganization to manage and analyze. Insight creation about the sales, or insight creation
7
for the sales organization cannot reduce its’ focus only to sales data. It is necessary to
understand other influence factors affecting to sales success as well as to understand if
the data available is having good enough quality to make it trustworthy for business
decision making and operational usage.
1.3.2 Hypothesis and qualitative measurement variables
The hypothesis for the case study and reasoning for the knowledge creation work of
this case study was that especially in large global companies having multiple data sys-
tems and data management processes, master data quality problems arise. One of the
reasons for this is that people are having different meanings and semantics for the
same data. When e.g. customer or product concept and their definitions are not clear,
different organization units within the same organization manage and understand con-
cepts in a different way, leading in controversial and ambiguous implementation of
data management processes and IT systems.
One of the research work goals was to analyze this hypothesis in the light of real busi-
ness data. The subject area of master data was chosen for this purpose and especially
regarding customer and product data. Research, analysis and recommendations how
well they are handled in the organization was accomplished. Lot of data quality investi-
gations and analysis were done during the development project adjacent to this study.
Since many data quality analysis had been done already during the past years, there was
no lack of data quality assessment materials to study and to analyze.
Regarding the research question of “How better data semantics and ontology can im-
prove the data quality regarding master data related quality issues”, real life data quality
use cases were selected for the hypothesis testing using following variables:
Variable 1a: How customer data definition variations affect to sales insight crea-
tion when having different understanding of customer data definitions?
Variable 1b: What are the implications of the variations to the business analytics
having different kind of customer semantics and hierarchies there?
Variable 2a: How product data definition variations affect to sales insight crea-
tion when having different understanding of product data definitions?
8
Variable 2b: What are the implications of the variations to the business analytics
having different kind of product semantics and hierarchies there?
1.3.3 Source of evidence
Major source for this research evidence was based on already available documentation
in the subject organization, some of them being with systematically gathered data by
the researcher himself during the past years. Supporting materials for the study was
gathered by using document archives, and having interviews with different data man-
agement teams and email discussions to gather current state information. When exam-
ining current state and data in the data warehouse and master data environment, real
life use cases and existing semantic data models was used for quantitative and qualita-
tive analysis. Observations done by the researcher and also by various other customer
and product data management persons working in the company were accomplished.
Based on these data sources, a case study database was created for the study work.
This study included an exploration phase to define the problem area as precisely as
possible by creating theoretical framework for the subject area and visiting and analyz-
ing real data found in the places like data warehouses and other operational databases.
Theoretical framework was created by examining existing bibliography of books, arti-
cles and other related studies available, and by making observations of data and using
case specific documentation of data quality issues. These observations together with
the theoretical framework defined also the needs for knowledge creation and prioritiza-
tion of research topic phases in an iterative way.
After this phase, descriptive case study materials were analyzed, and the findings doc-
umented in a separate classified appendix. Based on the analysis, conclusions and
propositions were made for the corrective actions. Some supporting interviews were
held to cross-check the validity of the past data quality findings and to reflect what are
their influence to business intelligence creation today.
9
1.4 Thesis project and it’s linkage to related capability development work and
program
The baseline for semantic comparison between existing experiments and observation
of data quality was created in a separate task to support also business analytics capabil-
ity development program. Renewal of conceptual master data model was also created
as a sub-project, and research studies were done on the area of developing sales insight
reporting and linkage between the conceptual data model and analytics capability crea-
tion activities.
One of the key things was to analyze different angles of the current state, circumstanc-
es of current organizational behavior and beliefs regarding data quality and its state,
and to analyze the need for a change of improvement perspective for sales insight.
Therefore as part of the development project work companywide, enterprise business
information data model was created to be used also as a baseline for as-is data quality
gap analyzes.
1.5 Report structure
This report is divided in two parts: publicly available part and confidential part. Case
study strategy and approach is explained in details chapter 2. In the chapter 3 theoretic
framework of business intelligence, data quality, data modeling principles and the link-
age between them how to construct business intelligence, knowledge and insight
through those frameworks are explained. Theoretical framework was used to construct
the empiric part of the case study and also for proposition creation how to improve
those data quality issues found during the research work from the semantics perspec-
tive. The empiric part of study is created as a separate appendix and it is company con-
fidential information. Generalizable outcomes and findings of this empiric analysis are
described in chapter 4 of this document, and overall result discussion and further sug-
gestions for future research topics in chapter 5.
10
2 Research strategy
2.1 Case study approach as a research method
Typical characteristics for a case study research approach is that it is an empirical in-
quiry to investigate contemporary phenomenon in depth and within its real-life con-
text, especially when the boundaries between phenomenon and the context they are
happening is not clear (Yin 2009, 18).
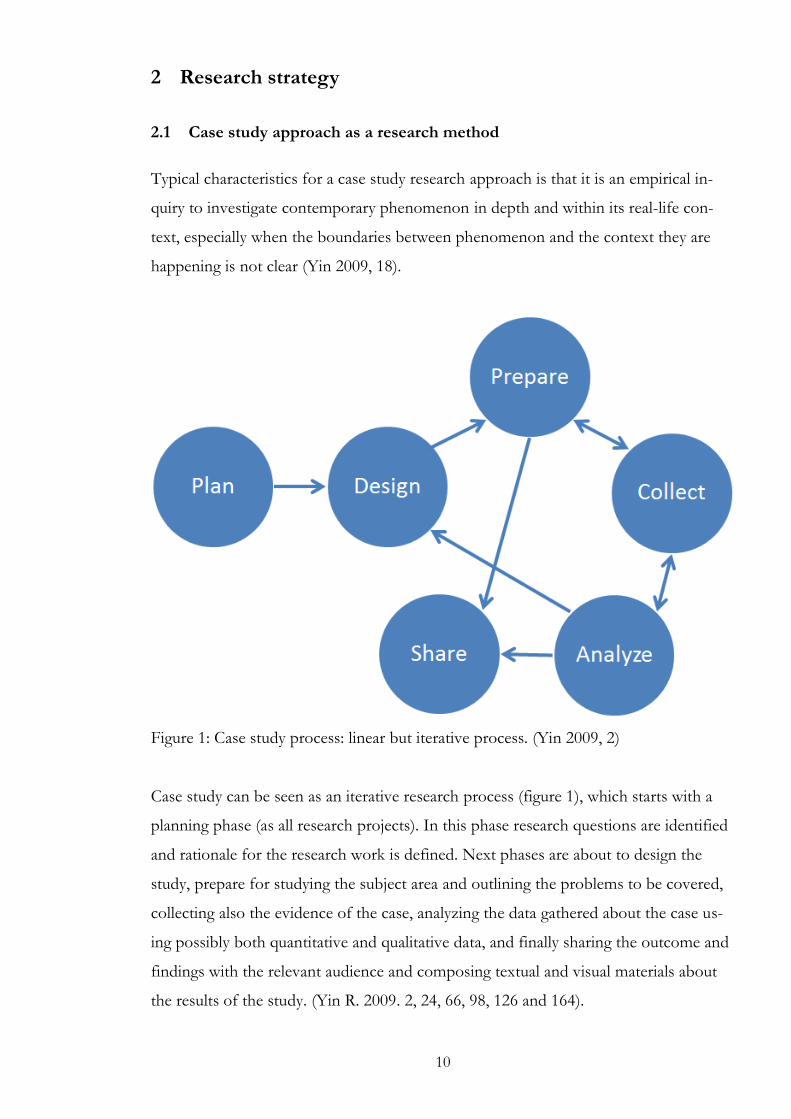
Figure 1: Case study process: linear but iterative process. (Yin 2009, 2)
Case study can be seen as an iterative research process (figure 1), which starts with a
planning phase (as all research projects). In this phase research questions are identified
and rationale for the research work is defined. Next phases are about to design the
study, prepare for studying the subject area and outlining the problems to be covered,
collecting also the evidence of the case, analyzing the data gathered about the case us-
ing possibly both quantitative and qualitative data, and finally sharing the outcome and
findings with the relevant audience and composing textual and visual materials about
the results of the study. (Yin R. 2009. 2, 24, 66, 98, 126 and 164).
11
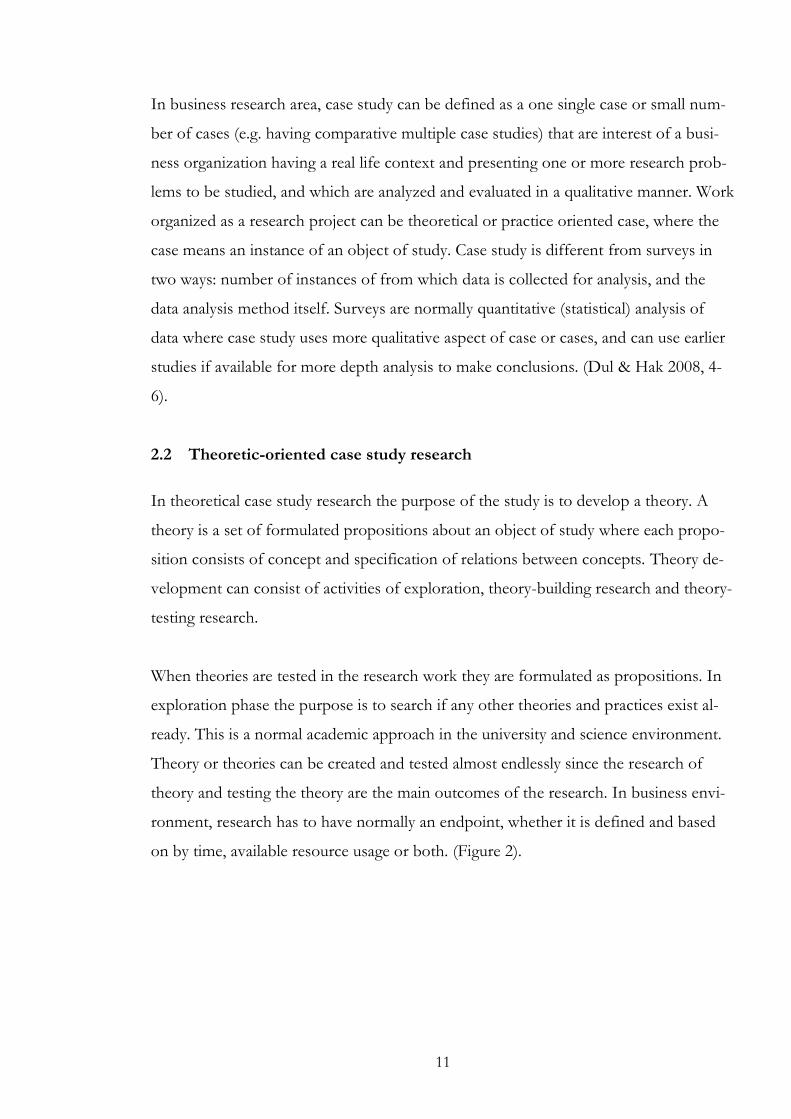
In business research area, case study can be defined as a one single case or small num-
ber of cases (e.g. having comparative multiple case studies) that are interest of a busi-
ness organization having a real life context and presenting one or more research prob-
lems to be studied, and which are analyzed and evaluated in a qualitative manner. Work
organized as a research project can be theoretical or practice oriented case, where the
case means an instance of an object of study. Case study is different from surveys in
two ways: number of instances of from which data is collected for analysis, and the
data analysis method itself. Surveys are normally quantitative (statistical) analysis of
data where case study uses more qualitative aspect of case or cases, and can use earlier
studies if available for more depth analysis to make conclusions. (Dul & Hak 2008, 4-
6).
2.2 Theoretic-oriented case study research
In theoretical case study research the purpose of the study is to develop a theory. A
theory is a set of formulated propositions about an object of study where each propo-
sition consists of concept and specification of relations between concepts. Theory de-
velopment can consist of activities of exploration, theory-building research and theory-
testing research.
When theories are tested in the research work they are formulated as propositions. In
exploration phase the purpose is to search if any other theories and practices exist al-
ready. This is a normal academic approach in the university and science environment.
Theory or theories can be created and tested almost endlessly since the research of
theory and testing the theory are the main outcomes of the research. In business envi-
ronment, research has to have normally an endpoint, whether it is defined and based
on by time, available resource usage or both. (Figure 2).
12
Figure 2: Theory-oriented case study research. (Dul & Hak 2008, 39).
2.3 Practice-oriented case study research
Practice-oriented case study is useful when the purpose is to deliver knowledge to the
practitioners who can use the findings and create new knowledge based on the study.
Practice here means responsibility, either formal or informal, to act according a real life
situation. In business environment, this can mean for example an operational or busi-
ness decision making situation.
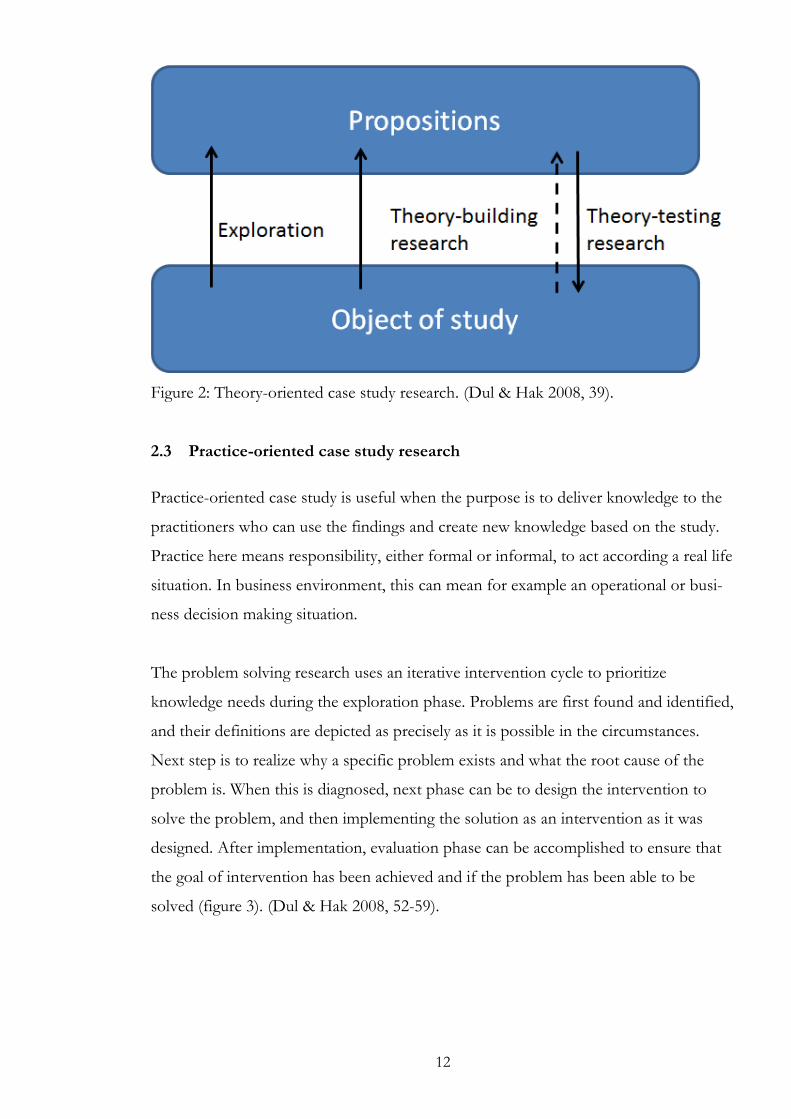
The problem solving research uses an iterative intervention cycle to prioritize
knowledge needs during the exploration phase. Problems are first found and identified,
and their definitions are depicted as precisely as it is possible in the circumstances.
Next step is to realize why a specific problem exists and what the root cause of the
problem is. When this is diagnosed, next phase can be to design the intervention to
solve the problem, and then implementing the solution as an intervention as it was
designed. After implementation, evaluation phase can be accomplished to ensure that
the goal of intervention has been achieved and if the problem has been able to be
solved (figure 3). (Dul & Hak 2008, 52-59).
13
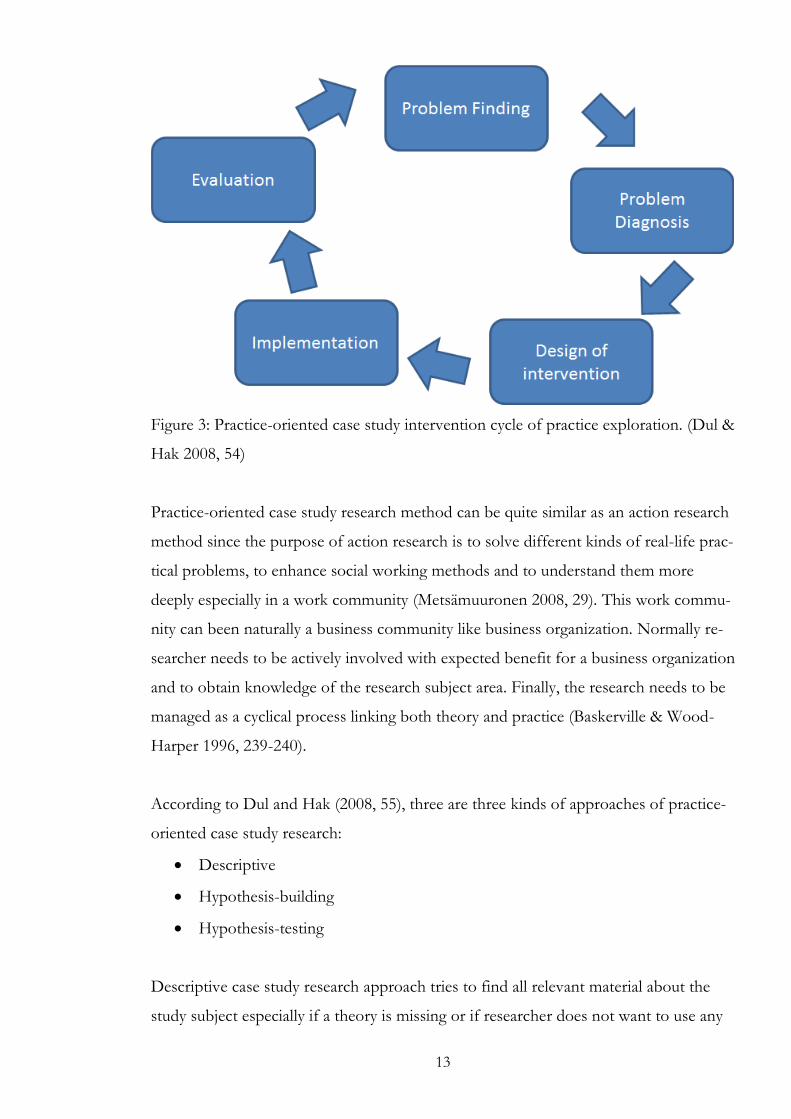
Figure 3: Practice-oriented case study intervention cycle of practice exploration. (Dul &
Hak 2008, 54)
Practice-oriented case study research method can be quite similar as an action research
method since the purpose of action research is to solve different kinds of real-life prac-
tical problems, to enhance social working methods and to understand them more
deeply especially in a work community (Metsämuuronen 2008, 29). This work commu-
nity can been naturally a business community like business organization. Normally re-
searcher needs to be actively involved with expected benefit for a business organization
and to obtain knowledge of the research subject area. Finally, the research needs to be
managed as a cyclical process linking both theory and practice (Baskerville & Wood-
Harper 1996, 239-240).
According to Dul and Hak (2008, 55), three are three kinds of approaches of practice-
oriented case study research:
Descriptive
Hypothesis-building
Hypothesis-testing
Descriptive case study research approach tries to find all relevant material about the
study subject especially if a theory is missing or if researcher does not want to use any
14
theories to explaining the subject or to test a theory with the case. Sometimes the de-
scriptive case study might miss concepts and terms so it might be even impossible to
start with a previous research results. Therefore one major and expected outcome of
the case study might be to just define definitions of concepts, and documenting them
holistically as such, especially if the research is very explorative in nature. (Routio
2007).
In exploratory research a researcher wants to explain deeper the consequences and
root causes of phenomenon and why things are like they are. The reasons behind ex-
planations can have retrospective, present or prospective view of events and phenom-
enon. Causal roots, context specific explanations and historic analysis of things hap-
pened in the past can give new ideas for further theory creation, hypothesis-building or
hypothesis testing research as well. Many times with the descriptive and exploratory
case studies need extreme focus limitation so the research area does not expand too
much and become too big to research and analyze. (Routio 2007).
Despite what kind of case study research approach is used, it is always good to have an
exploration phase in the research subject area. If hypotheses can be found, it can be
tested in a practice-oriented research project. If no hypothesis is available, then next
decision is to decide whether hypothesis creation is needed or not. If no hypothesis is
needed then descriptive research should be designed and executed. If hypothesis is
needed, hypothesis-building approach can create the needed knowledge. If hypothesis
is available and it is worth to test to create new knowledge and actions by practitioner,
hypothesis-testing approach should be executed. (Dul & Hak 2008, 45-55).
If the case study is using descriptive approach but intervention and implementation of
it is not part of the research work, intervention is not even possible or needed in the
time frame the research is done; it might be still relevant to describe and investigate the
case to find those areas and hidden constructions that have lead into the current state
and find the path to the current state changes as further research ideas. (Teräväinen
2011, 8-9). Descriptive case study has its place as a research method by describing the
subject of the study, documenting it and analyzing why the case has happened as it has
occurred, and what kind of things are needed to be understood when considering or
15
comparing it to other subjects in the same area. It also takes into account the specialty
of the research subject area by describing the circumstances, which, of course, can be
reflected against similar cases in some extent.
In the research work, gathering information about the subject as well as gathering in-
formation about what has been already studied and is available in the literature and
studies is important to discover. Six different kinds of methods for data gathering can
be used. Existing documentation in many forms, like descriptive written documents,
recordings or video material about the subject area is one kind of source of evidence.
Documentation can be about the past, present or prediction of the future; if past, then
archival records and databases are good source for information as well. Interviews with
practitioners and other relevant people referring to case subject are insightful for con-
structing a view on causal circumstances and viewpoints. Direct observations and par-
ticipant based observations as well as physical artifacts (like data warehouses or other
IT tools) are one kind of sources of evidence when constructing a case study database.
(Yin 2009, 101-114).
2.4 Case study success criteria
Social science research methods of validity checks can be used to evaluate success cri-
teria of a case study. These tests are construct validity, internal validity, external validity
and reliability. These validity principles can be used also in the business management as
well as data management area since much of the rules of data quality management is a
subject of a social and cultural behavior of an organization. (Yin 2009, 40-41).
There are also principles regarding how to collect data in a way it help and maximize to
the success criteria regarding the source of evidence usage. One principle is to use mul-
tiple source of evidence. This ensures that different angles of material and input for the
analysis phase are covered in a multifaceted way. Another important principle is to cre-
ate a case study database. This data storage includes the data that was gathered and
used for the study as well as the report produced by the researcher. It is also good to
keep notes and other related documents (incl. paper or digital printouts, voice or video
recording) as part of the case study database. Third principle is to maintain a chain of
16
evidence so that the case study questions, linkage between the questions of study pro-
tocol and link to evidence material is logical, visible and can be tracked also through
case study database including the end result of the case study as a case study report.
The citation in case study report should visually link the chain of evidence so that ex-
ternal validator can also repeat or further study the findings represented in the report.
(Yin 2009, 114-124).
2.4.1 Construct validity
One of most challenging tests is to evaluate if the case study is constructed, designed
and defined correctly, and if research topic and assumptions of the case are valid and
not just impressions done by the researcher himself. Important tactic to create valid
construct is to identify correct operational measures and use multiple sources of evi-
dence, establish chain of evidence and to give key informants a chance to review draft
case study report. Phases regarding these activities cover data collection and composi-
tion. (Yin 2009, 41-42).
Construct validity can be analyzed through four areas as content, convergent, discrimi-
nant and nomological validity. Content validity is about how logically the content is
managed to measure and is the content valid for measurement or for qualitative analy-
sis. Convergent validity is looking how scores in a testing environment correlate to
other scores in other tests assessing the same construct. Discriminant validity is the
degree of which scores in a test or case are not matching with other tests that are not
designed to assess the same construct. Nomological validity is about how a construct is
behaving similarly as similar related constructs (e.g. conformant with laws or common
logic). (Changing Minds Org 2012)
2.4.2 Internal validity
For explanatory case studies, one of the biggest concerns is that causal interpretations
are conducted correctly so that when creating relationship of event X leading to event
Y, there are no other factors P or Z that threat the validity of conclusions. These are
concerns that are needed to be done especially in data analysis phase. For descriptive
17
case studies, concern is not that big since they are not presenting causality reasons but
a description of a situation as it appears and how it has evolved. (Yin 2009, 42-43).
2.4.3 External validity
Depending on the use cases, single case studies can sometimes be difficult to general-
ize. This requires relevant theory creation which needs to be tested with a solid theo-
retical framework. This is done in the design phase. If multiple cases are selected to be
studied, those needs to be conducted separately, and conclusions across cases to be
done as a separate task, also ensuring and keeping in mind that the theory might need
to be updated. (Yin 2009, 43-57).
2.4.4 Reliability
When focusing on the reliability, one of the most important things are to avoid errors
and biased approach to the subject area of the study. When case study includes various
data gathering activities these should be documented and constructed as a study proto-
col, and the findings and results should be composed as a case study database. In this
way, the tests can be repeated by the investigator himself and by evidence validators.
(Yin 2009, 45). Thus, one of the key things is to ensure that researcher is objective to-
wards the subject area and is not mixing subjective opinions together with the findings
or conclusions.
3 Theoretical framework
3.1 Business intelligence
Business intelligence is an organizational capability where business organization is
gathering information for decision support and operational purposes to make analysis
and actions based on the collected information. This capability includes human re-
source capabilities along with information management, IT tool development and utili-
zation perspectives.
18
One of the most important areas of business intelligence development is to create ana-
lytical skills and artifacts for an organization. Successful companies who develop their
analytical skills focus typically work on five development areas: 1) having accessible,
high quality data, 2) orientate analytical skill development towards enterprise level in-
stead of having only randomly organized small initiatives, 3) create their leadership
skills to include also analytical working culture, 4) establish strategic targets and link
them analytical question and targets that make a difference to company’s success and
5) organize analytical human resources and their skill development in a manner that
benefits the whole enterprise and not just specific business functions (Davenport, Har-
ris & Morison 2011, 19-22).
3.2 Leading and lagging indicators
Indicator information can be divided in two categories: leading and lagging indicator
information. From business information usage perspective, lagging information is data
about from the past, and this kind of information can be stored in data warehouses or
operational data storage systems. This data can be utilized in performance management
by analyzing past data to see if those accomplished actions and results in the past led
organization to achieve its goals and targets, or not. It also provides a learning loop
back capability to analyze the success of an organization strategy creation or execution
success of the strategy. (Laursen & Thorlund 2010, 50-53).
Leading indicator information can be created based on information analysis by using
existing lag information or by combining it with some other external information rele-
vant for the business. Analysis can be based on different statistical analysis methods to
create new lead information, like key performance indicators (KPI) to improve existing
business process and ideas, or to create new ones. (Laursen & Thorlund 2010, 50-53).
Not all of the performance or result indicators are equally important. Parmenter (2010,
12-14) defines that an enterprise should not have more than ten (10) key result indica-
tors (KRI) and key performance indicators (KPI) explaining the result. There can be
tens or hundreds of team or unit specific performance indicators, but they are not the
key indicators for the whole company. Many times key performance and result indica-
19
tors as a concept can be used quite widely and wildly in the companies today, so the
meaning of something being “key” is not semantically necessarily that clear.
Parmenter (2010, 4) suggests also that the (key) performance indicator should be non-
financial indicator whereas (key) result indicators are mostly financial or otherwise in-
dicate the results of an action (Parmenter 2010, 2-7). COBIT as an IT management
framework used to have term of key goal indicators (KGI) and key performance indi-
cators, but in the version 4.1 and later on in the version 5 they are referring to two dif-
ferent kinds of indicators: outcome measures, and performance indicators. Outcome
measures (previously KGIs) are lagging indicators, and they show if the goals have
been met or not. Performance indicators show if the goals are likely going to be met,
and thus performance indicators are actually leading indicators. (IT Governance Insti-
tute 2007, 22).
3.3 Data categories
3.3.1 Definition of data
Data can be seen as a representation of something. Data becomes information when
the representation of something has a meaning and the content is interesting as such
for somebody. Data and information are many times used as synonyms, although in
reality information is data that is processed somehow for its intended use (Wang 1998,
59). In a business environment and from the business decision maker’s point of view
this means that data is aggregated to a level where it makes sense for a decision making
process (Laursen & Thorlund 2010, 94-95). When this aggregated data has also an in-
terpretation rule and defined semantics around the representation, data is processed as
an information entity or set of entities that has business interest. When this infor-
mation has clear business value for the business management, information becomes as
an information asset for the company. Like any other assets, information assets need to
be managed and nurtured for the business purposes.
20
3.3.2 Master data
Master data is all about the core objects of the business organization is working on or
working with – it defines the essence of the core building blocks for business opera-
tions of a company. Along with the associated metadata it defines what matters the
most for the business organization. (Loshin 2009, 5-8). Master data is non-transactional
data and information about the subjects and objects of a business event. This event
itself is a business transaction which involves the objects and parties of a transaction as
master data items. Examples of master data is company data (e.g. parties involved in
business transactions) or product data (subject of business transaction). (Loshin 2009,
15-21). Master data serves both operational transaction processing and operational us-
age, and also business analytics and related applications by providing dimensional data
around the facts of transactions. In other words, analytical applications are using and
consuming master data but do not create master data except when some derived analy-
sis results need to be updated to master data (e.g. customer value classification in fre-
quent flyer loyalty program when customer has reached a certain valuation level).
(Loshin 2011, 337-338).
In the early days of computing history, there was no master data management (MDM)
problem. The reason for this was that computing was done in a single centralized
computing environment, and both the transactional and master data was handled in
the same place and with the same data structures. Data was many times managed as flat
files, which sometimes caused problems with data redundancy and related data mainte-
nance problems having the same data multiplied many times in the processing time.
This was largely ignored as such since applications were quite straightforwardly devel-
oped for batch environment and for a single business purpose.
Since from 80’s amount of information and amount of information managing IT ap-
plications and systems have increased dramatically. This has meant that even inside one
organization there are multiple systems using, updating or creating data. This applies
also to master data. Workgroup computing invented in 80’s with the explosion of desk-
top computing and relational database system development for personal usage freed
the decision making capabilities from a centralized environment to decentralized or-
21
ganization unit level. Desktop application computing power developed in the 90’s ex-
ploded the distribution of master data in several places used and managed by several
organization units and teams. (Loshin 2009, 3-4).
In the mid 90’s when internet services started to reach more and more business interest
and importance, information management decentralization approach was not anymore
the key thing but developing centralized computing environment for internet services
became critical again. The same started to apply to master data management since it
started to come back from the desktop and groupware applications back to more cen-
tralized place. Because of the more complicated business decision making and service
offering environment, business process related application suites were created by fo-
cusing on combined business process management capabilities like customer relation-
ship management (CRM), enterprise resource planning (ERP) and supply chain man-
agement (SCM). Unfortunately, the master data was still spread –and many times still
is- typically across different business applications and application platforms serving
different organizational processes. That is why master data management has become
such an important topic for the business and for IT departments nowadays. In compa-
nies who have started master data management initiatives to correct the situation, mas-
ter data management teams and related governance groups are trying to link and inte-
grate master data back together with transactional data, especially when the enterprise
data warehouse environment has been established. In a large scale data warehouse en-
vironment most of the business process specific data needs to be mapped and linked
together so that better business decision and knowledge across processes can be shared
and analyzed. This applies also to master data integration need in the data warehouse
environment. (Loshin 2009, 3-4).
3.3.3 Transactional data
Transaction is data about some event. Event can be about anything that has happened,
or is about to be happen (predicted event). In business environment, transactional data
describes and captures those planned, predicted or actual events that take place when a
business organization operates its business. Normally one transaction as an infor-
mation entity (as a database record, for instance) describes one business event like sales
22
order intake, sending an invoice or capturing customer interaction between the busi-
ness organization and a customer. (Alter 2006, 218-219). If transactional data illustrates
more than one transaction, it is a presentation of aggregated transactions which means
that aggregated transaction loses information about some specific individual events
Laursen & Thorlund 2010, 95). Sometimes transactional data illustrates monetary op-
erations, communication event or other interaction between parties involved in the
event. These transactions can be captured as individual transactions, or being consoli-
dated as a group of transactions together for reporting purposes.
Transactions contain data about the subject of transactions as well as data about who
were the parties involved in the business event. This data is actually master data as de-
fined in chapter 3.3.2. If handled properly, transactional data should refer or otherwise
use master data handled separately from the transactional processing from the data
maintenance point of view; it is not a very good practice to keep master data like cus-
tomer names and addresses as part of each individual business transaction data. In-
stead, good practice would be to track business subjects and objects as part of master
data management separately and then only referring to those master data entities in the
transactional side. (Loshin 2011, 331-337).
3.3.4 Metadata – data about data
Metadata is defined in most simplistic way being data about data (Laursen & Thorlund
2010, 151). Metadata can be explaining structured or unstructured data. Metadata
about unstructured data (e.g. documents having no pre-defined data model as a data
structure) is mostly about textual data representation of the content and the content
taxonomies. These taxonomies can be internal subject areas found inside the unstruc-
tured data representation or they can become externally driven (like Sarbanes Oxley
taxonomy). Metadata referring to structured data (e.g. transactions or master data that
is identifiable and organized in a structured manner in a database) can be categorized in
three levels: enterprise, local and business metadata. Enterprise metadata is mostly
about business semantics which defines terms of an enterprise which should also in-
clude external reference data like country codes or names. Local interpretation of en-
terprise metadata can vary or localized versions might have a different concept for the
23
global term. This is where conceptual data models both in global and local levels can
help to map different words meaning the same thing, or if the same word is used to
mean different things. Without understanding these metadata mappings, data might
become incommensurable because of lack of semantic linkage. (Inmon, Strauss &
Neushloss 2008, 95-110).
The importance of business metadata management has arisen since the early first data
warehouse implementation in late 90’s. It is important for the end users or business
analysts to understand and know how to find data from the data warehouses or from
several data marts, or if an enterprise wide data warehouse approach is in use how to
find right information entities from this corporate wide data storage for new analysis
purposes. This requires that you know what kind of data is stored, where and from
what part of the business process data is collected. This means that some additional
data is required to define the data. (Inmon et al. 2008, 95-98). The metadata to be
managed for this kind of use situations can be defined in business information models
as well as in logical and physical data models. Conceptual data models gives the busi-
ness language, definitions and terms, which are then defined in more details in logical
and lastly in physical data models showing how the business information is managed
and stored in different data storages.
Metadata can be used to describe also the system of record about data subjects and
their attributes. System of record defines what is the source system (and a related busi-
ness process) which is providing a data entity or an attribute of it. For major data sub-
ject areas, like a customer order, there might be actually many systems providing the
data for customer order attributes as a value. Business metadata can define also the
rules and policies used in a business. It can also show business rules that e.g. in a sales
situation, age should be captured always. The reasoning for this business policy might
become from legal perspective. (Loshin 2009, 124-125).
Technical metadata can describe how the information can be represented (e.g. age is a
three digit numeric field, which is always a positive integer number). Technical metada-
ta can be used also how to transform alphabetic text field containing age information
to numeric if the source systems treat data differently. This is important information
24
especially for extracting, transforming and loading (ETL) process used to incorporate
data to data warehouse environment from various IT source systems. (Inmon et al.
2008, 223).
In master data management area, metadata management plays an important role. Busi-
ness definitions and business metadata defines policies and semantics regarding master
data and its usage, but it includes also reference data, data element metadata and data
governance related data rules for data use, access and data quality. Reference data such
as country or currency codes, although not necessarily originally created inside a com-
pany, needs to linked with other business transactional data and master metadata and
to be kept up-to-date as well (Loshin 2009, 105-107).
3.4 Information modeling methodologies and approaches
Modeling is an activity to represent a thing (like some phenomenon or an object) in
some other way than using the thing itself. Different kind of modeling methodologies
can be used to achieve in representing things. For very high level data modeling work
the notation of how to represent things is not that important because model can be
pictures, drawings or other ways to describe business terms and concepts as a repre-
sentation the target audience will understand easily. However, different modeling
methodologies and notation methods can provide advantages to illustrate various busi-
ness rules, semantics and relationships, and therefore a basic knowledge of various ap-
proaches of modeling is beneficial to know. Conceptual data models can be translated
into logical and physical data models of data applications and data storages as well as
dimensional data models used in the business intelligence area. (Hoberman et al. 2009,
13-28; 44)
3.4.1 Modeling techniques and notations
One of the most popular modeling methodologies is Unified Modeling Language
(UML) especially when object oriented system engineering methods are used widely in
a company. Entity-Relationship (ER) modeling or Information Engineering (IE) mod-
eling methodologies are also used widely in the data storage development areas, but
there are other notations used as well like Integration Definition for Information Mod-
25
eling (IDEF1X) and Object-Role Modeling (ORL). (Silverstone & Agnew 2009, 30-
33).
IDEF1X is used many times in government institutions since its origin is in United
States Department of Defense. Information engineering notation is very similar to ER-
models and it is also readable with minimal training for business users since it uses
boxes and lines with verb phrases in relationship lines to make it more readable. Barker
notation is similar in many ways that business users would represent things in Power-
point slides; e.g. subtypes of information are presented as smaller boxes inside the su-
pertype box which would make Barker notation to look like it is not a data model at all.
(Hoberman & et al. 2009, 91-101).
ORM models focus on high level concepts only so it cannot be very easily used to il-
lustrate logical or physical data models. The power of the notation is in that it can
show real life data as examples which makes it more concrete for the business users as
well. Last but not least one modeling method is to describe data as natural language
sentences as a document. Everybody who can read, have an opportunity to understand
the rules and definitions. Since there is no notation other than alphabetic language, the
danger of misinterpreting a notation as a diagram is not the case. (Hoberman & et al.
2009, 91-101). The problem might be that when considering a large business subject
area, the amount of text can be substantial compared to a data model diagram which
can illustrate business rules and relationships in a single page diagram and where textu-
al presentation could take tens or even hundreds pages of written language.
Modeling notation selection is dependent of what purpose and to what kind of audi-
ence it is targeted for. Entity-relationship model notation is an ideal choice for data-
base creation purposes and used by developers, where UML is fit for purpose for ap-
plication developers focusing on object oriented development and having not only da-
tabase tables creation work in mind. For business user, representing the data in an un-
derstandable format without any specific modeling notation might be good enough, for
example using Excel spreadsheet format. (Silverstone & Agnew 2009, 30-33). Depend-
ing on the audience of data models, the appropriate modeling notation should be se-
lected from the communicational aspects viewpoint. The key for making conceptual
26
models and data models understandable for business users is to choose a notation for
the end audience so that they can understand the communication. This is also an im-
portant topic from data quality perspective to ensure that the business context, seman-
tics, taxonomies and ontologies are understood in a similar way inside a business or-
ganization.
3.4.2 Conceptual data modeling
Conceptual data modeling a.k.a. business information modeling is about representing
business terms, concepts, their definitions and semantics along with their relationships
to each other. This can be done by showing concepts and terms as information entities
and also showing their relationship to each other in some information usage context.
In conceptual data modeling process key terms and definitions are used, described and
modeled as business sees them. (Hoberman & et al. 2009, 13-43).
In the conceptual data modeling business concepts, key terms and definitions are used,
described and modeled as business sees and uses them. The level of information enti-
ties are represented in a very high level without detailed attribute data (figure 4), alt-
hough there can be some sample attributes just to clarify and show the characteristics
of an entity (or class, if UML is used) (Hoberman & et al. 2009, 60-61). In a fact, con-
ceptual data model is not a data model at all because it just captures business concepts
and information, and how it is used in an organization (Chisholm 2012, 1-2). Concep-
tual data modeling is very important phase since it acts as a link to logical and physical
data models. The purpose of a high level conceptual data model is to show how to
control business rules and ultimately how database systems and should be managed
and integrated for the business (Hoberman & et al. 2009, 57-59).
27
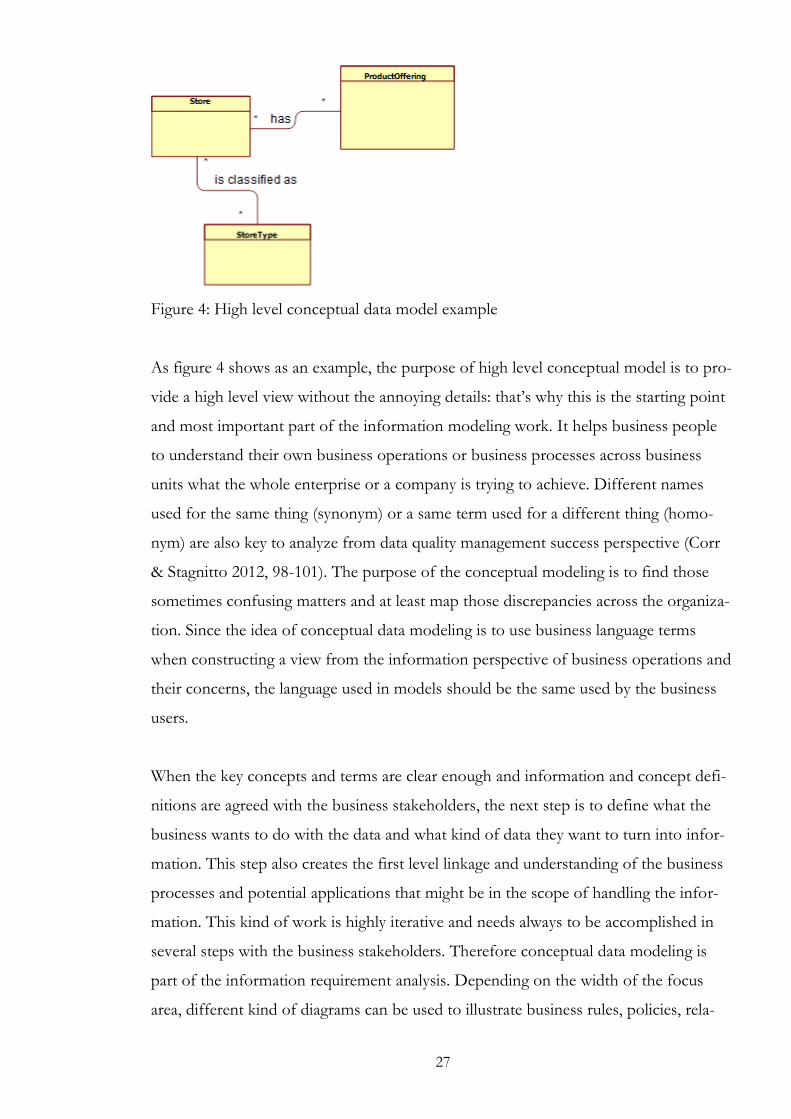
Figure 4: High level conceptual data model example
As figure 4 shows as an example, the purpose of high level conceptual model is to pro-
vide a high level view without the annoying details: that’s why this is the starting point
and most important part of the information modeling work. It helps business people
to understand their own business operations or business processes across business
units what the whole enterprise or a company is trying to achieve. Different names
used for the same thing (synonym) or a same term used for a different thing (homo-
nym) are also key to analyze from data quality management success perspective (Corr
& Stagnitto 2012, 98-101). The purpose of the conceptual modeling is to find those
sometimes confusing matters and at least map those discrepancies across the organiza-
tion. Since the idea of conceptual data modeling is to use business language terms
when constructing a view from the information perspective of business operations and
their concerns, the language used in models should be the same used by the business
users.
When the key concepts and terms are clear enough and information and concept defi-
nitions are agreed with the business stakeholders, the next step is to define what the
business wants to do with the data and what kind of data they want to turn into infor-
mation. This step also creates the first level linkage and understanding of the business
processes and potential applications that might be in the scope of handling the infor-
mation. This kind of work is highly iterative and needs always to be accomplished in
several steps with the business stakeholders. Therefore conceptual data modeling is
part of the information requirement analysis. Depending on the width of the focus
area, different kind of diagrams can be used to illustrate business rules, policies, rela-
28
tionships and definitions of concepts. Documentation of the terms can be published as
a separate glossary, so the entities in a model are clear before proceeding in to the next
level of more detailed data modeling phase. Conceptual data model with visual repre-
sentations are key to make a conceptual bridge between business and IT. (Hoberman
& et al. 2009, 119-127).
3.4.3 Logical data modeling
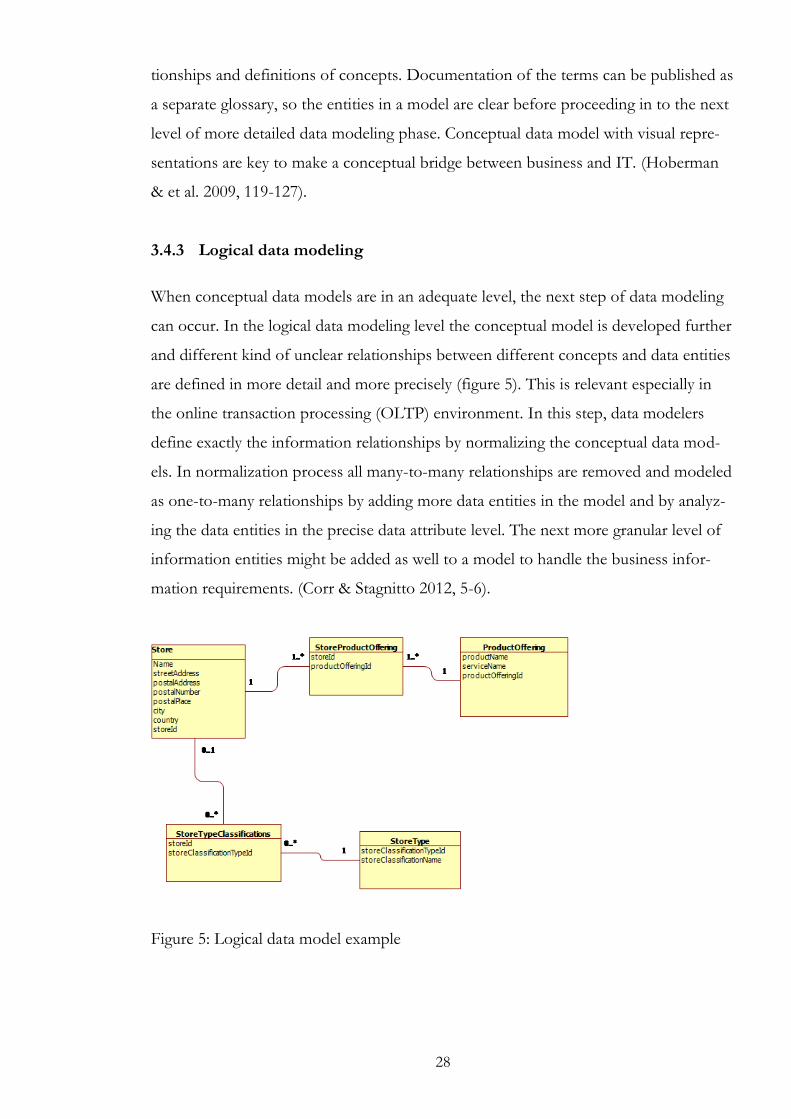
When conceptual data models are in an adequate level, the next step of data modeling
can occur. In the logical data modeling level the conceptual model is developed further
and different kind of unclear relationships between different concepts and data entities
are defined in more detail and more precisely (figure 5). This is relevant especially in
the online transaction processing (OLTP) environment. In this step, data modelers
define exactly the information relationships by normalizing the conceptual data mod-
els. In normalization process all many-to-many relationships are removed and modeled
as one-to-many relationships by adding more data entities in the model and by analyz-
ing the data entities in the precise data attribute level. The next more granular level of
information entities might be added as well to a model to handle the business infor-
mation requirements. (Corr & Stagnitto 2012, 5-6).
Figure 5: Logical data model example
29
The idea of logical data modeling is to develop the conceptual data model more close
to what is going to be implemented as an information and communication technology
(ICT) solution and/or database. It is still important to understand that both conceptual
and logical data models are not still meant to be implemented as such and they are
used for communicational purposes to enable extended group of people (like in IT
side) to understand what is the information business is looking for. (Hüsemann,
Lechtenbörger & Vossen 2000, 6-7).
In the ICT vendor management situations, both conceptual and logical data models are
very handy in vendor collaboration, evaluation phase when vendors are providing ICT
solution proposals, or when requests for proposals (RFP) are going to be sent out to
vendors for vendor selection based on their answers. Using higher level data models
and definitions makes external interest groups understand much better the business
needs and can enable them to provide better responses for RFP’s. (Takki 1999, 15).
3.4.4 Physical data modeling
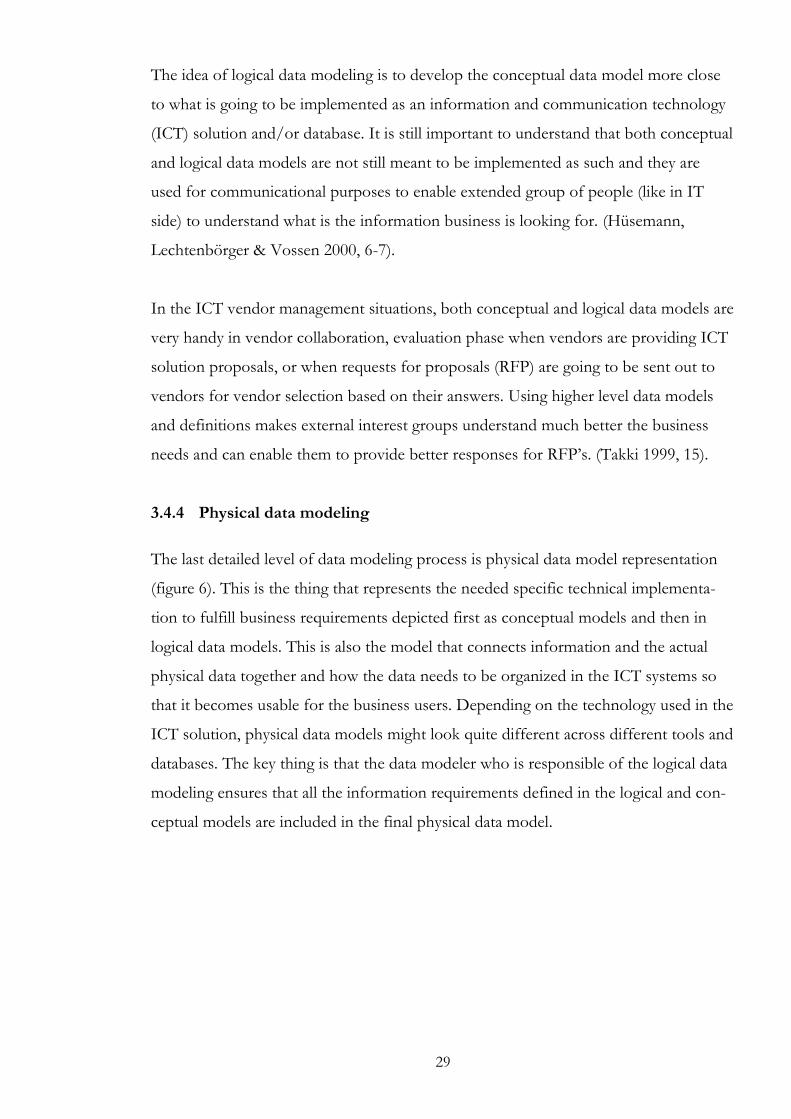
The last detailed level of data modeling process is physical data model representation
(figure 6). This is the thing that represents the needed specific technical implementa-
tion to fulfill business requirements depicted first as conceptual models and then in
logical data models. This is also the model that connects information and the actual
physical data together and how the data needs to be organized in the ICT systems so
that it becomes usable for the business users. Depending on the technology used in the
ICT solution, physical data models might look quite different across different tools and
databases. The key thing is that the data modeler who is responsible of the logical data
modeling ensures that all the information requirements defined in the logical and con-
ceptual models are included in the final physical data model.
30
Figure 6: Physical data model example, parameterized and normalized to avoid data
redundancy in OLTP environment
3.4.5 Data granularity
No matter what the level of business analytics usage company is having, pure single
record level of data is too specific for decision support. For example, individual trans-
actions of sales in certain time period might be an interesting piece of information to
the operative sales person or for customers receiving a cash receipt to check he/she
was invoiced correctly, but as a single piece of information this kind of individual
transaction data doesn’t help the company create better sales or how the company
should balance the resources for the sales operations. Therefore, this kind of detailed
data needs to be aggregated in the level it supports the decision making and planning
operations of sales. (Laursen & Thorlund 2010, 94-95).
Information needs to be aggregated in a level it enables to analyze and create new in-
sight of the operations, plan the business and set business targets that make sense. In
the aggregation of data, data semantics and definition of the data needs to be under-
stood. Aggregating right data but with wrong semantic hierarchy or classification defi-
nitions creates analytical ambiguity since the analysis outcomes are not anymore com-
parable and consistent. Different kind of hierarchies and categories used in an organi-
31
zation can exist, but those need to be clear from what viewpoint they are created.
(Laursen & Thorlund 2010, 100-101).
3.4.6 Dimensional data modeling
Operational databases and data warehouses have different purposes. Online transac-
tional processing support business execution; data warehouses on the other hand are
created for analyzing and evaluating business operations across the company. Entity
relationship modeling and 3rd normal form (3NF) data modeling supports OLTP sys-
tem creation and major goal of it is to reduce data redundancy in relational database
systems for data entry (Berson & Dubov 2012, 171). This relational database modeling
approach was developed and introduced already in 70s’ by E.F. Codd (Codd E.F 1970,
377-387).
If enterprise data models are created illustrating the various business and process inte-
grations between data entities in a normalized way, these data models can include hun-
dreds or thousands of data entities with complex relationships to each other. In a data
warehouse or even in smaller data mart environment relational normalized modeling
approach is not necessarily an optimal way to model business intelligence data for re-
porting and analytics purposes since the retrieval of data using 3NF data model schema
is not the best one from the performance perspective. Therefore dimensional modeling
is used for business intelligence reporting and analytics solutions. (Corr & Stagnitto
2012, 4-6).
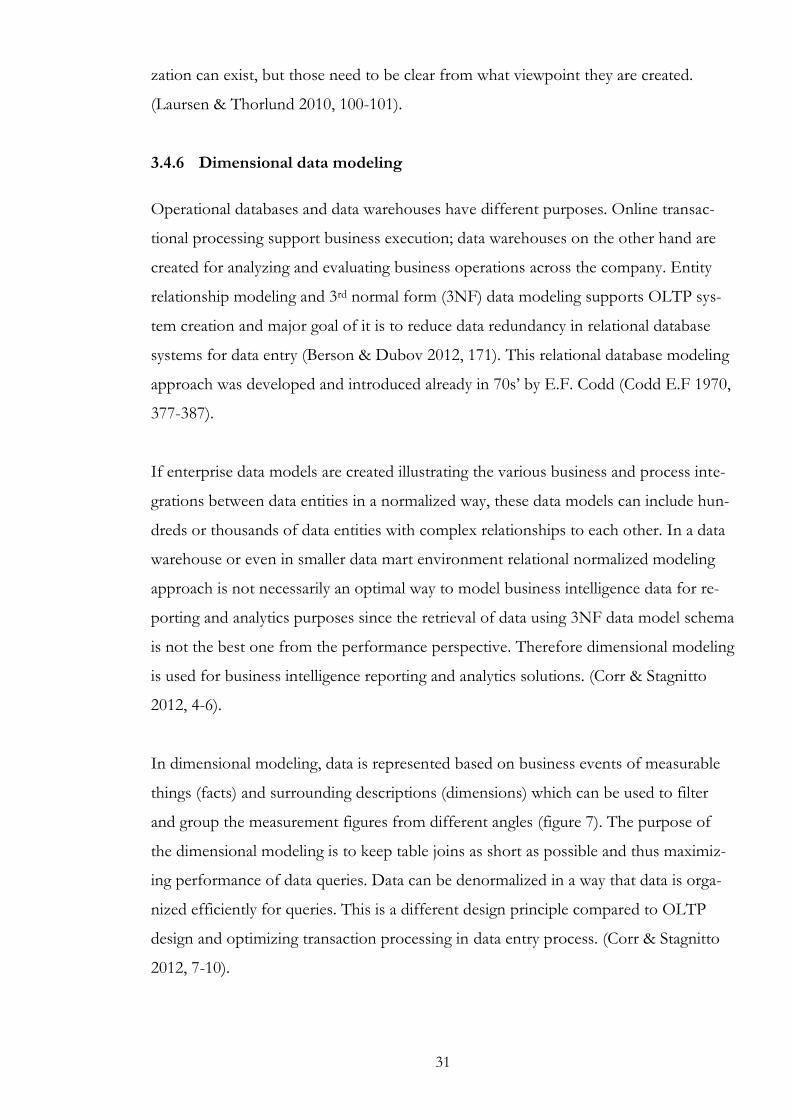
In dimensional modeling, data is represented based on business events of measurable
things (facts) and surrounding descriptions (dimensions) which can be used to filter
and group the measurement figures from different angles (figure 7). The purpose of
the dimensional modeling is to keep table joins as short as possible and thus maximiz-
ing performance of data queries. Data can be denormalized in a way that data is orga-
nized efficiently for queries. This is a different design principle compared to OLTP
design and optimizing transaction processing in data entry process. (Corr & Stagnitto
2012, 7-10).
32
Figure 7: Dimensional data model example
3.4.7 Business intelligence and master data modeling complexity
As explained in chapter 3.4.6, dimensional modeling is used many times for data mart
or data warehouse implementations for business intelligence applications. The reason
for this can be explained using social science theories and studies of so called Small
World problem introduced by Stanley Milgram in 1967 (Milgram 1967, 61‐67). In this
study, Milgram introduces a well-known phenomenon and phrase of “how small world
it is”; that is, concentrating on the occurrence of what is the probability that two per-
sons in a world would know each other – which is naturally pretty low, but it can still
happen (making the world small). The question becomes more interesting when con-
sidering the options that if persons X and Y do not know each other (which is very
likely) but if person Z does know X and Y. By continuing this kind of thinking Mil-
gram depicted a theory of how many intermediate links are needed in a certain popula-
tion before X and Y can be linked. This is the basis for Robert Hillard to suggest that
complexities of data models should be evaluated using Milgram’s network theory of
vertex (data entity), average number of connections to entities (relationship) and num-
ber of entities in per vertices to analyze the complexity of data model (Hillard 2012).
Regarding business intelligence reporting and analytics, master data is needed to make
transactional figures and numbers understandable and meaningful. Master data repre-
33
sents the viewpoints around the facts of business events showing who, when, what,
where, how and why something happened. Together they show facts representing
business process activity (verbs) in dimensions of classifications (nouns). (Corr & Stag-
nitto 2012, 44). Depending on how many of different kind of dimensions there are,
these dimensions as relationships to transactional facts can be illustrated as a data
model. Many times the relationship between data entities is as important to the busi-
ness as is the content of the data entities. What creates a challenge from business intel-
ligence creation perspective is how to manage the complexity of a business data model.
Increasing level of relationships starts to be not just hard to implement but also to un-
derstand by the business end users, which makes reviewing and understanding the
business data model even more difficult.
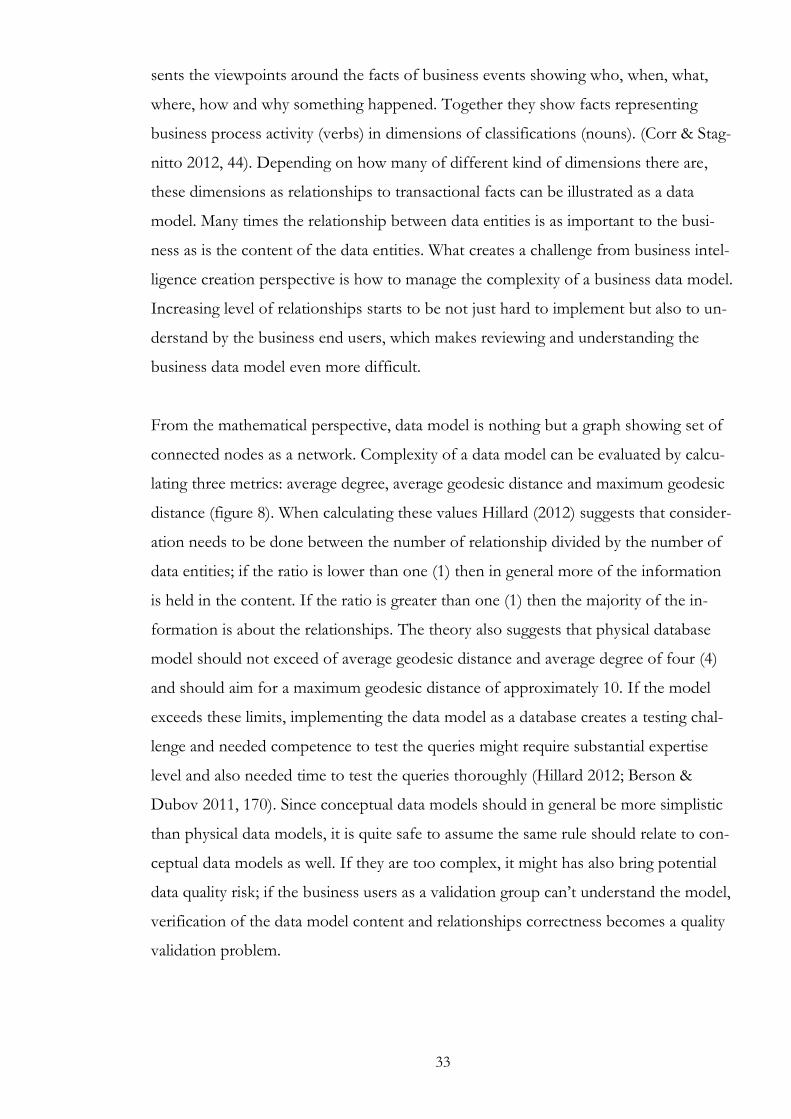
From the mathematical perspective, data model is nothing but a graph showing set of
connected nodes as a network. Complexity of a data model can be evaluated by calcu-
lating three metrics: average degree, average geodesic distance and maximum geodesic
distance (figure 8). When calculating these values Hillard (2012) suggests that consider-
ation needs to be done between the number of relationship divided by the number of
data entities; if the ratio is lower than one (1) then in general more of the information
is held in the content. If the ratio is greater than one (1) then the majority of the in-
formation is about the relationships. The theory also suggests that physical database
model should not exceed of average geodesic distance and average degree of four (4)
and should aim for a maximum geodesic distance of approximately 10. If the model
exceeds these limits, implementing the data model as a database creates a testing chal-
lenge and needed competence to test the queries might require substantial expertise
level and also needed time to test the queries thoroughly (Hillard 2012; Berson &
Dubov 2011, 170). Since conceptual data models should in general be more simplistic
than physical data models, it is quite safe to assume the same rule should relate to con-
ceptual data models as well. If they are too complex, it might has also bring potential
data quality risk; if the business users as a validation group can’t understand the model,
verification of the data model content and relationships correctness becomes a quality
validation problem.
34
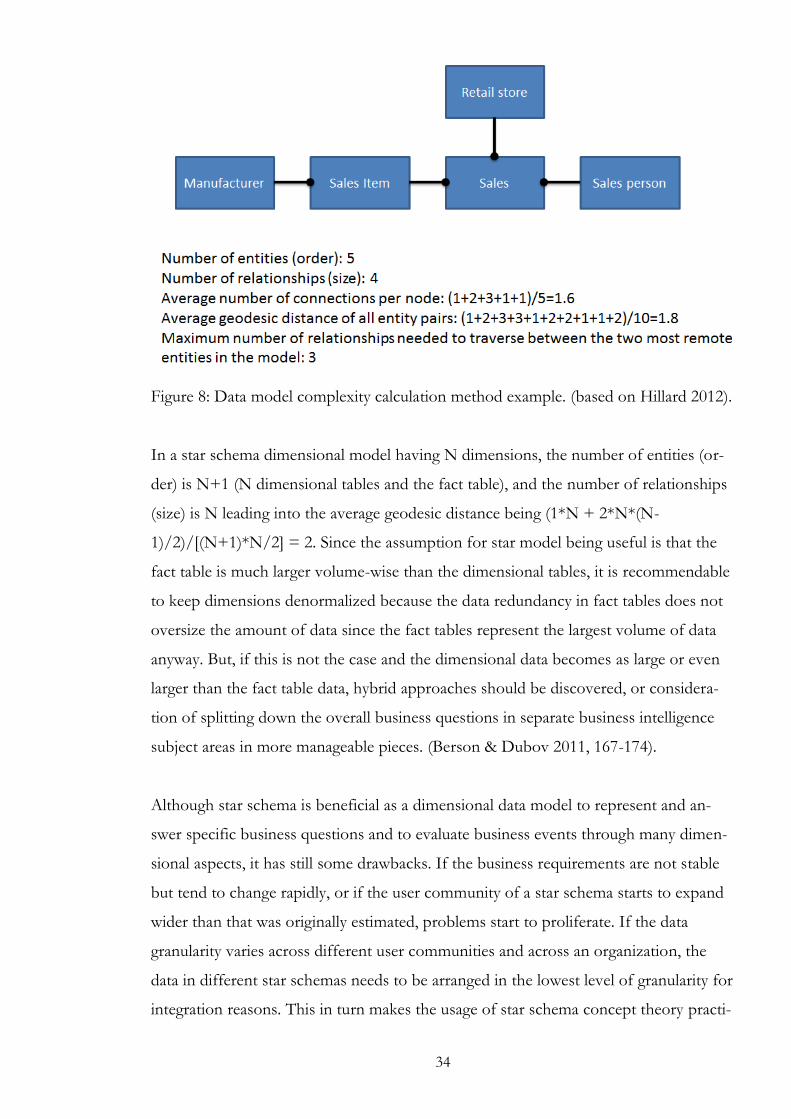
Figure 8: Data model complexity calculation method example. (based on Hillard 2012).
In a star schema dimensional model having N dimensions, the number of entities (or-
der) is N+1 (N dimensional tables and the fact table), and the number of relationships
(size) is N leading into the average geodesic distance being (1*N + 2*N*(N-
1)/2)/[(N+1)*N/2] = 2. Since the assumption for star model being useful is that the
fact table is much larger volume-wise than the dimensional tables, it is recommendable
to keep dimensions denormalized because the data redundancy in fact tables does not
oversize the amount of data since the fact tables represent the largest volume of data
anyway. But, if this is not the case and the dimensional data becomes as large or even
larger than the fact table data, hybrid approaches should be discovered, or considera-
tion of splitting down the overall business questions in separate business intelligence
subject areas in more manageable pieces. (Berson & Dubov 2011, 167-174).
Although star schema is beneficial as a dimensional data model to represent and an-
swer specific business questions and to evaluate business events through many dimen-
sional aspects, it has still some drawbacks. If the business requirements are not stable
but tend to change rapidly, or if the user community of a star schema starts to expand
wider than that was originally estimated, problems start to proliferate. If the data
granularity varies across different user communities and across an organization, the
data in different star schemas needs to be arranged in the lowest level of granularity for
integration reasons. This in turn makes the usage of star schema concept theory practi-
35
cally useless. In these kinds of situations data warehousing approach keeping data in 3rd
normal relational form and in detailed level, and building a data hub as a data ware-
house serving other business area specific data marts could be more valid approach.
The business context and requirements dictates what the suitable architectural pattern
is, and needs to be validated openly inside a business and IT organization. (Inmon et al.
2008, 18-21).
3.4.8 Linking concepts, information and knowledge together with ontology
When business concepts are shared inside an organization that doesn’t mean that the
ontology is in shape. In information science, ontology means definition of concepts
and their relationships to each other, which can be in a business environment very con-
text-specific (Wikipedia 2012_3). Tom Gruber defines ontology as an “explicit specifi-
cation of a conceptualization” (Gruber 1993, 199). From the business perspective, the
key words in this definition are not only ‘conceptualization’ but also the ‘explicit speci-
fication’. In the business environment first step is to share concepts explicitly inside an
organization. Having a common capability for knowledge sharing requires also that
common ontology for the company exists. This means that if concepts are shared but
they are not commonly agreed; or if knowledge is just referring to conceptualization
but it is not taken into use; or if a set of concepts is only shared and used inside one
specific are (like an application or a part of an organizational system) but not shared
for a business domain across applications, ontology is still missing (Dillon, Chang,
Hadzic & Wongthongtham 2008, 7). Having consensus of interpretation of concepts
and understanding of them in the context of a business domain or across domains are
crucial for ontology existence.
For an enterprise, amount of the needed sharable data and consensus of its usage
across in an organization is one the key topics when utilizing and linking data across
multiple business domains. This becomes especially important in the enterprise data
warehouse environment when common interchangeable knowledge sharing and analyt-
ics is in use (Davenport & Harris 2007, 185). Having a set of commonly used and
agreed concepts is a fundamental requirement of having a possibility to use automated
tools like ICT systems for data transformations and integrations. When concepts and
36
conceptual models are transformed into logical and physical data models and related
supporting tools having agreement of common semantics and ontology across business
domains, transforming data for business purposes becomes an easier task compared to
situation there’s no agreement on the ontology. If the ontological linkage is missing,
this normally means time-consuming and error-prone human interactions and manual
work in transformation, extracting, sending and receiving data between the ICT sys-
tems and databases. (Dillon et al. 2008, 7-8).
It is also important to understand the difference between ontology, concept and in-
formation linkage to knowledge creation: ontology defines agreed and shared concepts
and terms which are used to represent knowledge. Concepts (and conceptual models)
link information and data together giving a meaning and a definition for contextual
data representation and thus are actual ground facts for information sharing. Ontology
plays an important role by defining the vocabulary used to compose complex expres-
sions of a business operating environment. (Gruber 1993, 2-3).
3.5 Insight creation
Insight means about understanding how different actions have cause and effect in a
specific context. This can be done through introspection, observations, deductions and
perceptions of business environment and about the business organization itself. Insight
is a human capability to really learn not only what happened but also to really under-
stand the root causes of a phenomenon and end results of human behavioral actions.
(Davenport et al. 2010, 6-7).
Business organizations use different kind of methods and approaches to learn how
they are advancing or making the business. The key is to first define what the business
questions that needs to be answered are. This should lead and to be reflected also in
the IT tool development and making focus and priority selections of the development
efforts. Defining the right questions or using e.g. data mining techniques to find new
better business questions is a step forward having analytical approach and to become
an analytical fact-based driven company.
37
Business questions can be organized in two categories of time frame and innovation.
Time frame defines whether the business questions are looking in the past, in the pre-
sent or in the future. Innovation aspect defines whether the organization is working on
known facts or if it is creating of new insight. Depending on the business need and
type of questions, different kind of reporting and analysis needs can arise. Sometimes
there are no time for data collection phase and deep analysis; business decision for rap-
idly changing market situations might need to be done immediately by the manage-
ment. But, if there is a chance to prepare for these kind of situations, business man-
agement should preserve some time to find the right questions and be prepared to find
answers to them with the business analytics (Davenport et al. 2010, 10-11).
3.5.1 Knowledge creation
Knowledge cannot be created without individual persons and thus an organizational
knowledge creation is based on human beings using tacit and explicit information and
sharing a common ontological view on top of the data. This can be seen to happen in
four different cycles: socialization, externalization, combination and internalization
phases. In the socialization phase people share tacit information with each other (like
in brainstorming sessions). Socialization happens internally in the organizations or with
external parties as well (like customers). In the externalization tacit knowledge is de-
fined as explicit concepts; this is done by defining conceptual models, analogies, hy-
potheses and metaphors. Explicit information combination is about using other explic-
it information where individuals exchange and combine information using tools like
databases, business and information models to operational plans, use computerized
network communication capabilities for information finding and sharing, and find oth-
er knowledge like educational training as well. In the process of internalization explicit
data becomes to tacit information again by using and doing things in practice and using
explicit data for creating user stories, writing documentations or other presentations to
be shared in the business community (Nonaka & Takeuchi 1995, 56-62).
When new business questions arise or new opportunities are created in this cyclic event
of knowledge creation, ontology and conceptualization becomes very important vehi-
cle to share the knowledge and create new knowledge. With the explicit data, process
38
of data mining can be used to explore large amount of existing data to discover new
patterns and business rules which are useful to business. This can also be used to ex-
pand or modify existing ontologies of business organization operations and to find
new competitive advantages for it. (Linoff & Berry 2011, 1-4).
3.5.2 Reporting and insight differentiation
As defined in chapter 3.5, Davenport, Harris and Morison (Davenport & et al.. 2010,
6-8) divide analytics and related business questions in two levels: time frame and inno-
vation levels (figure 9). Question that answers a basic question “what happened” are
managed by developing reporting capabilities. This viewpoint is about looking in the
past. The next time frame question is to look on present things by answering to a ques-
tion “what is happening now”. These kinds of questions can be handled by generating
e.g. alerts or warning systems; for example, if something is happening in a way it is out
of the normal situation pattern, alerts can be created and send it to the manager being
responsible of such a process. Using some extrapolation patterns and calculation rules
it is also possible to predict and answer to a question “what will happen next” in the
future. All of these kinds of situations are more or less information sharing and using
information in different kind of time frame viewpoints. Using the business information
in this kind of way is in fact answering to a question what has happened or will happen
if the circumstances are not going to be changed. The problem of this kind of report-
ing or analytics usage is that information does not explain why the things have hap-
pened as they have. (Davenport & et al. 2010, 6-8). For example, sales report from the
past quarter showing sales revenue status does not explain why the sales figure as it is;
you can actually stare the sales figures “till the cows come home” (Video of Parmenter,
2011), but you can’t say based on the revenue why it is as it is and how to improve it.
More explanatory data and methods are needed to create new information and new
insight based on the data.
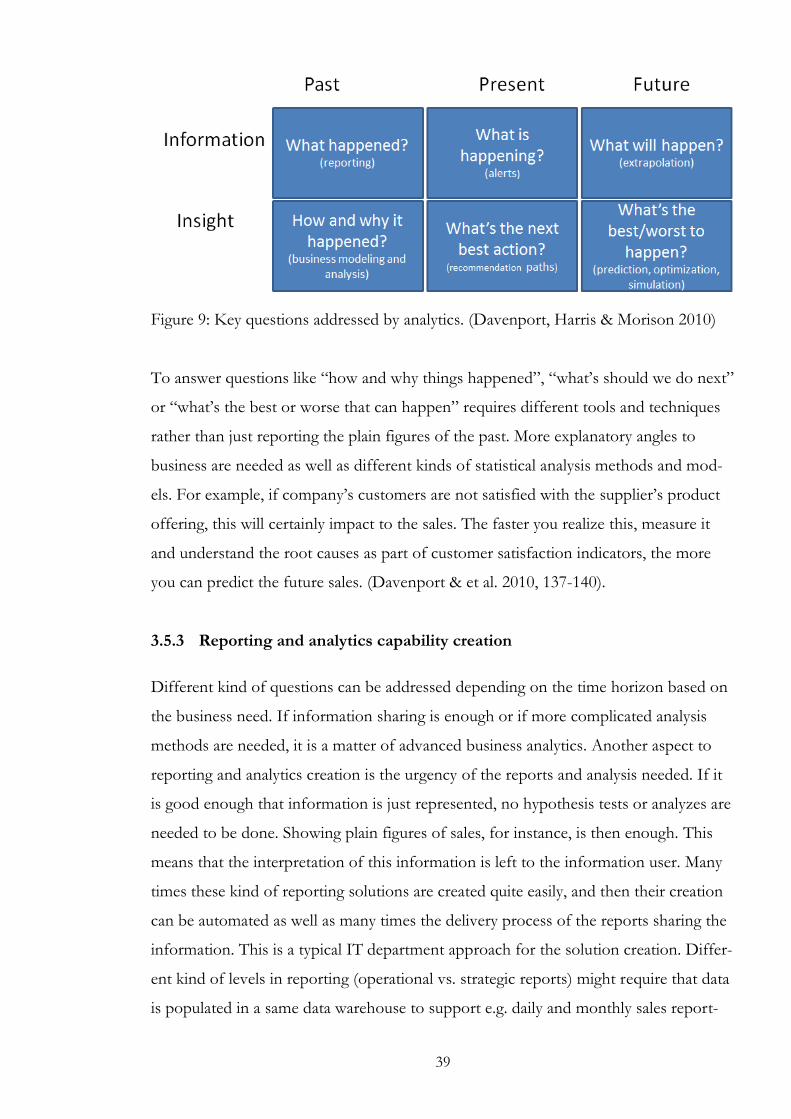
39
Figure 9: Key questions addressed by analytics. (Davenport, Harris & Morison 2010)
To answer questions like “how and why things happened”, “what’s should we do next”
or “what’s the best or worse that can happen” requires different tools and techniques
rather than just reporting the plain figures of the past. More explanatory angles to
business are needed as well as different kinds of statistical analysis methods and mod-
els. For example, if company’s customers are not satisfied with the supplier’s product
offering, this will certainly impact to the sales. The faster you realize this, measure it
and understand the root causes as part of customer satisfaction indicators, the more
you can predict the future sales. (Davenport & et al. 2010, 137-140).
3.5.3 Reporting and analytics capability creation
Different kind of questions can be addressed depending on the time horizon based on
the business need. If information sharing is enough or if more complicated analysis
methods are needed, it is a matter of advanced business analytics. Another aspect to
reporting and analytics creation is the urgency of the reports and analysis needed. If it
is good enough that information is just represented, no hypothesis tests or analyzes are
needed to be done. Showing plain figures of sales, for instance, is then enough. This
means that the interpretation of this information is left to the information user. Many
times these kind of reporting solutions are created quite easily, and then their creation
can be automated as well as many times the delivery process of the reports sharing the
information. This is a typical IT department approach for the solution creation. Differ-
ent kind of levels in reporting (operational vs. strategic reports) might require that data
is populated in a same data warehouse to support e.g. daily and monthly sales report-
40
ing. This becomes an important approach especially when the data quality and one set
of baseline data is a common concern to make the reports comparable and balanced.
(Laursen & Thorlund 2010, 115-116).
One of the data warehouse paradigms has been to choose between Ralph Kimball di-
mensional data mart development and Bill Inmon data warehouse development ideas.
Kimball believes that data warehouse is a conglomerate of all data marts in an enter-
prise, and having conformed data dimensions makes different data marts and different
fact tables comparable to each other. Inmon principles define that data warehouse (es-
pecially enterprise data warehouse) is a single strategic place for data sourcing that
companies should construct for their business intelligence purposes. In this kind of
data warehouse, data would be stored and managed in 3rd normal form, which can then
be provided for other data marts sourcing the data from this common warehouse.
Both design paradigms are possible: it is a question of how business organizations sees
their position in data governance and what is their attitude towards data management
going forward. (Serra 2012; Inmon & et al. 2008, 15-21; Kimball R. 2012).
If the purpose of business intelligence creation and data is seen as a strategic asset, data
warehousing by Inmon might be the preferred way; if the attitude of data analysis is
more on the departmental side, multiple data mart creation work and Kimball ap-
proach might be chosen (Serra 2012). Common challenge for both approaches comes
in defining and agreeing what is conformed and what are the common definitions of
different dimensions since different departments inside one company can have differ-
ent semantics regarding the dimensions, which is a political challenge for a company to
tackle. (Corr & Stagnitto 2012, 98-99).
3.6 Data quality
Today most of the organizations depend heavily on data. This happens generally in two
ways: standard business operations are executed as transactions of business events, and
supporting activities are managed before and after the execution. Data is used to run
and improve the business execution and to reach business targets of an organization.
Since data is also a strategic asset to differentiate company from its competitors, there
41
have to be processes that are established to ensure that data available has sufficient
quality to meet business operational and management targets and needs. (Loshin 2011,
1).
When talking about data quality and data quality improvements, it is important to no-
tice that the data quality cannot be detached from the context where data is going to be
used as information and for knowledge creation. In analytical decision making process,
using business intelligence solutions and different information sources data doesn’t
need to be nearly as perfect as it is required in transactional event recording environ-
ment (e.g. billing and invoicing). Naturally understanding of what is the needed level of
data quality has to be considered beforehand, and what is the current state after infor-
mation analysis activities. For example, if customer address is outdated in the transac-
tional contact center system, that is annoying and sometimes even a severe problem for
re-contacting the customer afterwards. For customer relationship analytics, this is nec-
essarily not a problem at all. Having the same data quality requirements for both ana-
lytical and transactional systems is far from optimal data quality management target.
(Davenport et al. 2010, 31-32).
3.6.1 Definition of quality
Quality can be defined in many ways depending on the context quality is measured or
experienced. In short, quality can be seen as “fitness for use” (Cappiello, Francalaci &
Pernici 2004, 68). Quality frameworks like TQM consider quality as continuous im-
provement of processes, products and organizational systems needed for running
business operations to meet customer expectations. Six Sigma framework looks simi-
larly how to improve systematically business processes where the target is to reduce the
fluctuation of product quality and making changes into the process and capabilities in a
manner that the quality is in the acceptable quality tolerance. (Wikipedia 2012_e).
Making a similar quality control as defined in TQM or Six Sigma is relevant in the
business intelligence data management area as well. The idea is to ensure and control
that different fact (business measures) can be viewed from different angles (data di-
mensions) and that the data is in an acceptable quality level. Information relevance re-
42
garding the data usage situation, the ability of the end user to use and understand data
correctly and to understand if the usage situation itself is understood correctly is highly
contextually driven (Watts, Shankaranarayanan & Even 2009, 202-203). This is why
information quality is hand in hand with the usage or process quality as well, and needs
to be considered respectively in that context. The same applies also in improvement
activities of data quality since information that is having acceptable quality for certain
decision making or operational usage may be perceived to be of poor quality for an-
other decision or operational situation (Cappiello et al. 2009, 72).
3.6.2 Dimensions of data quality
Data quality can be considered from different angles and dimensions. These dimen-
sions can be first divided in two sections: intrinsic and contextual quality dimensions
(figure 10). In intrinsic dimension, data can be analyzed based on how accurate it is,
how data is sourced and what is the lineage of data, how well it is consistent structural-
ly as well as from the semantic perspective. Contextual dimensions cover data quality
aspects of completeness, consistency and currency, timeliness, reasonableness and
identifiability of data. These dimensions also comprise key characteristic metrics as a
baseline in data quality assessment. It is important to have criteria for each dimension
whether the data quality is in adequate level or not – this is of course a matter of a par-
ticular organization to define and decide as well as conformance threshold defining the
needed level of conformation of data. This is a task that needs to be done according to
business needs and usage. (Loshin 2011, 129-146).
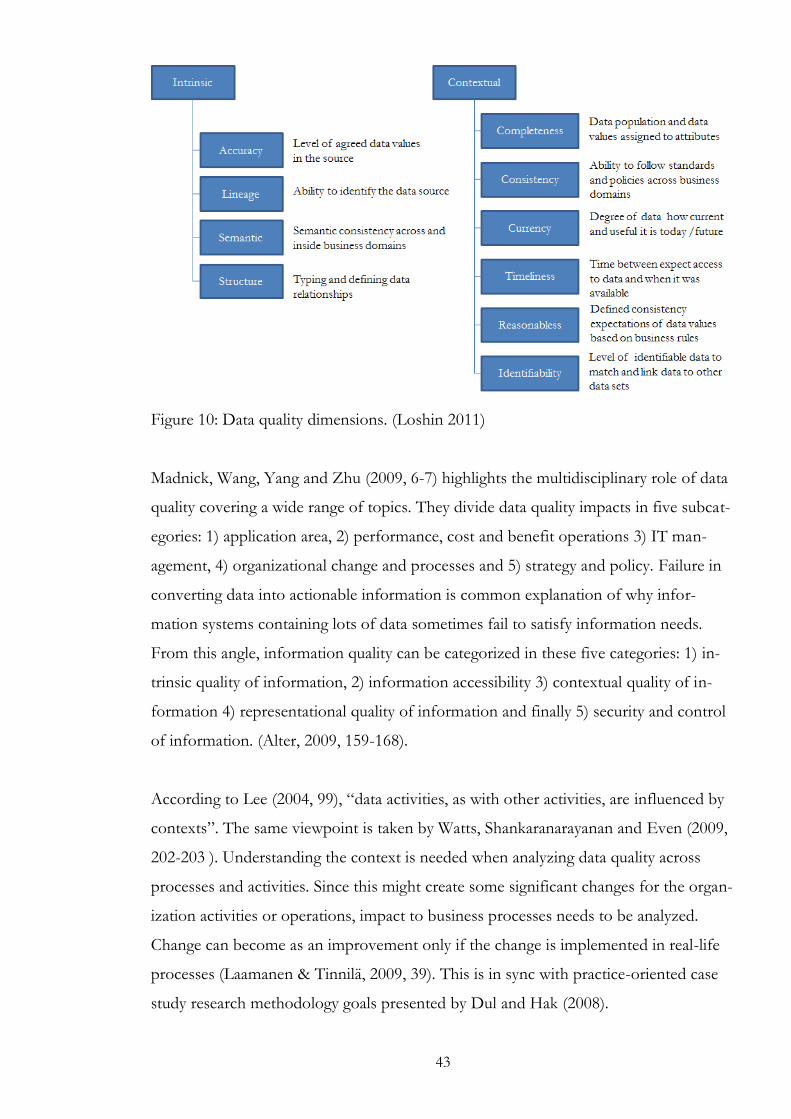
43
Figure 10: Data quality dimensions. (Loshin 2011)
Madnick, Wang, Yang and Zhu (2009, 6-7) highlights the multidisciplinary role of data
quality covering a wide range of topics. They divide data quality impacts in five subcat-
egories: 1) application area, 2) performance, cost and benefit operations 3) IT man-
agement, 4) organizational change and processes and 5) strategy and policy. Failure in
converting data into actionable information is common explanation of why infor-
mation systems containing lots of data sometimes fail to satisfy information needs.
From this angle, information quality can be categorized in these five categories: 1) in-
trinsic quality of information, 2) information accessibility 3) contextual quality of in-
formation 4) representational quality of information and finally 5) security and control
of information. (Alter, 2009, 159-168).
According to Lee (2004, 99), “data activities, as with other activities, are influenced by
contexts”. The same viewpoint is taken by Watts, Shankaranarayanan and Even (2009,
202-203 ). Understanding the context is needed when analyzing data quality across
processes and activities. Since this might create some significant changes for the organ-
ization activities or operations, impact to business processes needs to be analyzed.
Change can become as an improvement only if the change is implemented in real-life
processes (Laamanen & Tinnilä, 2009, 39). This is in sync with practice-oriented case
study research methodology goals presented by Dul and Hak (2008).
44
3.6.3 Data quality measurement, targets and linkage to business performance
indicators
Before setting any data quality targets and related metrics for it one must put focus on
the design of producing and generating data. Not all data is created for analytical and
business intelligence purposes, so some transformation might be needed to adjust data
to fit for the purpose. (Wand & Wang 1996, 87-89).
Data quality can be considered also from two theoretical approaches: communication
theory and information economics perspective. In communication theory, signaling in
a noisy channel can result difference between what the message was when it was send
and what was it when it was received (Shannon 2001, 3-4). On the other hand, infor-
mation economics theory focuses more on information usage. When using information
economics approach it is possible to compare what information sources are most ben-
eficial for a person or organization.
Although communication and information economics theories provide formal treat-
ments of communication measurement, they ignore how the design of an information
system and information usage situations affect to the data quality and how this should
be measured. The value of information is in the terms of the outcomes a person can
act upon the information. If the outcomes are erroneous and the errors are happening
statistically outside of the range of an acceptable tolerance, there is a good business
reason to investigate also if the errors are happening because of the wrong infor-
mation, or, wrong actions are made by right information. This is also a reason why data
quality cannot be measured only by using mathematical perspective to data but also
from the ontological perspective how it is interpreted. For knowledge creation success
ontology is an important agreement of an organization to agree with the meanings and
semantics. Having no agreement means there is no target; and from the data quality
perspective this is what is needed. Therefore, data quality dimensions and their data
quality targets have to be defined in the context of how the organization wants to set
its operational targets. (Wand & Wang 1996, 87-89).
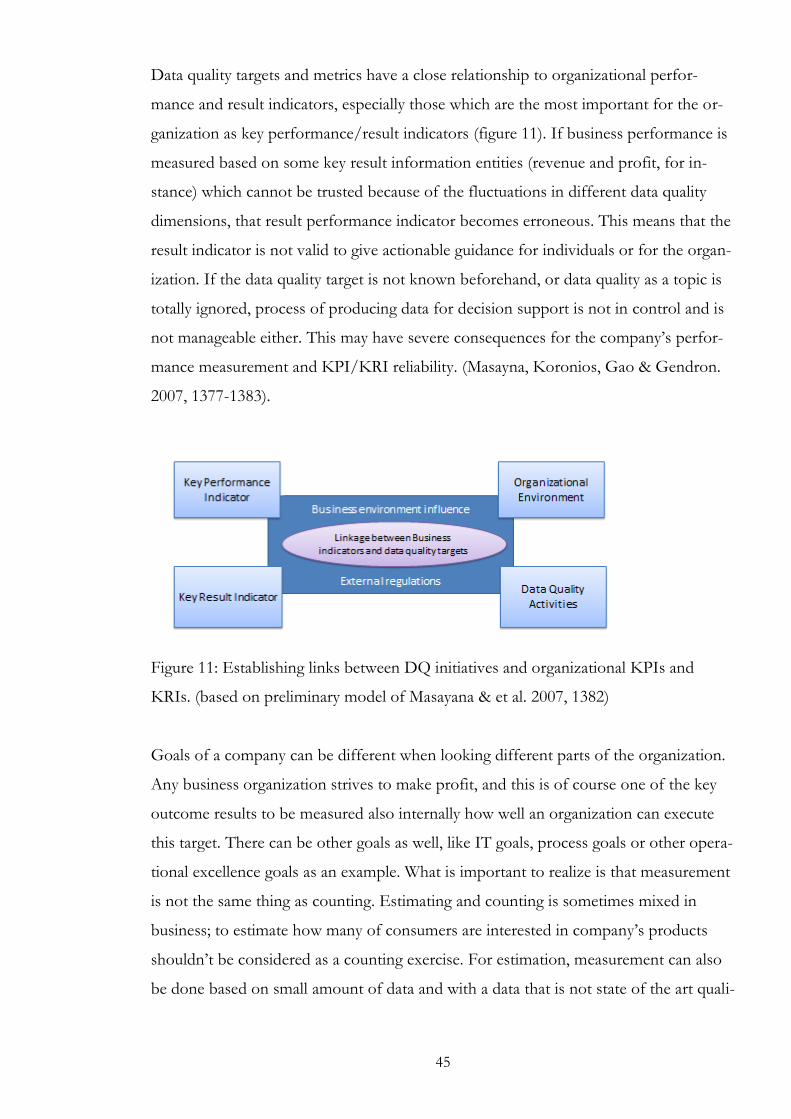
45
Data quality targets and metrics have a close relationship to organizational perfor-
mance and result indicators, especially those which are the most important for the or-
ganization as key performance/result indicators (figure 11). If business performance is
measured based on some key result information entities (revenue and profit, for in-
stance) which cannot be trusted because of the fluctuations in different data quality
dimensions, that result performance indicator becomes erroneous. This means that the
result indicator is not valid to give actionable guidance for individuals or for the organ-
ization. If the data quality target is not known beforehand, or data quality as a topic is
totally ignored, process of producing data for decision support is not in control and is
not manageable either. This may have severe consequences for the company’s perfor-
mance measurement and KPI/KRI reliability. (Masayna, Koronios, Gao & Gendron.
2007, 1377-1383).
Figure 11: Establishing links between DQ initiatives and organizational KPIs and
KRIs. (based on preliminary model of Masayana & et al. 2007, 1382)
Goals of a company can be different when looking different parts of the organization.
Any business organization strives to make profit, and this is of course one of the key
outcome results to be measured also internally how well an organization can execute
this target. There can be other goals as well, like IT goals, process goals or other opera-
tional excellence goals as an example. What is important to realize is that measurement
is not the same thing as counting. Estimating and counting is sometimes mixed in
business; to estimate how many of consumers are interested in company’s products
shouldn’t be considered as a counting exercise. For estimation, measurement can also
be done based on small amount of data and with a data that is not state of the art quali-
46
ty. (Hubbard 2010, 22-26) Still, data quality plays an important role in business intelli-
gence. The level of required quality varies depending on the context of analytical
methods or how performance is measured. This applies especially to key performance
indicator level data; e.g. the data quality requirements and what is required level of ac-
curacy and trustworthiness in business process improvement measurement area can be
quite different compared to company’s official financial profitability calculations.
Performance measurement can be accomplished in many ways, and it can be repre-
sented in many ways as well. Before measuring anything, and before starting to collect
information for the measurement it is important to define why the measurement is
important: what is the business question company is trying to get an answer (Hubbard
2010, 41-42). This means that business objectives must be translated to outcome
measurement and performance indicators. Data needed to be used in calculations of
those indicators needs to be valid, compliant and the meaning of the data needs to be
well known and defined before using it for calculation or analysis purposes. (Masayna
et al. 2007, 1376-1379).
One easy way to increase success rate of resolving data quality issues in performance
measurement is to focus on metrics that has some real business value. This means that
validation of metrics whether they are vanity metrics or actionable metrics needs to be
evaluated first; for example, reports showing metrics which are not actionable do not
create business value (Ries 2011, 143-144). Data collected for the vanity metrics crea-
tion is sometimes easier to do and therefore might gain popularity in the data gathering
process and reporting area which should be actually stopped. Parmenter (2010, 23)
actually claims that “many management reports are not management tools but merely
memorandum of information”. The point here is that monthly reporting needs to be
combined with weekly and daily view reporting view with actionable metrics in place to
show performance and result indicators leading into actions; quarterly and monthly
reporting does not do that (or the lead time from the measurement period to actions is
too long).
Combining different time frame or innovation views together leads into a requirement
to make the figures comparable. This might mean that data needs to be cleansed and
47
transformed to same place for reporting, and required data semantics reflecting busi-
ness rules needs to be managed to able combined reporting view in different time
frames (Laursen & Thorlund 2010, 170-174). Creating companywide metrics from the
multiple data sources is possible but the tendency is that they just create multiple truths
from multiple data sources and the energy of an organization might go in quarrels
which figures generated by IT reporting system or department are better than others
(Davenport & Harris 2007, 166-167). Despite of the importance of having good quality
data for the business, one must avoid a pitfall of perfectness. Data management and
quality improvement ideas just for sake of its own and expecting high quality targets
everywhere is a killing approach for startups for embedding analytics in business use.
Many highly analytical capable companies still have incomplete data although they have
perfect data governance structures and processes established. (Davenport et al. 2010,
133). It is the usage of data and understanding the decision supported metrics im-
portance that should guide these quality improvements across the business organiza-
tion. Too low and too high quality should be compared with a cost to value (Hubbard
2010, 107-108). The most important thing is to understand correctly the level of con-
sistency expectations from the business side towards quality requirements (Hubbard
2010, 281). This should lead also data quality initiatives both in the business and in ICT
side of a company.
3.6.4 Statistical process control in data quality management
Statistical process control (SPC) is a method of quality control that uses statistical anal-
ysis and methods as the name says. It is about monitoring the execution process and
controlling it. Control charts, also known as process-behavior charts or Shewart charts
named after the inventor Walter Shewart of SPC in early 1920s, can be used to deter-
mine if the business process is in a state of statistical control, meaning, the variance of
the process outcome is in the acceptable tolerance. For data quality management, the
manageable process can be any information process that creates or uses business in-
formation. (Wikipedia 2012_d).
To be able to statistically control the process, control points with quantifiable meas-
urement are needed. This can be managed by using control charts. Control chart has
48
the values of a time series, or sample series if sampling is used, of needed data quality
dimension metric. For example, if the goal is to measure how much of data entered in
a system is non-conformant against specified data quality rules, sample measurement
can be taken and calculation of how many of data points are non-conforming by using
binomial distribution as an assumption if the process is constant. If this will not be the
case, there is a room for improvement of the process. (Loshin 2011, 99-109).
The goal of statistically controlled process management is to create stability and pre-
dictability. As long the data points and data quality measurement regarding these data
points are in the control limits (inside the required tolerance), the process producing
data is stable. If the data is critical for the organization, control charts can be followed
as data quality scorecards. What should followed in this scorecard should be reflected
from the business scorecard performance indicators so that the data needed to calcu-
late business performance is consider as candidates for SPC process of data. (Loshin
2011, 109-113). Control method for data governance can be based on the same ap-
proach as it is used in embedded business analytics of an organization bringing thus
data management together with business management (Davenport et al. 2010, 128-
129).
3.6.5 Data governance
Governance is about management of people to reach defined goals and targets. Data
governance is a specific subject area that needs to be handled as part of other business
operations and management activities. Data governance is management and leadership
process focusing that the needed data for business operations as well as for business
intelligence is in place, meaning, that the data needed in business is available and it ful-
fills the needed defined data quality targets. This applies also to data security policies,
data standards, privacy and accessibility rules. In this way, data governance is not just
the IT department’s task to follow since data management is involved today in every-
thing organizations do; on the other hand if there are no instances looking after it, it
many times means nobody is responsible of it. Therefore companies having analytical
aspirations and having a need and willingness to invest on business intelligence solu-
49
tions should nominate a special group of people to look after data governance as a
special focus area. (Davenport et.al 2010, 35-36).
Data governance principles and execution need top level senior management leader-
ship and commitment. Certain people in a company may have specific data governance
roles. Executive decision makers are responsible of target setting what data is im-
portant for company’s future and what data needs to be managed throughout the
company. Most important data sets as data assets should be also defined by senior
management since it will create need for efforts and resources to manage the data.
(Davenport et al. 2010, 35-36).
Many organizations should nominate also people in the role of data owners or stew-
ards being responsible of particular types of data (e.g. customer, product, or financial
data). These persons should be organizationally responsible and able to steer interpre-
tation of data, its semantics, concepts and their relationship to each other, data quality
requirements as discussed in chapter 3.6.2 including also information protection, priva-
cy control and information life cycle operationally. These stewards and owners should
have data governance responsibility as a professional role beside their normal everyday
work. They should be also persons who support user community by collecting, collat-
ing and handling issues and problems with data, and are able to govern that other peo-
ple follow those principles and rules that are needed to manage data for business usage.
(Loshin 2011, 122-128).
Defining roles is a good starting point when implementing data governance in practice.
In the same time, when roles and people working in those roles also have accountabil-
ity and authority to act according the data governance rules, things start to happen in
reality. Accomplishing data governance should always lead to actionable process con-
trol of data quality as well as an integration to other IT and business governance model
execution. After all, data governance is not about just about IT or business governance
but an alignment effort with those aspects, connected to overall enterprise’s operation-
al quality management frameworks. One of major challenges still is for globally operat-
ing companies to decide how to balance global vs. local aspirations of data manage-
ment and quality controls and operating culture. This requires a companywide policy
50
and understanding of local circumstances towards global guidance. (Weber, Otto &
Österle 2009, 14-23).
3.7 Improving business intelligence data quality capabilities
Depending on the analysis requirements and current data quality maturity level, differ-
ent kind of data quality requirements and development needs can arise. The level of
the analytical stage affects also how well an organization will focus, demand and drive
for data quality improvements. Davenport, Harris and Morison (2010, 21-22) define
the stages in five levels: in the lowest level, organization can be practically analytically
impaired. This means, that the level of data integrity, timeliness and other data quality
dimensions are not in the focus of company’s doings. When the analytical capability
needs increase step by step to localized analytics level (level 2), and furthermore when
analytical aspirations expands to cover companywide aspect to use data across an or-
ganization towards fact-based decision making (level 3), more data quality topics come
onto the agenda of the top management.
As the organization starts to see strategic benefits to use information and knowledge in
a systematic manner on (level 4) and establishes enterprise data warehouse develop-
ment programs to integrate internal and external data sources, data quality becomes a
management topic. Further improvement of a company to become as an analytical
competitor means it starts using analytical capabilities as a competitive advantage. This
promotes establishing a business intelligence competence center as well as having en-
terprise wide data governance in place. It is very important to realize that when aspira-
tions to use analytics increase, data management topics need more focus. This means
that enterprise focus to use data is no longer only in functional silos but to use it across
the company. Leadership, strategic targeting and analyst competence development be-
comes leading drivers also in capability development of a company (Davenport et al.
2010, 23-43).
51
3.8 Supporting business intelligence creation with semantic business
information modeling and ontologies
Creating organizational knowledge and insight of business operations is sometimes a
complicated process in which information is transformed to explicit and tacit
knowledge. Knowledge, unlike information, is about people’s beliefs and commitment.
It is also about people’s required action, which draws a line how much or to what ex-
tent knowledge is needed: no more knowledge is needed than the action requires. De-
pending on the organizational culture, this can be achieved individual level and many
times quite easily; but it can and should also expand through the organization or even
across other organizations (inter-organization knowledge). Knowledge shared across
companies or even human cultures is dependent how people justify their beliefs. It is
also context specific and relational, but it is a conscious decision of people to start to
act for the community, and not just on the individual base (Nonaka & Takeuschi 1995,
56-59).
For knowledge creation, information is a commodity to create understanding, and hav-
ing a meaning attached to the information is crucial. Ontology, based on the infor-
mation and knowledge, is an agreement of an organization or other group of people
about what knowledge is all about and what is the interpretation of concepts and ob-
jects in a business domain or across domains. (Dillon et al. 2008, 7). Without having
agreement of concepts and semantics, it is difficult or sometimes impossible to define
what the organizational knowledge is, and what kind of knowledge is needed for busi-
ness decision making, operations and analytics. This relates also to the willingness to
share and continue sharing this knowledge as part of an organizational culture.
Increasing the validity and coverage of the business information to business users, and
to understand and share knowledge based on the common semantics and ontology is
important also for business intelligence creation. If the business users would have bet-
ter understanding of the semantics and ontology around data warehouses and other
data sources, retrieval and browsing and validating the data would be easier to accom-
plish. Having both data requirements described as conceptual data models, and having
also a presentation of what has been already stored in the data warehouses and data-
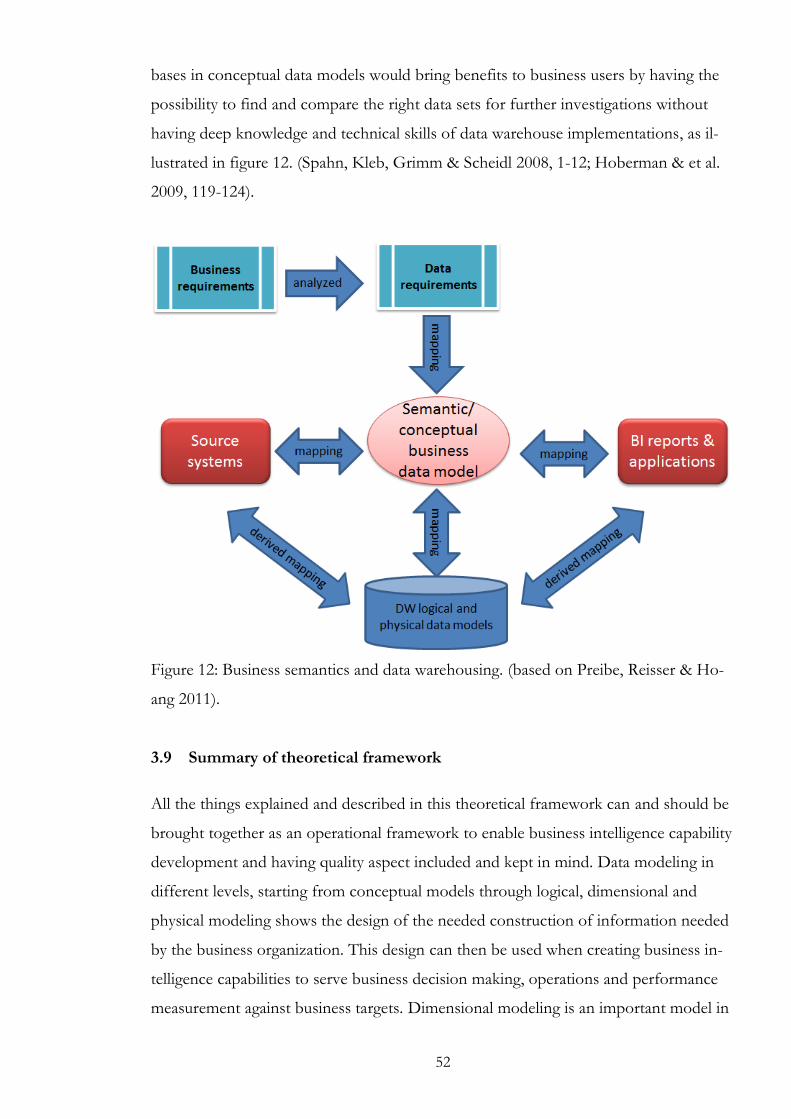
52
bases in conceptual data models would bring benefits to business users by having the
possibility to find and compare the right data sets for further investigations without
having deep knowledge and technical skills of data warehouse implementations, as il-
lustrated in figure 12. (Spahn, Kleb, Grimm & Scheidl 2008, 1-12; Hoberman & et al.
2009, 119-124).
Figure 12: Business semantics and data warehousing. (based on Preibe, Reisser & Ho-
ang 2011).
3.9 Summary of theoretical framework
All the things explained and described in this theoretical framework can and should be
brought together as an operational framework to enable business intelligence capability
development and having quality aspect included and kept in mind. Data modeling in
different levels, starting from conceptual models through logical, dimensional and
physical modeling shows the design of the needed construction of information needed
by the business organization. This design can then be used when creating business in-
telligence capabilities to serve business decision making, operations and performance
measurement against business targets. Dimensional modeling is an important model in
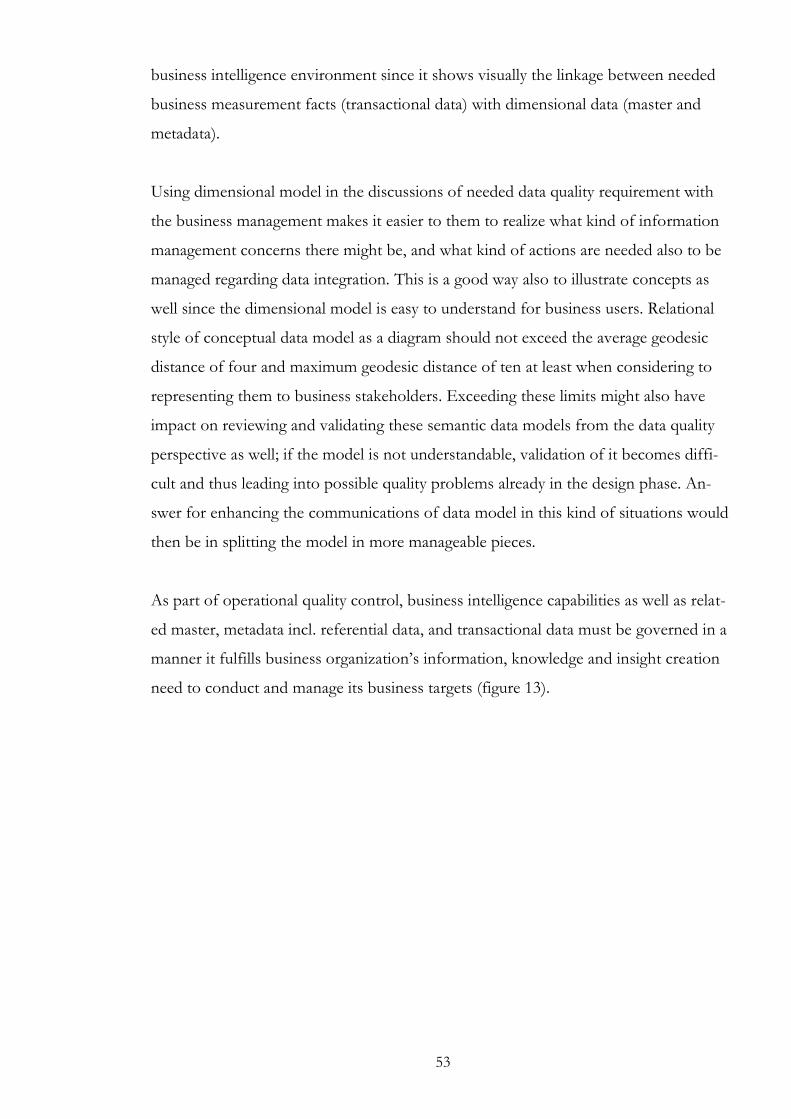
53
business intelligence environment since it shows visually the linkage between needed
business measurement facts (transactional data) with dimensional data (master and
metadata).
Using dimensional model in the discussions of needed data quality requirement with
the business management makes it easier to them to realize what kind of information
management concerns there might be, and what kind of actions are needed also to be
managed regarding data integration. This is a good way also to illustrate concepts as
well since the dimensional model is easy to understand for business users. Relational
style of conceptual data model as a diagram should not exceed the average geodesic
distance of four and maximum geodesic distance of ten at least when considering to
representing them to business stakeholders. Exceeding these limits might also have
impact on reviewing and validating these semantic data models from the data quality
perspective as well; if the model is not understandable, validation of it becomes diffi-
cult and thus leading into possible quality problems already in the design phase. An-
swer for enhancing the communications of data model in this kind of situations would
then be in splitting the model in more manageable pieces.
As part of operational quality control, business intelligence capabilities as well as relat-
ed master, metadata incl. referential data, and transactional data must be governed in a
manner it fulfills business organization’s information, knowledge and insight creation
need to conduct and manage its business targets (figure 13).
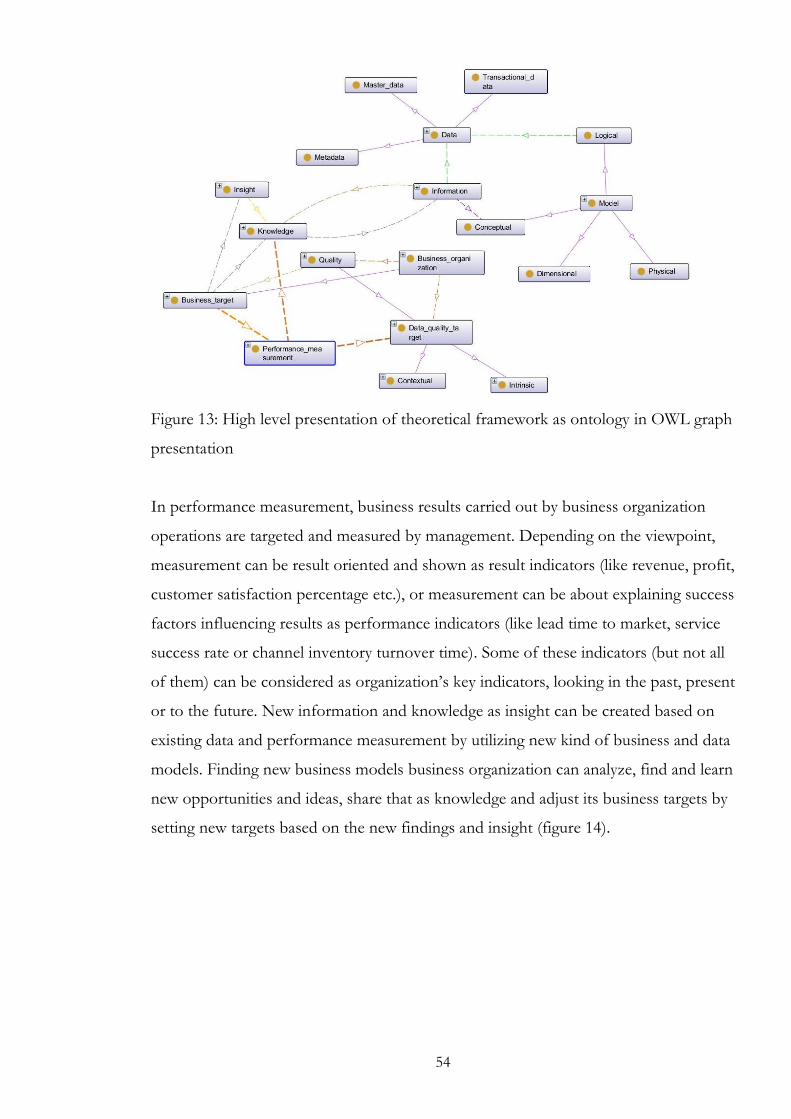
54
Figure 13: High level presentation of theoretical framework as ontology in OWL graph
presentation
In performance measurement, business results carried out by business organization
operations are targeted and measured by management. Depending on the viewpoint,
measurement can be result oriented and shown as result indicators (like revenue, profit,
customer satisfaction percentage etc.), or measurement can be about explaining success
factors influencing results as performance indicators (like lead time to market, service
success rate or channel inventory turnover time). Some of these indicators (but not all
of them) can be considered as organization’s key indicators, looking in the past, present
or to the future. New information and knowledge as insight can be created based on
existing data and performance measurement by utilizing new kind of business and data
models. Finding new business models business organization can analyze, find and learn
new opportunities and ideas, share that as knowledge and adjust its business targets by
setting new targets based on the new findings and insight (figure 14).
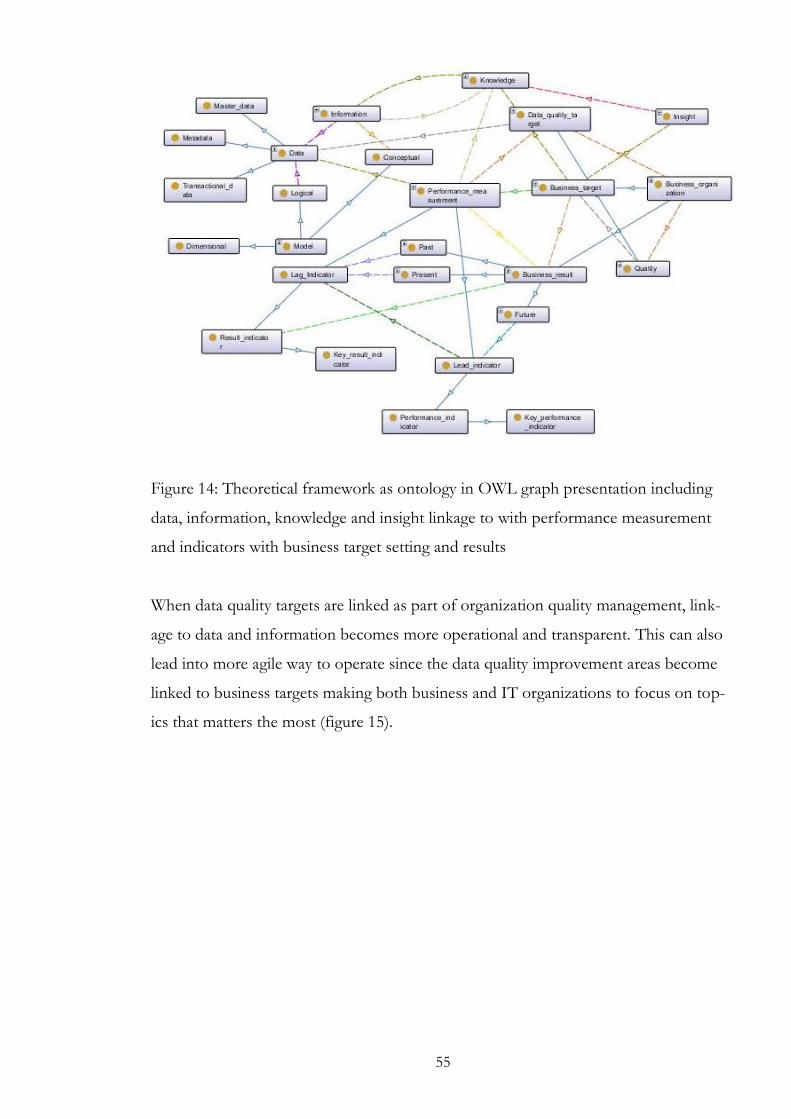
55
Figure 14: Theoretical framework as ontology in OWL graph presentation including
data, information, knowledge and insight linkage to with performance measurement
and indicators with business target setting and results
When data quality targets are linked as part of organization quality management, link-
age to data and information becomes more operational and transparent. This can also
lead into more agile way to operate since the data quality improvement areas become
linked to business targets making both business and IT organizations to focus on top-
ics that matters the most (figure 15).
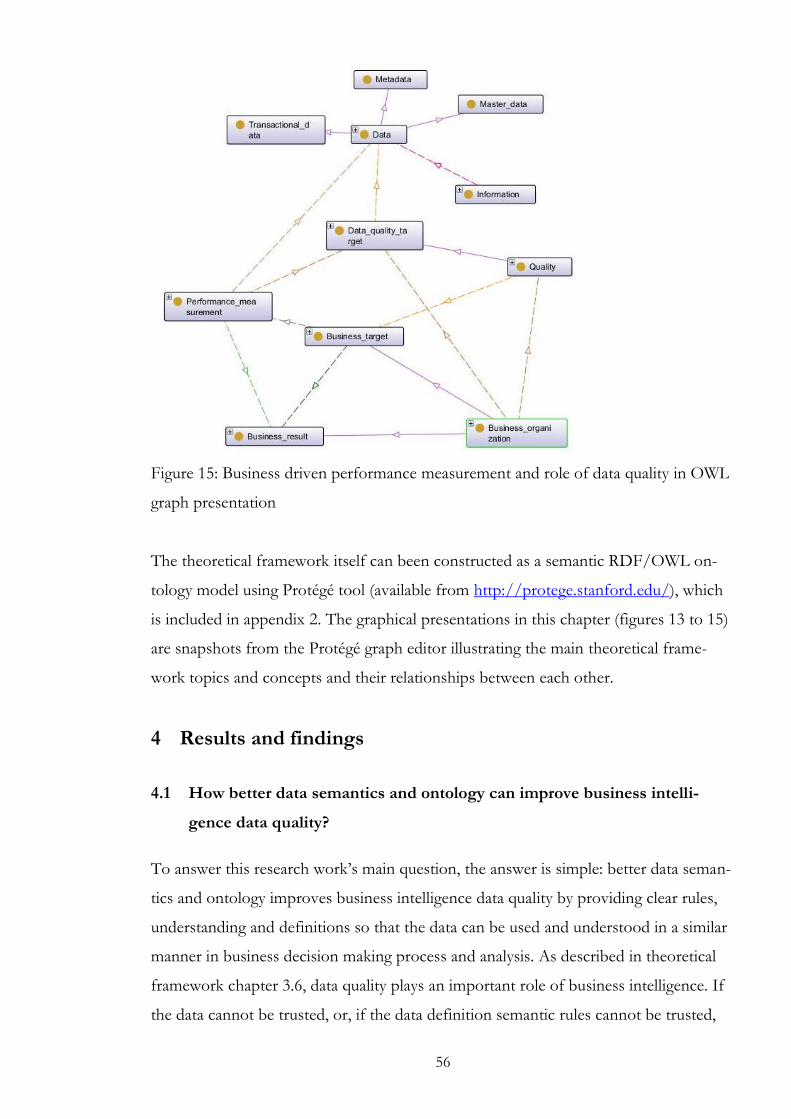
56
Figure 15: Business driven performance measurement and role of data quality in OWL
graph presentation
The theoretical framework itself can been constructed as a semantic RDF/OWL on-
tology model using Protégé tool (available from http://protege.stanford.edu/), which
is included in appendix 2. The graphical presentations in this chapter (figures 13 to 15)
are snapshots from the Protégé graph editor illustrating the main theoretical frame-
work topics and concepts and their relationships between each other.
4 Results and findings
4.1 How better data semantics and ontology can improve business intelli-
gence data quality?
To answer this research work’s main question, the answer is simple: better data seman-
tics and ontology improves business intelligence data quality by providing clear rules,
understanding and definitions so that the data can be used and understood in a similar
manner in business decision making process and analysis. As described in theoretical
framework chapter 3.6, data quality plays an important role of business intelligence. If
the data cannot be trusted, or, if the data definition semantic rules cannot be trusted,
57
the data itself cannot be trusted. Having a good quality of semantics is the first step in
any organization to start data quality improvement. Data profiling analysis of multiple
data sources can give beneficial improvement ideas, but they will just show the dis-
crepancies and variations of the data. Examples presented in the classified empirical
part of this study show that having clear definitions for the data plays a major role to
solve data quality issues not only meaningful for the business intelligence but some-
times for the business itself. Therefore the answer for the research question and as a
proposition is this: those main data entities that are important for the business meas-
urement and analytics should be in the unambiguous semantic level so they do not
cause harm for the business management by allowing misleading interpretations to
happen.
Starting point where to find the key information definitions and to ensure semantic
quality of information entities can be found when analyzing the key performance and
result indicators and related information data sets that are needed to construct those
key metrics. If all indicators are called as ‘key’, then the first thing is to define what is
really ‘key’ and what is not regarding business performance measurement (Parmenter
2010, 8-12). When this is clearer, both business intelligence and analytical teams and
competence centers, if exist, can start the definition work with the help of business
stakeholders and also with IT experts. Those professionals having also data modeling
experience and expertise are needed to define the common vocabulary around critical
business information, to agree on the definitions and structure of the data company-
wide, and to guide how to establish needed governance around the semantics and real
life data to keep it constantly in sync and shape. The task sounds simple but it is not.
In the empirical case study of company X, company had created already data quality
governance ideas and frameworks almost some ten years ago. The problem has been
that business interest in to these ideas has not been in a very high level and they have
not been very well understood always. IT driven data governance ideas have been
adopted, supported and implemented in the past with various level of success and
commitment. This has become problematic since business management has not always
realized the importance of data quality management and hasn’t considered that as part
of a normal business work.
58
Agreeing on common semantics is a difficult task in large corporations. Data quality
programs, MDM initiatives and other information governance activities tend to be dif-
ficult to implement if only IT unit and their departments are driving these activities.
The main reason for this, based on several discussion and personal observations during
the research work and even before that has shown that IT units focusing on data quali-
ty improvements are trying to make world a perfect place to live but are not able to
link target of data quality improvement initiatives to business value targets and benefit
creating actions. This is one of the finding that is aligned with Davenport, Harris &
Morison (2011) analytical capability studies as well and regarding levels of analytical
capabilities development. If the company is not an ultimate analytical data-driven com-
pany, or it has just started to become such a company and being in the beginning of its
analytical journey, then it is obvious that IT driven data governance programs doesn’t
get required focus and buy-in from the business management. The importance of con-
necting data management and data quality initiatives to enterprise level targets, leader-
ship and analytical capability development needs a holistic approach that has to be
adopted by the top management and the need for the improvements should be invent-
ed and led by leadership team members. This takes always its own time. If the leader-
ship commitment is missing, efforts of creating data management and governance de-
velopment projects mostly fail.
One way to bring the topic more practical level would be to link data management and
governance topics directly to company’s KPI and KRI metric development in a way
that required (good enough) data quality issues are covered as part of the performance
management and capability creation, and not as a separate IT driven topic. Also, keep-
ing in mind that since any data quality improvement exercises are multi-year projects
and a learning journey for the whole company, this means that keeping focus on tangi-
ble, short-term benefit and proof-of-business-value creating projects will let the organ-
ization gradually learn and share the benefits of having good quality data. Getting re-
sults early encourages to learn more, and thus to find more benefits.
59
4.1.1 Role of conceptual data modeling in creating better data semantics and
ontology
Modeling is an important way to represent a phenomenon, business events or objects
as defined in chapter 3.4. It plays a major role in communicating concepts, their defini-
tions and relationship in sync. It also simplifies the needed business information land-
scape by leaving out the details so the most important topics and things are only visible
and which can be used for business stakeholder discussions and knowledge sharing
sessions. Conceptual models give also a big picture which is important when business
environment is changing rapidly. Having a broader look on the current and designing
for the target first in a conceptual modeling level makes it easier and faster to see the
change impact as well. It is also politically agnostic since conceptual data models use
business language, and since e.g. technological aspirations are left out from the model
it is easier to discuss and focus only on information topics that matters the most, e.g.
ownership of data and other business process related data quality needs with the busi-
ness stakeholders. Since conceptual model focuses only on business, business users and
stakeholders do not need to feel uncomfortable of not understanding technological
aspects of data management since there are no technological items visible.
For semantics and ontology creation, business driven conceptual model is the ontology
for a business organization when agreed to be taken into use. Without having one,
common language for communication and understanding can become a major obsta-
cle, especially if common companywide efforts are created (like enterprise data ware-
housing or analytics combining more than one business subject areas together). Con-
ceptual data models show and define concepts and their relationships between the
concepts, which is one of the most important things in computer science and data
management area as described in chapter 3.4.8. What comes to data governance, its
role should be to keep the ontology maintained and also ensure it is consistently updat-
ed and approved to be used. Data governance explained in chapter 3.6.5 is not just
about having data values and processes being managed consistently but it is also very
much about keeping concepts and ontology up-to-date as well as including vocabular-
ies and taxonomies. Different taxonomies like product or customer categorizations rely
on the foundation of understandable, shared and approved ontology. If that is missing,
60
the guidance for implementation, shared knowledge and insight based on the
knowledge is difficult. During the case study research work it became clear that in
company X there is room for improvement to focus more on this level of information
modeling, and making respective data governance built around the ontology in place.
This would bring more efficiency in the overall knowledge sharing and insight creation
as well.
4.1.2 Analysis of difficulties to agree semantics and ontology in practice
Several sources of theoretical framework have indicated how difficult it is to agree hav-
ing common semantics in place companywide and agree on the definitions as a com-
mon ontology as described in chapter 3.4.8. Referring to a study made by Karel,
Moore, Coit & Rose (2011), only 17% of organizations rated their current level of or-
ganizational maturity in relation to master data management as a “high” or “very high”
classification in 2011 which was the same percentage of maturity in 2009. External
study results represented by The Data Warehouse Institute (TDWI, www.tdwi.org)
claim that 80% of business users are not capable of making their own queries and re-
ports on the data kept in data warehouse because of the lack of understanding concep-
tually and logically what data is available and where it is in a data warehouse environ-
ment (Preibe, Reisser & Hoang 2011, 766). Although it is of course a question that
how many business users do really need to make their own reports, the key thing still is
that no matter who does the retrieval of data, it needs to be accessible, understandable,
current and fit for the purpose of usage – meeting those data quality dimensions as
necessary described in chapter 3.6.2.
It is not really a surprise that many companies are having difficulties managing the data
and how to make it available consistently. The same have happened in company X.
Therefore initiatives to improve the situation have been started of which this research
is one kind of example. Still, the journey is just about to begin really, despite of having
enterprise data warehouse technically in place for many years. As proposed in this re-
search, the journey of improving business intelligence data quality should start with
having semantics in place, at least the most important ones, and communicate and hav-
ing an agreement to start to use it across the organization.
61
4.2 Data quality linkage to KPI structures and dimensional modeling
Looking on the strategic objectives of company X and their related key result and per-
formance indicators, there is a clear need for business intelligence reporting and analyt-
ic solutions to support creation of holistic measurement across different business sub-
ject areas like marketing, sales and operational planning areas. This kind of progress is
quite generalizable result of this research and which is common overall for many com-
panies nowadays. There is also a clear demand for having product and customer related
performance indicator metrics in place which would mean also that customer and
product data quality should be evaluated against these business result and performance
indicators.
When qualitative metrics are created for performance management to illustrate the
trustworthiness of the indicator data, customer and product master data and related
reference and business metadata becomes important and visible to business stakehold-
ers. Getting more data is not necessarily the right future target but instead collecting
less data but with a good enough quality with clearly defined purpose and meaning,
and using statistical methods like stratified sampling method could be used as a main
data gathering principle. Having semantically consistent business metadata and master
data linkage to transactional data where it makes senses regarding the key business
metrics and analytics would be the starting point for data quality improvements. This
would drive for defining companywide business intelligence implementations using
conformed dimensions around the facts in the whole enterprise.
As mentioned, data quality metrics needs to be linked to business KPI and KRI met-
rics in a way it reflects the essence of the actions they are created for. The problem is
that what are key indicators and what are not is not clearly defined in company X. This
creates also prioritization problem for data quality initiatives where to start data quality
improvements. Nevertheless, this is an activity that needs to be planned and executed
with the top management as discussed in theoretical framework chapter 3.2 since cer-
tain metrics are more important and higher in the hierarchy than others (the closer they
62
are to strategic targets and related critical success factors, the more important they are
for the company).
From the data quality management perspective, information data quality linkage to key
performance and result indicators are beneficial also in a sense it can drive the needed
dimensional data quality (and thus focus on master and metadata needed to be in
shape). These performance indicators with adjacent data quality indicators would be
then analyzed by top management with the help of business analysts to define what the
common business objectives are for the company. Depending on the level of how
much uncertainty is required to be removed for the fact based business decision pro-
cess, this would give also idea of needed data quality. As defined in the theoretical
framework discussing about data quality in chapters 3.6.2 and 3.6.3, data needs to be in
a quality level it meets the requirement to meet the expectation of the business, or as
Cappiello, Francalaci and Pernici (2004, 68) defined it: fitness for use. Because the us-
age scenarios of the data can be various, the overall fitness for data quality needs to be
agreed based on common data dimensions and ontology across the organization. This
is naturally responsibility for business to define the level of fitness and not to be done
IT organization by itself.
If the process described would be systematically applied and followed, in researcher’s
mind it would enable simple and efficient target setting process for IT organization
unit to focus not only on technological matters but really put targets for IT to serve
and provide needed analytical capabilities along with the operational targets to support
daily business. It might also be beneficial way to close the gap between business and IT
as interest groups inside a company also communication wise. With the common se-
mantics using conceptual data models through logical and physical data modeling data
management would also get the needed link to business goals, and the long lasting de-
bate what is the business value of e.g. master data management, data warehousing etc.
would gradually diminish. It would also bring the data management closer to business
activities, and the evidence for having bad or good quality from the information per-
spective would become more visible outside of IT organization. This way business
goals and data quality goals would not be any more two separate things but considered
as one; this would also break the old-fashioned thinking that business goals are for the
63
business people, and data management goals are for IT people only since they should
be a common joint effort and target.
4.3 Improving business intelligence data quality: organizational viewpoint
When motivation to start to improve the data quality areas starts to happen and
increase its focus also for the business, there are lots of theoretical frameworks created
how to go forward with data stewardship, data governance and other related data
management principles and maturity assessment methods. The problem of these kind
of generic frameworks are that there needs to be a business need to make them as
initiatives to fly. Frameworks like The Open Group Architecture Framework
(TOGAF), Control objectives for information and related technology (CoBIT) or
Method for an Integrated Knowledge Environment (Mike 2.0) provide good starting
point for organizations looking for frameworks and having no need to invent the
wheel of governance models and topics by themselves. Frameworks provide guidelines
for implementation but they do not do the work; that’s what the organization needs to
do by itself. Since time is scarce resource, it is important to start with a small quality
improvement project that do not spend time and money too much but gives concrete
benefit and hands-on example of improved things. These kinds of showing-by-
example efforts can build business interests better than preaching of the frameworks
itself to the top management. Framework is not the goal but a tool.
One of the most important organizational development areas for managing data quality
is to arrange data governance as described in the theoretical framework chapter 3.6.5.
Getting the commitment from the top business management level needs to be
established. The semantic level improvement ideas illustrated in this case study should
be managed in these kind of data governance organizational structures where the
highest level of data governance should be steering group with representatives from
different parts of a company, and which are operationally supported by nominated data
stewards from the operational business units.
64
5 Thesis work results discussion
5.1 Conclusion of case study success criteria
In this case study, comprehensive work of creating theoretical framework as well as
data gathering phase about the case of company X was conducted. The case and envi-
ronment of the phenomenon was documented and described, and research study was
connected to business intelligence development program where the findings were giv-
en as an input in an iterative way. Real life examples of data issues with real data was
used in the analysis phase so the empirical observations was based on data that has
been agreed and validated to represent real life cases and situation by different parties
inside an organization.
Since the purpose of the descriptive case study was not to create new theories or com-
pare the case with other cases outside the construct of this study, internal validity target
was more about to cover widely enough the subject area. External validity in a way of
using broad reference and literature materials was very thorough process, and getting
different frameworks, studies, books and articles was investigated to bring a holistic
theoretical framework to guide the study work. Regarding study reliability factors spe-
cial efforts has been put to ensure that researcher’s personal opinions didn’t influenced
in the outcomes of this research but was objectively analyzed based on the case study
material.
Personal observations was done by participating in the activities of business intelli-
gence data quality discussion and improvement projects to ensure reliability and objec-
tiveness of the construct and analysis outcomes of it. From this viewpoint researcher’s
personal opinion is that the results of describing the case, related framework and in-
formation gathering as well as qualitative analysis are on a good solid base. The study
content, illustrated cases and their analysis were also reviewed case by case with key
practitioners during the research work project iteratively.
65
5.2 Personal evaluation of the value of research project
During the research and thesis report writing, research project brought value to busi-
ness intelligence and master data management teams and projects. Research project
was linked in the context of business intelligence development program for sales in-
sight area but also even wider than that. During the exploration phase, communication
of both theoretic framework and case study empirical findings was shared with col-
leagues and development program team members, and iterative discussions about the
matters of data quality, semantics, ontology, data definitions and conceptual data mod-
eling linkage to logical and physical data model implementations were discussed with
other business functions as well.
This study has managed to bring the essence and reasoning of why semantics and hav-
ing good enough data quality is required in business intelligence development area and
how it can be improved from that perspective. These improvements being practical
and small enough can solve real data quality issues. During the thesis work project it
was also highlighted that the goal for data quality improvement is not to have 100%
data quality in every place since it is impossible to reach such a goal and since it costs
too much. Sometimes fit for purpose can be reached with lower data quality targets.
This case study and research work has increased also researcher’s personal knowledge
regarding the research subject area and that way managed to create new knowledge.
This was one the targets and benefit to establish this research project. Research work
and iterative collaboration during thesis work writing has enabled to clarify data quality
problems in the subject area as well as proposing solutions for the identified problems.
This study work have benefitted my personal goals to develop my skills and
knowledge, and have served both the organizational and my personal targets by bring-
ing new approach how to handle semantic data quality.
5.3 Further research topics to be considered
Considering the magnitude of the research subject area, further research might be
needed especially on the ontological implementation side of enterprise data warehous-
ing: how to keep track of consistent definitions, ontology and semantics in general

66
when multiple processes and systems are pushing data to enterprise data warehouse for
analytical purposes. Another subject area to be investigated more could be based on
social sciences and human behavior and how intrinsic and extrinsic motivators work in
the area of quality management. Quality cannot be a separate matter in people’s mind;
you need to grow into it. In principle, when the importance of doing something having
quality perspective in mind is clear and people understand their role in achieving to-
gether, people normally want to do their best - if they know why they need to do so.
This could be another interesting area to investigate and compare how big part these
kind of intrinsic motivators play in the quality management compared to extrinsic mo-
tivators like monetary incentives.
67
Bibliography
Alter, S. 2006. The work system method: connecting people, processes and IT for
business results. Work System Press.
Ambler S. 2006. Data Modeling 101. Readable at address
http://www.agiledata.org/essays/dataModeling101.html.
Baskerville R., Wood-Harper, A. 1996. A critical perspective on action research as a
method for information systems research. Journal of Information Technology, Issue
11.
Cappiello C., Francalaci C., Pernici B. Data quality assessment from the user’s perspec-
tive. 2004. International Workshop on Information Quality in Information Systems
2004 (IQIS'04), ACM Library.
Carr L., Stagnitto J. 2012. Agile data warehouse design: collaborative dimensional
modeling from whiteboard to star schema. DecisionOne Press.
Changing Minds Org. 2012. Readable at address
http://changingminds.org/explanations/research/design/types_validity.htm
Chisholm M. 2012. Big Data and the Coming Conceptual Model Revolution. Infor-
mation Management. Readable at address http://www.information-
management.com/newsletters/data-model-conceptual-big-data-Chisholm-10022303-
1.html.
Codd E.F. 1970. A relational model of data for large shared data banks. Communica-
tions of the ACM. Nr 6, vol. 13.
Davenport, T., Harris, J. 2007. Competing on Analytics. Harvard Business School Se-
ries.
68
Davenport, T., Harris, J., Morison, R. Analytics at Work: Smarter Decisions, Better
Results. 2010. Harvard Business Press.
Dillon T., Chang E., Hadzic M., Wongthongtham P. 2008. Differentiating Conceptual
Modelling from Data Modelling, Knowledge Modelling and Ontology Modelling and a
Notation for Ontology Modelling. 5th Asia-Pacific Conference on Conceptual Model-
ling (APCCM 2008).
Dul J., Hak T. 2008. Case study methodology in business research. Butterworth-
Heinemann.
Gruber, T. 1993. A translation approach to portable ontology specification.
Knowledge System Laboratory, Stanford University.
Hillard R. 2012. Small worlds data transformation measure. Readable at address
http://mike2.openmethodology.org/wiki/Small_Worlds_Data_Transformation_Meas
ure
Hoberman S., Burbank D., Bradley C. 2009. Data modeling for the business. Technics
Publications, LLC.
Hubbard, D. 2010. How to measure anything: Finding the value of “intangibles” in
business., 2nd edition. Wiley.
Hüsemann B., Lechtenbörger J., Vossen G. 2000. Conceptual data warehouse design.
Institut fur Wirtschaftsinformatik.
Inmon,W., Strauss D., Neushloss G. 2008. DW 2.0: The Architecture for the Next
Generation of Data Warehousing. Morgan Kaufman Series in Data Management Sys-
tems.
IT Governance Institute. Control objectives for information and related technology
(CobiT) 4.1 Edition. 2007.
69
Karel R., Moore C., Coit C., Rose S. 2011. Trends 2011: It’s time for the business to
own master data management strategies. Forrester research.
Kimball R. 2012. Design Tip #148 Complementing 3NF EDWs with Dimensional
Presentation Areas. Readable at address
http://www.kimballgroup.com/2012/08/01/design-tip-148-complementing-3nf-
edws-with-dimensional-presentation-areas/
Laamanen, K., Tinnilä, M. 2009. Prosessijohtamisen käsitteet – Terms and concepts in
business process management. Teknologiateollisuus ry.
Laursen G., Thorlund J. 2010. Business Analytics for managers. Taking Business intel-
ligence beyond reporting. Wiley.
Lee, Y. W. 2004. Crafting rules: Context-reflective data quality problem solving. Jour-
nal of Management Information Systems. Issue 20, 93–119.
Linoff G., Berry M. 2011. Data mining techniques for marketing, sales and customer
relationship management. Wiley.
Loshin, David. 2009. Master data management. Knowledge Integrity Inc, Elsevier.
Loshin, David. 2011. The Practitioner’s guide to data quality improvement. Elsevier.
Madnick S., Wang R., Yang W., Zhu H. 2009. Overview and Framework for Data and
Information Quality Research. Journal of Data and Information Quality, Volume 1
Issue 1, June 2009.
Masayna V., Koronios A., Gao J., Gendron M. Data quality and KPIS: A Link to be
established. 2007. The 2nd World Congress on Engineering Asset Management
(EAM).
70
Metsämuuronen, J. 2008. Laadullisen tutkimuksen perusteet. Gummerus.
Milgram S. 1967. The Small-world problem. Psychology Today, May 1967.
Nonaka I., Takeuchi H. 1995. The Knowledge creating company: how Japanese com-
panies create the dynamics of innovation. Oxford University Press.
Parmenter D. 2010. Key performance indicators: developing, implementing and using
winning KPIs. 2nd edition. Wiley.
Priebe T., Reisser A., Hoang D. 2011. Reinventing the Wheel?! Why Harmonization
and reuse fail in complex data warehouse environments and a proposed solution to the
problem. 10th International Conference on Wirtschaftsinformatik
Ries E. 2011. The lean startup. Portfolio Penguin.
Routio, P. 2007. Tapaustutkimus. Readable also at address
http://www2.uiah.fi/projekti/metodi/071.htm.
Serra J. 2012. Data Warehouse Architecture – Kimball and Inmon methodologies.
Readable at address http://www.kimballgroup.com/2012/08/01/design-tip-148-
complementing-3nf-edws-with-dimensional-presentation-areas/
Shannon C. 2001. Mathematical theory of communication. Mobile Computing and
Communications Review, Volume 5, Number 1
Silverstone L., Agnew P. 2009. The Data Model Resource Book, Volume 3: Universal
Patterns for Data Modeling. Wiley.
Spahn M., Kleb J., Grimm S., Scheidl S. 2008. Supporting Business Intelligence by
Providing Ontology-Based End-User Information Self-Service. ACM Library. OBI’08
Conference, October 27, 2008, Karlsruhe, Germany.
71
Takki P. 1999. Atk-sopimukset, käytännön käsikirja. Kauppakaari.
Teräväinen H. 2011. Case Study Research. A-36.3326 Tutkimusmetodologia. Aalto
University.
Wand Y., Wang R. Anchoring data quality dimensions in ontological foundations.
Communications of the ACM. November 1996/Vol. 39, No. 11.
Wang, R.Y. A Product Perspective on Total Data Quality Management. Communica-
tions of the ACM, 41, 2 (February 1998).
Watts S., Shankaranarayanan G., Even A. 2009. Data quality assessment in context: A
cognitive perspective. Journal of Desicision Support Systems, Issue 48, 202-211, Else-
vier
Weber, K., Otto B., Österle H. 2009. One size does not fit all – a contingency ap-
proach to data governance. ACM Journal of Data and Information Quality, vol.1, no.
1, article 4.
Video of Parmenter D. 2010. Key performance indicators developing, implementing
and using winning KPIs. 2nd edition. Wiley. Readable and visibile at address
http://www.amazon.com/Key-Performance-Indicators-KPI-
Implementing/dp/0470545151/ref=sr_1_1?ie=UTF8&qid=1346438758&sr=8-
1&keywords=parmenter
Wikipedia 2012_c. Ontology (information science). Readable at address
http://en.wikipedia.org/wiki/Ontology_%28information_science%29
Wikipedia 2012_d. Statistical process control. Readable at address
http://en.wikipedia.org/wiki/Statistical_process_control
Wikipedia 2012_e. Six Sigma. Readable at address
http://en.wikipedia.org/wiki/Six_Sigma

72
Yin, R.K., 2009. Case Study Research. Design and methods. 4th edition. Sage.
73
6 Attachments
6.1 Attachment 1: Theoretical framework as RDF/OWL presentation
<?xml version="1.0"?>
<!DOCTYPE rdf:RDF [
<!ENTITY owl "http://www.w3.org/2002/07/owl#" >
<!ENTITY xsd "http://www.w3.org/2001/XMLSchema#" >
<!ENTITY rdfs "http://www.w3.org/2000/01/rdf-schema#" >
<!ENTITY rdf "http://www.w3.org/1999/02/22-rdf-syntax-ns#" >
]>
<rdf:RDF xmlns="http://www.haaga-helia.fi/ONT_Ari_Anturaniemi#"
xml:base="http://www.haaga-helia.fi/ONT_Ari_Anturaniemi"
xmlns:rdfs="http://www.w3.org/2000/01/rdf-schema#"
xmlns:owl="http://www.w3.org/2002/07/owl#"
xmlns:xsd="http://www.w3.org/2001/XMLSchema#"
xmlns:rdf="http://www.w3.org/1999/02/22-rdf-syntax-ns#">
<owl:Ontology rdf:about="http://www.haaga-
helia.fi/ONT_Ari_Anturaniemi"/>
<!--
//////////////////////////////////////////////////////////////////
/////////////////////
//
// Object Properties
//
//////////////////////////////////////////////////////////////////
/////////////////////
-->
<!-- http://www.haaga-helia.fi/ONT_Ari_Anturaniemi#affect_to -
->
<owl:ObjectProperty rdf:about="http://www.haaga-
helia.fi/ONT_Ari_Anturaniemi#affect_to"/>
<!-- http://www.haaga-helia.fi/ONT_Ari_Anturaniemi#creates -->
<owl:ObjectProperty rdf:about="http://www.haaga-
helia.fi/ONT_Ari_Anturaniemi#creates"/>
74
<!-- http://www.haaga-helia.fi/ONT_Ari_Anturaniemi#defines -->
<owl:ObjectProperty rdf:about="http://www.haaga-
helia.fi/ONT_Ari_Anturaniemi#defines">
<rdfs:subPropertyOf
rdf:resource="&owl;topObjectProperty"/>
</owl:ObjectProperty>
<!-- http://www.haaga-helia.fi/ONT_Ari_Anturaniemi#executes --
>
<owl:ObjectProperty rdf:about="http://www.haaga-
helia.fi/ONT_Ari_Anturaniemi#executes"/>
<!-- http://www.haaga-helia.fi/ONT_Ari_Anturaniemi#explains --
>
<owl:ObjectProperty rdf:about="http://www.haaga-
helia.fi/ONT_Ari_Anturaniemi#explains"/>
<!-- http://www.haaga-helia.fi/ONT_Ari_Anturaniemi#follows_up
-->
<owl:ObjectProperty rdf:about="http://www.haaga-
helia.fi/ONT_Ari_Anturaniemi#follows_up"/>
<!-- http://www.haaga-helia.fi/ONT_Ari_Anturaniemi#has -->
<owl:ObjectProperty rdf:about="http://www.haaga-
helia.fi/ONT_Ari_Anturaniemi#has"/>
<!-- http://www.haaga-helia.fi/ONT_Ari_Anturaniemi#is_a -->
<owl:ObjectProperty rdf:about="http://www.haaga-
helia.fi/ONT_Ari_Anturaniemi#is_a">
<rdfs:subPropertyOf
rdf:resource="&owl;topObjectProperty"/>
</owl:ObjectProperty>
<!-- http://www.haaga-
helia.fi/ONT_Ari_Anturaniemi#is_compared_to -->
75
<owl:ObjectProperty rdf:about="http://www.haaga-
helia.fi/ONT_Ari_Anturaniemi#is_compared_to"/>
<!-- http://www.haaga-helia.fi/ONT_Ari_Anturaniemi#is_created
-->
<owl:ObjectProperty rdf:about="http://www.haaga-
helia.fi/ONT_Ari_Anturaniemi#is_created"/>
<!-- http://www.haaga-
helia.fi/ONT_Ari_Anturaniemi#is_created_from -->
<owl:ObjectProperty rdf:about="http://www.haaga-
helia.fi/ONT_Ari_Anturaniemi#is_created_from"/>
<!-- http://www.haaga-
helia.fi/ONT_Ari_Anturaniemi#is_defined_against -->
<owl:ObjectProperty rdf:about="http://www.haaga-
helia.fi/ONT_Ari_Anturaniemi#is_defined_against"/>
<!-- http://www.haaga-
helia.fi/ONT_Ari_Anturaniemi#is_estimated -->
<owl:ObjectProperty rdf:about="http://www.haaga-
helia.fi/ONT_Ari_Anturaniemi#is_estimated">
<rdfs:subPropertyOf
rdf:resource="&owl;topObjectProperty"/>
</owl:ObjectProperty>
<!-- http://www.haaga-
helia.fi/ONT_Ari_Anturaniemi#is_executed_as -->
<owl:ObjectProperty rdf:about="http://www.haaga-
helia.fi/ONT_Ari_Anturaniemi#is_executed_as"/>
<!-- http://www.haaga-
helia.fi/ONT_Ari_Anturaniemi#is_managed_by -->
<owl:ObjectProperty rdf:about="http://www.haaga-
helia.fi/ONT_Ari_Anturaniemi#is_managed_by"/>
76
<!-- http://www.haaga-helia.fi/ONT_Ari_Anturaniemi#is_measured
-->
<owl:ObjectProperty rdf:about="http://www.haaga-
helia.fi/ONT_Ari_Anturaniemi#is_measured"/>
<!-- http://www.haaga-
helia.fi/ONT_Ari_Anturaniemi#is_modeled_as -->
<owl:ObjectProperty rdf:about="http://www.haaga-
helia.fi/ONT_Ari_Anturaniemi#is_modeled_as"/>
<!-- http://www.haaga-
helia.fi/ONT_Ari_Anturaniemi#is_planned_as -->
<owl:ObjectProperty rdf:about="http://www.haaga-
helia.fi/ONT_Ari_Anturaniemi#is_planned_as"/>
<!-- http://www.haaga-
helia.fi/ONT_Ari_Anturaniemi#is_related_to -->
<owl:ObjectProperty rdf:about="http://www.haaga-
helia.fi/ONT_Ari_Anturaniemi#is_related_to"/>
<!-- http://www.haaga-helia.fi/ONT_Ari_Anturaniemi#is_shared -
->
<owl:ObjectProperty rdf:about="http://www.haaga-
helia.fi/ONT_Ari_Anturaniemi#is_shared"/>
<!-- http://www.haaga-helia.fi/ONT_Ari_Anturaniemi#makes -->
<owl:ObjectProperty rdf:about="http://www.haaga-
helia.fi/ONT_Ari_Anturaniemi#makes"/>
<!-- http://www.haaga-helia.fi/ONT_Ari_Anturaniemi#measures --
>
<owl:ObjectProperty rdf:about="http://www.haaga-
helia.fi/ONT_Ari_Anturaniemi#measures"/>
<!-- http://www.haaga-helia.fi/ONT_Ari_Anturaniemi#sets -->
77
<owl:ObjectProperty rdf:about="http://www.haaga-
helia.fi/ONT_Ari_Anturaniemi#sets"/>
<!-- http://www.haaga-helia.fi/ONT_Ari_Anturaniemi#uses -->
<owl:ObjectProperty rdf:about="http://www.haaga-
helia.fi/ONT_Ari_Anturaniemi#uses"/>
<!--
//////////////////////////////////////////////////////////////////
/////////////////////
//
// Classes
//
//////////////////////////////////////////////////////////////////
/////////////////////
-->
<!-- http://www.haaga-helia.fi/ONT_Ari_Anturaniemi#Action -->
<owl:Class rdf:about="http://www.haaga-
helia.fi/ONT_Ari_Anturaniemi#Action">
<rdfs:subClassOf rdf:resource="http://www.haaga-
helia.fi/ONT_Ari_Anturaniemi#Operations"/>
<rdfs:subClassOf>
<owl:Restriction>
<owl:onProperty rdf:resource="http://www.haaga-
helia.fi/ONT_Ari_Anturaniemi#affect_to"/>
<owl:someValuesFrom
rdf:resource="http://www.haaga-
helia.fi/ONT_Ari_Anturaniemi#Business_result"/>
</owl:Restriction>
</rdfs:subClassOf>
</owl:Class>
<!-- http://www.haaga-
helia.fi/ONT_Ari_Anturaniemi#Business_organization -->
<owl:Class rdf:about="http://www.haaga-
helia.fi/ONT_Ari_Anturaniemi#Business_organization">
<rdfs:subClassOf>
<owl:Restriction>
<owl:onProperty rdf:resource="http://www.haaga-
helia.fi/ONT_Ari_Anturaniemi#has"/>
78
<owl:someValuesFrom
rdf:resource="http://www.haaga-
helia.fi/ONT_Ari_Anturaniemi#Quality"/>
</owl:Restriction>
</rdfs:subClassOf>
<rdfs:subClassOf>
<owl:Restriction>
<owl:onProperty rdf:resource="http://www.haaga-
helia.fi/ONT_Ari_Anturaniemi#has"/>
<owl:someValuesFrom
rdf:resource="http://www.haaga-
helia.fi/ONT_Ari_Anturaniemi#Data_quality_target"/>
</owl:Restriction>
</rdfs:subClassOf>
</owl:Class>
<!-- http://www.haaga-
helia.fi/ONT_Ari_Anturaniemi#Business_result -->
<owl:Class rdf:about="http://www.haaga-
helia.fi/ONT_Ari_Anturaniemi#Business_result">
<rdfs:subClassOf rdf:resource="http://www.haaga-
helia.fi/ONT_Ari_Anturaniemi#Business_organization"/>
<rdfs:subClassOf>
<owl:Restriction>
<owl:onProperty rdf:resource="http://www.haaga-
helia.fi/ONT_Ari_Anturaniemi#is_measured"/>
<owl:someValuesFrom
rdf:resource="http://www.haaga-
helia.fi/ONT_Ari_Anturaniemi#Result_indicator"/>
</owl:Restriction>
</rdfs:subClassOf>
</owl:Class>
<!-- http://www.haaga-
helia.fi/ONT_Ari_Anturaniemi#Business_target -->
<owl:Class rdf:about="http://www.haaga-
helia.fi/ONT_Ari_Anturaniemi#Business_target">
<rdfs:subClassOf rdf:resource="http://www.haaga-
helia.fi/ONT_Ari_Anturaniemi#Business_organization"/>
<rdfs:subClassOf>
<owl:Restriction>
<owl:onProperty rdf:resource="http://www.haaga-
helia.fi/ONT_Ari_Anturaniemi#is_compared_to"/>
<owl:someValuesFrom
rdf:resource="http://www.haaga-
helia.fi/ONT_Ari_Anturaniemi#Business_result"/>
</owl:Restriction>
</rdfs:subClassOf>
<rdfs:subClassOf>
<owl:Restriction>
79
<owl:onProperty rdf:resource="http://www.haaga-
helia.fi/ONT_Ari_Anturaniemi#uses"/>
<owl:someValuesFrom
rdf:resource="http://www.haaga-
helia.fi/ONT_Ari_Anturaniemi#Insight"/>
</owl:Restriction>
</rdfs:subClassOf>
<rdfs:subClassOf>
<owl:Restriction>
<owl:onProperty rdf:resource="http://www.haaga-
helia.fi/ONT_Ari_Anturaniemi#is_measured"/>
<owl:someValuesFrom
rdf:resource="http://www.haaga-
helia.fi/ONT_Ari_Anturaniemi#Performance_measurement"/>
</owl:Restriction>
</rdfs:subClassOf>
<rdfs:subClassOf>
<owl:Restriction>
<owl:onProperty rdf:resource="http://www.haaga-
helia.fi/ONT_Ari_Anturaniemi#uses"/>
<owl:someValuesFrom
rdf:resource="http://www.haaga-
helia.fi/ONT_Ari_Anturaniemi#Knowledge"/>
</owl:Restriction>
</rdfs:subClassOf>
<rdfs:subClassOf>
<owl:Restriction>
<owl:onProperty rdf:resource="http://www.haaga-
helia.fi/ONT_Ari_Anturaniemi#is_managed_by"/>
<owl:someValuesFrom
rdf:resource="http://www.haaga-
helia.fi/ONT_Ari_Anturaniemi#Management"/>
</owl:Restriction>
</rdfs:subClassOf>
</owl:Class>
<!-- http://www.haaga-helia.fi/ONT_Ari_Anturaniemi#Conceptual
-->
<owl:Class rdf:about="http://www.haaga-
helia.fi/ONT_Ari_Anturaniemi#Conceptual">
<rdfs:subClassOf rdf:resource="http://www.haaga-
helia.fi/ONT_Ari_Anturaniemi#Model"/>
</owl:Class>
<!-- http://www.haaga-helia.fi/ONT_Ari_Anturaniemi#Contextual
-->
<owl:Class rdf:about="http://www.haaga-
helia.fi/ONT_Ari_Anturaniemi#Contextual">
<rdfs:subClassOf rdf:resource="http://www.haaga-
helia.fi/ONT_Ari_Anturaniemi#Data_quality_target"/>
</owl:Class>
80
<!-- http://www.haaga-helia.fi/ONT_Ari_Anturaniemi#Data -->
<owl:Class rdf:about="http://www.haaga-
helia.fi/ONT_Ari_Anturaniemi#Data">
<rdfs:subClassOf rdf:resource="&owl;Thing"/>
</owl:Class>
<!-- http://www.haaga-
helia.fi/ONT_Ari_Anturaniemi#Data_quality_target -->
<owl:Class rdf:about="http://www.haaga-
helia.fi/ONT_Ari_Anturaniemi#Data_quality_target">
<rdfs:subClassOf rdf:resource="http://www.haaga-
helia.fi/ONT_Ari_Anturaniemi#Quality"/>
<rdfs:subClassOf>
<owl:Restriction>
<owl:onProperty rdf:resource="http://www.haaga-
helia.fi/ONT_Ari_Anturaniemi#is_related_to"/>
<owl:someValuesFrom
rdf:resource="http://www.haaga-
helia.fi/ONT_Ari_Anturaniemi#Data"/>
</owl:Restriction>
</rdfs:subClassOf>
</owl:Class>
<!-- http://www.haaga-helia.fi/ONT_Ari_Anturaniemi#Decision --
>
<owl:Class rdf:about="http://www.haaga-
helia.fi/ONT_Ari_Anturaniemi#Decision">
<rdfs:subClassOf rdf:resource="http://www.haaga-
helia.fi/ONT_Ari_Anturaniemi#Management"/>
<rdfs:subClassOf>
<owl:Restriction>
<owl:onProperty rdf:resource="http://www.haaga-
helia.fi/ONT_Ari_Anturaniemi#affect_to"/>
<owl:someValuesFrom
rdf:resource="http://www.haaga-
helia.fi/ONT_Ari_Anturaniemi#Operations"/>
</owl:Restriction>
</rdfs:subClassOf>
<rdfs:subClassOf>
<owl:Restriction>
<owl:onProperty rdf:resource="http://www.haaga-
helia.fi/ONT_Ari_Anturaniemi#uses"/>
<owl:someValuesFrom
rdf:resource="http://www.haaga-
helia.fi/ONT_Ari_Anturaniemi#Insight"/>
</owl:Restriction>
</rdfs:subClassOf>
81
<rdfs:subClassOf>
<owl:Restriction>
<owl:onProperty rdf:resource="http://www.haaga-
helia.fi/ONT_Ari_Anturaniemi#uses"/>
<owl:someValuesFrom
rdf:resource="http://www.haaga-
helia.fi/ONT_Ari_Anturaniemi#Performance_measurement"/>
</owl:Restriction>
</rdfs:subClassOf>
</owl:Class>
<!-- http://www.haaga-helia.fi/ONT_Ari_Anturaniemi#Dimensional
-->
<owl:Class rdf:about="http://www.haaga-
helia.fi/ONT_Ari_Anturaniemi#Dimensional">
<rdfs:subClassOf rdf:resource="http://www.haaga-
helia.fi/ONT_Ari_Anturaniemi#Model"/>
</owl:Class>
<!-- http://www.haaga-
helia.fi/ONT_Ari_Anturaniemi#Executed_action -->
<owl:Class rdf:about="http://www.haaga-
helia.fi/ONT_Ari_Anturaniemi#Executed_action">
<rdfs:subClassOf rdf:resource="http://www.haaga-
helia.fi/ONT_Ari_Anturaniemi#Action"/>
<rdfs:subClassOf>
<owl:Restriction>
<owl:onProperty rdf:resource="http://www.haaga-
helia.fi/ONT_Ari_Anturaniemi#is_related_to"/>
<owl:someValuesFrom
rdf:resource="http://www.haaga-
helia.fi/ONT_Ari_Anturaniemi#Present"/>
</owl:Restriction>
</rdfs:subClassOf>
<rdfs:subClassOf>
<owl:Restriction>
<owl:onProperty rdf:resource="http://www.haaga-
helia.fi/ONT_Ari_Anturaniemi#is_related_to"/>
<owl:someValuesFrom
rdf:resource="http://www.haaga-
helia.fi/ONT_Ari_Anturaniemi#Past"/>
</owl:Restriction>
</rdfs:subClassOf>
</owl:Class>
<!-- http://www.haaga-helia.fi/ONT_Ari_Anturaniemi#Future -->
<owl:Class rdf:about="http://www.haaga-
helia.fi/ONT_Ari_Anturaniemi#Future">
82
<rdfs:subClassOf rdf:resource="http://www.haaga-
helia.fi/ONT_Ari_Anturaniemi#Business_result"/>
<rdfs:subClassOf>
<owl:Restriction>
<owl:onProperty rdf:resource="http://www.haaga-
helia.fi/ONT_Ari_Anturaniemi#is_estimated"/>
<owl:someValuesFrom
rdf:resource="http://www.haaga-
helia.fi/ONT_Ari_Anturaniemi#Lead_indicator"/>
</owl:Restriction>
</rdfs:subClassOf>
</owl:Class>
<!-- http://www.haaga-helia.fi/ONT_Ari_Anturaniemi#Information
-->
<owl:Class rdf:about="http://www.haaga-
helia.fi/ONT_Ari_Anturaniemi#Information">
<rdfs:subClassOf rdf:resource="&owl;Thing"/>
<rdfs:subClassOf>
<owl:Restriction>
<owl:onProperty rdf:resource="http://www.haaga-
helia.fi/ONT_Ari_Anturaniemi#is_modeled_as"/>
<owl:someValuesFrom
rdf:resource="http://www.haaga-
helia.fi/ONT_Ari_Anturaniemi#Conceptual"/>
</owl:Restriction>
</rdfs:subClassOf>
<rdfs:subClassOf>
<owl:Restriction>
<owl:onProperty rdf:resource="http://www.haaga-
helia.fi/ONT_Ari_Anturaniemi#creates"/>
<owl:someValuesFrom
rdf:resource="http://www.haaga-
helia.fi/ONT_Ari_Anturaniemi#Knowledge"/>
</owl:Restriction>
</rdfs:subClassOf>
<rdfs:subClassOf>
<owl:Restriction>
<owl:onProperty rdf:resource="http://www.haaga-
helia.fi/ONT_Ari_Anturaniemi#defines"/>
<owl:someValuesFrom
rdf:resource="http://www.haaga-
helia.fi/ONT_Ari_Anturaniemi#Data"/>
</owl:Restriction>
</rdfs:subClassOf>
</owl:Class>
<!-- http://www.haaga-helia.fi/ONT_Ari_Anturaniemi#Insight -->
<owl:Class rdf:about="http://www.haaga-
helia.fi/ONT_Ari_Anturaniemi#Insight">
<rdfs:subClassOf rdf:resource="&owl;Thing"/>
83
<rdfs:subClassOf>
<owl:Restriction>
<owl:onProperty rdf:resource="http://www.haaga-
helia.fi/ONT_Ari_Anturaniemi#is_created_from"/>
<owl:someValuesFrom
rdf:resource="http://www.haaga-
helia.fi/ONT_Ari_Anturaniemi#Knowledge"/>
</owl:Restriction>
</rdfs:subClassOf>
</owl:Class>
<!-- http://www.haaga-helia.fi/ONT_Ari_Anturaniemi#Intrinsic -
->
<owl:Class rdf:about="http://www.haaga-
helia.fi/ONT_Ari_Anturaniemi#Intrinsic">
<rdfs:subClassOf rdf:resource="http://www.haaga-
helia.fi/ONT_Ari_Anturaniemi#Data_quality_target"/>
</owl:Class>
<!-- http://www.haaga-
helia.fi/ONT_Ari_Anturaniemi#Key_performance_indicator -->
<owl:Class rdf:about="http://www.haaga-
helia.fi/ONT_Ari_Anturaniemi#Key_performance_indicator">
<rdfs:subClassOf rdf:resource="http://www.haaga-
helia.fi/ONT_Ari_Anturaniemi#Performance_indicator"/>
</owl:Class>
<!-- http://www.haaga-
helia.fi/ONT_Ari_Anturaniemi#Key_result_indicator -->
<owl:Class rdf:about="http://www.haaga-
helia.fi/ONT_Ari_Anturaniemi#Key_result_indicator">
<rdfs:subClassOf rdf:resource="http://www.haaga-
helia.fi/ONT_Ari_Anturaniemi#Result_indicator"/>
</owl:Class>
<!-- http://www.haaga-helia.fi/ONT_Ari_Anturaniemi#Knowledge -
->
<owl:Class rdf:about="http://www.haaga-
helia.fi/ONT_Ari_Anturaniemi#Knowledge">
<rdfs:subClassOf>
<owl:Restriction>
<owl:onProperty rdf:resource="http://www.haaga-
helia.fi/ONT_Ari_Anturaniemi#uses"/>
84
<owl:someValuesFrom
rdf:resource="http://www.haaga-
helia.fi/ONT_Ari_Anturaniemi#Information"/>
</owl:Restriction>
</rdfs:subClassOf>
</owl:Class>
<!-- http://www.haaga-
helia.fi/ONT_Ari_Anturaniemi#Lag_Indicator -->
<owl:Class rdf:about="http://www.haaga-
helia.fi/ONT_Ari_Anturaniemi#Lag_Indicator">
<rdfs:subClassOf rdf:resource="http://www.haaga-
helia.fi/ONT_Ari_Anturaniemi#Performance_measurement"/>
</owl:Class>
<!-- http://www.haaga-
helia.fi/ONT_Ari_Anturaniemi#Lead_indicator -->
<owl:Class rdf:about="http://www.haaga-
helia.fi/ONT_Ari_Anturaniemi#Lead_indicator">
<rdfs:subClassOf rdf:resource="http://www.haaga-
helia.fi/ONT_Ari_Anturaniemi#Performance_measurement"/>
<rdfs:subClassOf>
<owl:Restriction>
<owl:onProperty rdf:resource="http://www.haaga-
helia.fi/ONT_Ari_Anturaniemi#explains"/>
<owl:someValuesFrom
rdf:resource="http://www.haaga-
helia.fi/ONT_Ari_Anturaniemi#Lag_Indicator"/>
</owl:Restriction>
</rdfs:subClassOf>
</owl:Class>
<!-- http://www.haaga-helia.fi/ONT_Ari_Anturaniemi#Logical -->
<owl:Class rdf:about="http://www.haaga-
helia.fi/ONT_Ari_Anturaniemi#Logical">
<rdfs:subClassOf rdf:resource="http://www.haaga-
helia.fi/ONT_Ari_Anturaniemi#Model"/>
<rdfs:subClassOf>
<owl:Restriction>
<owl:onProperty rdf:resource="http://www.haaga-
helia.fi/ONT_Ari_Anturaniemi#defines"/>
<owl:someValuesFrom
rdf:resource="http://www.haaga-
helia.fi/ONT_Ari_Anturaniemi#Data"/>
</owl:Restriction>
</rdfs:subClassOf>
</owl:Class>
85
<!-- http://www.haaga-helia.fi/ONT_Ari_Anturaniemi#Management
-->
<owl:Class rdf:about="http://www.haaga-
helia.fi/ONT_Ari_Anturaniemi#Management">
<rdfs:subClassOf rdf:resource="http://www.haaga-
helia.fi/ONT_Ari_Anturaniemi#Business_organization"/>
<rdfs:subClassOf>
<owl:Restriction>
<owl:onProperty rdf:resource="http://www.haaga-
helia.fi/ONT_Ari_Anturaniemi#sets"/>
<owl:someValuesFrom
rdf:resource="http://www.haaga-
helia.fi/ONT_Ari_Anturaniemi#Business_target"/>
</owl:Restriction>
</rdfs:subClassOf>
</owl:Class>
<!-- http://www.haaga-helia.fi/ONT_Ari_Anturaniemi#Master_data
-->
<owl:Class rdf:about="http://www.haaga-
helia.fi/ONT_Ari_Anturaniemi#Master_data">
<rdfs:subClassOf rdf:resource="http://www.haaga-
helia.fi/ONT_Ari_Anturaniemi#Data"/>
</owl:Class>
<!-- http://www.haaga-helia.fi/ONT_Ari_Anturaniemi#Metadata --
>
<owl:Class rdf:about="http://www.haaga-
helia.fi/ONT_Ari_Anturaniemi#Metadata">
<rdfs:subClassOf rdf:resource="http://www.haaga-
helia.fi/ONT_Ari_Anturaniemi#Data"/>
</owl:Class>
<!-- http://www.haaga-helia.fi/ONT_Ari_Anturaniemi#Model -->
<owl:Class rdf:about="http://www.haaga-
helia.fi/ONT_Ari_Anturaniemi#Model"/>
<!-- http://www.haaga-helia.fi/ONT_Ari_Anturaniemi#Operations
-->
<owl:Class rdf:about="http://www.haaga-
helia.fi/ONT_Ari_Anturaniemi#Operations">
86
<rdfs:subClassOf rdf:resource="http://www.haaga-
helia.fi/ONT_Ari_Anturaniemi#Business_organization"/>
<rdfs:subClassOf>
<owl:Restriction>
<owl:onProperty rdf:resource="http://www.haaga-
helia.fi/ONT_Ari_Anturaniemi#has"/>
<owl:someValuesFrom
rdf:resource="http://www.haaga-
helia.fi/ONT_Ari_Anturaniemi#Data_quality_target"/>
</owl:Restriction>
</rdfs:subClassOf>
<rdfs:subClassOf>
<owl:Restriction>
<owl:onProperty rdf:resource="http://www.haaga-
helia.fi/ONT_Ari_Anturaniemi#executes"/>
<owl:someValuesFrom
rdf:resource="http://www.haaga-
helia.fi/ONT_Ari_Anturaniemi#Business_target"/>
</owl:Restriction>
</rdfs:subClassOf>
</owl:Class>
<!-- http://www.haaga-helia.fi/ONT_Ari_Anturaniemi#Past -->
<owl:Class rdf:about="http://www.haaga-
helia.fi/ONT_Ari_Anturaniemi#Past">
<rdfs:subClassOf rdf:resource="http://www.haaga-
helia.fi/ONT_Ari_Anturaniemi#Business_result"/>
<rdfs:subClassOf>
<owl:Restriction>
<owl:onProperty rdf:resource="http://www.haaga-
helia.fi/ONT_Ari_Anturaniemi#affect_to"/>
<owl:someValuesFrom
rdf:resource="http://www.haaga-
helia.fi/ONT_Ari_Anturaniemi#Lag_Indicator"/>
</owl:Restriction>
</rdfs:subClassOf>
</owl:Class>
<!-- http://www.haaga-
helia.fi/ONT_Ari_Anturaniemi#Performance_indicator -->
<owl:Class rdf:about="http://www.haaga-
helia.fi/ONT_Ari_Anturaniemi#Performance_indicator">
<rdfs:subClassOf rdf:resource="http://www.haaga-
helia.fi/ONT_Ari_Anturaniemi#Lead_indicator"/>
</owl:Class>
<!-- http://www.haaga-
helia.fi/ONT_Ari_Anturaniemi#Performance_measurement -->
87
<owl:Class rdf:about="http://www.haaga-
helia.fi/ONT_Ari_Anturaniemi#Performance_measurement">
<rdfs:subClassOf>
<owl:Restriction>
<owl:onProperty rdf:resource="http://www.haaga-
helia.fi/ONT_Ari_Anturaniemi#measures"/>
<owl:someValuesFrom
rdf:resource="http://www.haaga-
helia.fi/ONT_Ari_Anturaniemi#Business_result"/>
</owl:Restriction>
</rdfs:subClassOf>
<rdfs:subClassOf>
<owl:Restriction>
<owl:onProperty rdf:resource="http://www.haaga-
helia.fi/ONT_Ari_Anturaniemi#has"/>
<owl:someValuesFrom
rdf:resource="http://www.haaga-
helia.fi/ONT_Ari_Anturaniemi#Data_quality_target"/>
</owl:Restriction>
</rdfs:subClassOf>
<rdfs:subClassOf>
<owl:Restriction>
<owl:onProperty rdf:resource="http://www.haaga-
helia.fi/ONT_Ari_Anturaniemi#creates"/>
<owl:someValuesFrom
rdf:resource="http://www.haaga-
helia.fi/ONT_Ari_Anturaniemi#Knowledge"/>
</owl:Restriction>
</rdfs:subClassOf>
<rdfs:subClassOf>
<owl:Restriction>
<owl:onProperty rdf:resource="http://www.haaga-
helia.fi/ONT_Ari_Anturaniemi#uses"/>
<owl:someValuesFrom
rdf:resource="http://www.haaga-
helia.fi/ONT_Ari_Anturaniemi#Data"/>
</owl:Restriction>
</rdfs:subClassOf>
</owl:Class>
<!-- http://www.haaga-helia.fi/ONT_Ari_Anturaniemi#Physical --
>
<owl:Class rdf:about="http://www.haaga-
helia.fi/ONT_Ari_Anturaniemi#Physical">
<rdfs:subClassOf rdf:resource="http://www.haaga-
helia.fi/ONT_Ari_Anturaniemi#Model"/>
</owl:Class>
<!-- http://www.haaga-
helia.fi/ONT_Ari_Anturaniemi#Planned_action -->
88
<owl:Class rdf:about="http://www.haaga-
helia.fi/ONT_Ari_Anturaniemi#Planned_action">
<rdfs:subClassOf rdf:resource="http://www.haaga-
helia.fi/ONT_Ari_Anturaniemi#Action"/>
<rdfs:subClassOf>
<owl:Restriction>
<owl:onProperty rdf:resource="http://www.haaga-
helia.fi/ONT_Ari_Anturaniemi#is_related_to"/>
<owl:someValuesFrom
rdf:resource="http://www.haaga-
helia.fi/ONT_Ari_Anturaniemi#Future"/>
</owl:Restriction>
</rdfs:subClassOf>
</owl:Class>
<!-- http://www.haaga-helia.fi/ONT_Ari_Anturaniemi#Present -->
<owl:Class rdf:about="http://www.haaga-
helia.fi/ONT_Ari_Anturaniemi#Present">
<rdfs:subClassOf rdf:resource="http://www.haaga-
helia.fi/ONT_Ari_Anturaniemi#Business_result"/>
<rdfs:subClassOf>
<owl:Restriction>
<owl:onProperty rdf:resource="http://www.haaga-
helia.fi/ONT_Ari_Anturaniemi#affect_to"/>
<owl:someValuesFrom
rdf:resource="http://www.haaga-
helia.fi/ONT_Ari_Anturaniemi#Lag_Indicator"/>
</owl:Restriction>
</rdfs:subClassOf>
</owl:Class>
<!-- http://www.haaga-helia.fi/ONT_Ari_Anturaniemi#Quality -->
<owl:Class rdf:about="http://www.haaga-
helia.fi/ONT_Ari_Anturaniemi#Quality">
<rdfs:subClassOf rdf:resource="&owl;Thing"/>
<rdfs:subClassOf>
<owl:Restriction>
<owl:onProperty rdf:resource="http://www.haaga-
helia.fi/ONT_Ari_Anturaniemi#is_related_to"/>
<owl:someValuesFrom
rdf:resource="http://www.haaga-
helia.fi/ONT_Ari_Anturaniemi#Business_target"/>
</owl:Restriction>
</rdfs:subClassOf>
</owl:Class>
<!-- http://www.haaga-
helia.fi/ONT_Ari_Anturaniemi#Result_indicator -->
89
<owl:Class rdf:about="http://www.haaga-
helia.fi/ONT_Ari_Anturaniemi#Result_indicator">
<rdfs:subClassOf rdf:resource="http://www.haaga-
helia.fi/ONT_Ari_Anturaniemi#Lag_Indicator"/>
</owl:Class>
<!-- http://www.haaga-
helia.fi/ONT_Ari_Anturaniemi#Transactional_data -->
<owl:Class rdf:about="http://www.haaga-
helia.fi/ONT_Ari_Anturaniemi#Transactional_data">
<rdfs:subClassOf rdf:resource="http://www.haaga-
helia.fi/ONT_Ari_Anturaniemi#Data"/>
</owl:Class>
<!--
//////////////////////////////////////////////////////////////////
/////////////////////
//
// Individuals
//
//////////////////////////////////////////////////////////////////
/////////////////////
-->
<!-- http://www.haaga-helia.fi/ONT_Ari_Anturaniemi#Accuracy --
>
<owl:NamedIndividual rdf:about="http://www.haaga-
helia.fi/ONT_Ari_Anturaniemi#Accuracy">
<rdf:type rdf:resource="http://www.haaga-
helia.fi/ONT_Ari_Anturaniemi#Intrinsic"/>
</owl:NamedIndividual>
<!-- http://www.haaga-
helia.fi/ONT_Ari_Anturaniemi#Completeness -->
<owl:NamedIndividual rdf:about="http://www.haaga-
helia.fi/ONT_Ari_Anturaniemi#Completeness">
<rdf:type rdf:resource="http://www.haaga-
helia.fi/ONT_Ari_Anturaniemi#Contextual"/>
</owl:NamedIndividual>
90
<!-- http://www.haaga-helia.fi/ONT_Ari_Anturaniemi#Consistency
-->
<owl:NamedIndividual rdf:about="http://www.haaga-
helia.fi/ONT_Ari_Anturaniemi#Consistency">
<rdf:type rdf:resource="http://www.haaga-
helia.fi/ONT_Ari_Anturaniemi#Contextual"/>
</owl:NamedIndividual>
<!-- http://www.haaga-helia.fi/ONT_Ari_Anturaniemi#Currency --
>
<owl:NamedIndividual rdf:about="http://www.haaga-
helia.fi/ONT_Ari_Anturaniemi#Currency">
<rdf:type rdf:resource="http://www.haaga-
helia.fi/ONT_Ari_Anturaniemi#Contextual"/>
</owl:NamedIndividual>
<!-- http://www.haaga-
helia.fi/ONT_Ari_Anturaniemi#Identifiability -->
<owl:NamedIndividual rdf:about="http://www.haaga-
helia.fi/ONT_Ari_Anturaniemi#Identifiability">
<rdf:type rdf:resource="http://www.haaga-
helia.fi/ONT_Ari_Anturaniemi#Contextual"/>
</owl:NamedIndividual>
<!-- http://www.haaga-helia.fi/ONT_Ari_Anturaniemi#Lineage -->
<owl:NamedIndividual rdf:about="http://www.haaga-
helia.fi/ONT_Ari_Anturaniemi#Lineage">
<rdf:type rdf:resource="http://www.haaga-
helia.fi/ONT_Ari_Anturaniemi#Intrinsic"/>
</owl:NamedIndividual>
<!-- http://www.haaga-
helia.fi/ONT_Ari_Anturaniemi#Reasonabless -->
<owl:NamedIndividual rdf:about="http://www.haaga-
helia.fi/ONT_Ari_Anturaniemi#Reasonabless">
<rdf:type rdf:resource="http://www.haaga-
helia.fi/ONT_Ari_Anturaniemi#Contextual"/>
</owl:NamedIndividual>
<!-- http://www.haaga-helia.fi/ONT_Ari_Anturaniemi#Semantic --
>
91
<owl:NamedIndividual rdf:about="http://www.haaga-
helia.fi/ONT_Ari_Anturaniemi#Semantic">
<rdf:type rdf:resource="http://www.haaga-
helia.fi/ONT_Ari_Anturaniemi#Intrinsic"/>
</owl:NamedIndividual>
<!-- http://www.haaga-helia.fi/ONT_Ari_Anturaniemi#Structure -
->
<owl:NamedIndividual rdf:about="http://www.haaga-
helia.fi/ONT_Ari_Anturaniemi#Structure">
<rdf:type rdf:resource="http://www.haaga-
helia.fi/ONT_Ari_Anturaniemi#Intrinsic"/>
</owl:NamedIndividual>
<!-- http://www.haaga-helia.fi/ONT_Ari_Anturaniemi#Timeliness
-->
<owl:NamedIndividual rdf:about="http://www.haaga-
helia.fi/ONT_Ari_Anturaniemi#Timeliness">
<rdf:type rdf:resource="http://www.haaga-
helia.fi/ONT_Ari_Anturaniemi#Contextual"/>
</owl:NamedIndividual>
</rdf:RDF>
<!-- Generated by the OWL API (version 3.2.3.1824)
http://owlapi.sourceforge.net -->
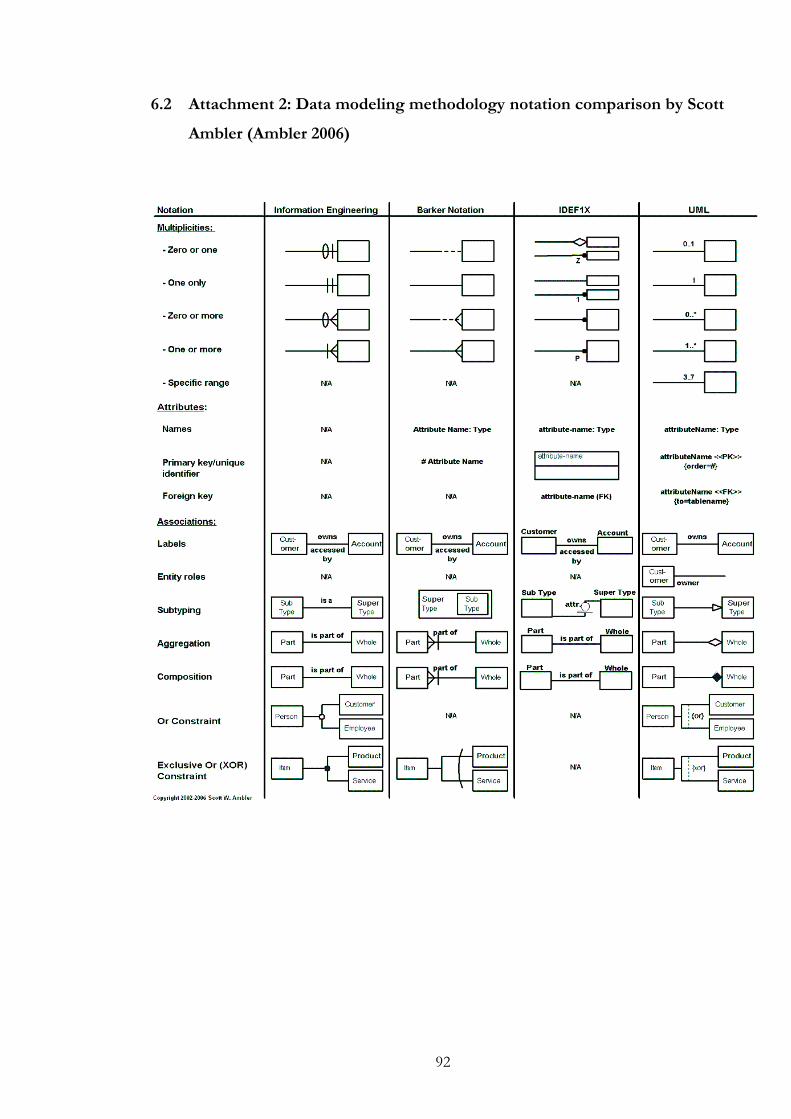
92
6.2 Attachment 2: Data modeling methodology notation comparison by Scott
Ambler (Ambler 2006)

93
6.3 Attachment 3 (confidential): Empirical part of case study
see separate file.