Embed Size (px)
Citation preview

Improving Cephalogram Analysis through Feature Subimage Extraction
A Mu/ti/ayer Perceptron and Genetic Algorithm
ephalograms are clinically useful im- C a g e data for diagnosis and treatment in Method for Better Automatic to locate landmarks. orthodontics. In a cephalogram, a num- ber of characteristic reference points in terms of landmarks are used to
on gray-scale mathematical morphology
In our previously developed system [lo] for automatic landmark recognition,
the feature subimages containing Landmark ReCOYnifiOn
characterize the geometry of the skull. These related data are then computed for diagnosis or treatment. The feature curves corresponding to the cranial base, maxillary plane, mandib- ular plane, and other significant features are used as the basis for cephalometric superimpo- sition [l-41.
Up to now, the process of cephalometry has always been done manually. Since it is very tedious, time-consuming, and also heavily dependent on the orthodontists’ experience, a computerized system would provide great relief. Only a few cephalometric analysis pack- ages are commercially avail- able . Halazonet is [ 5 ] has developed a computer-assisted
the landmarks were extracted in relation to a fixed ear rod in the image. The spatial relationships for these subimages were defined on the basis of a statistical analy- sis of one cephalogram data set that, however, may not be appli- cable to other data sets. Cross-correlation [I 11 was then implemented in the system, but the extracted subimages were not very reliable. Therefore, a novel method combining a multilayer perceptron (MLP) and genetic al- gorithm (GA) is proposed in this article to improve the perfor- mance of the automatic landmarking system.
The GA represents a class of adaptive searching techniques based on natural selection and genetic inheritance [ 121. The
cephalometric analysis system for orth- odontic diagnosis in which the operator can digitize and input the landmarks manually. Following that, the measure- ments and analysis are carried out. This system has the advantages of low cost, custom-made analysis, ease of manipula- tion, and integration with other applica- tion software in the Windows p c operating system.
Many researchers have studied cephalogram analysis from the perspec- tive of image processing. In 1986, Levy-mandel, et al. [ 6 ] , proposed a knowledge-based expert system to locate the landmarks of cephalograms automati- cally. In their method, all lines and edges are first obtained using the method for global line following. Then, pertinent
lines are traced to locate the landmarks based on prior knowledge. In 1989, Parthasarathy, et al. [7], used the pyramid method to decrease the spatial resolution of the image and then enhanced the local image to extract useful edges or lines. Tong, et al. 181, followed the strategy of ParthaSarathy to locate landmarks on Soft tissue. Cardillo and Sid-Ahmed [9] devel- oped a target-recognition algorithm based
GA’s behavior provides an approxima- tion within ail acceptable tolerance, in- stead of an exact match, and hence saves computational costs. It provides as a use- ful way of solving global function optimizations. In the field of image pro- cessing, the GA provides superior per- formance Over conventional techniques [13,141,
~~~~~l networks have been widely ap- plied in a variety fields in recent years. A comprehensive description of the applica- tions of neural networks relevant to medi- cal imaging was provided by Miller, et al. [15]. The raw images containing features can be considered as input data to the neu- ral network structure, and the neural net- works are then trained for the specific purpose [16,17].
Yen-ting (hen’, Kuo-shen (heng’, and
~ ~ n s ~ i t ~ ~ ~ of ~ ~ o ~ ~ ~ i ~ a I € n g ~ n ~ ~ r ~ n g , ~ a ~ i o n a l Cheng ~ u ~ g ~ n i v e r s i ~ ~ T a i ~ ~ ~ ~ ’ Q e ~ Q r ~ ~ i e ~ ~ oE Q ~ ~ t ~ s ~ r y ,
Na~Qna l Cheng Kung ~ ~ ~ v @ ~ s ~ ~ ~ a ~ ~ i t a ~ , T a ~ ~ ~ a ~
Jia-kuang Liu 1
Januory/February 1999 IEEE ENGINEERING I N MEDICINE AND BIOLOGY 0739-51 75 /99 /$ lO .OOOl999 IEEE 15
The purpose of the study presented in this article is to improve cephalogram analysis by a novel system developed from the MLP and the GA. The method may be further applied to extract the cor- responding features for cephalometry su- perimposition.
The neural network employed in this study was a full-connected MLP of three layers, with error back-propagation leam- ing [18]. Two distinct passes, the forward pass and the backward pass, were applied In the forward pass at time R , the internal activityv,(n) and the actual response yJ(n) for node j is computed using the following equations:
(1)
where n denotes the number of iterations, i the node in the previous layer, w J~ the syn- apse weight connecting the output of node i to the input of node j , and 8 the threshold applied to node j .
In the backward pass, the error func- tion eJ is defined as e,(n) = dJ(n) - yJ(n). It is passed from the output layer back through the network for modifying the weight w and the threshold 8:
For the node j in the output layer, we have:
26
For the node j in the hidden layer, we have:
In the training stag;, the procedure is stopped when the mean squared error E ~ , , of the output falls within the specified er- ror range:
where the set C represents all the nodes in the output layer.
MLP Structure In the input layer, the nodes were arranged into two dimensions with a size equal to that of the reduced resolution subimages. The nodes in the hidden layer were empir- ically set to be the same as the input layer. Only one node was in the output layer. The actual response indicated the possi- bility of similarity to the input pattern.
Determination of Input Layer Size The size of the input pattern is a crucial factor in network performance. Larger in- put patterns will create a larger network size and the need for greater computation costs. Moreover, it is not helpful for gen- eral feature extraction if the trained MLP
l is too sensitive to the subtle local spatlal variation. On the contrary, smaller input 1 patterns create a smaller network, but they could result in a higher possibility for er- ror. Thus, there is a tradeoff between com- putation costs and accuracy. Referring to I the results of our experiments, a size re- duction ratio of 1/4 was demonstrated to be a good choice for some feature subimages (corresponding to the land- marks Ar, Or, and S) and 1/6 for the other ~
subimages (see Fig I). I
Training Patterns Collection 1
All the training patterns, including both ' the true and the false images, were ob- tained from the original image using a re- duced resolution pyramid. Three sets of cephalograms (i.e., traznmg set, validation set, and test set), were collected from the Department of Dentistry at National Cheng Kung University Hospital. The first set was employed to generate the true patterns and false patterns for training. The true patterns were determined in a way that allowed the features for the land- marks to appear in specific areas within the subimages. The subimages distributed around the features were sampled as false images. In this training stage, the trained MLP would process the areas around the subimages of all the training sets again, to recruit new false images. Once the trained
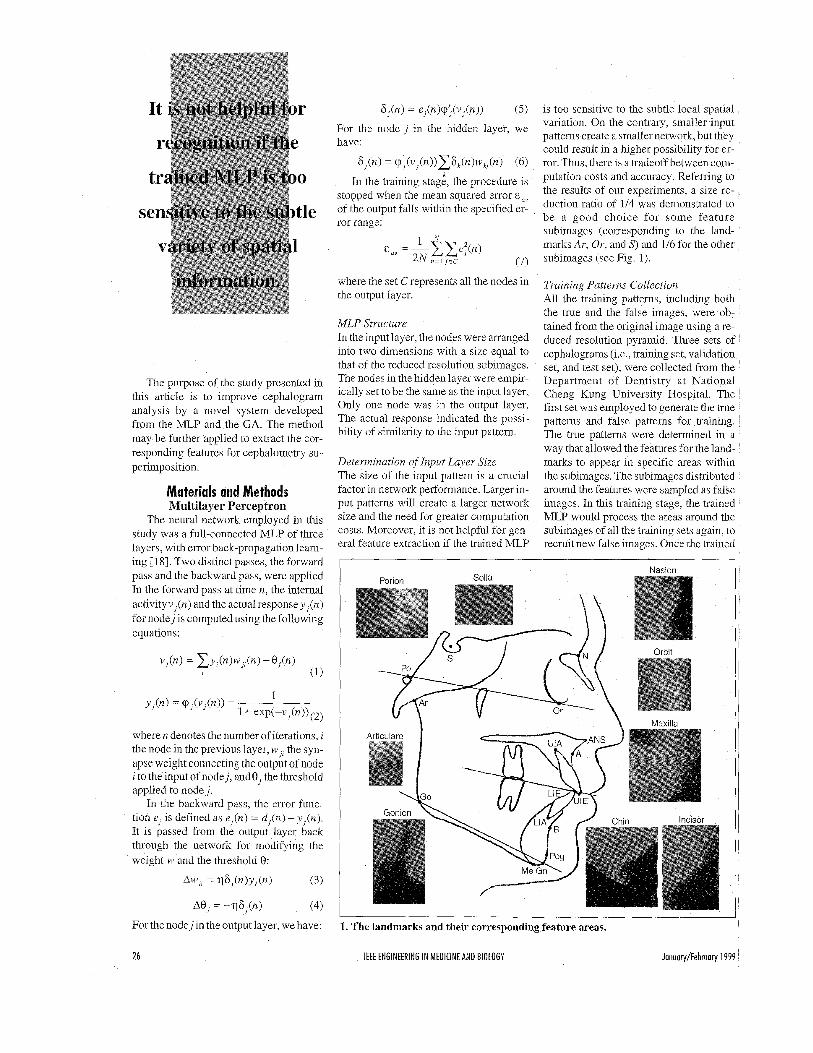
Nasion
\ Mnwilln I
1. The landmarks and their corresponding feature areas.
IEEE ENGINEERING I N MEDICINE AND BIOLOGY January/February 1999

MLP showed poor performance on some image of the validation set, additional cor- responding patterns were added to facili- tate additional learning.
Cross- Validation Cross-validation is a process in statistics for checking if the trained network has learned enough about the past to general- ize to the future. Cross-validation can re- fine the networkin different ways, such as network complexity, size of learning-rate parameter, and other parameters. The per- tinent stop criterion for training is deter- mined on the basis of the results obtained from the cross-validation process. Several weight sets corresponding to stop crite- rion values were generated during the training process. Some images of the vali- dation set were used to check the perfor- mance. The weights with the best results were adopted.
Genetic Algorithm The GA is a technique that can be used
to explore an unknown domain by using a population (or database) of prescribed structures. Based on associated fitness, new structures are generated using ge- netic operators, as in natural evolution. The GA is adaptive, accumulating useful information from the current generation in order to bias subsequent searches into useful subspace, and to produce superior offspring for the next generation. The searching domain is a coded parameter space. The parameters, in terms of struc- tures, are encoded as strings called “indi- viduals,” with the analogy here being genes on a chromosome. The same types of parameters for samples were clustered as a population. Three basic operations (i.e., reproduction, crossover, and muta- tion) were applied to the population to generate a new generation with a higher fitness for survival. The flow chart for this process is shown in Fig. 2.
Reproduction Reproduction i s employed to generate new individuals on the basis of the ratio of fitness values. Higher fitness provides more individuals that are the same as their parents. This implies the rule of natural selection-individuals with higher fitness have a greater chance to replicate them- selves in the next generation, while those with lesser fitness are more likely to fail.
Crossover At this stage, individuals of the new popu- lation were mated, based on the probahil- ity of crossover. A crossing site was selected randomly for exchanging the partials of the mates, as the substrings within each string imply the various spa- tial information. After reproduction and crossover, the new strings were taken from the more significant areas in the search domain. The high-performance strings will pass their characteristics to in- dividuals in the next generation.
Mutation This stage is associated with the crossover stage for alternating the value of each chromosome, based on the probability of mutation. Even though it is an effective way to search for the solution, there is still some potentially useful information that may be lost. Mutation tries to “wander” around the solution space randomly to find other solutions. It is very useful when the searching falls into a local optimum.
Parameters Setting Eighty subimages were randomly se- lected as the original population. The probability of crossover was set to 0.6. It is noteworthy that the probability of muta- tion was variable, since it is a function of the fitness value and the position of the genes. The value for mutation is a crucial factor in the performance of the CA. A higher probability of mutation would be a more powerful disturbance to the conver- gence of evolution. A lower probability of mutation would cause the mutated new generation to lodge within some local population fold. In our experiments, the parameter varied from 0.05 to 0.2, linearly depending on the value of fitness. It was conceptually based on the idea that supe- rior chromosome$ with high fitness would be more adaptable than inferior chromo- somes. Under this consideration, there was no reason for a superior chromosome
to undergo a large change with a high mutation probability.
The other effective coefficient for mu- tation was the site of inner genes in the chromosome. The genes at a lower site might change at a higher probability than genes at higher sites. This idea is based on the fact that the encoded chromosome in- dicates the position of samples in the im- plementation. The chromosome might adapt itself to a better condition lightly rather than roughly. This effect is caused by the change in the lower gene position.
Image Preprocessing It is difficult to recognize the features
or landmarks on a cephalogram with bad quality, such as over- or underexposure. Therefore, cephalograms with poor qual- ity were not considered for the computer- ized process. The brightness for an image can be adjusted by the f-number setting on the aperture of the camera. The gray-value histogram can be linearly enhanced be- tween the appropriate range. This can im- prove intensity defects.
Weighting Function For each feature, only a limited area
was searched, so as to prevent redundant searching in areas other than the feature. The range of the searching area was evalu- ated statistically, based on sample fea- tures of cephalograms from various types of cases. The weighting function was in- troduced into the system to emphasize the spatial correlations of features. The weighting function is a Gaussian function of the form:
2. Flow chart of the genetic algorithm.
Januory/Februory 1999 IEEE ENGINEERING IN MEDICINE AND BIOLOGY 27

I Searching
3. The procedure for the proposed method.
where p is the mean of the samples’ posi- tions. The value for (T is three times the standard deviation of the horizontal or ver- tical distribution of the feature. The origin of the weighting function was set as the center of the searching area. Horizontal and vertical weightmg were considered separately, and the product was considered in the weighting function. The weighting function was introduced in the multiplica- tion of the fitness for the detected position and its product was used as the real fitness. This was because a detected position lo- cated far away from the center would have less statistical significance.
Analysis Procedures Instead of the global image, a limited
region corresponding to each feature
subimage was defined for GA searching. The size of the region was evaluated sta- tistically, based on the distribution of fea- tures of the training set. Eighty subimages were randomly selected within each lim- ited region. All the positions (x,y), of up- per-left corner of subimages were encoded as the strings to form a popula- tion for the GA. Their fitness value for each subimage was estimated using a traincd MLP. The individuals with higher fitness values were selected for reproduc- tion and crossover to generate the next offspring iteratively.
Figure 3 shows the procedures for the proposed method to extract the feature subimage containing landmark Go.
Results and Discussion In the real application of cephalograni
landmarking, the true images for patients may vary significantly. Moreover, the im-
28 IEEE ENGINEERING IN MEDICINE AND BIOLOGY
age-taking processes are hard to control ~
accurately. The images can be divided I into several kinds of variations, as de- scribed below:
2 . Deformation: Mainly caused by the craniofacial skull structure
2. Rotation: Caused by the patient be- 1 ing improperly posed while taking the I X-ray, or by the improper placement of 1
the X-ray film during digitization I
3. Scaling. Indicates dimension prob- ’ lems with the features. The patients’ skull 1 itself and the distance from the camera to , the film could affect the size of the digi- tized feature
1 I
4. Test images of different geometrical conditions. (a) The original image with three objects. (b) The circles are crushed and wrapped. (c) The triangles are rotated 5 and 10 degrees. (d) The triangles are scaled to 125% and 75%. (e) The triangles have the gray values of 200 and 150.
January/February 1999

4. Brightness variety: Controlled by the radiographer, and by the f-number of the camera aperture
In order to verify the performance of the proposed technique for application to a variety of cases, a number of images with distorted geometrical shapes were made. The original shapes are shown in Fig.4(a). The geometrical shapes were deformed or transformed in several dif- ferent ways. Displayed in turn, the crush and wrap of circles is shown in Fig. 4(b), the rotation of triangles in Fig. 4(c), the scaling of triangles in Fig. 4(d), and the triangles with different brightness in Fig. 4(e). The deformations were made to im- itate real cases of feature images in cephalogram analysis.
In the simulation experiments, the MLP was trained only with the informa-
c 3
F 1 0 0 ~ 0
50
250 1-j
-
ob 5 I O I 5 20 55 30 35 do Angle
(a)
200
150 c a 100
i 0 ' ' ' ' ' A 0.6 0.7 0.8 0.9 1 1.1 1.2 1.3
Scale Ratio (b)
s 3 150
I 150 200 250
Brightness (d
5. The output MLP for varied shapes. (a) The output of MLP for the shapes at different rotation angles, (b) in different scales, and (c) with different brightness values.
tion obtained from the original geomet- ric shapes. In other words, the trained MLP did not have any information about distortion or transformation. Figure 4 shows the resulting images for recogniz- ing the deformed or transformed shapes. The extracted features are marked by rectangles. From these results, it is seen
that the algorithm does have the robust ability to pick out the shape-like targets in every case. Figure 5 shows the evalu- ated output of the network compared to the varied geometrical shapes. It indi- cates that the proposed algorithm is also robust enough in dealing with the varia- tions between cases.
Crcle
Triangle
Diamond
)n of computation time for specific figures. MLP without GA MLP with GA (1 0 times)
(unit: sec) (unit: sec)
21 -44 mean: 28.5 sid: 8.5
282 21 -23 mean: 21.8 std: 0.91
mean: 25 std: 5.16
mean:775
284 21 -36
708 - 955
Recognizing results Average position
Mean = (293 95) std = (1 7. 0.7)
(295, 95) Circle
Triangle
Diamond
Mean = (356, 94) (355, 94)
std = (1.9. 0.31
---- Table 3. Accuracy comparison for the application of cephalogram analysis.
(a) Crosscorrelation method. Feature Po S N Or Maxilla Incisor Chin Go Ar
Sei I 9/10 9/10 7/10 loll0 6/10 loll0 8/10 8/10 6/10 Sei II 616 516 216 616 5/6 616 6/6 616 516 Set 111 19/22 18/22 19/22 19/22 21/22 21/22 16/22 21/22 14/22 Accuracy I: 81% (73190)
II: 87% (47154) 111: 84% (1681198)
total: 84% (288/342) (b) MLP with GA-based method.
I: 97%(87/90) I I 96%(52/54)
Ill: 92%(182/198)
January/February 1999 IEEE ENGINEERING I N MEDICINE AN0 BIOLOGY 19

6. Examples of feature subimage for incisors (a) without and (b) with cavities and fillings using the trained MLP.
7. The extracted feature subimages us- ing the proposed method.
The program was carried out using a personal computer with a Pentium-Pro 200 CPU. The computation time is listed in Ta- ble l. In fact, apure MLP has to scan a local area to determine the position that corre- sponds to a specific feature with maximum MLP output; no doubt, this takes time. Fur- thermore, only one computation time for the GA-based MLP is also not appropriate for comparison. Therefore, the average computation time for 10 tests was taken in- stead. In a comparison of the computation time of a pure MLP with the GA-based MLP, the average computation time of the later was significantly less.
The stability and the accuracy of the algorithm were evaluated in the next ex- periment. Recognition was performed 10 times for each geometrical shape. The stability and accuracy were affected pri- marily by the level of MLP training. As shown in Table 2, the stability and accu- racy were good.
Due to the variety of features, it was difficult to define the absolute position of
30
the features in a assigned region. This means that the extracted area in which the feature was contained was still diffi- cult to resolve. In some cases, the ex- tracted areas in which the feature had a slight shift were considered to be correct. Results with ambiguous or definite mis- takes were limited. An experienced user was invited to evaluate the results. The recognition results for the image sets are shown in Table 3. The results show that the proposed algorithm has a high capa- bility in processing the real cases of the training set, the validating set, and even the testing set. Compared with our previ- ous method using correlation, the current method is better in subimage extraction.
Figure 6(a) shows an example of fea- ture subimage extraction for an incisor, with sequentially scanning of the entire searching area using a trained MLP. In this area, the actual responses of all out- put were display in a gray-scale image. This result indicates the possibility of containing the feature in the detected window. The higher the intensity, the higher the response and the greater the similarity to the content within the de- tected window with the feature. The pic- torial results show the overlap with the image corresponding to the searching area. The entire image with reduced res- olution is shown in the left-top corner. It is shown that the trained MLP results in a clear spot, indicating the feature and its neighbors.
How does the MLP respond to a case that it has never encountered before? Figure 6(b) shows the results for a case involving cavity fillings and missing teeth, which is unfamiliar to the trained MLP. The MLP cannot produce a high
IEEE ENGINEERING I N MEOlClNE AND BIOLOGY
resolution feature. In other words, the MLP cannot be sure whether the fea- tures exist within the detected windows at those positions. But the true features (incisors) still can be recognized in the positions with the brightest intensity. This shows the outstanding character- istics of the MLP for tolerating fault in this application. An example for nine extracted feature subimages is shown in Fig. 7.
Our algorithm takes about 10 or more minutes for the computation time to lo- cate all of the feature subimages. This to- tal is heavily dependent on the time needed for the convergence of the GA. In addition, the fitness value for the GA is computed by the MLP Therefore, the performance of the GA also depends on whether the MLP is well trained. The most crucial factor for training is a full collection of meaningful patterns for the true as well as false images. Practically, the true patterns with the specific fea- tures may be easily identified and col- lected. But, a “representative” collection of false patterns is difficult to define and assemble. In this study, it is suggested that false patterns be added for each newly obtained cephalogram to increase the accuracy o?f the system
Summary and Conclusions An MLP with a GA was proposed to
extract feature subimages containing orthodontic landmarks. Simulated images and cephalograms were used to mvesti- gate its performance in comparison with the cross-correlation method. From the re- sults of simulated image containing shapes with different geometrical condi- tions, it was shown that the fault tolerance of the MLP for rotation, scaling, bnght- ness variety, and other anomalous defor- mations is good enough to overcome the clinical application problems. It was also shown that the stability, accuracy, and speed of t h i s proposed algorithm are very promising. Moreover, the performance of the MLP can be significantly improved by collecting more “representative” false patterns. The GA is a good approach to speed up the process of feature subimage extraction based on the fitness evaluated using the MLP.
Acknowledgment This work was supported in part by the
National Science Council, ROC, under the Grant NSC86-2745-B-006-00l-MO8.
January/February 1999

Yen-Ting Chen was bom in Chia-Yi, Taiwan, ROC, in 1966. He re- ceived the B.S. degree in electrical engineering in 1989 from Feng Chia University and the M.S. degree of biomedical en- gineering in 1991 from
National Cheng Kung University, Taiwan. He is now a Ph.D. candidate of the Institute of Biomedical Engineering at National Cheng Kung University. His research inter- ests are in the field of medical image pro- cessing and applications.
Kuo-Sheng Cheng
IEEE) was bom in Tai- pei, Taiwan, ROC, in 1958. He received the BSc. and M.Sc. degrees both in electrical engi- neering in 1980 and 1982 from the National
Cheng Kung University, Tainan, Taiwan, and the M.S. degree in biomedical engi- neering in 1988 from Rensselaer Polytech- nic Institute, Troy, NY, USA. In 1990, he received the Ph.D. degree in electrical en- gineering from the National Cheng Kung University. He is now professor and chair- man of the Institute of Biomedical Engi- neering at National Cheng Kung University. His research interests include medical image processing, electrical im- pedance imaging, and microcomputer based biomedical instrumentation.
(S’82-M’90-SM’97 of
Jia-Kuang Liu was born in Taiwan, ROC, in 1957. She received her BDS degree from National Taiwan University, in 1981. Since 1992, she has been an assis-
January/February 1999
tant professor at Col- lege of Medicine, National Cheng Kung University, and chair at Division of Orthodon- tics, Dental Depart- ment, National Cheng Kung University Hos- pital. She has also been
the chair of the Dental Department, Na- tional Cheng Kung University Hospital, since 1997. Her research interests are orthodontic material, dental imaging, and biomechanics in orthodontics.
Address for Correspondence: Kuo-sheng Cheng, Ph.D., Professor and Chairman, Institute of Biomedical Engi- neering, National Cheng Kung Univer- sity, Tainan, Taiwan, ROC. E-mail: kscheng @ mail.bme.ncku.edu. tw . Fax: 886-6-2343270
References I. Moyers RE: Handbook of Orthodontics. Chi- cago, IL: Year Book Medical, 1988. 2. Ghafari J, Engel FE, and Laster LL: Cephalometric superimposition on the cranial base: A review and a comparison of four methods. Am. J . Orthod. Dentofac. Orthop., 91(5):
3. Baumrind S, Bassat YB, Korn EL, Bravo LA, and Curry S: Mandibular remodeling mea- sured on cephalograms: 2. A comparison of infor- mation from implant and anatomic best-fit superimpositions. Am. J. Orthod. Dentofac. Orthop., 102(3): 227-238, 1992. 4. Nielsen IL: Maxillary superimposition: a com- parison of three methods for cephalometric evalu- ation of growth and treatment change. Am. J. Orthod. Dentofac. Orthop., 95(5): 422-43 1,1989. 5 . Halazonetis DJ: Computer-assisted cephalometric analysis. Am. J. Orthod. Dentofac.
403-413, 1987.
Orthop., 105(5): 517-521, 1994.
IEEE ENGINEERING I N MEDICINE AND BIOLOGY
6. LCvy-mandel AD, Venetsanopoulos AN, and Tsotsos JK: Knowledge-based landmarking of cephalograms. Comput. Biomed. Res. , 19:
7. Parthasarathy S, Nugent ST, Gregson PG, and Fay DF: Automatic landmarking of cephalograms. Comput. Biomed. R e s . , 22:
8. Tong W, Nugent ST, Gregson PH, Jensen GM, and Fay DF: Landmarking of cephalograms using a microcomputer system. Comput. Biomed. Res., 23: 358-379, 1990. 9. Cardillo J and Sid-Ahmed MA: An image processing system for locating craniofacial land- marks. IEEE Trans. Med. Imag., 13(2): 275-289, 1994. IO. Chen YT, Cheng KS and Liu JK: Auto- mated cephalogram landmarking. Chinese J. Med. Biol. Eng., 16(2): 199-213, 1996. 1 1. Kasturi R and Trivedi MM: Image Analysis Applications, New York: Marcel Dekker, 1990. 12. Goldberg DE: Genetic algorithms, in Search, Optimization and Machine Learning. New York: Addison-Wesley, 1989. 13. Bhanu B, Lee S and Ming J: Adaptive image segmentation using a genetic algorithm. IEEE Trans. Syst. Man Cybern., 25(12): 1543-1567, 1995. 14. Liu J, Tang YY, and Cao YC: An evolntion- ary autonomous agents approach to image feature extraction. IEEE Trans. Evol. Comput., l(2): 141-158, 1997. 15. Miller AS, Blott BH, and Hames KT: Re- view of neural network applications in medical imaging and signal processing. Med. & Biol. Eng. & Comput., 30(5): 449-464, 1992. 16. Rowley HA, Baluja S, and Kanade T: Hu- man face detection in visual scenes. Tech Rep, Carnegie Mellon University, 1995. 17. Goodenday LS, Cios KJ, and Shin I: Iden- t i fying coronary s tenosis using an im- age-recognition neural network. IEEE Eng. Med. Biol. Mag., 16(5): 139-144, 1997. 18. Haykin S: Neural Network: A Comprehensive Foundation. Upper Saddle River, NJ: Prentice Hall, 1994.
282-309, 1986.
248-269, 1989.
31