Embed Size (px)
Citation preview

by Rails-to-Trails Conservancy
and the Association of Pedestrian
and Bicycle Professionals
P r e p a r e d fo r t h e Fe d e r a l H i g h w a y A d m i n i s t r a t i o nJanuary 1998
Improving Conditions for Bicycling and Walking

Fo r e w o r d
C O M M U N I T Y F O C U S
P o r t l a n d , OR —Total Commitment to Bicycling
D a v i s, C A — A Bicycle-friendly City
Bicycling and Walking in a Cold Climate, A K
B I CY C L E A N D P E D E S T R I A N P L A N S
Oregon Bicycle and Pedestrian Plan
B i r m i n g h a m , AL Area Bicycle, Pedestrian and Greenway Plan,
Planning to Make Chicago Bicycle-friendly, I L
O F F- RO A D FA C I L I T I E S
King County Regional Trails System, WA
Capital Crescent Tr a i l , M D
Glenwood Canyon I-70 Tr a i l ,C O
Cowboy Trail Master Plan, N E
The Katy Tr a i l , M O
The Schuylkill River Tr a i l , PA
Universal Trail Assessment Process
O N - RO A D FA C I L I T I E S
S e a t t l e ’s Bike Spot Safety Program, WA
Illinois Accommodates Buggies and Bicycles
Pedestrian Safety Devices
Bike Lanes
S t r e e t s c a p e : A Comprehensive A p p r o a c h , F L
Palo A l t o ’s Bicycle Boulevard, C A
Neighborhood Traffic Calming in Seattle, WA
Downtown Corridor Improvement in Indianapolis, I N
Pedestrian Priority Measures
L e w i s t o n— Auburn Railroad Bridge, M E
Silver City, NM Main Street
E D U C A T I O N , E N C O U R A G E M E N T , E N F O R C M E N T
Safe Moves, C A
Community Cycling Programs for Kids
California Bike Commute Day
Twin Cities Bicycle Map and Commuter Guide, M N
Safe Bicycling in Chicago, I L
Cops on Bikes
Bicycle Commuter Program at Fleetwood Enterprises, C A
T R A N S I T- RE L AT E D
Transit and Pedestrian Development in A r l i n g t o n , VA
C a l t r a i n ’s “Bikes on Board” P r o g r a m
Phoenix Bikes on Buses Program, A Z
“Build Greater A u s t i n ,” T X
A N C I L L A R Y FA C I L I T I E S
C h i c a g o ’s Bicycle Parking Program, I L
Long Beach Bikestation, C A
R e s o u r c e s
Acronyms and Photo Credits
This document is disseminated under the sponsorship
of the Department of Tr a n s p o rtation in the interest of
i n f o rmation exchange. The United States Govern m e n t
assumes no liability for its contents or use there o f .
The contents of this re p o rt reflect the views of the
c o n t r a c t o r, who is responsible for the accuracy of the
data presented herein. The contents do not necessarily
reflect the official policy of the Department of
Tr a n s p o rt a t i o n .
This re p o rt does not constitute a standard ,
specification or re g u l a t i o n .
The United States Government does not endorse
p roducts or manufacturers. Trade or manufacture r s ’
names appear herein only because they are considere d
essential to the object of this document.

H o w e v e r, ISTEA did not guarantee Federal funding. Instead, pedestrian
and bicycle projects have had to compete with all other transportation pro-
jects for limited amounts of available funding. Decisions on which pro j e c t s
a re funded are made at State and metropolitan levels of government. In
addition, State and local funding sources are also used to provide pro j e c t s
for walking and bicycling. There f o re, providing funding for these pro j e c t s
is a concrete illustration of the value of walking and bicycling to these
c o m m u n i t i e s .
This “best practices” re p o rt provides information on some outstanding
pedestrian and bicycle projects that have been recognized for incre a s i n g
walking and bicycling and improving user safety in communities across the
United States. We have certainly overlooked other “best practices” in other
places. Our intent was to highlight exemplary projects and to show what
has been done that can be replicated in other places. We hope that by
seeing what others have done, you will be inspired to create your own
p rograms to encourage more and safer walking and bicycling in your own
c o m m u n i t y.
J O H N C . F E G A N
B I C Y C L E A N D P E D E S T R I A N P R O G R A M M A N A G E R
U N I T E D S T AT E S D E PA RT M E N T O F T R A N S P O RT AT I O N
f o r e w o r d
B E S T P R A C T I C E S
E N C O U R AG I N G M O R E P E O P L E T O W A L K A N D
B I C Y C L E , A N D T O D O S O S A F E LY, I N VO LV E S
A C T I O N S A T F E D E R A L, S T A T E , A N D L O CA L L E V E L S .
T H E I N T E R M O DA L S U R FA C E T R A N S P O RT A T I O N
E F F I C I E N C Y A C T O F 1 9 9 1 ( I S T E A ) P R OV I D E D
B R OA D E L I G I B I L I T Y T O U S E F E D E R A L F U N D S F O R
T H E S E P R O J E C T S .

(Not including re f e rences included in Best Practices re p o rts themselves)
G e n e r a l
National Bicycling and Walking Study Final Report , F H WA, 1993
National Bicycling and Walking Study Case Studies (24), F H WA, 1993
Bicycle and Pedestrian Safety and Accommodations, a three-day trainingcourse available through the National Highway Institute, FHWA, 1996
A Synthesis of Bicycle Safety-related Researc h , F H WA, 1994
Pedestrian Crash Types: A 1990s Informational Guide, F H WA, 1997
Bicycle Crash Types: A 1990s Informational Guide, F H WA, 1997
P l a n n i n g
Bicycle and Pedestrian Planning Under ISTEA: A Synthesis of the Stateof the Practice, F H WA, 1997
Bicycle and Pedestrian Planning Under ISTEA: A Training Manual,F H WA, 1994
Selecting Roadway Design Treatments to Accommodate Bicyclists, F H WA ,1 9 9 2
Bicycle Facility Planning: APA Planning Advisory Service Report 459,A PA, 1995
Making the Connection: Integrating Land-use and Tr a n s p o rt a t i o nPlanning for Livable Communities, 1000 Friends of Oregon, 1997
A Bicycle-friendly City (video), Bicycle Federation of America, 1995.( $ 2 0 )
Off-road Fa c i l i t i e s
Guide to the Development of Bicycle Facilities, AASHTO, 1991
Trails for the 21st Century: A Planning, Design and Management Manualfor Multi-use Tr a i l s , Rails to Trails Conserv a n c y, 1993
G reenways, Flink and Searns, Conservation Foundation, 1993
Trail Intersection Design Guidelines (Draft) pre p a red for Florida DOT bythe University of North Carolina Highway Safety Research Center in1996.
Rails with Trails: Sharing Corridors for Tr a n s p o rtation and Recre a t i o n .Rails to Trails Conserv a n c y, 1998.
On-road Fa c i l i t i e s
Guide to the Development of Bicycle Facilities, AASHTO, 1991
A Policy on Geometric Design of Streets and Highways, AASHTO, 1995
Making Streets that Work, City of Seattle, 1996 (video and workbook)
Design of Pedestrian Facilities, Report of Recommended Practice.Institute of Tr a n s p o rtation Engineers (ITE).
Residential Street Design and Tr a ffic Control, ITE
Tr a ffic Calming. APA Planning A d v i s o ry Service Report Number 456,1 9 9 5 .
The Pedestrian Enviro n m e n t , 1000 Friends of Oregon, 1993.
Education, Encouragement and Enforc e m e n t
Mean Streets: Pedestrian Safety and Reform of the Nation’sTr a n s p o rtation Law. E n v i ronmental Working Group, 1997
S h a re the Road: Let’s Make America Bicycle-friendly. E n v i ro n m e n t a lWorking Group, 1997
The Complete Guide to Police Cycling ($20), IPMBA.
a d d i t i o n a l r e s o u r c e s
B E S T P R A C T I C E S
W h e re to Obtain these Resourc e s
F H WA P U B L I C A T I O N S
NAT I O N A L BI C Y C L E A N D PE D E S T R I A N
CL E A R I N G H O U S E
1506 21S T ST R E E T N W, SU I T E 2 1 0
WA S H I N G T O N , DC 20036
(800) 760-6272
R A I L S -T O -T R A I L S
C O N S E R VA N CY
1100 17T H ST R E E T, NW; 10T H FL O O R
WA S H I N G T O N, DC 20036
(202) 331-9696
B I CY C L E F E D E R A T I O N O F
A M E R I C A
1506 2 1S T ST R E E T, NW; SU I T E 2 0 0
WA S H I N G T O N, DC 2 00 36
(202) 463-66 22
L E AG U E O F A M E R I C A N
B I CY C L I S T S
1612 K ST R E E T, NW; SU I T E 4 0 1
WA S H I N G T O N, DC 20006
(202) 8 22- 133 3
E N V I R O N M E N T A L W O R K I N G
G R O U P
1718 CO N N E C T I C U T AV E. , NW;
SU I T E 6 0 0
WA S H I N G T O N, DC 200 09
(202) 6 67-6982
I N S T I T U T E O F
T R A N S P O R T A T I O N E N G I N E E R S
52 5 SC H O O L ST R E E T, SW; SU I T E 4 1 0
WA S H I N G T O N, DC 20024
A M E R I C A N P L A N N I N G
A S S O C I AT I O N
122 S. MI C H I G A N AV E N U E, SU I T E 1 6 0 0
CH I C A G O, IL 60603
A M E R I C A N A S SO C IAT I O N O F
S TAT E HI G HWAY A N D
T R A N S P O RTAT I ON O F F I CI A L S
444 NO RT H CA P I T O L ST R E E T, NW;
SU I T E 2 2 5
WA S H I N G T O N, DC 20001
(202) 624-5800
1 0 0 0 F R I E N D S O F O R E G O N
534 SW 3R D AV E N U E , SU I T E 3 0 0
PO RT L A N D, OR 97204
(503) 497-1000
F L O R I D A D E P A R T M E N T O F
T R A N S P O R T AT I O N
BI C Y C L E A N D PE D E S T R I A N PR O G R A M
605 SU WA N N E E ST R E E T, MS-82
TA L L A H A S S E E, FL 32399
(850) 487-1200
C O N S E R VA T I O N F U N D
1800 NO RT H KE N T ST R E E T, SU I T E 1 1 2 0
AR L I N G T O N, VA 22209
(703) 525-6300
C I T Y O F S E A T T L E
BI C Y C L E A N D PE D E S T R I A N PR O G R A M
SE AT T L E EN G I N E E R I N G DE PA RT M E N T
600 4T H AV E N U E, RO O M 7 0 8
SE AT T L E, WA 98104

Photo Cre d i t s
Andy Clarke, Photodisc
City of Port l a n d
Andy Clarke
Anchorage Parks & Recreation Dept.
Andy Clarke
Andy Clarke
R a i l s - t o - Trails Conserv a n c y
Colorado DOT, Andy Clarke
R a i l s - t o - Trails Conserv a n c y
Illinois DOT
J e ff Olson (NYSDOT), Andy Clarke
Andy Clarke
Anita Jenkins
Ryan Snyder
Andy Clarke
P h o t o d i s c
Mark Adams
Eric Dibner
Safe Moves
City of Port l a n d
Andy Clarke
Andy Clarke
Ritch Vi o l a
Andy Clarke
S p o rt s w o r k s
City of Chicago
Ryan Snyder
a c r o n y m s a n dc r e d i t s
B E S T P R A C T I C E S
AA S H T O. . . .American Association of State Highway and Tr a n s p o rtation Off i c i a l s
A P B P . . . . . . . . .Association of Pedestrian and Bicycle Pro f e s s i o n a l s
C I P . . . . . . . . . . . .Capital Improvement Pro g r a m
C M AQ. . . . . . . .Congestion Mitigation and Air Quality Improvement Pro g r a m
D N R. . . . . . . . . . .D e p a rtment of Natural Resourc e s
D O T . . . . . . . . . .D e p a rtment of Tr a n s p o rt a t i o n
F H WA . . . . . . . .Federal Highway Administration
F R A . . . . . . . . . . .Federal Railroad Administration
FTA . . . . . . . . . . .Federal Transit Administration
I S T E A . . . . . . . .I n t e rmodal Surface Tr a n s p o rtation Efficiency Act of 1991
M U T C D . . . . .Manual of Uniform Tr a ffic Control Devices
M P O . . . . . . . . . .M e t ropolitan Planning Org a n i z a t i o n
N H T SA . . . . . .National Highway Tr a ffic Safety Administration
N RT F. . . . . . . . .National Recreational Trail Fund
RT C . . . . . . . . . . .R a i l s - t o - Trails Conserv a n c y
T E ( P ) . . . . . . . . .Tr a n s p o rtation Enhancement (Pro g r a m )
T I P . . . . . . . . . . . .Tr a n s p o rtation Improvement Pro g r a m

IM P R OV I N G CO N D I T I O N S F O R
B I CYC L I N G A N D WA L K I N G
Written by R a i l s - t o - Trails Conserv a n c y
s t a ff and members of the Association
of Pedestrian and Bicycle Pro f e s s i o n a l s .
Edited by Andy Clarke
Designed by Bob Kiern a n
Printed by ColorCraft of Vi rg i n i a
Special thanks to Susan Dohert y
( RTC), Christopher Douwes, John
Fegan, and Barbara McMillen (FHWA ) ,
Pamela Foggin (FRA), Matt We l b e s
( F TA), and Maria Vegega, Donna
G i l m o re, and Lori Gabrielle Miller
(NHTSA) for their careful review and
comments on various drafts.
Thanks also to the panel of advisors
who helped select the entries, including:
J e ff Olson (New York State DOT), Ti m
Oliver (Maricopa County DOT), Craig
Williams (Illinois DOT), and Rick
Waring (APBP Board ) .

The Oregon Bicycle and Pedestrian Plan, one of the modal
elements of the Oregon Tr a n s p o rtation Plan, carries considerable authority
as it establishes ODOT’s policies re g a rding bicycling and walking. It sets
c o n s t ruction standards for ODOT and offers guidance to local jurisdictions
in establishing their bicycle and pedestrian networks.
Section One: Policy and Action Plan
The first part of the document is a policy and action plan which has a
clear vision statement: Oregon envisions a transportation system where
walking and bicycling are safe and convenient transportation modes for
urban trips.
The importance of these modes is explained from enviro n m e n t a l ,
economic, and social perspectives. Other factors that influence walking
and bicycling, such as land use, are mentioned to put the plan’s goals
in context.
The plan focuses on existing streets in urban areas, where short trips
on foot or by bicycle are most common. Renovating existing streets with
bikeways and walkways is emphasized, because these streets are alre a d y
in place and serve community needs.
The goal is to provide safe, accessible, and convenient bicycling and
walking facilities and to support and encourage increased levels of bicy-
cling and walking. This goal will be implemented by the following action
i t e m s :
Action 1:
P rovide bikeway and walkway systems that are integrated with other trans-
p o rtation systems.
Action 2:
C reate a safe, convenient, and attractive bicycling and walking enviro n m e n t .
Action 3:
Develop education programs that improve bicycle and pedestrian safety.
A distinguishing feature of Oregon’s plan is the recognition that the
Actions will be implemented primarily through good road design. Transport-
ation projects that are designed with consideration of pedestrians’ and
bicyclists’ needs serve all users well. This is a diff e rent approach from the
m o re traditional view of creating a network independent of roads and
s t reets. There f o re, the bulk of the plan is a road design manual. It is the
s o u rce of information for designers, planners, and citizens, when they want
to build streets that accommodate nonmotorized modes.
Section Two: Design
The design section establishes standards for safe and attractive bike-
ways and walkways. High standards are established so facilities do more
than just accommodate current walkers and bicyclist: another goal is to
attract new users. The plan is subdivided into the following sections:
Planning Principles : The planning of walkway and bikeway networks
a d h e res to these principles:
1 . Existing streets must be impro v e d .
2. A rterials are important to pedestrians and bicyclists.
3. Obstacles must be overc o m e .
4. The biggest impediment to walking and bicycling is segregated land
use that creates long distances between origin and destination.
o r e g o n p l a n
B I C Y C L E A N D P E D E S T R I A N P L A N S
O R E G O N B I C YC L E A N D P E D E S T R I A N P L A N
The public involvement
process

Other planning considerations such as public transit and access man-
agement are discussed. Appropriate types of facilities are explained, as
well as techniques to overcome barriers to walking and biking (busy
s t reets, freeway crossings, etc.).
Design Principles :
B i keway Design p resents the various types of on-road bikeways
( s h a red ro a d w a y, shoulder bikeway, and bike lanes), as well as special
considerations such as railroad cro s s i n g s .
Bicycle Pa r k i n g o ffers recommendations for cities to use in their
local ord i n a n c e s .
B i ke Lane Restriping is an effective and inexpensive tre a t m e n t
for improving conditions for bicyclists on existing ro a d s .
Walkway Design covers the basic urban walkway - sidewalks; stan-
d a rds are established to meet ADA re q u i rements; other considerations
such as bus stops and planting strips are pre s e n t e d .
S t reet Crossings a re the greatest challenge to pedestrian mobility;
i m p rovements such as islands and curb extensions are discussed.
Multi-Use Paths, p reviously called “bike paths,” serve pedestrians
and other users. The opportunities and challenges associated with
separated paths are pre s e n t e d .
Intersections and Interc h a n g e s p resent special challenges to
users and designers, since most conflicts occur here; designs to
i m p rove bicycle and pedestrian safety are pre s e n t e d .
S i g n i n g — s t a n d a rdized signs and markings are proposed for State
and local systems.
M a i n t e n a n c e — recommendations are presented that will enable
O D O T, cities, and counties, to keep facilities in a usable condition.
Safety Considerations — the major causes of pedestrian and
bicycle crashes are explored. Engineering, education, and enforcement
solutions are off e re d .
Bicycle Maps — statewide standards for legends help cyclists pick
a route anywhere in the State.
The plan contains close to 200 graphics and over 100 photos, to illus-
trate the designs. These can be used as overheads or slides for classroom
presentations, or modified for use in other documents, such as local plans.
Since its publication in 1996, the Oregon Bicycle and Pedestrian Plan
has been widely distributed in State and around the country and is in
daily use by planners, designers, elected officials, and citizens. The Plan
answers most of the questions fielded by ODOT bicycle and pedestrian
p rogram staff .
M o re than two years in the making, the plan was produced by the
Bicycle and Pedestrian Program Manager in collaboration with the State
advisory committee and ODOT’s in-house graphics department. The public
involvement process solicited hundreds of comments, most of which were
c o n s i d e red and used in the final version. The total cost to produce the
plan is estimated at $40,000: $20,000 in staff time, $10,000 in graphics
and lay-out, $10,000 in printing.
B I C Y C L E A N D P E D E S T R I A N P L A N S
c o n t a c t M I C H A E L R O N K I N
OR E G O N BI C Y C L E A N D PE D E S T R I A N
PR O G R A M
OR E G O N D O T
TR A N S P O RTAT I O N BU I L D I N G, RO O M 2 1 0
SA L E M, OR 97310
(503) 986-3555
E-M A I L: m i c h a e l . p . ro n k i n@o d o t . s t a t e . o r. u s
other ex a m p l e s
N E W J E R S E Y B I CY C L E A N D
P E D E S T R I A N M A S T E R P L A N :
BI L L FE L D M A N, NE W JE R S E Y D O T,
(609) 530-8062
other ex a m p l e s
P E N N S Y LVA N I A BI CY C L E A N D
PE D E S T R I A N M A S T ER P LA N :
DAV E BA C H M A N, PE N ND O T,
(717) 783-8444

The main focus of the Birmingham Area Bicycle, Pe d e s t r i a n
and Greenway Plan is to establish the transportation value of bike-
ways, sidewalks, and trails for Jefferson and Shelby Counties as an ele-
ment of the Long-Range Tr a n s p o rtation Plan. By creating routes which
p rovide linkages to retail establishments, households, schools, re c re-
ational facilities, major employment centers and other destinations, bicy-
cle and pedestrian projects can be justified and programmed for funding
in the five-year Tr a n s p o rtation Improvement Program (TIP).
Funding for the $250,000 plan came from the Congestion Mitigation
and Air Quality Improvement Program. Local match funds were pro v i d e d
by the Birmingham Regional Planning Commission (managing agency),
the City of Birmingham, and Jefferson and Shelby Counties. The consult-
ing team for the project included consultants who were nationally re c o g-
nized in the field of bicycle and pedestrian planning and design as well
as local planning and design firms with experience in greenway planning.
One hallmark of the plan was extensive community participation. An
A d v i s o ry Committee, established by the MPO to guide the project, included
re p resentatives of each participating agency, the Alabama Department of
Tr a n s p o rtation, local citizens, bicycle and pedestrian advocates, local
developers, the Chamber of Commerce, and several local interest gro u p s .
In addition, numerous public meetings and workshops sought public input
and a newsletter provided up-to-date information as the plan developed. A
local advocacy group, the Pedestrian Bicycle Coalition (PBC), was cre a t e d
specifically to support the Plan and encourage its implementation. The
PBC has since incorporated and has become an active player in advocacy
e ff o rts and bicycle education pro g r a m s .
A common problem with bicycle planning is the inability to assess cur-
rent demand for facilities and current level of service provided by the
existing street system. The Plan pioneered the use of several new engi-
neering tools that address these needs — tools that are now being used
in metropolitan areas throughout the country. The Latent Demand Score
estimates the relative level of demand for bicycle travel along specific
t r a n s p o rtation corridors. The Bicycle Level of Service model was used to
estimate current conditions for bicycling on area roadways and used to
identify roadways where improvements are needed due to inadequate trav-
el conditions for bicycles.
Implementation of the Plan is reflected in both the FY 1997 and FY
1998 Tr a n s p o rtation Improvement Program (TIP). A continuing bicycle
and pedestrian planning element has funded a planner to facilitate
p roject development, establish safety programs in local schools, and
develop a public awareness and education program. Seven off - road trail
p rojects have been programmed by the MPO in the TIP at a total cost of
$7.2 million.
In summary, bicycle and pedestrian projects can be justified from a
t r a n s p o rtation perspective and included as part of an are a ’s Long-Range
Tr a n s p o rtation Plan, making them eligible for traditional transport a t i o n
f u n d i n g .
b i r m i n g h a m
B I C Y C L E A N D P E D E S T R I A N P L A N S
c o n t a c t B I L L F O I S Y
B R P C
MA G N O L I A OF F I C E PA R K, SU I T E 2 2 0
2112 11T H AV E . SO U T H
BI R M I N G H A M, AL 35256-3304
(205) 251-8139
(205) 328-3304
E-M A I L:b r p c l@ A L O N L I N E
other ex a m p l e s
N I AG A R A F R O N T I E R
P L A N N I N G C O M M I S S I O N :
TI M TR A B O L D
(716) 856-2026
N O RT H C E N T R A L T E X A S
C O U N C I L O F G O V E R N M E N T S :
MI K E SI M S
(817) 695-9210
B I R M I N G H A M , A L A R E A B I C YC L E , P E D E S T R I A N , A N D G R E E N W A Y P L A N

c o n t a c t B E N G O M B E R G
CH I C A G O DE PA RT M E N T O F TR A N S P O RTAT I O N
RO O M 400, 30 N. LA SA L L E
CH I C A G O, IL 6 0 6 0 2
(312) 744-8093
E-M A I L: b g o m b e rg@c i . c h i . i l . u s
At seven pages, Chicago’s Bike 2000 Plan, looks extremely thin
next to the many weightier bike plans produced under the Interm o d a l
S u rface Tr a n s p o rtation Efficiency Act (ISTEA). Yet the impact of the plan
is a model for other cities.
C h i c a g o ’s post-auto bicycle program began in the mid 1950s with sig-
nificant development of bike paths in parks including Chicago’s cro w n
jewel, the 29-km (18-mile) Lakefront Path. The most recent bicycle pro-
gram renaissance began in 1990 with Mayor Richard M. Daley establish-
ing a bicycle council. The Mayor’s Bicycle Advisory Council became a
showcase for the cooperative eff o rts of the City’s Department of
Tr a n s p o rtation and the local bicycle advocacy group, the Chicagoland
Bicycle Federation. The Council went right to work, starting projects while
simultaneously writing a planning framework. This approach of develop-
ing the blueprints while building continues to energize Chicago’s bicycle
p ro g r a m .
The first projects of the Council included long-discussed Lakefro n t
Path improvements; signed, named connecting street routes between
trails; a bike map; and a parking rack demonstration at 13 municipal
buildings. In the midst of these projects the Bike 2000 Plan was written.
The purpose of the Plan there f o re was not to figure out what to do first, but
what to do next. In the middle of the drafting of the Bike 2000 Plan,
C o n g ress passed ISTEA, just in time to provide new funding opport u n i t i e s
for the proposed pro j e c t s .
Mayor Daley announced the Bike 2000 Plan during Bike to Work We e k
in May 1992. In his speech, he was able to introduce not only the plan but
also the bike racks and routes that had already been achieved. This set a
p a t t e rn for annual pro g ress re p o rts. Every year at the Bike Week rally the
Mayor re p o rts on what has been accomplished in the past year.
The main goal of the Bike 2000 Plan is for 10% of all short (8 km (5
miles) and under) individual vehicle (single occupant) trips to be by bicy-
cle by the year 2000. The Bike 2000 Plan contains 29 re c o m m e n d a t i o n s
o rganized into Education, Encouragement, Engineering, and Enforc e m e n t
categories. As of this writing there has been significant action on 28 items
and the remaining one is under discussion.
Many of the important policy and network details that are included in
m o re comprehensive bicycle plans such as Houston’s or New York City’s are
only now being developed in Chicago. A comprehensive survey of off - s t re e t
trail opportunities with a focus on active and abandoned rail corridors was
completed in 1997. A plan identifying an on-street network of bikeways
and accordant implementation of policies will be completed in 1998. The
latter will draw on lessons from the 1996 installation of 40 km (25 miles)
of bike lanes.
In all of Chicago’s most significant accomplishments, there is a common
p a t t e rn. First, a small demonstration project is attempted usually using
exclusively local funds. With experience, the project is modified and the
successful components are expanded, usually with State and Federal fund-
ing. Starting small helps everyone gain experience with a proposed pro g r a m
and feedback develops ownership in a program. It is ultimately this bro a d
based ownership that makes Chicago’s bicycle program so vital. Political
leadership, the city staff, and public interest groups work together for the
success of the program and understand each other’s intere s t s .
c h i c a g o p l a n
B I C Y C L E A N D P E D E S T R I A N P L A N S
other ex a m p l e s
N E W Y O R K C I T Y B I CY C L E M A S T E R P L A N :
JA C K S O N WA N D R E S, BI C Y C L E NE T W O R K DE V E L O P M E N T PR O G R A M, DE PA RT M E N T O F
PL A N N I N G, 2 LA FAY E T T E ST., SU I T E 1200, NE W YO R K, NY 10007, (212) 442-4640 (FA X)
C O M P R E H E N S I V E B I K E WA Y P L A N O F T H E C I T Y O F H O U S T O N :
GU S NO WA K, PE, CI T Y O F HO U S T O N, PU B L I C WO R K S A N D EN G I N E E R I N G DE PA RT M E N T,
PO BO X 1562, HO U S T O N, TX 77251-1562.
P L A N N I N G T O M A K E C H I C AG O B I C YC L E - F R I E N D L Y

HomeHome
Portland, OR is considered one of the country’s most bicycle-
friendly cities. Half a million residents live in the City of Portland (over
1.2 million in the Portland Metropolitan Region), surrounded by hills,
f a rms, and forests. Its climate is mild, with an average 1,000-1,250 mm
(40 to 50 inches) of rain falling between October and June. Port l a n d ’s
hills, rain, and rising levels of traffic congestion are indeed impediments
to bicycling. Yet, in October 1995, it was selected by Bicycling Magazine
as the most bicycle friendly large city in the United States. How did it get
t h e re?
In large part, Port l a n d ’s success is due to a long-standing commitment
to improving the bicycling environment. As early as 1971, Ore g o n ’s lead-
ers adopted State law ORS 366.514, requiring cities and counties to
spend a minimum of one percent of transportation revenues on bikeways
and walkways and include bikeways and walkways as part of roadway con-
s t ruction and re c o n s t ruction. Curre n t l y, Portland spends between four and
12 percent of its annual transportation budget on bicycle-related pro j e c t s
and maintenance.
In 1973, Port l a n d ’s first Bicycle Plan was developed by a re s i d e n t s ’
task force. This eff o rt led to the creation of the City’s Bicycle Pro g r a m —
one of the country ’s oldest. Vo l u n t a ry citizen re p resentation was main-
tained through a Bicycle Advisory Committee, a group of residents appoint-
ed by City Council to advise on all matters related to bicycling. Port l a n d
has also benefited from the organized advocacy eff o rts for the past 10
years of the Bicycle Tr a n s p o rtation Alliance. Its eff o rts have led to
i n c reased government and public awareness and support for bicycle issues.
To d a y, the bicycle is a key means of transportation for thousands of
P o rtland residents and a desired means of transportation for many thou-
sands more. Over half of Portland residents own a bicycle and ride at least
o c c a s i o n a l l y. Bicycle use is rising rapidly. Overall, the bicycle share of
trips is about two percent in Portland, rising to 3.3 percent of trips in the
i n n e r, more dense areas of town. For example, while only 200 cyclists per
day were re c o rded on the Hawthorne Bridge in 1975, by 1997 this num-
ber had climbed to over 2,200. Similar increases have been documented
at numerous locations throughout the City.
Many aspects of Portland encourage bicycle use. The City has installed
over 320 km (200 miles) of bikeways —bicycle lanes, bicycle boulevard s ,
and off - s t reet paths. Over 80 km (50 miles) have been added in just the
last two years, while an additional 40 to 50 km (25 to 32 miles) are
planned annually. In addition, Portland maintains the integrity of the
bikeway network through regular maintenance as well as responding to
hotline, web page, and postcard requests. Portland has installed loop
detector markings to assist bicyclists in activating signals; replaced or
re t rofitted many of its dangerous grates; and trained staff throughout the
C i t y ’s agencies to look for potential bikeway improvements.
Cyclists park at over 3,000 publicly-installed bicycle parking spaces
or rent longer- t e rm space at one of 250 bicycle lockers. The City code was
recently modified to re q u i re new and re c o n s t ructing buildings to install
both short- and long-term bicycle parking. Bicycle commuters can also
take advantage of five “Bike Central” stations (providing showers, chang-
ing facilities, and long-term bicycle storage).
The City annually distributes free bicycle maps and safety inform a t i o n
to over 10,000 residents and helps to sponsor numerous community
bicycling events.
p o r t l a n d ,o r e g o n
C O M M U N I T Y F O C U S
By Mia Birk, City of Po r t l a n d
0 2
C I T Y O F P O RT LA N D — A T O T A L C O M M I T M E N T T O B I C YC L I N G
Portland, OR

HomeHome
c o n t a c t M I A B I R K
CI T Y O F PO RT L A N D
BU R E A U O F TR A F F I C MA N A G E M E N T
1120 S.W. 5T H AV E., RO O M 7 3 0
PO RT L A N D, OR 97204
(503) 823-7082
E-M A I L: m b i r k @ s y s e n g . c i . p o rt l a n d . o r. u s
WE B PA G E: w w w. t r a n s . c i . p o rt l a n d . o r. u s
O R C A L L (503) 823-CYCL.
A commitment toward bicycling by its regional partners, including the
O regon Department of Tr a n s p o rtation (ODOT), Metro (the regional govern-
ment), and the neighboring counties (Clackamas, Multnomah, and
Washington) also contributes to an improving bicycling enviro n m e n t .
ODOT has been working to place bicycle lanes on its streets ru n n i n g
t h rough Portland. Metro has been leading an eff o rt to ensure that future
land-use development encourages balanced transportation options,
including bicycle transportation. The three neighboring counties have
adopted bicycle master plans and are working with Portland to ensure that
bikeways are connected. Another key regional partner is Tri-Met (the local
transit system), whose entire bus fleet is equipped with bicycle racks, and
who allows bicyclists on the light rail train (MAX). There are over 80,000
bicycle trips on MAX or bus annually.
In addition, many organizations and businesses offer their energy and
commitment to improve the bicycling environment. Port l a n d ’s Parks
B u reau and Metro ’s Greenspaces Program are installing dozens of kilo-
meters of off - s t reet paths, such as the
Springwater corridor and Eastside
Esplanade. More than three dozen
bicycle shops provide crucial serv i c e s
to Portland cycl ists. There is an
i m p ressive array of advocacy, educa-
tion, and riding groups, including the
Bicycle Tr a n s p o rtation Alliance (spon-
sor of the annual Bike Month), Kaiser Perm a n e n t e ’s Injury Pre v e n t i o n
P rogram, Portland United Mountain Pedalers, and Portland Wheelmen
Touring Club. The Portland Police Bureau and the Office of Transportation’s
Parking Patrol use bicycles, as do some of Portland General Electric’s meter
readers.
F i n a l l y, a diverse coalition of educators, administrators, bicycle advo-
cates, and government agencies are working to make bicycling a more
viable and safe option for children. These eff o rts include the Office of
Tr a n s p o rt a t i o n ’s Tr a ffic Calming Program (installing speed humps and
signal beacons around schools), Community Tr a ffic Safety Pro g r a m ( K i d s
on the Move safety curriculum, For Kids’ Sake Slow Down campaign, and
bicycle safety workshops), and Bicycle Program (installing bicycle racks
at, and bikeways to, schools). Others involved include Portland Public
Schools, parents, educators, the Community Cycling Center (teaching
c h i l d ren bicycle safety, re p a i r, and riding skills), and numerous gro u p s
working to increase helmet use.
While Portland has a tremendous amount of community support and
momentum, it still has a long way to go to be truly bicycle-friendly. Its
Bicycle Master Plan (adopted May of 1996), presents the blueprint for the
f u t u re: a 1,000 km (630 mile), well-maintained bikeway network; short -
and long-term bicycle parking at every cyclist destination; full integration
with transit; and comprehensive bicycle safety education for all re s i d e n t s .
The realization of this vision is intended to achieve a 10 percent mode
s h a re and a dropping bicycle-motor vehicle crash rate. Portland is totally
committed to making bicycling an integral part of daily life.
C O M M U N I T Y F O C U S
C ity of Portland—A To tal Com m it m ent to Bic ycl i n g
0 3
Portland: Bikes on Bu se s

HomeHome
In Davis, CA the city logo is a bicycle, more than 20 percent of
trips are made by bicycle, there are no school buses (everyone walks or
bicycles to school) and the local micro bre w e ry brews a “bicyclists beer”.
Many consider Davis, population 55,000, to be the most bicycle friendly
city in the United States.
Bicycle lanes are striped on 56 km (35 miles) of the city’s 170 km
(107-mile) street network. There are another 56 km (35 miles) of sepa-
rated off - road trails and bike paths, sometimes paralleling the city’s
major roads but more often extending beyond the highway system. As an
example, the campus of the University of California at Davis is highly
accessible by bicycle on a system of trails that has all but re p l a c e d
roads. Eleven grade-separated intersections carry the trail system over or
under major highways throughout the city. The result is that more than
80 percent of the major roads (arterials) in the city have either a parallel
path or striped bike lane, making bicycle travel safe enough for all ages.
The City and University authorities have worked together closely to
plan, develop and maintain the bicycling infrastru c t u re. All new devel-
opments are re q u i red to incorporate bicycling provisions: new buildings
must have bicycle parking; new roads must have space for bicyclists; and
housing areas must be connected to the bicycling network and to each
other with short sections of trail. Over the course of 35 years, building
bicycling into the fabric of the city has become the norm .
Davis also boasts a number of interesting and unique features and
with thousands of bicyclists in such a small area the city is something of
a laboratory. For example, you can see almost every conceivable type of
bicycle parking device — and the way it is used or abused — somewhere
in the city.
B i ke lanes: the city has bike lanes on streets with and without on-
s t reet parking, and on all classifications of street. The bike lanes are typ-
ically at least 1.5 meters (five feet) wide, and often wider to allow
cyclists to ride two-abreast or to pass each other. Shared parking and
bike lanes are usually 5 meters (15 feet) wide and the corners of the car
parking stalls are marked with white paint. There are numerous inter-
sections where right-turning traffic is placed to the right of the bike lane
— allowing straight-ahead bicyclists to avoid conflict with turning cars.
Ro u n d a b o u t s : the trail system on the UC Davis campus carr i e s
huge volumes of bicyclists, especially between classes and at the start
and finish of the school day. Traditional intersection designs were insuf-
ficient to cope with the volume and so roundabouts were installed at the
busier locations.
Bicycle-sensitive traffic signal detectors: bicyclists in Davis
r a rely have to worry about traffic signals detecting their pre s e n c e .
Bicycle sensitive loop detectors are installed at most signalized inter-
sections and at some the “best” place for bicyclists to stop is shown with
a white painted bicycle symbol. These are commonly used where bicycle
lanes are located between the through- and right-turning traffic lanes.
Bicycle Traffic Signals: one major intersection on the edge of the
university campus has peak hour flows of more than 2,300 cars and
1,100 bicyclists (and more than a few pedestrians) and in one two-year
period there were 16 car-bike collisions. The city responded by installing
t r a ffic signals with special bicycle symbols and adding a 30-second
“bikes only” phase in the signal timing. This time allows bicyclists to
clear the intersection with minimum conflict and delays for every o n e —
and there were no re p o rted crashes in the year following the experiment.
The bicycle signals are now being used at six other locations around the city.
d a v i s,c a l i f o r n i a
C O M M U N I T Y F O C U S
By Andy Clarke, Ra i l s -to -T rails Con se r va n c y
0 4
D A V I S , C A : A B I C YC L E F R I E N D L Y C I T Y
c o n t a c t T I M B U S T O S
CI T Y O F DAV I S
23 RU S S E L L BO U L E VA R D
DAV I S , CA 956 16
(916 ) 757-5 686
E-M A I L: b i k e c z a r@w h e e l . d e n . d a v i s . c a . u s
D av is, CA

HomeHome
c o l d c l i m a t e s
C O M M U N I T Y F O C U S
By Robert Lau rie, Alaska Dep a r t m ent of Tra n spo r tat i on
0 5
The northern city of Anchorage, AK boasts of one of the most
extensive urban trail systems in the nation. With more than 400 km (250
miles) of biking, hiking, skiing, dog sled, and equestrian trails within the
city limits, Anchorage offers a multitude of trail choices for its 255,000
residents.
In 1996, the American Hiking Society recognized Anchorage as
one of the top trail towns in the U.S. and the city is proof that a com-
munity does not have to be in the sun belt for its residents to enjoy
the benefits of good trails.
Despite the city’s nort h e rn climate with its short winter days and more
than 1.5 meters (five feet) of snow each winter, Anchorage residents make
full use of their trails year- round. A recent survey completed as part of the
update of the area trails plan showed that nearly 50 percent of the popu-
lation uses the trails in winter on a regular basis. “I don’t think there ’s a
whole lot of diff e rence” between summer and winter use, said Parks and
R e c reation Department employee Pat Tilton, who sees the trails on a daily
basis in his job. The city’s Parks and Recreation Department maintains
m o re than 35 km (22 miles) of trails for winter running and pedestrian use
while nearly 22 km (14 miles) of the more heavily used trails are lighted.
After several years of attempting to plow and sand the trails each winter,
the Parks and Recreation department bowed to the realities of the climate.
The department now drags and packs several trails for Nordic skiers, winter
joggers, mountain bikers, ski jorers, and dog sledders.
Indeed, Anchorage trails exemplify multiple use. Summer users range
from the familiar bicyclists, hikers, in-line skaters, joggers, and along some
trails, equestrians. After the snow flies in late October or early November the
mix includes cross country skiers (both traditional and skate skiers), moun-
tain bikers, joggers, dog sledders, and ski-jorers (cross-country skiers pulled
by dogs in harnesses). A distinctive feature of the Anchorage trail system is
the number of grade separated crossings of major highways. More than two-
dozen over- and underpasses make it possible to travel for almost 32 km (20
miles) without crossing a road at street level. One of the newest overcross-
ings bends above Tudor Road, a five lane principal arterial, to provide the
gentle sweeping turn required by dog teams and to miss some utility lines.
In 1973, there were fewer than 5 km (3 miles) of bike trail in the
m u n i c i p a l i t y. Today there are more than 400 km (250 miles) of trails. Most
of the funding for the system came from State and municipal sources. A
few matching grants from the Land and Water Conservation Fund helped
on some segments. More re c e n t l y, Federal transportation funds (ISTEA)
have been used to complete missing links and bridge major roads. Design
work has begun on major extensions to the Tony Knowles Coastal Trail and
the city’s 1998 Tr a n s p o rtation Improvement Program includes $200,000
for a location study for a key north-south trail.
The key to Anchorage’s success is “major community involvement fro m
the beginning,” according to Tilton, who participated in the first org a n i z-
ing bike ride in 1973. Other communities seeking to match Anchorage’s
achievements should develop a trails plan early on, he says. The plan
should include appropriate standards for the community. For example,
A n c h o r a g e ’s Trail Plan includes standards for dog sled trails as well as
hiking trails. The plan should include a mechanism to protect trail corr i-
dors the community deems important. One of the duties of the Anchorage
Parks and Recreation staff is to review proposed subdivision plats against
the trails plan to ensure trail corridors are pre s e rv e d .
Anchorage is living proof that trail activities needn’t shut down with fall
leaves. Some skeptics in nort h e rn communities may argue against putting
money into trails because they can be used only part of the year. But
A n c h o r a g e ’s experience is that climate is not a valid excuse. Anchorage
trails are used year round and perhaps see a wider variety of users than
trails elsewhere.
c o n t a c t R O B E R T L A U R I E
AL A S K A DE PA RT M E N T O F TR A N S P O RTAT I O N
3132 CH A N N E L DR I V E, RO O M 2 0 0
JU N E A U, AK 99801-7898
(907) 465-6989
E-M A I L: ro b e rt _ l a u r i e @ d o t . s t a t e . a k . u s
other ex a m p l e s
C I T Y O F M A D I S O N , W I :
ART H U R RO S S, (608) 266-6225
B I C YC L I N G A N D W A L K I N G I N A C O L D C L I M AT E
A n c ho rage, AK

King County, WA is the provider of one of the largest trail systems in
the United States. The King County Regional Trail System currently com-
prises nearly 320 km (200 miles) of improved multi-purpose trails. An
additional 110 km (70 miles) of right of way are available within the
public domain await ing improvement, while about 95 km (60 miles)
remains to be acquired. Ultimately, a system of nearly 650 km (400
miles) of facilities serving bicyclists, walkers, runners, equestrians, and a
wide variety of other users is planned.
The regional trails comprise a significant element of King County’s open
space system, and connect urban areas with parks, valleys, mountains, a n d
other communities. The trail system also is intended to provide routes for
wildlife movement and to buffer natural areas from development.
A Variety of Trails and Experiences
The King County Regional Trails System is notable for the variety of
d i ff e rent rights of way used in its development. The County has been at
the fore f ront of conversion of abandoned rail pro p e rties to trail use, both
in the direct acquisition of lines such as that used in the Burke-Gilman
Trail, to railbanking the Cedar River Trail (Milwaukee Road rail line) and
others. The trail system makes extensive use of waterf ront pro p e rties, pre-
s e rving public access along river and lakefronts, while also seeking access
along uti lity corridors, water pipelines, and other linear pro p e rt i e s .
Developer dedications have closed many gaps in the system, and many
kilometers of trails have been added by local jurisdictions extending the
benefit of the regional system into neighborhood trail networks.
The trail system is also notable in its growing stature as a re g i o n a l
nonmotorized transportation network. Working with the King County
D e p a rtment of Tr a n s p o rtation, the Parks Department has been able to
develop the core system to a standard which supports remarkable user
volumes for commuting and other utilitarian trip purposes. Federal trans-
p o rtation funding has enabled the County to focus development of spe-
cific corridors with particular potential for carrying commute traffic to
destinations such as Boeing, the University of Washington, Microsoft, and
to connections with the County’s on-street bicycle network and re g i o n a l
transit. The Washington State Department of Tr a n s p o rtation is investing
significant re s o u rces to making freeway corridors accessible either thro u g h
inclusion of trails within the right of way or by bridging the barriers cre a t e d
by freeway constru c t i o n .
Some of the highlights of the regional trail system include the Burke-
Gilman and Sammamish River Trails, which together allow one to travel
f rom the Fremont neighborhood of Seattle to Marymoor Park in Redmond,
45 km (28 miles) away. The entire trail is paved and offers waterf ront and
water views of the Lake Washington Ship Canal, Lake Union, Lake
Washington, and the Sammamish River. The trail covers everything fro m
the urban landscape of Seattle to the University of Washington campus to
the pre s e rved farmlands of the Sammamish Va l l e y.
Another popular trail is the Snoqualmie Valley Trail, which, when com-
pleted will stretch 58 km (36 miles) from Snohomish County to the nort h
to the Cascade Foothills where the trail joins the Iron Horse Trail, a cro s s -
state rail-trail extending through the Cascades to Idaho. The 29 km (18
miles) of crushed rock and compacted ballast trail that is completed
allows exploration of one of the most beautiful valleys in We s t e rn
Wa s h i n g t o n .
The Interurban Trail and the Green River Trail will eventually comprise
a system of nearly 80 km (50 miles), ranging from the Seattle Wa t e rf ro n t
to the southernmost areas of the County, utilizing riverf ront levees and the
abandoned route of the once-popular Seattle-Tacoma electric commuter
r a i l w a y. The Interurban currently serves a tremendous bicycle commuting
population, and will again serve rail use by allowing bicyclists and pedes-
trians direct access to the Commuter Rail system currently planned to
enter service in King County in 2002.
Fu t u re Challenges
k i n g c o u n t y t r a i l s
O F F - R O A D F A C I L I T I E S
K I N G C O U N T Y R E G I O N A L T R A I L S Y S T E M

c o n t a c t P H I L M I L L E R
KI N G CO U N T Y RO A D S H A R E PR O G R A M
821 SE C O N D AV E . MS65
SE AT T L E WA 9 810 4
(206) 689-47 41
E-M A I L:p h i l . m i l l e r @ m e t ro k c . g o v
other ex a m p l e s
I N DY G R E E N W A Y S P L A N ,
C I T Y O F I N D I A N A P O L I S :
RAY IRV I N
(317) 327-7431
The King County Regional Trail System and its development have set
n u m e rous precedents for other jurisdictions in the central Puget Sound
region, Washington State, and nationally. As the system moves closer to
fulfillment of its original vision, new issues and challenges are emerg i n g
which are pointing to new expectations from users and managers. These
challenges include:
Local System Development
As growth and traffic impacts are increasingly being felt in the ro b u s t
Puget Sound economy of the late 1990s, greater attention is being paid
by neighborhood and community activists to the development of local and
n e i g h b o rhood trail systems. Usually, these systems are established “after
the fact” requiring new approaches to right-of-way acquisition or man-
agement. Other challenges include assumption of liability, systematic
dedication of right of way as part of the development review process, and
e ffective re t rofit of local systems to support both the regional trail system
and local circulation needs.
User Mix
The planning of the regional trail system has sought to anticipate the
need to accommodate an increasingly diverse set of users, with their
a c c o rdingly diff e rent re q u i rements for trail access, design standards, and
f e a t u res specific to particular user groups. While most of the system is
intended to be paved, many if not most trail corridors contain parallel
equestrian facilities, while rural trails leading to the mountains are being
p re p a red to accommodate larger tire bikes (mountain, cross, touring).
While the Regional Trails Plan establishes long term expectations, trail
managers and planners are seemingly always attempting to respond to the
needs of emerging classes of users.
Appropriate and Consistent Regional
Application of Standard s
As more communities develop trail plans and programs intended to
s u p p o rt the Regional Trail vision, a problem recurs in inconsistent appli-
cation of trail standards, design guidelines, and philosophies. King County
uses AASHTO standards as a baseline for system development. Staff is
often working with design consultants to maintain standards which
emphasize safety and utility over landscape values. In the long term ,
e ff o rts at the Puget Sound Regional Council (the local metropolitan plan-
ning organization) to provide an accepted regional standard are expected
to alleviate the pro b l e m .
Summary—A Vision Fu l f i l l e d ?
The development of the King County Regional Trails System has suc-
ceeded beyond the expectations of its founders, in that the system is part
of the commonly and legally acknowledged transportation system of the
C o u n t y, and re p resents far more than linear green spaces. The trails
define and connect communities throughout the County and have devel-
oped into one of the most significant indicators of a quality of life that
continues to attract people to the Nort h w e s t .
O F F - R O A D F A C I L I T I E S

p u rchase the corridor for continued rail service. Railbanking is a pro c e s s
by which unused rail corridors can be pre s e rved for future use and used in
the interim as a trail. Late in 1989, 29 adjacent land owners (unsuccess-
fully) filed suit claiming rights to the portion of the corridor abutting their
p ro p e rt y.
T h roughout these setbacks, the project to turn the former rail line into
a trail was kept alive by the Coalition for the Capital Crescent Trail, a citi-
zen group founded in 1986. They organized clean-up days and walks along
the corridor to increase awareness of the potential trail. Members worked
with the NPS and Montgomery County to maintain agency support. The
Coalition hired a campaign coordinator to persuade the County to buy its
p o rtion of the corridor for $10.5 million in December 1988, and later to
lobby Congress and the D.C. city council to approve the $11 million need-
ed to buy the corridor in the District.
The 18 km (11 mile) Capital Crescent Tr a i l connects downtown
Washington, DC with the Montgomery County, MD suburbs of Bethesda and
Silver Spring. Fourteen kilometers (9 miles) of the trail are paved and the
remainder is surfaced with crushed stone.
The Capital Crescent Trail, an extraordinarily popular urban trail that is
used by thousands of people every week for a wide variety of purposes, is
a great success story because of both its instant popularity and for the way
it came into existence.
The trail runs along a converted CSX spur rail line that, until the early
1980s, was used to del iver coal to a power plant in Georg e t o w n ,
Washington, DC. After the trains stopped running, the lengthy process of
t u rning the corridor into a trail began and after nearly ten years the first
section of the trail was opened to the public. On weekday mornings, the
long-awaited trail is primarily used by commuters and a few early-bird exer-
cisers. After work, the path is more crowded with a mix of re c re a t i o n a l
users and commuters making their way home. On the weekends, the trail
is so heavily used by walkers, runners, in-line skaters, and families push-
ing baby carriages that faster and more confident cyclists often avoid the
trail altogether.
One reason for the relatively slow pace of development of this popular
trail was the number of diff e rent agencies and jurisdictions involved. As
CSX was preparing to abandon the corr i d o r, Montgomery County amended
its master plan to include use of the corridor in Maryland as a trail. In early
1988, the U.S. Army Corps of Engineers announced plans to develop a
trail plan for the corr i d o r, as the right-of-way runs through a re s e rvoir over
which they have jurisdiction. At the same time, the National Park Serv i c e
(NPS) was being urged to support use of the corridor as a trail within the
District of Columbia — NPS was involved because the corridor runs along
the C&O Canal National Historical Park for several kilometers. However,
al l trail development activities were put on hold when, soon after the
Interstate Commerce Commission (now the Surface Tr a n s p o rtation Board )
a p p roved the railbanking of the line, a local businessman attempted to
c a p i t a l c r e s c e n t
O F F - R O A D F A C I L I T I E S
C A PI TA L C R E S C E N T T R A I L

c o n t a c t RICHARD METZINGER
NAT I O N A L PA R K SE RV I C E, NAT I O N A L
CA P I TA L RE G I O N
1100 OH I O DR I V E, SW
WA S H I N G T O N, D.C. 20242-0001
VO I C E: (202) 523-5555
FAX: (202) 523-1322
other ex a m p l e s
C E DA R L A K E T R A I L
RH O N D A RA E
MI N N E A P O L I S TR A N S P O RTAT I O N DE PA RT M E N T
CI T Y HA L L
350 SO U T H FI F T H ST R E E T. RO O M 3 5 0
MI N N E A P O L I S, MN 55415-1316
(612) 673-2411
p u b l i c a t i o n
“ M I L E S T O N E S : 1 9 8 6 - 1 9 9 6 , A
C H R O N O L O G Y O F T H E F I R S T
T E N Y E A R S . ”
PR O D U C E D B Y T H E CO A L I T I O N F O R T H E
CA P I TA L CR E S C E N T TR A I L, P.O. BO X
30703, BE T H E S D A, MD 20824.
other ex a m p l e s
M I N U T E M A N T R A I L
18 K M ( 1 1 -M I L E ) R A I L-T R A I L C O N N E C T I N G
T H R E E BO S T O N S U B U R B S T O T H E M B TA’S
AL E W I F E STAT I O N.
AL A N MCCL E N N E N, JR.
D I R E C T O R, PL A N N I N G & CO M M U N I T Y
DE V E L O P M E N T
TO W N O F AR L I N G T O N
730 MA S S A C H U S E T T S AV E N U E
AR L I N G T O N, MA 02174-4908
(617) 641-4891
c o n t a c t W I L L I A M G R I E S
MO N T G O M E RY CO U N T Y DE PA RT M E N T O F
PA R K S
9500 BR U N E T T AV E N U E
SI LV E R SP R I N G, MD 20901-3299
VO I C E: (301) 495-2535
FAX: (301) 585-1921
In December 1991, the Intermodal Surface Tr a n s p o rtation Eff i c i e n c y
Act (ISTEA) was signed into law, creating new Federal funding opport u n i-
ties for trails. A revised trail plan was completed in May 1992, estimating
development to cost $1.6 million for the portion in Montgomery County.
The County requested $1.3 million in ISTEA funds and in September
1992 received a portion of this request for construction. The first section
of trail opened to the public in December 1993 and additional funding for
the trail was obtained from the Potomac Electric Power Company for an
easement the utility holds in the corr i d o r.
While 18 km (11 miles) of the trail are now open, the trail is not yet
complete. The Coalition is pushing to extend the trail to downtown Silver
Spring, MD, connecting it to the Metro subway station. There is even con-
sideration of running a light-rail transit line along the corridor between
Silver Spring and Bethesda — a good example of the value of railbanking
in pre s e rving corridors for future rail service.
Also at issue is a long tunnel in Bethesda, MD. The tunnel is curre n t l y
closed, forcing trail users to leave the right-of-way for three blocks and use
local streets. While opening the tunnel would minimize use of city stre e t s ,
t h e re are safety concerns about using the tunnel. The tunnel also would
become an issue if light-rail is put in along the corr i d o r — the tunnel is not
wide enough for both rail and trail.
The trail is a critical link in more ways than one. Not only does it con-
nect downtown D.C. with residential suburbs, but it also connects to the
C&O Canal, a 300 km (185-mile) path from downtown Washington to the
w e s t e rn edge of Maryland, and the Rock Creek Park Trail. Eventually, the
Capital Crescent also will link into the Metropolitan Branch Trail and com-
plete a ring of trails around the District of Columbia.
O F F - R O A D F A C I L I T I E S

O F F - R O A D F A C I L I T I E S
As the Interstate era came to a close in the 1980s, bicycle and
pedestrian facilities were more frequently included in Interstate comple-
tion projects. Vi rginia DOT built the Custis Trail along I-66 in suburban
Arlington, VA. Washington State DOT included a multi-use trail in its
re c o n s t ruction of I-90 across Lake Washington and Mercer Island, and the
I-90 tunnel which pierced the Mt. Baker neighborhood of south Seattle.
And, as part of completing the final link of I-70, Colorado DOT built a con-
c rete path beneath the red rock cliffs of Glenwood Canyon just east of
Glenwood Springs, CO.
To d a y, cyclists, in-line skaters, and pedestrians can travel the 88 km
(55 miles) from Glenwood Springs to Vail, in the heart of Colorado’s Rocky
Mountains, on a combination of on- and off - road paths. Some 21 km (13
miles) of this journey is possible because the $500 million project to com-
plete a four-lane interstate highway through Glenwood Canyon included
$50 million for three major mitigation measures: 1) construction of four
rest areas; 2) planting more than 150,000 trees, shrubs, and grasses for
revegetation; and 3) building a trail to maintain direct access to the banks
of the Colorado River (more than 80 pullouts along the old Route 6 would
be eliminated by the new highway).
The trail highlights just two of the many lessons that the Glenwood
Canyon highway project has to teach re g a rding environmental design, inno-
vative construction techniques, and public part i c i p a t i o n :
1 . Incorporation of a trail often benefits the design and cost-eff e c t i v e-
ness of the highway itself. Locating the trail along the retaining wall
between the roadway and the river resulted in low cost, high perf o rm a n c e
flood protection for the wall foot-
ings and highway itself—a l l o w i n g
s p read footings to be used in
place of the much more costly
deep foundat ions because a
rip-rap base and concrete trail
overlay provided sufficient scour
p rotection. The only added cost created by the trail was providing periodic
bridges over the many streams cascading out of canyon draws, and other
finishing touches re q u i red by a trail as opposed to a simple erosion contro l
s t ru c t u re .
2 . Local citizen participation is essential for ensuring the highest
quality p roduct. A Citizens Advisory Committee (CAC) was convened to
watchdog the entire highway project. All design developments had to be
a p p roved by the CAC before any final design or construction could com-
mence. Completion of the trail remained a high priority for the CAC and
they negotiated a compromise between experienced trail interests wanting
a three meter (10 foot) path, and some design engineers and enviro n m e n-
talists seeking to minimize the whole projects footprint by providing only a
two meter (six foot) tre a d w a y. To d a y ’s two-and-a-half meter wide (eight
foot) trail is aligned primarily on the river side of the highway, and along
with four expanded rest areas, provides visitors a higher quality of re c re-
ational access to the river and side canyon trails than before constru c t i o n
of the Interstate.
c o n t a c t R A L P H T R A P A N I
CO L O R A D O D O T
202 CE N T E N N I A L ST.
GL E N W O O D SP R I N G S, CO 8 1 6 0 1
(970) 945-7629
other ex a m p l e s
I - 6 6 I N V I R G I N I A ( CU S T I S TR A I L):
RI T C H VI O L A, AR L I N G T O N CO U N T Y
(703) 358-3699
I - 9 0 I N W A S H I N G T O N (I-90 TR A I L):
MI K E DO R N F E L D, WA S H I N G T O N D O T
(206) 705-7258
G L E N WO O D C A N YO N I - 7 0 R E C R E AT I O N A L T R A I L
g l e nwo o dc a nyo n t r a i l

The 550 km (321 mile) Cowboy Tr a i l spans eight counties between
C h a d ron and Norfolk, Nebraska. Twenty-two kilometers (14 miles) are open
and the rest is under development. The trail will be primarily crushed stone
with concrete in the more built-up urban areas.
On September 7th, 1997, the Nebraska Game and Parks Commission
opened three short segments of what will be the longest rails to trails con-
version in the United States when it is complete. Rails-to-Trails Conserv a n c y
( RTC) purchased the rail corridor in 1994 from Chicago and Nort h w e s t e rn
Tr a n s p o rtation Company for $6 million, railbanked the corr i d o r, and donat-
ed it to the Nebraska State Game and Parks Commission. The value of the
material salvaged from the corridor (tracks, ties, and ballast) more than off-
set the purchase price of the corr i d o r. With the help of $2 million in ISTEA
funds, state support, a $400,000 grant from RTC, and other private
donations and community support, the trail is becoming a re a l i t y.
The corridor is primarily rural in nature, passing through small towns
about every 16 km (10 miles). The corridor traverses diverse terrain, fro m
the western hemisphere ’s largest stabilized sand dune formation to hay
c o u n t ry to the Elkhorn River Va l l e y. The length of the trail, diversity of the
t e rrain, historical significance of the corr i d o r, and the need to address the
c o n c e rns of farmers whose pro p e rty the trail passes through, re q u i red a
c o m p rehensive trail development and management plan.
The Master Plan was developed over two years and started with a mem-
ber of the team walking the entire corr i d o r. During the three-week trek he
photographed and inventoried soil types, hydrology, climate, vegetation,
wildlife, landmarks, buildings, bridges, land use, population and cultural
characteristics, and connecting attractions such as other trails, points of his-
toric significance, and recreational opportunities.
The resulting inventory provides trail users with both educational and
practical information about the corridor and had the additional benefit of
enabling him to contact members of the communities through which the
trail passes.
The plan highlights four notable dimensions of the trail.
1) A consistent and long-term vision is established for the trail to ensure
an efficient and coordinated plan of development. The plan pro v i d e s
speci fications for trail design which a llows f lexibi lity for each
community to develop their portion of the trail in a way that re f l e c t s
their individuality.
2) T h e re is an assurance of the rail corr i d o r’s pre s e rvation, including all
221 bridges, for possible future rail reactivation (as specified under
railbanking legislation).
3) A safe re c reational re s o u rce is created for local families and re s i d e n t s
of all ages and physical abilities.
4) O p p o rtunities are identified to stimulate local economies by encourag-
ing local, State, regional, and national tourism. The plan includes
elements of design, liability issues, and an overall design concept that
will ensure continuity. Lastly, the operational costs were developed,
including proposed management and maintenance policies, develop-
ment priorities, possible partnerships, and estimated costs.
The cost of the plan was $100,000 which was met by a Tr a n s p o rt a t i o n
Enhancements award from the Federal transportation legislation, ISTEA.
The Nebraska Game and Parks Commission used part of the value of the
donated corridor as their match re q u i red in the Tr a n s p o rtation Enhance-
ments pro g r a m .
c o w b o y t r a i l
O F F - R O A D F A C I L I T I E S
c o n t a c t M A R G P E T E R S O N
MA S T E R P L A N PR O J E C T DI R E C T O R
(202) 237-7585
c o n t a c t L A R RY V O E C K S
SM I T H FA L L S STAT E PA R K
NE B R A S K A GA M E A N D PA R K S CO M M I S S I O N
P.O. BO X 3 3 D
SPA R K S, NE B R A S K A 6 9 2 2 0
(402) 376-1306
M A S T E R P L A N O F T H E C O W B OY R E C R E AT I O N A N D N AT U R E T R A I L

When the Missouri-Ka n s a s -Texas Railroad (known as the Katy)
decided to cease operation on its 320 km (200 mile) route from Sedalia
to Machens, MO in 1986, State parks planners and local citizens re c o g-
nized the 100-year old corr i d o r’s potential as a long distance re c re a t i o n
and transportation facility.
One decade later, the Katy Trail State Park grand opening celebration
took place in Jefferson City, Missouri. The Missouri Department of Natural
R e s o u rces (MDNR) was able to acquire the right-of-way with a $2.2 million
contribution by the late Edward D. “Ted” Jones, a St. Louis businessman
who had never before owned a bicycle but recognized the value of pre s e rv-
ing the corr i d o r. Once purchased from the railroad, the MDNR immediately
began developing the swatch of rich, rural farm land along the nort h e rn
bank of the Missouri River as a public-access linear park.
With smaller segments opening since 1990, the Katy Trail is curre n t l y
300 km (185 miles), the longest rails to trails conversion in the United
States. It is operated by the State Department of Natural Resources as part
of the Missouri park system. The total right-of-way spans nine counties, 27
levee districts, and unites 35 (primarily rural) towns ranging in population
f rom under 100 to 75,000. The corridor parallels the original route of
Lewis and Clark and features the nation’s longest center-lift railro a d
bridge, listed on the National Register of Historic Bridges. The entire ro u t e
is part of the American Discovery Trail and will eventually connect Kansas
City to St. Louis by trail. The Katy Trail also is recognized as the first ‘rail-
banked’ corridor in the United States. (Railbanking is a program under the
National Trails System Act that allows for the pre s e rvation of rail corr i d o r s
with their interim use as public trails.)
It is estimated that the trail, with its scenic landscape, packed lime-
stone surface and easy grade (the trail rarely exceeds a 5% grade), attracts
200,000-300,000 users and yields well over $3 million to local re v e n u e
a n n u a l l y. Though the development of the corridor was initially met with
several adjacent landowner challenges, the trail has been credited with the
re s u rrection of the economies of multiple towns s u ffering the ill-effects of
the railroad industry ’s d e p a rt u re. Even some of the most vehement oppo-
nents of the trail project began to realize its potential benefits when, in
1990, the first pilot sections of the trail brought streams of visitors to the
a rea. Within weeks of the first portions opening, an abundance of new and
old ventures appeared on the local landscape, vying for the new tourism
dollars. Restaurants, bed and breakfasts, bicycle sales and service, bicycle
rentals, craft and antique shops, and even wineries now dot the trail.
N u m e rous landowners also operate private campgrounds and re f re s h m e n t
a reas on their pro p e rt y.
In 1992, the department accepted an additional 54 km (33 miles)
between Sedalia and Clinton from the Union Pacific Railroad Company.
The MDNR is working on the remaining sections, with hopes of one day
having a 380 km (233-mile) rail-trail among its park operations.
As its name recognition grows, the Katy Trail State Park has received a
steady increase in visitors. All 22 department-maintained trail heads pro-
vide parking and most provide a range of other amenities, including
re s t rooms, water, bicycle rental, maps, and telephones. The trail is easily
k a t y t r a i l
O F F - R O A D F A C I L I T I E S
T H E K A T Y T R A I L

c o n t a c t WA L L AC E K E C K
MI S S O U R I DE PA RT M E N T O F NAT U R A L
RE S O U R C E S
P.O. BO X 166, BO O N V I L L E, MO 65233
(660) 882-8196
h t t p : / / K a t y t r a i l . S h o w m e s t a t e . c o m
other ex a m p l e s
PR A I R I E S P I R I T RA I L -T R A I L , KS :
TR E N T MCCO W N (913) 448-6767
G H O S T T O W N T R A I L , PA :
ED PAT T E R S O N (412) 463-8636
N E W Y O R K S E A W AY C A N A L
T R A I L , N Y :
JO H N DIMU R A (518) 436-3034
accessed and used with babystrollers and wheelchairs and every mile is
marked with a sign post that corresponds to the traditional railroad mileage
system. While equestrian use will be permitted on the section between
Sedalia and Wi n d s o r, equestrian and motorized equipment (outside of off i-
cial vehicles and motorized wheelchairs) is prohibited. Its popularity has
given rise to numerous newspaper and magazine travel accounts, the Katy
Trail Guidebook series, and even a frequently visited web site.
The MDNR is capitalizing on this popularity by implementing fundrais-
ing and support programs throughout the towns along the trail. The Adopt-
a-Section program supports MDNR operations by allowing trail enthusiasts
to ‘adopt’ a trailhead or a two-mile (3.2 km) section of trail in exchange for
a $100 contribution. Sign posts recognizing the donors are placed along
the corr i d o r. Trail enthusiasts can also purchase inscribed park benches for
$285, with proceeds going toward trail maintenance. A MDNR volunteer
c o o rdinator is currently formulating volunteer task forces within adjacent
towns to handle patrols, natural and historic interpretation, and mainte-
nance in their areas. Program participants will receive a newly developed
trail-wide newsletter.
In addition to the $2.2 million donation from Ted Jones that went to
the acquisition and pre l i m i n a ry development of the corr i d o r, the MDNR has
also received $1,921,734 in ISTEA funds over a period from 1992 to
1996 trail construction and the restoration of several historic railro a d
depots. The Katy Trail operates on an annual budget of $100,000, with the
bulk of the funds devoted to trail maintenance.
O F F - R O A D F A C I L I T I E S

A number of communities have capitalized on the opport u n i t y
to combine trails and greenways within or alongside active rail corr i d o r s .
C u rrently there are 54 open rails-with-trails and over 70 projects in the
works. Not every rail corridor is a candidate for shared use. Out of the 921
open rail-trails only a handful are rails-with-trails. However, as the follow-
ing example illustrates, rails-with-trails can be accomplished with pro p e r
design and a good working relationship with the adjacent railro a d .
The Schuylkill River Trail is a 39 km (24-mile), multi-use path which
connects downtown Philadelphia and Valley Forge National Historic Park.
P o rtions of the trail corridor are shared with Conrail, South East Penn-
sylvania Transit Authority (SEPTA), and PECO Energ y. The 3 meter (10
foot) wide paved trail is open to a multitude of user groups, including peo-
ple with disabilities. About three kilometers (two miles) of the trail is rail-
w i t h - t r a i l .
The trail was built in four phases using Federal Highway funds com-
bined with local taxes. Tr a n s p o rtation Enhancement funds will be used for
a western extension, which also will be a rail-with-trail. The total Federal
and local funding will be $1.3 million.
Land for the trail was secured through fee-simple acquisition and ease-
ments. The Montgomery County Commissioners had a contact with a
Conrail executive. This was helpful in beginning negotiations with Conrail
for an easement for trail purposes within their right-of-way. The easement
within Conrail right-of-way was paid for at fair market value.
Design for the trail within Conrail right-of-way was negotiated by
M o n t g o m e ry County Planning Designers and Conrail engineers. Conrail was
given final say on trail design within their corr i d o r. The easement was non-
specific in terms of design providing a “blank slate” for both parties. This
allowed maximum flexibility during the design process. Conrail would not
allow at-grade crossings of their mainline but approved two crossings of
spur lines used for switching and storing railroad cars. Within the grant of
easement there is a clause that prevents Conrail, except in an emerg e n c y,
f rom parking or stopping its rolling stock or other equipment in any man-
ner on the easement area that will impede the use or safety of the bikeway.
The distance between tracks and trail varies from 4 meters to 1.5 meters
( m e a s u red from the outer edge of the trail to the center line of the adjacent
tracks) with a wood rail fence or grade separation.
Sections of the trail run adjacent to a SEPTA commuter train line. The
trail is not within the SEPTA right-of-way. The rails and track are about 6
meters (20 feet) apart, measured from the outer edge of the trail to the
center line of the adjacent tracks, with some sections separated by a wood
rail fence and others by a culvert. The trail provides nonmotorized access
to several SEPTA stations including the Norristown Tr a n s p o rtation Center
w h e re connections to other forms of transportation can be made.
Liability insurance for the trail is provided in the Montgomery County
Parks umbrella policy. Conrail is indemnified from liability where the trail
is on their right-of-way.
r a i l w i t h t r a i l
O F F - R O A D F A C I L I T I E S
c o n t a c t J O H N W O O D
CH I E F O F OP E N SPA C E PL A N N I N G
MO N T G O M E RY CO U N T Y PL A N N I N G CO M M I S S I O N
PO BO X 3 1 1
NO R R I S T O W N, PA 10404-0311
(610) 278-3736
E-M A I L:m c p c w e b @ m o n t c o p a . o rg
p u b l i c a t i o n
R A I L S W I T H T R A I L S : S H A R I N G
T R A N S P O R T AT I O N C O R R I D O R S
RA I L S-T O- TR A I L S CO N S E RVA N C Y
1100 17T H ST R E E T, 10T H FL O O R
WA S H I N G T O N, DC 20036
(202) 331-9696
other ex a m p l e s
F I V E S T A R T R A I L , PA :
MA L C O M SI A S,
WE S T M O R E L A N D CO U N T Y BU R E A U O F
PA R K S, (412) 830-3962.
T R AV E R S E A R E A R E C R E A T I O N
T R A I L ( T A RT ) , M I : MI K E DI L L E N B E C K,
GR A N D TR AV E R S E CO U N T Y RO A D
CO M M I S S I O N, (616) 922-4848.
S C H U Y L K I L L R I V E R T R A I L , P H I L A D E L PH I A , P A

All trail users have different intere s t s , abilities, skills, and
e x p e rtise. The Universal Trail Assessment Process accurately and objec-
tively documents trail conditions to increase user safety, identify mainte-
nance needs, and enable users to make informed choices about appro p r i-
ate trails.
At the 1990 National Council on Disability hearing (Jackson Hole,
WY), concern was expressed that most trail information was not suff i c i e n t
to allow people with disabilities to determine whether the trail was suited
to their interests and abilities (i.e. accessible). Peter Axelson, a wheel-
chair user, outdoor enthusiast, and founder of Beneficial Designs, decided
to develop a standardized assessment process which would provide accu-
rate and reliable information about trail conditions. A pilot project with
the National Park Service and USDA Forest Service identified five key
f e a t u res which affect trail access: grade, trail width, cross slope, surf a c e
type, and obstacles.
C o n v e rting the raw information into classifications such as moderate
would not give trail users much more information than the existing
“length, elevation” trail signs used on
most trails. Instead, a universal appro a c h
was used to provide information about
trail conditions to all trail users, re g a rd-
less of their abilities. Beneficial Designs
received funding through the Small Business Innovation Researc h
P rogram of the National Center for Medical Rehabilitation Research (part
of the National Institute of Child Health and Human Development at the
National Institutes of Health) to develop the Universal Trail Assessment
P rocess, a standardized, objective method for documenting trail condi-
tions. The Universal Trail Assessment Process re q u i res a team of two to
four people, one of whom has been trained in the process. Simple tools
(compass, tape measure, Smart level, clinometer, etc.) are used to quan-
tify the trail condi tions. Data are processed by computer to gener-
ate Trai l Access I n f o rmation (TAI) and a grade profile of the trail. TA I
p rovides trail data in a form that is useful to trail visitors, and includes
trail length, elevation change, maximum and average cross slopes, and
grades, sites where there are obstacles or the surface type changes, and
the minimum and average width of the trail.
A system of trail access information symbols and trail signage layouts
w e re developed to visually convey TAI in attractive, easy to read form a t s .
The maps contain text, grade profiles with surface information, and a top
view map with symbols showing the sites of major obstacles. Audio
descriptions of trail access information were developed for people with
visual impairm e n t s .
t r a i l a s s e s s m e n t
O F F - R O A D F A C I L I T I E S
c o n t a c t BENEFIC IAL DE SIGNS
5858 EM P I R E GR A D E
SA N TA CR U Z, CA 95060
(408) 429-8447
(408) 423-8450
m a i l @ b e n e f i c i a l d e s i g n s . c o m
T H E U N I V E R S A L T R A I L A S S E S S M E N T P R O C E S S : EN H A N C I N G T R A I L A C C E S S F O R A L L U S E R S

The goals of the City of Seattle’s Bicycle Program a re to get
m o re people bicycling more often and to reduce the number of crashes
involving bicyclists. The intent of the Bike Spot program is to make low
cost improvements (such as maintenance work, signs, and small constru c-
tion projects) that improve bicycle safety and access on Seattle’s stre e t s .
The program relies on citizens to identify problems that need attention
because the bicycling public has the best information as to where pro b-
lems exist and City staff does not have the re s o u rces to identify all the
p roblems that need fixing.
Program Mechanics: The Citizen Bicycling Improvement Request
f o rm is distributed to bike shops, community centers, and published in a
local bicycle club newsletter (see graphic). Individuals provide the location
and nature of the problem; and their name, address, and phone number.
The form has the address of the bicycle program and a place for a stamp.
When the form is received, staff assess the request and call the person who
filled out the form to let them know that: a) the problem will be fixed; b)
the problem needs further investigation; or c) the problem is something
that the bike spot program cannot address. In all cases, the citizen knows
about how long it will take to respond to their request. A pothole, for exam-
ple, may be filled in 24 hours while a bike rack request might take six
weeks to install. The next step is to determine whether a field check is
needed. Ty p i c a l l y, a field check is not needed on routine maintenance
items such as a request to sweep a bike lane but is re q u i red for impro v e-
ments such as the installation of signs and bike racks. If an impro v e m e n t
is approved, a work instruction is sent electronically sent to the appro p r i-
ate City crew who then do the work and notify the bicycle program that the
i m p rovement has been completed. Bicycle program staff then call the cit-
izen who originally made the request to complete the loop.
Fu n d i n g : The program works with existing maintenance pro g r a m s
that pay for many of the bike spot projects. For example, the City’s
“Pothole Ranger” crew does nothing but respond to pothole requests and
the bike spot program simply adds a few requests to this existing pro g r a m .
H o w e v e r, new facilities such as bike racks, new signs, and new bike lanes,
a re directly paid for by the bike spot program. For the past several years,
local funds matched with Federal transportation funds have resulted in a
p rogram ranging from $500,000 to $700,000 per year.
Comments Regarding Program: This is the single most impor-
tant program we administer. Citizens appreciate the quick turn - a round on
the initial phone call. The program is popular with elected officials and other
decision makers since it generates thank you letters and phone calls.
F i n a l l y, it helps the City defend itself against liability claims since we can
demonstrate that we have a safety program that quickly responds to main-
tenance concern s .
s p o t i m p r o v e m e n t
O N - R O A D F A C I L I T I E S
c o n t a c t P ET ER LA G E RW E Y
BI C Y C L E & PE D E S T R I A N CO O R D I N AT O R
CI T Y O F SE AT T L E
600 FO U RT H AV E N U E, SU I T E 7 0 8
SE AT T L E, WA 98104-1879
(206) 684-5108
E-M A I L: p e t e . l a g e rw e y @ c i . s e a t t l e . w a . u s
other ex a m p l e s
C I T Y O F C H IC AG O:
BE N GO M B E R G, (312) 744-8093
E-M A I L:b g o m b e rg @ c i . c h i . i l . u s
M A I N E D O T :
DAV I D NE L S O N, (207) 287-3318
E-M A I L:d a v i d . n e l s o n @ s t a t e . m e . u s
S E A T T L E ’ S B I K E S P O T S A F E T Y P R O G R A M

With the assistance of Transportation Enhancement funds,
the Illinois Department of Tr a n s p o rtation constructed two noteworthy pro-
jects to improve travel conditions for buggies and bicycles in the Amish
region of the State. These projects provided a positive solution to ongoing
operational complications caused by slow moving horse-drawn buggies
operating on State highways.
The large Amish population that resides in East Central Illinois typically
shuns motorized transportation in favor of buggies and bicycles. Because
many of the shoulders on State roadways lacked sufficient paved width,
buggy operators usually were forced to travel in the vehicle lane. Since
their operating speeds are slow and much of the area attracts tourists who
a re unfamiliar with the concept of buggies operating on the ro a d w a y, col-
lisions with motorists overtaking the buggies were not uncommon.
These two projects created a network of accommodating roadways in
the area surrounding the communities of Arthur and Sullivan. In total, they
p rovided 40 km (24 miles) of roadways with 2.5 meter (eight foot) shoul-
ders. While improving the safety of buggy operations was the primary impe-
tus for the project, the project also made it safer and more efficient for
b i c y c l i s t s — bicycle use is very common among the Amish as well. Since
the area has numerous tourist attractions, the provision of paved shoulders
also offers more opportunities for bicycle-tourism. In addition, the area is
primarily farmland and the paved shoulders allow safer operation of slow-
moving farm equipment. The total cost of the work was $2.3 million, with
the first project of 29 km (18 miles) completed in 1993 and the re m a i n d e r
in 1996.
Various States have policies that encourage or re q u i re the provision of
paved shoulders for improving the conditions for nonmotorized travel. For
example, Oregon and Wisconsin both have policies that re q u i re paved
shoulders on roadways where average daily traffic exceeds 1,000 to 1,200
cars. The paved shoulders provide a safer area for bicyclists and other
users to operate away from the traffic lanes and provide numerous other
benefits to the traveling public re g a rdless of their choice of vehicle.
p a v e d s h o u l d e r s
O N - R O A D F A C I L I T I E S
c o n t a c t C R A I G W I L L I A M S
IL L I N O I S DE PA RT M E N T O F TR A N S P O RTAT I O N
2300 S. DI R K S E N PA R K WAY
SP R I N G F I E L D, IL 62764.
(217) 782-3194
other ex a m p l e s
O R E G O N D E PA RT M E N T O F T R A N S P O R T A T I O N :
MI C H A E L RO N K I N (503) 986-3555
W I S C O N S I N D E PA R T M E N T O F T R A N S P O R T AT I O N :
TO M HU B E R (608) 267-0294
I L L I N O I S A C C O M M O D AT E S A M I S H B U G G I E S A N D B I C YC L E S

Pedestrian safety is a national problem, and creating better
s t reet crossings is part of the solution. A number of new best practices
have emerged recently which will make crossing the street safer, including
i m p roved new pavement markings, new “Yield to Pedestrians” devices, and
new applications of lighting and signage. What makes the following exam-
ples “best practices” is the combination of their innovative approach to
safety along with a cost-effective means of providing real solutions.
New Yield to Pedestrians Devices: T h roughout New England,
communities have posted a variety of signs in the middle of the road that
say “Yield to Pedestrians,” “Stop for Pedestrians,” “Give Pedestrians a
Brake,” and other safety messages at crosswalks. For many years, traff i c
engineers have actively tried to remove these signs because they are not
included in the Manual of Uniform Tr a ffic Control Devices (MUTCD).
Communities have resisted removing the signs because they are eff e c t i v e ,
yet at the same time some of their existing signs are either inconsistent
with the vehicle and traffic law, or are made out of metal which could be
a safety hazard if struck by a motor vehicle. The New York State
D e p a rtment of Tr a n s p o rtation (NYSDOT) has come up with an innovative
solution to this problem by creating a new specification for “Yield to
Pedestrians” devices which can be placed in the middle of the road at a
c rosswalk.
The new devices are called SPCCDs, or Supplemental Pedestrian
C rossing Channelizing Devices. They are made out of traffic safety cone
materials and re t ro reflective fabric — there are no metallic parts. The sign
panel is a direct depiction of the New York State Vehicle and Tr a ffic Law,
which states that motorists shall yield to pedestrians when the pedestrian
is in the same half of the roadway as the motorist. This graphic is now
included in the New York State MUTCD and can be used both in the ro a d-
way on the SPCCD, or as a separate roadside sign. The devices were crash
tested by the New Jersey State police, and are being evaluated by the
University of North Carolina Highway Research Center. The standard spec-
ification is available from NYSDOT and the devices are now commerc i a l l y
a v a i l a b l e .
The development of this innovative “Yield to Pedestrians” device*
re p resents a cost effective, tangible change in the way New York does
business. This eff o rt involved teamwork among government agencies, lead-
ership within NYSDOT, and a public-private partnership to bring the idea
to market. With the development of this device, NYSDOT hopes to facili-
tate the national eff o rt to improve safety for pedestrians, who account for
14% of traffic fatalities in the United States. New Jersey, Wa s h i n g t o n
State, and others are developing similar applications. A version of the
SPCCD called the “soft sandwich” is included in the new Washington State
Pedestrian Facilities Guidebook. As one of the first states to formally include
a “Yield to Pedestrians” device in its State MUTCD, New York believes it
has taken a major step towards improved customer service and making
t r a n s p o rtation more user friendly.
New Crosswalk Markings: Two innovative solutions for better
c rosswalks come from Cambridge, Massachusetts and Salt Lake City, Utah.
In Cambridge, a textured thermoplastic crosswalk is being placed in the
pavement while the hot asphalt is being rolled. This provides a much
longer lifespan for the pavement marking material, which heightens long-
t e rm visibility and re t ro f l e c t i v i t y. The Cambridge crosswalks are being
installed with ladder style markings, which are both more visible and
l o n g e r-lasting than the basic two stripe crosswalk. Salt Lake City has gone
one step further in this direction, installing two sections of ladder- s t y l e
markings on either side of a section of unmarked asphalt. This pro v i d e s
nearly identical visibility to the approaching motorist, but leaves the center
of the crosswalk free of pavement marking materials which can be slippery
when wet. Both of these solutions are cost-effective and applicable in all-
weather conditions, making crosswalk markings more effective for pedes-
trians and easier to maintain for public works depart m e n t s .
p e d e s t r i a n s a f e t y
O N - R O A D F A C I L I T I E S
P E D E S T R I A N S A F E T Y D E V I C E S
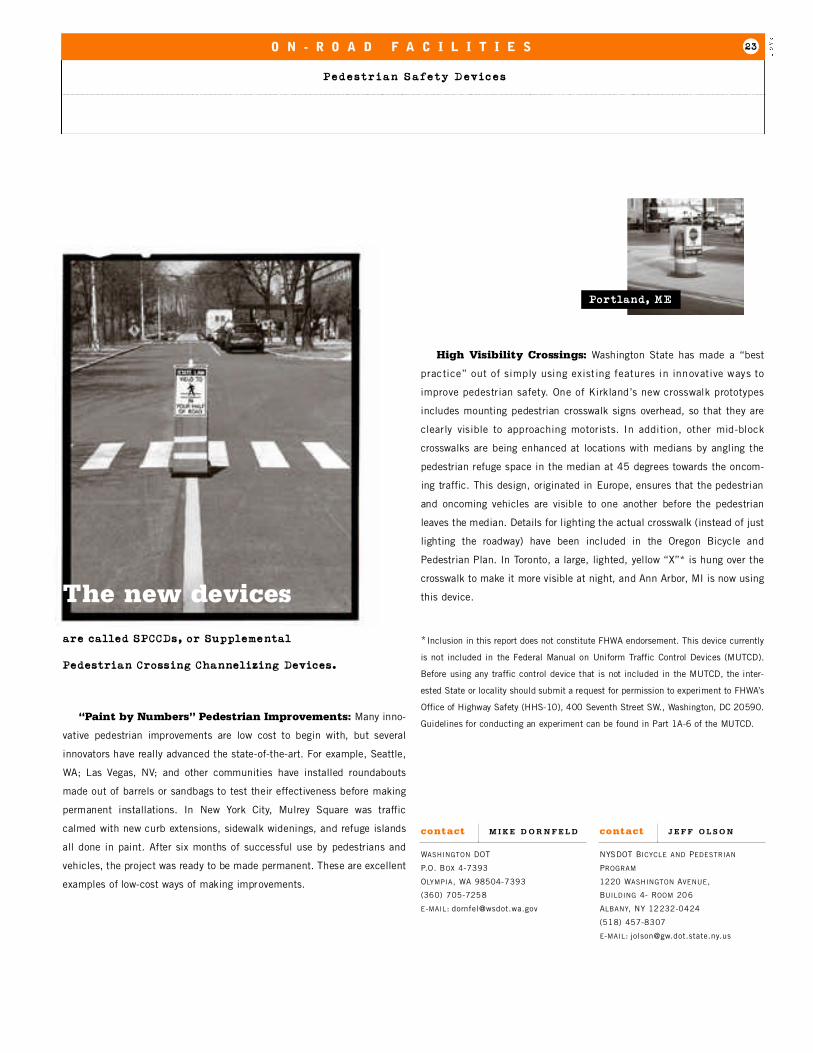
High Visibility Crossings: Washington State has made a “best
practice” out of simply using exist ing features in innovative ways to
i m p rove pedestrian safety. One of Kirkland’s new crosswalk pro t o t y p e s
includes mounting pedestrian crosswalk signs overhead, so that they are
clearly visible to approaching motorists. In addition, other mid-block
c rosswalks are being enhanced at locations with medians by angling the
pedestrian refuge space in the median at 45 degrees towards the oncom-
ing traffic. This design, originated in Europe, ensures that the pedestrian
and oncoming vehicles are visible to one another before the pedestrian
leaves the median. Details for lighting the actual crosswalk (instead of just
lighting the roadway) have been included in the Oregon Bicycle and
Pedestrian Plan. In To ronto, a large, lighted, yellow “X”* is hung over the
c rosswalk to make it more visible at night, and Ann Arbor, MI is now using
this device.
* Inclusion in this report does not constitute FHWA endorsement. This device currently
is not included in the Federal Manual on Uniform Tr a ffic Control Devices (MUTCD).
B e f o re using any traffic control device that is not included in the MUTCD, the inter-
ested State or locality should submit a request for permission to experiment to FHWA’s
O ffice of Highway Safety (HHS-10), 400 Seventh Street SW., Washington, DC 20590.
Guidelines for conducting an experiment can be found in Part 1A-6 of the MUTCD.
O N - R O A D F A C I L I T I E S
c o n t a c t J E F F O L S O N
NYSDOT BI C Y C L E A N D PE D E S T R I A N
PR O G R A M
1220 WA S H I N G T O N AV E N U E,
BU I L D I N G 4- RO O M 206
AL B A N Y, NY 12232-0424
(518) 457-8307
E-M A I L: j o l s o n @ g w. d o t . s t a t e . n y. u s
c o n t a c t M I K E D O R N F E L D
WA S H I N G T O N D O T
P.O. BO X 4 - 7 3 9 3
OLY M P I A, WA 98504-7393
(360) 705-7258
E-M A I L: d o rn f e l @ w s d o t . w a . g o v
The new devices
“ Paint by Numbers” Pedestrian Improvements: Many inno-
vative pedestrian improvements are low cost to begin with, but several
innovators have really advanced the state-of-the-art. For example, Seattle,
WA; Las Vegas, NV; and other communities have installed ro u n d a b o u t s
made out of barrels or sandbags to test their effectiveness before making
p e rmanent installations. In New York City, Mulrey Square was traff i c
calmed with new curb extensions, sidewalk widenings, and refuge islands
all done in paint. After six months of successful use by pedestrians and
vehicles, the project was ready to be made permanent. These are excellent
examples of low-cost ways of making impro v e m e n t s .

“Cities with higher levels of bicycle commuting have on
average 70 percent more bikeways per roadway mile and six times more
bike lanes per roadway mile”, according to a 1993 re p o rt commissioned
by the Federal Highway Administration. Communities across the country
a re confirming this and discovering that something as simple as a 1.2
meter (four feet) or 1.5 meter (five feet) wide lane dedicated for bicycle
travel is enough to transform potential cyclists into actual riders.
In Corvallis, OR, for example, over 90 percent of the collector and art e-
rial streets have striped bike lanes and eight percent of work trips are made
by bike — the highest in the State. The Oregon bicycle program manager
says the lanes “lead to an unparalleled feeling of ease: whether riding a
bike or driving a car, the behavior of the other is pre d i c t a b l e . ”
Indeed, bicycle lanes—defined by the American Association of Highway
and Tr a n s p o rtation Officials as “a portion of the roadway which has been
designated by striping, signing, and pavement markings for the pre f e re n t i a l
or exclusive use of bicyclists”—have been found by numerous re s e a rc h e r s
over the past 20 years to make both bicyclists and drivers more pre d i c t a b l e
and more comfortable with each other’s presence.
A 1996 study on the impact of bicycle lanes in Santa Barbara, CA
found that streets where bike lanes were added saw the number of bicy-
clists increase by 47 percent compared to just one percent on streets with-
out bike lanes. The 48 percent overall increase in cycle use re p resents a
real rise of 19 percent when adjusted for population increases in the city.
Many other communities re p o rt similar experiences. Larger cities such
as San Diego, CA and Tucson, AZ have hundreds of kilometers of bike lanes
on major streets and higher levels of bike use than cities the same size
without these facilities. Eugene, OR, and Madison, WI both enjoy bicycle
travel levels of close to 10 percent of all trips and they have extensive on-
s t reet bicycle lane networks that have been developed over many years.
Bike lanes are no longer the pre s e rve of newer, We s t e rn cities and
college towns. The city of Chicago (40 km (25 miles) in the last year) is
n a rrowly ahead of Philadelphia, New York City, and Houston, in striping and
restriping roads to include bicycle lanes. The city of Seattle, long-considered
a bicycle friendly community, recently embarked on a bike lane striping
p rogram in the downtown area to extend the reach of the regional trail net-
work into the heart of the city.
The basic design of a bike lane is relatively simple and universally fol-
lowed in the communities described above. A minimum of 1.2 meters (4
feet) wide, bike lanes are one-way, on-street lanes for bicycle use that are
marked with a bicycle symbol and the words “bike lane”. They usually go
in the direction of travel and are on the right side of the street. Where park-
ing is allowed, the parking lane may be extended to at least 4 meters (12
feet) to accommodate both parked cars and the bicycle lane — s o m e
communities stripe both sides of the lane, others just the outer stripe.
Design manuals, such as the AASHTO Guide for the Development of Bicycle
Facilities, offer numerous options for integrating bike lanes into intersection
design to minimize potential conflicts.
As experience with bike lanes develops, different applications
a re being tried.
Counter-flow bike lanes: Both Eugene, OR and Madison, WI have
experimented by striping bike lanes on both sides of a one-way street, mak-
ing the street two-way for bicyclists but one-way for motorists. In Eugene,
the counter-flow lane is on a residential road whereas Madison’s is a wide
bike lane on the major street running through the city and University of
Wisconsin campus. After initial concerns (and some design modifications),
the lanes in both communities have been a great success.
b i k e l a n e s
O N - R O A D F A C I L I T I E S
B I K E L A N E S

Left-side bike lanes: Madison, WI also has pioneered the use of
bike lanes striped on the left-side of a one-way street. An important pair of
one-way streets in the heart of the city had predominantly left-turn i n g
movements by bicyclists and thus the bike lane was striped on the left side
of the road. Once again, after a six-month period of adaptation, motorists
and bicyclists in the city have become accustomed to its operation and it
works.
Advanced Stop Lines*: The city of Cambridge, MA has re c e n t l y
restriped a complex signalized intersection with a design that allows bicy-
clists using bicycle lanes to wait at a red light several meters ahead of
other travel lanes. When the light changes, bicyclists can get away quick-
er and make a left turn without conflicting with other traffic.
Blue bicycle lanes: The city of Portland, OR is testing the impact
of painting bike lanes blue as they pass through intersections. Cities in
Denmark, the Netherlands, and
other European countries have
done thi s f o r many year s
(although some choose red or
g reen paint) — this will be the
first known application in the
United States.
O N - R O A D F A C I L I T I E S
c o n t a c t
C I T Y O F M A D I S O N
ART H U R RO S S
215 MA RT I N LU T H E R KI N G JR. BLV D.
P.O. BO X 2 9 8 6
MA D I S O N, WI 53701
(608) 266-6225
E-M A I L: a ro s s @ c i . m a d i s o n . w i . u s
c o n t a c t
C I T Y O F E U G E N E
DI A N E BI S H O P
858 PE A R L ST R E E T
EU G E N E, OR 97401
(503) 687-5298
E-M A I L: d i a n e . l . b i s h o p @ c i . e u g e n e . o r. u s
c o n t a c t
C I T Y O F P H I L A D E L P H I A
TO M BR A N I G A N
1401 JFK BLV D., RO O M 8 3 0
PH I L A D E L P H I A, PA 19102-1676
(215) 686-5514
E-M A I L: t h o m a s . b r a n i g a n @ p h i l a . g o v
c o n t a c t
C I T Y O F T U C S O N
KE I T H WA L Z A K
201 NO RT H ST O N E
P.O. BO X 2 7 2 1 0
TU C S O N, AZ 85726
(520) 791-4372
E-M A I L: k w a l z a k @ c i . t u c s o n . a z . u s
c o n t a c t
C I T Y O F P O R T L A N D
MI A BI R K
1120 SW 5T H AV E. “730
PO RT L A N D, OR 97204
(503) 823-7028
E-M A I L: m b i r k @ s y s e n g . c i . p o rt l a n d . o r. u s
c o n t a c t
C I T Y O F C A M B R I D G E
CA R A SE I D E R M A N
57 IN M A N ST R E E T
CA M B R I D G E, MA 02139
(617) 349-4629
E-M A I L: s e i d e rm a n @ c i . c a m b r i d g e . m a . u s
* Inclusion in this re p o rt does not constitute FHWA endorsement. This device
c u rrently is not included in the Federal Manual on Uniform Tr a ffic Control Devices
(MUTCD). Before using any traffic control device that is not included in the MUTCD,
the interested State or locality should submit a request for permission to experiment
to FHWA’s Office of Highway Safety (HHS-10), 400 Seventh Street SW., Wa s h i n g t o n ,
DC 20590. Guidelines for conducting an experiment can be found in Part 1A-6 of the
M U T C D .

The idea of streetscape is now commonplace in the context of
urban design, redevelopment, and community planning. In Collier County,
FL, the urban design phase of all planned developments includes extensive
landscape arc h i t e c t u re. Entry features, landscaped medians, and edge
t reatments are all part of the development identity. In addition, the
s t re e t s c a pe —landscaping, streetlights, benches, bike racks, and t r a s h
re c e p t a c l e s — becomes a major component of the redevelopment of stre e t s .
Collier County has also included streetscape in its overall community plan-
ning with the development and adoption of a Streetscape Master Plan.
Landscaping makes a tremendous impact on street appearance.
A p p ropriate median and edge plantings are vital to creating attractive ro a d-
ways. Street planting can create or re i n f o rce the identity of a street: tre e s ,
s h rubs, and ground cover and their related spacing along the street estab-
lish a pattern which can make the street memorable.
Medians also benefit pedestrians by simplifying the crossing pro c e d u re ,
especially on multi-lane roads. A median refuge allows pedestrians to cro s s
one direction of traffic and wait safely before crossing the next lanes of
t r a ffic. Landscaping the edges of roadways also benefits pedestrians by
p roviding shade, interest, and an additional perceived barrier between the
roadway and sidewalk.
Collier County has taken a comprehensive approach to implement the
s t reetscape of all the major arterial roadways within the urban area. Collier
C o u n t y, the City of Naples, and private enterprise have combined re s o u rc e s
to create and maintain an outstanding streetscape program. This
public/private partnership has developed a “signature” for Naples and
Collier County over the past decade.
The Development of the Streetscape Master Plan (SSMP) has been a 3-
step process over the past three years. The first step involved data
g a t h e r i n g . State, County, and City design standards were assembled
along with major roadway development schedules. Using the Metro p o l i t a n
Planning Org a n i z a t i o n ’s 15-Year Plan as a guide, a network of divided high-
ways was established as the boundary for the SSMP in urbanized Collier
C o u n t y. A shorter action plan relating to Collier County’s 5-Year Highway
I m p rovement Plan was also identified as the near term landscape imple-
mentation schedule. A major product from the data gathering phase was
the establishment of the urban area streetscape network.
The second step involved a character analysis. Va r i o u s
s t reetscape zones were determined by identifying the character of the
s t reet. Proposed landscaping should be inspired by existing, positive site
characteristics. The character of a street is defined by the existing and pro-
posed land uses, existing vegetation, natural and unique features, views,
and topography.
Character zones were assigned to each street, as appropriate, to guide
landscape design. Character zones that were established include the
Activity Center Zone, Residential Zone, Util ity Zone, Gateway Zone,
Urban/Residential Zone, Agricultural Zone, and Conservation Zone.
The third and final step was implementation. T h e
S t reetscape Master Plan recognized both policies and design in order to be
site specific, memorable, and implementable. The Streetscape Master
Plan was adopted by the Collier County Board of County Commissioners on
May 30, 1997. It is incorporated by re f e rence into the Collier County Land
Development Code as a public road rights-of-way, median, and re q u i re d
adjacent landscape buffer development and maintenance guideline.
The landscaping of streets in both
planned developments and along the
major arterials has created a memo-
rable signature for Naples and Collier
C o u n t y, FL.c o n t a c t A N I TA J E N K I N S
WI L S O N, MI L L E R, BA RT O N A N D PE E K
3200 BA I L E Y LA N E, SU I T E 2 0 0
NA P L E S, FL 34105-8507
(941) 649-4040
E-M A I L: n a p l e s @ w i l s o n m i l l e r. c o m
s t r e e t s c a p e
O N - R O A D F A C I L I T I E S
S T R E E TS C A P E : A C O M P R E H E N S I V E A P P R O A C H

B ryant Street. At the same time, the City has removed many stop signs that
impeded bicycle travel. Bryant Street has become a quiet, tree-lined re s i-
dential street that is fast and peaceful for bicyclists and pedestrians. The
City has also signed the bike boulevard well with directional and destina-
tion information. As a result, over 600 bicyclists ride on Bryant Street on
a typical day.
The first three kilometers (two miles) of Bryant Street were convert e d
into a bike boulevard in 1982. In 1992, the City extended the bike
b o u l e v a rd two km (1.25 miles) north to the city limit, but not without
c o n t ro v e r s y. The City tried temporary barriers for six months and later
modified the treatment with permanent fixtures. Many people had con-
c e rns over the diversion of traffic from Bryant Street to adjacent stre e t s
and as part of the permanent solution, the City put a traffic circle in one
intersection to slow motor vehicles instead of block them. This compro-
mise won over many locals.
The City has heard few complaints from residents on Bryant Street. The
necessity to drive a car a little further to circumvent barriers is traded for
the serenity of living on a quiet street. Most seem to like it.
Bike boulevards may work in other communities. The streets must be
selected carefully so as to not divert traffic onto neighboring re s i d e n t i a l
s t reets. Residential streets flanked on both sides by arterial streets may
be the best candidates. Wherever cities try bike boulevards, temporary
f i x t u res during trial periods can improve the design, as well as gain public
a c c e p t a n c e .
b i c y c le b o u l e v a r d
O N - R O A D F A C I L I T I E S
Palo Alto, CA has pioneered a potential solution to planners
attempting to re t rofit older cities with bikeways: bicycle boulevard s .
O p p o rtunities to create space for bike lanes on city streets are often limit-
ed by physical and political constraints. Restriping streets with narro w e r
travel lanes is the easiest, cheapest, and most politically acceptable
means, but many streets do not have room for bike lanes, even if the travel
lanes are restriped. Widening can be expensive; removing parking can
mean political suicide; narrowing sidewalks worsens the pedestrians’ lot;
and reducing the number of lanes on a street runs counter to conventional
w i s d o m .
These constraints typically mean bicyclists must forego bike lanes on
many streets where they are needed. Palo Alto’s bicycle boulevard pro v i d e s
another option. Bryant Street has been converted to a bike boulevard with
t r a ffic control devices that prevent motorists from using the street as a
t h o ro u g h f a re, while improving the speed of bicycle travel. The bike boule-
v a rd extends about five km (three miles) through residential neighbor-
hoods, as well as downtown. Several barriers and landscaped islands allow
bicycles and pedestrians to travel through, but prohibit cars from using
B ryant Street as a through street. In one spot, a bridge over a creek is too
n a rrow for cars, but just right for bikes. Tr a ffic signals allow only bicyclists
and pedestrians to go through one intersection with an arterial street, while
motor vehicles must turn. These devices cause most motorists to opt for
s t reets where they can go faster and further and only local motorists use
c o n t a c t CITY OF PALO ALT O
CA R L ST O F F E L
P.O. BO X 1 0 2 5 0
PA L O ALT O, C A 94 303
(415) 3 29- 255 2
other ex a m p l e s
C I T Y O F S E AT T L E , W A :
PE T E R LA G E RW E Y
(206) 684-5108
E-M A I L: p e t e . l a g e rw e y @ c i . s e a t t l e . w a . u s
C I T Y O F P O R T L A N D , O R :
M I A B I R K
(503) 823-7082
E-M A I L: m b i r k @ s y s e n g . c i . p o rt l a n d . o r. u s
B I C YC L E B O U L E V A R D I N P A L O A L T O

Of all the traffic calming devices used in Seattle, t r a ff i c
c i rcles have proven to be the most effective at solving neighborhood traff i c
concerns. Since 1973, more than 600 traffic circles have been constructed
in Seattle and the Neighborhood Tr a ffic Calming Program (NTCP) staff
receive about 600 requests for traffic circles each year. The pro g r a m
is c u rrently funded to construct 30 traffic circles per year.
Potential traffic circle locations are identified through community
requests or investigation of high crash locations. A priority point system,
based on the number of crashes that have occurred at the intersection and
the speed and volume of traffic, is used to rank the locations where traff i c
c i rcles are requested. Funding is allocated starting with the location with
the worst combination of problems. Residents are re q u i red to submit a
petition with signatures re p resenting 60% of households within one block
of the proposed traffic circle. The cost to construct each circle ranges fro m
$3,000 to $6,000.
Each traffic circle is designed individually to fit the intersection. Most
of Seattle’s local streets are 7.6 meters (25 feet) wide or less and traff i c
c i rcles are usually four to five meters (12 to 16 feet) in diameter. All inter-
sections where circles are to be constructed are reviewed by the Fire
D e p a rtment and field tests are conducted where they may have a specific
c o n c e rn. Designs may be adjusted or parking restricted to ensure that fire
t rucks can pass by the circ l e .
All the traffic circles currently under construction are landscaped. The
landscaping plays two important roles, making the circle more attractive to
the neighborhood residents and changing the character of the street to
make it less appealing to drive at high speeds. Local residents are re q u i re d
to maintain the plantings.
Crash reduction is the greatest benefit of traffic circ l e s.
Between 1991 and 1994 a total of 119 traffic circles were constru c t e d
t h rough the NTCP. A comparison of the number of crashes which occurre d
at these intersections in the calendar year before and after constru c t i o n
reveal a 94% reduction in crashes. The number of injuries dropped fro m
153 in the year before construction to one injury in the year after con-
s t ruction. This crash reduction was found to continue in the subsequent
y e a r s .
In addition to reducing collisions, traffic circles also reduce vehicle
speeds without significantly reduced traffic volumes. The minimal impact
on traffic volumes allows circles to be used as a spot safety device without
having to address the impacts of diverting traffic being shifted to other re s-
idential streets. Tr a ffic circles reduce a stre e t ’s attractiveness as a cut
t h rough route by their reduction of traffic speeds.
After over twenty years of experience installing traffic circles, Seattle
has found them to be an effective device for controlling neighborhood traf-
fic and improving the safety of residential stre e t s .
t r a f f i c c a l m i n g
O N - R O A D F A C I L I T I E S
c o n t a c t J I M M U N D E L L
C I T Y O F S E AT T L E
6 0 0 4 T H AV E N U E
S E AT T L E , WA 9 8 1 0 4
( 2 0 6 ) 6 8 4 - 7 5 7 7
N E I G H B O R H O O D T R A F F I C C A L M I N G : S E A T T L E ’ S T R A F F I C C I RC L E S
Publications and contact information:
Additional information including program description, design guidelines,
re p o rts, and a video ($15) may be obtained fro m :

Indianapolis has undertaken a successful large-scale effort
to revitalize its historic downtown based on improving the pedestrian envi-
ronment. The Downtown Corridor Improvement Project, located in down-
town Indianapolis between Washington and Meridian Streets, has been an
integral part of the central business district’s revitalization. By re d u c i n g
t r a ffic on this major thoro u g h f a re and changing it to a more pedestrian-
friendly environment, the city hoped to ensure the success of an adjacent
new major retail, entertainment, and economic development center.
The project achieved four main goals in its design:
1 ) changing the street from being purely uti litarian to having both
function and aesthetic appeal;
2 ) using plantings, street lighting, furnishing, re s u rfacing, and special
paving to create an environment that fosters pedestrians, sidewalk
cafes, and new commercial and retail activities;
3) enabling the street to change its orientation from auto-only to pedes-
trian friendly, including compliance with accessibility guidelines for
the physically-challenged;
4) acknowledging the history of the are a .
Due to the close cooperation of several groups involved in development
of the project, it was completed less than six months after the design was
finalized. Participating groups included the Indiana Department of Capital
Asset Management, Indiana Department of Tr a n s p o rtation, City of
Indianapolis Department of Metropolitan Development, Indianapolis
Downtown, Inc., and Indianapolis Historic Preservation Commission. In addi-
tion, ongoing discussions with the local merchants’ association helped to
ensure that the project was fully supported and fully integrated into the sur-
rounding business district.
Total cost of the project was $5,163,126, of which $4 million was
p rovided through the Tr a n s p o rtation Enhancements program. The City of
Indianapolis contributed the $1,693,126 match.
The re c o n s t ruction has stimulated new businesses to relocate to the
c o rr i d o r, now considered a prestigious retail location near the Circ l e
C e n t e r, the new mixed-use development adjacent to Washington Stre e t .
Although the project was completed quickly and successfully, it did face
an unexpected hurdle because part of the design was considered to have
an adverse affect on the National Register Eligible Historic district known
as the Circle Center historic district. Consequently, in order to advance the
p roject, it was necessary to request comments from the advisory council on
historic pre s e rvation. Ensuring that future projects have received all of the
a p p ropriate historic pre s e rvation reviews in downtown business districts is
essential before the design phase of projects such as this are completed.
i n d i a n a p o l i s
O N - R O A D F A C I L I T I E S
c o n t a c t J I M S HAC K L E F O R D
CI T Y O F IN D I A N A P O L I S
DE PA RT M E N T O F CA P I TA L AS S E T
MA N A G E M E N T, (317) 327-4578
other ex a m p l e s
B R OA D W AY E N H A N C E M E N T P R O J E C T :
VA N HO R N , TX . MA RY TE L L E S - GO I N S , TE X A S D O T, (915 ) 774 -4324
D I X I E H I G H W A Y S I D E W A L K I M P R O V E M E N T S :
F L O R E N C E K Y. RO D N E Y CR I C E, PR O J E C T MA N A G E R , (606) 64 7-5 416
D O W N T O W N C O R R I D O R I M P R O V E M E N T P R O J E C T, I N D I A N A P O L I S , I N
The re c o n s t r u c t i o n

Pedestrian collisions in the United States account for more than
t h ree percent of injury crashes and 14 percent of fatal crashes.
Nationwide, about 37 percent of pedestrian injury crashes and 20 perc e n t
of fatal crashes occur at intersections (U.S. Department of Tr a n s p o rt a t i o n ,
1996). In urban areas pedestrian crashes are even more concentrated at
intersections, rising as high as 51 percent in some communities (Retting,
1993). Public education and enforcement campaigns have tried — b u t
l a rgely failed — to promote lasting pedestrian safety i m p rovements at
intersections. Incre a s i n g l y, however, traffic control measures are being used
to improve pedestrian attention and provide greater separation between
pedestrians and motor vehicles.
Leading Pedestrian Interval Signal Phase
Most traffic signals are designed to release pedestrians and turn i n g
vehicles concurre n t l y, providing little or no time separation. One technique
that can be used to separate pedestrians and turning vehicles in time is to
p rovide a leading pedestrian interval (LPI) which permits pedestrian traff i c
to begin crossing several seconds before the release of potentially
conflicting motor vehicles. Research by Van Houten et al. (1997) has
examined the influence of a three-second LPI on pedestrian behavior and
conflicts with turning vehicles.
Subjects of this re s e a rch were pedestrians crossing at three signalized
intersections in St. Petersburg, FL. Prior to the experiment, signal phasing
at these intersections were configured to provide onset of the pedestrian
walk signal and the green signal for turning vehicles concurre n t l y. During
the experiment, a three-second LPI was installed to release pedestrians
t h ree seconds before turning vehicles.
During the baseline condition, the number of conflicts per 100 pedes-
trians who started crossing during a defined five-second begin walk period,
averaged 3.0, 2.1, and 3.3 for the intersections of 3rd, 4th, and 5th with
Central. After the introduction of the LPI, conflicts were almost non-existent,
averaging 0.1, 0.1, and 0.2. For both seniors and non-seniors there were
fewer conflicts during the LPI condition than during the baseline period,
for both left- and right-turning vehicles.
The experiment also monitored the impact of the LPI on the number of
pedestrians who yielded to turning vehicles. During the baseline condition
the number of pedestrians yielding (per 100 pedestrians crossing) aver-
aged 5.5, 5.2, and 4.4 for the three intersections re s p e c t i v e l y. After the
i n t roduction of the LPI the number of pedestrians yielding averaged 2.5,
2.8, and 4.0.
S u m m a r y
The introduction of a three second LPI reduced conflicts between
pedestrians and turning vehicles, reduced the incidence of pedestrians
yielding the right of way to turning vehicles, and made it somewhat easier
to cross the street by allowing pedestrians to occupy the crosswalk before
t u rning vehicles were permitted to enter the intersection. Once pedestrians
w e re in the crosswalk, drivers acknowledged their presence and were more
likely to yield the right-of-way.
LPIs, in this study, provided a potentially safer and more comfort a b l e
walking environment and should be considered at busy signalized inter-
sections where it is desirable to
reduce conflicts between pedestri-
ans and turning motor vehicles.
c r o s s i n g t i m e
O N - R O A D F A C I L I T I E S
c o n t a c t R IC H A R D RE T T I N G
IN S U R A N C E IN S T I T U T E F O R HI G H WAY
SA F E T Y
1005 N. GL E B E RD., ST E. 800
AR L I N G T O N, VA 22201
(703) 247-1500
c o n t a c t D R . R O N VA N H O UT E N
CE N T E R F O R ED U C AT I O N A N D RE S E A R C H
I N SA F E T Y
17 JO H N BR E N T O N DR I V E
DA RT M O U T H, N.S., CA N A D A, B2X 2V5
(902) 434-6274
P E D E S T R I A N P R I O R I T Y M E A S U R E S
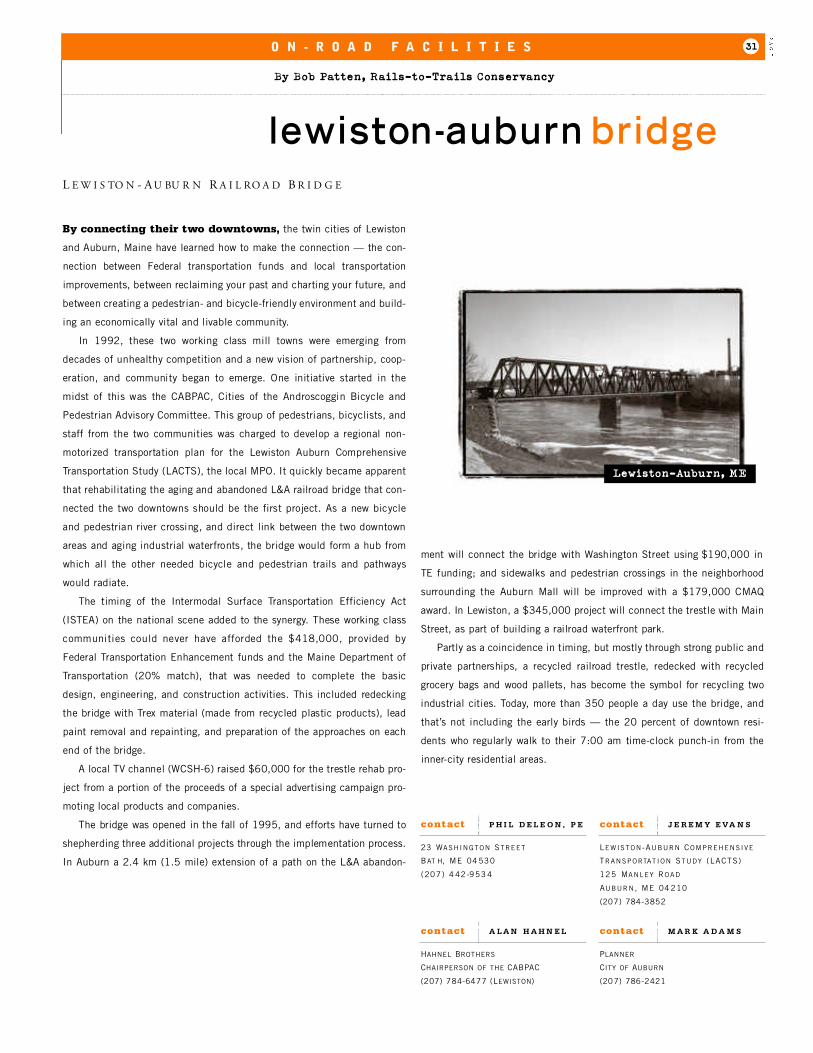
O N - R O A D F A C I L I T I E S
l e w i s ton-a u b u r n b r i d g e
By connecting their two downtowns, the twin cities of Lewiston
and Auburn, Maine have learned how to make the connection — the con-
nection between Federal transportation funds and local transport a t i o n
i m p rovements, between reclaiming your past and charting your future, and
between creating a pedestrian- and bicycle-friendly environment and build-
ing an economically vital and livable community.
In 1992, these two working class mill towns were emerging fro m
decades of unhealthy competition and a new vision of partnership, coop-
eration, and community began to emerge. One initiative started in the
midst of this was the CABPAC, Cities of the Androscoggin Bicycle and
Pedestrian Advisory Committee. This group of pedestrians, bicyclists, and
s t a ff from the two communities was charged to develop a regional non-
motorized transportation plan for the Lewiston Auburn Compre h e n s i v e
Tr a n s p o rtation Study (LACTS), the local MPO. It quickly became appare n t
that rehabilitating the aging and abandoned L&A railroad bridge that con-
nected the two downtowns should be the first project. As a new bicycle
and pedestrian river crossing, and direct link between the two downtown
a reas and aging industrial waterf ronts, the bridge would form a hub fro m
which all the other needed bicycle and pedestrian trails and pathways
would radiate.
The timing of the Intermodal Surface Tr a n s p o rtation Efficiency Act
(ISTEA) on the national scene added to the synerg y. These working class
communities could never have aff o rded the $418,000, provided by
Federal Tr a n s p o rtation Enhancement funds and the Maine Department of
Tr a n s p o rtation (20% match), that was needed to complete the basic
design, engineering, and construction activities. This included re d e c k i n g
the bridge with Trex material (made from recycled plastic products), lead
paint removal and repainting, and preparation of the approaches on each
end of the bridge.
A local TV channel (WCSH-6) raised $60,000 for the trestle rehab pro-
ject from a portion of the proceeds of a special advertising campaign pro-
moting local products and companies.
The bridge was opened in the fall of 1995, and eff o rts have turned to
s h e p h e rding three additional projects through the implementation pro c e s s .
In Auburn a 2.4 km (1.5 mile) extension of a path on the L&A abandon-
ment will connect the bridge with Washington Street using $190,000 in
TE funding; and sidewalks and pedestrian crossings in the neighborh o o d
s u rrounding the Auburn Mall will be improved with a $179,000 CMAQ
a w a rd. In Lewiston, a $345,000 project will connect the trestle with Main
S t reet, as part of building a railroad waterf ront park.
P a rtly as a coincidence in timing, but mostly through strong public and
private partnerships, a recycled railroad trestle, redecked with re c y c l e d
g ro c e ry bags and wood pallets, has become the symbol for recycling two
industrial cities. To d a y, more than 350 people a day use the bridge, and
t h a t ’s not including the early birds — the 20 percent of downtown re s i-
dents who regularly walk to their 7:00 am time-clock punch-in from the
i n n e r-city residential are a s .
L E W I S TO N - A U BU R N R A I L RO A D B R I D G E
c o n t a c t P H I L D E L E O N , P E
23 WA S H I N G T O N ST R E E T
BAT H, ME 04 530
(207) 4 42-953 4
c o n t a c t J E R E M Y E VA N S
LE W I S T O N- AU B U R N CO M P R E H E N S I V E
TR A N S P O RTAT I O N ST U D Y ( L A C T S )
125 MA N L E Y RO A D
AU B U R N , ME 04 210
(207) 784-3852
c o n t a c t A L A N H A H N E L
HA H N E L BR O T H E R S
CH A I R P E R S O N O F T H E C A B PA C
(207) 784-6477 (LE W I S T O N)
c o n t a c t M A R K A D A M S
PL A N N E R
CI T Y O F AU B U R N
(207) 786-2421

Silver City, NM overcame numerous obstacles to re c o n s t ru c t
historic downtown sidewalks to be completely accessible for people with
disabilities. Key factors were an aff i rmative public spirit, methodical plan-
ning that included participation of accessibility specialists, and care f u l
monitoring of construction to meet tolerances.
The sidewalks of downtown Silver City have curbs as high as 800 mm
(32 inches)! The high curbs help check floodwaters funneled into the
n a rrow downtown from the slopes of the Mogollon Mountains. A number of
intersections also have pedestrian bridges that swing into place across the
street during flooding. One flood long ago washed away Main Street, leaving
a fifty-foot deep canyon, now called the Big Ditch, that has been recreated
into a central park.
Mining and outlaws, such as Billy the Kid, helped create the are a ’s
h i s t o ry. To d a y, Silver City’s historic character and year- round pleasant cli-
mate make the community an attractive tourist destination.
The Main Street Project began planning downtown improvements in
1986. Three public meetings targeted a sixteen-block area for sidewalk
re c o n s t ruction. Some of the sidewalks date from 1905-1915, and others
f rom WPA projects in the 1930s. Many street corners had steps instead of
s t a n d a rd curbs. Previously-installed ramps were unsafe and deteriorated.
M e rchants had steps at their doorways, blocking patrons with mobility
i m p a i rments. The major goal was to make the downtown accessible for
pedestrians and keep the old-time flavor.
To address these challenges, the Main Street Project helped the City
apply for ISTEA Enhancement funds. Additional funds came from local
taxes and legislative grants. The City paid for design services from a local
f i rm, Engineers, Inc; and Main Stre e t ’s volunteer staff visited each of 120
residential and business buildings, identifying concerns and solving pro b-
lems. With the help of the local Daily News, these eff o rts garn e red wide
community support .
Early in the design process, the staff consulted with New Mexico
G o v e rn o r’s Committee on Concerns of the Handicapped. This collaboration
resolved the location for accessible parking, developed ramp configura-
tions to take creative advantage of the terrain, and agreed on handrail and
c rosswalk details. Achieving accessibility at each intersection and store-
f ront sometimes called for in-the-field redesign and careful grade contro l .
Instead of following a standard detail, the designers found unique solutions
responsive to site characteristics.
Success depended on the close monitoring of construction, carry i n g
t h rough with the contractor, the State Highway and Tr a n s p o rtation inspec-
t o r, and the accessibility experts to get the details right. The staff com-
mitment to the community’s daily needs kept traffic flowing during con-
s t ruction by building two-block sections on one side of the street at a time.
F i n a l l y, the respect for the community’s historic character is reflected in
sidewalks tinted in sandstone tones so they do not look glaringly new.
For a cost of $1.1 million, including engineering and design, Silver City
c o n s t ructed more than sidewalks. Landscaping with street trees and bor-
der plantings helped re s t o re the historically-correct look. Completing the
p roject on budget allowed the City to use its contingency for benches and
trash containers.
The Silver City Main Street Project received the Quality Aw a rd from the
New Mexico Highway and Tr a n s p o rtation Department for a project with a
local municipal lead. Project leaders have been recognized by the Federal
Access Board and have presented at conferences on the Americans with
Disabilities Act. The future goal for this mountain community include
extending accessibility through the Big Ditch Park.
s i l v e r c i t ys i d e w a l k s
O N - R O A D F A C I L I T I E S
c o n t a c t E R I C D I B N E R
CI T Y O F BE R K E L E Y
2201 DW I G H T WAY
BE R K E L E Y, CA 94704
(510) 644-6506
S I LV E R C I T Y M A I N S T R E E T

s a f e m o v e s
E D U C A T I O N , E N C O U R A G E M E N T , E N F O R C E M E N T
Safe Moves is a nonprofit organization involved in educating
c h i l d ren, parents and the community on pedestrian, bicycle, motor vehicle,
train, bus and re c reational safety in a fun, non-traditional and interactive
m a n n e r.
Thousands of school children throughout California are reaping the
benefits of traffic safety training courses provided by Safe Moves, a non-
p rofit organization based in Van Nuys, CA. Students are taught what to
do — and what not to do — on city streets. They learn about the potential
h a z a rds of alleyways and unknown dogs, how to properly secure a bicycle
helmet, and how a green traffic light doesn’t always mean that it is safe to
c ross the street.
When conducting interactive school workshops, Safe
Moves educators address bicycle, pedestrian, auto safety,
and transit education safety with children. The workshops,
g e a red specifically to diff e rent age groups, come equipped
with the ‘Safe Moves City,’ a training course that provides hands-on expo-
s u re to sidewalks, streets, driveways, buses, crosswalk signals, railro a d
tracks, cars, trucks, and even dogs. The simulated city allows children to
work one-on-one with skilled safety trainers who evaluate the child’s level
of understanding of traffic laws and potential hazards and work with them
to learn safe bicycle and pedestrian behavior.
In addition to the elementary, middle, and high school recipients, Safe
Moves targets programs to parents and other members of the community,
conducting programs for law-enforcement agencies, hospitals, transport a-
tion agencies, community groups, and physically disabled individuals.
Available workshops run the gamut from on-the-road training, traffic violators
workshops, and senior citizen programs to community outreach campaigns,
bike and pedestrian master plan consulting, and data collection and
evaluation. On-the-road training comes in the form of ‘street rides’ for
qualified children and their families who have completed the workshops
and the traffic simulation courses.
Safe Moves conducts evaluations on all of the programs it implements,
and the National Highway Tr a ffic Safety Administration and the Californ i a
O ffice of Tr a ffic Safety have published re p o rts on the program. Regional
analyses indicate that bicycle and pedestrian related crashes have signifi-
cantly dropped in recent years. Statistics released by the Los Angeles
County of Public Works, for example, show that bicycle-related deaths
d ropped 25% and pedestrian-related deaths dropped 30% between 1993
and 1997.
Safe Moves was established in 1983 by former bicycle racer Pat Hines,
in response to the death of a friend in a bicycle accident. Since its found-
ing, the program has received numerous awards, including the 1996
United States Secre t a ry of Tr a n s p o rtation Child Tr a n s p o rtation Safety
Aw a rd. Safe Moves’ extensive client list includes partnerships with the City
of Los Angeles Police Department and Department of Tr a n s p o rtation, the
Los Angeles County Department of Health Services and Department of
Public Works, the San Francisco EMS Agency, the San Diego Unified
School District, and some twenty other California cities. Funding for Safe
Moves is derived from grants, corporate sponsorships, and a club mem-
bership pro g r a m .
c o n t a c t S A F E M O V E S
PAT HI N E S
EX E C U T I V E DI R E C T O R
15500 ERW I N ST # 1 1 2 1 - 1 5
VA N NU Y S, CA 91411-1017
(818) 908-5341
other ex a m p l e s
E F F E C T I V E C YC L I N G
( F O R D I F F E R E N T A G E S ) :
LE A G U E O F AM E R I C A N BI C Y C L I S T S,
1612 K ST R E E T N W, SU I T E 4 0 1
WA S H I N G T O N, DC 20006
(202) 822-1333
S A F E M O V E S

The Portland, OR Community Cycling Center runs a series of
c y c l i n g - related activities to build life and job skills for children of low
income families, including a Summer Rides Program for kids between the
ages of 8 and 12. Similar programs in other communities are building self-
esteem and team responsibility; teaching mechanical, problem-solving and
job skills; engaging kids in positive and creative re c reational activities;
i m p roving bike safety and handling skills; introducing children to their
community and surroundings; and distributing aff o rdable bikes and helmets
to low income families.
The Community Cycling Center’s Summer Rides Program, funded by
the Bureau of Housing and Community Development and Metro (a re g i o n-
al government agency), guided 142 children from low income households
t h rough a two-week bicycling program in the summer of 1997. During the
two week course, a child learns how to wear and adjust a bike helmet,
signal, ride safely on city streets (both alone and in a group), inspect
a bicycle and perf o rm basic maintenance tasks, fix a flat tire, and find
their way around the neighborh o o d .
T h ree hour bike rides — developed and managed by Community Center
s t a ff and 12 volunteers — enable the kids to explore Portland on their bikes
and get to destinations such as a community blood bank, a fire station, the
central library and a food shelter. Participants are given pre- and post-
p rogram tests to rate their acquisition of knowledge during the course. On
a scale of 0-10, skills master rose for the 8 to 10 year-olds from 3.9 to 8.5
and for the older kids from 6.6 to 9.5.
In the Winter and Spring of 1996, the Bicycle Coalition of the Delaware
Valley (BCDV) started a Youth Cycle and Recycle program along similar
lines to the Portland program. Working with the Philadelphia Housing
Authority and local businesses, the BCDV arranged monthly rides to desti-
nations within the city that the children rarely knew even existed. After rid-
ing the 11 km (7 miles) from his housing project home to a wildlife re f u g e
near Philadelphia’s airport, one rider said “I never knew that Philadelphia
looked like this.”
BCDV Executive Director Sue MacNamara says, “Seeing a bunch of
grade school kids take a corner on their bikes in straight formation, using
hand signals, is almost as exciting as watching a pack of pro f e s s i o n a l
cyclists gracefully take a downhill turn . ”
In Atlanta, GA, James Chapman of the Georgia Tr a n s p o rtation Alliance
taught a six-week Citizen School for 11-14 year-olds in the summer of
1995. The apprenticeship made students more aware of the transport a t i o n
needs of the community and taught them how to read maps, survey public
opinion and inventory streets for pedestrian and bicycle conditions.
The course concluded with the students presenting their findings and
making recommendations on how to make the community around their
school more bicycle-friendly. Representatives of the city staff and city
council attended the briefing, which included call for repairing bro k e n
sidewalks, smoothing out rough roads and installing bike racks at schools.
c y c l i n g f o rk i d s
E D U C A T I O N , E N C O U R A G E M E N T , E N F O R C E M E N T
c o n t a c t B R I A N L A C Y
CO M M U N I T Y CY C L I N G CE N T E R
240 7 NE A L B E RTA
PO RT L A N D, OR 972 11
(503 ) 288-8 864
E-M A I L: c o m c y c l e @ t e l e p o rt . c o m
c o n t a c t J A M E S C H A P M A N
GE O R G I A TR A N S P O RTAT I O N AL L I A N C E
1083 AU S T I N AV E., NE, RO O M 1 0 7
AT L A N TA, GA 30307
(404) 653-0966
E-M A I L: t p a j a m a s @ a o l . c o m
other ex a m p l e s
T R I P S F O R K I D S :
SA N FR A N C I S C O, MA R I LY N PR I C E,
(415) 381-2941
B I CY C L E W O R K S :
ST. LO U I S, RO Y BO H N, (314) 772-6115
c o n t a c t S U E M C N A M A R A
BI C Y C L E CO A L I T I O N O F T H E
DE L AWA R E VA L L E Y
252 SO U T H 1 1T H ST R E E T
PH I L A D E L P H I A, PA 19107
(215) 829-4188
E-M A I L: b c d v @ a o l . c o m
C O M M U N I T Y C Y C L I N G P R O G R A M S F O R K I D S

b i k e c o m m u te d a y
E D U C A T I O N , E N C O U R A G E M E N T , E N F O R C E M E N T
C o o rdinated by the California Bike Coalition since 1995,
the California Bike Commute is an annual statewide event which pro m o t e s
bike commuting on a designated day or week in the month of May.
In 1994, the fledgling California Bicycle Coalition began organizing for
a 1995 “Bike-to-Work Day” event that would unite California bicycle
g roups, municipalities, and large employers in the promotion of bicycle
commuting throughout the state. “California Bike Commute” was based on
studies from San Diego County Bike-to-Work Days, which proved that these
p romotions were successful in convincing first-time bike commuters to
become regular commute cyclists.
The first California Bike Commute Day was held on May 4, 1995.
Despite bad weather in northern California, over 11,000 cyclists “registered”
for this event, and according to registration information, 263,000 km
(163,450 miles) were traveled by bicycle commuters that day.
This event found instant popularity with the public and the media.
Over 100 cities, counties, and Ride Share agencies participated thro u g h-
out the state. Hundreds of employers promoted the event at company
worksites. In addition, hundreds of media outlets covered the event,
including radio, newspaper and television coverage.
The amazing element of the California Bike Commute was its success
on a shoe-string budget. Caltrans and a handful of Rideshare or transit
agencies donated posters and registration cards, while T- s h i rt sales paid for
administrative costs and limited advertising. The bulk of this event was
developed on volunteer time and energ y, with small donations from a vari-
ety of bike clubs and re t a i l e r s .
The California Bicycle Coalition continues to promote the ever- e x p a n d-
ing California Bike Commute, and the number of participants and part i e s
involved has continued to gro w. Coordinating days, or weeks, which
specifically promote bicycle commuting are a proven method of incre a s-
ing numbers of commute cyclists. The California Bicycle Coalition has
also found the California Bike Commute to be an effective means of
i n c reasing membership.
c o n t a c t K . C . B U T L E R
CA BI K E CO M M U T E
(619) 679-1027
other ex a m p l e s
D E N V E R , C O : JA M E S MA C K AY
(303) 640-1088
W A S H I N G T O N , D C : WA B A
(202) 872-9830
TE XA S : TE X A S BI C Y C L E CO A L I T I O N,
(512) 476-RI D E
T H E C A L I F O R N I A B I K E C O M M U T E D A Y

The Twin Cities Bicycle Map and Commuter Guide is a highly
detailed street map of Minneapolis and St. Paul, covering a 630 square km
(243 square mile) area, with insets of both downtown as well as the
University of Minnesota. It features on-street bicycle lanes, paved trails,
and uses three colors to rank streets good, fair, and poor for bicycle use.
The reverse side features a complete re s o u rce guide to commuting and
crash avoidance tips, a listing of bicycle dealers and annual events, and
i n f o rmation about State, county, and city advisory boards and committees.
The Original Map (1991)
In 1990, a survey of University of Minnesota (U of MN) commuters
found that twenty percent of students and ten percent of faculty and staff
bicycled to campus three seasons of the year. Based on this information, a
grant was awarded to the Minnesota Community Bicycle Safety Project in
the U of MN Extension Service to develop a map to promote bicycle com-
muting at the University. The University of Minnesota Bicycle Guide and
Commuter Map was published in 1991. Using the U of MN as a core and
extending approximately 13 km (8 miles) in each direction, this map clear-
ly showed commuters the safest routes into the University and surro u n d i n g
a reas. Nine thousand copies of the map were produced and sold at are a
b o o k s t o res and bicycle shops.
The New Revised Twin Cities Bicycle Map and Commuter
Guide (1997)
In the summer of 1996, the decision was made to revise the map. The
revision process began with the realization that less than 20% of the map’s
g ross income was available to fund production of the next version, which
was estimated to cost $15,000.
A plan was developed to solicit support from interested agencies and
o rganizations and a project coord i n a t o r, Gary Sjoquist of the Minnesota
Coalition of Bicyclists, was hired. Working with the bicycle advisory com-
mittees of Minneapolis and St. Paul, the Parking and Tr a n s p o rt a t i o n
S e rvices division of the University of Minnesota, Mn/DOT, and the
M e t ropolitan Council (the area MPO), the funds were raised to re v i s e ,
print, and distribute the new map, now called the Twin Cities Map and
Commuter Guide.
t w i n c i t i e s m a p
E D U C A T I O N , E N C O U R A G E M E N T , E N F O R C E M E N T
T W I N C I T I E S B I C YC L E M A P A N D C O M M U T E R G U I D E

A rmed with the promise of funding, the map’s DXF and Arc Info cover-
age files were transferred from the Minnesota Department of Tr a n s p o rt a t i o n
to the University of Minnesota’s Cartographic Laboratory. The U of MN
C a rtography Lab blended the Mn/DOT data with U.S.G.S. rectified digital
o rtho photo quad coverage of downtown Minneapolis, St. Paul, and the
University campuses to provide the map’s highly detailed base. Over a four
month period, revisions to the map were made by soliciting input fro m
bicycle commuters, cycling clubs, city and county maintenance off i c i a l s ,
and by riding many of the streets and trails. Three colors were used to rate
s t reets good, fair, or poor based on roadway width, average daily motorized
t r a ffic volumes, traffic control signal locations, and information about
bicycle commuter roadway use. The new map was completed and put into
distribution in May 1997, and within five months sold nearly 4,000 copies
without the benefit of the peak sales months of March and April. The map
has been hailed as a legible and accurate map and a useful re s o u rce for
both commuting and re c reational cyclists.
Key Changes to the New Map
Now renamed as the Twin Cities Bicycle Map and Commuter Guide, the
map was further revised to include the nearly 32 km (20 miles) of on-stre e t
bicycle lanes in Minneapolis, St. Paul, and the University campuses. By
bringing the map on to a digital platform, the area of the map was extend-
ed nearly 3.2 km (two miles) without changing the map’s physical size.
F rom a marketing standpoint, this allowed the map to now feature the com-
plete St. Paul Bikeways Plan as well as show safe access to the Mall of
America (recently hailed as the most visited site in America) and still
remain a convenient size when folded.
Another significant change was to replace the nomenclature “off - ro a d ”
with “off - s t reet” to acknowledge off - road (dirt) mountain bike trails in the
a rea. Another key change refocused the map’s insets to include one com-
bination inset for both University campuses, and insets for Minneapolis
and St. Paul downtown areas. The re s o u rce guide information was updat-
ed and a list of bicycle dealers within the map’s area added, as well as a
list of larger annual bicycle events.
m a p s a n dg u i d e s
E D U C A T I O N , E N C O U R A G E M E N T , E N F O R C E M E N T
c o n t a c t N E W Y O R K
K I M B E R L E Y S T A H L M A N K E A R N S
D I R E C T O R O F P U B L I C A F FA I R S
DE PA RT M E N T O F CI T Y PL A N N I N G
CI T Y O F N E W YO R K
22 RE A D E S T R E E T
N E W YO R K, NY 1 000 1-1216
( 212) 7 20-3503
c o n t a c t S A N F R A N C I S C O
PE T E R TA N N E N
BI C Y C L E PR O G R A M MA N A G E R
SA N FR A N C I S C O DE PA RT M E N T O F PA R K I N G
A N D TR A F F I C
25 VA N NE S S AV E N U E, #345
SA N FR A N C I S C O, CA 94102-6033
(415) 554-2396
E-M A I L : p e t e r _ t a n n e n @ c i . s f . c a . u s
c o n t a c t I L L I N O I S
CR A I G WI L L I A M S
IL L I N O I S DE PA RT M E N T O F TR A N S P O RTAT I O N
2300 SO U T H DI R K S E N PA R K WAY,
RO O M 3 3 0
SP R I N G F I E L D, IL 62764
(217) 785-3194
E-M A I L : d o t c w c @ c m s w a n g . s t a t e . i l . u s
other ex a m p l e s
C I T Y O F N E W Y O R K
Two of a series five bike maps (one for
each Borough) covering New York City
w e re published in the Spring of 1997.
Each map, produced on recycled paper,
f e a t u res a city-wide map on one side
and a borough-specific map on the
o t h e r. Intended for cyclists of all ability
levels, the maps show recommended on-
s t reet routes and facilities, parks, trails,
bike shops, and other destinations.
s u m m a r y
T W I N C I T I E S
The Twin Cities Bicycle Map and
Commuter Guide is an excellent exam-
ple of cities, State agencies, and a
major university working together to pro-
duce a lucid and extremely useful map
of a major urban area for pedestrians,
in-line skaters, and bicyclists.
C I T Y O F S A N F R A N C I S C O
An innovative and exciting public-
private partnership between the San
Francisco Department of Parking and
Tr a ffic (DPT) and Pacific Bell re s u l t e d
in publication of a detailed city-wide
bicycle route map — in the 1997
Yellow Pages for the city. Pacific Bell
Yellow Pages volunteered to be re s p o n-
sible for the entire map production.
T H E I L L I N O I S D E P A RT M E N T
O F T R A N S P O R T AT I O N
has created a series of bicycle maps
covering diff e rent regions of the State
— the maps provide information on the
t r a ffic and roadway conditions bicyclists
can expect to encounter. The maps were
c reated in partnership with a local
U n i v e r s i t y.
c o n t a c t G A RY S J O Q U I S T
MI N N E S O TA CO A L I T I O N O F BI C Y C L I S T S
(612) 452-0907
c o n t a c t CY N T H IA M CA RT H U R
U O F MN EX T E N S I O N SE RV I C E
(612) 625-9719

s a f e b i c y c l i n g
E D U C A T I O N , E N C O U R A G E M E N T , E N F O R C E M E N T
c o n t a c t B E N G O M B E R G
BI C Y C L E PR O G R A M CO O R D I N AT O R
CH I C A G O DE PA RT M E N T O F TR A N S P O RTAT I O N
30 N. LASA L L E ST, SU I T E 4 0 0
CH I C A G O, IL 60602
(312) 744-8093
E-M A I L: b g o m b e rg @ c i . c h i . i l . u s
c o n t a c t R A N DY N E U F E L D
EX E C U T I V E DI R E C T O R
CH I C A G O L A N D BI C Y C L E FE D E R AT I O N
417 S. DE A R B O R N ST., SU I T E 1 0 0 0
CH I C A G O, IL 60605
(312) 427-3325
E-M A I L: c h i b i k e f e d @ a o l . c o m
What’s a good way for a city agency to promote safe cycling?
In Chicago it’s by partnering with the local bicycle advocacy group to
p roduce an award-winning booklet.
In 1994, the Chicago Department of Tr a n s p o rtation received a
$30,000 Highway Tr a ffic Safety (Section 402) grant to produce a booklet
on safe bicycling skills. The city contracted with the Chicagoland Bicycle
Federation, Chicago’s bicycle advocacy group, to write the booklet. The
Chicagoland Bicycle Federation had previously produced a one-page flyer
for the Chicago Department of Tr a n s p o rt a t i o n .
The result of the new collaboration is a 36-page booklet that pro v i d e s
basic skills for urban cycling, including how to negotiate traffic, safely
c ross intersections, dress for bad weather, and prevent bike theft. More
than 100 illustrations and photographs complement the non-technical,
concise text. Polish and Spanish language versions also were produced to
make the information accessible to Chicago’s major non-English speaking
g roups. The booklets were free of charge to the public.
The booklet has been so popular that it has been reprinted and re p r i n t e d .
M o re than 100,000 copies have been circulated to date with the best
distribution points being bike shops, bike clubs, bike messenger serv i c e s ,
and fitness clubs.
In 1996, because of the tremendous demand from outside Chicago, the
Illinois Department of Tr a n s p o rtation contracted with the Chicagoland
Bicycle Federation to produce a statewide version. “Safe Bicycling in
Illinois“ has become one of the Illinois Department of Tr a n s p o rt a t i o n ’s
most popular publications, with 100,000 copies printed. The Chicago Are a
Bicycle Dealers Association (CABDA) published a special version in 1996
to provide the booklet to a national audience and emphasize the value of
specialty bicycle re t a i l e r s .
In 1996, the Chicago Department of Tr a n s p o rtation secured another
Highway Tr a ffic Safety grant to produce three new versions of the booklet
for Chicago re s i d e n t s :
An abridged 12-page version featuring its main points. The
considerably lower cost, 10¢/copy versus 30¢/copy for the 36-page version,
enabled 100,000 copies to be printed, permitting widespread distribution
(e.g. sporting goods stores, universities, public libraries).
A childre n’s version to teach safe bicycling skills to 10 to 12-year old
c h i l d ren, the ages considered most effective for training. Over 175,000
copies will be printed for distribution at elementary schools, bike store s ,
and police stations.
On-line versions. The abridged and childre n ’s versions will be posted
on the City of Chicago’s home page (www.ci.chi.il.us/WM/CDOT/Bikes) in
early 1998, to make this information more accessible.
What’s next?
Funding is being sought for a teacher’s guide with classroom and on-
bike exercises to accompany the childre n ’s booklet. Booklet chapters may
also be spun off into flyers. For example, the chapter on preventing bike
theft could be reprinted by the police depart m e n t .
“ S A F E B I C YC L I N G I N C H I C AG O ” R I D E S O N

From the smallest towns to the biggest cities, f rom university
campuses to National, State, and local parks, from the snow-swept stre e t s
of Alaska to the manicured White House lawn, law enforcement off i c i a l s
a re leading a riding revolution. The Police on Bikes movement is changing
police departments at the close of the 20th Century more than anything
has since automobiles were introduced in the early 1900s.
The recent re s u rgence of bike patrols began in the late 1980s in Seattle,
WA, where the police department began using bicycles because of congested
downtown streets. The patrols were an immediate success. Because of the
benefits that police departments could gain by sharing ideas, training tips,
p a t rol tactics, uniform advancements, and safety concerns, a Police on
Bikes Conference was initiated by the League of American Bicyclists in
1991. Later, the International Police Mountain Bike Association was formed.
To d a y, over 10,000 officers from 45 States have received IPMBA’s P o l i c e
C y c l i st ™ training.
How Do Cops on Bikes Help Communities?
Police administrators usually are convinced to support the intro d u c t i o n
or growth of bicycle patrols once they are made aware of the benefits to
their departments:
B i ke patrols are cost effective—10 to 15 bike officers can be
fully outfitted for the cost of one patrol car.
B i ke officers can travel faster and farther than foot officers —and
they are able to patrol and pursue in areas that are unreachable by car.
Bicycles give officers the “stealth” advantage— b e c a u s e
they are silent, cops on bikes can ride right up to the scene of a
crime before they are noticed. This has uniformly increased arre s t
rates and is a newfound success in fighting street crime.
Bicycles are great public relations tools — an officer on a
bike is much more approachable than one in a patrol car.
Officer morale is improved.
Departments have cited lower health care costs due to a
m o re fit officer corps.
Once bike patrols are up and rolling, such benefits tend to make them
s e l f - s u fficient. Communities as a whole benefit from introducing bike
p a t rols, which is why local bike clubs, bike shops, and other community
g roups often help to raise start-up funds (about $1,000 to fully equip one
bike, with an annual maintenance fee of about $100 — versus an average
of $23,000 to purchase one patrol car plus an annual maintenance fee of
over $3,000).
Cyclists also point out that in communities with a visible bike patro l :
1) Bicyclists are more easily recognized as legitimate users of the
roadway system.
2) The benefits of bicycling are more visible.
3) Other personnel within the police department are exposed to the
special needs of bicyclists. Enforcement of traffic laws for all ro a d
users becomes more uniform .
4) Bike officers can initiate road improvement requests where necessary
for safe bicycle use.
5) F rom schools to parks, and from downtown business districts to quiet
n e i g h b o rhoods, bicycles are helping bridge the gap between law
e n f o rcement agencies and the communities they are sworn to protect.
Keeping “the Finest” Safe and Effective
IPMBA is a non-profit education organization that provides the best,
most complete training for bicycle officers. While IPMBA training has lit-
erally spanned the globe since its inception in 1991—with courses having
been taught in English, French, Spanish, and Russian, in ten countries on
four continents —the United States leads the way.
p o l i c e o n b i k e s
E D U C A T I O N , E N C O U R A G E M E N T , E N F O R C E M E N T
c o n t a c t
T H E I N T E R N A TI O N A L P O L I C E M O U N T A I N B I K E A S S O C I A T I O N ,
1612 K ST., NW, ST E . 401, WA S H I N G T O N , DC 20006; T E L. (202) 822-1333, FA X
(202) 822-1334; LABI P M B A@A O L.C O M; W W W.B I K E L E A G U E.O R G/I P M B A.
p u b l i c a t i o n s
A C O N T A C T G U I D E T O I P M B A M E M B E R S ’ D E P A R T M E N T S
(600 A C R O S S T H E C O U N T RY) I S AVA I L A B L E T O I N Q U I R E A B O U T L O C A L B E N E F I T S,
C H A L L E N G E S, A N D F U N D I N G O P P O RT U N I T I E S (IPMBA; $20) .
“ T H E C O M P L E T E G U I D E T O P O L I C E C Y C L I N G ”
I S A 2 5 0 -PA G E, D E TA I L E D M A N U A L O F T H E S K I L L S, B A C K G R O U N D, A N D R E S O U R C E S
N E C E S S A RY F O R O F F I C E R S A N D C O M M U N I T I E S N E W T O B I K E PAT R O L S (IPMBA; $20).
C O P S O N B I K E S : R E D U C I N G C R I M E , C U T T I N G C O S T S , A N D I M P RO V I N G C O M M U N I T I E S

b i k e t o w o r k
E D U C A T I O N , E N C O U R A G E M E N T , E N F O R C E M E N T
Fleetwood Enterprises provides a model in attracting people to
commute by bicycle and disproves the myth that Californians can’t be
pried out of their cars. While many companies in the United States ensure
their employees have free car parking and other incentives to drive to work,
Fleetwood Enterprises has shown what happens when equivalent financial
incentives are off e red to those who bicycle to work.
In 1988, the South Coast Air Quality Management District (SCAQMD
— the Los Angeles re g i o n ’s air quality agency) started mandating that larg e
employers encourage their employees to commute to work by means other
than driving alone. Companies have been free to design their own incen-
tive programs, as long as they increased the ratio of commuters to vehicles
to 1.5. Many companies off e red pre f e rential parking to carpoolers, subsi-
dized vanpools, provided bus passes, or allowed employees to work fro m
home. Some off e red bicycle commuter incentives.
Fleetwood Enterprises, located in suburban Riverside, California, 100
km (62 miles) east of downtown Los Angeles, employs about 650 people
to make re c reational vehicles and manufactured homes. When Fleetwood
Enterprises embarked upon their bicycle commuter program, about one
p e rcent of their employees rode to work on a bicycle, consistent with the
regional average. The company enacted one of the most ambitious set of
bicycle incentives in the region. They built bicycle lockers for safe parking
and provided showers and clothing lockers so people could clean up and
change before work. Fleetwood made the tools in a shop available for bicy-
cle repair and provided financial incentives in the form of a point system.
Each day someone bicycled to work, they received two points worth $1
each that could be accumulated and exchanged for gifts from a catalog.
E v e ry month the company held a bicycle promotional event. Fun rides,
prize drawings, lunches, casual dress, or other bike-to-work day incentives
enticed employees to join. The Employee Tr a n s p o rtation Coord i n a t o r, a
specially trained employee with the responsibility of carrying out the
ridesharing program, organized the incentives and promotional events, and
placed notices on bulletin boards. When the bicycle program was in full
swing, approximately 10 percent of the employees commuted to work by
bicycle, a ten-fold increase. This magnitude of change in travel behavior
far exceeds what many experts believe possible, especially in a suburban
community like Riverside, CA.
Political winds have changed and policy makers have charted a more
“business-friendly” approach to clean air. About two years ago, Fleetwood
Enterprises opted for an alternative to ridesharing and dismantled their
bicycle commuter program. They still have bike lockers, showers, and
clothing lockers but no longer give financial incentives or promote bicycle
commuting. They stopped tracking the number of bicycle commuters.
What remains is the knowledge that bicycle commuter programs can work
and that Southern Californ i a ’s ridesharing mandate was quite effective in
encouraging changed behavior.
c o n t a c t R Y A N S N Y D E R
RYA N SN Y D E R A S S O C I AT E S
1015 GAY L E Y AV E. , #1 248
LO S A N G E L E S, CA 9 002 4
(31 0) 82 4-99 31
E -M A I L : r y s n y d e r @ i x . n e t c o m . c o m
B I C YC L E C O M M U T E R P R O G R A M A T F L E E T W O O D E N T E R P R I S E S
E a c h d a y

w a l k a b le a r l i n g t o n
T R A N S I T - R E L A T E D
Twenty-five years ago, Arlington County, VA was a languid
suburban community just across the Potomac River from Wa s h i n g t o n ,
DC. To d a y, the county has been transformed into a thriving, diverse urban
community with a balance of residences, offices, and retail. The catalyst
has been the opening of eleven stations on two lines of the regional sub-
way system (Metro ) .
County leaders and planners in the 1970s agreed to concentrate inten-
sive development around the planned transit stations and to create a mix
of office, retail, residential, and public uses. Stable residential neighbor-
hoods more than one kilometer away from the stations would be connect-
ed to the new development with pedestrian walkways.
Since the opening of the Metro stations (six stations in 1976 and five
in 1979), more than 2,175,000 square meters (23,400,000 square feet)
of commercial development and 20,000 new residential units have been
built along the two corr i d o r s — m o re than double the rate in the 20 years
prior to 1977. The population has grown to an historic high of 186,000
and more than 218,000 people work in the County.
M o re than 95 percent of office space and 67 percent of retail in the
County is now within walking distance of transit. Residents of the two
M e t ro corridors use transit for 41 percent of work trips compared to the
regional average of only 15 percent. Only one third of the residents drive
to work compared to 72 percent for the region. Thre e - q u a rters (76%) of
transit trips are initiated by walking compared to 25 percent at other
N o rt h e rn Vi rginia stations.
This transformation to a walking and transit based community has been
achieved by keeping walking distances short, making walking safer and
m o re secure and ensuring walking is comfortable and attractive.
Keeping walking distance short
Mix land uses within neighborhoods and blocks
Place highest density closest to transit stops
Place parking underg round or away from activities
C reate diagonal and mid-block walkways through developments
Bridge barriers to pedestrian travel
Making walking safer and more secure
P rovide adequate time at pedestrian traffic signals
Enhance mid-block cro s s i n g s
Reduce pedestrian crossing distances
Calm vehicular traff i c
P rovide adequate lighting along walkways
Making walking comfortable and attractive
Widen sidewalks
Make ground floors intere s t i n g
Plant trees and display public art
Install benches, shelters, and awnings
Remove utilities and obstructions from walkways
The County has also avoided (or is correcting) common mistakes such
as surrounding the transit stations with parking, making roads too wide
and difficult to cross, neglecting pedestrian walkways, and relying on
private redevelopment for all improvements. Arlington County has worked
cooperatively with developers and Metro to complete facility impro v e m e n t s
in a systematic manner over many years.
c o n t a c t R I T C H V I O L A
AR L I N G T O N CO U N T Y PU B L I C WO R K S
DE PA RT M E N T
2100 CL A R E N D O N BLV D # 7 1 7
AR L I N G T O N, VA 22203
(703) 358-3699
E-M A I L: rv i o l a @ c a p a c c e s s . o rg
T R A N S I T A N D P E D E S T R I A N O R I E N T E D D E V E LO P M E N T I N A R L I N G TO N , VA

b i k e son b o ard
T R A N S I T - R E L A T E D
c o n t a c t
T HE G L O BAL CYC L IN G N E TW O R K
(w w w. c y c l i n g . o rg) H O S T S T H E C A LT R A I N-
B I K E S, B A RT-B I K E S, A N D B I K E S-N-T R A N S I T
L I S T S.
c o n t a c t
E L L E N F L E T C H E R
CA LT R A I N BAC, (650) 494-8943
E-M A I L: f l e t c h e re @ a o l . c o m
c o n t a c t
J O H N C I C C A R E L L I (A U T H O R)
(650) 725-2453
E-M A I L: j o h n . c i c c a re l l i @ s t a n f o rd . e d u
c o n t a c t
J A N E T M C G O V E R N
CA LT R A I N PU B L I C IN F O R M AT I O N OF F I C E
(650) 508-6356
w w w. c a l t r a i n . c o m
other ex a m p l e s
T H E W W W. B I K E M A P. C O M W E B S I T E
L I S T S O V E R 170 NO RT H AM E R I C A N T R A N S I T S Y S T E M S T H AT C A R RY B I C Y C L E S. EX A M P L E S
I N C L U D E B A RT (BAY AR E A RA P I D TR A N S I T, w w w. b a rt . o rg), WA S H I N G T O N’S ME T R O S U B-
WAY ( w w w. w m a t a . c o m ), A N D BO S T O N ’S M B TA S U B WAY (w w w. m b t a . c o m). TH E CY C L I S T S
TO U R I N G CL U B S I T E (h t t p : / / w w w. c t c . o rg . u k / t r a i n s . h t m l) L I S T S B I C Y C L E A C C O M M O D A-
T I O N S A B O A R D EN G L I S H R A I L S Y S T E M S.
Parties involved / Public involvement
The Counties of San Francisco, San Mateo, and Santa Clara have owned
the line since 1992 and oversee it through a Joint Powers Board composed
of elected officials. Amtrak operates the system. An August 1992 meeting
attended by over 200 people led to a pilot program with capacity of 4 bikes
per train and the formation of Caltrain’s Bicycle Advisory Committee. The
BAC meets at least quart e r l y, includes cyclists from each county plus staff
and conductors, and has helped to develop racks, printed materials, and
policies. Caltrain’s Citizens Advisory Committee (CAC) expressed cru c i a l
early support for bicycle accommodations.
The San Francisco Bicycle Coalition (www. s f b i k e . o rg) and Silicon Va l l e y
Bicycle Coalition (www. s v b c b i k e s . o rg) were instrumental in gathering sup-
p o rt from individuals and employers. The recently formed Mid-Peninsula
Bicycle Coalition (http://blue-room.com/MPBC/) supports bike access in
San Mateo County.
The “caltrain-bikes” Internet list is a forum for resolving problems and
generating ideas. At least one conductor participates, and staff follows the
discussion.
Critical step
A Bicycle Advisory Committee is essential. Support from large employers
helps considerably because each re p resents hundreds of customers.
C A LT R A I N “ B I K E S O N B O A R D ” P R O G R A M
Caltrain is a 110-km (70-mile) passenger rail line c o n n e c t i n g
San Francisco with Silicon Va l l e y. Caltrain accommodates a total of 24 bicy-
c l e s on all trains and 48 on some — the highest capacity in North America
— offering the door-to-door convenience of a car throughout a 900 square
km (350 square mile) area. Trains operate from 6am to midnight, with sev-
e r a l per hour at commute times and hourly service at most other times.
Cost, Funding, and Revenue Impact
San Francisco County contributed $30,000 in State Tr a n s p o rt a t i o n
Development Act funds for the design, fabrication, and installation of the
first onboard racks, which created a capacity of 12 bicycles per train.
C a l t r a i n ’s operating budget increased capacity to current levels. By attract-
ing customers who would otherwise drive, the program repaid its start u p
costs within six months and is now a revenue source. Ridership incre a s e d
over 7% recently and some attribute 4% to cyclists. There are now over
1,500 cyclist boardings each weekday, and advocates expect demand to
continue rising.
C a rrying bicycles also saves transit operators hundreds of thousands of
dollars annually because cyclists bring their own “shuttle”. (By contrast,
about 20 “free” shuttle bus lines log about 2,500 daily boardings, re q u i r-
ing subsidies on the order of $50,000 per line ($1 or more per ride)).

b i k es on b u s es
T R A N S I T - R E L A T E D
In 1991, the Phoenix Transit Department implemented its Bikes
on Buses Program using an alternative rack design, which improved how
bikes were transported. This rack and the operational guidance used, has
once again made the integration of these two modes a viable option for
agencies across the country.
As the 1980s ended, the once common integration of bikes on buses
had nearly disappeared. Transit agencies across the country had taken
steps to integrate these modes, but for various reasons, only remnants of
these programs still existed by 1990. Around this time, a group of citizens
re p resenting three area bicycle groups approached the City of Phoenix
Transit Department to consider allowing bikes on buses. Phoenix Tr a n s i t
welcomed the idea and invited the groups to help with a study.
A task force was formed comprised of citizens, staff from several gov-
e rnmental agencies, and private industry. This committee reviewed exist-
ing data from around the country and identified many shortfalls, such as
route and time limitations, equipment drawbacks, and operational con-
straints caused by loading delays. With these shortfalls identified, the
committee outlined a pilot project and funding to carry it out.
In March 1991, the Phoenix Bikes on Buses Pilot Program was imple-
mented with funding from the City of Phoenix and an Air Quality
Demonstration Grant from the Arizona Department of Tr a n s p o rtation. The
unique feature of Phoenix’s Bikes on Buses Program was the rack used.
This front mounted, locally designed rack made by Mobilis — which is now
available commercially — allowed for two bikes to be carried at once.
Either bicycle could be removed without touching the other bike, which
reduced loading delay. Of note, this rack has also proved to be durable and
does not affect other maintenance routines used by transit agencies.
The six month pilot program installed racks on 40 buses operating on
t h ree routes in the Phoenix Area and carried over 5,500 bicycle toting
passengers. Upon successful completion of the pilot, the Phoenix City
Council approved the system-wide expansion of the Program. Federal and
matching state dollars financed the project which now carries more than
1.5 million passengers with bicycles every year.
The success of the program caught the attention of other transit agen-
cies. In only one year after implementation, more than 70 transit agencies
f rom across North America contacted Phoenix for information on its bikes
on buses program. To d a y, many transit agencies - including Tu c s o n ,
Seattle, Portland, and San Jose - have instituted bikes on buses pro g r a m s .
Quality racks are now widely available through several manufacturers and
range in price from $300 to $500, excluding installation.
The success of Phoenix’s Bikes on Buses Program, and many others like
it, depend on people understanding that continuous improvement can be
made to any process. In this case, existing programs were enhanced thro u g h
c a reful study and evaluation, and the development of an alternative rack
design which changed how bikes were transported. These changes turned
bikes on buses into a successful venture for transit agencies a c ross the coun-
t ry that continues to draw new riders to transit and bicycling today.
c o n t a c t M I K E N A VA R E Z
PH O E N I X TR A N S I T DE PA RT M E N T
302 N. FI R S T AV E N U E, S U I T E 7 0 0
PH O E N I X, AR I Z O N A 8 5 0 0 3
(602) 262-7242
c o n t a c t B O B F L O R
KI N G CO U N T Y ME T R O TR A N S P O RTAT I O N DE P T.
EX C H A N G E BL D G., MS 188
821 2N D AV E N U E
SE AT T L E, WA S H I N G T O N 9 8 1 0 4
(206) 684-1611
c o n t a c t M I K E A R O
VA L L E Y T R A N S P O RTAT I O N AU T H O R I T Y
33 31 NO RT H 1S T ST R E E T
SA N J O S E, CA L I F O R N I A 9 5 2 3 4 - 1 9 0 6
(408) 32 1-7057
rack manufacture r
S P O RT W O R K S N W I N C .
MA R K STA N L E Y
15500 NE WO O D I N V I L L E DU VA L L RO A D
WO O D I N V I L L E, WA S H I N G T O N 9 8 0 7 2 - 6 4 7 6
(425) 483-7000
rack manufacture r
M O B I L I S
JO H N MI S A N Y
308 EA S T PI M A
PH O E N I X, AR I Z O N A 8 5 0 0 4
(602) 256-3465
rack manufacture r
K O R P R O D U C T S D E S I G N I N C .
BO B MCLE O D
866A KI N G ED WA R D ST R E E T
WI N N I P E G, MA N I T O B A, CA N A D A R 3 H 0 3 7
(204) 783-3348
P H O E N I X B I K E S O N B U S E S P R O G R A M

Few transit agencies can match Austin’ s Capital Metro p o l i t a n
Tr a n s p o rtation Authority commitment to improving conditions for bicycling
and walking.
In 1994, the Build Greater Austin (BGA) Program was initiated as a
ten-year capital improvement program by the Capital Metro p o l i t a n
Tr a n s p o rtation Authority (CMTA), the City of Austin and ten surro u n d i n g
communities within CMTA’s service area. The program is funded thro u g h
the Capital Metro budget which is financed by a one percent sales tax
collected throughout the Austin metro area. The $71 million pro g r a m
includes $20 million for capital mobility projects and $11 million for
s t reet and mobility projects outside the city.
What makes this program unique is the commitment by a transit
authority to alternative modes of transportation through pedestrian
and bicycle improvements. Bicycle and pedestrian planning gro u p s ,
local mobility impairment advisory groups, and individuals pro v i d e
consistent and ongoing input into potential projects to ensure ful l
public participation.
The City of Austin has dedicated $3.6 million to sidewalk installation.
Prioritization of sidewalk installation along bus routes is accomplished
t h rough analysis of ridership demographic data. Additionally, the CMTA
works cooperatively with mobility impairment advisory groups to identify
and remedy locations needing spot mobility improvements. This includes,
but is not limited to, sidewalk spot re p a i r, obstruction removal and instal-
lation of bus stop pads and curb ramps.
Other pedestrian improvements funded through the BGA Pro g r a m
include $280,000 toward the Walnut Creek Trail project—an east/west
trail corr i d o r, ongoing funding for two major streetscape renovations along
Guadalupe Street in the University district and South Congress in the
s o u t h e rn part of the city, shared-cost sidewalk improvement projects spon-
s o red by BGA and TX DOT, as well as several sidewalk, curb ramp, and trail
p rojects in the ten surrounding suburban communities.
In 1996, the BGA Program supported several bicycle facility impro v e-
ments such as trail connectors, street restriping, spot sweeping for bike
lanes, barr i e r- c rossing along a major arterial, and bicycle/transit integra-
tion through city-wide promotional activities. CMTA was also the first Te x a s
t r a n s p o rtation authority to equip its bus fleet with bicycle racks. The pro-
gram has been highly successful and new buses are now fitted with racks
b e f o re delivery. For 1998, the proposed allocation includes impro v e m e n t s
to rail crossings, trail signage, and durable bicycle lockers for park and ride
l o c a t i o n s .
g r e a t e r a u s t i n
T R A N S I T - R E L A T E D
c o n t a c t C H R I S E D M O N D S
C M TA
2910 E 5T H
AU S T I N, TX 78702
(512) 389-7540
E-M A I L: C h r i s . E d m o n d s @ v o y a g e r. c a p m e t ro . a u s t i n . t x . u s
“ BU I L D G R E AT E R A U S T I N” P R O G R A M
The program is funded

One of the best examples of Chicago’s successes is the City’s
Bike Rack Program. Bike racks were a natural beginning project given the
new availability of Congestion Mitigation and Air Quality Improvement pro-
gram (CMAQ) funding and the Bike 2000 Plan’s emphasis on short trips.
By the end of 1997, 4,250 racks were in place throughout the city. The
racks have been installed as a part of three separate CMAQ grants totaling
$1.5 million. Another $170,000 CMAQ grant has been received for 1998
rack installation.
Early in 1992 the Mayor’s Bicycle Advisory Council decided to test new
bike rack designs. Thirty-one wave and inverted-U racks were tested at 10
buildings: city hall, libraries, and municipal offices. The racks looked good
and attracted use immediately. The test cost less than $15,000 and was
funded through an existing guardrail contract.
The city applied for $750,000 for bike parking in the first call for
CMAQ project proposals which occurred soon after this successful trial.
The first 1,100 racks were sited according to suggestions from city staff
and volunteer survey teams from the Chicagoland Bicycle Federation.
Special attention was given to distribute available racks between govern-
ment buildings, cultural institutions, parks, neighborhood retail, and the
central business district.
At first the Illinois Department of Tr a n s p o rtation wanted site plans for
all 1,100 racks. Later they accepted a set of standardized installation
configurations and a list of installation locations. Because of the initial
quantity of rack installations, it was not feasible to contact adjacent
p ro p e rty owners. A letter was sent to each alderman listing installation
locations in their ward. The first responses to the racks were mostly negative,
but only a handful of racks were actually relocated. However, the positive
response came quickly and clearly: the racks attracted use; several of
those who asked that racks be removed asked to keep them; and busi-
nesses that didn’t get racks wanted to know why they were overlooked.
The 1998 project will include a demonstration of higher security,
longer term parking.
Some of the strategies that have made the projects
s u c c e s s f u l :
• The “Inverted-U” design functions especially well. These racks do not
o b s t ruct the sidewalk, they can accommodate any type of lock, and it is
easy to stand bikes against them.
• Cyclists and pro p e rty owners are invited to suggest locations thro u g h
p o s t c a rds, newspaper articles, and the Intern e t .
• Consent to install a nearby rack is received from nearby property owners.
• The importance of locating racks as close as possible to the building
entrance cannot be overe m p h a s i z e d .
• The managers of schools, parks, transit stations, museums, libraries,
post offices, and other institutions are systematically asked if racks are
needed.
The racks utilize high quality materials, “bombproof” coatings, and
s e c u re mountings. These make the racks more expensive initially but they
look better and re q u i re less maintenance.
c h i c a g o b i k e p a r k i n g
A N C I L L A R Y F A C I L I T I E S
contact and publication
T H E B I K E 2 0 0 0 P L A N ,
B I K E R A C K P R O G R A M S P E C I F I C AT I O N S, A N D O T H E R CH I C A G O B I C Y C L E P R O G R A M P U B L I C A-
T I O N S A R E AVA I L A B L E F R O M, BE N GO M B E R G, CH I C A G O DE PA RT M E N T O F TR A N S P O RTAT I O N
30 N. LASA L L E, RO O M 400, CH I C A G O, IL 60602
E -M A I L: b g o m b e rg @ c i . c h i . i l . u s
AC T I O N TO MA K E C H I C AG O BI C YC L E- F R I E N D LY: TH E B I K E RAC K PRO G R A M
other ex a m p l e s
C I T Y O F S E A T T L E , W A :
PE T E R LA G E RW E Y, (206) 684-5108
C I T Y O F M A D I S O N , W I :
ART H U R RO S S, (608) 266-6225

Urban planners in today’s American cities might look to the
Long Beach Bikestation for clues to attracting people out of their cars.
American communities have spread out in land use patterns that lack the
compactness needed for convenient access to transit. Since passengers
typically will walk no more than 1 kilometer to a transit stop, the number
of people who live convenient to transit is small. Since cyclists can easily
travel three to five kilometers (two to three miles), bike-transit centers can
attract people out of their cars by expanding the band of potential riders
a p p roximately ten-fold. This is critical to air quality since most air pollu-
tion emitted from autos spews out during the first few kilometers of the
“cold start.”
The Long Beach Bikestation is the first of its kind in the United States.
Initiated primarily through ISTEA’s Congestion Mitigation and Air Quality
p rogram and Los Angeles County Metropolitan Tr a n s p o rtation Authority
( L A C M TA) funds, the Bikestation feature s :
1 . F ree valet parking for 150 bicycles
2 . Rentals of commuter, folding and electric bicycles
3 . Bicycle repairs and tune-ups
4 . A bicycle accessories shop
5 . A re s t room and changing are a
6 . A coffee bar and patio seating
7 . Bike-on-transit info and licenses, bike route maps, and transit
s e rvice info
8 . Bike safety and maintenance classes
9 . Bike loaner trial program for commuters
1 0 .Commuter bike club
1 1 .Bike-to-work day promotion as well as a bike maintenance program
for at-risk youth
l o n g b e a c h
A N C I L L A R Y F A C I L I T I E S
The Long Beach Bikestation is open from 6 a.m. to 7 p.m. Monday
t h rough Friday, and from 9 a.m. to 6 p.m. on weekends and it is usually
s t a ffed by one or two people.
Located on the transit mall in downtown Long Beach, the Bikestation
is at the end of the Metro Blue Line light rail, 35 km (22 miles) south of
downtown Los Angeles and cyclists can transfer from train to bus or local
downtown shuttles. More than 50 km (30 miles) of bike paths serve the
Bikestation and patrons can conveniently walk to offices, shops, re s t a u-
rants, as well as hotels and the Convention Center.
The Bikestation stru c t u re cost $125,000 to build, roughly the same as
six stalls for autos in a typical parking stru c t u re, on land donated by the
Long Beach Redevelopment Agency. The colorful stru c t u re is made of
lightweight metal and translucent fiberglass and is bolted to a concre t e
pad. Employees hang the bicycles on overhead hooks. It has become more
than a convenience center for bicyclists and a booster to transit ridership:
community leaders believe the Bikestation has enlivened the street and
attracted tourists.
After only 18 months of operation, the Bikestation parked about 1,500
bicycles per month with an increase of about 10 percent per month.
Salaries, marketing, and general overhead are funded equally by the City
and the LACMTA. The facili ty also maintains a volunteer pro g r a m
comprised of senior citizens, at-risk youth, and other civic-minded people.
The Long Beach Bikestation has fostered the start of similar facilities
in suburban Santa Clarita and Chatsworth, Union Station in downtown Los
Angeles and the City of Palo Alto. The Long Beach Bikestation is encour-
aging more communities to address transportation policy with this unique
way of linking the advantages of bicycling with those of transit.
other ex a m p l e s
B I K E C E N T R A L
PO RT L A N D, OR.: RO G E R GE L L E R
(503) 823-7671
L O N G B E AC H B I K E S T A T I O N
c o n t a c t G E O R G I A C A S E
ON E WO R L D TR A D E CE N T E R
P.O. BO X 3 2 2 2 1
LO N G BE A C H, CA 90832
(562) 595-4720
E-M A I L: b k s t a t i o n @ a o l . c o m
c o n t a c t R Y A N S N Y D E R
RYA N SN Y D E R AS S O C I AT E S
1015 GAY L E Y AV E. #1248
LO S A N G E L E S, CA 90024
(310) 824-9931
E-M A I L: ry s n y d e r @ i x . n e t c o m . c o m