Embed Size (px)
Citation preview

Improving DNA Plasmid Production in Escherichia Coli
by
ADAM SINGER
(Under the Direction of Mark A. Eiteman)
ABSTRACT
The ability to produce large quantities of plasmid DNA is imperative for wide scale
availability of DNA vaccines. Large scale, high yield production relies on the synergy between
host strain, plasmid, medium and production scheme. Screening as many variables as quickly
and cost effectively as possible is the goal. In this study, Escherichia coli strains were
transformed with two plasmids and screened for plasmid yield in shake flasks in chemically
defined medium supplemented with either glucose or glycerol. High yield candidates were
grown in feed batch fermentations at two specific growth rates, µ = 0.14 h-1 and µ = 0.24 h-1. As
predicted, high production in shake flasks was predictive of high production in fermentations.
Using our media and process, we were able to reach volumetric yields of approximately 600
mg/L and specific yields of approximately 17.82 mg/g, regardless of growth rate. We were also
able to increase productivity (mg/Lh) over 30%.
INDEX WORDS: E. coli, fed-batch, gene therapy, plasmid production

Improving DNA Plasmid Production in Escherichia Coli
by
ADAM SINGER
B.S., Biological Engineering, University of Georgia, 1998
A Thesis Submitted to the Graduate Faculty of The University of Georgia in Partial Fulfillment
of the Requirements for the Degree
MASTER OF SCIENCE
ATHENS, GEORGIA
2007

© 2007
Adam Singer
All Rights Reserved

Improving DNA Plasmid Production in Escherichia Coli
by
ADAM SINGER
Major Professor: Mark A. Eiteman
Committee: Elliot Altman Sidney Kushner
Electronic Version Approved: Maureen Grasso Dean of the Graduate School The University of Georgia August 2007

iv
DEDICATION
To my wife Dana and my daughter Sydney-Rose. Thank you for standing by me.

v
ACKNOWLEDGEMENTS
I would like to thank my major professor Dr. Mark A. Eiteman and Dr. Elliot Altman for
their guidance and belief that I could accomplish this task. They have had an instrumental part in
my engineering education. Thanks to my committee member Dr. Sidney Kushner for his support
during the initial stages of this project. Thank you Merial Ltd for providing me with the
financial, technical, and personal support to finish this project. I would especially like to thank
Frank Milward, Lauri Kreimeyer and Xuan Guo for their continued support. Without their
continuing support, I would never have taken the first steps.
Special thanks to Amanda Randall, Mike Vincent, Ernie Veal, Thasan Murugesu, Jayanta
Sinha, Fabien Lux and Nicolas Carboulec for your technical support and help.
Lastly, I would like to thank my family and friends for picking me up when I fell. Dana,
Sydney-Rose, Rory, Mom, Burt, Phyllis and Paul. I love you all.
vi
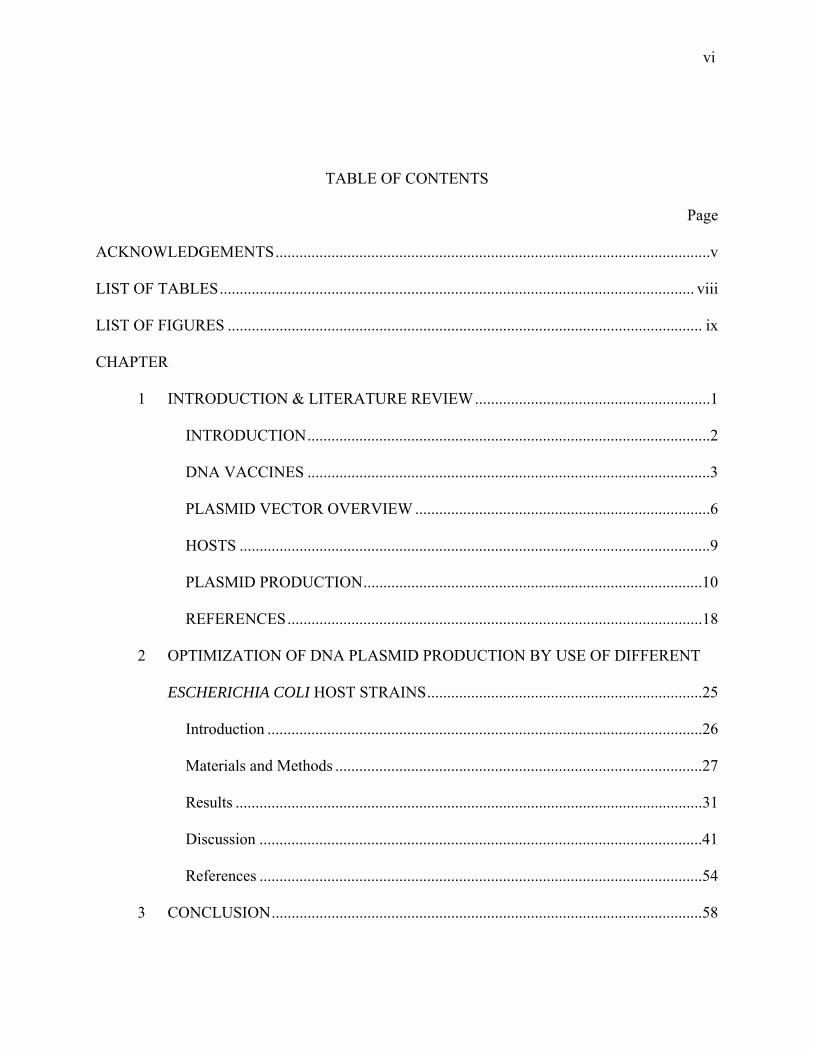
TABLE OF CONTENTS
Page
ACKNOWLEDGEMENTS.............................................................................................................v
LIST OF TABLES....................................................................................................................... viii
LIST OF FIGURES ....................................................................................................................... ix
CHAPTER
1 INTRODUCTION & LITERATURE REVIEW...........................................................1
INTRODUCTION.....................................................................................................2
DNA VACCINES .....................................................................................................3
PLASMID VECTOR OVERVIEW ..........................................................................6
HOSTS ......................................................................................................................9
PLASMID PRODUCTION.....................................................................................10
REFERENCES........................................................................................................18
2 OPTIMIZATION OF DNA PLASMID PRODUCTION BY USE OF DIFFERENT
ESCHERICHIA COLI HOST STRAINS.....................................................................25
Introduction .............................................................................................................26
Materials and Methods ............................................................................................27
Results .....................................................................................................................31
Discussion ...............................................................................................................41
References ...............................................................................................................54
3 CONCLUSION............................................................................................................58

vii
APPENDICES ...............................................................................................................................60
A Raw Data from Clonal Selection .................................................................................60
B Raw Data from Shake Flasks.......................................................................................65
C Raw Data from Fermentations .....................................................................................68
D Raw Data From Dry Cell Weight Data........................................................................99
viii
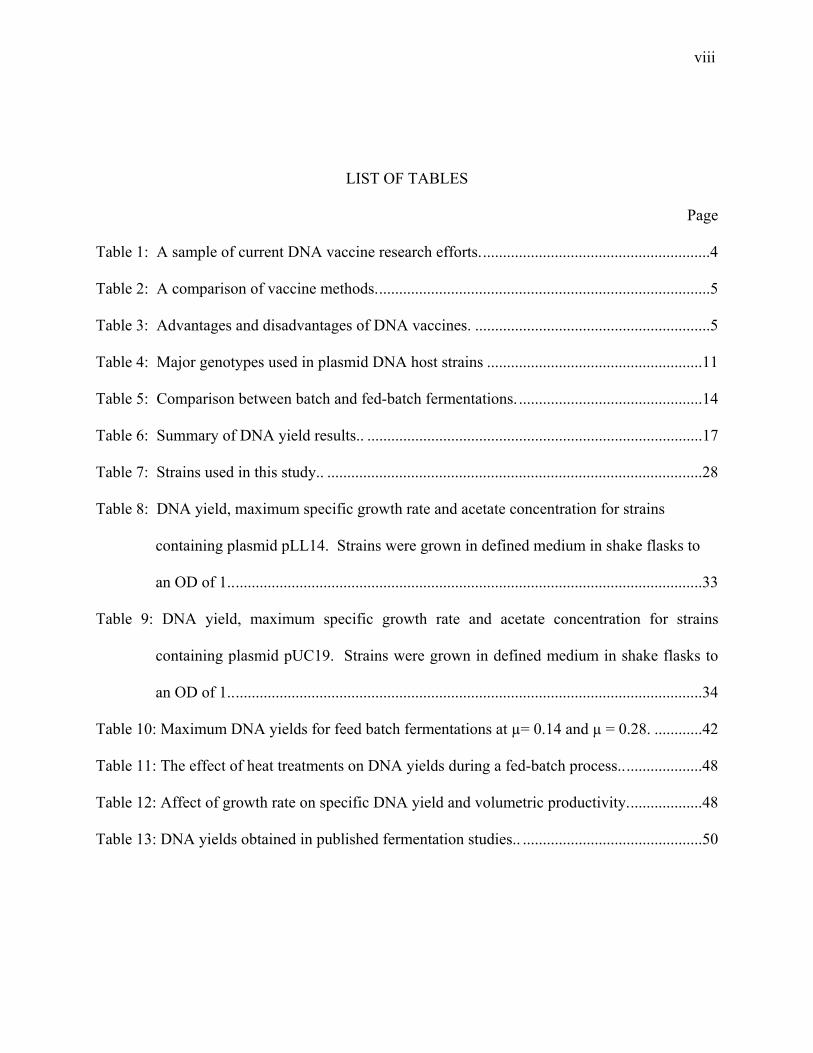
LIST OF TABLES
Page
Table 1: A sample of current DNA vaccine research efforts..........................................................4
Table 2: A comparison of vaccine methods....................................................................................5
Table 3: Advantages and disadvantages of DNA vaccines. ...........................................................5
Table 4: Major genotypes used in plasmid DNA host strains ......................................................11
Table 5: Comparison between batch and fed-batch fermentations. ..............................................14
Table 6: Summary of DNA yield results.. ....................................................................................17
Table 7: Strains used in this study.. ..............................................................................................28
Table 8: DNA yield, maximum specific growth rate and acetate concentration for strains
containing plasmid pLL14. Strains were grown in defined medium in shake flasks to
an OD of 1.......................................................................................................................33
Table 9: DNA yield, maximum specific growth rate and acetate concentration for strains
containing plasmid pUC19. Strains were grown in defined medium in shake flasks to
an OD of 1.......................................................................................................................34
Table 10: Maximum DNA yields for feed batch fermentations at µ= 0.14 and µ = 0.28. ............42
Table 11: The effect of heat treatments on DNA yields during a fed-batch process.....................48
Table 12: Affect of growth rate on specific DNA yield and volumetric productivity...................48
Table 13: DNA yields obtained in published fermentation studies.. .............................................50
ix
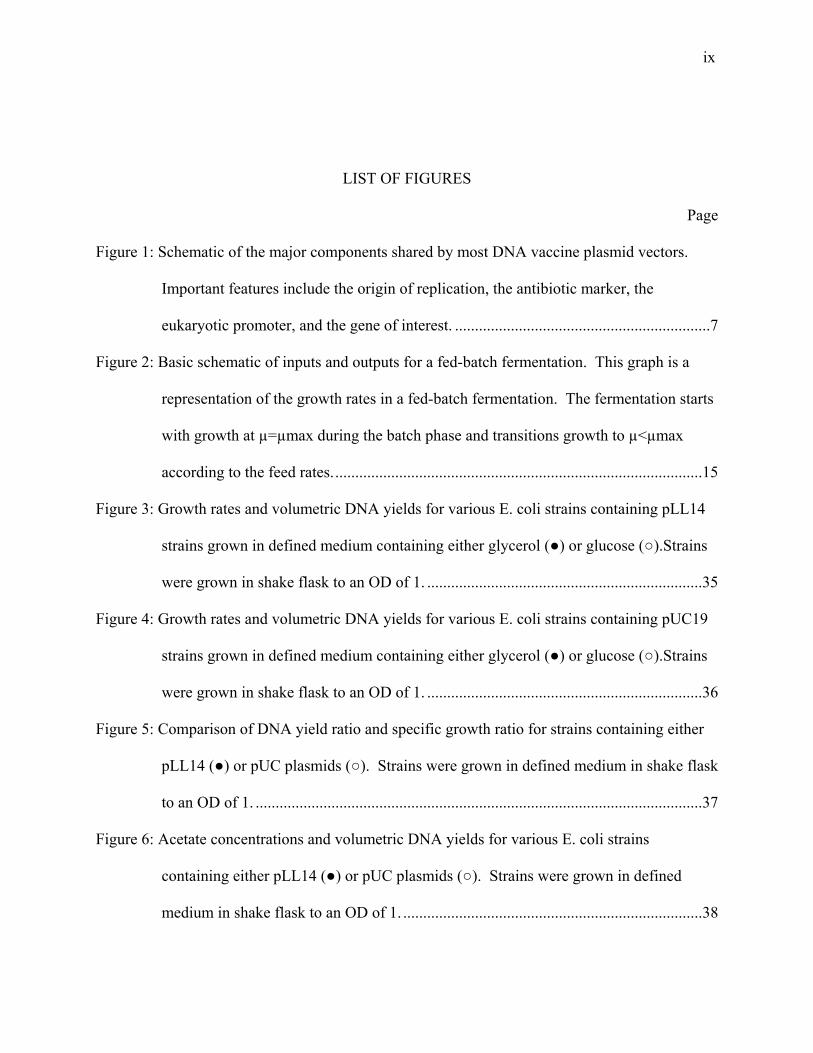
LIST OF FIGURES
Page
Figure 1: Schematic of the major components shared by most DNA vaccine plasmid vectors.
Important features include the origin of replication, the antibiotic marker, the
eukaryotic promoter, and the gene of interest. ................................................................7
Figure 2: Basic schematic of inputs and outputs for a fed-batch fermentation. This graph is a
representation of the growth rates in a fed-batch fermentation. The fermentation starts
with growth at µ=µmax during the batch phase and transitions growth to µ<µmax
according to the feed rates.............................................................................................15
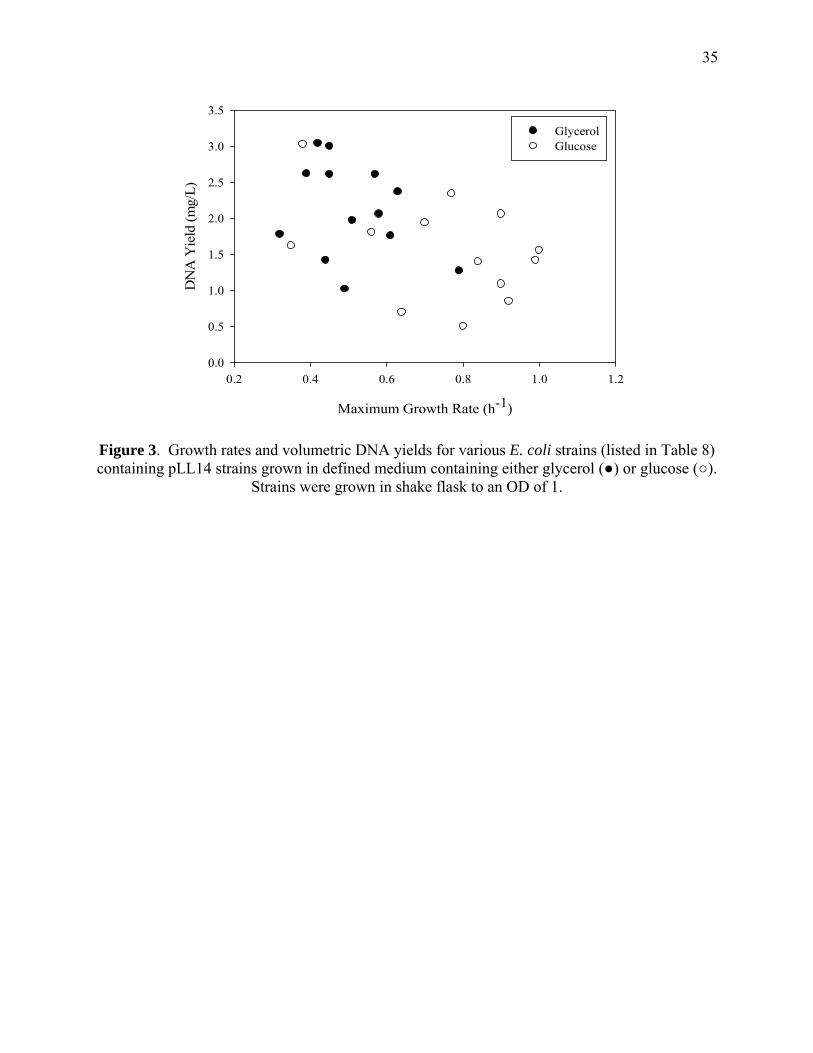
Figure 3: Growth rates and volumetric DNA yields for various E. coli strains containing pLL14
strains grown in defined medium containing either glycerol (●) or glucose (○).Strains
were grown in shake flask to an OD of 1. .....................................................................35
Figure 4: Growth rates and volumetric DNA yields for various E. coli strains containing pUC19
strains grown in defined medium containing either glycerol (●) or glucose (○).Strains
were grown in shake flask to an OD of 1. .....................................................................36
Figure 5: Comparison of DNA yield ratio and specific growth ratio for strains containing either
pLL14 (●) or pUC plasmids (○). Strains were grown in defined medium in shake flask
to an OD of 1. ................................................................................................................37
Figure 6: Acetate concentrations and volumetric DNA yields for various E. coli strains
containing either pLL14 (●) or pUC plasmids (○). Strains were grown in defined
medium in shake flask to an OD of 1. ...........................................................................38

x
Figure 7: Production of DNA in SCS1-L during a glucose-limited fed-batch process with
µ=0.12 h-1: Volumetric DNA yield (▲), specific DNA yield (■) and OD ( ). Heat
treatment effects are shown to the right of the dashed line. ..........................................43
Figure 8: Production of DNA in BL21 during a glucose-limited fed-batch process with µ=0.12
h-1: Volumetric DNA yield (▲), specific DNA yield (■) and OD ( ). Heat treatment
effects are shown to the right of the dashed line. ..........................................................44
Figure 9: Production of DNA in MC4100 during a glucose-limited fed-batch process with
µ=0.12 h-1: Volumetric DNA yield (▲), specific DNA yield (■) and OD ( ). Heat
treatment effects are shown to the right of the dashed line. ..........................................45
Figure 10: Production of DNA in SCS1-L during a glucose-limited fed-batch process with
µ=0.24 h-1: Volumetric DNA yield (▲), specific DNA yield (■) and OD ( ). Heat
treatment effects are shown to the right of the dashed line. ..........................................46
Figure 11: Production of DNA in MC4100 during a glucose-limited fed-batch process with
µ=0.24 h-1: Volumetric DNA yield (▲), specific DNA yield (■) and OD ( ). Heat
treatment effects are shown to the right of the dashed line. ..........................................47

1
CHAPTER 1
INTRODUCTION & LITERATURE REVIEW

2
INTRODUCTION
A new technology for vaccine development is the use of the plasmid DNA as the antigen.
A form of gene therapy, DNA vaccination can be used for the prevention of viral, bacterial, and
parasitic diseases, as a therapeutic vaccination for diseases, or for other health conditions such as
cancer, Malaria and AIDS (Gregoriadis, 1998; Tuteja, 1999; Mountain, 2000, Barouch et al.,
2000; Barouch et al., 2001; Doolan and Hoffman 2001; Lowe et al., 2006; Lowe et al., 2007).
The market for gene therapy products is expected to exceed 45 billion dollars by 2010 (Glaser,
1997). Well over 100 DNA vaccine trails have been initiated (Listner et al., 2006). In-fact, as
of 2007 16% of all gene therapy clinical trials involved plasmid DNA
(http://www.wiley.co.uk/genetherapy/clinical).
Jenner first demonstrated the ability to vaccinate for an infectious disease over 200 years
ago. In 1796, Jenner “vaccinated” a young boy with an attenuated strain of Cowpox. Later he
injected the boy with the Smallpox virus and observed no infection. Since that time, vaccination
has been successful for a variety of infectious diseases. Since initial work using naked DNA as
an antigen (Wolf et al., 1990), DNA vaccination has become one of the fastest growing areas of
medical research (Leitner et al., 2000). Despite this fact, many of the most harmful diseases such
as HIV, malaria, HBV, and tuberculosis cannot be vaccinated against.
In 1996, the FDA released their first major documentation related to the production of
DNA vaccines, “The points to consider on plasmid DNA vaccines for preventive infectious
disease indications” (FDA). This document provided the guidelines needed to industrialize DNA
vaccine production. This document was later revised in 2005 to the “Guidance for Industry:
Considerations for Plasmid DNA Vaccines for Infectious Disease Indications.”

3
DNA VACCINES
Vaccination by naked plasmid DNA is the transfer of genetic material into a host. DNA
vaccines can best be described as the expression of exogenous antigen contained on a
mammalian expression vector. DNA Vaccination can be used to treat a number of diseases and
conditions such as: influenza, HIV, HBV, HCV, CMV, tuberculosis, melanoma, non-Hodgkin’s
lymphoma, HSV, myocardidis, and various allergens (Taubes, 1997; Gregoriadis, 1998; Tuteja,
1999; Gurunathan et al., 2000; Srivastava and Liu, 2003).
The seminal study on DNA Vaccines showed that exogenous proteins could be expressed
from naked DNA plasmid injected into the muscle cells of mice (Wolff et al., 1990). Later,
humural and cellular immune responses from injected plasmid encoded antigens were shown
(McDonnell and Askari, 1996). Davis et al. (1993) showed that muscle cell uptake led to the
expression and extra cellular release of the antigen. The antigen was then taken up by antigen
presenting cells (APC). It has also been suggested that APCs will directly take up DNA
(Gurunathan et al., 2000; Leitner et al., 2000; Srivastava and Liu, 2003). Johnson et al. (1992)
demonstrated the initial concept of direct DNA immunization. Ulmer et al. (1993) showed that
mice were protected against influenza A if they had been injected with influenza DNA
fragments. Subsequent work throughout the nineties further demonstrated the usefulness of
DNA vaccines in combating disease (Robinson, 1993; Liu et al., 1996; Liu et al., 1997; Ulner,
1997). Work continues in the new millennium on some important disease targets as shown in
Table 1. Currently, DNA vaccines for diseases such as HIV, Melanoma, and CMV are in phase I
and II trials for humans (NIH, 2006).

4
Additionally, DNA vaccines for animals have received licenses by the USDA and are
currently in use for West Nile (Horses, Fort Dodge, 2005), Infectious Haematopoietic Necrosis
Virus (Salmon, Aqua Health, 2005) and Melanoma (Dogs, Merial Ltd., 2007).
Table 1. A sample of current DNA vaccine research efforts.
Disease Target Reference
Intracellular pathogens Gurunathan et al., 2000 Bergmann-Leitner and Leitner, 2004 Powell, 2004
Cancer treatment Mountain, 2000 Ferber, 2001 Leitner and Thalnamer, 2003 Berzofsky et al., 2004
HIV Barouch et al., 2000 Barouch et al., 2001 Sheets et al., 2006
Enteric Pathogens (Viral, Bacterial, Parasites) Compiled by Herrman, 2006
Although plasmid DNA as a therapeutic compound is a novel technology, certain similarities are
shared with currently used vaccination methods. Table 2 compares DNA vaccines with live and
killed vaccines (Gurunathan et al., 2000). The advantages and disadvantages of DNA vaccines
are reviewed in Table 3.
The production of DNA vaccines requires three steps. Step one involves the creation of
the plasmid containing the gene of interest. The plasmid is then transformed into a selected host
microorganism that will be used for its production, followed by clonal selection, medium
adaptation and small-scale seed production (used to inoculate fermentors). Step two involves the
production of the plasmid DNA. Fermentation methods, culture conditions, and fermentation
scale-up are refined at this step.

5
Table 2. A comparison of vaccine methods.
DNA Vaccine Live Attenuated
Killed / Subunit
Immune Response
Humoral B cells +++ +++ +++ Cellular CD4+ +++ Th1
lymphocytes +/-Th1
lymphocytes +/-Th1
lymphocytes CD8+ ++ +++ - Antigen
Presentation MHC class
I&II MHC class
I&II MHC
class II
Memory Humoral +++ +++ +++ Cellular ++ +++ +/- Manufacturing Ease of R&D and
production ++++ + ++
Cost +++ + + Transport/Storage +++ + +++ Safety +++ ++ ++++
+ = level of effect
Table 3. Advantages and disadvantages of DNA vaccines.
Advantages Disadvantages
• No harmful organism / infectious agents to work with
• No risk of reversion (possible with attenuated vaccines) (Henke, 2002; Moreno and Timón, 2004)
• Mimic effect of live attenuated vaccines (Gurunathan, 2000)
• Manufacturing/Production, storage, and Quality Control are relatively simple (Mountain, 2000)
• Defined product • Good safety
• Only 1 in every 1000 plasmids reach the nucleus and is expressed, inefficient transfection in vivo (Ferreira et al., 2000; Mountain, 2000).
• Require dosages as high as several mg (Berzofsky et al., 2004; Okonkowski, 2005; Donnelly et al., 2003; Listner et al., 2006)
• Short duration of expression in most tissues (Mountain, 2000)
• Low immunological potency for self (tumor) antigens (Berzofsky et al., 2004)

6
In addition, harvest methods must be determined to coincide with the downstream processing
methods. Step three involves the downstream processing of the plasmid DNA. Cellular debris
along with all impurities (salts, endotoxins, and plasmid isoforms) must be removed leaving only
a suitable percentage of supercoiled plasmid for the final product.
PLASMID VECTOR OVERVIEW
The active ingredient injected into a patient for a DNA vaccine is a purified suspension
(can be mixed with a number of vaccine adjuvants) of double-stranded plasmid DNA. All
plasmids used in DNA vaccination have several common features. Figure 1 is a schematic
representation of a typical plasmid employed in the development of a DNA vaccine. The origin
of replication (Ori) is a sequence of DNA at which plasmid replication is initiated. Plasmid
origins are well-defined sites at which replication starts in both directions until the two
replication forks meet. The type of Ori helps determine the maximum copy number of the
plasmid per cell. Since the Ori on the vector is specific to bacterial replication, the injected
plasmid cannot replicate in a eukaryotic host. A commonly used Ori is derived from the E. coli
plasmid ColE1 (Carnes, 2005). The pUC derived plasmids, initially described by Vieira and
Messing (1982), were derived from pBR322 (Bolivar et al., 1977).
Temperature sensitive mutations can increase yields (copy number) 30-40 times with a
temperature increase from 30°C to 42°C (Wong et al., 1982; Lahijani et al., 1996). Boros et al.
(1984), and later Lahijani et al., (1996) described a single G A mutation that caused a 70-fold
increase in plasmid yield with a shift from 37°C to 42ºC. The copy number of pUC-derived
plasmids can be as high as 500-700 per cell (Minton, 1984; Minton et al., 1988). In addition to
increases in copy number, the choice of Ori may increase the yield of supercoiled plasmid DNA,
downstream recovery and purification (Shamlou, 2003).

7
Promoter
Polyadenylation
Signal
Gene E
ncoding Antigen
Ant
i bio
tic R
esis
tanc
e
G
ene
Ori
MultipleCloning Site
MultipleCloning Site
Figure 1. Schematic of the major components shared by most DNA vaccine plasmid vectors. Important features include the origin of replication, the antibiotic marker, the eukaryotic
promoter, and the gene of interest. Supercoiled plasmid DNA is the only form considered therapeutic by the FDA. Linear,
nicked and relaxed isoforms are considered impurities and must be removed (FDA, 1996a,
1996b). Currently, the importance of the ratio of supercoiled (SC-pDNA) versus open circular
plasmid (OC-pDNA) isoforms on the efficacy of DNA vaccination is only partially understood
(Marquet et al., 1997; Middaugh et al., 1998; Bergan et al., 2000; Evans et al., 2000). Cherng et
al. (1999) have shown that SC-pDNA has higher transfection efficiency than OC-pDNA.
Przybylowski et al. (2007) showed a relationship to stability and percentage of SC-pDNA.
8
Purification processes strive for a minimum of 90% SC-pDNA per batch. Interaction between
the plasmid, bacterial host and production process all contribute to the quality of the final pDNA
(O'Kennedy et al., 2003).
An important component of a plasmid is the antibiotic resistance gene. This resistance is
critical for maintaining the plasmid during the production process. Ampicillin, kanamycin, and
tetracycline are the most commonly used selective markers. Unfortunately, ampicillin and other
β-lactam antibiotics must be removed for all clinical work (FDA, 1996a; FDA, 1998) due to
hypersensitivity reactions in patients. Kanamycin is currently the most widely used selection
agent for DNA vaccines, since it does not present a significant allergic risk (Durland and
Eastman, 1998).
The remaining components of the vector allow the gene of interest to transcribe once
injected into the patient. Sufficient transcription of the gene of interest requires a strong viral
promoter. The most commonly used strong viral promoters are either the cytomegalovirus
immediate early gene (CMV-IE), simian virus 40 (sv40), or rous sarcoma virus (rsv) (Manoj and
Babiuk, 2004). The CMV-IE promoter is considered the strongest based on in vitro expression
studies (Lee et al., 1997). To ensure mRNA stability these promoters are paired with
transcription terminators/polyadenylation signals (shown as poly (A) tail in Figure 4) derived
from genes such as bovine growth hormone (bgh), sb40 and human β-globin (Tuteja, 1999;
Prather et al., 2003). The gene encoding the antigen is cloned after the promoter employing a
multiple cloning site within the vector.
Lastly, other components may be included on the vector, such as CpG motifs for immune
response, intron sequences for nuclear transport and enhancers (Srivastava and Liu, 2003; Manoj
and Babluk, 2004).

9
HOSTS A second biological factor involved with DNA vaccine production is the host strain.
Although the host and its components are removed during final processing of the plasmid DNA
its identity is crucial to plasmid production. The bacterial host is the factory to produce plasmid
DNA. In general, K12 derivatives of E. coli are the strain of choice. K12 variants are well
characterized and exempted by the NIH guidelines for recombinant genetic research (Carnes,
2005). Because the selection of the best bacterial host is critical to the production process, most
studies of particular strains have been conducted by specific companies. The results remain
unpublished. It is probable that the synergy between plasmid, host and fermentation scheme is
the major factor in the success of DNA plasmid production (Durland and Eastman, 1998).
The primary industrial criteria for a host include: high specific (defined as μg plasmid/mg
dry cell weight) and volumetric production (defined as mg plasmid/L of culture), minimal
production times, homogeneity of plasmid (> 90% SC pDNA), and low endotoxin levels.
Currently, strains such as DH5 and its derivatives (DH5α, DH10), XL1-Blue, and JM109 meet
the requirements of industry (Carnes, 2005). For example, Merck is developing its HIV vaccines
using DH5 (Okonkowski et al., 2005). Additional E. coli strains, such as the B strain (BL 21),
are also being investigated (Xu et al., 2005). Lastly, the chosen strain/plasmid combination must
be in harmony with the production method (medium selection, fermentation, and downstream
processing). Certain bacterial genes that affect plasmid production have been identified. These
genes are described in Table 4. Some hosts are avoided (e.g. HB101) because they are gal+ and
produce a capsule (colonic acid), making cell lysis and downstream purification more difficult
(Carnes, 2005).

10
PLASMID PRODUCTION Once an appropriate plasmid has been constructed and the host strain chosen,
optimization of plasmid production can commence. The production phase consists of two
important components: medium selection and fermentation process development. The
interaction between host, plasmid, medium, and fermentation dictates the success of the overall
process. Furthermore, production will have a significant effect on the downstream processing of
pDNA (O’Kennedy, et al., 2003). As discussed earlier DNA vaccines require dosages at the mg
level. Therefore, to reduce costs, yields per fermentation must be maximized. Compounding
this issue is the dearth of published papers on successful plasmid production techniques. Success
of a production process is measured as:
• Specific yield – plasmid DNA per biomass • Volumetric yield – plasmid DNA per liter of fermentation
Additionally, any reduction in times to produce these yields can reduce associated costs
(yield/time). Indeed, much of the cost associated with DNA vaccines is determined during the
production phase.
Medium Selection and Development Carnes (2005) considered the following factors important in the development of a
production media. These include:
• Affect of components on plasmid yield and quality • Biomass yield • Lot to lot consistency • Downstream purification • Regulatory concerns (current good manufacturing practices)
O’Kennedy et al. (2000) found that use of chemically defined medium (CDM) resulted in higher
copy numbers.

11
Table 4. Major genotypes used in plasmid DNA host strains
Genotype Consequence recA The recA family of genes is involved in the complex regulation of the SOS system (an
E. coli regulatory network that is induced by DNA damage). In addition, proteins expressed by recA are also involved in homologous recombination between homologous molecules. recA mutants are completely deficient in homologous recombination.
endA1 endA1 encodes the 12-kDa protein which non-specifically cleaves double-stranded DNA (dsDNA) approximately every 400 bp and degrades the DNA into oligonucleotides with an average size of 7bps. endA mutants improve yield and quality of the plasmid preparations.
gyrA The gyrA family of genes encodes gyrases (i.e., ATP-dependent topoisomerases) involved in regulation of the chromosomal replication process that remove positive supercoils introduced during replication. Gyrases also have the ability to introduce negative supercoils into a relaxed DNA.
hsdRMS(rk-mk+): The hsd family of genes encodes genes involved in protecting the bacterial chromosome from being digested by restriction enzymes (host specificity for DNA). These genes are involved in DNA methylation. Mutation prevents cleavage by an endogenous endonuclease system.
deoR Mutation involves a gene that encodes a repressor protein. This repressor suppresses a set of genes involved in nucleotide utilization. In the absence of this gene, the regulated genes are expressed constitutively. Cells containing the deoR mutation transform at higher efficiency than their non-mutated counterparts.
dam Encodes an enzyme that methylates A residues in the GATC sequence. Mutations eliminate the presence of methyl-A, which is not normally found in eukaryotes.
mcrA Restriction system named Modified Cytosine Restriction is directed against DNA methylated at the sequence 5'...Cm5CGG, which is its only known target (Raleigh and Wilson, 1986)
mcrBC McrBC requires the presence of two (G/A)mC recognition elements (where mC is 5-hydroxymethylcytosine, N4-methylcytosine or 5-methylcytosine appropriately spaced in the substrate DNA. DNA cleavage occurs in region between two recognition elements (Dila et al., 1990).
dcm Encodes an enzyme that methylates the second C residue in the CC(A/T)GG sequence. Mutations eliminate the presence of methyl-C, which is normally founds in eukaryotes, but not in this sequence.
F- Conjugative, low copy number F plasmid; when present, it may contaminate the final plasmid preparation.
Prototrophic / minimal auxotroph
Defined media are desired for plasmid production as well as product characterization and cost. Host strains that require as few additional media components as possible are desired. For example, the strain SCS1 is a complete prototroph while DH5α only requires the vitamin thiamine.
Information adapted from Durland and Eastman, 1998.
12
In addition, they observed that a C:N ratio of 2.78 to 1 (molar ratio of carbon, as carbohydrate, to
total nitrogen) resulted in the highest specific plasmid DNA yields (ten fold increase at optimum
ratio). CDM supply only the elements needed for cell growth and generally contain the
following components:
• Carbon source-glucose or glycerol • Salts, minerals, and trace metals • Nitrogen source
High density cell culture requires the correct balance of all these components to support cell
growth and avoid inhibition (Lee, 1996; Shiloach and Fass, 2005).
The choice of carbon source plays a key role in cell yield and related acetate production.
Since high acetate concentrations can inhibit growth rates and reduce biomass yields, acetate
must be controlled (Luli and Strohl, 1990; Majewski and Domach, 1990). The effect of acetate
on plasmid DNA production has not been investigated (Xu et al., 2005). Glucose is the most
common carbon source, but also generates the most acetate. Xu et al. (2005) found that glycerol
produced the highest specific plasmid production while glucose produced the highest volumetric
yield. This can be explained since glycerol has been associated with poor cell growth.
Determining the optimal medium composition can be a very costly and time-consuming process.
Fermentation Design
Two types of fermentations are used to produce DNA vaccines, batch and fed-batch.
Each method has its advantages and disadvantages (summarized in Table 5). A simple
schematic of a fed-batch fermentor is shown in Figure 2. The ability to dictate growth rates and
grow cells to higher densities makes fed-batch fermentations the production method of choice.
The problems related to high growth rates are high acetate production, plasmid instability, and
lower percentage of supercoiled plasmid (Carnes, 2005).

13
As growth rate decreases, the specific yield generally increases (Bentley et al., 1990; Prather
et al., 2003). For example, a change in copy number from 15 to 23 per cell was observed with a
decrease in growth rate from 1.7 to 0.4 h-1 (Lin-Chao and Bremer, 1986). Chen et al. (1997),
observed a change in specific yield from 0.7 μg/mg to 1.7 μg/mg associated with a change in
growth rate of 0.69 to 0.13 h-1. Seo and Bailey (1986) found that cultures growing at 0.6 – 0.8
h-1 contained less plasmid than cultures growing at 0.3-0.4 h-1 with a value of 0.2 h-1 as the low
limit. Rozkov et al. (2006) observed an almost 2-fold increase in specific yields after a switch
from batch production (µmax=0.48 h-1 and 6 mg/g) to fed-batch (µ = 0.1 h-1 and 10 mg/g).
Studies have also found that plasmid yields were highest after the culture had entered the
stationary phase, a similar condition to the late phase of a fed-batch process (Hecker et al., 1985;
Reinikainen et al., 1989).
In addition, super coiling and plasmid stability may be controlled by changes in dissolved
oxygen, pH, and temperature (Goldstein and Drlica, 1984; Durland and Eastman, 1998).
Additional strategies, such as temperature shock, chemical treatment, and amino acid starvation
may have been used to increase specific yields (Shamlou, 2003). For example, a 37°C to 42°C-
45°C shift in fermentation temperature (Lahijani et al., 1996), or the use of chloramphenical
(Reinikainen et al., 1989).
Table 6 contains a compilation of published yield data along with information about the
methods.
14
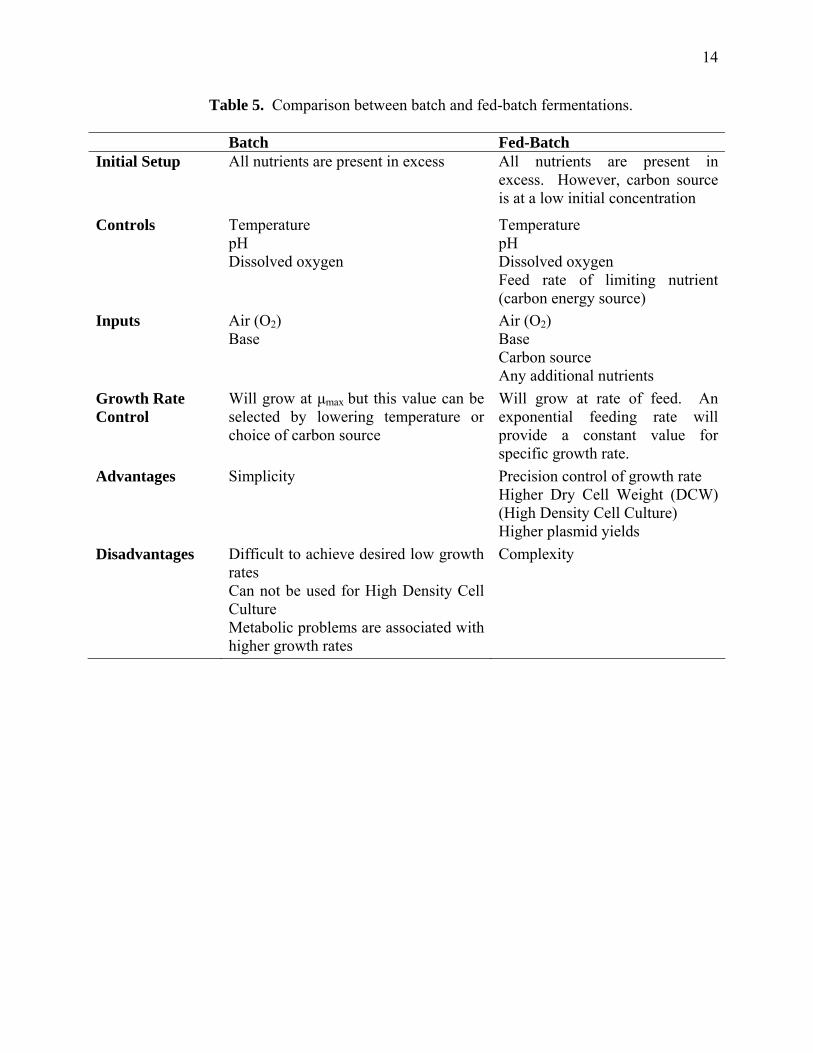
Table 5. Comparison between batch and fed-batch fermentations.
Batch Fed-Batch Initial Setup All nutrients are present in excess All nutrients are present in
excess. However, carbon source is at a low initial concentration
Controls Temperature pH Dissolved oxygen
Temperature pH Dissolved oxygen Feed rate of limiting nutrient (carbon energy source)
Inputs Air (O2) Base
Air (O2) Base Carbon source Any additional nutrients
Growth Rate Control
Will grow at μmax but this value can be selected by lowering temperature or choice of carbon source
Will grow at rate of feed. An exponential feeding rate will provide a constant value for specific growth rate.
Advantages Simplicity
Precision control of growth rate Higher Dry Cell Weight (DCW) (High Density Cell Culture) Higher plasmid yields
Disadvantages Difficult to achieve desired low growth rates Can not be used for High Density Cell Culture Metabolic problems are associated with higher growth rates
Complexity

Figure 2. Basic schematic of inputs and outputs for a fed-batch fermentation. This graph is a representation of the growth rates in a fed-batch fermentation. The fermentation starts with growth at µ=µmax during the batch phase and transitions growth to µ<µmax according to the feed rates.
15

17
Table 6. Summary of DNA yield results.
Strain Volumetric Yield (mg/L)
DCW (g/L)
Specific Yield (mg/g) Method Miscellaneous Reference
DH5 220 ~45 ~ 4.8 Fed-batch 37°C to 42-45°C temperature shift
Lahijani et al., 1996
DH5α 230 60 3.83 Fed-batch with DO-stat feeding
glycerol and yeast extract μ = 0.15 h-1
Schmidt et al., 2003
DH10β 82-98 80-105 1.7 Fed-batch DO-stat and pH-stat
μ = 0.13 h-1 Chen et al., 1997
NR 130-250 70-90 1.8-2.78 Batch Proprietary medium Durland and Eastman, 1998
NR 260-430 55-65 6.61 Fed-batch Proprietary medium High specific yields
Carnes and Williams, 2004
NR 670-1100 ~45 ~14.8-24.4 Fed-batch 37°C to 42°C temperature shift
Carnes and Williams, 2004
BL21 58.3 5.38 10.8 Shake Flask Glucose as carbon source
Xu et al., 2005
DH5 634-846 NR 28-34 Fed-batch Variable process steps
Okonkowski et al., 2005
DH5α 6.96 2.5 12.2 Shake Flask Semi-defined medium with 1% casamino acids
O’Kennedy et al., 2000
JM109 60 3.5 17.1 Batch μ = 0.33 h-1 Wang et al., 2001 DH1 296 NR 10 Fed Batch μ = 0.10 h-1 Rozkov et al., 2006 DH5 1200 NR 25-32 Fed Batch Large scale (2000L) Listner et al., 2006 DH5α 1500 ~33.5 ~45 Fed-Batch 37°C to 42°C
temperature shift μ = 0.12 h-1
Carnes et al., 2006
NR = Not reported

18
REFERENCES Barouch, D.H. et al. 2000. Augmentation of immune responses to HIV-1 and simian immunodeficiency virus DNA vaccines by IL-2/Ig plasmid administration in rhesus monkeys. Proc. Natl. Acad. Sci., USA. 97:4192-4197. Barouch, D.H. et al. 2001. Control of viremia and prevention of clinical AIDS in rhesus monkeys by cytokine-augmented DNA vaccination. Science 290: 486-492. Bentley, W.E., N. Mirjalili, D.C. Andersen, R.H. Davis, and D.S. Kompala. 1990. Plasmid-encoded protein: the principal factor in the metabolic burden associated with recombinant bacteria. Biotechnology and Bioengineering 35: 668-681. Bergan, D., T. Galbraith, and D.L. Sloane. 2000. Gene transfer in vitro and in vivo by cationic lipids is not significantly affected by levels of supercoiling of a reporter plasmid. Pharm Res. 17(8): 967-73. Bergmann-Leitner, E.S. 2004. Danger, death and DNA vaccines. Microbes and Infection 6: 319-327. Berzofsky, J.A., T. Masaki, O. SangKon, I.M. Belyakov, J. D. Ahlers, J.E. Janik, and J.C. Morris. 2004. Progress on new vaccine strategies for the immunotherapy and prevention of cancer . J. Clin. Invest. 113: 1515-1525. Blattner, F.R. et al. 1997. The complete genome sequence of Escherichia coli K-12. Science 277: 1453-74. Bolivar, F., R.L. Rodriguez, P.J. Greene, M.C. Betlach, H.L. Heyneker, and H.W. Boyer. 1977. Construction and characterization of new cloning vehicles. II. A multipurpose cloning system, Gene 2: 95-113. Bores, I., G. Posfai, P.A. Venetianer. 1984. High-copy-number derivatives of the plasmid cloning vector pBR322 (Recombinant DNA; polylinker; transversion mutation; regulatory RNA I; transcription termination). Gene. 30: 257-260. Bouchard, B., B.B. Fuller, S. Vijayasaradhi, and A.N. Houghton. 1989. Induction of pigmentation in mouse fibroblasts by expression of human tyrosinase cDNA. J. of Experimental Medicine 169: 2029-2042. Carnes, A.E. 2005. Fermentation design for the manufacture of therapeutic plasmid DNA. BioProcess Int. Oct: 36-44. Carnes, A. and J.A. Williams. 2004. Optimization of E. coli fermentation for plasmid DNA production. Molec. Ther. 9(supplement): 310.

19
Carnes, A.E., C.P. Hodgson and J.A. Williams. 2006. Inducible Escherichia coli fermentation for increased plasmid DNA production. Biotechnol. Appl. Biochem. 45:155-166 Casadaban, M.J. 1976. Transposition and fusion of the lac genes to selected promoters in Escherichia coli using bacteriophage lambda and mu. J. Mol. Biol. 104: 541–555. Chen, W. C. Graham, and R.B. Ciccarelli. 1997. Automated fed-batch fermentation with feed-back controls based on dissolved oxygen (DO) and pH for production of DNA vaccines. Journal of Industrial Microbiology & Biotechnology 18: 43–48. Cherng, J.Y., N.M. Schuurmans-Nieuwenbroek, W. Jiskoot, H. Talsma, N.J. Zuidam, W.E. Hennink, and D.J. Crommelin. 1999. Effect of DNA topology on the transfection efficiency of poly((2-dimethylamino)ethyl methacrylate)-plasmid complexes. J Control Release. 60: 343-353. Davis, H.L., R.G. Whalen, and B.A. Demeneix. 1993. Direct Gene transfer into skeletal muscle in vivo: factors affecting efficiency of transfer and stability of expression. Hum. Gene Ther. 4: 151-159. Dila D., E. Sutherland, L. Moran, B. Slatko, and E.A. Raleigh. 1990. Genetic and sequence organization of the mcrBC locus of Escherichia coli K-12. J. Bacteriol. 172: 4888-4900. Doolan, D.L. and S.L. Hoffman. 2001. DNA-based vaccines against malaria and other diseases - from the laboratory to the clinic. Gene Ther Reg. 1:213-232 Donnelly, J.J., J.B. Ulmer, J.W. Shiver, and M.A. Liu. 1997. DNA Vaccines. Annual Review of Immunology 15: 617-648. Donnelly, J., K. Berry, and J. Ulmer. 2003. Technical and regulatory hurdles for DNA vaccines. Int. J. Parasitol. 33: 457-467. Durland, R.H., E. M. Eastman. 1998. Manufacturing and quality control of plasmid-based gene expression systems. Advanced Drug Delivery Review. 30:33-48. Evans, R.K., Z. Xu, K.E. Bohannon, B. Wang, M.W. Bruner, and D.B. Volkin. 2000. Evaluation of degradation pathways for plasmid DNA in pharmaceutical formulations via accelerated stability studies. J Pharm Sci. 89: 76-87. FDA. Center for Biologics Evaluation and Research. 1996a. Points to Consider on Plasmid DNA Vaccines for Preventive Infectious Disease Indications (Draft Guidance). US Food and Drug Administration: Rockville, MD. FDA. Center for Biologics Evaluation and Research. 1996b. Addendum to The Points to Consider in Human Somatic Cell and Gene Therapy. US Food and Drug Administration, Rockville, MD.
20
FDA. Center for Biologics Evaluation and Research. 1998. Guidance for Human Somatic Cell Therapy and Gene Therapy. US Food and Drug Administration: Rockville, MD. FDA. Center for Biologics Evaluation and Research. 2005. Considerations for Plasmid DNA Vaccines for Infectious Disease Indications. US Food and Drug Administration: Rockville, MD. Ferber, D. 2001. Gene therapy: Safer and virus free. Science 294: 1638-1642. Ferreira, G.N.M., G.A. Monterio, D.M.F. Prazeres, and J.M.S. Cabral. 2000. Downstream processing of plasmid DNA for gene therapy and DNA vaccine applications. TIBTECH Sep (18): 380-388. Glaser, V. 1997. Promise of gene therapy for treating disease remains on trial in the clinic. Genet. Eng. News 14: 33-34. Goldstein, E. K. Drlica. 1984. Regulation of Bacterial DNA Supercoiling: Plasmid Linking Numbers Vary with Growth Temperature. Proc. Natl. Acad. Sci. USA. 81: 4046-4050. Grant, S.G. N., J. Jessee, F. R. Bloom, and D. Hanahan. 1990. Differential plasmid rescue from transgenic mouse DNAs into Escherichia coli methylation-restriction mutants. Proc. Natl. Acad. Sci. USA 87: 4645-4649. Gregoriadis, G. 1998. Genetic Vaccines: Strategies for Optimization. Pharmaceutical Research 15(5): 661-668. Gurunathan, S., D.M. Klinman, and R.A. Seder. 2000. DNA Vaccines: Immunology, Application and Optimization. Annu. Rev. Immunol. 18: 927-974 Hanahan, D. 1983. Studies on transformation of Escherichia coli with plasmids. J. Mol. Biol. 136: 557-580. Hecker, M., A. Schroeter, and F. Mach. 1985. Escherichia coli relA strains as hosts for amplification of pBR322 plasmid DNA. FEMS Microbiol. Lett. 29: 331-334. Henke, A. 2002. DNA immunization--a new chance in vaccine research? Med Microbiol Immunol (Berl). 191: 187-90. Herrmann, J.E. 2006. DNA vaccines against enteric infections. Vaccine. 24: 3705-3708. Johnston, S.A., D. Tang, M. Devit. 1992, Genetic immunization is a simple method for eliciting an immune response. Nature 356: 152-154. Lahijani, R., G. Hulley, G. Soriano, N.A. Horn, and M. Marquet. 1996. High-yield production of pBR322-derived plasmids intended for human gene therapy by employing a temperature-controllable point mutation. Hum Gene Ther. 7: 1971-1980.

21
Lee, S.Y. 1996. High cell-density culture of Escherichia coli. TBTECH 14: 98-105. Lee, A.H., Y.S. Suh, J.H. Sung, S.H. Yang, and Y.C. Sung. 1997. Comparison of various expression plasmids for the induction of immune response by DNA immunization. Mol Cells. 7 (4): 495-501. Leitner, W. and J. Thalhamer. 2003. DNA vaccines for non infectious diseases: new treatments for tumor and allergy. Expert Opin. Biol. Ther. 3: 627-638. Leitner, W., H. Ying, and N.P. Restifo. 2000. DNA and RNA-based vaccines: principles, progress and prospects. Vaccine 18: 765-777. Lin-Chao, S., and H. Bremer. 1986. Effect of the bacterial growth rate on replication control of plasmid pBR322 in Escherichia coli. Mol. Gen. Genet. 203: 143–149. Listner, K., L. Bentley, J. Okonkowski, C. Kistler, R. Wnek, A. Caparoni, B. Junker, D. Robinson, P. Salmon, and M. Chartrain. 2006. Development of a Highly Productive and Scalable Plasmid DNA Production Platform. Biotechnol. Prog. 22: 1335 -1345. Liu, M.A., Y. Yasutomi, M.E. Davies, H.C. Perry, D.C. Freed, N.L. Letvin, and J.W. Shiver. 1996. Vaccination of mice and nonhuman primates using HIV-gene-containing DNA. Antibiot Chemother. 48: 100-104. Liu, M.A., W. McClements, J.B. Ulmer, J. Shiver, and J.J. Donnelly. 1997. Immunization of non-human primates with DNA vaccines. Vaccine 15: 909-12. Lowe, D.B, M.H. Shearer, and R.C. Kennedy. 2006. DNA vaccines: successes and limitations in cancer and infectious disease. J. Cell. Biochem. 98:235-242. Luli, G.W. and W.R. Strohl. 1990. Comparison of growth, acetate production, and acetate inhibition of Escherichia coli strains in batch and fed-batch fermentations. Appl Environ Microbiol. 56: 1004–1011. Marquet, M., N.A. Horn, and J.A. Meek.1997. Characterization of plasmid DNA vectors for use in human gene therapy. BioPharm. May: 42–50. Majowski, R.A. and M.M Domach. 1990. Simple constrained-optimization view of acetate overflow in E. coli. Biotechnol. Bioeng. 35: 732-738. Manoj, S., L.A Babiuk, and S. van Duren Littel. 2004. Approaches to Enhance the Efficacy of DNA Vaccines. Crit. Rev. in Clinical Lab. Sciences 41: 1-39. McDonnell, W.M. and Askari, F.K. 1996. DNA Vaccines. New Engl. J. of Med. 334: 42-45. Middaugh, C.R., R.K. Evans, D.L. Montgomery , and D.R. Casimiro. 1998. Analysis of plasmid DNA from a pharmaceutical perspective. J. Pharm. Sci. 87: 130-146.

22
Minton, N.P. 1984. Improved plasmid vectors for the isolation of translational lac gene fusions. Gene 31: 269-273. Minton, N.P., S.P.Chambers, S.E. Prior, S.T. Cole, and T. Garnier. 1988. Copy number and mobilization properties of pUC plasmids. Bethesda Res Lab Focus 10: 56-60. Moreno, S., M. Timón. 2004. DNA vaccination: an immunological perspective. Inmunología 23 (1): 41-55. Mountain, A. 2000. Gene therapy: the first decade. TIBTECH 18: 119-128. O’Kennedy, R.D., C. Baldwin, and E. Keshavarz-Moore. 2000. Effects of Growth Medium Selection on Plasmid DNA Production and Initial Processing Steps. J. Biotechnol. 76: 175–183.10. O’Kennedy, R.D., J.M Ward, and E. Keshavarz-Moore. 2003. Effects of fermentation strategy on the characteristics of plasmid DNA production. Biotechnol. Appl. Biochem. 37: 83–90. Okonkowski, J., L. Kizer-Bentley, K. Listner, D. Robinson, and M. Chartrain. 2005. Development of a Robust, Versatile, and Scalable Inoculum Train for the Production of a DNA Vaccine. Biotechnol. Prog. 21: 1038-1047. Powell, K. 2004. DNA vaccines-back in the saddle again? Nat. Biotechnol. 22: 799-801. Prather-Jones, K. S. Sager, J. Murphy, and M. Chartrain. 2003. Industrial scale production of plasmid DNA for vaccine and gene therapy: plasmid design, production, and purification. Enzyme Microb. Technol. 33: 865–883 Przybylowski, M., S. Bartido, O. Borquez-Ojeda, M. Sadelain, and I. Riviere. 2007. Production of clinical-grade plasmid DNA for human Phase I clinical trials and large animal clinical studies. Vaccine 25: 5013- 5024. Raleigh E.A., G. Wilson. 1986. Escherichia coli K-12 restricts DNA containing 5-methylcytosine. Proc Natl. Acad. Sci. USA 83: 9070-9074. Reinikainen, P., K. Korpela, V. Nissinen, J. Olkku, H. Soderlund,. and P. Markkanen. 1989. Escherichia coli plasmid production in a fermenter. Biotechnol. Bioeng. 33: 386-393. Robinson, H. L., L. A. Hunt, and R. G. Webster. 1993. Protection against a lethal influenza virus challenge by immunization with a haemagglutinin-expressing plasmid DNA. Vaccine 11: 957-960. Rozkov, A, C.A. Avignone-Rossa, P.F. Ertl, P. Jones, R.D. O’Kennedy, J.J. Smith, J.W. Dale and M.E. Bushell. 2006. Fed batch culture with declining specific growth rate for high-yielding production of a plasmid containing a gene therapy sequence in Escherichia coli DH1. Enzyme and Microbial Technology. 39: 47-50.

23
Schmidt, T., K. Friehs, E. Flaschel, and M. Schleef. 2003. Method for the Isolation of ccc Plasmid DNA. US Patent 6,664,078. Seo, J. and J.E. Bailey. 1986. Continuous cultivation of recombinant Escherichia coli: Existence of an optimum dilution rate for maximum plasmid and gene product concentration. Biotechnol. Bioeng. 28: 1590-1594. Shamlou, P.A. 2003. Scaleable processes for the manufacture of therapeutic quantities of plasmid DNA. Biotechnol. Appl. Biochem. 37: 207–218. Sheets, R.L., J. Judith Stein, S. Manetz, C. Duffy, and M, Nason. 2006. Biodistribution of DNA Plasmid Vaccines against HIV-1, Ebola Severe Acute Respiratory Syndrome, or West Nile Virus Is Similar, without Integration, despite Differing Plasmid Backbones or Gene Inserts. Toxicological Sci. 91: 610–619. Shiloach, J., R. Fass. 2005. Growing E. coli to high cell density A historical perspective on method development. Biotech. Adv. 23: 345-357. Studier, F.W. and B.A. Moffatt. 1986. Use of bacteriophage T7 RNA polymerase to direct selective high-level expression of cloned genes. J. Mol. Biol.189: 113–130. Srivastava, I.K. and M.A. Liu. 2003. Gene Vaccines. Annals of Internal Med. 138: 550-559. Taubes, G. 1997. Salvation in a Snippet of DNA? Science 278: 1711-1714. Tuteja, R. 1999. DNA Vaccines: A Ray of Hope. Crit Rev. in Biochem. and Mol. Bio. 34(1): 1-24. Ulmer, J.B. et al. 1997. Induction of immunity by DNA vaccination: application to influenza and tuberculosis. Behring Inst Mitt. 98: 79-86. Ulmer, J.B., J.C. Sadoff, M.A. Liu. 1996. DNA Vaccines. Curr. Opin. Immunol. 8: 531-536. Ulmer, J.B. et al. 1993. Heterologous protection against influenza by injection of DNA encoding a viral protein. Science 259: 1745–1749. Vierra, J. and J. Messing. 1982. The pUC Plasmids, an M13 mp7-derived system for insertion mutagenesis and sequencing with synthetic universal primers. Gene 19: 259−268. Wang, Z., G. Le, Y. Shi, and G. Wegrzyn. 2001. Medium design for plasmid DNA production based on stoichiometric model. Process Biochem. 36: 1085-1093. Wolf, J.A., R.W. Malone, P. Williams, W. Cong, G. Acsadi, A. Jani, and P.L. Felgner. 1990. Direct gene transfer into mouse muscle in vivo. Science 247: 1465-1468.

24
Wong, E.M., M.A. Muesing, and B. Polisky. 1982. Temperature-Sensitive Copy Number Mutants of ColE1 Are Located in an Untranslated Region of the Plasmid Genome. Proc. Natl. Acad. Sci. USA. 79: 3570–3574. Xu, Z., W. Shen, H. Chen, and P. Cen. 2005. Effects of medium composition on the production of plasmid DNA vector potentially for human gene therapy. J Zhejiang Univ SCI. 6B:396-400. Yanisch-Perron, C., J. Vieira, and J. Messing. 1985. Improved M13 phage cloning vectors and host strains: nucleotide sequences of the M13mp18 and pUC19 vectors. Gene 33: 103–119.

25
CHAPTER 2
OPTIMIZATION OF DNA PLASMID PRODUCTION BY USE OF DIFFERENT
ESCHERICHIA COLI HOST STRAINS1
1A. Singer, M.A. Eiteman, and E. Altman. 2007. To be submitted to Biotechnology and Bioengineering.
26
Introduction
The market for gene therapy based medicines is expected to reach 45 U. S. billion dollars
by 2010 (Glaser, 1997). Wolf et al. (1990) demonstrated that exogenous proteins could be
expressed from plasmid DNA injected into the muscle cells of a mouse, and by 2007, 16% of
clinical therapies included the use of “naked” plasmid DNA as the vector
(http://www.wiley.co.uk/genetherapy/clinical). Ulmer et al. (1993) were able to protect mice
from influenza A by injecting them with influenza DNA fragments. Over 100 human DNA
vaccines are currently in clinical trials (Listner et al., 2006), and major human disease targets
HIV, cancer, enteric pathogens, malaria and influenza use plasmid DNA vaccines (Tuteja, 2002;
Gilbert, 2005; Herrman, 2006; Cantanzaro et al., 2007; Laddy et al., 2007; Lowe et al., 2007,
Sheets et al., 2006).
DNA vaccines require milligram dosages to elicit proper immune responses (Donnelly et
al., 2003; Berzofsky et al., 2004; Okonkowski, 2005; Listner et al., 2006), and therefore
production methods must maximize volumetric and specific yields. Production of large
quantities of plasmid DNA depends on many factors including host strain, choice of plasmid,
media components, fermentation type/strategy and downstream processing (Durland and
Eastman, 1998; Carnes, 2005). Many successful methods use Escherichia coli in high-density
culture (Shiloach and Fass, 2005), and previous studies have shown that specific growth rate
affects yield (Seo and Bailey, 1986; Bentley et al., 1990; Chen et al. 1997; Prather et al., 2003).
Fed-batch fermentations routinely achieve cell densities as high as 40 g/L. Rozkov et al. (2006)
observed nearly a 2-fold increase in specific yield in a fed-batch process with a low specific
growth rate (µ = 0.1 h-1), compared to a batch process (µmax=0.48 h-1). Additional strategies such
as temperature shock, chemical treatment, and amino acid starvation also can increase specific
27
yields (Shamlou, 2003). For example, a temperature shift from 37°C to 42°C-45°C resulted in a
70-fold increase in yield (Lahijani et al., 1996), while the use of chloramphenical resulted in a 5-
fold increase in plasmid production (Reinikainen et al., 1989).
Most previous studies have used one of only a very few E. coli strains such as DH5
(Okonkowski et al., 2005; Listner et al., 2006) or DH5α (Schmidt et al., 2003). For industrial
production, a screening procedure that correlates DNA production with fed-batch processes from
small, flask scale would save much effort.
The goal of this study was to compare several E. coli strains for plasmid DNA
production. The strains each were transformed with a high copy plasmid and compared for DNA
production in a defined medium using either glycerol or glucose as the carbon source. Select
strains were then grown at a 7L fermentor under fed-batch conditions.
Materials and Methods
Strains and Plasmids. Strains used in this study are shown in Table 7. Transformed strains were
maintained in chemically defined media (CDM) supplemented with 25% glycerol (v/w) at -70°C.
Plasmids used in this study were pLL14 (Merial Ltd, Lyon France), a derivative of pVR1012
(Hartikka et al., 1996; Vical Inc., San Diego, CA) and pUC19 (Norrander et al., 1983). Both
plasmids are high copy number, and pLL14 contains a ColE1-like origin and a kanamycin
resistance gene while pUC19 contains a ColE1 origin and an ampicillin resistance gene
(Yanisch-Perron et al., 1985). Chemical transformation was used following manufacturers'
directions or using a chemical transformation kit (Qbiogene, Irvine, CA). Transformed strains
on CDM agar plates with 5 g/L glycerol and 100 μg/mL kanamycin or ampicillin were incubated
at 37°C for 24 h prior to commencing overnight cultures.
28
Clonal Selection. After transformation on LB plates containing an antibiotic, five single colonies
of each strain were adapted to CDM plates with two passes. Each clone was grown in three mL
for 10-12 h at 37°C and 200 rpm. After harvest, DNA was quantified, and the clones with the
highest production and best growth characteristics were chosen. Working seed batches were
produced and frozen at -70°C with 15% (v/v) glycerol.
Table 7. Strains used in this study.
Strain Genotype Source BL21 B F- dcm ompT hsdS (rB
–, mB–) gal Stratagene
DH1 F- λ- supE44 hsdR17 recA1 gyrA96 relA1 endA1 thi-1 ATCC 33849
DH5α F- Φ80lacZΔM15 Δ(lacZYA-argF)U169 recA1 endA1 hsdR17(rk
-, mk+) phoA supE44 λ- thi-1 gyrA96 relA1
Invitrogen
JM105 F- Δ(lac proAB) lacIq thi repsL endAl slcB15 hadR4 traD36 proAB Δ(ZM15)
Pharmacia
JM109 e14-(McrA-) recA1 endA1 gyrA96 thi-1 hsdR17(rK-
mK+) supE44 relA1 Δ(lac-proAB) [F’ traD36 proAB
lacIqZΔM15]
Promega
Mach 1 F- Φ80(lacZ) ΔM15 ΔlacX74 hsdR(rK- mK
+) ΔrecA1398 endA1 tonA
Invitrogen
MG1655 F- λ- ilvG rfb-50 rph-1 ATCC 700926 MC1061 F- ∆lacX74 rpsL araD139 ∆(ara leu)7697 galU galK
hsdR mcrB thi Laboratory Collection
MC4100 F- araD139 ∆(argF-lac)U169 rpsL150 relA1 deoC1 rbsR fthD5301 fruA25 λ -
ATCC 35695
NM554 MC1061 recA13 Laboratory Collection
SCS1-L recA1 endA1 gyrA96 thi-1 hsdR17(rK- mK
+) supE44 relA1
Merial LTD, Lyon France
SCS1-S recA1 endA1 gyrA96 thi-1 hsdR17(rK- mK
+) supE44 relA1
Stratagene
SE5000 MC4100 recA1 Laboratory Collection

29
Growth Conditions. Chemically defined medium (CDM) contained (per L): 6.0 g citric acid,
20.0 mg MnSO4·H2O, 8.0 mg CoCl2·6H2O, 4.0 mg ZnSO4·7H2O, 3.6 mg AlCl3·6H2O, 3.97 mg
Na2MoO4·4H2O, 3.2 mg CuSO4·5H2O, 1.0 mg H3BO3, 800 mg MgSO4·7H2O, 52.8 mg
CaCl2·2H2O, 74.0 mg FeSO4·7H2O, 8.0 g KH2PO4, 2.4 g Na2HPO4·2H2O, 750.0 mg (NH4)2SO4,
8.0 g (NH4)2HPO4, 130.0 mg NH4Cl, and 10 mg thiamine·HCl. For MC1061 and NM554, the
medium also contained 20.0 mg/L leucine. Luria-Bertani (LB) medium contained (per L): 10.0 g
bacto-tryptone, 5.0 g yeast extract, and 10.0 g NaCl. The pH was adjusted to 6.8 using 28%
NH4OH, and sterilized for 30 min at 121°C. Kanamycin (Km) or ampicillin (Am) was added at
100 mg/L after sterilization.
Flask cultures were grown at 37°C and 200 rpm in 250 mL baffled flasks containing 30
mL CDM with 5 g/L glycerol or glucose. Cultures were grown to an OD of 1.
Fed-batch fermentations were carried out in a 7 L bioreactor (Applikon Biotechnology,
Foster City, CA) with a 3.5 L starting volume. Control was provided by BioexpertXP software,
ADI 1030 Bio-controller and an ADI 1035 Bio-console (Applikon). CDM initially contained 5
g/L glucose, 2 mL of antifoam (Antifoam 1500, Dow Corning, Midland, MI), and 100 mg/L Km.
Vessels were inoculated with 35 mL of a shake flask culture (5 g/L glycerol and 100 mg/L Km)
grown to an OD of 1. Fermentations were carried out at 37°C, a pH of 6.8 (controlled with 15%
NH4OH) and an agitation of 1000 rpm. Dissolved O2 (DO) was maintained above 20% with
aeration at 2.45 L/min (O2 and air mixed as necessary). Aeration commenced when the DO
initially reached 30%. Fed-batch mode was initiated when the initial glucose was exhausted, as
indicated by the increase in DO. The feed solution contained 60% glucose (w/v), MgSO4·7H2O
(8.5 g/L) and 1 mL/L antifoam. Feed rates were controlled at exponentially increasing flow rates
using a mini-pulse pump (Gilson, Inc, Middleton, WI) and the following control algorithms
30
adapted from Jones and Anthony (1977) to maintain a constant specific growth rate at either 0.14
h-1 or 0.28 h-1:
⎟⎠⎞
⎜⎝⎛
⋅⋅⎟⎟⎠
⎞⎜⎜⎝
⎛⎟⎠⎞
⎜⎝⎛⋅⎟
⎠⎞
⎜⎝⎛ ⋅
=60T
480003600
ts
sVFi
00 μμ e
0.00560s
48FF i0
i ⋅⎟⎠⎞
⎜⎝⎛⋅⎟
⎠⎞
⎜⎝⎛=
Here Fi was the feed flow rate (mL/s), F0 was the pump head speed (rpm), si was the feed
substrate concentration (g/L), s0 was the initial substrate concentration (g/L), µ was the desired
specific growth rate (h-1), T was the maximum feed rate of pump (mL/min), t was the process
time (min). When the OD reached 60-70, the temperature was raised to 42°C and the feeding
rate was reduced by 10% for 4 h ("heat treatment").
Sampling and Analysis. Cell growth was measured as optical density (OD) at 562 nm
(Pharmacia LKB Ultraspec III, St. Albans, UK). This measurement was correlated to dry cell
weight (DCW). For DCW measurement, 20 mL of cell culture was centrifuged (10 min at 3000
× g), the supernatant decanted, the pellet washed with DI water and the tube centrifuged twice
again. The pellet was resuspended in DI water and poured into a weighing boat and dried at
60°C for 24 h. DNA samples were obtained from column purifications (Qiagen, Miniprep) for 3
mL of sample having an OD of 1, to ensure the binding capacity of the column was not
exceeded. The absorbance was measured at 260, 280 and 320 nm and the DNA concentration
was calculated via the spectrophotometer software. Samples that fell in the linear range (0.1≤
A260 ≤ 1.0) were accepted. Purity was determined by a 260:280 of 1.8 to 2.0. Acetate was
measured by liquid chromatography using a refractive index detector as previously described
(Eiteman and Chastain, 1997).

31
Results
DNA Yield Comparison in Shake Flask Cultures. Thirteen strains of E. coli were first compared
for their production of plasmid DNA in a defined medium in shake flasks. Two different
plasmids were compared: pL114 and pUC19. The differences between these plasmids were the
selectable markers (kanamycin for pLL14 and ampicillin for pUC19) and the ability to induce
plasmid production by increasing incubation temperatures in pLL14. Furthermore, pLL14
contains a single G A mutation that can increase copy number up to 70-fold (Lahijani et al.,
1996). Two different carbon sources were compared: glycerol and glucose. Table 8 shows the
results for pL114 with each carbon source, while Table 9 shows analogous results for pUC19.
Since these shake flasks were conducted in a batch mode, the strains each grew at their
maximum growth rate during the experiment.
Figures 3 and 4 show the distribution of growth rates and DNA yields for pLL14 and
pUC19, respectively. Any given strain achieved a higher DNA yield with the pLL14 plasmid
compared to the pUC19 plasmid. We observed a slight negative relationship between DNA
yield and growth rate. That is, lower specific growth rate favored greater DNA yield,
particularly for plasmid pUC19. Moreover, for each plasmid the use of glucose as a carbon
source generally resulted in higher growth rate and lower DNA yield than the use of glucose.
However, exceptions to these general observations were found for both plasmids.
In order to compare the two carbon sources, for each strain/plasmid we calculated the
growth ratio: the maximum specific growth rate (μMAX) observed with glycerol divided by the
μMAX observed with glucose. Similarly, the yield ratio was calculated as the DNA yield
observed when glycerol was the carbon source divided by the DNA yield observed with glucose.
Generally, strains had a higher value of μMAX with glucose than during growth in glycerol

32
(growth ratio < 1) and a greater DNA yield when glycerol was the sole carbon source compared
to glucose (yield ratio > 1). Figure 5 shows all the yield ratios for both strains as functions of the
respective growth ratios. Regardless of plasmid, most tested strains had a growth ratio of less
than 0.8 and although some strains with low growth ratio showed also a low yield ratio, the
highest yield ratios were found at growth ratios between 0.5 and 0.8. Strains with the greatest
differences in maximum growth rate for each substrate generally had a greater difference in yield
for each substrate.
Of the strains studied, only SCS1-S attained a higher specific growth rate using glycerol
than using glucose (for both plasmids). Interestingly, this strain showed very low DNA yield
ratio, with the DNA yield observed when the strain grew on glucose being approximately equal
to the DNA yield using glycerol. So, this strain behaved differently from all the other strains.
For both growth and yield, the results with glucose and glycerol were very similar. Considering
the plasmid pLL114, volumetric yields using glycerol ranged from 1 mg/L (MG1655) to 3 mg/L
(SCS1-S and SCS1-L), while using glucose yields ranged from 0.5 mg/L (MG1655) to 3 mg/L
(SCS1-S). BL21 (2.61 mg/L), SE5000 (2.61 mg/L) and NM554 (2.62 mg/L) were other strains
which generated high DNA yields using glycerol as the carbon source. The two strains which
consistently generated the lowest DNA (regardless of plasmid or carbon source) were MC4100
and MG1655. Generally, acetate formation from glucose correlated with high growth rate.
Although no strain generated both a high acetate concentration and a high DNA yield, there was
no correlation between DNA yield and acetate formation for either plasmid (Figure 6).

33
Table 8. DNA yield, maximum specific growth rate and acetate concentration for strains containing plasmid pLL14. Strains were grown in defined medium in shake flasks to an OD of 1. Standard deviation of yield measurements is shown in parentheses.
DNA Yield Maximum Specific Growth Rate Acetate (h-1) (mg/L)
(mg/L) Strain
Glycerol Glucose Ratio Glycerol Glucose Ratio Glycerol Glucose BL21 2.61 (0.02) 2.34 (0.08) 1.11 0.45 0.77 0.59 0 0 DH1 1.76 (0.02) 1.09(0.05) 1.63 0.61 0.90 0.68 0 60
DH5α 2.06 (0.16) 1.42 (0.03) 1.45 0.58 0.99 0.58 0 180 JM105 1.42 (0.09) 0.70 (0.08) 2.02 0.44 0.64 0.68 0 190 JM109 1.97 (0.18) 1.94 (0.06) 1.02 0.51 0.70 0.73 0 190 Mach 1 2.37 (0.16) 1.40 (0.03) 1.69 0.63 0.84 0.75 0 60
MC1061 1.78 (0.07) 1.62 (0.11) 1.10 0.32 0.35 0.91 0 80 MC4100 1.27 (0.05) 0.85 (0.06) 1.50 0.79 0.92 0.86 80 360 MG1655 1.02 (0.07) 0.50 (0.04) 2.03 0.49 0.80 0.61 0 80 NM554 2.62 (0.10) 1.81 (0.04) 1.44 0.39 0.56 0.70 0 210 SCS1-L 3.00 (0.12) 2.06 (0.13) 1.46 0.45 0.90 0.50 0 180 SCS1-S 3.04 (0.09) 3.03 (0.18) 1.00 0.42 0.38 1.11 0 80 SE5000 2.61 (0.20) 1.56 (0.08) 1.67 0.57 1.00 0.57 0 200

34
Table 9. DNA yield, maximum specific growth rate and acetate concentration for strains containing plasmid pUC19. Strains were grown in defined medium in shake flasks to an OD of 1. Standard deviation of yield measurements is shown in parentheses.
DNA Yield (mg/L)
Maximum Specific Growth Rate (h-1)
Acetate (mg/L) Strain
Glycerol Glucose Ratio Glycerol Glucose Ratio Glycerol Glucose BL21 0.84 (0.03) 0.78(0.05) 1.07 0.45 0.52 0.87 0 0 DH1 1.22 (0.05) 0.55 (0.06) 2.23 0.47 0.79 0.59 0 60
DH5α 1.30 (0.06) 1.06 (0.09) 1.23 0.46 0.70 0.66 0 0 JM105 1.26 (0.24) 0.91 (0.00) 1.38 0.59 0.82 0.72 0 210 JM109 1.49 (0.06) 0.81 (0.04) 1.84 0.56 0.86 0.65 0 300
MC1061 1.43 (0.09) 0.81 (0.05) 1.75 0.39 0.46 0.85 10 80 MC4100 0.56 (0.05) 0.40 (0.06) 1.40 0.74 1.10 0.67 0 220 MG1655 0.72 (0.03) 0.43 (0.02) 1.68 0.58 0.87 0.67 0 200 NM554 1.61 (0.07) 0.86 (0.10) 1.87 0.33 0.47 0.70 0 80 SCS1-S 1.19 (0.05) 1.35 (0.05) 0.88 0.41 0.40 1.03 0 40 SCS1-L 1.41(0.03) 0.86 (0.08) 1.64 0.34 0.62 0.55 0 0
35
Maximum Growth Rate (h-1)
0.2 0.4 0.6 0.8 1.0 1.2
DN
A Y
ield
(mg/
L)
0.0
0.5
1.0
1.5
2.0
2.5
3.0
3.5
GlycerolGlucose
Figure 3. Growth rates and volumetric DNA yields for various E. coli strains (listed in Table 8) containing pLL14 strains grown in defined medium containing either glycerol (●) or glucose (○).
Strains were grown in shake flask to an OD of 1.

36
Maximum Growth Rate (h-1)
0.2 0.4 0.6 0.8 1.0 1.2
DN
A Y
ield
(mg/
L)
0.2
0.4
0.6
0.8
1.0
1.2
1.4
1.6
1.8GlycerolGlucose
Figure 4. Growth rates and volumetric DNA yields for various E. coli strains (listed in Table 9)
containing pUC19 strains grown in defined medium containing either glycerol (●) or glucose (○). Strains were grown in shake flask to an OD of 1.

37
Growth Ratio (Gly/Glu)
0.4 0.5 0.6 0.7 0.8 0.9 1.0 1.1 1.2
Yie
ld R
atio
(Gly
/Glu
)
0.8
1.0
1.2
1.4
1.6
1.8
2.0
2.2
2.4
pLL14pUC19
Figure 5. Comparison of DNA yield ratio and specific growth ratio for strains containing either pLL14 (●) or pUC plasmids (○). Strains were grown in defined medium in shake flask to an OD
of 1.

38
Acetate (mg/L)
0 100 200 300 400
DN
A Y
ield
(mg/
L)
0.0
0.5
1.0
1.5
2.0
2.5
3.0
3.5
pLL14 pUC19
Figure 6. Acetate concentrations and volumetric DNA yields for various E. coli strains containing either pLL14 (●) or pUC plasmids (○). Strains were grown in defined medium in
shake flask to an OD of 1.

39
Two sets of isogenic pairs were examined. These pairs include MC4100-SE5000 and
MC1061-NM554. Both SE5000 and NM554 are recA mutants of their respective pair. In each
of the eight cases (two plasmids, two carbon sources, two isogenic pairs), the recA mutants
yielded more DNA than the control strain (i.e., with the recA+ gene). The difference between the
pairs was greatest for shake flasks in which glycerol was the carbon source, and for the pLL14
plasmid. The greatest increase (106%) resulting from the recA mutation was observed for the
MC4100-SE5000 pair with glycerol and the pLL114 plasmid.
Fed-batch fermentations. Three strains of E. coli were compared for their production of
plasmid DNA in a defined medium in a fed-batch fermentation. Three strains were chosen for
the fed-batch process operated at a specific growth rate of 0.14 h-1 (SCS1-L, BL21 and
MC4100), while two strains were examined at a higher specific growth rate of 0.28 h-1 (SCS1-L
and MC4100). Each fermentation was conducted using a glucose-limited feed and the strains
contained the pLL114 plasmid. Biomass, volumetric and specific DNA yields, and acetate were
measured during the course of each fermentation. Table 10 shows the maximum yields for each
fermentation prior to and post heat treatment.
Figures 7, 8 and 9 show the biomass, volumetric yield and specific yield for example
fermentations of each strain at the specific growth rate of 0.14 h-1, while Figures 10 and 11 show
these results for two example fermentations at a specific growth rate of 0.28 h-1..
OD and DNA Yield. At the lower growth rate, OD and volumetric yield increased over
time for each strain. SCS1-L produced the greatest volumetric yield (after heat treatment) of 603
mg/L and 7.35 mg/L/OD. BL21 showed the second highest volumetric yield of 519 mg/L and
6.23 mg/L/OD while MC4100 had the poorest volumetric yield of 222 mg/L and 2.78 mg/L/OD.
For SCS1-L, the specific yield increased slowly over time to a maximum value of 18.85 mg/g.
40
For BL21 the specific yields decreased slightly until the heat treatment for a maximum of 15.58
mg/g. MC4100 had relatively constant specific yields even after the heat treatment for a
maximum of 7.30 mg/g. Overall SCS1-L produced the highest levels of DNA while MC4100
generated the least quantities For high growth rates, SCS1-L ended the fermentation with a
volumetric yield of 611 mg/L and 6.71 mg/L/OD, while MC4100 had a volumetric yield of 353
mg/L and 3.50 mg/L/OD. Specific yields stayed relatively the same until after the heat treatment
for SCS1-L for a maximum value of 17.21 mg/g. MC4100 had a gradual increase in specific
yield throughout the fermentation to a maximum value of 9.19 mg/g.
As noted in the Materials and Methods section, the temperature was raised to 42ºC for 4
hours immediately after biomass had reached an OD of about 60-70, because such a treatment
for the pLL14 plasmid can increase yields (Wong et al., 1982; Lahijani et al., 1996). We
calculated whether the heat treatment did indeed improve DNA yield (Table 11). Generally, the
heat treatment improved the specific DNA yield. An exception to this rule was MC4100 at low
growth rate, in which the heat treatment reduced the DNA yield by 17%. The improvement in
DNA yield due to heat treatment was greater for fed-batch processes operating at the higher
growth rate.
Two of the strains (SCS1-L and MC4100) we compared for DNA production at two
different specific growth rates, 0.14 h-1 and 0.28 h-1. Prior to heat treatment, the DNA yield was
lower at higher growth rates for both strains (Table 12). For example, the specific DNA yield for
SCS1-L was 28% less at a growth rate of 0.28 h-1 compared to a growth rate of 0.14 h-1. Because
heat treatment resulted in a more significant improvement in DNA yield at higher growth rate as
described above, the DNA yield was similar or greater for the two growth rates after heat
treatment. Specifically, for SCS1-L the specific DNA yield was only 7% lower at the higher

41
growth rate compared to the lower growth rate, while for MC4100 the specific DNA yield
increased by 35% with an increase in growth rate. A higher growth rate permitted the cells to
reach the same OD in less time. Thus, the rate of DNA production as reflected by the volumetric
productivity was quite different because of an increase in specific growth rate (Figure 12). For
SCS1-L, the volumetric DNA productivity was 48% greater when the fed-batch process was
conducted at a growth rate of 0.28 h-1 compared to a growth rate of 0.14 h-1. For MC4100, the
volumetric DNA productivity was 137% greater when the fed-batch process was conducted at
the higher growth rate.
No correlation between acetate formation and DNA yield was observed (Table 10).
SCS1-L at both growth rates resulted in very low acetate accumulation. Although BL21 and
MC4100 showed similar acetate concentrations at low growth rates (100 mg/L versus 125 mg/L
after heat treatment), these two strains generated quite different amounts of DNA. We also did
not observe a correlation between growth rate and acetate formation for MC4100 and SCS1-L.
Discussion
Much of the recent work on DNA plasmid production has focused on improved large-
scale processes to maximize yield, and some successful approaches are summarized in Table 13.
Generally, it is only feasible to examine very few variables for DNA production. Most
production schemes limit testing, for example, to media components (O’Kennedy et al., 2000;
Xu et al., 2005) or slight changes in growth rate (Chen et al., 1997, Rozkov et al., 2006).
Exhaustive studies on variables such as strain, growth rate, and medium components effects on
replication of plasmids containing ColE1-like origins of replication have not been published
(Wang et al., 2004).

42
Table 10. Maximum DNA yields during fed-batch fermentations at µ= 0.14 h-1 and µ = 0.28 h-1. Standard deviation for triplicate samples are in parentheses.
Maximum DNA Yield
(pre-heat)
Maximum DNA Yield
(post-heat)
Run Strain µ
(h-1) Volumetric (mg/L)
mg/L/OD
Specific (mg/g)
OD
Acetate(mg/L) Volumetric
(mg/L) mg/L/ OD
Specific (mg/g)
OD
Acetate(mg/L)
1 SCS1-L 0.14 439
(22) 6.27 16.10
(0.81) 70 30 603
(7) 7.35 18.85
(0.22) 82 0
2 SCS1-L 0.14 442 (18)
6.23 15.98 (0.66)
71 0 601 (5)
6.99 17.92 (0.15)
86 10
3 SCS1-L 0.28 249 (11)
4.08 10.48 (0.47)
61 0 611 (14)
6.71 17.21 (0.38)
91 0
4 SCS1-L 0.28 297 (40)
4.87 12.56 (1.67)
61 0 602 (21)
6.69 17.13 (0.60)
90 0
1 BL21 0.14 267 (19)
4.94 12.37 (12)
54 20 442 (6)
6.23 15.58 (0.21)
71 100
2 BL21 0.14 283 (26)
4.29 11.00 (1.00)
66 80 519 (16)
5.90 15.12 (0.48)
88 100
1 MC4100 0.14 189 (3)
2.91 7.55 (0.13)
65 10 191 (6)
2.33 6.13 (0.19)
82 150
2 MC4100 0.14 213 (18)
3.28 8.60 (0.71)
65 10 222 (11)
2.78 7.30 (0.36)
80 100
3 MC4100 0.28 186 (9)
2.78 7.29 (0.34)
67 0 353 (8)
3.50 9.19 (0.21)
101 20
4 MC4100 0.28 112 (5)
2.11 5.58 (0.25)
53 0 292 (18)
3.40 8.94 (0.54)
86 20

43
Time (h)
0 10 20 30 40
OD
0
20
40
60
80
100
Vol
umet
ric D
NA
Yie
ld (m
g/L)
0
100
200
300
400
500
600
700
Spec
ific
DN
A Y
ield
(mg/
g)
0
5
10
15
20
ODVolumetricSpecific
Figure 7. Production of DNA in SCS1-L during a glucose-limited fed-batch process with µ=0.14 h-1: Volumetric DNA yield (▲), specific DNA yield (■), and OD ( ). Heat treatment
effects are shown to the right of the dashed line.

44
Time (h)
5 10 15 20 25 30 35 40
OD
0
20
40
60
80
100
Vol
umet
ric D
NA
Yie
ld (m
g/L)
0
100
200
300
400
500
600Sp
ecifi
c D
NA
Yie
ld (m
g/g)
0
2
4
6
8
10
12
14
16
ODVolumetricSpecific
Figure 8. Production of DNA in BL21 during a glucose-limited fed-batch process with µ=0.14 h-1: Volumetric DNA yield (▲), specific DNA yield (■), and OD ( ). Heat treatment effects
are shown to the right of the dashed line.

45
Time (h)
5 10 15 20 25 30 35 40
OD
0
20
40
60
80
100
Vol
umet
ric D
NA
Yie
ld (m
g/L)
0
50
100
150
200
250Sp
ecifc
DN
A Y
ield
(mg/
g)
0
2
4
6
8
10
ODVolumetricSpecific
Figure 9. Production of DNA in MC4100 during a glucose-limited fed-batch process with µ=0.14 h-1: Volumetric DNA yield (▲), specific DNA yield (■), and OD ( ). Heat treatment
effects are shown to the right of the dashed line.

46
Time (h)
10 12 14 16 18 20 22 24 26
OD
0
20
40
60
80
100
Vol
umet
ric D
NA
Yie
ld (m
g/L)
0
100
200
300
400
500
600
700
Spec
ific
DN
A Y
ield
(mg/
g)
6
8
10
12
14
16
18
ODVolumetricSpecific
Figure 10. Production of DNA in SCS1-L during a glucose-limited fed-batch process with µ=0.28 h-1: Volumetric DNA yield (▲), specific DNA yield (■), and OD ( ). Heat treatment
effects are shown to the right of the dashed line.

47
Time (h)
8 10 12 14 16 18 20 22 24
OD
0
20
40
60
80
100
120
Vol
umet
ric D
NA
Yie
ld (m
g/L)
0
100
200
300
400Sp
ecifi
c D
NA
Yie
ld (m
g/g)
0
2
4
6
8
10
ODVolumetricSpecific
Figure 11. Production of DNA in MC4100 during a glucose-limited fed-batch process with µ=0.28 h-1: Volumetric DNA yield (▲), specific DNA yield (■), and OD ( ). Heat treatment
effects are shown to the right of the dashed line.

48
Table 11. The effect of heat treatments on DNA yields during a fed-batch process.
Strain µ (h-1)
Improvement in Specific DNA
Yield (%)
SCS1-L 0.14 14.6% SCS1-L 0.28 50.3% BL21 0.14 31.7%
MC4100 0.14 -17.0% MC4100 0.28 43.1%
Table 12. Affect of growth rate on specific DNA yield and volumetric productivity.
Strain µ (h-1)
Average specific
DNA yield (before
heat treatment)
(mg/g)
Average specific DNA
yield (after heat treatment)
(mg/g)
DNA productivity (after heat treatment)
(mg/Lh)
SCS1-L 0.14 16.04 18.39 16.39 0.28 11.52 17.17 24.26
MC4100 0.14 8.08 6.72 5.98 0.28 6.44 9.07 14.16

49
The high cost (manpower, materials, time) associated with commercial-scale process studies
encourages the development of a small-scale screening protocol for candidate strains and
fermentation conditions, a process similar to the High Throughput Screening used in the
pharmaceutical industry.
Shake Flask Screening. One goal of this work was to determine if screening strains at a shake
flask scale could correlate to production at a larger fermentation scale. Shake flask experiments
indicated that BL21, SCS1-S, and SCS1-L generated the greatest DNA from glucose, while
MC4100, JM105, and MG1655 generated the least. Results with the three strains BL21, SCS1-
L, and MC4100 in 7 L fermentation studies were consistent with the shake flask results.
Although not an exhaustive investigation, the results of the screen conducted at each strain's
maximum specific growth rate did correlate with the larger scale studies at controlled growth
rates. In addition, the DNA production significantly improved when the process was conducted
in a controlled fermentor compared to a shake flask. For example, the DNA yield for SCS1-L
during shake flask growth was 2.1 g/L/OD, while for the fed-batch process this yield was around
7 mg/L/OD at lower growth rates after heat treatment.
Growth Rate. Our low specific growth rate fermentations (µ = 0.14 h-1) were based on the work
of previous studies such as Chen (1997) and more recently Rozkov (2006). The results with
specific yield and volumetric yield at this growth rate were in line with results obtained in other
studies (Table 13), with the specific DNA yield obtained with SCS1-L (18 mg/g) similar to the
highest reported values. We also wanted to determine if a higher specific growth rate would
impact DNA generation. For this study, we selected one "good" producer (SCS1-L) and one
"poor" producer (MC4100).

50
Table 13. DNA yields obtained in published fermentation studies.
Strain Volumetric DNA Yield
(mg/L)
DCW (g/L)
Specific DNA Yield
(mg/g)
Method
Miscellaneous
Reference
DH5 220 ~ 45 ~ 4.8 Fed-batch 37°C to 42-45°C temperature shift
Lahijani et al., 1996
DH5α 230 60 3.83 Fed-batch with DO-stat feeding
glycerol and yeast extract μ = 0.15 h-1
Schmidt et al., 2003
NR 130-250 70-90 1.8-2.78 Batch Proprietary medium
Durland and Eastman, 1998
NR 260-430 55-65 6.61
Fed-batch Proprietary medium High specific yields
Carnes and Williams, 2004
NR 670-1100 ~ 45 ~ 14.8-24.4 Fed-batch 37°C to 42°C temperature shift
Carnes and Williams, 2004
DH5 634-846
NR 28-34 Fed-batch Variable process steps Okonkowski et al., 2005
DH1 296 NR 10 Fed–batch μ = 0.10 h-1
Rozkov et al., 2006
DH5 1200 NR 25-32 Fed-batch Large scale (2000L)
Listner et al., 2006
DH5α 1500 ~ 33.5 ~ 45 Fed-batch 37°C to 42°C temperature shift μ = 0.12 h-1
Carnes et al., 2006

51
Using the otherwise same fed-batch process, each was grown at µ = 0.28 h-1. The DNA yields
attained prior to the heat treatment were lower at the higher growth rate as expected,
approximately 28% lower for SCS1-L and 20% for MC4100. The effect of specific growth rate
on plasmid production has been discussed previously. Plasmids containing ColE1-like origins of
replication require only proteins from the host strain to replicate (Donoghue and Sharp, 1978). A
decrease in cellular activities like those related to growth can account for the up shift in plasmid
DNA replication. It is widely accepted in literature that copy numbers of ColE1 type plasmids
are inversely proportional to specific growth rate (Seo and Bailey, 1985, 1986; Lin-Chao and
Bremer, 1986; Reinikainen et al., 1989; Reinikainen and Virkajärvi, 1989; Prather et al., 2006).
Heat Treatment.
According to previous studies (Wong et al., 1982; Lahijani et al., 1996), a heat treatment
can increase both volumetric and specific yields. The single point mutation on the pLL14 affects
the negative regulation of replication from our plasmid, especially at high temperatures. In this
case the mutation maps upstream of the RNAI promoter. RNAI inhibition alters the initiation of
RNA transcription (Fitzwater et al., 1988; Wang et al., 2004). Two proteins rom/rop that
regulate priming and copy number by interacting with RNAI have also been implicated (Tamm
and Polisky, 1985; Wang et al., 2004). Hecker et al. (1985) and Reinikainen et al. (1989) found
that plasmid yields were highest after the culture had entered the stationary phase. Heat
treatment may mimic the metabolic requirements of a stationary phase due to the drop in growth
rate.
At the growth rate of 0.14 h-1, a 15% increase in the specific DNA yield was observed for
SCS1-L after heat treatment. Surprisingly the specific DNA yield for MC4100 decreased by
approximately 17% after heat treatment. For MC4100 this means that biomass increased from

52
an OD 65 to 81 with no significant improvement in plasmid production. During the 4 hour
period of heat treatment, the specific growth rates for both strains were about 0.075 h-1 (down
from 0.14 h-1). At the higher growth rate of 0.28 h-1, specific yields increased over 40% due to
heat treatments for both strains. During the four-hour heat treatment, the specific growth rate
was about 0.13 h-1, approximately a 50% decrease (on average for both strains). In studying the
affect of growth rate on DNA production, Chen et al. (1997) and Seo and Bailey (1986) observed
optimum growth rates of 0.13 h-1 and 0.20 h-1, respectively, for their plasmid host combinations.
At lower specific growth rates, there is less competition for carbon and nutrients and sufficient
time for plasmid production (Chen et al., 1997 and Reinikainen et al., 1989). Additionally, lower
specific growth rates allow a coupling of plasmid replication rates with host cell division
resulting in improved plasmid segregation (Zabriskie and Arcuri, 1986).
For MC4100, when we compare fermentation 1 (µ=0.14 h-1) with fermentation 3 (µ=0.28
h-1) we see almost no difference in pre-heat volumetric or specific yields. Additionally, given
the dramatic improvement in yield after heat treatment at a specific growth rate of µ=0.28 h-1 we
can only hypothesize that we may have dropped below the optimal growth rate for plasmid DNA
production. Of the published papers concerning DNA yields, the lowest published growth rate
for a successful fermentation was µ=0.10 h-1 (Rozkov et al., 2006).
SCS1-L acted as expected at both growth rates, higher yields at lower specific growth
rates prior to heat treatment. However, heat treatments caused a specific yield increase of 14.6%
for µ=0.14 h-1 as compared to 50.3% for µ=0.28 h-1. There are two hypothetical explanations for
these dramatic differences in production. First, as with MC4100 we may have dropped below
the optimal growth rate for plasmid DNA production. Second, we may be approaching the
maximum possible yields for our process.

53
For our process, it stands to reason that approximately 600 g/L and 18 mg/g is approaching this
limit. A process involving a fast initial growth rate followed by a slow growth stage and/or heat
treatment would improve productivity and still produce maximum yields (Chen, 1999 and
Schmidt et al., 2003).
Other comments
Although NM554 and SE5000 both showed relatively high yields in shake flasks, particularly
using glycerol as a carbon source, these strains grew with difficulty in CDM and were not
considered for fed-batch fermentation.
Overall productivity increased at higher specific growth rates as shown in the results
section (48% for SCS1-L and 137% for MC4100). However, prior to heat treatment these
numbers tell a much different story. Compared to experiments at the lower growth rates before
heat treatment, SCS1-L showed a decrease in productivity of 4% and MC4100 had only a slight
increase of 17%. Thus, the improved production of plasmid DNA at the higher growth rate was
a direct result of the large benefit of heat treatment at higher growth rates.
Using our screening process, we were able to identify both “good” and “poor” candidates
for plasmid DNA production. Starting with 5 clones of 13 different strains, we first selected the
best clone of each strain and then rated all the strains using shake flasks. The three strains
selected for further study using a fed-batch process indicated a direct relationship between the
screening in shake flasks and the larger scale process.

54
REFERENCES Bentley, W.E., N. Mirjalili, D.C. Andersen, R.H. Davis, and D.S. Kompala. 1990. Plasmid-encoded protein: the principal factor in the metabolic burden associated with recombinant bacteria. Biotechnology and Bioengineering 35: 668-681. Berzofsky, J.A., T. Masaki, O. SangKon, I.M. Belyakov, J. D. Ahlers, J.E. Janik, and J.C. Morris. 2004. Progress on new vaccine strategies for the immunotherapy and prevention of cancer . J. Clin. Invest. 113: 1515-1525. Carnes, A.E. 2005. Fermentation design for the manufacture of therapeutic plasmid DNA. BioProcess Int. Oct: 36-44. Carnes, A.E., C.P. Hodgson and J.A. Williams. 2006. Inducible Escherichia coli fermentation for increased plasmid DNA production. Biotechnol. Appl. Biochem. 45:155-166 Catanzaro, A.T., M. Roederer, R.A. Koup, R.T. Bailer, M.E. Enama, M.C. Nason, J.E. Martin, S. Rucker, C.A. Andrews, P.L. Gomez, J.R. Mascola, G.J. Nabel, and B.S. Graham. 2007. Phase I clinical evaluation of a six-plasmid multiclade HIV-1 DNA candidate vaccine. Vaccine. 25: 4085-4092. Chen, W.C. 1999. Automated high-yield fermentation of plasmid DNA in Escherichia coli. US Patent 5,995,323. Chen, W. C. Graham, and R.B. Ciccarelli. 1997. Automated fed-batch fermentation with feed-back controls based on dissolved oxygen (DO) and pH for production of DNA vaccines. Journal of Industrial Microbiology & Biotechnology 18: 43–48. Donoghue, D.J., and P.A. Sharp. 1978. Replication of colicine E1 plasmid DNA in vivo requires no plasmid-encoded proteins. J. Bacteriol. 133, 1287–1294. Donnelly, J., K. Berry, and J. Ulmer. 2003. Technical and regualatory hurdles for DNA vaccines. Int. J. Parasitol. 33: 457-467. Durland, R.H., E. M. Eastman. 1998. Manufacturing and quality control of plasmid-based gene expression systems. Advanced Drug Delivery Review. 30: 33-48. Fitzwater, T., X. Zhang, R. Elblel and B. Polisky. 1988. Conditional high copy number ColE 1 mutants: resistance to RNA1 inhibition in vivo and in vitro. The EMBO Journal. 7: 3289-3297. Gilbert, S.C., V.S. Moorthy, L. Andrews, A.A. Pathan, S.J. McConkey, J.M. Vuola, S.M. Keating, T. Berthoud, D. Webster, H. McShane, and A.V. Hill. 2006. Synergistic DNA-MVA prime-boost vaccination regimes for malaria and tuberculosis. Vaccine. 24: 4554-4561. Glaser, V. 1997. Promise of gene therapy for treating disease remains on trial in the clinic. Genet. Eng. News 14: 33-34.

55
Hartikka, J., M. Sawdey, F. Cornefert-Jensen, M. Margalith, K. Barnhart, M. Nolasco, H.L. Vahlsing, J. Meek, M. Marquet, P. Hobart, J. Norman, M. Manthorpe. 1996. An improved plasmid DNA expression vector for direct injection into skeletal muscle. Hum Gene Ther. 7: 1205-17. Hecker, M., A. Schroeter, and F. Mach. 1985. Escherichia coli relA strains as hosts for amplification of pBR322 plasmid DNA. FEMS Microbiol. Lett. 29: 331-334. Herrmann, J.E. 2006. DNA vaccines against enteric infections. Vaccine. 24: 3705-3708. Jones, R.C. and R.M. Anthony. 1977. The relationship between nutrient feed rate and specific growth rate in fed batch cultures. Applied Microbiology and Biotechnology. 4: 87-92. Laddy, D.J., J. Yan, N. Corbitt, D. Kobasa, G.P. Kobinger, and D.B. Weiner. 2006. Immunogenicity of novel consensus-based DNA vaccines against avian influenza. Vaccine. 25: 2984-2989. Lahijani, R., G. Hulley, G. Soriano, N.A. Horn, and M. Marquet. 1996. High-yield production of pBR322-derived plasmids intended for human gene therapy by employing a temperature-controllable point mutation. Hum Gene Ther. 7: 1971-1980. Lin-Chao, S., and H. Bremer. 1986. Effect of the bacterial growth rate on replication control of plasmid pBR322 in Escherichia coli. Mol. Gen. Genet. 203: 143–149. Listner, K., L. Bentley, J. Okonkowski, C. Kistler, R. Wnek, A. Caparoni, B. Junker, D. Robinson, P. Salmon, and M. Chartrain. 2006. Development of a Highly Productive and Scalable Plasmid DNA Production Platform. Biotechnol. Prog. 22: 1335 -1345. Lowe, D.B., M.H. Shearer, C.A. Jumper, and R.C. Kennedy. 2007. Towards progress on DNA vaccines for cancer. Cell Mol Life Sci. Jun 14; [Epub ahead of print]. Norrander, J., T. Kempe, and J. Messing. 1983. Construction of improved M13 vectors using oligodeoxynucleotide-directed mutagenesis. Gene 26: 101-6. Okonkowski, J., L. Kizer-Bentley, K. Listner, D. Robinson, and M. Chartrain. 2005. Development of a Robust, Versatile, and Scalable Inoculum Train for the Production of a DNA Vaccine. Biotechnol. Prog. 21: 1038-1047. Prather-Jones, K.L., M.C. Edmonds, and J.W. Herod. 2006. Identification and characterization of IS1 transposition in plasmid amplification mutants of E. coli clones producing DNA vaccines. Appl Microbiol Biotechnol. 73: 815–826. Prather-Jones, K.L., K. S. Sager, J. Murphy, and M. Chartrain. 2003. Industrial scale production of plasmid DNA for vaccine and gene therapy: plasmid design, production, and purification. Enzyme Microb. Technol. 33: 865–883

56
Reinikainen, P., K. Korpela, V. Nissinen, J. Olkku, H. Soderlund,. and P. Markkanen. 1989. Escherichia coli plasmid production in a fermenter. Biotechnol. Bioeng. 33: 386-393. Reinikainen, P. and I. Virkajärvi. 1989. Escherichia coli growth and plasmid copy numbers in continuous cultivations. Biotechnol Lett. 11: 222–230. Rozkov, A, C.A. Avignone-Rossa, P.F. Ertl, P. Jones, R.D. O’Kennedy, J.J. Smith, J.W. Dale and M.E. Bushell. 2006. Fed batch culture with declining specific growth rate for high-yielding production of a plasmid containing a gene therapy sequence in Escherichia coli DH1. Enzyme and Microbial Technology. 39: 47-50. Schmidt, T., K. Friehs, E. Flaschel, and M. Schleef. 2003. Method for the Isolation of ccc Plasmid DNA. US Patent 6,664,078. Seo, J. and J.E. Bailey. 1985. Effects of recombinant plasmid content on growth properties and cloned gene product formation in Escherichia coli. Biotechnol Bioeng. 27: 1668–1674. Seo, J. and J.E. Bailey. 1986. Continuous cultivation of recombinant Escherichia coli: Existence of an optimum dilution rate for maximum plasmid and gene product concentration. Biotechnol. Bioeng. 28: 1590-1594. Shamlou, P.A. 2003. Scaleable processes for the manufacture of therapeutic quantities of plasmid DNA. Biotechnol. Appl. Biochem. 37: 207–218. Sheets, R.L., J. Judith Stein, S. Manetz, C. Duffy, and M, Nason. 2006. Biodistribution of DNA Plasmid Vaccines against HIV-1, Ebola Severe Acute Respiratory Syndrome, or West Nile Virus Is Similar, without Integration, despite Differing Plasmid Backbones or Gene Inserts. Toxicological Sci. 91: 610–619. Shiloach, J., R. Fass. 2005. Growing E. coli to high cell density A historical perspective on method development. Biotech. Adv. 23: 345-357. Tamm, T. and B. Polisky. 1985. Characterization of the ColE1 Primer-RNA1 Complex: Analysis of a Domain of ColE1 RNA1 Necessary for Its Interaction with Primer RNA. Proc. Natl. Acad. Sci., USA. 82: 2257-2261. Tuteja, R. 2002. DNA vaccine against malaria: a long way to go. Crit Rev Biochem Mol Biol. 37: 29-54. Ulmer, J.B. et al. 1993. Heterologous protection against influenza by injection of DNA encoding a viral protein. Science 259: 1745–1749. Wang, Z., Z. Yuan and U.R. Henggeb. 2004. Processing of plasmid DNA with ColE1-like replication origin. Plasmid. 51: 149–161.

57
Wolf, J.A., R.W. Malone, P. Williams, W. Cong, G. Acsadi, A. Jani, and P.L. Felgner. 1990. Direct gene transfer into mouse muscle in vivo. Science 247: 1465-1468. Wong, E.M., M.A. Muesing, and B. Polisky. 1982. Temperature-Sensitive Copy Number Mutants of ColE1 Are Located in an Untranslated Region of the Plasmid Genome. Proc. Natl. Acad. Sci. USA. 79: 3570–3574. Yanisch-Perron, C., J. Vieira, and J. Messing. 1985. Improved M13 phage cloning vectors and host strains: nucleotide sequences of the M13mp18 and pUC19 vectors. Gene 33: 103–119. Zabriskie, D.W. and E.J. Arcuri. 1986. Factors influencing productivity of fermentation employing recombinant microorganisms. Enzyme Microb Technol. 8: 706–717.

58
CHAPTER 3
CONCLUSIONS

59
Improvements in production schemes will be required to meet the growing market for
DNA based gene therapies. Molecular genetics and process engineering will have to work hand
in hand to attain the highest DNA plasmid yields. Due to the complexity of interactions required
to produce plasmid DNA it is important to test as many variables as possible. Although not an
exhaustive investigation, we were able to show the efficacy of small scale screening to determine
fermentation candidates.
For this study, we looked at host-plasmid interactions and carbon source at the small
scale. Using this information we chose promising candidates and grew them at a small
fermentation scale. With a streamlined process, we were able to achieve plasmid yields in line
with some of the highest published yields.
We can only speculate that “good” and “poor” production of plasmid DNA is related to
certain genotypic combinations. In the case of our chosen strains, the genes recA and relA would
be of interest for further study.

60
Appendix A:
Raw Data From Clonal Selection
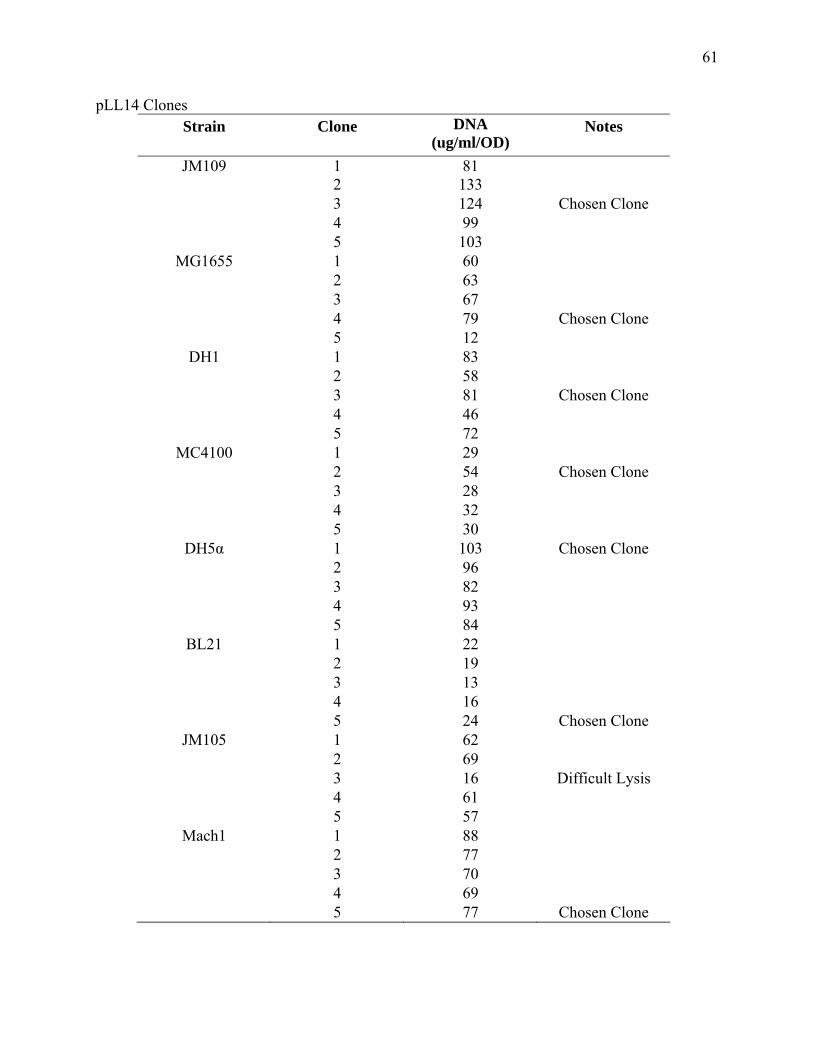
61
pLL14 Clones Strain Clone DNA
(ug/ml/OD) Notes
JM109 1 81 2 133 3 124 Chosen Clone 4 99 5 103
MG1655 1 60 2 63 3 67 4 79 Chosen Clone 5 12
DH1 1 83 2 58 3 81 Chosen Clone 4 46 5 72
MC4100 1 29 2 54 Chosen Clone 3 28 4 32 5 30
DH5α 1 103 Chosen Clone 2 96 3 82 4 93 5 84
BL21 1 22 2 19 3 13 4 16 5 24 Chosen Clone
JM105 1 62 2 69 3 16 Difficult Lysis 4 61 5 57
Mach1 1 88 2 77 3 70 4 69 5 77 Chosen Clone

62
Strain Clone DNA (ug/ml/OD)
Notes
SCS1 S 1 112 2 139 3 159 Chosen Clone 4 119 5 132
SE5000 1 112 Chosen Clone 2 110 3 94 4 80 5 115
SCS1 L 1 195 2 149 3 140 4 149 5 165 Chosen Clone
MC1061 1 49 2 43 3 66 4 81 5 90 Chosen Clone
NM554 1 96 2 98 3 86 4 110 Chosen Clone 5 88
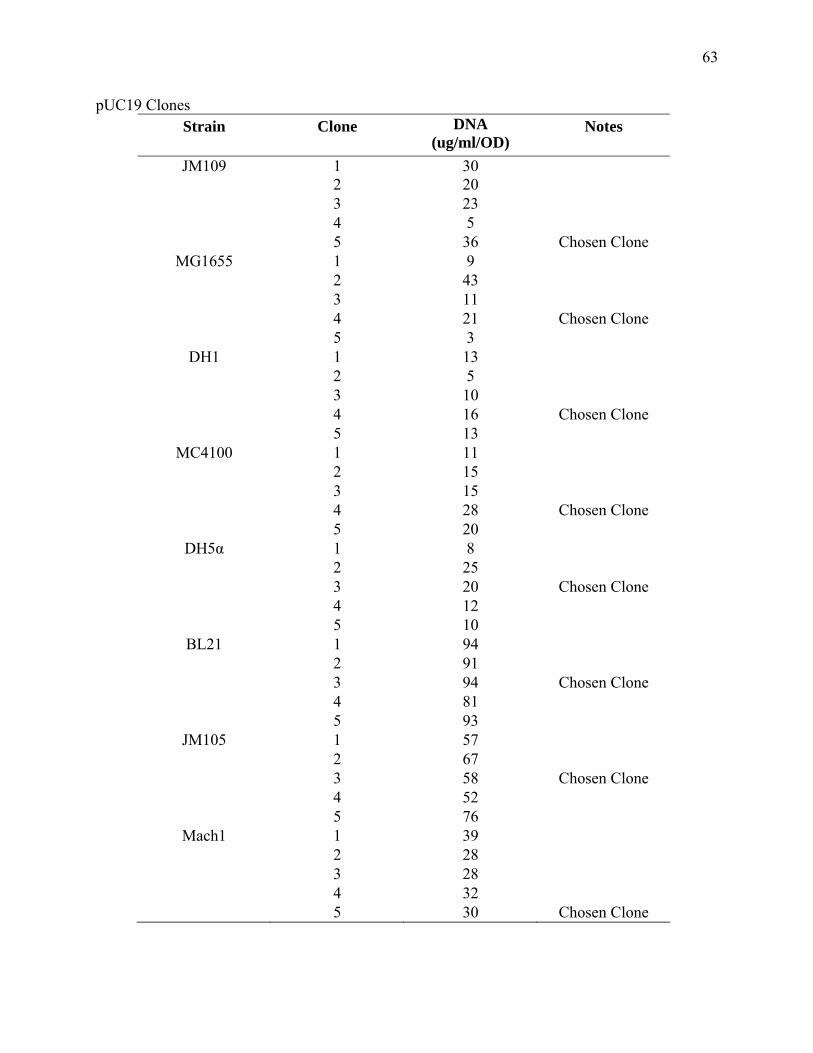
63
pUC19 Clones Strain Clone DNA
(ug/ml/OD) Notes
JM109 1 30 2 20 3 23 4 5 5 36 Chosen Clone
MG1655 1 9 2 43 3 11 4 21 Chosen Clone 5 3
DH1 1 13 2 5 3 10 4 16 Chosen Clone 5 13
MC4100 1 11 2 15 3 15 4 28 Chosen Clone 5 20
DH5α 1 8 2 25 3 20 Chosen Clone 4 12 5 10
BL21 1 94 2 91 3 94 Chosen Clone 4 81 5 93
JM105 1 57 2 67 3 58 Chosen Clone 4 52 5 76
Mach1 1 39 2 28 3 28 4 32 5 30 Chosen Clone

64
Strain Clone DNA (ug/ml/OD)
Notes
SCS1 S 1 32 2 25 3 61 Chosen Clone 4 49 5 53
SCS1 L 1 99 2 63 3 56 4 78 5 79 Chosen Clone
MC1061 1 75 2 100 3 58 4 107 Chosen Clone 5 105
NM554 1 96 2 98 3 86 4 103 Chosen Clone 5 88

65
Appendix B:
Raw Data From Shake Flasks
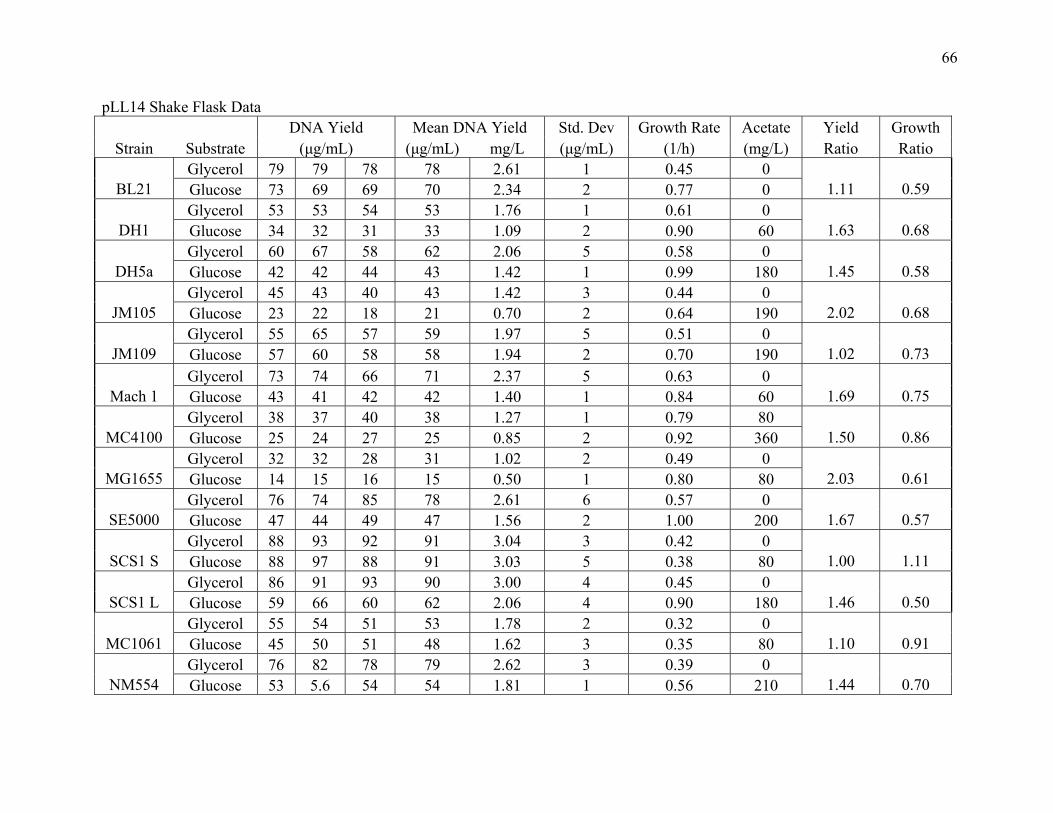
66
pLL14 Shake Flask Data DNA Yield Mean DNA Yield Std. Dev Growth Rate Acetate Yield Growth
Strain Substrate (μg/mL) (μg/mL) mg/L (μg/mL) (1/h) (mg/L) Ratio Ratio Glycerol 79 79 78 78 2.61 1 0.45 0
BL21 Glucose 73 69 69 70 2.34 2 0.77 0 1.11 0.59 Glycerol 53 53 54 53 1.76 1 0.61 0
DH1 Glucose 1.63 0.68 34 32 31 33 1.09 2 0.90 60 Glycerol 60 67 58 62 2.06 5 0.58 0
DH5a Glucose 42 42 44 43 1.42 1 0.99 180 1.45 0.58 Glycerol 45 43 40 43 1.42 3 0.44 0
JM105 Glucose 23 22 18 21 0.70 2 0.64 190 2.02 0.68 Glycerol 55 65 57 59 1.97 5 0.51 0
JM109 Glucose 57 60 58 58 1.94 2 0.70 190 1.02 0.73 Glycerol 73 74 66 71 2.37 5 0.63 0
Mach 1 Glucose 43 41 42 42 1.40 1 0.84 60 1.69 0.75 Glycerol 38 37 40 38 1.27 1 0.79 80
MC4100 Glucose 25 24 27 25 0.85 2 0.92 360 1.50 0.86 Glycerol 32 32 28 31 1.02 2 0.49 0
MG1655 Glucose 14 15 16 15 0.50 1 0.80 80 2.03 0.61 Glycerol 76 74 85 78 2.61 6 0.57 0
SE5000 Glucose 47 44 49 47 1.56 2 1.00 200 1.67 0.57 Glycerol 88 93 92 91 3.04 3 0.42 0
SCS1 S Glucose 88 97 88 91 3.03 5 0.38 80 1.00 1.11 Glycerol 86 91 93 90 3.00 4 0.45 0
SCS1 L Glucose 59 66 60 62 2.06 4 0.90 180 1.46 0.50 Glycerol 55 54 51 53 1.78 2 0.32 0
MC1061 Glucose 45 50 51 48 1.62 3 0.35 80 1.10 0.91 Glycerol 76 82 78 79 2.62 3 0.39 0
NM554 Glucose 53 5.6 54 54 1.81 1 0.56 210 1.44 0.70

67
pUC19 Shake Flask Data DNA Yield Mean DNA Yield Std. Dev Growth Rate Acetate Yield Growth
Strain Substrate (μg/mL) (μg/mL) mg/L (μg/mL) (1/h) (mg/L) Ratio Ratio Glycerol 25 24 26 25 0.84 1 0.45 0 BL21
Glucose 25 23 22 23 0.78 2 0.52 0 1.07 0.87 Glycerol 38 37 35 37 1.22 1 0.47 0 DH1
Glucose 16 15 19 16 0.55 2 0.79 60 2.23 0.59 Glycerol 38 38 41 39 1.30 2 0.46 0 DH5α
Glucose 34 29 32 32 1.06 3 0.70 0 1.23 0.66 Glycerol 41 43 30 38 1.26 7 0.59 0 JM105
Glucose 28 28 27 27 0.91 0 0.82 210 1.38 0.72 Glycerol 44 44 47 45 1.49 2 0.56 0 JM109
Glucose 23 25 25 24 0.81 1 0.86 300 1.84 0.65 Glycerol 15 17 18 17 0.56 2 0.74 0 MC4100
Glucose 13 13 10 12 0.40 2 1.10 220 1.40 0.67 Glycerol 21 23 21 22 0.72 1 0.58 0 MG1655
Glucose 13 12 14 13 0.43 1 0.87 200 1.68 0.67 Glycerol 36 37 34 36 1.19 2 0.41 0 SCS1 S
Glucose 42 40 39 40 1.35 2 0.40 40 0.88 1.03 Glycerol 43 43 41 42 1.41 1 0.34 0 SCS1 L
Glucose 26 23 28 26 0.86 3 0.62 0 1.64 0.55 Glycerol 43. 45 40 43 1.43 3 0.39 10 MC1061
Glucose 24. 23 25 24 0.81 1 0.46 80 1.75 0.85 Glycerol 50 48 46 48 1.61 2 0.33 0
NM554 Glucose 23 25 29 26 0.86 3 0.47 80 1.87 0.70
Note: A stable clone of SE5000 and Mach1 with pUC 19 was never created.

68
Appendix C:
Raw Data From Fermentations

69
SCS1 Lyon Fermentation #1 April 24, 2007 Strain= SCS1 Lyon Feed Batch Growth Rate = 0.14 h-1 Batch Carbon Source = 5 g/l Glucose Starting Volume = 3564 ml Feed = 600 g/L Glucose + 10 g/l MgSO4 + 1.5 ml/l Antifoam
Final Volume = 4136 ml
Final Dry Cell Weight = 31.98 g/L Time Heat treatment started: 32:30 h Time fed-batch commenced = 13:10 h Final Specific Yield = 18.6 mg/g Final Volumetric Yield = 595 mg/L

70
Time Feed Pump
Speed (RPM) dO2 (%) temp (°C) pH OD 562
0:00:00 0 92.79 36.94 6.80 1:00:00 0 91.88 36.94 6.80 2:00:00 0 90.57 37.01 6.80 3:00:00 0 88.68 37.01 6.80 4:00:00 0 86.05 37.01 6.80 5:00:00 0 82.23 36.94 6.80 6:00:00 0 76.49 37.01 6.80 7:00:00 0 67.20 36.91 6.80 8:00:00 0 52.15 37.05 6.80 9:00:00 0 98.37 36.91 6.81
10:00:00 0 96.49 36.98 6.80 11:00:00 0 92.69 37.01 6.80 12:00:00 0 85.67 37.05 6.80 13:00:00 0 74.29 37.05 6.80 13:30:00 2.15 91.55 37.01 6.82 6.914:00:00 2.31 85.95 36.98 6.80 15:00:00 2.65 87.12 36.94 6.80 16:00:00 3.05 86.05 36.98 6.80 17:00:00 3.51 83.07 37.05 6.80 18:00:00 4.04 80.74 36.98 6.80 19:00:00 4.65 76.58 36.98 6.80 19:35:00 5.04 73.26 37.05 6.80 1920:00:00 5.34 72.31 37.01 6.80 21:00:00 6.15 68.01 36.98 6.80 22:00:00 7.07 61.65 37.01 6.80 23:00:00 8.13 55.20 36.98 6.80 24:00:00 9.36 49.14 37.01 6.80 25:00:00 10.76 40.03 37.01 6.80 26:00:00 12.38 32.07 37.01 6.80 27:00:00 14.24 19.61 36.98 6.80 4128:00:00 16.38 21.14 36.91 6.80 29:00:00 18.84 19.80 37.01 6.80 30:00:00 21.67 20.07 36.98 6.80 30:35:00 23.52 20.76 37.05 6.80 6031:00:00 24.93 20.01 37.05 6.80 32:00:00 28.67 19.57 36.98 6.80 6732:30:00 30.75 19.43 36.98 6.80 7033:00:00 32.98 17.72 41.62 6.79 34:00:00 27.90 19.82 41.91 6.80 35:00:00 27.90 21.40 41.86 6.80 36:00:00 27.90 19.54 41.88 6.80 36:40:00 27.90 23.04 41.88 6.80 82

71
DNA Data
Sample Time Volume (ml) OD Biomass
(gm/L)
Volumetric Yield
(mg/L)
Specific Yield
(mg/g)
Acetate (mg/L)
Glucose (mg/L)
1 2.69 17.23 6.40 1 13:30 3565 6.9 2.69 17.85 6.63 250 0
2 7.41 75.00 10.12 2 19:35 3612 19 7.41 85.00 11.47 280 0
3 15.99 242.47 15.16 3 27:00 3756 41 15.99 228.77 14.31 0 60
4 23.40 372.00 15.90 4 30:35 3889 60 23.40 380.00 16.24 0 120
5 27.30 439.53 16.10 5 27.30 413.95 15.16 5
32:30 3975 70 27.30 395.35 14.48
30 130
6 31.98 592.00 18.51 6 31.98 589.33 18.43 6
36:40 4136 82 31.98 602.67 18.85
0 100

72
SCS1 Lyon Fermentation #2 May 8, 2007 Strain= SCS1 Lyon Feed Batch Growth Rate = 0.14 h-1 Batch Carbon Source = 5 g/l Glucose Starting Volume = 3570 ml Feed = 600 g/L Glucose + 10 g/l MgSO4 + 1.5 ml/l Antifoam
Final Volume = 4373 ml
Final Dry Cell Weight = 33.54 g/L Time Heat treatment started: 32:30 h Time fed-batch commenced = 12:40 h Final Specific Yield = 17.8 mg/g Final Volumetric Yield = 595 mg/L
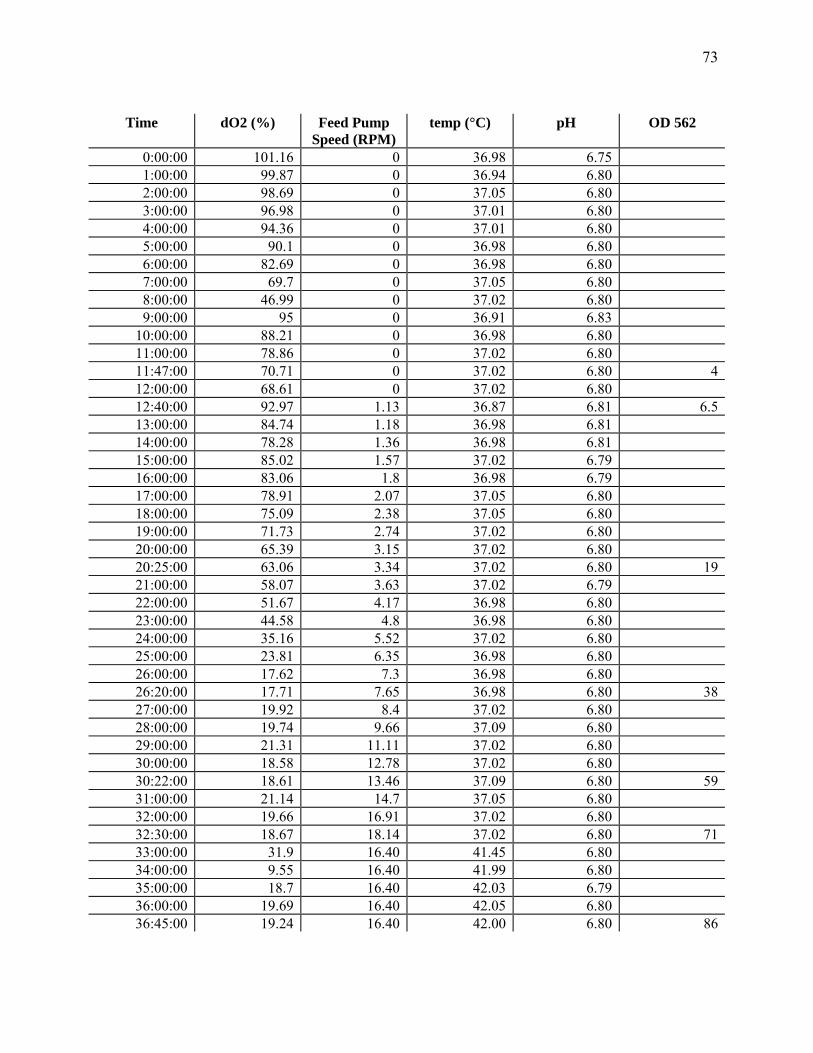
73
Time dO2 (%) Feed Pump
Speed (RPM) temp (°C) pH OD 562
0:00:00 101.16 0 36.98 6.75 1:00:00 99.87 0 36.94 6.80 2:00:00 98.69 0 37.05 6.80 3:00:00 96.98 0 37.01 6.80 4:00:00 94.36 0 37.01 6.80 5:00:00 90.1 0 36.98 6.80 6:00:00 82.69 0 36.98 6.80 7:00:00 69.7 0 37.05 6.80 8:00:00 46.99 0 37.02 6.80 9:00:00 95 0 36.91 6.83
10:00:00 88.21 0 36.98 6.80 11:00:00 78.86 0 37.02 6.80 11:47:00 70.71 0 37.02 6.80 412:00:00 68.61 0 37.02 6.80 12:40:00 92.97 1.13 36.87 6.81 6.513:00:00 84.74 1.18 36.98 6.81 14:00:00 78.28 1.36 36.98 6.81 15:00:00 85.02 1.57 37.02 6.79 16:00:00 83.06 1.8 36.98 6.79 17:00:00 78.91 2.07 37.05 6.80 18:00:00 75.09 2.38 37.05 6.80 19:00:00 71.73 2.74 37.02 6.80 20:00:00 65.39 3.15 37.02 6.80 20:25:00 63.06 3.34 37.02 6.80 1921:00:00 58.07 3.63 37.02 6.79 22:00:00 51.67 4.17 36.98 6.80 23:00:00 44.58 4.8 36.98 6.80 24:00:00 35.16 5.52 37.02 6.80 25:00:00 23.81 6.35 36.98 6.80 26:00:00 17.62 7.3 36.98 6.80 26:20:00 17.71 7.65 36.98 6.80 3827:00:00 19.92 8.4 37.02 6.80 28:00:00 19.74 9.66 37.09 6.80 29:00:00 21.31 11.11 37.02 6.80 30:00:00 18.58 12.78 37.02 6.80 30:22:00 18.61 13.46 37.09 6.80 5931:00:00 21.14 14.7 37.05 6.80 32:00:00 19.66 16.91 37.02 6.80 32:30:00 18.67 18.14 37.02 6.80 7133:00:00 31.9 16.40 41.45 6.80 34:00:00 9.55 16.40 41.99 6.80 35:00:00 18.7 16.40 42.03 6.79 36:00:00 19.69 16.40 42.05 6.80 36:45:00 19.24 16.40 42.00 6.80 86

74
DNA Data
Sample Time Volume (ml) OD Biomass
(gm/L)
Volumetric Yield
(mg/L)
Specific Yield
(mg/g)
Acetate (mg/L)
Glucose (mg/L)
1 1.56 10.20 6.54 1 11:47 3575 4 1.56 9.88 6.33
260 0
2 2.54 16.91 6.67 2 12:40 3570 6.5 2.54 17.78 7.01
0 10
3 7.41 90.38 12.20 3 20.25 3624 19 7.41 104.30 14.08
0 40
4 14.82 190.51 12.85 4 26:20 3749 38 14.82 200.13 13.50
0 420
5 23.01 352.75 15.33 5 30:22 3940 59 23.01 379.22 16.48
0 80
6 27.69 442.38 15.98 6 27.69 438.57 15.84 6
32:22 4064 71 27.69 409.05 14.77
0 80
7 33.54 601.14 17.92 7 33.54 592.57 17.67 7
36:45 4373 86 33.54 592.00 17.65
10 100

75
BL21 Fermentation #1 April 24, 2007 Strain= BL21 Feed Batch Growth Rate = 0.14 h-1 Batch Carbon Source = 5 g/l Glucose Starting Volume = 3560 ml Feed = 600 g/L Glucose + 10 g/l MgSO4 + 1.5 ml/l Antifoam
Final Volume = 4136 ml
Final Dry Cell Weight = 27.69 g/L Time Heat treatment started: 30:30 h Time fed-batch commenced = 10:48 h Final Specific Yield = 15.4 mg/g Final Volumetric Yield = 438 mg/L
Note: Heat treatment was started at 54 when the pump reached its maximum rate (48 rpm). This was due to a slow feed rate of the tubing used.

76
Time dO2 (%) Feed Pump
Speed (RPM) temp (°C) pH OD 562
0:00:00 100.51 0 36.94 6.80 1:00:00 98.64 0 36.94 6.80 2:00:00 95.78 0 36.98 6.80 3:00:00 91.07 0 37.02 6.80 4:00:00 82.98 0 37.02 6.80 5:00:00 69.58 0 37.02 6.80 6:00:00 46.34 0 37.05 6.80 7:00:00 96.82 0 36.91 6.82 8:00:00 92.16 0 36.98 6.80 9:00:00 84.33 0 36.98 6.80
10:00:00 69.22 0 37.02 6.80 10:48:00 86.85 0 36.94 6.81 6.0 11:00:00 83.63 3.07 37.02 6.81 12:00:00 85.17 3.54 36.98 6.80 13:00:00 83.04 4.07 36.98 6.79 14:00:00 79.87 4.68 36.94 6.80 15:00:00 77.61 5.38 36.98 6.80 16:00:00 75.99 6.19 37.05 6.80 17:00:00 75.24 7.12 37.09 6.80 18:00:00 74.13 8.19 37.02 6.80 19:00:00 72.11 9.42 37.02 6.80 19:35:00 69.93 10.23 37.02 6.80 1720:00:00 67.89 10.84 37.02 6.80 21:00:00 62.7 12.47 37.02 6.80 22:00:00 57.27 14.34 37.02 6.79 23:00:00 51 16.5 37.02 6.79 24:00:00 44.2 18.98 37.02 6.80 24:32:00 40.53 20.45 37.02 6.80 2725:00:00 37.01 21.83 37.02 6.80 25:40:00 30.78 23.96 37.09 6.80 3226:00:00 26.73 25.11 37.09 6.80 27:00:00 21.53 28.88 37.02 6.80 27:47:00 19.49 32.23 37.02 6.80 4028:00:00 22.38 33.22 37.05 6.80 29:00:00 19.97 38.22 37.02 6.80 30:00:00 19.93 43.96 37.05 6.80 30:30:00 18.88 46.72 37.02 6.80 5431:00:00 25.24 43 41.92 6.80 32:00:00 19.69 43 41.92 6.79 33:00:00 20.44 43 41.96 6.80 34:30:00 18.56 43 41.96 6.80 71

77
DNA Data
Sample Time Volume (ml) OD Biomass
(gm/L)
Volumetric Yield
(mg/L)
Specific Yield
(mg/g)
Acetate (mg/L)
Glucose (mg/L)
1 2.40 6.69 16.06 1 10:48 3555 6 2.40 6.05 14.53 0 0
2 6.80 12.11 82.33 2 19:35 3618 17 6.80 15.02 102.17 0 0
3 12.80 10.69 136.81 3 25:40 3708 32 12.80 10.87 139.15 0 0
4 16.00 12.45 199.20 4 27:47 3776 40 16.00 10.82 173.07 60 0
5 21.60 12.37 267.14 5 30:30 3894 54 21.60 11.13 240.36 20 40
6 28.40 15.53 441.19 6 28.40 15.20 431.67 6
34:30 4165 71 28.40 15.58 442.38
100 50

78
BL21 Fermentation #2 May 8, 2007 Strain= BL21 Feed Batch Growth Rate = 0.14 h-1 Batch Carbon Source = 5 g/l Glucose Starting Volume = 3575 ml Feed = 600 g/L Glucose + 10 g/l MgSO4 + 1.5 ml/l Antifoam
Final Volume = 4593 ml
Final Dry Cell Weight = 34.32 g/L Time Heat treatment started: 30:48 h Time fed-batch commenced = 10:57 h Final Specific Yield = 14.7 mg/g Final Volumetric Yield = 504 mg/L

79
Time dO2 (%) Feed Pump
Speed (RPM) temp (°C) pH OD 562
0:00:00 100 0 36.84 6.79 1:00:00 99.95 0 36.98 6.84 2:00:00 99.95 0 37.09 6.83 3:00:00 99.95 0 36.98 6.83 4:00:00 100 0 36.98 6.82 5:00:00 85.61 0 36.98 6.81 6:00:00 59.75 0 36.98 6.80 7:00:00 100 0 37.05 6.80 8:00:00 99.95 0 37.01 6.80 9:00:00 99.95 0 36.98 6.91
10:00:00 100 0 37.01 6.82 10:57:00 100 2.1 36.87 6.80 5.811:00:00 100 2.27 36.80 6.81 12:00:00 99.95 2.61 37.02 6.80 13:00:00 99.95 3 37.02 6.80 14:00:00 99.95 3.45 36.94 6.80 15:00:00 96.88 3.97 37.01 6.80 16:00:00 96.31 4.57 36.98 6.80 17:00:00 94.36 5.26 37.12 6.80 18:00:00 92.82 6.04 37.01 6.80 19:00:00 87.61 6.95 36.94 6.80 19:45:00 85.78 7.72 37.02 6.80 2020:00:00 79.51 8 37.02 6.80 21:00:00 71.64 9.2 37.05 6.80 22:00:00 63.59 10.58 37.16 6.80 23:00:00 52.94 12.17 36.94 6.80 24:00:00 41.68 14 37.05 6.80 24:27:00 36.14 14.91 37.05 6.80 3325:00:00 30.73 16.11 37.09 6.80 25:54:00 19.39 18.27 37.12 6.80 4026:00:00 17.05 18.53 37.05 6.80 27:00:00 18.88 21.31 37.05 6.80 27:57:00 16.39 24.34 37.16 6.80 4928:00:00 26.32 24.51 37.05 6.80 29:00:00 19.42 28.2 37.01 6.80 30:00:00 20.52 32.43 37.12 6.81 30:48:00 0.34 36.28 37.09 6.80 6631:00:00 8.42 37.31 41.90 6.80 32:01:00 18.95 33.33 41.95 6.80 33:00:00 0.05 33.33 41.90 6.80 35:01:00 0.1 33.33 41.81 6.80 88
Note: The dO2 probe may have malfunctioned during this run as seen in the graph. However, this did not effect the growth dynamics (as compared to both the expected and to the first BL21 run.

80
DNA Data
Sample Time Volume (ml) OD Biomass
(gm/L)
Volumetric Yield
(mg/L)
Specific Yield
(mg/g)
Acetate (mg/L)
Glucose (mg/L)
1 2.26 14.05 6.21 1 10:57 3755 5.8 2.26 14.02 6.20 0 0
2 7.80 105.67 13.55 2 19:45 3852 20 7.80 109.80 14.08 0 20
3 15.60 173.60 11.13 3 25:54 4014 40 15.60 175.73 11.26 0 50
4 19.11 206.40 10.80 4 27:57 4113 49 19.11 186.40 9.75 80 90
5 25.74 283.33 11.01 5 30:48 4293 66 25.74 246.44 9.57 80 130
6 34.32 519.12 15.13 6 34.32 506.76 14.77 6
35:01 4593 88 34.32 486.47 14.17
100 200

81
MC4100 Fermentation #1 May 7, 2007 Strain = MC4100 Feed Batch Growth Rate = 0.14 h-1 Batch Carbon Source = 5 g/l Glucose Starting Volume = 3547 Feed = 600 g/L Glucose + 10 g/l MgSO4 + 1.5 ml/l Antifoam
Final Volume = 4480
Final Dry Cell Weight = 30.4 g/L Time Heat treatment started: 30:00 h Time fed-batch commenced = 8:30h Final Specific Yield = 7.3 mg/g Final Volumetric Yield = 222 mg/L

82
Time dO2 (%) Feed Pump
Speed (RPM) temp (°C) pH OD 562
0:00:00 105.83 0 6.74 36.94 1:00:00 104.22 0 6.80 36.98 2:00:00 102.91 0 6.80 37.05 3:00:00 95.64 0 6.80 36.98 4:00:00 84.07 0 6.80 37.02 5:00:00 60.81 0 6.80 37.02 6:00:00 95.78 0 6.83 37.05 7:00:00 87.19 0 6.79 36.94 8:00:00 68.93 0 6.80 37.02 8:30:00 54.43 0 6.80 37.05 5.39:00:00 83.62 1.1 6.82 36.94
10:00:00 84.68 1.27 6.87 36.98 11:00:00 84.02 1.46 6.96 36.98 12:00:00 87.39 1.68 6.93 37.02 13:00:00 85.62 1.93 6.87 36.98 14:00:00 82.98 2.22 6.81 36.98 15:00:00 81.98 2.55 6.80 37.02 1216:00:00 78.36 2.94 6.80 36.98 17:00:00 73.35 3.38 6.80 37.02 18:00:00 68.26 3.88 6.79 36.98 19:00:00 63.88 4.47 6.80 37.02 20:00:00 57.05 5.14 6.80 37.02 21:00:00 50.27 5.91 6.79 37.02 21:10:00 48.52 6.05 6.80 37.05 2622:00:00 41.86 6.80 6.80 36.94 23:00:00 33.58 7.82 6.80 37.09 24:00:00 22.33 9.03 6.80 36.98 25:00:00 20.84 10.35 6.80 37.05 26:00:00 19.79 11.91 6.79 37.02 27:00:00 19.35 13.70 6.80 37.02 27:15:00 19.73 14.18 6.80 37.12 5128:00:00 23.68 15.75 6.80 37.02 29:00:00 19.84 18.12 6.79 36.98 29:36:00 19.82 19.71 6.80 37.02 6530:00:00 4.69 18.20 6.80 41.02 31:00:00 14.1 18.20 6.80 41.98 32:00:00 21.81 18.20 6.81 42.01 33:00:00 23.41 18.20 6.81 42.01 34:00:00 37.87 18.20 6.85 41.95 80
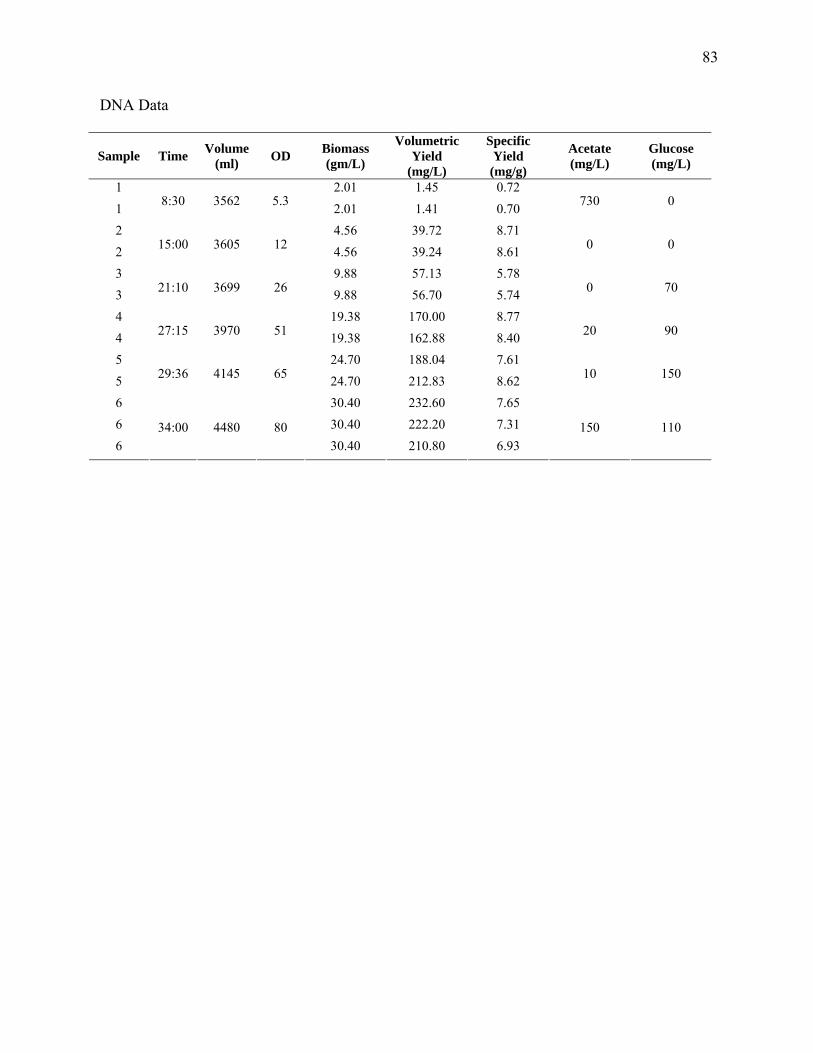
83
DNA Data
Sample Time Volume (ml) OD Biomass
(gm/L)
Volumetric Yield
(mg/L)
Specific Yield
(mg/g)
Acetate (mg/L)
Glucose (mg/L)
1 2.01 1.45 0.72 1 8:30 3562 5.3 2.01 1.41 0.70 730 0
2 4.56 39.72 8.71 2 15:00 3605 12 4.56 39.24 8.61 0 0
3 9.88 57.13 5.78 3 21:10 3699 26 9.88 56.70 5.74 0 70
4 19.38 170.00 8.77 4 27:15 3970 51 19.38 162.88 8.40 20 90
5 24.70 188.04 7.61 5 29:36 4145 65 24.70 212.83 8.62 10 150
6 30.40 232.60 7.65 6 30.40 222.20 7.31 6
34:00 4480 80 30.40 210.80 6.93
150 110

84
MC4100 Fermentation #2 May 19, 2007 Strain = MC4100 Feed Batch Growth Rate = 0.14 h-1 Batch Carbon Source = 5 g/l Glucose Starting Volume = 3566 Feed = 600 g/L Glucose + 10 g/l MgSO4 + 1.5 ml/l Antifoam
Final Volume = 4513
Final Dry Cell Weight = 31.16 g/L Time Heat treatment started: 31:00 h Time fed-batch commenced =09:09 h Final Specific Yield = 6.18 mg/g Final Volumetric Yield = 193 mg/L

85
Time dO2 (%) Feed Pump
Speed (RPM) temp (°C) pH OD 562
0:00:00 103.85 0.00 37.34 6.73 1:00:00 102.67 0.00 36.98 6.80 2:00:00 101.39 0.00 36.98 6.80 3:00:00 98.73 0.00 37.02 6.81 4:00:00 93.16 0.00 37.02 6.80 5:00:00 79.45 0.00 37.05 6.80 6:00:00 46.71 0.00 37.02 6.80 7:00:00 95.67 0.00 37.02 6.81 8:00:00 83.65 0.00 36.98 6.79 9:00:00 57.72 0.00 37.05 6.79 9:08:00 88.78 0.00 36.91 6.81 5.4
10:00:00 81.14 1.17 36.98 6.83 11:00:00 70.58 1.35 37.02 6.91 12:00:00 82.91 1.55 37.05 6.94 13:00:00 81.68 1.78 37.02 6.90 14:00:00 79.14 2.05 37.02 6.85 15:00:00 81.6 2.36 36.98 6.80 16:00:00 81.38 2.71 36.98 6.80 16:30:00 82.08 2.91 36.98 6.80 1217:00:00 80.82 3.12 36.98 6.80 18:00:00 75.92 3.59 37.02 6.80 19:00:00 70.77 4.13 36.98 6.80 20:00:00 65.56 4.75 37.02 6.80 21:00:00 58.87 5.46 37.02 6.79 22:00:00 52.33 6.28 36.94 6.80 23:00:00 44.08 7.23 37.02 6.80 24:00:00 33.96 8.31 37.02 6.79 25:00:00 22.57 9.56 37.09 6.80 26:00:00 20.97 11.00 37.05 6.80 27:00:00 19.87 12.65 37.02 6.79 27:15:00 20.11 13.10 37.02 6.80 4628:00:00 19.47 14.55 37.02 6.80 29:00:00 20 16.74 37.02 6.80 30:00:00 19.34 19.25 37.02 6.80 30:40:00 19.66 18.90 37.05 6.80 6531:00:00 23.93 18.90 43.24 6.79 32:00:00 18.83 18.90 41.96 6.79 33:00:00 16.59 18.90 41.99 6.80 34:00:00 20.35 18.90 41.98 6.80 35:00:00 20.1 18.90 41.98 6.80 82

86
DNA Data
Sample Time Volume (ml) OD Biomass
(gm/L)
Volumetric Yield
(mg/L)
Specific Yield
(mg/g)
Acetate (mg/L)
Glucose (mg/L)
1 2.05 2.11 1.03 1 9:08 3567 5.4 2.05 2.36 1.15 870 0
2 4.56 28.00 6.14 2 16:30 3627 12 4.56 31.84 6.98 0 0
3 17.48 112.92 6.46 3 27:15 3927 46 17.48 110.92 6.35 40 0
4 24.70 191.09 7.74 4 30:40 4169 65 24.70 186.52 7.55 10 0
5 31.16 199.19 6.39 5 31.16 190.95 6.13 5
35:00 4513 82 31.16 187.57 6.02
100 140

87
SCS1 Lyon Fermentation #3 May 23, 2007 Strain = SCS1 Lyon Feed Batch Growth Rate = 0.28 h-1 Batch Carbon Source = 5 g/l Glucose Starting Volume = 3573 ml Feed = 600 g/L Glucose + 10 g/l MgSO4 + 1.5 ml/l Antifoam
Final Volume = 4368 ml
Final Dry Cell Weight = 35.49 g/L Time Heat treatment started: 21:00 h Time fed-batch commenced = 12:04 h Final Specific Yield = 16.88 mg/g Final Volumetric Yield = 599 mg/L

88
Time dO2 (%) Feed Pump
Speed (RPM) temp (°C) pH OD 562
0:00:00 97.33 0 35.36 6.8 1:00:00 98.66 0 36.98 6.8 3:00:00 94.31 0 36.94 6.8 4:00:00 90.16 0 37.02 6.8 5:00:00 83.11 0 37.05 6.8 6:00:00 70.86 0 36.94 6.8 7:00:00 50.45 0 37.02 6.8 8:00:00 96.98 0 37.02 6.84 9:00:00 94.16 0 37.02 6.8
10:00:00 88.82 0 37.02 6.8 11:00:00 79.82 0 37.02 6.8 12:00:00 65.67 0 37.02 6.8 12:04:00 64.94 0 37.02 6.8 6.513:00:00 73.39 2.69 36.94 6.8 14:00:00 66.21 3.55 37.05 6.8 15:00:00 54.66 4.7 36.98 6.8 16:00:00 39 6.22 37.05 6.8 16:15:00 35 6.67 37.02 6.79 2117:00:00 21.07 8.23 36.98 6.8 18:00:00 19.63 10.89 37.16 6.79 19:00:00 18.69 14.41 37.05 6.8 19:53:00 18.59 18.46 37.02 6.8 4920:00:00 18.97 19.07 37.09 6.79 21:00:00 18.3 25.12 37.12 6.79 6122:00:00 23.37 22.50 41.96 6.8 23:00:00 15.49 22.50 41.99 6.79 24:00:00 20.6 22.50 41.99 6.8 25:00:00 22.25 22.50 42.01 6.8 91
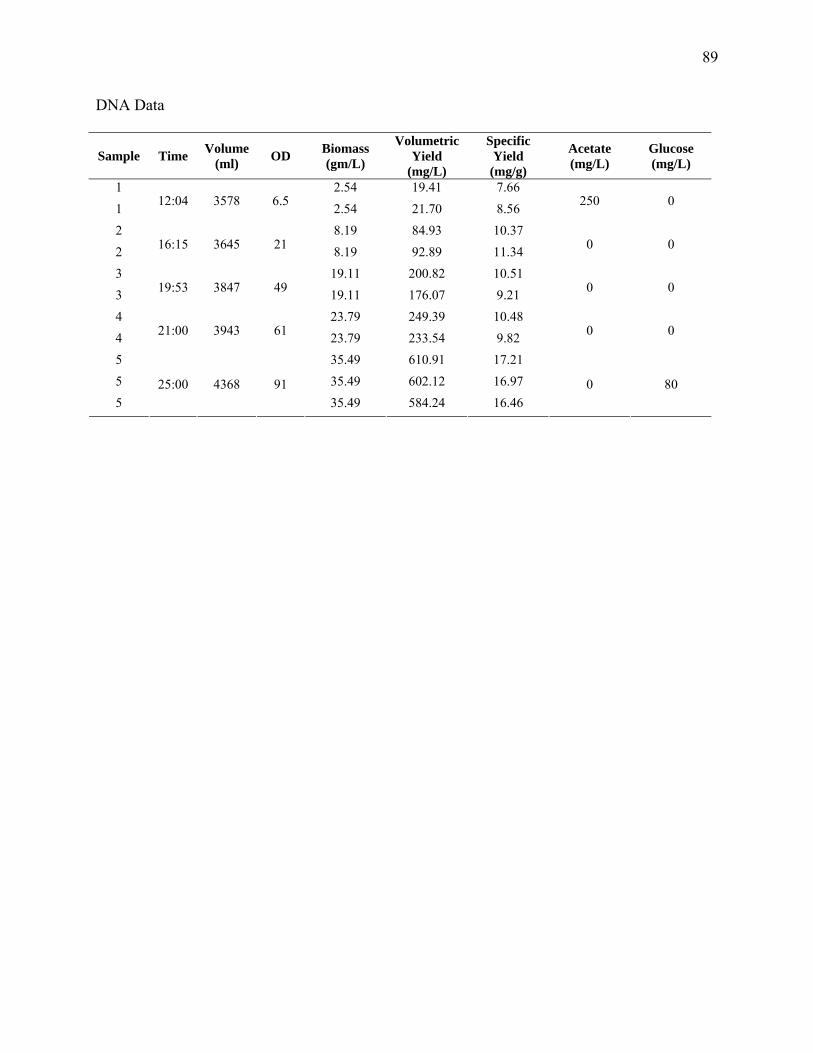
89
DNA Data
Sample Time Volume (ml) OD Biomass
(gm/L)
Volumetric Yield
(mg/L)
Specific Yield
(mg/g)
Acetate (mg/L)
Glucose (mg/L)
1 2.54 19.41 7.66 1 12:04 3578 6.5 2.54 21.70 8.56 250 0
2 8.19 84.93 10.37 2 16:15 3645 21 8.19 92.89 11.34 0 0
3 19.11 200.82 10.51 3 19:53 3847 49 19.11 176.07 9.21 0 0
4 23.79 249.39 10.48 4 21:00 3943 61 23.79 233.54 9.82 0 0
5 35.49 610.91 17.21 5 35.49 602.12 16.97 5
25:00 4368 91 35.49 584.24 16.46
0 80

90
SCS1 Lyon Fermentation #4 May 24, 2007 Strain = SCS1 Lyon Feed Batch Growth Rate = 0.28 h-1 Batch Carbon Source = 5 g/l Glucose Starting Volume = 3573 ml Feed = 600 g/L Glucose + 10 g/l MgSO4 + 1.5 ml/l Antifoam
Final Volume = 4371 ml
Final Dry Cell Weight = 35.1 g/L Time Heat treatment started: 21:00 h Time fed-batch commenced = 12:09 h Final Specific Yield = 16.64 mg/g Final Volumetric Yield = 584 mg/L

91
Time dO2 (%) Feed Pump
Speed (RPM) temp (°C) pH OD 562
0:00:00 94.9 0 35.33 6.8 1:00:00 95.73 0 36.98 6.8 2:00:00 93.94 0 36.98 6.8 3:00:00 90.91 0 37.02 6.8 4:00:00 86.22 0 37.01 6.81 5:00:00 78.69 0 36.98 6.81 6:00:00 67.15 0 36.98 6.8 7:00:00 46.65 0 37.01 6.8 8:00:00 95.1 0 36.91 6.82 9:00:00 92.36 0 37.01 6.8
10:00:00 86.97 0 36.98 6.8 11:00:00 79.93 0 37.02 6.8 12:00:00 63.49 0 37.01 6.8 12:09:00 61.83 0 36.98 6.8 6.713:00:00 61.64 2.92 36.98 6.8 14:00:00 64.34 3.86 37.09 6.8 15:00:00 52.93 5.1 37.01 6.8 16:00:00 46.84 6.75 37.02 6.8 16:20:00 31.41 7.42 37.02 6.8 2017:00:00 20.04 8.94 36.98 6.8 18:00:00 19.33 11.82 37.16 6.8 19:00:00 19.62 15.65 37.09 6.8 20:00:00 17.92 20.7 37.02 6.8 5021:00:00 17.43 27.39 37.12 6.8 6122:00:00 53.05 25.20 41.97 6.8 23:00:00 1.31 25.20 42.04 6.8 24:00:00 14.15 25.20 41.99 6.8 25:00:00 37.78 25.20 42.09 6.8 90

92
DNA Data
Sample Time Volume (ml) OD Biomass
(gm/L)
Volumetric Yield
(mg/L)
Specific Yield
(mg/g)
Acetate (mg/L)
Glucose (mg/L)
1 2.61 16.98 6.50 1 12:09 3578 6.7 2.61 17.84 6.83 200 0
2 7.80 91.00 11.67 2 16:20 3645 20 7.80 82.73 10.61 0 0
3 19.50 202.50 10.38 3 20:00 3849 50 19.50 195.50 10.03 0 0
4 23.79 240.41 10.11 4 21:00 3949 61 23.79 296.50 12.46 0 20
5 35.10 601.52 17.14 5 35.10 590.30 16.82 5
25:00 4371 90 35.10 560.61 15.97
0 80

93
MC4100 Fermentation #3 May 30, 2007 Strain = MC4100 Feed Batch Growth Rate = 0.28 h-1 Batch Carbon Source = 5 g/l Glucose Starting Volume = 3550 ml Feed = 600 g/L Glucose + 10 g/l MgSO4 + 1.5 ml/l Antifoam
Final Volume = 4646 ml
Final Dry Cell Weight = 38.38 g/L Time Heat treatment started: 19:00 h Time fed-batch commenced = 8:54 h Final Specific Yield = 8.95 mg/g Final Volumetric Yield = 344 mg/L

94
Time dO2 (%) Feed Pump
Speed (RPM) temp (°C) pH OD 562
0:00:00 101.02 0 37.12 6.75 1:00:00 99.65 0 36.98 6.81 2:00:00 97.87 0 36.98 6.81 3:00:00 94.21 0 36.98 6.81 4:00:00 85.86 0 37.02 6.8 5:00:00 67.76 0 37.05 6.8 6:00:00 94.66 0 36.84 6.82 7:00:00 90.03 0 36.98 6.8 8:00:00 73.28 0 37.02 6.8 8:50:00 52.86 0 37.02 6.8 5.79:00:00 65.76 3 36.98 6.81
10:00:00 49.42 3.97 36.98 6.81 11:00:00 50.21 5.25 37.01 6.82 12:00:00 37.34 6.95 37.02 6.8 13:00:00 27.65 9.19 36.98 6.8 14:00:00 19.46 12.17 37.09 6.8 14:12:00 -0.11 12.87 37.12 6.8 2315:00:00 18.61 16.1 37.02 6.79 16:00:00 19.49 21.3 37.05 6.8 17:00:00 19.67 28.18 37.02 6.8 18:00:00 18.49 37.29 37.05 6.8 19:00:00 5.88 49.34 41.71 6.8 6720:00:00 17.11 65.28 42 6.79 21:00:00 39.52 86.37 41.97 6.8 22:00:00 17.25 114.28 42 6.79 23:00:00 -0.11 144.99 41.68 6.83 101

95
DNA Data
Sample Time Volume (ml) OD Biomass
(gm/L)
Volumetric Yield
(mg/L)
Specific Yield
(mg/g)
Acetate (mg/L)
Glucose (mg/L)
1 2.166 3.42 1.57 1 8:50 3555 5.7 2.166 3.28 1.51 980 0
2 8.74 43.85 5.01 2 14:12 3667 23 8.74 49.92 5.71 0 0
3 25.46 185.56 7.28 3 19:00 4086 67 25.46 173.11 6.79 0 120
4 38.38 341.96 8.90 4 38.38 336.76 8.77 4
23:00 4646 101 38.38 352.84 9.19
20 100

96
MC4100 Fermentation #4 June 5, 2007 Strain = MC4100 Feed Batch Growth Rate = 0.28 h-1 Batch Carbon Source = 5 g/l Glucose Starting Volume = 3550 ml Feed = 600 g/L Glucose + 10 g/l MgSO4 + 1.5 ml/l Antifoam
Final Volume = 4425 ml
Final Dry Cell Weight = 32.68 g/L Time Heat treatment started: 18:20 h Time fed-batch commenced = 8:54 h Final Specific Yield = 8.90 mg/g Final Volumetric Yield = 291 mg/L

97
Time dO2 (%) Feed Pump
Speed (RPM) temp (°C) pH OD 562
0:00:00 98.64 0 36.87 6.75 1:00:00 97.7 0 36.94 6.8 2:00:00 95.86 0 36.98 6.8 3:00:00 92.24 0 37.05 6.8 4:00:00 84.26 0 37.01 6.8 5:00:00 66.44 0 37.01 6.8 6:00:00 93.04 0 36.76 6.81 7:00:00 88.04 0 37.01 6.8 8:00:00 72.94 0 37.02 6.8 8:49:00 63.25 0 37.01 6.8 5.59:00:00 65.54 3.55 36.98 6.8
10:00:00 52.92 4.7 37.01 6.8 11:00:00 52.68 6.22 36.98 6.82 12:00:00 47.87 8.23 37.05 6.8 13:00:00 48.45 10.89 37.05 6.8 14:00:00 32.4 14.41 36.98 6.8 14:54:00 22.4 18.3 37.05 6.8 2715:00:00 21.3 19.06 37.05 6.79 16:00:00 19.15 25.22 37.09 6.8 17:00:00 19.82 33.37 37.09 6.8 18:00:00 17.53 44.16 37.12 6.8 5318:20:00 15.03 48 37.1 6.8 5619:00:00 3.48 43 41.82 6.8 20:00:00 12.05 43 42.16 6.8 21:00:00 28.79 43 42.02 6.8 22:00:00 31.83 43 41.99 6.8 22:30:00 6.38 43 42 6.8 86

98
DNA Data
Sample Time Volume (ml) OD Biomass
(gm/L)
Volumetric Yield
(mg/L)
Specific Yield
(mg/g)
Acetate (mg/L)
Glucose (mg/L)
1 2.09 3.11 1.49 1 8:49 3553 5.5 2.09 2.98 1.43 660 0
2 10.26 72.34 7.05 2 14:54 3708 27 10.26 67.48 6.58 0 10
3 20.14 105.44 5.24 3 18:00 3944 53 20.14 112.44 5.58 0 60
4 32.68 308.00 9.42 4 32.68 272.57 8.34 4
22:30 4425 86 32.68 292.29 8.94
20 130

99
APPENDIX D
Raw Data From Dry Cell Weight Data

100
Strain Gross
Weight (mg)
OD Sample
Size (mL)
DCW Coefficient
SCS1-L 0.31 42 20 0.37 SCS1-L 0.56 67 20 0.42 SCS1-L 0.31 38 20 0.41 SCS1-L 0.18 26 20 0.35
SCS1-L Average 0.39
BL21 0.514 70 20 0.37 BL21 0.527 67 20 0.39 BL21 0.465 55 20 0.42 BL21 0.314 40 20 0.39
BL21 - Average 0.39
MC4100 0.355 46 20.5 0.38 MC4100 0.528 64 20 0.41 MC4100 0.17 26 18 0.36 MC4100 0.359 51 19 0.37
MC4100 - Average 0.38