Embed Size (px)
Citation preview

FINAL REPORT
FHWA-WY-09/10F
State of Wyoming U.S. Department of Transportation Department of Transportation Federal Highway Administration
IMPROVING FOUNDATION DESIGN IN ROCK:
LOAD TEST AT BURMA ROAD OVERPASS
By:
Department of Civil and Architectural Engineering University of Wyoming
1000 E. University Avenue Laramie, Wyoming 82071
December 2009

Notice This document is disseminated under the sponsorship of the U.S. Department of Transportation in the interest of information exchange. The U.S. Government assumes no liability for the use of the information contained in this document. The contents of this report reflect the views of the author(s) who are responsible for the facts and accuracy of the data presented herein. The contents do not necessarily reflect the official views or policies of the Wyoming Department of Transportation or the Federal Highway Administration. This report does not constitute a standard, specification, or regulation.
The United States Government and the State of Wyoming do not endorse products or manufacturers. Trademarks or manufacturers’ names appear in this report only because they are considered essential to the objectives of the document.
Quality Assurance Statement The Federal Highway Administration (FHWA) provides high-quality information to serve Government, industry, and the public in a manner that promotes public understanding. Standards and policies are used to ensure and maximize the quality, objectivity, utility, and integrity of its information. FHWA periodically reviews quality issues and adjusts its programs and processes to ensure continuous quality improvement.
ii
Technical Report Documentation Page Report No.
FHWA-WY-09/10F
Government Accession No.
Recipients Catalog No.
Title and Subtitle
IMPROVING FOUNDATION DESIGN IN ROCK: LOAD TEST AT BURMA ROAD OVERPASS
Report Date
December 2009 Performing Organization Code
Author(s)
John P. Turner, Ph.D., P.E.
Performing Organization Report No.
Performing Organization Name and Address
Department of Civil and Architectural Engineering University of Wyoming
1000 E. University Avenue Laramie, Wyoming 82071
Work Unit No. RS07(209)
Job No: RS07209 Contact or Grant No.
Sponsoring Agency Name and Address
Wyoming Department of Transportation 5300 Bishop Blvd.
Cheyenne, WY 82009-3340
WYDOT Research Center (307) 777-4182
Type of Report and Period Covered Final Report
May 2009 – November 2009 Sponsoring Agency Code
Supplementary Notes WYDOT Technical Contact: M. Falk, P.E., Asst. State Engineering Geologist
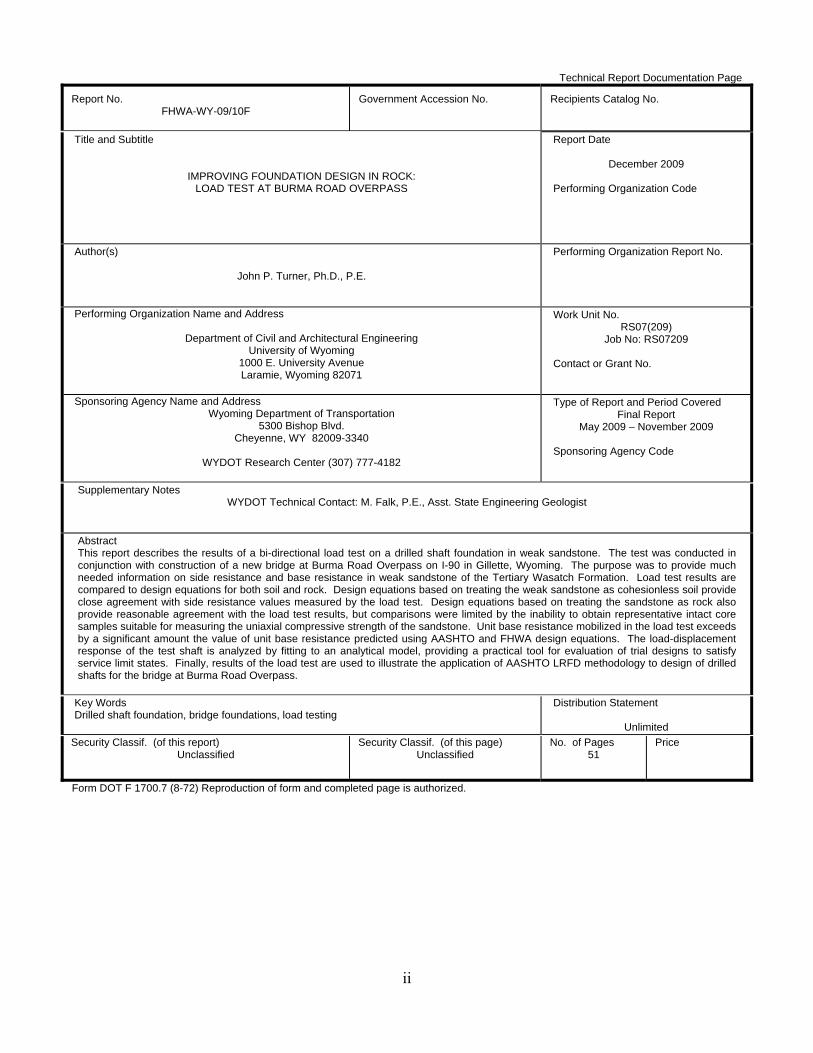
Abstract This report describes the results of a bi-directional load test on a drilled shaft foundation in weak sandstone. The test was conducted in conjunction with construction of a new bridge at Burma Road Overpass on I-90 in Gillette, Wyoming. The purpose was to provide much needed information on side resistance and base resistance in weak sandstone of the Tertiary Wasatch Formation. Load test results are compared to design equations for both soil and rock. Design equations based on treating the weak sandstone as cohesionless soil provide close agreement with side resistance values measured by the load test. Design equations based on treating the sandstone as rock also provide reasonable agreement with the load test results, but comparisons were limited by the inability to obtain representative intact core samples suitable for measuring the uniaxial compressive strength of the sandstone. Unit base resistance mobilized in the load test exceeds by a significant amount the value of unit base resistance predicted using AASHTO and FHWA design equations. The load-displacement response of the test shaft is analyzed by fitting to an analytical model, providing a practical tool for evaluation of trial designs to satisfy service limit states. Finally, results of the load test are used to illustrate the application of AASHTO LRFD methodology to design of drilled shafts for the bridge at Burma Road Overpass.
Key Words Drilled shaft foundation, bridge foundations, load testing
Distribution Statement
Unlimited
Security Classif. (of this report) Unclassified
Security Classif. (of this page) Unclassified
No. of Pages 51
Price
Form DOT F 1700.7 (8-72) Reproduction of form and completed page is authorized.

iii
SI* (Modern Metric) Conversion Factors
Approximate Conversions from SI Units Approximate Conversions to SI Units Symbol
When You Know
Multiply By To Find Symbol Symbol When You Know Multiply By To Find Symbol
Length Length
mm
millimeters
0.039 inches In in inches 25.4 millimeters mm
m
meters
3.28 feet Ft ft feet 0.305 meters m m
meters
1.09 yards Yd yd yards 0.914 meters m
km
kilometers
0.621 miles Mi mi miles 1.61 kilometers km
Area Area
mm2
square millimeters
0.0016 square inches in2 in2 square inches 645.2 square millimeters mm2
m2
square meters
10.764 square feet ft2 ft2 square feet 0.093 square meters m2 m2
square meters
1.195 square yards Yd2 yd2 square yards 0.836 square meters m2
ha
hectares
2.47 acres Ac ac acres 0.405 hectares ha km2
square kilometers
0.386 square miles Mi2 mi2 square miles 2.59 square kilometers km2
Volume Volume
ml
milliliters
0.034 fluid ounces fl oz fl oz fluid ounces 29.57 milliliters ml
l
liters
0.264 gallons gal gal gallons 3.785 liters l m3
cubic meters
35.71 cubic feet ft3 ft3 cubic feet 0.028 cubic meters m3
m3
cubic meters
1.307 cubic yards Yd3 yd3 cubic yards 0.765 cubic meters m3
Mass Mass
g
grams
0.035 ounces Oz oz ounces 28.35 grams g
kg
kilograms
2.202 pounds Lb lb pounds 0.454 kilograms kg Mg
megagrams
1.103 short tons (2000 lbs) T T short tons (2000 lbs) 0.907 megagrams Mg
Temperature (exact) Temperature (exact)
C
Centigrade
1.8 C + 32 Fahrenheit F F Fahrenheit 5(F-32)/9 Celsius C
temperature
temperature temperature or (F-32)/1.8 temperature
Illumination Illumination
lx
lux
0.0929 foot-candles Fc fc foot-candles 10.76 lux lx
cd/m2
candela/m2
0.2919 foot-Lamberts Fl fl foot-Lamberts 3.426 candela/m2 cd/m2
Force and Pressure or Stress Force and Pressure or Stress
N
newtons
0.225 poundforce Lbf lbf pound-force 4.45 newtons N
kPa
kilopascals
0.145 pound-force per square inch
psi psi pound-force per square inch
6.89 kilopascals kPa

iv
ACKNOWLEDGMENTS
This study was funded by the Wyoming Department of Transportation. The author wishes to extend his sincere thanks to the WYDOT Research Advisory Committee for support of this work. Mr. Mark Falk, Assistant Chief Engineering Geologist, was the WYDOT research sponsor. Mr. Falk and Mr. Jim Coffin, Chief Engineering Geologist, provided the full support of the WYDOT Geology Program during the course of this study. Mr. Robert Johnson, Engineering Geologist, supervised the site investigation of the Burma Road Overpass site and provided information on the geology of the load test site. Mr. Kirk Hood, WYDOT Engineering Geologist, assisted in organizing the load test. The support of all WYDOT Geology personnel is much appreciated. Shawn Cooney, University of Wyoming student, assisted the author with several aspects of the analysis presented in Chapter 3 of this report and participated in field observation of the test shaft installation. Several of Mr. Cooney’s photographs are used in Chapter 2. The author would like to express his thanks to the personnel of Loadtest, Inc. who carried out the Osterberg Load Cell test for this project, especially Mr. Bob Simpson. Michael Patritch and Tim McDowell of the WYDOT Research Committee provided outstanding administrative support and much encouragement, for which the author is grateful.

v v
EXECUTIVE SUMMARY
Load testing of a drilled shaft foundation at the site of a new bridge provided the opportunity to evaluate design methods employed by the Wyoming DOT for foundations in rock. Selection of design values of side and base resistance for drilled shaft foundations in rock is a challenge to engineers and geologists responsible for design of bridges and other structures. Rock mass can exhibit large variability in strength and quality. Rock is often difficult to sample when it is highly fractured or weathered. The boundary between soil and highly weathered rock can be hard to define and the design equations for soil will produce different side and base resistance values than the design equations for rock. One approach to reducing uncertainty is to conduct a load test for the purpose of verifying values of side and base resistances. The Wyoming DOT conducted a drilled shaft load test for this purpose at the Burma Road Overpass site near Gillette, WY, in September, 2009. This load test provided an opportunity to research the behavior of drilled shafts in rock in order to improve the reliability and cost-effectiveness of WYDOT foundation design methods. This report provides a review of design methods for drilled shafts in rock under axial loading (Chapter 1). This is followed by a summary of the field load test conducted at the Burma Road Overpass (Chapter 2). In Chapter 3, the load test results are compared to current design methods and the measured resistances are used to illustrate the application of LRFD design methods to the design of drilled shafts for the bridge at Burma Road Overpass.

vi
Contents CHAPTER 1: INTRODUCTION AND BACKGROUND ........................................... 1
1.1 Introduction .............................................................................................................. 1
1.2 Objectives ................................................................................................................ 1
1.3 Design Considerations for Rock Sockets ................................................................. 2
1.3.1 Evaluation of Strength Limit States .................................................................. 3
1.3.2 Side Resistance in Cohesionless Soils .............................................................. 7
1.3.3 Evaluation of Service Limit States.................................................................... 9
CHAPTER 2: LOAD TEST AT BURMA ROAD OVERPASS ................................ 11
2.1 Bridge and Structural Considerations .................................................................... 11
2.2 Site Conditions ....................................................................................................... 13
2.3 Test Shaft Installation ............................................................................................ 15
2.4 Load Test and Results ............................................................................................ 19
CHAPTER 3: APPLICATION TO ROCK SOCKET DESIGN ............................... 22
3.1 Evaluation of Drilled Shaft Resistances ................................................................ 22
3.1.1 Side Resistance ............................................................................................... 22
3.1.2 Base Resistance ............................................................................................... 24
3.2 Load-Deformation Response ................................................................................. 25
3.3 Application of Results to LRFD Design of Drilled Shafts .................................... 29
CHAPTER 4: CONCLUSIONS AND RECOMMENDATIONS .............................. 32
4.1 Conclusions ............................................................................................................ 32
4.2 Recommendations .................................................................................................. 33
REFERENCES ................................................................................................................ 35
APPENDIX A: Model for Axial Load-Displacement Response of a Rock Socket ... 37
APPENDIX B: Axial Load-Displacement Model for Burma Road Overpass ......... 41
vii
LIST OF TABLES
Page
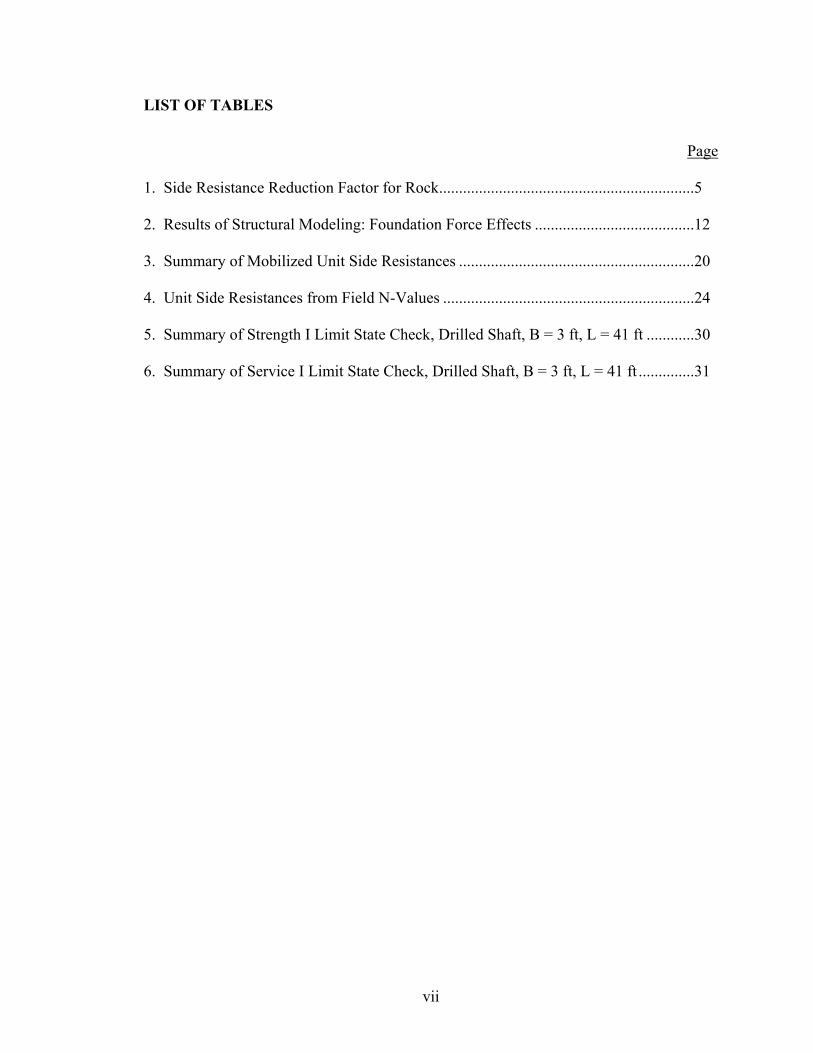
1. Side Resistance Reduction Factor for Rock ................................................................5 2. Results of Structural Modeling: Foundation Force Effects ........................................12 3. Summary of Mobilized Unit Side Resistances ...........................................................20 4. Unit Side Resistances from Field N-Values ...............................................................24 5. Summary of Strength I Limit State Check, Drilled Shaft, B = 3 ft, L = 41 ft ............30 6. Summary of Service I Limit State Check, Drilled Shaft, B = 3 ft, L = 41 ft ..............31

viii
LIST OF FIGURES
Page 1. Drilled shaft in rock under axial compression ............................................................3 2. Base resistance factor for rock (Prakoso and Kulhawy 2002) ....................................7 3. Frictional model of side resistance, drilled shaft in cohesionless soil ........................8 4. Simplified model of axial load-deformation behavior, drilled shaft in rock ..............10 5. Elevation view of bridge at Burma Road Overpass (WYDOT, 2009) .......................11 6. Boring logs along the northern alignment of Burma Road Overpass .........................14 7 Bi-Directional (O-cell) testing schematic (courtesy LoadTest, Inc.) ..........................16 8. Drilling operation for installation of the test shaft (Photo by S. Cooney) ..................17 9. Photo of the drilled shaft borehole prior to concrete placement (Photo by S. Cooney) ..................................................................................................17 10. Test shaft reinforcing cage with attached O-cell (Photo by S. Cooney) ....................18 11. Concrete placement in the bottom of the shaft prior to placement of the reinforcing cage (Photo by S. Cooney) .........................................................................................19 12. Load-displacement curve from O-cell test (Loadtest, Inc. 2009) ..............................20 13. Equivalent top load versus settlement curve, Burma Road Overpass (Loadtest, Inc. 2009) ..................................................................................................21 14. Mobilized unit side resistance versus displacement curves (Loadtest, Inc. 2009) ....21 15. Interpretation of a compression load test on a complete rock socket (Kulhawy and Carter 1992) .......................................................................................26
16. Complete and base load versus settlement curves from O-cell test ...........................28 17. Measured (in red) and modeled load versus settlement curve for drilled shaft at Burma Road Overpass ...............................................................................................28 18. Modeled uplift load-displacement curve ...................................................................29

1
CHAPTER 1: INTRODUCTION AND BACKGROUND
1.1 Introduction
Properly designed and constructed drilled shaft foundations can provide cost-effective and reliable support for highway bridge structures. A drilled shaft is a reinforced concrete member constructed by excavating a cylindrical hole in the ground followed by placement of a reinforcing cage and backfilled with concrete. Use of drilled shafts can be particularly advantageous at sites underlain by rock because large axial and lateral loads can be supported and foundation deformations can be limited to tolerable levels. Tools and equipment for excavating in rock have undergone many improvements in recent years and design methods for shafts in rock also have advanced significantly. Nevertheless, selection of appropriate design values of side and base resistance for rock sockets can still be very challenging. Reasons include the following: (i) rock mass can exhibit large variability in strength and quality, (ii) rock is often difficult to sample and test when it is highly fractured, weak, or weathered, and (iii) the boundary between soil and highly weathered rock can be hard to define and the design equations for soil will produce different side and base resistance values than the design equations for rock. Load testing of drilled shafts provides a means to verify design assumptions and/or to measure ultimate values of side and base resistance. The Wyoming DOT conducted a drilled shaft load test for this purpose at the Burma Road Overpass site near Gillette, WY, in September of 2009. This load test provided an opportunity to the Principal Investigator and WYDOT to research the behavior of drilled shafts in rock in order to improve the reliability and cost-effectiveness of WYDOT foundation design methods. Evaluation of the load test with the objective of improved design is the topic of this report.
1.2 Objectives
The objectives of this project are to use the load test results at Burma Road Overpass to evaluate design equations for side and base resistance in a weakly-cemented sandstone and to apply a model that predicts the axial load-settlement behavior of drilled shafts in rock. These research activities maximize the benefits of conducting the load test. Comparison of measured side and base resistances against design equations given by AASHTO and FHWA enable WYDOT engineers and geologists to determine their applicability to the subsurface conditions at the Burma Road Overpass and to sites with similar geology on future projects. Modeling the load-displacement response of the test shaft enables direct evaluation of AASHTO service limit states for the overpass project. The model can now be used by WYDOT engineers on future projects that require predictions of axial load-settlement response of drilled shafts in rock. The principal benefits to WYDOT are increased confidence in design methods for drilled shafts, the introduction of a new analytical tool for predicting foundation deformations used in service limit state evaluations, and more cost-effective foundation designs.

2
1.3 Design Considerations for Rock Sockets
Current AASHTO design specifications (AASHTO 2007) require that both superstructure and substructure elements, including foundations, be designed in the format of LRFD (Load and Resistance Factor Design). The basic design criterion that must be satisfied for all applicable limit states can be stated as:
the summation of factored force effects may not exceed the summation of factored resistances.
In equation form:
iiiii RQ (1)
where:
i = a load modifier to account for ductility, redundancy, and operational importance of the bridge or other structure
i = load factor; a multiplier applied to force effects Qi = force effect i = resistance factor for resistance component i Ri = nominal value of resistance component i
The left side of the inequality given by Equation 1 represents the summation of factored force effects while the right side represents the summation of factored resistances. A force effect is defined as an axial load, shear, or moment caused by loads acting on the structure. AASHTO specifies the load combinations under which the bridge must be analyzed, for each limit state. When applied to a drilled shaft under axial force effects, the resistance (right-hand side of Eq. 1) consists of several components, including side resistance (uplift or compression) and base resistance (compression only). To illustrate, consider the case of a rock-socketed drilled shaft of length L and diameter B under a compressive force Qc as shown in Figure 1 (a). The compressive force is transferred to the ground through (a) shearing stress that develops at the concrete-rock interface along the sides of the shaft and (b) the bearing stress that develops between the tip of the shaft and the underlying rock. The resultants of these two components of resistance are shown in the figure as: (1) side resistance Rs and (2) base resistance Rb. The load transfer response can be illustrated by considering a generalized axial load versus displacement curve as shown in Figure 1 (b). Upon initial loading, shearing stress develops along the vertical shaft-rock interface. For relatively small load, displacement is small and the stress-strain behavior at the shaft-rock interface is linear (line OA). There is no relative displacement (“slip”) between the concrete shaft and surrounding rock and the system may be modeled as being linearly elastic. With increasing load, the shear strength along some portion of the shaft sidewall is exceeded, initiating rupture of the “bond” and relative slip at the shaft-rock interface. The load-displacement curve

3
(a) Free body diagram, shaft under compression (b) Load settlement curve
Figure 1. Drilled shaft in rock under axial compression becomes nonlinear as rupture and slip progress and a greater proportion of the applied load is transferred to the base (line AB). At some point, the full side resistance is mobilized, there is slip along the entire surface (“full slip” condition), and a greater proportion of the applied load is transferred to the shaft base (beyond point B in Figure 1 b). If loading is continued to a displacement sufficient to cause failure of the rock mass beneath the base, a peak compressive load may be reached. In practice, design of drilled shafts in rock requires consideration of (1) geotechnical and structural capacity (strength limit states) and (2) deformation limits (service limit states). Geotechnical capacity in compression is evaluated in terms of limiting values of side and base resistances. Load transfer in uplift involves the same mechanisms of side resistance mobilization as described above for compression. The uplift force Qu is resisted by the weight of the shaft (W) and the side resistance (Rs), both of which act downward. Base resistance is assumed to be zero.
1.3.1 Evaluation of Strength Limit States Considering the two components of resistance for axial compression loading (side and base), the summation of factored resistances (right side of Equation 1) for evaluation of LRFD strength limit states is given by:
BNB
n
1ii,SNi,Sii RRR
(2)
B
L
Qc
Rs
W
Rb Settlement, wc
Lo
ad
, Qc
B
Linear elastic
Progressive slip
Full slip
O
A

4
where RSN,i = nominal side resistance for layer i, S,i = resistance factor for side resistance in layer i, n = number of layers providing side resistance, RBN = nominal base resistance, and B = resistance factor for base resistance. The total nominal side resistance for a specific geomaterial layer is the product of the nominal unit side resistance (fSN) and the cylindrical surface area over which side resistance develops, expressed as the product of the layer thickness (zi) and the shaft circumference, or:
SNiSN BR fz (3) where B = shaft diameter, zi = thickness of layer i, and fSN = nominal unit side resistance. Nominal unit side resistance for shafts in rock may be evaluated on the basis of mean uniaxial compressive strength of the rock, as follows:
a
u
a
SN
p
qC
p
f (4)
in which qu = mean value of uniaxial compressive strength for the rock layer, pa = atmospheric pressure in the same units as qu, and C = a regression coefficient used to analyze load test results. Studies relating side resistance to rock compressive strength include those of Horvath and Kenney (1979), Rowe and Armitage (1987), Kulhawy and Phoon (1993), and others. The most recent regression analysis of available load test data is reported by Kulhawy et al. (2005) and demonstrates that the mean value of the coefficient C is approximately equal to 1.0. The authors recommend the use of Equation 4 with C = 1.0 for design of “normal” rock sockets. A lower bound value of C = .63 was shown to encompass 90% of the load test results. For design, the value of qu used in Equation 4 should not exceed the compressive strength of the drilled shaft concrete, unless load testing is conducted and the results verify that a higher value of side resistance can be achieved. The term “normal” as used above applies to sockets constructed with conventional equipment and resulting in nominally clean sidewalls without resorting to special procedures or artificial roughening. Rocks that may be prone to smearing or rapid deterioration upon exposure to atmospheric conditions, water, or slurry, are outside the “normal” range and may require additional measures to insure reliable side resistance. Rocks exhibiting this type of behavior include clay shales and other argillaceous rocks. Rock that cannot support construction of an unsupported socket without caving is also outside the “normal” and will likely exhibit lower side resistance than given by Equation 4 with C = 1.0.

5
The expression for unit side resistance in rock as given in the FHWA Drilled Shaft Manual (O’Neill and Reese 1999) and adopted in the AASHTO (2007) LRFD specifications has the same form as Equation 4 but with a recommended value of the coefficient C = 0.65. This is referred to as the “Horvath and Kenney” method based on their 1979 paper. O’Neill and Reese (1999) also applied an empirical reduction factor E to account for the degree of fracturing. The resulting expression is:
0.65 (5)
where the coefficient is estimated from the RQD of the rock. The relationships between RQD and are given in Table 1. Considering the more recent research on side resistance in rock, in particular the work cited above by Kulhawy et al. (2005) that incorporates the original data of Horvath and Kenney (1979) plus additional data compiled over the ensuing 25+ years, Equation 4 with C = 1.0 is recommended for routine design of rock sockets. For rock that cannot be drilled without some type of artificial support, such as casing or by grouting ahead of the excavation, the reduction factors given in Table 1 are recommended for application to the resistance calculated by Equation 4. Additional research is needed to establish reliability-based resistance factors for use with this approach. Nominal base resistance is the product of the nominal unit base resistance (qBN) and the cross-sectional area of bearing at the shaft base (Abase), or:
BN
2
BN q4
BR
(6)
Base resistance in rock is complex because of the wide range of possible rock mass conditions. Various failure modes are possible depending upon whether rock mass strength is governed by intact rock, fractured rock mass, or structurally controlled by
Table 1. Side Resistance Reduction Factor for Rock
RQD (%) Joint Modification Factor,
Closed joints Open or gouge-filled joints
100 1.00 0.85 70 0.85 0.55 50 0.60 0.55 30 0.50 0.50 20 0.45 0.45

6
shearing along dominant discontinuity surfaces. In practice, it is common to have information on the uniaxial compressive strength of intact rock (qu) and the general condition of rock at the base of a shaft. Empirical relationships between nominal unit base resistance (qBN) and rock compressive strength can be expressed in the form:
ucrBN qNq * (7) where Ncr
* is an empirical base resistance factor for rock. Studies relating qBN to qu are reported by Zhang and Einstein (1998) and Prakoso and Kulhawy (2002). There is overlap in the data used in each study although the authors used different interpretations of load test results to establish qBN. Prakoso and Kulhawy used a consistent definition of ultimate base resistance and limited the data to tests that exhibited failure. Results of the Prakoso and Kulhawy study are shown in Figure 2 in which the base resistance factor is plotted against shaft diameter. The data base included 14 load tests at 9 sites in several rock types, mainly fine-grained sedimentary rocks. The mean value of Ncr
* is 3.38 with a coefficient of variation COV = 35.4%. A lower bound value of Ncr
* = 2.5 incorporates most of the points shown in Figure 2 and is consistent with work by Rowe and Armitage (1987) in which a value of Ncr* = 2.5 is recommended for competent rock. Considering these three studies, a value of Ncr
* = 2.5 is recommended for design when qu is the sole parameter for establishing qBN and the following conditions are met:
1. The shaft base is bearing on rock which is either massive or tightly jointed (no compressible seams or joints) to a depth of at least one diameter beneath the base.
2. No solution cavities or voids exist beneath the base, and. 3. A clean base can be achieved and verified using conventional clean-out
equipment. Equation 7 with Ncr* = 2.5 is recommended in AASHTO (2007).
Values of Ncr* greater than 2.5, which clearly are possible based on Figure 2, are
justified when they can be verified by local experience or load testing.

7
Figure 2. Base resistance factor for rock (Prakoso and Kulhawy 2002)
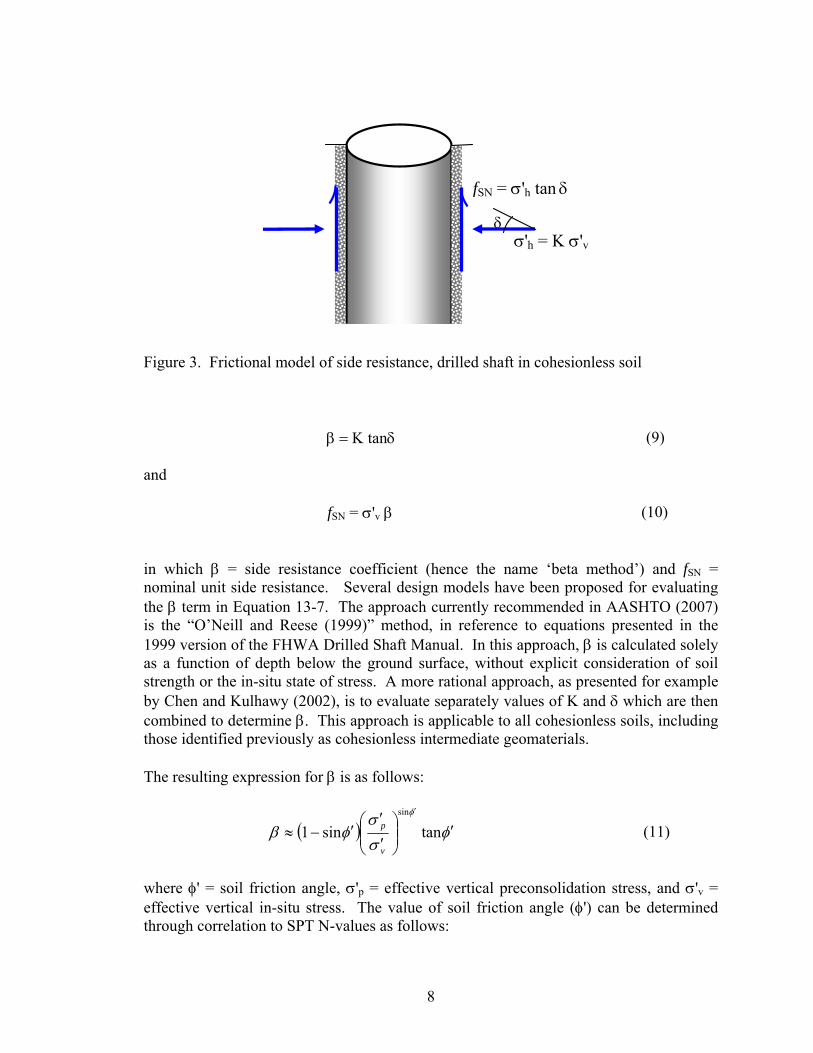
1.3.2 Side Resistance in Cohesionless Soils The site of the drilled shaft load test that is the subject of this report is underlain by sandstone which is described as being weathered and poorly-cemented. Over most of the depth corresponding to the test shaft, Drivepoint Penetration and Standard Penetration Tests (SPT) were conducted. Results of SPT tests, given in terms of N-values, are typically used to evaluate resistances in cohesionless soils such as sands and gravels. The availability of SPT data at Burma Road Overpass makes it possible to compare the load test results to design equations for side resistance based on field N-values. The applicable design equations are presented below and are evaluated against the load test results in Chapter 3. The nominal side resistance of a drilled shaft in cohesionless soil can be expressed as the frictional resistance that develops over a cylindrical shear surface defined by the soil-shaft interface. As illustrated in Figure 3, the unit side resistance is directly proportional to the normal stress acting on the interface. Nominal side resistance is then given by:
tanδKσΔzπBzBR SNSN vf (8)
in which RSN = nominal side resistance, B = shaft diameter, z = thickness of the soil layer over which resistance is calculated,'v = average vertical effective stress over the depth interval z, K = coefficient of horizontal soil stress (K = 'h/'v),'h = horizontal effective stress, and = effective stress angle of friction for the soil-shaft interface. For convenience, the following terms may be combined:
8
Figure 3. Frictional model of side resistance, drilled shaft in cohesionless soil
tan (9) and
fSN = 'v (10) in which = side resistance coefficient (hence the name ‘beta method’) and fSN = nominal unit side resistance. Several design models have been proposed for evaluating the term in Equation 13-7. The approach currently recommended in AASHTO (2007) is the “O’Neill and Reese (1999)” method, in reference to equations presented in the 1999 version of the FHWA Drilled Shaft Manual. In this approach, is calculated solely as a function of depth below the ground surface, without explicit consideration of soil strength or the in-situ state of stress. A more rational approach, as presented for example by Chen and Kulhawy (2002), is to evaluate separately values of K and which are then combined to determine . This approach is applicable to all cohesionless soils, including those identified previously as cohesionless intermediate geomaterials. The resulting expression for is as follows:
tansin1
sin
v
p (11)
where ' = soil friction angle, 'p = effective vertical preconsolidation stress, and 'v = effective vertical in-situ stress. The value of soil friction angle (') can be determined through correlation to SPT N-values as follows:
'h = K 'v
fSN = 'h tan

9
601log2.95.27 N (12)
in which (N1)60 = N-value corrected for effective overburden stress and corresponding to 60 percent energy efficiency of the hammer. A practical estimate for preconsolidation stress can be made using the following correlation suggested by Mayne (2007):
m60
a
p N47.0p
(13)
where m = 0.6 for clean quartzitic sands and m = 0.8 for silty sands to sandy silts, and N60 is the field N-value (not corrected for overburden stress). For each cohesionless soil layer, the value of evaluated by Equation 13-15 is substituted into Equation 13-7 for determination of unit side resistance and this value is substituted into Equation 13-5 for determination of nominal side resistance RSN. This model accounts for site-specific variations in horizontal stress and soil strength in a rational manner. The method described above, commonly referred to as the beta-method, is generally applicable to non-cemented cohesionless soils. The sandstone at Burma Road Overpass is weakly cemented; however, the fact that Standard Penetration Testing was possible suggests that it may behave more like soil than rock for engineering purposes.
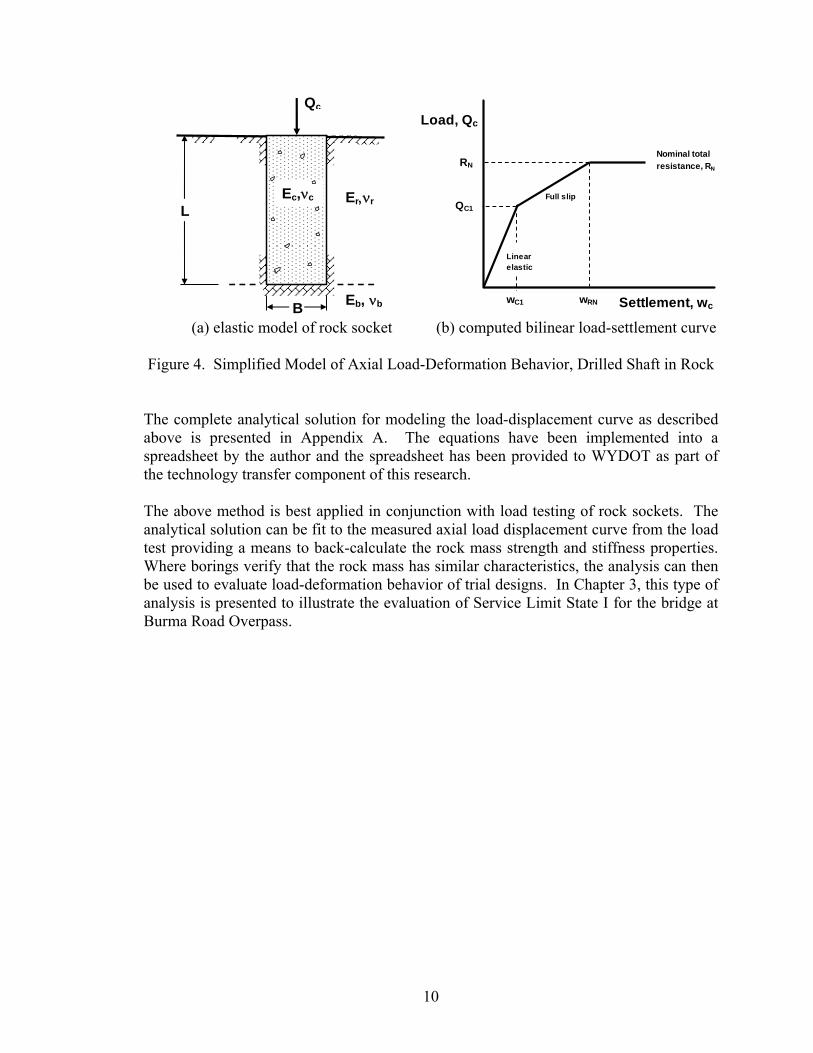
1.3.3 Evaluation of Service Limit States An approximate method given by Kulhawy and Carter (1992) provides simple closed-form expressions that compare reasonably well to more sophisticated nonlinear finite element analyses. The basic problem is depicted in Figure 4a and involves predicting the relationship between an axial compression load (Qc) applied to the top of a socketed shaft and the resulting axial displacement at the top of the socket (wc). The concrete shaft is modeled as an elastic cylindrical inclusion embedded within an elastic rock mass. The cylinder of depth L and diameter B has Young’s modulus Ec and Poisson’s ratio c. The rock mass surrounding the cylinder is homogeneous with Young’s modulus Er and Poisson’s ratio r while the rock mass beneath the base of the shaft has Young’s modulus Eb and Poisson’s ratio b. The solution (Figure 4b) approximates the actual nonlinear load-deformation response of an axially loaded rock socket (see Fig. 1b) as consisting of two linear segments: (1) the initial linear elastic response and (2) the full slip condition. The maximum load is limited to the nominal axial resistance.
10
(a) elastic model of rock socket (b) computed bilinear load-settlement curve Figure 4. Simplified Model of Axial Load-Deformation Behavior, Drilled Shaft in Rock
The complete analytical solution for modeling the load-displacement curve as described above is presented in Appendix A. The equations have been implemented into a spreadsheet by the author and the spreadsheet has been provided to WYDOT as part of the technology transfer component of this research. The above method is best applied in conjunction with load testing of rock sockets. The analytical solution can be fit to the measured axial load displacement curve from the load test providing a means to back-calculate the rock mass strength and stiffness properties. Where borings verify that the rock mass has similar characteristics, the analysis can then be used to evaluate load-deformation behavior of trial designs. In Chapter 3, this type of analysis is presented to illustrate the evaluation of Service Limit State I for the bridge at Burma Road Overpass.
B
L
Qc
Err
Eb, b
Ec,c
Settlement, wc
Load, Qc
Full slipQC1
Nominal total
resistance, RN
wC1
Linear elastic
wRN
RN
11
CHAPTER 2: LOAD TEST AT BURMA ROAD OVERPASS
A proposed new bridge crossing I-90 near Gillette, WY, required drilled shafts in weathered sandstone to resist uplift forces at the abutments. The uncertainty associated with strength properties of the sandstone and uplift resistance of the foundations led the Wyoming DOT to conduct a field load test on a full-size drilled shaft at the site of the bridge. This chapter provides an overview of the key features of the bridge followed by a description of the site conditions and the drilled shaft load test.
2.1 Bridge and Structural Considerations
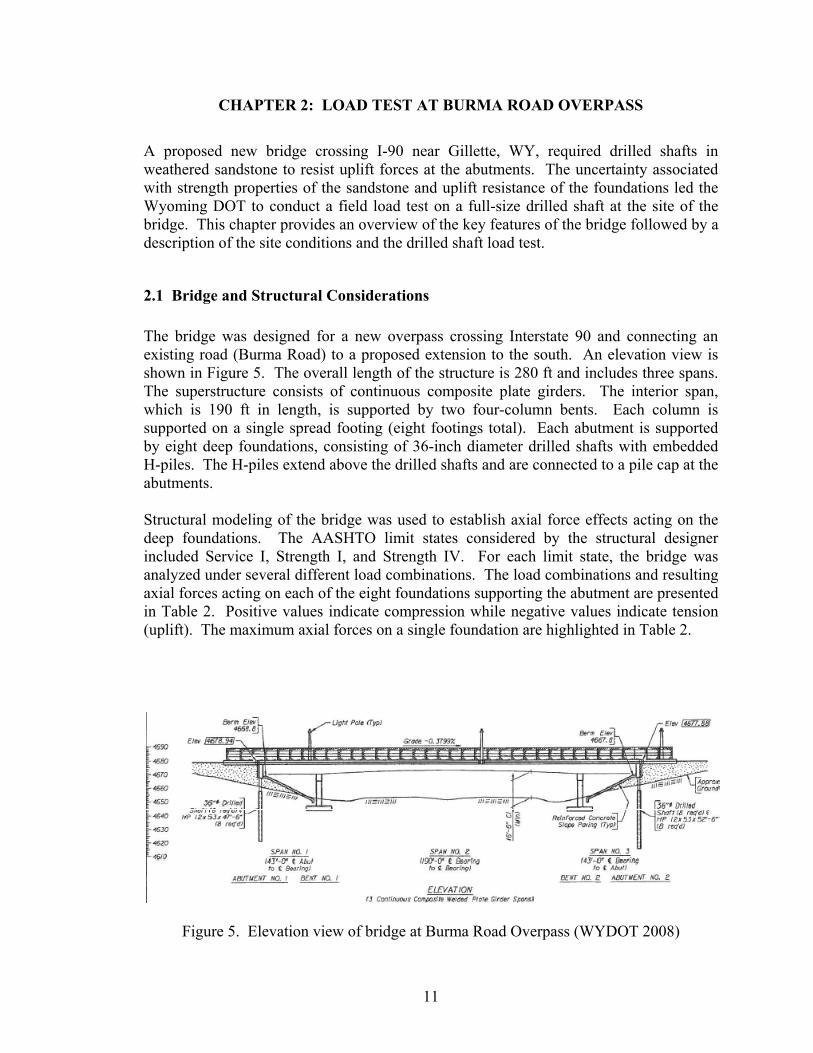
The bridge was designed for a new overpass crossing Interstate 90 and connecting an existing road (Burma Road) to a proposed extension to the south. An elevation view is shown in Figure 5. The overall length of the structure is 280 ft and includes three spans. The superstructure consists of continuous composite plate girders. The interior span, which is 190 ft in length, is supported by two four-column bents. Each column is supported on a single spread footing (eight footings total). Each abutment is supported by eight deep foundations, consisting of 36-inch diameter drilled shafts with embedded H-piles. The H-piles extend above the drilled shafts and are connected to a pile cap at the abutments. Structural modeling of the bridge was used to establish axial force effects acting on the deep foundations. The AASHTO limit states considered by the structural designer included Service I, Strength I, and Strength IV. For each limit state, the bridge was analyzed under several different load combinations. The load combinations and resulting axial forces acting on each of the eight foundations supporting the abutment are presented in Table 2. Positive values indicate compression while negative values indicate tension (uplift). The maximum axial forces on a single foundation are highlighted in Table 2.
Figure 5. Elevation view of bridge at Burma Road Overpass (WYDOT 2008)

12
For foundation design, the following forces will govern: Service I: Factored axial compression = 86.1 kips (Piles 1 and 8, Load Case 2) Factored axial uplift = 84.8 kips (Piles 1 through 8, Load Case 3) Strength I: Factored axial compression = 61.2 kips (Piles 1 and 8, Load Case 4) Factored axial uplift = 162.5 kips (Piles 2 and 7, Load Case 3) Axial force effects for the Strength IV limit state are less than those listed above for Strength I, and therefore do not require further consideration (i.e., Strength I governs the foundation design). In Chapter 3, the axial forces given above are used to illustrate the application of LRFD design methods to the foundations for the bridge at Burma Road Overpass. Table 2. Results of Structural Modeling: Foundation Force Effects
(Data from B. Rentner, WYDOT Bridge)
Load Description
1
2
3
4
5 [ live load ]
6 live load
Load Pile 1 Pile 2 Pile 3 Pile 4 Pile 5 Pile 6 Pile 7 Pile 8 1 40.122 28.002 36.513 34.385 34.385 36.513 28.002 40.122 278.044
2 86.133 38.907 62.957 57.071 57.071 62.957 38.907 86.133 490.136
3 ‐84.779 ‐84.779 ‐84.779 ‐84.779 ‐84.779 ‐84.779 ‐84.779 ‐84.779 ‐678.232
4 ‐7.988 ‐7.988 ‐7.988 ‐7.988 ‐7.988 ‐7.988 ‐7.988 ‐7.988 ‐63.904
5 ‐53.252 ‐53.252 ‐53.252 ‐53.252 ‐53.252 ‐53.252 ‐53.252 ‐53.252 ‐426.016
6 37.216 37.216 37.216 37.216 37.216 37.216 37.216 37.216 297.728
2+3+4 ‐6.634 ‐53.860 ‐29.810 ‐35.695 ‐35.695 ‐29.810 ‐53.860 ‐6.634 ‐251.998
Load Case Limit State DC DW LL+IM1 Strength IV 1.50
2 Strength IV 1.50 1.50
3 Strength I 1.25 1.50 1.75
4 Strength I 0.90 0.65 1.75
Load Case Pile 1 Pile 2 Pile 3 Pile 4 Pile 5 Pile 6 Pile 7 Pile 8 1 60.183 42.002 54.769 51.578 51.578 54.769 42.002 60.183 417.064
2 ‐9.951 ‐80.789 ‐44.715 ‐53.543 ‐53.543 ‐44.715 ‐80.789 ‐9.951 ‐377.996
3 ‐103.480 ‐162.512 ‐132.450 ‐139.807 ‐139.807 ‐132.450 ‐162.512 ‐103.480 ‐1076.498
4 61.154 18.651 40.295 34.999 34.999 40.295 18.651 61.154 310.198
Axial Force Effects (kips)Service Limit States I and IV:
Load 2 + Load 3 + Load 4 + Load 6
Strength Limit States: Load Combinations and Load Factors
Description
Load 1
Load 2 + Load 3 + Load 4
Load 2 + Load 3 + Load 4 + Load 5
Service I Limit State: Axial Force Effects (kips)
Items in brackets [ ] indicate uplift
Cap Weight + Lower Portion of Wingwalls
Cap Weight + Wingwalls + Diaphragm + [Girder Weight + Cross‐Frames + Stay‐in‐Place Forms]
[ deck + curbs + traffic rail + pedestrian safety fence + drain system ]
[ future wearing surface ]

13
A notable outcome of the structural analysis is that uplift force effects are the dominant design consideration for the abutment foundations. Design of drilled shafts founded in rock under uplift means that a single component of resistance, side resistance, must be relied upon, in contrast to compression for which both side and base resistances are mobilized. This reliance on side resistance makes it important for the designer to have reliable estimates of unit side resistance for the rock. This was the primary consideration that led WYDOT Bridge and Geology personnel to consider conducting a foundation load test for this project.
2.2 Site Conditions
Subsurface conditions are described in an internal WYDOT memo from R. Johnson, Engineering Geologist (WYDOT 2008), referred to herein as “Foundation Memo”. Bedrock in the area is Tertiary Wasatch Formation, described as “drab sandstone and drab to variegated claystone” (Love and Christiansen 1985). Based on four borings made at the site the subsurface consists of “up to 67 ft of very dense, poorly cemented slightly moist sandstone to very dense, poorly cemented silty sandstone”. Occasional blue-gray clay lenses were encountered, ranging in thickness from 0.5 to 1 foot. All of the gomaterials are believed to be derived from weathering of the Wasatch Formation. Unweathered bedrock was not observed in any of the borings. Figure 6 shows a portion of the boring log sheet showing subsurface profiles at two borings located on the north side of the bridge. The north abutment of the bridge is approximately mid-way between the two borings. The boring on the left, at Station 19+10, is believed to be most representative of the load test location. Information shown on the log includes drivepoint penetration values (in blows per foot) from the surface to elevation 4,646 ft (borehole depth = 17 ft). The drivepoint test involved a 140-lb hammer with a 30-inch drop height acting on a 2-inch diameter conical penetrometer. At depth = 17 ft, the blows per foot exceeded 300 at which point driving was terminated. There is no reliable correlation between the strength of sandstone and the drivepoint resistance. However, refusal can be indicative of stronger, less weathered rock, while the material above this depth is indicative of cemented soil-like material. Below this depth the Standard Penetration Test (SPT) was conducted and the values shown represent the number of blows per foot (N), or, if the number of blows exceeds 100, the distance of penetration. For example, 100/10" represents 100 blows over a penetration of 10 inches. Achieving 100 blows in less than 1 ft of penetration is considered refusal. The values shown range from N = 85 to refusal, which is indicative of weak rock or strongly cemented soil. Beginning at elevation 4,220 ft (borehole depth = 43 ft) rock coring was initiated. On the boring log, numbers below this depth indicate core samples and percent recovery. As can be observed, rock core runs numbered 4 through 10 show percent recovery ranging from zero (no recovery) to 50% with a mean value of 20%. Rock Quality Designations (RQD), for the core runs with sufficient recovery, range from zero to 10%. Taken at face value, these low values of recovery and RQD are considered indicative of ‘very poor’

14
Figure 6. Boring logs along the northern alignment of Burma Road Overpass
(WYDOT 2008) rock mass. Alternatively, this may suggest that the weathered sandstone is highly prone to disturbance caused by the coring operation and that percent recovery and RQD are not meaningful parameters for assessing the in-situ behavior of these materials for foundation design. As noted in the next section, excavation for drilled shaft construction produced a competent borehole with no observed caving or other signs of instability. Very few of the samples obtained using the split spoon sampler with the Standard Penetration Test or from rock coring were adequate for performing laboratory strength tests. In Boring 19+10 a single value of undrained shear strength is reported for core run No. 8., corresponding to borehole depth interval = 63 to 68 ft. The undrained shear strength cu = 7.2 kips/ft2. In the borehole at Station 19+85 two samples of rock were tested in uniaxial compression, corresponding to core runs No. 22 and No. 23. From the boring log it can be seen that core run No. 22 is located in weathered poorly cemented sandstone and this sample yielded qu = 5.5 kips/ft2. Core run No. 23 is shown as corresponding to gray, sandy clay shale and yielded qu = 17.1 kips/ft2. Several points are noted regarding the available strength values. First, the number of measurements is small and does not lend itself to statistical evaluation by parameters such as mean and standard deviation. Second, the reported values vary over a wide range and correspond to different materials (sandstone versus clay shale) making it difficult to select design values of strength applicable to evaluation of side resistance over the full length of a drilled shaft. Third, the low recovery rates observed in most of the core runs raise the question of sample disturbance. Combined with the low number of intact test specimens, it is difficult to assess the degree to which sample disturbance may have affected the measured strengths.
15
The values of uniaxial compressive strength, 5.5 ksf and 17.1 ksf, fall in a range that straddles the boundary between soil and rock. Compressive strength of qu = 5.5 ksf falls in a range that corresponds to ‘very stiff’ when applied to cohesive soils, while qu = 17.1 corresponds to ‘very weak’ rock. Since sandstone is the predominant material providing side and base resistance of the drilled shaft at the test site, it could be argued that design methods based on treating the weathered sandstone as soil may be most appropriate. This issue is considered further in Chapter 3. In summary, the subsurface investigation provides useful information on the site stratigraphy and overall conditions (weakly cemented sandstone with interbedded shale layers), but somewhat ambiguous information that can be used for selection of strength parameters of the subsurface materials for foundation design. Data on the uniaxial compressive strength of the sandstone is limited to a single value corresponding to a sample depth that is below the base of the test shaft. This topic is considered further in Chapter 3 of this report. This uncertainty in the selection of appropriate strength values was an additional factor supporting the decision to conduct a foundation load test.
2.3 Test Shaft Installation
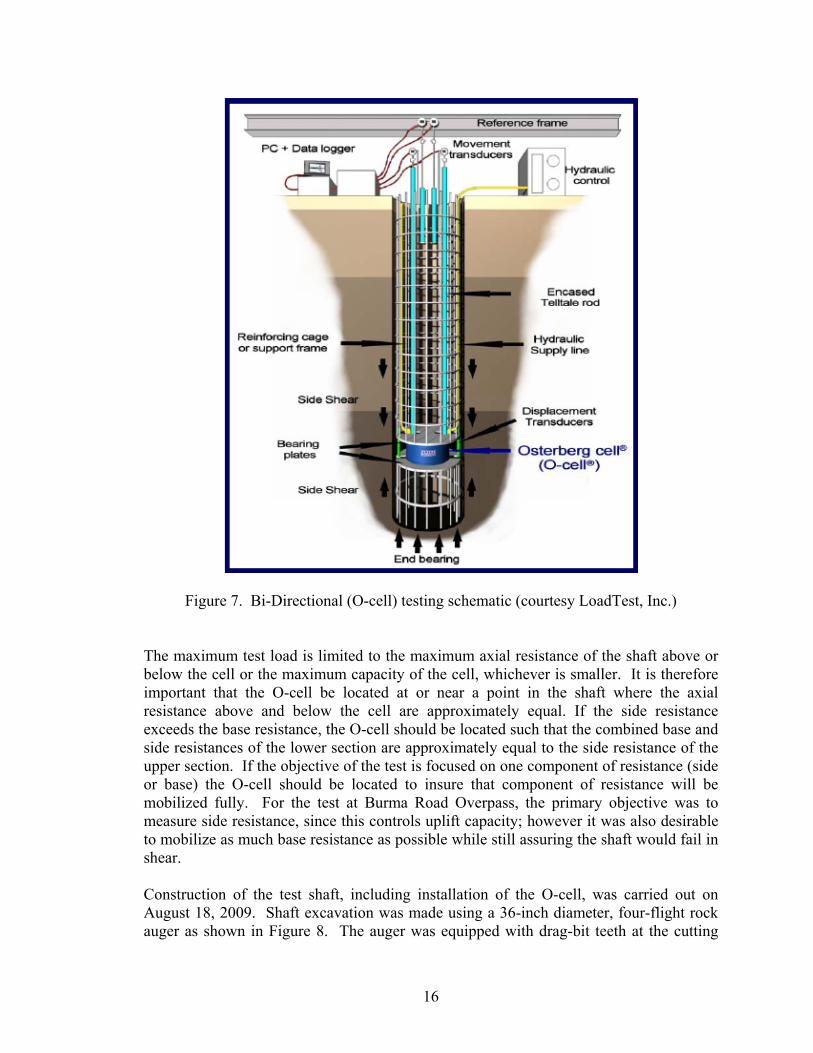
A single drilled shaft was constructed for the purpose of conducting a field load test. The objective of the test was to make direct measurements of side and base resistances considered to be representative of those expected in the drilled shafts supporting the abutments of the bridge at Burma Road Overpass. The load test was conducted using the Osterberg load cell (commonly referred to as the O-cell test). This method involves bi-directional loading of a drilled shaft. Force is applied to the shaft by means of an embedded hydraulic jacking system. The expendable jack is sandwiched between steel plates and cast within the test shaft. The portion of the shaft above the O-cell provides a reaction for loading against the portion below the O-cell and vice versa, thus eliminating the need for a separate structural reaction system. A schematic diagram of the O-cell loading system is shown in Figure 7. The O-cell loading system is provided in the U.S. exclusively by Loadtest, Inc. After a shaft has been cast and the concrete has been allowed to gain sufficient strength for testing, the O-cell is pressurized to break the tack weld holding the cell together and to “crack” the shaft into an upper and a lower portion. Pressure is then applied incrementally to load the upper and lower shaft sections. During the test, upward and downward movements of each section of the shaft are also measured and recorded, enabling the calculation of a load-displacement curve. Strain gages attached to ‘sister bars’, or sections of rebar embedded in the shaft, make it possible to calculate the axial force at the strain gage locations, thus providing numerical values of load transfer and average side resistance over portions of the shaft between strain gage elevations.
16
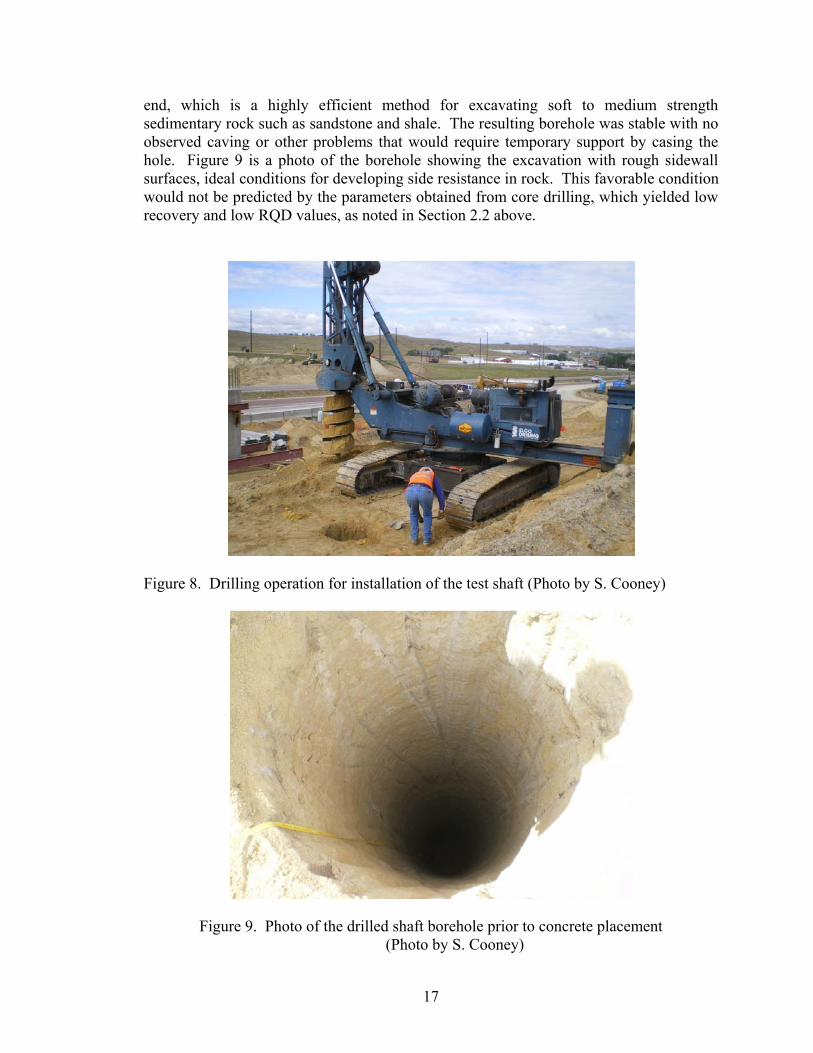
Figure 7. Bi-Directional (O-cell) testing schematic (courtesy LoadTest, Inc.) The maximum test load is limited to the maximum axial resistance of the shaft above or below the cell or the maximum capacity of the cell, whichever is smaller. It is therefore important that the O-cell be located at or near a point in the shaft where the axial resistance above and below the cell are approximately equal. If the side resistance exceeds the base resistance, the O-cell should be located such that the combined base and side resistances of the lower section are approximately equal to the side resistance of the upper section. If the objective of the test is focused on one component of resistance (side or base) the O-cell should be located to insure that component of resistance will be mobilized fully. For the test at Burma Road Overpass, the primary objective was to measure side resistance, since this controls uplift capacity; however it was also desirable to mobilize as much base resistance as possible while still assuring the shaft would fail in shear. Construction of the test shaft, including installation of the O-cell, was carried out on August 18, 2009. Shaft excavation was made using a 36-inch diameter, four-flight rock auger as shown in Figure 8. The auger was equipped with drag-bit teeth at the cutting
17
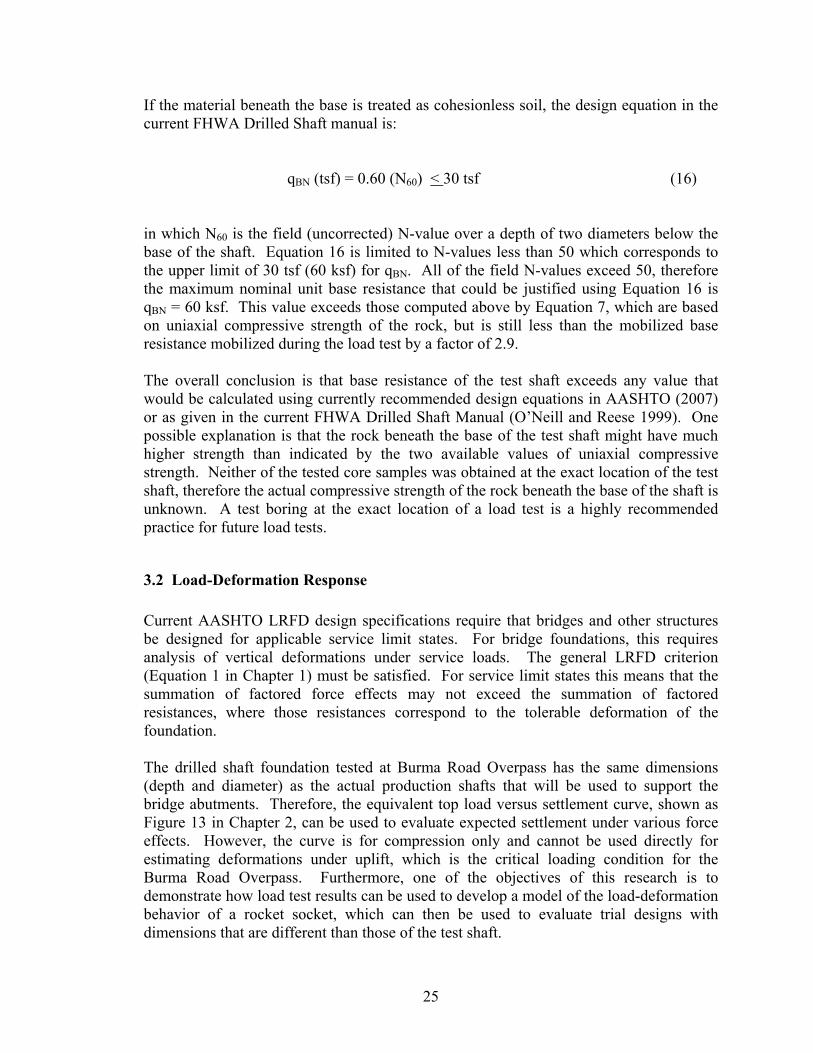
end, which is a highly efficient method for excavating soft to medium strength sedimentary rock such as sandstone and shale. The resulting borehole was stable with no observed caving or other problems that would require temporary support by casing the hole. Figure 9 is a photo of the borehole showing the excavation with rough sidewall surfaces, ideal conditions for developing side resistance in rock. This favorable condition would not be predicted by the parameters obtained from core drilling, which yielded low recovery and low RQD values, as noted in Section 2.2 above.
Figure 8. Drilling operation for installation of the test shaft (Photo by S. Cooney)
Figure 9. Photo of the drilled shaft borehole prior to concrete placement (Photo by S. Cooney)

18
The reinforcing cage was fabricated on site and the O-cell was attached to the bottom of the cage by personnel from Loadtest, Inc. and the general contractor. Figure 10 shows the rebar cage with the O-cell attached to its base as it was being transported to the borehole. The holes in the upper and lower plates of the O-cell apparatus are intended to allow fluid concrete to flow around the O-cell. The steel plates are 2 inches thick. The rebar cage consists of eleven No. 9 longitudinal bars with No. 3 spirals on a 4-inch pitch. The base of the O-cell is 7 ft above the base of the shaft. This location was chosen on the basis of preliminary estimates of side and base resistance to assure the shaft would fail by reaching the limiting side resistance of the section above the O-cell while still mobilizing significant base resistance in the portion below the O-cell. The top elevation of the test shaft is 4,661 feet. Strain gages were placed on sister bars at two locations along the rebar cage. One is at a depth of 22 feet (S.G. Level 1) and the other is at a depth of 12 feet (S.G. Level 2). The bottom of the O-cell is at a depth of 34 feet and the tip of the shaft is at a depth of 41 feet (elevation = 4,620 feet). When the borehole was excavated to the target depth of 41 feet, fluid concrete was placed into the bottom 7 feet of the shaft. The reinforcing cage and O-cell apparatus were then lowered into the excavation while suspended from a crane. Figure 11 shows the suspended cage while concrete was being placed by pump truck into the lower portion of the shaft. Once the cage was in place concrete was placed by tremie up to the ground surface to complete the test shaft.
Figure 10. Test shaft reinforcing cage with attached O-cell (Photo by S. Cooney)

19
Figure 11. Concrete placement in the bottom of the shaft prior to placement of the reinforcing cage (Photo by S. Cooney)
2.4 Load Test and Results
The load test was conducted on September 2, 2009, by personnel from Loadtest, Inc. WYDOT Geology and Bridge personnel were present to observe the test, as was the author. Test results are presented in a report provided by Loadtest, Inc. (Loadtest, Inc. 2009). The maximum bi-directional sustained force applied to the test shaft was 1,457 kips and corresponded to the maximum resistance provided by the upper section of the shaft, as anticipated. At this load, the downward movement of the O-cell base was 0.74 inches and the upward displacement was 2.18 inches. The calculated unit side resistance averaged over the upper section of the shaft (from the O-cell to the ground surface) is 4.4 kips/ft2. At the maximum load, the mobilized base resistance is estimated to be 171 kips/ft2. Load displacement behavior of the shaft can be displayed in two ways. Figure 12 shows the O-cell load versus upward displacement of the upper portion of the shaft and load versus downward movement of the lower part of the shaft. These curves represent the actual measured behavior and are used to calculate mobilized side and base resistances. In this case, the peak side resistance of the upper section appears to have been reached. The resistance of the lower portion of the shaft has not been mobilized fully.

20
Figure 12. Load-displacement curve from O-cell test (Loadtest, Inc. 2009)
Second, by adding values of load at common values of displacement (upward and downward) it is possible to construct a “Equivalent Top Load versus Settlement Curve” from the O-cell test results. This curve, shown in Figure 13, represents an approximation of the load-settlement behavior of the test shaft subject to an axial compressive force applied at the top of the shaft. Two curves are shown, one using the actual values of displacement measured during the O-cell test and a second curve that accounts for the elastic compression of the concrete shaft expected to occur during top-down loading. Strain gage measurements allow the average unit side resistance to be estimated over the depth intervals between strain gages and between the O-cell and S.G. Level 1. Figure 14 shows curves of mobilized unit shearing resistance (kips/ft2) versus upward movement of the shaft above the O-cell. Table 3 summarizes the maximum observed values of unit side resistance for the three depth intervals and the unit side resistance averaged over the upper portion of the shaft. Table 3. Summary of Mobilized Unit Side Resistances
(Data from Loadtest, Inc. 2009)
Depth IntervalUpward Displacement
(inches)
Mobilized Unit Side
Resistance (kips/ft2
O‐cell to Ground Surface (average) 2.13 4.4
S.G. Level 2 to Ground Surface 2.10 5.0
S.G. Level 1 to S.G.Level 2 2.13 4.5
O‐cell to S.G. Level 1 2.16 3.8

21
Figure 13. Equivalent top load versus settlement curve, Burma Road Overpass
(Loadtest, Inc. 2009)
Figure 14. Mobilized unit side resistance versus displacement curves (Loadtest, Inc. 2009)

22
CHAPTER 3: APPLICATION TO ROCK SOCKET DESIGN
3.1 Evaluation of Drilled Shaft Resistances
In Chapter 1 design equations were presented for calculating nominal values of side and base resistance for drilled shafts in rock. In each case, the equations depend on measured values of uniaxial compressive strength of intact core specimens. It was noted in Chapter 2 that a very limited number of intact specimens were available for uniaxial compression testing. Despite this limitation, the load test results provide an opportunity to compare measured values of resistance to resistances calculated by the design equations.
3.1.1 Side Resistance Nominal unit side resistance for shafts in rock is evaluated by the following expression (Equation 4 in Chapter 1):
a
u
a
SN
p
qC
p
f (4)
in which qu = mean value of uniaxial compressive strength for the rock layer, pa = atmospheric pressure in the same units as qu (e.g. 2.116 ksf), and C = a regression coefficient used to analyze load test results. It was noted in Chapter 1 that the mean value of the coefficient C is approximately equal to 1.0 for “normal” rock, defined as rock which can be excavated using conventional drilling tools while remaining stable. The excavation for the test shaft clearly fits this definition. In Chapter 2 it was noted that uniaxial compressive strength of the sandstone is limited to a single value measured on an intact specimen obtained by rock coring in Boring 19+85 over the elevation interval of 4,613 ft to 4,618 feet. The base of the test shaft is at elevation 4,620 feet. The uniaxial compressive strength of the specimen qu = 5.5 ksf. Substituting this value into Equation 4 yields the following:
612.1116.2
5.50.1
116.2SNf
(14)
fSN = 2.116 ksf (1.612) = 3.41 ksf (15) All of the measured side resistance values for various intervals of the shaft, as presented in Table 3, exceed the side resistance predicted above in Equation 15. This very limited data suggests that side resistance calculated using Equation 4 provides a safe value of nominal side resistance for design. It is also noted that the calculated value of fSN

23
exceeds the value actually used to design the drilled shafts at Burma Road Overpass, which is 2 ksf, as recommended in the Foundation Memo (WYDOT 2008). Alternatively, a value of C = 1.29 would correctly predict the average measured unit side resistance (4.4 ksf). For comparison, the average value of qu given in the Foundation Memo, denoted as “Average Uniaxial Compressive Strength”, qu = 11.3 ksf, can be used with Equation 4 and C = 1. This calculation yields a design unit side resistance of 4.89 ksf, which is in close agreement with the measured values presented in Table 3. This ‘average’ value of qu is based on two measured values (5.5 ksf and 17.1 ksf) which is not a statistically valid mean. This comparison, therefore, should be considered as an exercise and not a rigorous test of the design equation. The higher of the two strength values (17.1 ksf) was measured on a rock core specimen of shale, which is not the predominant rock type along the side of the test foundation. The comparisons presented above between side resistance values measured in the load test and those predicted using current design equations suggest that Equation 4 with the recommended value of C = 1.0 provides a valid tool for designing drilled shafts in rock when it is possible to obtain specimens of rock core that are suitable for conducting uniaxial compression tests. The data that support this conclusion are quite limited, but nevertheless show good agreement with the load test results at Burma Road Overpass. An important caveat is that the shaft excavation at the test site was stable, fitting the definition of a ‘normal’ rock socket, despite the observation that core recovery and RQD values indicated a poor quality rock mass. A alternative approach to evaluation of side resistance in geomaterials that exhibit characteristics of both soil and rock is to utilize measured N-values from the Standard Penetration Test (SPT). Both borings in the vicinity of the test shaft (Borings 19+10 and 19+85) include N-values to depths that cover the depth range of the test shaft. The equations used to compute values of unit side resistance from N-values are presented in Chapter 1 (see Equations 11 through 13, referred to as the beta-method). Values of unit side resistance fSN calculated by these equations are tabulated in Table 4 below. All of the data points correspond to depths that are above the tip elevation of the test shaft. The mean value of side resistance from the six available data points is fSN = 4.6 ksf. This value is remarkably close to the average measured unit side resistance over the shaft depth of 4.4 ksf. This exercise strongly suggests that N-values provide an alternative means to calculating design values of unit side resistance for weak rock in which Standard Penetration Testing is possible. An important point to note is that the beta method, as applied above, was not developed for use with cemented sands. One reason for this limitation is the lack of useful data (load tests) on drilled shafts in cemented materials. However, at least for the conditions at Burma Road Overpass, the method appears to have merit in sandstone that is weathered to a degree that makes it possible to obtain N-values.

24
Table 4. Unit Side Resistances from Field N-Values
3.1.2 Base Resistance The mobilized unit base resistance during the O-cell test is estimated to be 171 kips per square foot (Loadtest Inc., 2009). From Figure 11 (Chapter 2) it can be observed that the load-deformation behavior of the section of drilled shaft below the O-cell is approximately linear up to the maximum load applied in the test. There is no sign of yielding or that a limiting value of base resistance was developed. For design of the production shafts a value of qBN = 40 ksf was used, as recommended in the Foundation Memo. The mobilized value of qB = 171 ksf can also be compared to values predicted by design equations. In Chapter 1, the following equation was presented for calculating nominal base resistance of drilled shafts in competent rock:
ucrBN qNq * (7) in which qBN = nominal unit base resistance, Ncr
* = a bearing capacity factor for rock and qu = uniaxial compressive strength of intact rock over a depth interval of two shaft diameters below the base of the shaft. As shown in Figure 2 (Chapter 1) data from load tests to failure yield a mean value of Ncr
* = 3.38. A lower bound value of Ncr* = 2.5
incorporates most of the points shown in Figure 2 and is recommended for design when it can be verified that the base of the shaft is free of loose debris and is underlain by competent rock. It was noted further that higher values of Ncr
* are clearly possible, but that they should be verified by load testing before being used in design. Values of uniaxial compressive strength are limited to the two values noted previously: qu = 5.5 ksf for a single specimen of sandstone and qu = 17.1 ksf for a single specimen of shale. Using Equation 7 with Ncr
* = 2.5, this yields nominal bases resistance values of 13.8 ksf and 42.8 ksf, respectively. Regardless of which value is used, the mobilized unit base resistance of 171 ksf exceeds the computed nominal values by a substantial margin. The measured resistance is a lower-bound value because the full base resistance was not reached. In fact, the value of Ncr
* that would correspond to the mobilized base resistance is Ncr
* = 31.0 for qu = 5.5 ksf and Ncr* = 10.0 for qu = 17.1 ksf.
Boring
Sample
No.
Elevation
(ft)
Depth
(ft)v' (psf) N‐value Beta f SN (psf)
19+10 1 4,644.0 19.0 2,280 85 2.02 4,597
19+10 2 4,634.0 29.0 3,480 100 1.63 5,677
19+85 12 4,647.0 4.0 480 71 6.06 2,909
19+85 14 4,642.0 9.0 1,080 92 3.81 4,116
19+85 16 4,637.0 14.0 1,680 100 2.81 4,726
19+85 19 4,628.0 23.0 2,760 100 1.94 5,635
Mean: 4,610
25
If the material beneath the base is treated as cohesionless soil, the design equation in the current FHWA Drilled Shaft manual is: qBN (tsf) = 0.60 (N60) < 30 tsf (16) in which N60 is the field (uncorrected) N-value over a depth of two diameters below the base of the shaft. Equation 16 is limited to N-values less than 50 which corresponds to the upper limit of 30 tsf (60 ksf) for qBN. All of the field N-values exceed 50, therefore the maximum nominal unit base resistance that could be justified using Equation 16 is qBN = 60 ksf. This value exceeds those computed above by Equation 7, which are based on uniaxial compressive strength of the rock, but is still less than the mobilized base resistance mobilized during the load test by a factor of 2.9. The overall conclusion is that base resistance of the test shaft exceeds any value that would be calculated using currently recommended design equations in AASHTO (2007) or as given in the current FHWA Drilled Shaft Manual (O’Neill and Reese 1999). One possible explanation is that the rock beneath the base of the test shaft might have much higher strength than indicated by the two available values of uniaxial compressive strength. Neither of the tested core samples was obtained at the exact location of the test shaft, therefore the actual compressive strength of the rock beneath the base of the shaft is unknown. A test boring at the exact location of a load test is a highly recommended practice for future load tests.
3.2 Load-Deformation Response
Current AASHTO LRFD design specifications require that bridges and other structures be designed for applicable service limit states. For bridge foundations, this requires analysis of vertical deformations under service loads. The general LRFD criterion (Equation 1 in Chapter 1) must be satisfied. For service limit states this means that the summation of factored force effects may not exceed the summation of factored resistances, where those resistances correspond to the tolerable deformation of the foundation. The drilled shaft foundation tested at Burma Road Overpass has the same dimensions (depth and diameter) as the actual production shafts that will be used to support the bridge abutments. Therefore, the equivalent top load versus settlement curve, shown as Figure 13 in Chapter 2, can be used to evaluate expected settlement under various force effects. However, the curve is for compression only and cannot be used directly for estimating deformations under uplift, which is the critical loading condition for the Burma Road Overpass. Furthermore, one of the objectives of this research is to demonstrate how load test results can be used to develop a model of the load-deformation behavior of a rocket socket, which can then be used to evaluate trial designs with dimensions that are different than those of the test shaft.

26
The model presented in Appendix A, developed by Kulhawy and Carter (1992) provides a rational interpretation of load test results in which the load-deformation response is idealized as consisting of three distinct regions: linear elastic, full slip, and nominal total resistance, as illustrated in Figure 4 (Chapter 1). To model the results of a load test, the slopes of various portions of the measured load-settlement curve are used to calculate values of the rock mass strength and stiffness properties, as illustrated in Figure 15. The equations relating the curve parameters (consisting of slopes S1, S2, and S3 and the intercept Qi) to the strength and stiffness properties of the rock are as follows:
E
LS S (17)
E
BS (18)
tan · tanψ S S
S S (19)
2ζ tan · tanψ 1 Q
BL (20)
ζ ln 5 1 ν L
B (21)
Figure 15. Interpretation of a compression load test on a complete rock socket
(Kulhawy and Carter 1992)
27
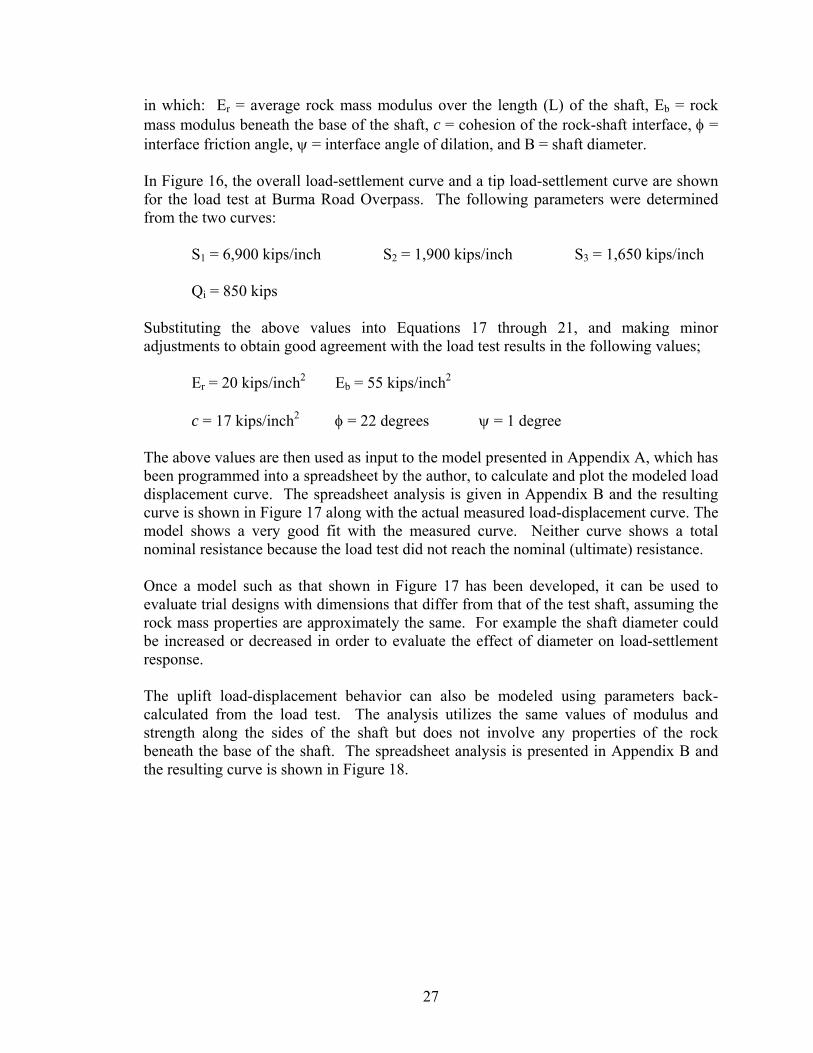
in which: Er = average rock mass modulus over the length (L) of the shaft, Eb = rock mass modulus beneath the base of the shaft, c = cohesion of the rock-shaft interface, = interface friction angle, = interface angle of dilation, and B = shaft diameter. In Figure 16, the overall load-settlement curve and a tip load-settlement curve are shown for the load test at Burma Road Overpass. The following parameters were determined from the two curves: S1 = 6,900 kips/inch S2 = 1,900 kips/inch S3 = 1,650 kips/inch Qi = 850 kips Substituting the above values into Equations 17 through 21, and making minor adjustments to obtain good agreement with the load test results in the following values; Er = 20 kips/inch2 Eb = 55 kips/inch2 c = 17 kips/inch2 = 22 degrees = 1 degree The above values are then used as input to the model presented in Appendix A, which has been programmed into a spreadsheet by the author, to calculate and plot the modeled load displacement curve. The spreadsheet analysis is given in Appendix B and the resulting curve is shown in Figure 17 along with the actual measured load-displacement curve. The model shows a very good fit with the measured curve. Neither curve shows a total nominal resistance because the load test did not reach the nominal (ultimate) resistance. Once a model such as that shown in Figure 17 has been developed, it can be used to evaluate trial designs with dimensions that differ from that of the test shaft, assuming the rock mass properties are approximately the same. For example the shaft diameter could be increased or decreased in order to evaluate the effect of diameter on load-settlement response. The uplift load-displacement behavior can also be modeled using parameters back-calculated from the load test. The analysis utilizes the same values of modulus and strength along the sides of the shaft but does not involve any properties of the rock beneath the base of the shaft. The spreadsheet analysis is presented in Appendix B and the resulting curve is shown in Figure 18.

28
Figure 16. Complete and base load versus settlement curves from O-cell test
Figure 17. Measured (in red) and modeled load versus settlement curve for drilled shaft at Burma Road Overpass
0
500
1000
1500
2000
2500
3000
0.00 0.25 0.50 0.75 1.00 1.25 1.50 1.75 2.00
Axi
al L
oad
(ki
ps)
Displacement (inches)
Tip Load-Settlement Curve,O-cell Test
Complete Load-Settlement Curve, O-cell Test
0
500
1000
1500
2000
2500
3000
0.00 0.25 0.50 0.75 1.00 1.25 1.50 1.75 2.00
Axi
al L
oad
(ki
ps)
Displacement (inches)
Complete SocketL = 41 ftB = 3 ftEr = 20 k/in2
Eb = 55 k/in2r = 0.25b = 0.30
Load-Settlement Curve, O-cell TestLoadtest, Inc., 2009

29
Figure 18. Modeled uplift load-displacement curve
3.3 Application of Results to LRFD Design of Drilled Shafts
The load test results, including the measured and modeled load displacement curves, can be used to perform limit state checks for the drilled shaft design at Burma Road Overpass. For each applicable limit state, the basic LRFD inequality (Equation 1) must be satisfied; this constitutes a ‘check’. The applicable limit states identified by the Bridge Engineer include Strength I, Strength IV, and Service I. Since the Strength I force effects are greater than the Strength IV force effects, checks are conducted for Strength I only. For each limit state, checks are conducted for both compression and uplift. Each case is described below. Strength I For the Strength I compression case, resistances will be the values reported by Loadtest, Inc. (2009). The net side resistance above the O-cell is reported to be 1,420 kips. The side resistance below the O-cell is estimated to be 246 kips. These values are added to obtain the nominal side resistance of 1,666 kips. The mobilized base resistance is estimated to be 1,211 kips. This value does not correspond to a nominal (ultimate) resistance; however it will be used in this analysis because it is the maximum value of base resistance that can be verified. The limit state check is conducted as follows:
0
500
1000
1500
2000
2500
3000
0.00 0.25 0.50 0.75 1.00 1.25 1.50 1.75 2.00
Axi
al L
oad
(ki
ps)
Displacement (inches)
Shear Socket in UpliftL = 41 ftB = 3 ftEr = 20 k/in2
r = 0.25

30
Strength I Factored Force Effect (compression) = 61.2 kips (Piles 1 and 8, Load Case 4) As noted above, the nominal side resistance RSN = 1,666 kips and nominal base resistance RBN = 1,211 kips. The resistance factor specified by AASHTO (2007) for all strength limit states in which the resistance is based on a load test is = 0.7. Applying Equation 1:
iiiii RQ (1)
61.2 kips < 0.70 (1,666) + 0.70 (1,211 kips) (22) 61.2 kips < 2,013.9 kips √ (23) The LRFD inequality is satisfied and the drilled shaft design therefore satisfies the Strength I Limit State criterion for compression (i.e., checks). For uplift: Strength I Factored Force Effect (uplift) = 162.5 kips (Piles 2 and 7, Load Case 3) The nominal side resistance in uplift RSN = 1,666 kips and nominal base resistance in uplift RBN = 0. The resistance factor specified by AASHTO (2007) for all strength limit states in which the resistance is based on a load test, for uplift is = 0.6. Applying Equation 1: 162.5 kips < 0.60 (1,666) + 0 (24) 162.5 kips < 999.6 kips √ (25) The LRFD inequality is satisfied and the drilled shaft design therefore satisfies the Strength I Limit State criterion for uplift (√). Results of the Strength I limit state checks are summarized in Table 5 Table 5. Summary of Strength I Limit State Check, Drilled Shaft, B = 3 ft, L = 41 ft
Service I The bi-directional load test conducted at Burma Road Overpass was used to develop an equivalent top load versus displacement curve for axial compression, shown as Figure 13 in Chapter 2. Since the test shaft has the same dimensions as the production shafts, this
Factored Axial Force Effect
(kips)
Nominal Side
Resistance,
RSN (kips)
Resistance
Factor, S
Factored Side
Resistance
(kips)
Nominal Base
Resistance,
RSN (kips)
Resistance
Factor, B
Factored Base
Resistance
(kips)
Factored Resistances
(kips)
Factored Force Effects
< Factored Resistances ?
Compression 61.2 1,666.0 0.70 1166.2 1,211.0 0.70 847.7 2013.9 √
Uplift 162.5 1,666.0 0.60 999.6 0 0 0 999.6 √

31
curve can be used directly to perform a service limit state check for compression, as follows. For illustrative purposes only, it will be assumed that the Bridge Engineer has established a tolerable settlement of ½ inch for each drilled shaft foundation at the abutment, for both compression and uplift. From Table 2: Service I: Factored axial compression = 86.1 kips (Piles 1 and 8, Load Case 2) Entering Figure 13, the axial compressive resistance corresponding to ½ inch settlement is approximately equal to 1,850 kips. The resistance factor specified for Service I Limit State analysis is = 1.0. Applying Equation 1:
iiiii RQ (1)
86.1 kips < 1.0 (1,850 kips) (26) 86.1 kips < 1,850 kips √ (27) The LRFD inequality is satisfied and the drilled shaft design therefore satisfies Service I Limit State criterion for compression (√). In addition to the limit state check, it is useful to determine the expected settlement under the service force effect. From the compression load-settlement curve, the expected downward settlement under a force of 86.1 kips is approximately 0.014 inches. For uplift loading, Figure 18 is used to determine that the axial resistance corresponding to ½ inch of uplift displacement is approximately 1,060 kips. The limit state check is satisfied because the factored uplift force effect of 84.8 kips is well within the factored uplift resistance of 1,060 kips. Figure 18 can also be used to estimate the expected uplift displacement under the service force effect. For an uplift force of 84.8 kips the expected uplift displacement is approximately 0.016 inches, which is well within the tolerable deformation. Results of the Service I limit state check are summarized in Table 6. Table 6. Summary of Service I Limit State Check, Drilled Shaft, B = 3 ft, L = 41 ft
Factored Axial Force
Effect (kips)
Tolerable Vertical
Deformation
(inches)
Nominal Resistance
at Tolerable
Deformation (kips)
Resistance
Factor, S
Factored Resistances
(kips)
Factored Force Effects <
Factored Resistances ?
Expected
Deformation
Under Service I
Force Effect
Compression 86.1 0.5 1,850.0 1.00 1,850.0 √ .01 inch
Uplift 84.8 0.5 1,060.0 1.00 0.0 √ .02 inch
32
CHAPTER 4: CONCLUSIONS AND RECOMMENDATIONS
4.1 Conclusions
A bi-directional load test on a single drilled shaft at Burma Road Overpass provided a unique opportunity to evaluate design methods for rock-socketed foundations used to support highway bridges in Wyoming. The test foundation was constructed in weakly-cemented weathered sandstone. The full side resistance of the section of drilled shaft above the O-cell was mobilized and measured. This enabled the author to compare the measured unit side resistance to nominal values predicted by design equations given in current AASHTO and FHWA design codes. While the test did not result in mobilization of the full base resistance, a very high value of base resistance was measured and this also provides a lower bound value that is compared to values given by current design equations. The principal findings of this study are as follows.
1. Design equations based on N-values from the Standard Penetration Test provide nominal values of side resistance that are close to the measured average unit side resistance measured by the load test. The mean value of unit side resistance predicted using the ‘beta-method’ is fSN = 4.61 kf. The average measured value of unit side resistance from the load test is fS = 4.4 ksf. The equations upon which the nominal values are calculated involve several empirical relationships between N-values and soil properties. The method was developed for non-cemented sands and gravels, yet appears to provide a reasonable estimate of side resistance in the weakly-cemented sandstone encountered at the test site.
2. Evaluation of design equations for unit side resistance in rock was limited by the
inability to obtain intact core samples suitable for measuring the uniaxial compressive strength of the sandstone. Only two values of uniaxial compressive strength (qu) were obtained. Both specimens were taken from a boring that is not at the exact location of the test shaft and both were taken from an elevation that is lower than the base of the shaft. One of the core specimens was sandstone and yielded qu = 5.5 ksf, while the second core specimen was shale and yielded qu = 17.1 ksf. Nominal unit side resistance based on the strength of the single sandstone specimen yields fSN = 3.41 kf. Nominal unit side resistance based on the ‘average’ strength of the two specimens (sandstone and shale) yields fSN = 4.89 kf. While these nominal values fall within a range that agrees with the average measured unit side resistance (4.4 ksf) and with the range of values established for various depth intervals along the shaft (3.8 ksf to 5.0 ksf), it is not sufficient data upon which to base a strong conclusion.
3. All of the nominal side resistance values based on design equations are greater than the value used to design the drilled shafts (2 ksf) at Burma Road Overpass.
33
The load test was successful, therefore, in demonstrating that higher values of side resistance are justified than those currently being used by WYDOT for drilled shafts in weak rock.
4. Unit base resistance mobilized in the load test is estimated to be 171 ksf. This value exceeds by a significant amount the value of unit base resistance used to design the drilled shafts (40 ksf) as well as nominal values predicted using AASHTO and FHWA design equations. Unit base resistance (qBN) calculated from N-values yields qBN = 60 ksf. Equations that are based on uniaxial compressive strength of rock yield values of qBN ranging from 13.8 to 42.8 ksf. A possible reason for the much higher observed base resistance is that the sandstone below the base of the test shaft may be of much higher strength than the specimens tested in uniaxial compression. No specimens were obtained and tested at the exact location of the test shaft.
5. Modeling the load-displacement response of rock-socketed drilled shafts can be accomplished by fitting the results of a load test to an analytical model. The resulting model provides a powerful tool for evaluation of trial designs to satisfy AASHTO LRFD design criteria. The as-designed shafts at Burma Road overpass easily satisfy LRFD criteria for Strength I, Strength IV, and Service I limit state. Calculations illustrating limit state check for all applicable loading cases are presented in Chapter 3.
4.2 Recommendations
The load test conducted at Burma Road overpass demonstrates that realistic values of side resistance can be predicted using design equations published in current AASHTO and FHWA publications. The following are recommended: Side Resistance For subsurface conditions that permit Standard Penetration Testing (SPT) in granular geomaterials, nominal values of side resistance for design can be calculated using the beta-method as presented in Chapter 1 of this report. Granular geomaterials include all soils classified as clean sands and gravels, silty sands and gravels, as well as material described as rock, such as sandstone or conglomerate, which is weak and/or weathered to a degree that makes it possible to penetrate using SPT. For strata of rock which cannot be penetrated by SPT, rock coring and laboratory testing of intact cores to measure uniaxial compressive strength is recommended. Side resistance for design of rock sockets can then be established using Equation 4 presented in Chapter 1. At the Burma Road Overpass site, rock core samples were insufficient for this purpose, however, even the very limited test results, consisting of only a single value of qu for the sandstone, provide a unit side resistance that would result in a safe design

34
but which is more realistic and allows for higher side resistance than the design value actually used. Base Resistance Where Standard Penetration Testing is possible in cohesionless soils or in weathered sandstone, values of design unit base resistance (qBN) can be calculated using: qBN (tsf) = 0.60 (N60) < 30 tsf (16) This expression places an upper limit of 60 ksf on nominal unit base resistance and clearly underestimates the base resistance measured in the load test at Burma Road Overpass. Where SPT penetration is not possible, it is recommended to obtain intact cores in the zone of tip bearing and to perform uniaxial compression tests. In this case, the following expression is recommended: qBN = 2.5 qu (28) this corresponds to Equation 7 with N*cr = 2.5. This equation is limited to sites where the base is underlain by competent rock, as defined in Chapter 1. Where it is not possible to obtain intact core samples or to penetrate using SPT, load testing may be the most effective way to justify the use of higher values of base resistance, as demonstrated by the load test at Burma Road overpass. Finally it is recommended that WYDOT consider load testing of drilled shafts in rock in conjunction with future bridge projects. The information obtained from the load test at Burma Road Overpass shows that both side and base resistances far exceed the nominal values recommended in the Foundation Memo and actually used to design the drilled shafts for this project. Results of load testing conducted during the design phase would allow for the use of higher resistance factors and more cost-effective designs. Collection and analysis of multiple tests over time will certainly lead to more reliable designs for a wide range of geomaterials and could allow WYDOT to develop in-house calibrations for establishing resistance factors for specific geomaterials.

35
REFERENCES AASHTO (2007), AASHTO LRFD Bridge Design Specifications, Customary U.S. Units, 4th Ed., 1510 p. Horvath, R.G., and Kenney, T.C. (1979). "Shaft Resistance of Rock Socketed Drilled Piers," Proceedings, Symposium on Deep Foundations, ASCE, New York, pp. 182-214. Kulhawy, F.H. and Prakoso, W.A. (2007). “Issues in Evaluating Capacity of Rock Socket Foundations,” Proceedings, 16th Southeast Asian Geotechnical Conference, Southest Asian Geotechnical Society, Malaysia. Kulhawy, F.H., Prakoso, W.A., and Akbas, S.O. (2005). "Evaluation of Capacity of Rock Foundation Sockets," Alaska Rocks 2005, Proceedings, 40th U.S. Symposium on Rock Mechanics, G. Chen, S. Huang, W. Zhou and J. Tinucci, Editors, American Rock Mechanics Association, Anchorage, AK, 8 p. (on CD-ROM). Loadtest, Inc. (2009). “Report on Drilled Shaft Load Testing, TS-1 – Burma Road Overpass Gillette, Wyoming,” Project No. LT-9573, Prepared for S&S Builders by Loadtest, Incorporated, Gainesville, FL, 49 p. Love, J.D. and Christiansen, A.C. (1985). Geologic Map of Wyoming,U.S. Geological Survey. O'Neill, M.W., and Reese, L.C. (1999). "Drilled Shafts: Construction Procedures and Design Methods," Publication No. FHWA-IF-99-025, Federal Highway Administration, Washington, D.C., 758 p. Pells, P.J.N. and Turner, R.M. (1979). "Elastic Solutions for the Design and Analysis of Rock-Socketed Piles," Canadian Geotechnical Journal, Vol. 16, pp. 481-487. Prakoso, W.A. and Kulhawy, F.H. (2002). “Uncertainty in Capacity Models for Foundations in Rock,” Proceedings, 5th North American Rock Mechanics Symposium, Ed. R. Hammah et al. Toronto, pp. 1241-1248. Randolph, M.F., and C.P. Wroth, C.P. (1978). "Analysis and Deformation of Vertically Loaded Piles," Journal of the Geotechnical Engineering Division, ASCE, Vol. 104, No. GT12, pp. 1465-1488. Rowe, R.K. and Armitage, H.H. (1987). "A Design Method for Drilled Piers in Soft Rock," Canadian Geotechnical Journal, Vol. 24, pp. 126-142. Turner, J.P. (2006). NCHRP Synthesis 360: Rock-Socketed Shafts for Highway Structure Foundations, Transportation Research Board, National Research Council, Washington, D.C., 148 p.

36
WYDOT (2008). Memorandum Re: “Burma Road Overpass, Station 19 + 10 to Station 22 + 45”, from Robert Johnson, Engineering Geologist, to G. Frederick, P.E., State Bridge Engineer, dated January 2, 2008, 7 p. Zhang, L and Einstein, H.H. (1998). "End Bearing Capacity of Drilled Shafts in Rock," Journal of Geotechnical and Geoenvironmental Engineering, Vol. 124, No. 7, ASCE, pp. 574-584.

37
APPENDIX A: Model for Axial Load-Displacement Response of a Rock Socket
This approximate method, given by Kulhawy and Carter (1992), provides simple closed-form expressions that compare reasonably well to more sophisticated nonlinear finite element analyses reported by Pells and Turner (1979) and Rowe and Armitage (1987). The basic problem was depicted in Figure 4 and involves predicting the relationship between an axial compression load (Qc) applied to the top of a socketed shaft and the resulting axial displacement at the top of the socket (wc). The concrete shaft is modeled as an elastic cylindrical inclusion embedded within an elastic rock mass. The cylinder of depth L and diameter B has Young’s modulus Ec and Poisson’s ratio c. The rock mass surrounding the cylinder is homogeneous with Young’s modulus Er and Poisson’s ratio r while the rock mass beneath the base of the shaft has Young’s modulus Eb and Poisson’s ratio b. The solution (Figure 4b) approximates the load-deformation response of an axially loaded rock socket as consisting of two linear segments: (1) the initial linear elastic response and (2) the full slip condition. The maximum load is limited to the nominal axial resistance. For compression loading, two cases are treated by Kulhawy and Carter: (1) a “complete socket”, for which full contact is assumed between the base of the concrete shaft and the underlying rock, and: (2) a shear socket, for which a void is assumed to exist beneath the base. Uplift is also considered and was applied to analyze the test shaft under the expected uplift force effects at the overpass project. For illustrative purposes only the complete socket under compression case will be presented here. 1. For the linearly elastic portion of the load-displacement curve.
L
L
B
L
L
L
B
L
BG
Qw
b
b
r
cc
tanh221
1
4
tanh21
1
41
2
A-1 in which: wc = axial deformation (settlement)
2
2 22
B
LL
A-2
= ln [5(1 - r)L/B] A-3

38
= Ec/Gr A-4
Gr = Er/ [2(1 + r] = elastic shear modulus of rock mass A-5
= Gr/Gb A-6
Gb = Eb/ [2(1 + b] A-7
The magnitude of load transferred to the base of the shaft (Qb) is given by:
D
D
B
D
D
Q
Q
b
b
c
b
tanh221
1
4
cosh
11
1
4
A-8 2. For the full slip portion of the load–displacement curve.
BFBE
QFw
r
cc 43
A-9 in which:
F3 = a1(1BC3 - 2BC4) – 4a3 A-10
rE
caB
DDaF 2
34
2114 1
A-11
34
4,34,3 DD
DC
A-12
DBaaE
ED
b
rb 1,21,2132
4,3 exp41
A-13
2
4 21
2
2,1
A-14

39
4
2
1
B
E
Ea
r
c
A-15
BE
Ea
r
c
3
A-16
a1 = (1 + r) + a2 A-17
tantan2
1112 r
c
rc E
Ea
A-18
c
rc
E
Ea
tan23
A-19 The magnitude of load transferred to the base of the shaft (Qb) is given by:
cc
b
Q
cBPP
Q
Q 2
43
A-20 in which:
P3 = a1(1 - 2) B exp[(1 + 2)D] / (D4 – D3) A-21
P4 = a2(exp[2D] - exp[1D]) / (D4 – D3) A-22 Note that the point of intersection between the linear elastic portion of the curve and the full slip segment, defined by point (QC1, wC1) in Figure 3b, can be calculated by setting Equation A-1 equal to Equation A-9, solving for the resulting value of axial load (QC1) and using this value to compute the corresponding displacement wC1. Numerical solutions to Equations A-1 through A-22 are implemented conveniently by spreadsheet, thus providing designers a simple analytical tool for assessing the likely ranges of behavior for trial designs. The user of this method should be familiar with the assumptions made in its development. The modulus of the rock mass is assumed to be constant over the depth of shaft embedment and beneath the base. Rock mass modulus and its variation with depth must, therefore, be assessed carefully (see Chapter 3 of

40
Turner 2006) and determined to satisfy the assumption of uniformity. Strength of the rock mass is required in terms of its Mohr-Coulomb parameters (c, , and ) where = angle of dilatancy. In the absence of laboratory testing of the rock-concrete interface, for example by constant normal stiffness direct shear tests, Kulhawy and Carter (1992) suggest the following correlations between the Mohr-Coulomb strength parameters and uniaxial compressive strength (qu) of intact rock:
32
1.0
a
u
a p
q
p
c A-23
32
001.0tantan
a
u
p
q A-24
41
APPENDIX B: Axial Load-Displacement Model for Burma Road Overpass
This Appendix presents two figures, each of which illustrates the results of the load-displacement analysis of the test shaft at Burma Road Overpass. The equations presented in Appendix A, developed by Kulhawy and Carter (1992), were programmed by the author into a spreadsheet. Input parameters include the geometry of the foundation (depth and diameter) and strength and stiffness properties of the rock and the drilled shaft foundation. The program then executes the calculations corresponding to the equations given in Appendix A. Results are presented as a graph showing the axial load-displacement calculated by the model. Figure B-1 shows the spreadsheet analysis of the test shaft plotted alongside the equivalent top load-settlement curve developed by Loadtest, Inc. (2009) and presented in their report of the load test. Fitting the model to match the results of the load test is presented and discussed in Chapter 3. This fitting is the method by which the strength and stiffness parameters of the rock mass were established. Figure B-2 shows the spreadsheet analysis for modeling the uplift load-displacement curve of the as-designed drilled shafts at Burma Road Overpass. This curve is used to evaluate the design for Service Limit State I, also described and discussed in Chapter 3. A ‘live’ version of the spreadsheet solution has been provided to Wyoming DOT as part of this research project and can also be obtained by contacting the author.

42
Figure B-1. Spreadsheet Analysis of Load-Displacement Model, Shaft in Compression
by Kulhawy & Carter (1992)
SHAFT PROPERTIESShaft diameter B (in): 36 Linear Elastic Load-Displacement Calculations
Shaft depth D (in): 492
Modulus of concrete, E c (kip/in2): 4408 Q c (kips)
Complete Socket w c (in)
Tip Load Q tip (kips) Q c (kips)
Complete Socket w c
(in)Tip Load Q c (kips)
Poissons ratio, c: 0.25 0 0.00 0.0 1160 0.194 254.5
Shear modulus, G c (kip/in2): 1763.2 1160 0.189 252.5 2600 0.89 1463.3
86.1 0.014 2600 1.201785 0.50
PROPERTIES OF SIDE ROCK MASS
Rock mass modulus E r (k/in2): 20
Rock mass Poissons ratio, r: 0.25
Shear modulus, G r (k/in2): 8
cohesion, c (lb/in2) 16friction angle, (degrees) 22dilation angle, (degrees) 1
PROPERTIES OF BASE ROCK MASS
Rock mass modulus E b (k/in2): 55
Rock mass Poissons ratio, b: 0.3
Shear modulus, G b (k/in2): 21.154
DIMENSIONLESS CONSTANTS FOR LINEAR ELASTIC (calculated )
CALCULATED CONSTANTS FOR FULL SLIP
=E c/G r 551 a 3 0.0325
= ln[5(1- r) D /B ] 3.9367 a 2 88.8648
= G r/G b 0.3782 a 1 93.7857
(D )2 0.6889 257.8048 0.0017 6697197.6
for complete socket: G rBw c / 2Q c 0.0235 1 0.0004
for shear socket: E rBw c / 2Q c 0.0699 2 -0.0004
C 1 -2.1584Equivalent Linear Spring Constants K (force/length) C 2 -3.1584
complete socket: K c = Q c/w c 6127 k/in C 3 -0.0541
shear socket: K s= Q c/w c 5150.4 k/in C 4 0.9459
D 3 -0.1652Proportion of Load Transferred to Tip D 4 2.8888
complete socket: Q tip /2Q c 0.2176 F 1 6.8801
F 2 0.0711
F 3 1.1000
F 4 0.0103
P 3 0.839395482
P 4 -11.03963024
Full-Slip Load-Displacement Calculations
Elastic Load-Settlement Analysis, Rock Socket in Compression
0
500
1000
1500
2000
2500
3000
0.00 0.25 0.50 0.75 1.00 1.25 1.50 1.75 2.00
Axi
al L
oad
(ki
ps)
Displacement (inches)
Complete SocketL = 41 ftB = 3 ftEr = 20 k/in2
Eb = 55 k/in2r = 0.25b = 0.30
Load-Settlement Curve, O-cell TestLoadtest, Inc., 2009

43
Figure B-2. Spreadsheet Analysis of Load-Displacement Model, Shaft in Uplift
by Kulhawy & Carter (1992)
SHAFT PROPERTIESShaft diameter B (in): 36 Linear Elastic Load-Displacement Calculations
Shaft depth D (in): 492
Modulus of concrete, E c (kip/in2): 4408 Q c (kips)
Shear Socket w c (in)
Tip Load Q tip
(kips) Q c (kips)
Complete
Socket w c (in)
Tip Load Q c
(kips)
Poissons ratio, c: 0.25 0 0.00 0.0 949.5 0.179 77.8
Shear modulus, G c (kip/in2): 1763.2 949.5 0.184 0.0 1400 1.475 456.0
87.5 0.017 1400 1.8001061 0.500
PROPERTIES OF SIDE ROCK MASS
Rock mass modulus E r (k/in2): 20
Rock mass Poissons ratio, r: 0.25
Shear modulus, G r (k/in2): 8
cohesion, c (lb/in2) 16friction angle, (degrees) 22dilation angle, (degrees) 1
PROPERTIES OF BASE ROCK MASS
Rock mass modulus E b (k/in2): 55
Rock mass Poissons ratio, b: 0.3
Shear modulus, G b (k/in2): 21.154
DIMENSIONLESS CONSTANTS FOR LINEAR ELASTIC (calculated )
CALCULATED CONSTANTS FOR FULL SLIP
=E c/G r 551 a 3 0.0325
= ln[5(1- r) D /B ] 3.9367 a 2 88.8648
= G r/G b 0.3782 a 1 93.7857
(D )2 0.6889 257.8048 0.0017 6697197.6
for complete socket: G rBw c / 2Q c 0.0235 1 0.0004
for shear socket: E rBw c / 2Q c 0.0699 2 -0.0004
C 1 -2.1584Equivalent Linear Spring Constants K (force/length) C 2 -3.1584
complete socket: K c = Q c/w c 6127 k/in C 3 -0.0541
shear socket: K s= Q c/w c 5150.4 k/in C 4 0.9459
D 3 -0.1652Proportion of Load Transferred to Tip D 4 2.8888
complete socket: Q tip /2Q c 0.2176 F 1 6.8801
F 2 0.0711
F 3 1.1000
F 4 0.0103
P 3 0.839395482
P 4 -11.03963024
R 1 6.507513607
R 2 0.070898815
Elastic Load-Settlement Analysis, Rock Socket in Uplift
Full-Slip Load-Displacement Calculations
0
500
1000
1500
2000
2500
3000
0.00 0.25 0.50 0.75 1.00 1.25 1.50 1.75 2.00
Axi
al L
oad
(ki
ps)
Displacement (inches)
Shear Socket in UpliftL = 41 ftB = 3 ftEr = 20 k/in2
r = 0.25