Embed Size (px)
Citation preview

Improving Gas Furnace Performance: A Field and Laboratory Study at End of Life L. Brand, S. Yee, and J. Baker Partnership for Advanced Residential Retrofit
February 2015

NOTICE
This report was prepared as an account of work sponsored by an agency of the United States government. Neither the United States government nor any agency thereof, nor any of their employees, subcontractors, or affiliated partners makes any warranty, express or implied, or assumes any legal liability or responsibility for the accuracy, completeness, or usefulness of any information, apparatus, product, or process disclosed, or represents that its use would not infringe privately owned rights. Reference herein to any specific commercial product, process, or service by trade name, trademark, manufacturer, or otherwise does not necessarily constitute or imply its endorsement, recommendation, or favoring by the United States government or any agency thereof. The views and opinions of authors expressed herein do not necessarily state or reflect those of the United States government or any agency thereof.
Available electronically at http://www.osti.gov/bridge
Available for a processing fee to U.S. Department of Energy and its contractors, in paper, from:
U.S. Department of Energy Office of Scientific and Technical Information
P.O. Box 62 Oak Ridge, TN 37831-0062
phone: 865.576.8401 fax: 865.576.5728
email: mailto:[email protected]
Available for sale to the public, in paper, from: U.S. Department of Commerce
National Technical Information Service 5285 Port Royal Road Springfield, VA 22161 phone: 800.553.6847
fax: 703.605.6900 email: [email protected]
online ordering: http://www.ntis.gov/ordering.htm

iii
Improving Gas Furnace Performance: A Field and Laboratory Study at End of Life
Prepared for:
The National Renewable Energy Laboratory
On behalf of the U.S. Department of Energy’s Building America Program
Office of Energy Efficiency and Renewable Energy
15013 Denver West Parkway
Golden, CO 80401
NREL Contract No. DE-AC36-08GO28308
Prepared by:
Partnership for Advanced Residential Retrofit
Gas Technology Institute
1700 South Mount Prospect Road
Des Plaines IL 60018
NREL Technical Monitor: Stacey Rothgeb
Prepared under Subcontract No. KNDJ-0-40346-03
February 2015

iv
The work presented in this report does not represent performance of any product relative to regulated minimum efficiency requirements. The laboratory and/or field sites used for this work are not certified rating test facilities. The conditions and methods under which products were characterized for this work differ from standard rating conditions, as described. Because the methods and conditions differ, the reported results are not comparable to rated product performance and should only be used to estimate performance under the measured conditions.

v
Contents List of Figures ............................................................................................................................................ vi List of Tables ............................................................................................................................................. vii Acknowledgments ................................................................................................................................... viii Definitions ................................................................................................................................................... ix Executive Summary .................................................................................................................................... x 1 Problem Statement ............................................................................................................................... 1
1.1 Introduction ..........................................................................................................................1 1.2 Background ..........................................................................................................................1 1.3 Installation Conditions .........................................................................................................2 1.4 Relevance to Building America’s Goals ..............................................................................3 1.5 HVAC SAVE Program ........................................................................................................3 1.6 Performance Degradation With Age ....................................................................................3
2 Objective ................................................................................................................................................ 5 3 Research Methodology ........................................................................................................................ 6
3.1 Research Questions ..............................................................................................................6 3.2 Technical Approach—Data Collection and Analysis ..........................................................6 3.3 Measurement Methods .........................................................................................................8 3.4 Equipment ............................................................................................................................9 3.5 Analysis Methodology .........................................................................................................9 3.6 Furnaces Tested .................................................................................................................10
3.6.1 InterCity Products GN100A016AIN .....................................................................11 3.6.2 InterCity Products GUI100A012GIN ....................................................................12 3.6.3 Lennox G12QE382-10 ...........................................................................................13 3.6.4 InterCity Products GN100A016CIN......................................................................14 3.6.5 Fraser Johnston PBKM-L016N080A ....................................................................15 3.6.6 Lennox G23Q4/5-100-4 .........................................................................................16 3.6.7 Amana GUC090X50B ...........................................................................................17 3.6.8 Rheem RGOA100CER ..........................................................................................18 3.6.9 Armstrong GUK075D14-18 ..................................................................................19 3.6.10 Trane TUS060A936AO .........................................................................................20 3.6.11 Lennox G16Q3757 .................................................................................................21 3.6.12 Lennox GH6D 100M .............................................................................................22
4 Analysis ............................................................................................................................................... 23 4.1 Steady-State Efficiency ......................................................................................................23 4.2 Annual Fuel Utilization Efficiency and Annualized Efficiency ........................................27 4.3 Efficiency Change With Time ...........................................................................................30
5 Results and Discussion ..................................................................................................................... 32 6 Conclusions and Recommendations ............................................................................................... 34 References ................................................................................................................................................. 35

vi
List of Figures Figure 1. Section 11.2.12 excerpt from ASHRAE Standard 103-2007 .................................................. 10 Figure 2. Section 11.4.12 excerpt from ASHRAE Standard 103-2007 .................................................. 10 Figure 3. Furnace #1 InterCity Products ................................................................................................. 11 Figure 4. Furnace #2 InterCity Products ................................................................................................. 12 Figure 5. Furnace #3 Lennox ................................................................................................................... 13 Figure 6. Furnace #4 InterCity Products ................................................................................................. 14 Figure 7. Furnace #5 Fraser Johnston .................................................................................................... 15 Figure 8. Furnace #6 Lennox ................................................................................................................... 16 Figure 9. Furnace #7 Amana .................................................................................................................... 17 Figure 10. Furnace #8 Rheem .................................................................................................................. 18 Figure 11. Furnace #9 Armstrong ............................................................................................................ 19 Figure 12. Furnace #10 Trane .................................................................................................................. 20 Figure 13. Furnace #11 Lennox ............................................................................................................... 21 Figure 14. Furnace #12 Lennox ............................................................................................................... 22 Figure 15. Steady-state efficiency field and Standard 103 lab conditions .......................................... 24 Figure 16. Steady-state efficiency field and Standard 103 lab conditions .......................................... 27 Figure 17. AE field and Standard 103 lab conditions ............................................................................ 28 Figure 18. Rated AFUE compared to AE Standard 103 lab conditions ............................................... 29 Figure 19. Efficiency change versus age ................................................................................................ 30 Figure 20. Rated AFUE versus efficiency change per year .................................................................. 31
Unless otherwise noted, all figures were created by PARR.

vii
List of Tables Table 1. Data Collected in the Field ........................................................................................................... 7 Table 2. Data Collected in the Laboratory ................................................................................................ 8 Table 3. Measurement Tolerances ............................................................................................................ 8 Table 4. Test Procedure and Measurements ............................................................................................ 9 Table 5. Equipment Table ........................................................................................................................... 9 Table 6. Furnace #1 InterCity Products .................................................................................................. 11 Table 7. Furnace #2 InterCity Products .................................................................................................. 12 Table 8. Furnace #3 Lennox ..................................................................................................................... 13 Table 9. Furnace #4 InterCity Products .................................................................................................. 14 Table 10. Furnace #5 Fraser-Johnston ................................................................................................... 15 Table 11. Furnace #6 Lennox ................................................................................................................... 16 Table 12. Furnace #7 Amana .................................................................................................................... 17 Table 13. Furnace #8 Rheem .................................................................................................................... 18 Table 14. Furnace #9 Armstrong ............................................................................................................. 19 Table 15. Furnace #10 Trane .................................................................................................................... 20 Table 16. Furnace #11 Lennox ................................................................................................................. 21 Table 17. Furnace #12 Lennox ................................................................................................................. 22 Table 18. Efficiency Measurements ........................................................................................................ 23 Table 19. Furnace Field Data and Steady-State Efficiency ................................................................... 23 Table 20. Steady-State Efficiency Comparison ...................................................................................... 24 Table 21. Airflow in the Field and Standard 103 Conditions ................................................................ 25 Table 22. Furnace Rise Range ................................................................................................................. 25 Table 23. Airflow Rate Differences in the Field and Lab at the Same Static Pressure ...................... 26 Table 24. Steady-State Efficiency Measured in the Lab ........................................................................ 27 Table 25. AE Under Field and Standard 103 Conditions ....................................................................... 28 Table 26. Rated AFUE and AE Under Standard 103 Conditions .......................................................... 29
Unless otherwise noted, all tables were created by PARR.

viii
Acknowledgments
The Partnership for Advanced Residential Retrofit would like to thank Energy Stewards International for collecting the furnaces and field data used in this project.

ix
Definitions
AE Annualized efficiency
AFUE Annual fuel utilization efficiency
ANSI American National Standards Institute
ASHRAE American Society of Heating, Refrigerating and Air-Conditioning Engineers
BEopt™ Building Energy Optimization software
Btu British thermal unit
DOE U.S. Department of Energy
ESP External static pressure
HVAC Heating, ventilation, and air conditioning
HVAC SAVE HVAC System Adjustment & Verified Efficiency
kWh Kilowatt hour
MEEA Midwest Energy Efficiency Alliance
w.c. Water column

x
Executive Summary
In 2010, natural gas provided 54% of total residential space heating energy in the United States on a source basis, or 3.5 quadrillion Btu, according to the U.S. Department of Energy (DOE) Building Energy Data Book. Natural gas burned in furnaces accounted for 92% of that total, and boilers and other equipment made up the remainder. A better understanding of installed furnace performance is key to energy savings for this significant energy use.
Natural gas furnace performance can be measured in many ways. The DOE annual fuel utilization efficiency (AFUE) rating provides a fixed value under specified conditions, analogous to the U.S. Environmental Protection Agency miles per gallon rating for new vehicles. The AFUE rating is provided by the manufacturer to the consumer and is a way to choose between models tested on the same basis. This value is commonly used in energy modeling calculations. ASHRAE 103 is a consensus furnace testing standard developed by the engineering community. The procedure provided in the standard covers heat-up, cool-down, condensate heat loss, and steady-state conditions and an imposed oversize factor. The procedure can be used to evaluate furnace performance with specified conditions or with some variation chosen by the tester. In this report the ASHRAE 103 test result will be referred to as annualized efficiency (AE) to avoid confusion with the DOE rating, and any nonstandard test conditions will be noted. Aside from these two laboratory tests, steady-state or flue loss efficiency can be measured in the field under many conditions, typically as found or tuned to the manufacturers’ recommended settings. In this report, AE and steady-state efficiency are used as measures of furnace performance.
Modeled pre-retrofit energy consumption and retrofit energy savings commonly exceed those of actual energy consumption and savings. This is especially true in homes that are leaky, poorly insulated, and that have older mechanical systems (Polly et al. 2011). The discrepancy may be related to poor load modeling that increases runtimes; to the performance of equipment tested under laboratory conditions, which differs from field performance; or to equipment performance that degrades with time. The latter two theories are tested in this study.
The objective of this project is to examine the impact that common installation practices and age-induced equipment degradation may have on the installed performance of natural gas furnaces over the life of the product, as measured by steady-state efficiency and AE. The Partnership for Advanced Residential Retrofit identified 12 furnaces of various ages and efficiencies that were operating in residential homes in the Des Moines, Iowa, metropolitan area and worked with a local heating, ventilation, and air conditioning contractor to retrieve furnaces and test them for steady-state efficiency and AE in the lab. Prior to removal, system airflow, static pressure, equipment temperature rise, and flue loss measurements were recorded for each furnace as installed in the house. After removal from the field, the furnaces were transported to the Gas Technology Institute laboratory, where the Partnership for Advanced Residential Retrofit conducted steady-state efficiency and AE testing. Nine of the 12 furnaces could be tested in the lab with minor component repair that did not impact efficiency. Steady-state efficiency was calculated for each furnace from the field data. Each furnace was then tested for steady-state efficiency and AE under field conditions and AE under test conditions specified in the ASHRAE 103-2007 (consensus) test standard, based on furnace type. In this report, rated AFUE is used as the “before” condition and AE under ASHRAE Standard 103 conditions is used as the “after”

xi
condition in the absence of individual furnace efficiency lab test results when the furnaces were new.
The test results show that steady-state efficiency in the field was 6.4% lower than that measured for the same furnaces under Standard 103 conditions in the lab, which included tuning the furnace input and airflow rate to the conditions recommended by the manufacturer. This value is based on the average of nine of the 12 furnaces that could be tested after minor repair. Comparing AE measured under Standard 103 conditions with the rated AFUE shows similar values, implying that equipment performance did not significantly decrease over 15–24 years of operation. The conclusion is that rated AFUE values can be used as a good indicator of the performance of natural gas furnaces throughout their useful lives if they are installed according to the manufacturers’ installation instructions. Installing a furnace correctly in the lab or in the field is a key driver in this finding: increase the blower speed to provide the correct airflow to match the manufacturer’s recommended temperature rise without exceeding the manufacturer’s design static pressure. If the fan speed cannot be adjusted properly, changes to the duct system will need to be made.
1
1 Problem Statement
1.1 Introduction Natural gas furnaces are rated for efficiency using the U.S. Department of Energy (DOE) annual fuel utilization efficiency (AFUE) test standard under controlled laboratory test conditions. In the home, these furnaces are then installed under conditions that can vary significantly from the standard, require adjustment by the installing contractor to adapt to field conditions, may or may not be inspected over their useful lifetimes, and can operate with little maintenance over a 30-year period or longer. At issue is whether the installation practices, field conditions, and wear over the life of the furnace reduce the efficiency significantly from the rated efficiency. In this project, nine furnaces, with 15–24 years of field service, were removed from Iowa homes and tested in the lab under four conditions to determine the effects of installation practices, field operating conditions, and age on efficiency.
1.2 Background As required by the Energy Policy and Conservation Act of 1975, the National Bureau of Standards developed test procedures to establish methods of energy consumption of certain appliances. On May 10, 1978, DOE promulgated the test procedures for furnaces and boilers. Those procedures and the amendments of August 10, 1980 provided the basis for ASHRAE Standard 103, the gas furnace and boiler efficiency test standard. ASHRAE developed the standard using the American National Standards Institute (ANSI) consensus process. It was approved by the ASHRAE Standards Committee on June 27, 1982. The original standard was ANSI/ASHRAE 103-1982 (ASHRAE 1982). ASHRAE 103-2007 will be referred to as “Standard 103” in this report.
Minimum appliance efficiency levels came into effect in the mid-1980s. When the Energy Policy and Conservation Act was amended, DOE was required to promulgate energy conservation standards for certain major appliances, including residential furnaces. In 1987, the National Appliance Energy Conservation Act established initial minimum efficiency standards for residential gas furnaces at 78% AFUE for most gas furnaces effective January 1, 1992. The minimum efficiency for furnaces was revised upward in 2007—gas furnaces produced after 2015 are required to have an AFUE of 80% or higher.
The DOE AFUE rating procedure and ASHRAE Standard 103 are not developed in tandem. In 1997, DOE published a final rule that amended the original test procedure for furnaces incorporating provisions contained in test procedure waivers granted to several manufacturers from 1985 to 1996 and adding test procedures for new product designs. In 2010, DOE published a final rule that amended the original test procedure for residential furnaces to include standby and off-mode energy use. ASHRAE re-evaluates Standard 103 on a 5-year interval and published the most recent version in 2007.
ASHRAE SPC 103 is currently reviewing Standard 103 for the next publication cycle, and DOE has issued a Request for Information seeking input on the DOE AFUE test procedure. Because the timeline for the ASHRAE and DOE standards activities are not coincident, the furnaces tested in this report under ASHRAE 103 2007 may have originally been listed according to an older DOE test procedure. The authors believe the differences in ASHRAE Standard 103 and

2
DOE AFUE test procedure over time are not significant and are within the 0.1% experimental error of the laboratory test setup in this report (Brand and Rose 2012).
Previous Building America research has shown that correct sizing and proper installation of heating, ventilation, and air conditioning (HVAC) systems are crucial to achieving the desired occupant comfort and efficiency levels (Burdick 2011; Brand 2012). However, while there are several directly applicable and well-known installation, sizing, and distribution design guidelines, the DOE Building American team, Partnership for Advanced Residential Retrofit (PARR), has observed that installing contractors often do not follow these guidelines, especially during an upgrade of existing equipment. It is common practice within the HVAC industry to replace existing equipment without determining if the existing duct system is properly designed and sized to match the needs of the new equipment, or to fail to adjust the new equipment to match the existing distribution system. The result is equipment installed and operating at conditions outside the manufacturer’s recommended range.
This project explored the effects these adverse operating conditions have on equipment performance ratings by conducting several measurements:
• Calculated steady-state efficiency based on field reported conditions.
• Measured steady-state efficiency in the lab at the same field conditions without adjusting the furnaces.
• Measured steady-state efficiency in the lab at ASHRAE Standard 103 conditions.
• Measured, annualized efficiency (AE) in the lab under conditions reported from the field and without adjusting the furnaces.
• Measured AE in the lab under Standard 103 conditions.
AE measurements are as described in ANSI/ASHRAE 103-2007. Although Standard 103 uses AFUE as the test value, AE is used in this report to avoid confusion with the DOE rating. PARR has evaluated the performance of each furnace according to ASHRAE Standard 103 and has modified the test to simulate conditions found in the field for some furnace test cases.
1.3 Installation Conditions In retrofit situations HVAC installers regularly fail to address the existing distribution system when installing new equipment, resulting in equipment operating outside the manufacturer’s specifications. Ductwork that was installed many years ago to meet the previous load and match the original equipment (generally higher delivered air temperature at lower flow rates) often cannot handle the airflow requirements of newer high efficiency units. Manufacturers address this situation in their installation instructions by providing guidelines on setting the fan speed so the furnace operates in its rise range (air temperature rise across the furnace). A second common field adjustment is to set the input rate on the furnace to match the value on the label. This is done by adjusting the gas valve pressure setting and measuring the gas flow rate by observing the meter. Some installers fail to perform these adjustments and the performance is impacted.

3
1.4 Relevance to Building America’s Goals Overall, the goal of DOE’s Building America program is to reduce home energy use by 30%–50% compared to the 2009 International Energy Conservation Code for new homes and pre-retrofit energy use for existing homes. To this end, Building America conducts research to “develop market-ready energy solutions that improve efficiency of new and existing homes in each U.S. climate zone, while increasing comfort, safety, and durability.”1
This project directly aligns with Building America’s objectives, as it addresses commonly observed deficiencies in forced-air natural gas furnace installations, which likely increase energy use in many American homes. Presumably, following the furnace manufacturer’s installation instructions carefully and employing industry-approved methods for equipment sizing, duct design, and filter selection should result in the unit achieving its rated performance, while failure to do so may reduce performance, thus increasing energy use. Further, degradation of performance over time caused by drift of component settings or other factors is assumed; this project provides data to test those assumptions.
1.5 HVAC SAVE Program The furnaces analyzed in this study were taken from homes participating in Iowa’s HVAC System Adjustment & Verified Efficiency (SAVE) program, a statewide HVAC training and certification program (Yee et al. 2013). The HVAC SAVE program was developed by the Midwest Energy Efficiency Alliance (MEEA) to train contractors in the skills necessary to determine in-place performance of functioning systems, including equipment and distribution systems. Energy Stewards International has been training HVAC professionals for many years on how contractors can use static pressures, system temperatures, and airflows to identify existing system deficiencies, allowing them to make targeted repairs or adjustments. The furnaces being analyzed in this study, which were removed from the field, help to test the hypothesis that previously installed equipment is performing in less than optimal installation conditions.
1.6 Performance Degradation With Age In addition to studying how installed conditions affect energy use, this project examined potential degradation in equipment performance over time by conducting a second round of AE testing on each unit under conditions specified in Standard 103 and comparing these results with the original rating. Building America Simulation protocols (Hendron and Engebrecht 2010) once used a degradation factor for furnace efficiency in Building Energy Optimization software (BEopt™), although that has been discontinued. The equation below provides the calculation evaluated in this project:
1 www1.eere.energy.gov/buildings/residential/ba_research.html

4
AFUE = (Base AFUE) × (1-M)age where Base AFUE = Typical efficiency of pre-retrofit equipment when new M = Maintenance factor 0.005 annual professional maintenance 0.015 seldom or never maintained age = Age of equipment in years, up to a maximum of 20 years

5
2 Objective
The objective of this project was to examine the impact that common installation practices and age-induced equipment degradation may have on the installed performance of natural gas furnaces, as measured by steady-state efficiency and AE. Recommendations are made on methods to improve field performance.

6
3 Research Methodology
3.1 Research Questions The research conducted in this project addresses the following questions:
1. What is the degradation in furnace efficiency for typical field installation compared to the rated performance?
2. How should performance ratings be modified in models (such as BEopt) to account for degradation, especially for retrofit situations?
3. How do rated and measured efficiency compare for vintage furnaces?
3.2 Technical Approach—Data Collection and Analysis PARR identified 12 working furnaces of various production years installed in the field, gathered operating condition information, transported each furnace to a laboratory, and tested each furnace for steady-state efficiency and for AE as described in ASHRAE Standard 103-2007.
Standard 103 provides test methods, instrumentation tolerances, and calculation techniques to determine AE. The following basic tests were conducted:
1. Steady-state test (used for both the steady-state and AE results)
2. Cool-down test
3. Heat-up test
4. Condensate heat loss under cyclic conditions test (condensing furnaces).
In addition to the test conditions recommended in Standard 103, PARR also ran the above tests mimicking the operating conditions of each furnace, as found in the field. These conditions differ from furnace to furnace as each field installation does vary. Based on MEEA’s recent experience with the HVAC SAVE, a regional contractor training and certification initiative based on National Comfort Institute principles, some common conditions seen in the field are as follows:
• High external static pressures (ESPs) caused by either undersized or restrictive distribution systems: For testing, Standard 103 recommends a minimum external static of 0.2 in. w.c. (inches of water column) depending on the furnace size; 0.7–0.9 in. w.c. is commonly observed in the field. External static was be measured in the field for each furnace and used for testing.
• Oversized equipment: Standard 103 accounts for oversizing by simulating burner on and off time per cycle; testing is conducted under conditions that represent a 70% oversized unit. In this project it was not possible to test oversizing because house characteristics were not logged and utility bills are not available. In previous work done by PARR (Brand and Rose 2012), it was determined that oversizing is not a significant factor for high-efficiency furnaces.
• Equipment that is off rate: The Standard 103 recommends that burner input rate be adjusted to within 2% of the hourly Btu input rating specified by the manufacturer. The gas input to the equipment was measured in the field and then tested under the same

7
conditions in the laboratory during the field conditions round of testing. For testing under Standard 103 conditions, input rate was corrected.
The original test plan for this project included collecting furnaces with a range of ages and designs: 1960s–1990s, ribbon burners and in-shot burners, atmospheric and fan-assisted combustion, lower efficiency and higher efficiency. The furnaces in this study covered all the cases except the very early years. The year of manufacture of the nine furnaces tested ranges from 1987–1998, three are ribbon burners, and the rest are in-shot burners, two are atmospheric combustion systems, and two are high efficiency (condensing) furnaces. This range of ages and types is fairly representative of the installed base and is sufficient for this research.
Furnaces were sourced from the Des Moines, Iowa, metropolitan area, leveraging MEEA’s work on HVAC SAVE. Twelve furnaces were collected; only nine could be tested without significant repair. PARR chose not to test the furnaces requiring significant repair because the performance could be altered.
Before each furnace was removed from the field, several measurements were taken to determine actual operating conditions. PARR is aware that measurements taken in the field are difficult to obtain within the accuracy of that recommended by Standard 103. These measurements were not used to determine AE, but rather as a general guide for determining field steady-state conditions and field conditions for laboratory testing. Table 1 provides information that was collected in the field.
Table 1. Data Collected in the Field Data Notes
Nameplate Data Units, coils, fans, etc. Temperature Rise Across the Equipment °F, radiation shielded
Static Pressure Using a manometer or digital gage O2% in Flue Gases Concentration, %
Airflow Rate Flow plate replacing the filter Once the initial evaluation of the equipment was completed in the field, each furnace was shipped to the Gas Technology Institute laboratory.
Table 2 shows the major data points that were collected as part of the efficiency testing, in accordance with ASHRAE 103:

8
Table 2. Data Collected in the Laboratory Data Notes
Room Temperature Average of 4 points, radiation shielded
Jacket Loss Thermocouples in 6 × 6 in. square on furnace jacket except for blower housing (contact temperature sensor may be used)
Power to Burner and Blower kWh Dry CO2 in Flue Gases Concentration, ppm Room Humidity Level Must be less than 80% RH
Time for Several Events Seconds Flue Gas Temperature In a grid pattern using beaded thermocouples
Supply and Return Temperatures Thermocouples
Gas Consumption Cubic feet Weight of Condensate Using a clean non-scaling container
Gas Heating Value Btu/standard cubic feet Tracer Gas Concentration Within 2% of value
Table 3 provides measurement tolerances from Standard 103. Instruments were selected and power conditioning was applied to meet these requirements.
Table 3. Measurement Tolerances
Measurement Tolerance Temperature 2°F Gas Pressure 0.2 in. w.c. Air Pressure 0.01 in. w.c.
CO2 0.1% Weight 0.5% Volume 0.5%
Time 0.5 s/h Tracer Gas 2% Electricity 1%
Voltage 1% Gas 1%
Gas Heating Value 1% 3.3 Measurement Methods Laboratory steady-state and AE testing for this project has been conducted according to Standard 103. Table 4 provides a summary of the measurements required for each step.

9
Table 4. Test Procedure and Measurements Section
in Standard
103
Test Name Description Measurements
9.1 Steady-state test
Measure energy into the furnace from natural gas and
energy lost from the vent system and condensate system
Measure CO2, flue gas temperature, condensate
production, gas consumption, and jacket losses under steady-state
conditions.
9.5 Cool-down test Measure energy lost to the flue gases during the post-purge or cool-down period
Flue gas temperature and time under cool-down conditions
9.6 Heat-up test Measure energy lost to the flue gasses during heat up with delayed blower start
Flue gas temperature and time during heat-up
9.8
Condensate heat loss under
cyclic conditions
Measure thermal energy lost to condensate
Fuel input, heating value, temperature, and pressure of the
gas, and weight of condensate for each cycle
3.4 Equipment Table 5 provides the basic set of equipment used to perform these tests.
Table 5. Equipment Table Measurement Equipment Needed Gas Flow Rate Gas flow meter calibrated to be accurate within 1% of flow volume
Electricity Consumption
Watt meters with an accuracy of 1% of measured energy (not included in energy balance)
Temperatures Bead thermocouples with an accuracy of ± 2°F Air Pressure Manometer or pressure gage with an accuracy of ± 0.01 in. w.c.
Power Conditioning Voltage to be controlled within 1% of nameplate requirement on furnace
CO2 Concentration Within ± 0.1% Time Stopwatch or timer accurate to ± 0.5 s/h
Tracer Gas Gas chromatograph accurate to ± 2% of measured concentration Gas Heating Value Gas calorimeter ± 1% in Btu/ft3
3.5 Analysis Methodology The full analysis procedure is described in detail in ASHRAE Standard 103-2007. Section 11 was followed for calculating the AE based on the type of furnace under test. For noncondensing and nonmodulating furnaces, Section 11.2 describes the procedures used to calculate steady-state efficiency, heating seasonal efficiency, maximum fuel input rate, and oversizing factor, all of which will be used in step 11.2.12 to calculate the AE. The same process applies for condensing furnaces as described in Section 11.3, noncondensing modulating furnaces as described in

10
Section 11.4, and condensing modulating furnaces as described in Section 11.5. The two equations used to calculate AE are shown in Figure 1 for nonmodulating furnaces and Figure 2 for modulating furnaces. (AFUE in Standard 103 is referred to as AE in this report to avoid confusion.)
Figure 1. Section 11.2.12 excerpt from ASHRAE Standard 103-2007
Figure 2. Section 11.4.12 excerpt from ASHRAE Standard 103-2007 3.6 Furnaces Tested Twelve furnaces were collected from the field. Only nine could be tested in the lab without significant repair that would impact performance. A short description of each furnace, a photograph, nameplate information, and field measurements are included in Figure 3 through Figure 14 and Table 6 through Table 17.

11
3.6.1 InterCity Products GN100A016AIN The GN100A016AIN model is a mid-efficiency gas furnace with an induced draft combustion system. The unit was built in April 1992 and removed from service in September 2012.
Figure 3. Furnace #1 InterCity Products
Table 6. Furnace #1 InterCity Products
Specifications Manufacturer InterCity Products Height, in. 40.125
Model GNI100A016AIN Width, in. 22.75 Serial Number R921600151 Depth, in. 28.25
Year April 1992 Duct Depth, in. 18.5 Input Capacity 100,000 Duct Width, in. 21.25
Output Capacity 80,400 DOE-Rated AFUE 80.5
Field Data Reported Airflow (CFM) 920 Temperature Rise, °F 84
O2% 9.6 ESP, in. w.c. 0.9 Flue Temperature, °F 467

12
3.6.2 InterCity Products GUI100A012GIN The GUI100A012GIN model is a mid-efficiency gas furnace with an induced draft combustion system. This unit was built in March 1991 and removed from service in September 2012.
Figure 4. Furnace #2 InterCity Products
Table 7. Furnace #2 InterCity Products
Specifications Manufacturer InterCity Products Height, in. 39.25
Model GUI100A012GIN Width, in. 19.25 Serial Number L931034889 Depth, in. 28.25
Year March 1991 Duct Depth, in. 18.5 Input Capacity 100,000 Duct Width, in. 17.75
Output Capacity 80,000 DOE-Rated AFUE 80.1
Field Data Reported Airflow (CFM) 878 Temperature Rise, °F 73
O2% 11.3 ESP, in. w.c. 0.7 Flue Temperature, °F 504

13
3.6.3 Lennox G12QE382-10 The G12QE382-10 model is an atmospheric gas furnace using indoor combustion air, a draft diverter, and an atmospheric burner. The unit was built in June 1989 and removed from service in September 2012.
Figure 5. Furnace #3 Lennox
Table 8. Furnace #3 Lennox
Specifications Manufacturer Lennox Height, in. 49
Model G12QE382-10 Width, in. 16.5 Serial Number 5889607663 Depth, in. 26.25
Year June 1989 Duct Depth, in. 17.75 Input Capacity 82,000 Duct Width, in. 14.25
Output Capacity None Found DOE-Rated AFUE 72.5
Field Data Reported Airflow (CFM) 947 Temperature Rise, °F 88
O2% 13.2 ESP, in. w.c. 0.6 Flue Temperature, °F 548

14
3.6.4 InterCity Products GN100A016CIN The GN100A016CIN model is a mid-efficiency gas furnace using an induced-draft combustion system. The unit was manufactured in October 1993 and removed from service in September 2012. The front panels of this furnace were missing. New panels were fabricated for the test.
Figure 6. Furnace #4 InterCity Products
Table 9. Furnace #4 InterCity Products
Specifications Manufacturer InterCity Products Height, in. 40.625
Model GN100A016CIN Width, in. 23 Serial Number L934418652 Depth, in. 28.25
Year October 1993 Duct Depth, in. 18.25 Input Capacity 100,000 Duct Width, in. 21.25
Output Capacity 80,400 DOE-Rated AFUE 80.5
Field Data Reported Airflow (CFM) 792 Temperature Rise, °F 84
O2% 9.6 ESP, in. w.c. 0.9 Flue Temperature, °F 467

15
3.6.5 Fraser Johnston PBKM-L016N080A The PBKM-L016N080A model is a mid-efficiency furnace using an induced draft combustion system. This furnace was received without a front panel, so one was fabricated. The unit was built in February 1994 and removed from service in September 2012.
Figure 7. Furnace #5 Fraser Johnston
Table 10. Furnace #5 Fraser-Johnston
Specifications Manufacturer Fraser-Johnston Height, in. 40.25
Model PBKM-L016N080A Width, in. 22.25 Serial Number EBCM101513 Depth, in. 28.25
Year February 1994 Duct Depth, in. 19.5 Input Capacity 80,000 Duct Width, in. 21.125
Output Capacity 64,000 DOE-Rated AFUE 80
Field Data Reported Airflow (CFM) 619 Temperature Rise, °F 86
O2% 10.8 ESP, in. w.c. 0.9 Flue Temperature, °F 511

16
3.6.6 Lennox G23Q4/5-100-4 The G23Q4/5-100-4 model is a mid-efficiency furnace using an induced draft combustion system. The unit was built in January 1998 and removed from service in September 2012.
Figure 8. Furnace #6 Lennox
Table 11. Furnace #6 Lennox
Specifications Manufacturer Lennox Height, in. 46.25
Model G23Q4/5-100-4 Width, in. 22.25 Serial Number 5898A 35920 Depth, in. 28.5
Year January 1998 Duct Depth, in. 18.75 Input Capacity 100,000 Duct Width, in. 19
Output Capacity 80,000 DOE-Rated AFUE 80
Field Data Reported Airflow (CFM) 841 Temperature Rise, °F 89
O2% 13.3 ESP, in. w.c. 0.8 Flue Temperature, °F 562

17
3.6.7 Amana GUC090X50B The GUC090X50B model is a high-efficiency direct vent condensing gas furnace. The front panels for this furnace were missing and new panels were fabricated. The unit was built in September 1996 and removed from service in September 2012.
Figure 9. Furnace #7 Amana
Table 12. Furnace #7 Amana
Specifications Manufacturer Amana Height, in. 48
Model GUC090X50B Width, in. 24.625 Serial Number 9609152460 Depth, in. 28
Year September 1996 Duct Depth, in. 19.75 Input Capacity 90,000 Duct Width, in. 23.125
Output Capacity 85,000 DOE-Rated AFUE 94.4
Field Data Reported Airflow (CFM) 1071 Temperature Rise, °F 53
O2% 12.9 ESP, in. w.c. 0.8 Flue Temperature, °F 144

18
3.6.8 Rheem RGOA100CER The RGOA100CER model is an atmospheric gas furnace with a draft diverter. This furnace could not be tested because it was damaged beyond repair during shipping. The unit was built in August 1991 and removed from service in September 2012.
Figure 10. Furnace #8 Rheem
Table 13. Furnace #8 Rheem
Specifications Manufacturer Rheem Height, in. 46.25
Model RGOA100CER Width, in. 17.5 Serial Number MN3D104 F3491 0205 Depth, in. 28.125
Year August 1991 Duct Depth, in. 20 Input Capacity 100,000 Duct Width, in. 16
Output Capacity 65,000 DOE-Rated AFUE 65
Field Data Reported Airflow (CFM) 997 Temperature Rise, °F 84
O2% 10 ESP, in. w.c. 0.8 Flue Temperature, °F 497

19
3.6.9 Armstrong GUK075D14-18 The GUK075D14-18 model is a direct-vent high-efficiency condensing gas furnace. It was manufactured in September 1994 and removed from service in September 2012.
Figure 11. Furnace #9 Armstrong
Table 14. Furnace #9 Armstrong
Specifications Manufacturer Armstrong Height, in. 46
Model GUK075D14-18 Width, in. 22 Serial Number 8494J33762 Depth, in. 28
Year September 1994 Duct Depth, in. 19.5 Input Capacity 75,000 Duct Width, in. 20.75
Output Capacity 67,000 DOE-Rated AFUE 90
Field Data Reported Airflow (CFM) 693 Temperature Rise, °F 86
O2% 12.2 ESP, in. w.c. 0.9 Flue Temperature, °F 555*
*Reported value

20
3.6.10 Trane TUS060A936AO The TUS060A936AO model is an atmospheric gas furnace with a draft diverter. Front panels were fabricated to replace those lost in shipment. The center heat exchanger mounting screw was replaced. The unit was manufactured in September 1987 and removed from service in September 2012.
Figure 12. Furnace #10 Trane
Table 15. Furnace #10 Trane
Specifications Manufacturer Trane Height, in. 49
Model TUS060A936AO Width, in. 18.125 Serial Number B36599305 Depth, in. 28.125
Year September 1987 Duct Depth, in. 20 Input Capacity 60,000 Duct Width, in. 17
Output Capacity None Found DOE-Rated AFUE 68.4
Field Data Reported Airflow (CFM) 604 Temperature Rise, °F 87
O2% 11.3 ESP, in. w.c. 0.8 Flue Temperature, °F 497
21
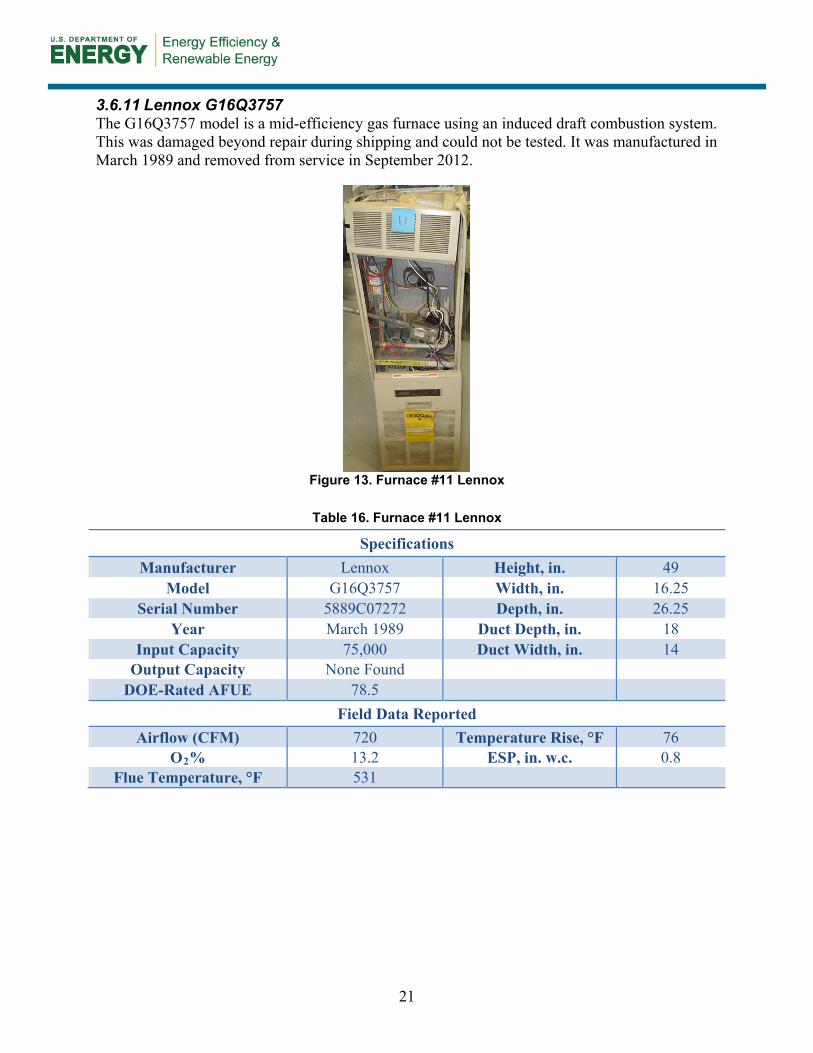
3.6.11 Lennox G16Q3757 The G16Q3757 model is a mid-efficiency gas furnace using an induced draft combustion system. This was damaged beyond repair during shipping and could not be tested. It was manufactured in March 1989 and removed from service in September 2012.
Figure 13. Furnace #11 Lennox
Table 16. Furnace #11 Lennox
Specifications Manufacturer Lennox Height, in. 49
Model G16Q3757 Width, in. 16.25 Serial Number 5889C07272 Depth, in. 26.25
Year March 1989 Duct Depth, in. 18 Input Capacity 75,000 Duct Width, in. 14
Output Capacity None Found DOE-Rated AFUE 78.5
Field Data Reported Airflow (CFM) 720 Temperature Rise, °F 76
O2% 13.2 ESP, in. w.c. 0.8 Flue Temperature, °F 531

22
3.6.12 Lennox GH6D 100M The GH6D 100M model is an atmospheric gas furnace that uses a draft diverter. This furnace could not be tested because the height exceeded the test chamber capability. The unit was manufactured in May 1963 and removed from service in September 2012.
Figure 14. Furnace #12 Lennox
Table 17. Furnace #12 Lennox
Specifications Manufacturer Lennox Height, in. 60.75
Model GH6D 100M Width, in. 21 Serial Number None Found Depth, in. 27.5
Year May 1963 Duct Depth, in. 17 Input Capacity 100,000 Duct Width, in. 19
Output Capacity 80,000 DOE-Rated AFUE N/A
Field Data Reported Airflow (CFM) 861 Temperature Rise, °F 88
O2% 11.5 ESP, in. w.c. 0.8 Flue Temperature, °F 485

23
4 Analysis
Gas furnace efficiency was determined using five different metrics to compare laboratory and field performance. Table 18 below shows the efficiency metrics.
Table 18. Efficiency Measurements Efficiency
Metric Description
SSE FC Calc Steady-state efficiency under field conditions calculated from field data SSE FC LM Steady-state efficiency under field conditions as measured in the lab
SSE SC LM Steady-state efficiency under ASHRAE Standard 103 test conditions measured in the lab; airflow and input rate adjusted
AE FC LM AE using ASHRAE Standard 103 under field conditions measured in the lab
AE SC LM AE using ASHRAE Standard 103 test conditions measured in the lab; airflow and input rate adjusted to Standard 103 conditions
4.1 Steady-State Efficiency Steady-state efficiency was measured under constant load conditions in the field and in the lab (thermostat calling for heat). Field data were reported by the HVAC contractor. Lab testing included the Gas Technology Institute rack-mounted combustion analyzer system that is calibrated daily and the instruments used in the Standard 103 test procedure as discussed earlier in this report. Field conditions are based on handheld combustion analyzers, digital static pressure transducers for ESP, and a flow plate for airflow rate.
Table 19 shows the data collected in the field and the manufacturer-recommended temperature rise. Note that in almost every case, the furnaces were operating in the field above the manufacturer’s temperature rise recommendation.
Table 19. Furnace Field Data and Steady-State Efficiency
Number Manufacturer O2 (%)
ESP (in.
w.c.)
Airflow Rate
(CFM)
Flue Temperature
(°F)
Temperature Rise (°F)
Manufacturer Temperature Rise Range
(°F) 1 ICP 9.6 0.9 920 467 84 30–60 2 ICP 11.3 0.7 878 504 73 40–70 3 Lennox 13.2 0.6 947 548 88 70–100 4 ICP 12 0.9 792 433 90 30–60 5 Fraser-Johnston 10.8 0.9 619 511 86 20–50 6 Lennox 13.3 0.8 841 562 89 30–60 7 Amana 12.9 0.8 1071 144 53 35–65 9 Armstrong 12.2 0.9 693 555 86 50–80
10 Trane 11.3 0.8 604 497 87 40–70

24
Because AFUE and AE cannot be measured in the field, steady state efficiency is used as a field efficiency indicator. A comparison was made with the calculated steady-state efficiency value from field data and steady-state efficiency under the Standard 103 conditions as measured in the lab, SSE SC LM. Table 20 shows the steady-state efficiency calculated from the field data and SSE SC LM measured in the lab under Standard 103 test conditions of 0.2 in. w.c. ESP. In all cases, the field value is less than the laboratory-measured value.
Table 20. Steady-State Efficiency Comparison
Number Manufacturer SSE FC Calc SSE SC LM 1 ICP 76.8 80.4 2 ICP 73.3 81.4 3 Lennox 67.5 77.2 4 ICP 75.1 80.5 5 Fraser Johnston 73.7 79.7 6 Lennox 66.5 81.2 7 Amana 87.0 93.7 9 Armstrong 88.1 88.6 10 Trane 73.5 76.3
Figure 15 compares the steady-state efficiency between the field and Standard 103 conditions. The 45-degree line represents perfect agreement, above the line means the lab measured value is greater, or conversely that the calculated value from field measurement is lower. The difference between the means is 6.4%. A paired t-test of the null hypothesis that the sample means are not different from each other at p < 0.05 is rejected based on a statistical analysis. The means are significantly different for these two data sets, indicating poor performance in the field caused by poor installation practices or misadjustment.
Figure 15. Steady-state efficiency field and Standard 103 lab conditions
25
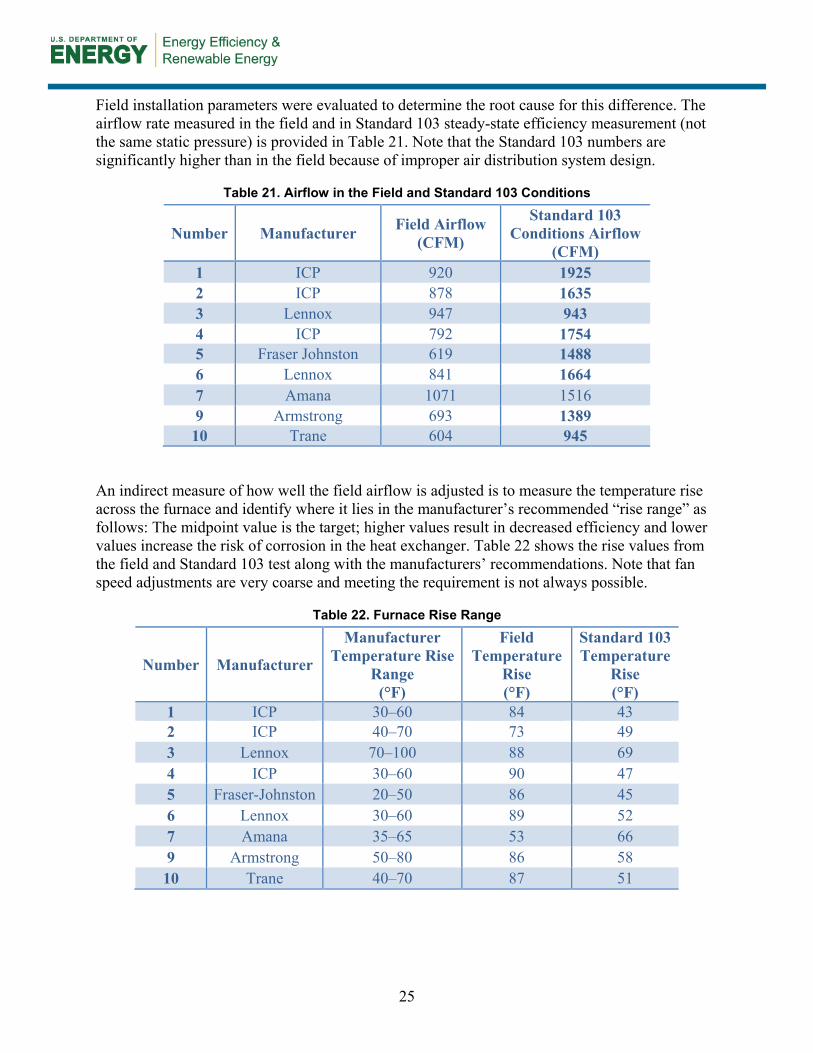
Field installation parameters were evaluated to determine the root cause for this difference. The airflow rate measured in the field and in Standard 103 steady-state efficiency measurement (not the same static pressure) is provided in Table 21. Note that the Standard 103 numbers are significantly higher than in the field because of improper air distribution system design.
Table 21. Airflow in the Field and Standard 103 Conditions
Number Manufacturer Field Airflow (CFM)
Standard 103 Conditions Airflow
(CFM) 1 ICP 920 1925 2 ICP 878 1635 3 Lennox 947 943 4 ICP 792 1754 5 Fraser Johnston 619 1488 6 Lennox 841 1664 7 Amana 1071 1516 9 Armstrong 693 1389 10 Trane 604 945
An indirect measure of how well the field airflow is adjusted is to measure the temperature rise across the furnace and identify where it lies in the manufacturer’s recommended “rise range” as follows: The midpoint value is the target; higher values result in decreased efficiency and lower values increase the risk of corrosion in the heat exchanger. Table 22 shows the rise values from the field and Standard 103 test along with the manufacturers’ recommendations. Note that fan speed adjustments are very coarse and meeting the requirement is not always possible.
Table 22. Furnace Rise Range
Number Manufacturer
Manufacturer Temperature Rise
Range (°F)
Field Temperature
Rise (°F)
Standard 103 Temperature
Rise (°F)
1 ICP 30–60 84 43 2 ICP 40–70 73 49 3 Lennox 70–100 88 69 4 ICP 30–60 90 47 5 Fraser-Johnston 20–50 86 45 6 Lennox 30–60 89 52 7 Amana 35–65 53 66 9 Armstrong 50–80 86 58 10 Trane 40–70 87 51

26
Airflow was not set within the rise range for many of these furnaces in the field, or the ductwork was too small to achieve the required airflow. Note that most field furnaces were operating at the top or above the rise range, resulting in lower steady-state efficiency.
As a final note on field adjustments, input rate adjustments were not required for laboratory testing of the furnaces except for furnace #10. This furnace was received set at 76,000 Btu/h compared to the 60,000 Btu/h on the label. There was no individual test to determine the efficiency change associated with adjusting the input in isolation, but adjusting both the input rate and airflow improved the steady-state efficiency by 2.8% for this furnace.
PARR attempted to measure the steady-state efficiency of the furnaces under field airflow and static pressure conditions (SSE FC LM) to determine if the field conditions could be replicated in the lab. Table 23 shows the field-measured airflow rate and the lab-measured airflow rate when the furnaces were installed to the same reported ESP conditions needed to replicate the ductwork pressure drop from the field. There is a significant discrepancy between these two values, for reasons unknown to the investigator. It is likely that either the reported field ESP or field airflow measurements are not reliable. Potential causes are that the flow plate replaced a dirty filter or that the return duct geometry was not suitable for use with the flow plate.
Table 23. Airflow Rate Differences in the Field and Lab at the Same Static Pressure
Furnace Field-Measured
Airflow Rate (CFM)
Lab-Measured Airflow Rate
(CFM) 1 920 1,288 2 878 1,206 3 947 661 4 792 1,048 5 619 938 6 841 1,407 7 1,071 1,516 9 693 955 10 604 665
PARR elected to set up the furnaces in the lab according to the static pressure reading rather than the airflow reading, because it was considered to be the more accurate of the two field measurements. SSE FC LM was compared to the steady-state efficiency under the conditions in Standard 103 (SSE SC LM). Recall that that the Standard 103 condition test is done after airflow adjustments are made and the input rate is adjusted.
Table 24 shows the differences between the two values.

27
Table 24. Steady-State Efficiency Measured in the Lab
Furnace
Field Conditions Lab-Measured Steady-State
Efficiency (SSE FC LM), %
Standard 103 Conditions Lab-Measured Steady-
State Efficiency (SSE SC LM), %
1 79.3 80.4 2 80.6 81.4 3 74.8 77.2 4 77.2 80.5 5 79.1 79.7 6 80.9 81.2 7 90.9 93.7 9 88.3 88.6 10 76.7 76.3
Figure 16 shows the two efficiency values on a chart; the 45-degree line represents perfect agreement.
Figure 16. Steady-state efficiency field and Standard 103 lab conditions The test results show that there is still a statistically significant difference between the two means, but it is only on the order of 1.2% because replicating the field environment in the lab is difficult.
4.2 Annual Fuel Utilization Efficiency and Annualized Efficiency AFUE is the DOE efficiency rating point as measured under specific conditions in the lab. In this report, AE is used for the Standard 103 rating point. When tested according to Standard 103

28
without change, Annualized Efficiency Standard Conditions Lab Measured (AE SC LM) is used. When Standard 103 is modified to reflect field conditions, Annualized Efficiency Field Conditions Lab Measured (AE FC LM) is used. Table 25 provides the test results.
Table 25. AE Under Field and Standard 103 Conditions
Furnace AE Field Conditions (AE FC LM), %
AE Standard 103 Conditions (AE SC LM), %
1 80.47 81.04 2 82.7 82.9 3 70.6 73.0 4 79.1 81.3 5 80.5 81.1 6 81.5 82.5 7 92.7 94.9 9 91.3 91.8 10 71.7 69.6
Figure 17 shows the data in graphical form where the 45-degree line indicates perfect agreement.
Figure 17. AE field and Standard 103 lab conditions Using the same paired t-test for significance with this data set, the mean difference of 0.8% is not significant when testing AE under field and AE under Standard 103 conditions in the lab. The difficulty associated with setting up field conditions in the lab, as mentioned in the steady-state efficiency analysis, coupled with the four heat-up, cool-down, and condensate collection parts of the test masks the differences.

29
Table 26 shows the difference between the rated AFUE on the furnace and the lab-measured value under Standard 103 conditions (AFE SC LM). This test does not rely on replicating the field conditions in the lab. A comparison is made between these values, though the individual furnaces were not rated for AFUE when they were new and the test procedures are not identical.
Table 26. Rated AFUE and AE Under Standard 103 Conditions
Furnace Rated AFUE (%)
AE Standard Conditions (AE SC LM), %
1 80.5 81.0 2 80.1 82.9 3 72.5 73.0 4 80.5 81.3 5 80.0 81.1 6 80.0 82.5 7 94.4 94.9 9 90.0 91.8 10 68.4 69.6
Figure 18 shows the data in graphical form.
Figure 18. Rated AFUE compared to AE Standard 103 lab conditions
Using the same hypothesis testing, there is a significant difference between the rated AFUE and the lab-measured AE from Standard 103 for this data set, at 1.3%. There are several potential reasons for the slight difference, including differences in the test procedures, changes to the standards over time, sampling differences, bias in the test, or emissivity changes from oxidation of the heat exchangers. Standard 103 is revised every 4 years and the DOE standard also

30
undergoes periodic revision, so it is possible that the DOE rating test procedure was significantly different than the 2007 Standard.
The hypothesis that there is a time dependence to furnace efficiency is tested in Section 4.3.
4.3 Efficiency Change With Time The efficiency measurements for the furnaces collected from the field provide a unique opportunity to evaluate changes to the efficiency of furnaces with time.
Figure 19 plots the age of the furnace versus percent change per year of furnace efficiency as measured by the difference from rated AFUE and AE measured in the lab (AE SC LM), which is independent of field measurement.
Figure 19. Efficiency change versus age A linear fit of the data did not result in a slope or intercept value that was statistically significant. The implications are that there is no time dependency in this metric. It is also possible that there is some bias in the AE test compared to the rated DOE value, as mentioned earlier. At minimum, the authors contend that these data can be used to conclude that there is no time dependency to the AE measurement when using rated AFUE as a baseline; thus, the degradation predicted by Equation 1 is not supported in this research.
A final comparison was made between efficiency change, as calculated by rated AFUE-AE SC LM, versus age to determine if there was a relationship between the two. The graph is provided in Figure 20.

31
Figure 20. Rated AFUE versus efficiency change per year This analysis shows that there is no relationship between rated AFUE and a linear efficiency change per year.

32
5 Results and Discussion
The primary objective of this project was to determine how age and adverse installation conditions affect natural gas field performance as measured by AE. The results from this study are summarized below:
1. There is a significant difference between the steady-state efficiency calculated from field data and the steady-state efficiency measured in the lab under Standard 103 conditions. The difference in the mean is 6.4%. An analysis of the nine data points in Figure 16 using a paired student t-test and p < 0.05 for significance indicates that the two data sets are significantly different. The implication is that field performance is 6.4% lower than rated conditions for this sample because of poor installation practices or misadjustment.
2. There is a significant difference between steady-state efficiency measured in the lab under field conditions and Standard 103 conditions, at 1.2%. Replicating the field environment proved to be difficult in this test. Because the furnaces were removed from their installation sites, additional field data could not be collected.
3. There is no significant difference between AE under field conditions and AE under Standard 103 conditions measured in the lab. The difficulty associated with setting up field conditions in the lab, as mentioned above, coupled with the four heat-up, cool-down, and condensate collection parts of the test may mask the difference.
4. The mean lab-measured AE from the Standard 103 is 1.3% higher than rated AFUE, a statistically significant difference. This test does not rely on replicating field conditions in the lab. There are several potential reasons for this finding, including differences in the test procedures, changes to the standards over time, sampling differences, bias in the test, or emissivity changes from oxidation of the heat exchangers. Standard 103 is revised every 4 years and the DOE standard also undergoes periodic revision, so it is possible that the older equipment was measured under a procedure no longer included in the Standard 103.
5. Testing a linear fit of efficiency with time was not significant for either the slope or intercept values. The implications are that there is a nonzero increase in rated AFUE, but it is not time dependent, indicating that the change happens in the first 15 years of field use. It is also possible that there is some bias in the lab test compared to the DOE standard, as mentioned earlier. The authors conclude that the degradation predicted by Equation 1 is not supported in this research.
The research questions are addressed below:
Q1: What is the degradation in furnace efficiency for typical field installation compared to the rated performance?
A1: Furnace steady-state efficiency calculated from field data is 6.4% below that measured in the laboratory under Standard 103 conditions, a statistically significant difference.

33
Q2: How should efficiency values be modified in models (such as BEopt) to account for degradation, especially for retrofit situations?
A2: BEopt and other models do not need to adjust for differences between rating conditions and the field environment for furnaces that are installed properly.
Q3: How do rated and measured efficiency compare for vintage furnaces?
A3: Older furnaces show no degradation of performance over an average lifetime of 19 years. From the data, time is not a significant variable in the regression, so there may be an initial increase or a slight bias caused by differences in test standards.

34
6 Conclusions and Recommendations
The conclusions of this research are that the rated DOE AFUE is a good measure of the performance of natural gas furnaces in the field where the installation instructions are followed. Field conditions are difficult to replicate in the laboratory, so lab testing that replicates the field environment requires more study. Efficiency comparisons between the rated value and the Standard 103 test in the lab show no degradation after an average lifetime of 19 years, in fact a slight increase was measured. Using this comparison, the efficiency levels do not show a significant time dependency.
PARR recommends that BEopt and other models continue to use the DOE-rated AFUE without adjustment for installation practices or degradation with time. This data set supports those recommendations. Field measurements of efficiency, static pressure, and airflow (using a flow plate) were inconsistent in this study when compared to laboratory measurements. It is recommended that field measurements be used only as a general indicator of performance when tuning a furnace or adjusting airflow, not as an absolute indication of performance for modeling or energy savings analysis.
PARR conducted this investigation to determine which deficiencies in the field, if any, hold the largest energy saving potential. Setting the furnace on rate, and tuning the fan to the manufacturer’s recommended rise range (temperature rise across the furnace) are the two most significant factors in achieving good performance, as recommended by the manufacturer. If the fan speed cannot be adjusted properly, changes to the distribution system need to be made. A qualified installer should follow the manufacturer’s installation instructions regarding these and other settings to get the best performance.
Future natural gas furnace testing is recommended to add data to the cases where a relationship could not be determined in this project: replicating field conditions in the lab and establishing efficiency change with time. For example, a test where furnaces are rated, installed in the field for normal operation, and then re-rated by the rating agency using the same DOE test procedure to determine if there is a significant degradation in the rating point. It may also be valuable to determine if a poorly installed furnace would operate significantly below the rating point. Examples would be furnaces working outside the rise range (very high or very low), and furnaces cycling off the high limit controller for a significant part of the time. Finally, simulation models have improved significantly since rated AFUE was first used as an indicator of performance. Research is recommended to identify several performance metrics that can be used by simulations to improve the agreement between calculated and actual field performance.
35
References
ASHRAE (1982). Standard “Method of Testing for Heating Seasonal Efficiency of Central Furnaces and Boilers.” ANSI/ASHRAE Standard 103-1982, Approved by the ASHRAE Board of Directors on October 1, 1982.
ASHRAE (2007). Standard “Method of Testing for Annual Fuel Utilization Efficiency of Residential Central Furnaces and Boilers.” ANSI/ASHRAE Standard 103-2007, Approved by the ASHRAE Board of Directors on June 27, 2007.
Brand, L.; Rose, W. (2012). Measure Guideline: High Efficiency Natural Gas Furnaces. Gas Technology Institute, Des Plaines IL, DOE/GO-102012-3684.
Brand, L. (2012). Expert Meeting Report: Achieving the Best Installed Performance from High-Efficiency Residential Gas Furnaces. Gas Technology Institute, Des Plaines IL, 2012
Buildings Energy Data Book, 2.1 Residential Sector Energy Consumption, Section 2.1.5 2010 Residential Energy End-Use Splits, by Fuel Type (Quadrillion Btu). Accessed February 2015: http://buildingsdatabook.eren.doe.gov/docs/xls_pdf/2.1.5.pdf.
Burdick, A. (2011). Strategy Guideline: Accurate Heating and Cooling Load Calculations. Golden, CO: National Renewable Energy Laboratory. NREL/SR-5500-51603.
Hendron, R., Engebrecht, C. (2010), Building America House Simulation Protocols.” Golden, CO: National Renewable Energy Laboratory. NREL/TP-550-49426.
Polly, B.; Kruis, N.; Roberts, D. (2011). Assessing and Improving the Accuracy of Energy Analysis for Residential Buildings. Golden, CO: National Renewable Energy Laboratory. NREL/TP-5500-50865.
Yee, S.; Baker, L.; Brand, L.; Wells, J. (2013). “Energy Savings from System Efficiency Improvements in Iowa’s HVAC SAVE Program.” Chicago, IL: Midwest Energy Efficiency Alliance.

DOE/GO-102015-4624 ▪ February 2015


![[-]GDG UPFLOW GAS FURNACE Form 92-21650-34-04...Title [-]GDG UPFLOW GAS FURNACE Form 92-21650-34-04 Subject: GAS FURNACE UPFLOW Keywords: GDG, GAS, UPFLOW, FURNACE, [-]GDG, 92-21650-34-04](https://img.pdfslide.net/doc/110x75/60adbca1a05ef2753c1c4a21/-gdg-upflow-gas-furnace-form-92-21650-34-04-title-gdg-upflow-gas-furnace.jpg)