Embed Size (px)
Citation preview

IMPROVING HEALTH and BUILDING PROSPERITY:A Por olio of Interven ons to Reduce the Human and Economic Burden of Malnutri on in Women and Children of Georgia

© United Na ons Children’s Fund 2012
UNICEF9 Eristavi Str. UN House0179, Tbilisi, GeorgiaTel: 995 32 – 2 23 23 88, 2 25 11 30e-mail: [email protected] www.unicef.ge
December 2012

The Economic Consequences Of Malnutri on in Georgia
IMPROVING HEALTH and BUILDING PROSPERITY:
A Por olio of Interven ons to Reduce the Human and Economic Burden of Malnutri on in Women and Children of Georgia


1
EXECUTIVE SUMMARY
Reduc on of malnutri on can generate human and social capital to fuel na onal economic de-velopment. Extensive evidence demonstrates that nutri onal defi cits in pregnant women and young children have consequences not only for health and survival but also for physical and intellectual growth, school performance and ul mately produc vity and economic growth. A review of 8 basic indicators of nutri on status included in the Health Care Sta s cal Yearbook (2010-11) and the Georgia Na onal Nutri on Survey (2009), suggests half a million Georgians, mainly women and children, suff er some form of malnutri on – and will not achieve their full poten al as students, workers, ci zens and parents.
This analysis applies global evidence of heightened mortality or morbidity risks as well as mental development and physical performance defi cits associated with specifi c indicators of malnutri on to Georgia’s na onal health, demographic and economic environment. The resul ng Damage Assess-ment Report (DAR) roughly describes the magnitude of the na onal burden of malnutri on.
Nearly 300 annual deaths of children < 5 years as a result of maternal anemia, low birth weight, folic acid related birth defects and subop mal breas eeding.
Defi cits in cogni ve development of children as a result of iron defi ciency and stun ng indicate future produc vity losses valued at a Net Present Value of more than $60 million annually.
Work performance and produc vity of adults engaged in manual labor is depressed more than $20 million annually as a result of their iron defi ciency anemia.
Low birth weight deliveries, folic acid related birth defects and non-exclusive breas eeding are associated with excess u liza on of and social services valued at nearly $15 million annually.
Over 10 years this na onal burden of malnutri on is es mated at $1.3 billion, including about 3400 premature deaths of children.
This burden simultaneously defi nes an opportunity for signifi cant health, social and economic devel-opment benefi ts that can be achieved via simple, feasible and aff ordable nutri on interven ons. This paper proposes a package of evidence-based and proven nutri on supplementa on and educa on interven ons that target the specifi c indicators measured in the DAR and strategically focus on peri-ods of highest risk, 5 Life-cycle Segments where the documented threat and burden is the greatest:
Segment 1 Pregnancy: Micronutrient supplementa on and nutri on educa on integrated into ongoing antenatal services in order to safeguard pregnancy and improve birth outcomes.
Segment 2 Maternity: Enhanced counseling in maternity facili es promo ng early con n-ued exclusive breas eeding as part of rou ne maternity care.
Segment 3 Infant 0-6 Months: Maternal micronutrient supplements with intensive breast-feeding promo on and nutri on educa on during me of highest mortality risk for infants.
Segment 4: Infant/Toddler 6-24 months: Child feeding and care educa on along with mul- ple micronutrient powders to improve nutrient density to complementary foods.
Segment 5: Popula on-wide interven on: Na onal fl our for fi ca on with iron and folic

2
IMPROVING HEALTH AND BUILDING PROSPERITY
acid; na onal mul -media campaigns to support targeted behavior change.Implementa on of this proposed por olio of preventa ve nutri on interven ons is considered fea-sible with li le or no investment in addi onal demand crea on and minimal investment in develop-ment of policies, standards and human capacity. Current coverage of the na onal health care system as refl ected in delivery of antenatal care, vaccina on and other services suggests these interven ons may reach 75-95% of the target popula on for each of the 5 Life-Cycle Segments above. Published interna onal evidence evalua ng eff ec veness of the proposed por olio suggests that the 10-Year burden of $1.3 billion may be reduced by one-quarter – and prevent nearly 1000 childhood deaths.
PROJECTED 10 YEAR BENEFITS VIA IPNS INTERVENTIONS AT SCALE
Nutri on Indicator Baseline DAR Eff ec veness Coverage Program Benefi t
Underweight $5.32 25% 74.0% $0.98
Low Birth Weight $106.20 10% 92.7% $9.84
Perinatal Death $62.47 25% 92.7% $14.48
Sub Op mal Breas eeding $83.58 50% 94.6% $39.53
Neural Tube Defect $62.39 70% 77.5% $33.85
Stun ng $520.75 25% 74.0% $96.29
Iron Defi ciency Children $203.42 30% 78.0% $47.60
Iron Defi ciency Anemia Adults $269.20 50% 75.0% $100.95
Total 8 Indicators $1,313.34 $343.53
A review of domes c and interna onal inputs and costs indicates 10 year benefi ts of $343 mil-lion may be secured with programs requiring ~$15 million in fi nancing – from consumers, gov-ernment agencies and industry. This suggests a benefi t cost ra o of >20 – for each $1 invested the proposed por olio may return more than $20 in benefi ts. This compares favorably with many investments included in Georgia’s 10 Point Plan for Strategic Development. This interven- on por olio can make substan al and cost-eff ec ve contribu ons towards the goals of Georgia
Health Strategy which include reducing premature death “primarily among children” as well as reducing general morbidity and associated disabili es. These investments maternal and child nutri on are key to “enhancement of maternal and child health services,” a key objec ve of the Georgia Health Care Strategy.
Therefore, this integrated por olio of nutri on interven ons merits serious considera on. We recommended developing a mul sectoral process to more fully elaborate implementa on and fi nancing mechanisms for the programs summarized above. Some specifi c next steps include:
Reform standards for antenatal care and service delivery based on WHO Integrated Man-agement of Pregnancy and Childbirth Standards for Maternal and Neonatal Care.
Establish standards for distribu on of mul ple micronutrient powders for children 6-24 months of age based on WHO Guidelines for Use of Mul ple Micronutrient Powders for Home For fi ca on of Foods Consumed by Infants and Children 6–23 months of Age
Considera on of mandatory standards for for fi ca on domes c and imported fl our based on WHO Recommenda ons for Wheat and Maize For fi ca on.

3
The Economic Consequences Of Malnutri on in Georgia
THE ECONOMIC CONSEQUENCES OF MALNUTRITION
IN GEORGIA:

4

5
The Economic Consequences Of Malnutri on in Georgia
TABLE OF CONTENTS
1. Background & Ra onale 6
2. Child Mortality A ributable to Malnutri on 10
2.1 Underweight ...................................................................................................................102.2 Low Birth Weight ............................................................................................................122.3 Perinatal Mortality A ributed to Anemia in Pregnancy ..................................................122.4 Mortality A ributed to Sub-Op mal Breas eeding ........................................................13 2.5 Neural Tube Defects: .......................................................................................................13 2.6 Summary of Child Mortality A ributed to 5 Malnutri on Indicators ..............................15 2.7 Es ma ng Value of Workforce Lost to Child Mortality ...................................................16
3. Depressed Future Produc vity of Children 17
3.1 Stun ng or Small Stature ................................................................................................173.2 Anemia in Children: .......................................................................................................183.3 Long Term Disability from Folic Acid Related Neural Tube Defects ................................19
4. Depressed Current Produc vity: Anemia in Adult Workers 20
5. Excess Healthcare Expenditures 23
5.1 Excess Healthcare Costs Due to Subop mal Breas eeding ............................................235.2 Costs Associated with Low Birth Weight Deliveries ........................................................255.3 Medical and Welfare Costs Associated with Folic Acid Related Birth Defects .................26
6. Summary: Na onal Economic Consequences of Child Malnutri on 28

6
IMPROVING HEALTH AND BUILDING PROSPERITY
1. BACKGROUND & RATIONALEScien fi c understanding of malnutri on has expanded beyond protein energy malnutri on associated clinical condi ons like kwashiorkor and nutri onal marasmus – and with devasta ng images of starva on. Over the past decade the evidence has increasingly recognized that this tragic and visible form of malnutri on represents “the small p of the iceberg…. only 1-5% of the burden of malnutri on.”1 Consequently freedom from hunger is defi ned as an environment where poor nutri on is no longer an impediment to survival, health or the achievement of full human poten al and “people, at all mes, have physical, social and economic access to suffi cient, safe and nutri ous food which meets their dietary needs and food preferences for an ac ve and healthy life.”2
Poverty, malnutri on, and poor child development are locked in a vicious cycle of poor health, lower learning capacity, diminished physical ac vity and lower work performance or produc vity. As this cycle threatens health and survival, it simultaneously erodes the founda on of economic growth - people’s strength and energy, crea ve and analy cal capacity, ini a ve and entrepreneurial drive. Extensive evidence demonstrates that lack of op mal nutri on for young children has consequences not only for health and survival but also for physical and intellectual growth, school performance and ul mately future earnings and produc vity. When indicators of subop mal child nutri on are widespread, the aggregate burden on na onal economic growth can be signifi cant. Achieving reduc ons in the prevalence of malnutri on can substan ally reduce this na onal burden as well as generate human and social capital to fuel economic development. Data from the Health Care Yearbook for 2010 and the Georgia Na onal Nutri on Survey 2009, shown in Table 1, indicates approximately half a million Georgians, mainly women and children, suff er some form of malnutri on. Underweight children, one of the tradi onal indicators of malnutri on represents only < 1% of total malnutri on of Georgia. The seven addi onal indicators defi ne the true burden of malnutri on to the human, social and economic development of Georgia. In some cases, such as maternal anemia, low birth weight or insuffi cient breas eeding, malnutri on represents an immediate threat to health and survival. In other cases, such as childhood anemia or stun ng, the individual consequences are rela vely modest defi cits in physical growth, mental development and work performance. But with wide segments of the popula on aff ected, these modest defi cits accumulate with overwhelming na onal impact. In all cases, these indicators of malnutri on prevent Georgian children and adults from achieving their full poten al as students, workers, ci zens and parents.
Table 1: Summary of 8 Key Nutri on Indicators in Georgia
Nutri onIndicator
Risk Group
Na onal Prevalence (%)
Es mated #/yr Aff ected
Risk or Defi cit
Underweight Children < 5 yrs 1.7%3 4,650 Mortality
Stun ng Children < 5 yrs 11.3%4 31,102 Retarded Development
Low Birth Weight Infants 5.4% 5 3,412Mortality, Morbidity,
Growth
1 Latham, Michael, Human Nutri on in the Developing World, Food and Nutri on Series - No. 29 FAO 1997 2 World Food Summit, 1996 United Na on’s Food & Agricultural Organiza on, Food p:// p.fao.org/es/esa/policybriefs/pb_02.pdf3 Georgia Na onal Nutri on Survey 2009 plus assump on that rate of mild underweight is the same as moderate underweight.4 IBID 5 Health Care Sta s cal Yearbook, 2010, Ministry of Labor, Health and Social Aff airs & Na onal Center for Disease Control and Public Health.

7
The Economic Consequences Of Malnutri on in Georgia
Anemia
Children < 15 years 22.8%6 62,791Mental Development
Defi cit
Working Age Women
24.1%7 385,360Work Performance,
Earnings
Births to Anemic Women
25.6%8 16,132Risk of Perinatal
Mortality
Sub-Op mal Breas eedChildren 0-24
months45.2%9 56,966 Mortality and Morbidity
Folic Acid Related Birth Defects
All Births 2/100010 126 Mortality and Disability
The scien fi c literature has developed substan al evidence defi ning heightened mortality or morbidity risks as well as mental development and physical performance defi cits associated with each of these 8 indicators – expressed as rela ve risk (RR) or defi cit (%). In this analysis, these “coeffi cients of loss” are applied to the na onal health, educa on, demographic and economic environment to develop a na onal Damage Assessment Report (DAR). The DAR is a rough scenario describing the magnitude of the na onal burden emerging from the status quo of these 8 indicators. This simultaneously defi nes the signifi cant na onal development benefi ts of simple, feasible and cost eff ec ve interven ons to lower the burden.
The DAR assesses the magnitude of consequences from these 8 nutri on indicators via 4 discrete pathways to economic loss:
Mortality and disability in children with consequent lost value of a future workforce. Child cogni ve development defi cit resul ng in inferior school performance and adult pro-
duc vity. Current value of depressed produc vity in working adults. Current value of excess and preventable healthcare and welfare u liza on.
The sec ons that follow will project the na onal economic consequences pathway by pathway and indicator by indicator. Projec ons will be based the algorithm shown in Table 2 below inpu ng demographic, labor and other economic data.
Table 2 Algorithm Used to Project Economic Losses from Each Nutri on Indicator
Number w/ Defi cit or Risk
X
Average Wage
X
Labor Force Par cipa- on
X
AverageWorking
X
Coeffi cient Risk-Defi cit
X
Dis-count for NPV
=Net Pres-ent Value of Loss
Prevalence (%) x # in Risk Group
$4407/yr 64.2% 51 yrs RR or % from Litera-ture
@ 3% $/yr (NPV)
These economic, demographic and labor data points were gathered from offi cial na onal sta s cal sources and applied as follows:
6 Georgia Na onal Nutri on Survey 2009 plus assump on that rate of for children 5-10 years is similar to < 5 years.7 IBID8 IBID9 IBID10 March of Dimes, Global Report of Birth Defects, 2001

8
IMPROVING HEALTH AND BUILDING PROSPERITY
Par cipa on in the labor force is based on GEOSTAT report of 64.2% economic ac vity rate for ci zens more than 15 years of age in 2010.11 This rate is 55.5% for women and 74.5% for men. More than half this economic ac vity is “self-employed” individuals.
Annual wage of $4407 is based on GEOSTAT report of average nominal monthly salary of GEL 597.6. Monthly salaries range from GEL 279/month in the agriculture sector to more than GEL 1000/month in fi nancial services. This average wage is about 80% of the es -mated per capita share GDP (PPP) contributed by working adults $5400.12
Average me engaged in the labor force or “working life” is es mated at 51 years. This es- mate is roughly calculated as the diff erence between 15 years of age (based on economic
ac vity rate from Labor Force Survey and WHO Healthy Work Life Expectancy). While 15 years of age is not the average age of entry into the workforce, the economic ac vity sta- s cs used from GEOSTAT begin from age 15.
Discount rate used to calculate Net Present Value is 3% recommended by the World Bank for social investment.13 Projected losses from malnutri on in today’s children do not begin un l the child enters the work force and subsequently the lost earnings stretch out as much as 66 years in the future. The Net Present Value (NPV) is used to value future lost produc- vity in present currency. The NPV “borrows” from the future at a 3% interest rate known
as the “social discount rate.” This social discount rate is not related to infl a on but merely refl ects the subjec ve me preference for current consump on over future consump on or savings.14 This enables a life me of future earnings to be expressed as a current annual economic loss and represents a frac on of “gross” earnings:15 While the basic DAR follows World Bank recommended 3% for social investments, a parallel analysis is also run at 5%.
Caveat to the Damage Assessment Report Methodology
Conver ng indicators of malnutri on to economic ac vity and a aching a monetary value to that economic ac vity travels a long and winding road. First, mone zing the consequences of malnutri on is dependent on a rela vely thin evidence base and complex methodologies as well as na onal health, demographic and economic sta s cs that are some mes not up to date or unreliable. Second, many factors beyond individual physical and intellectual poten al determine earnings or work performance. Work place incen ves, available technology and sense of opportunity all eff ect how increased human performance poten al translates into actual improved produc vity and earnings. Finally, benefi ts of improved nutri on extend beyond the workplace to a range of “voluntary” ac vi es including paren ng and household ac vi es to educa onal improvement, entrepreneurial pursuits and community par cipa on. In a world where improvement in nutri on, health and subsequent produc vity will emerge mainly from individual choices and behaviors, the signifi cance of these “voluntary” ac vi es cannot be overstated. However, these are not captured in the DAR which focuses on monetary earnings only. For all these reasons and more, the margin of error is large and the calcula ons should
11 GEOSTAT Distribu on of popula on age of 15 and older by economic status, 1998-2010, Downloaded June, 201212 CIAFactbook, h ps://www.cia.gov/library/publica ons/the-world-factbook/geos/gg.html13 World Bank, Development Report 1993: Inves ng in Health. Oxford University Press World Bank 199314 Ross et all, Calcula ng the Consequences of Micronutrient Malnutri on on Economic Produc vity, Health and Survival, AED 200315 The formula used to calculate the NPV is as follows: (# in Risk Group w/ Defi ciency X Defi cit Coeffi cient X Labor Par cipa on Rate)
X Present Value (Discount Rate, Work Life, Annual Wage) –Present Value (Discount Rate, Years un l Workforce Entry, Annual Wage) / # Annual Cohort in Risk Group

9
The Economic Consequences Of Malnutri on in Georgia
be considered as an order of magnitude. These are projec ons to focus and facilitate policy discussion.
Over the next decades, a growing Georgian economy will doubtless lower this human and fi nancial burden. However, nutri on status will respond rela vely slowly. A recent World Bank analysis of malnutri on and economic growth in 79 countries concluded “that income growth can play an important role in malnutri on reduc on, but that it is not enough. Increases in the number and eff ec veness of direct nutri on interven ons have a crucial role to play if nutri on goals are to be met.”16 According to the Disease Control Priori es Project, “Progress has been made in some areas, but the current magnitude of the problems and of the associated disease burden underscores the need for more investment in nutri onal interven ons.”17
16 Harold Alderman, Simon Appleton, Lawrence Haddad, Lina Song and Yisehac Yohannes Reducing Child Malnutri on: HowFar Does Income Growth Take Us? Centre for Research in Economic Development and Interna onal Trade, University of No ngham CREDIT Research Paper No 105
17 Laura E. Caulfi eld, Stephanie A. Richard, Juan A. Rivera, Philip Musgrove, and Robert E. Black, Stun ng, Was ng, and Micronutrient Defi ciency Disorders, Disease Control Priori es in Developing Countries, 2006

10
IMPROVING HEALTH AND BUILDING PROSPERITY
2. CHILD MORTALITY ATTRIBUTABLE TO MALNUTRITION
Table 3 Child Mortality in Georgia 18
Age Segment Rate/1000 Annual Projected Mortality
Child Mortality: < 5 Years 16.4 1033Infant Mortality: < 1Year 14.1 889Neonatal Mortality: < 1 months 9.5 599
Post Neonatal: 1-12 months 4.5 290S llbirths 7.8 682
Malnutri on rarely specifi ed as a cause of death. However, the close associa on of malnutri on, infec on, disease and premature death of children has been extensively documented with a range of data demonstra ng that malnutri on is the underlying cause of more than half of all child deaths worldwide.23 Of the
es mated 63 thousand children born in Georgia annually, 1033 die before their 5th birthday. And the fi rst month of life is the most dangerous. More than 85% of deaths among children less than 5 years of age are during the fi rst year of life – and more than half during the fi rst month.
While not listed as the offi cial cause of death, how many of these deaths are associated with malnutri on in children and their mothers? The sec ons that follow apply coeffi cients for higher risk of mortality developed in the scien fi c literature for 5 indicators of malnutri on to paint a picture of child mortality that can be a ributed to current prevalence of malnutri on in Georgia. The general methodology is outlined in Table 4.
Table 4: Projec on of Methodology for Projec ng Mortality from Malnutri on Indicators
Prevalence of Condi on
X20
Rela ve RiskMortality
=
Popula on A ributable Risk
X
Annual Deaths in Relevant Risk Group
=
Annual Deaths A ributed
% and # From Na onal Data
RR: in Scien fi c Literature Calculated From Na onal Data Deaths/Yr
2.1 Underweight
Table 5 Rela ve Risk of Mortality for Underweight Children < 5 yrs from Various Causes21
Severe< 3 SD
Moderate<2 – 3 SD
Mild< 1-2 SD
Overall 9.7 2.5 1.8Diarrhea 9.5 3.4 2.1Pneumonia 6.4 1.3 1.2Malaria 1.6 1.2 0.8Measles 6.4 2.3 1.3
Based on the recent Georgia Na onal Nutri on Survey we es mate more than 4.6 thousand children under the age of 5 years are underweight.22 Defi ned as at least one standard devia on or more below expected weight for age, these children face a signifi cant risk of premature death. A recent meta-analysis found that the
rela ve risk of death for underweight children compared to normal weight children was 10 mes
18 Reproduc ve Health Survey 2010 19 Pelle er, D. L methodology for es ma ng contribu on of malnutri on to child mortality in developing countries. J Nutr. 124:21
1994.20 This is conceptual only and represents mul ple computa ons. .21 Robert E Black, Lindsay H Allen, Zulfi qar A Bhu a, Laura E Caulfi eld, Mercedes de Onis, Majid Ezza , Colin Mathers, Juan Rivera,
Maternal and child undernutri on: global and regional exposures and health consequences Maternal and Child Undernutri on Study Group, Lancet Published OnlineJanuary 17, 2008
22 Georgia Na onal Nutri on Survey, UNICEF, NCDC, 201023 IBID.

11
The Economic Consequences Of Malnutri on in Georgia
for severe underweight (<-3 SD), 2.5 mes for moderately underweight (<-2 SD), and 1.8 mes for mildly underweight (<-1SD).24 However, this included causes of death such as malaria, measles and diarrhea which are not considered major risks for children in Georgia. Therefore, in this DAR we apply the lower rela ve risks for pneumonia – a major cause of childhood death in Georgia.25 Parameters for the DAR are reviewed below:
Since the risk of mortality is drama cally diff erent as infants grow into pre-school ages, two parallel calcula ons are run – one for a cohort of ~26 thousand children ages 1-5 months and another for ~212 thousand children 6-59 months. We exclude children in the neonatal period, comprising > 50% of child mortality, assuming that mortality and underweight in the neonatal period is related to maternal status, birth outcome and other condi ons.
Along with the Georgia Na onal Nutri on Survey fi ndings for moderate and severe under-weight, the DAR adds the conserva ve assump on that prevalence of mild underweight is equal to moderate underweight. Based this assump on, we es mate 525 young infants 1-5 months and 4126 older children 6-59 months face higher risks of mortality associated with underweight.
The dis nct rela ve risks of mortality are applied to the prevalence of underweight for mild, moderate and severe segments. This yields dis nct popula on a ributable risk (PARS) for each segment - ranging from 0.1% - 2.4% for each segment.
These parameters are summarized in Table 6 and 7 sugges ng a total of ~12 deaths per year due to underweight among children less than 5 years – about 7 among children 6-59 months and 5 in the much smaller cohort of children 1 to 5 months old. Almost all these deaths occur among the approximately 1 thousand severely underweight children.
Table 6 Projec on of Mortality A ributed to Underweight in Children `1-5 months
Prevalence of Condi on
X
Rela ve RiskMortality
=
Popula on A ributable Risk
X
Annual Deaths in Children 1-5 months
=
Annual Deaths A ributed
Mild: 0.08%25 1.2 0.2%
186
0.3 Moderate: 0.08% 1.3 0.2% 0.4 Severe: 0.04% 6.4 2.1% 3.9
Table 7 Projec on of Mortality A ributed to Underweight in Children `6-59 months
Prevalence of Condi on
X
Rela ve RiskMortality
=
Popula on A ributable Risk
X
Annual Deaths in Children 6-59 month
=
Annual Deaths A ributed
Mild: 0.74% 1.2 0.1%
249
0.4 Moderate: 0.74% 1.3 0.2% 0.6 Severe: 0.45% 6.4 2.4% 6
24 Health Care Sta s cal Yearbook, 2010, Ministry of Labor, Health and Social Aff airs & Na onal Center for Disease Control and Public Health.
25 Assume a segment with “mild” underweight equal to segment with moderate underweight. .

12
IMPROVING HEALTH AND BUILDING PROSPERITY
2.2 Low Birth Weight
O en associated with maternal anemia, 3,412 or 5.4% of births in Georgia resulted in low birth weights in 2010, infants weighing less than 2500 grams.26 These babies are at higher risk of neonatal mortality, par cularly the 428 infants born with birth weights of less than 2000 grams.27
Recent meta-analysis pooling 11 studies concludes that babies weighing 1500–1999 grams were 8.1 mes more likely to die and those weighing 2000–2499 grams were 2.8 mes more likely to die during the fi rst month of life compared to normal weight births over 2500 grams.28 However, these studies are predominantly from countries where a substan al number of births are not in a medical facility or a ended by a skilled birth a endant. Therefore, for Georgia, where ~99% of births are in a professional maternity facility, the DAR applies the lowest rela ve risk of 2.8 to all cases, including the 13% of low birth weight babies falling below the 2000 gram threshold - including 123 births below 1500 grams. As shown in Table 8, the RR of 2.8 and 5.4% prevalence yield a PAR of 8.9%. The PAR is applied to the total es mated 599 neonatal deaths in Georgia, to project 53 deaths per year as a result of low birth weight deliveries.
Table 8: Projec on of Mortality A ributed to Low Birth Weight
Prevalence of Condi on
X
Rela ve RiskMortality
=
Popula on A ributable Risk
X
Annual Deaths Neonatal Deaths
=
Annual Deaths A ributed
5.4% 2.8 8.9% 599 53 Deaths/Yr
2.3 Perinatal Mortality A ributed to Anemia in Pregnancy
Perinatal death, defi ned as number of s llbirths plus mortality during the fi rst week of life, is a major cause of child death in Georgia – more than 1 thousand deaths.29 A recent meta-analysis including 10 individual studies quan fi ed the o en observed associa on of anemia during pregnancy with perinatal death concluding that where malaria is not a signifi cant threat, as is the case in Georgia, perinatal mortality decreases 16% for every 1 gram per deciliter increase in the mother’s hemoglobin – a rela ve risk of 0.84.30
The prevalence of anemia among pregnant women found in the Georgia Na onal Nutri on Survey is 25.6%.31 Since anemia is o en the result of a range of non-nutri onal factors, the DAR focuses specifi cally on anemia caused by iron defi ciency (IDA) which is due to a lack of absorbable iron in the diet. WHO defi nes IDA as the most common form of anemia, about 50-60% of all anemias.32 However, in Georgia the prevalence malaria as well as causes of anemia not related to iron defi ciency such as vitamin A defi ciency, HIV or hook worm is low. Therefore, we expect the propor on of anemia caused by iron defi ciency is probably high - more than the 50-60% es mated by WHO for the global situa on. However, data for iron defi ciency in the Georgia Na onal Nutri on Survey found rates at only a frac on of 1% in both women and children, a fi nding that would represent the lowest rates
26 Health Care Sta s cal Yearbook, 2010, Ministry of Labor, Health and Social Aff airs & Na onal Center for Disease Control and Public Health.
27 IBID28 Black et al Maternal & child undernutri on: global and regional exposures and health consequences Maternal and Child
Undernutri on Study Group, Jan 17, 200829 Based on Health Care Sta s cal Yearbook, Ministry of Labor, Health and Social Aff airs & Na onal Center for Disease Control and
Public Health Table 2.1230 Stoltzfus RJ, Mullany L, Black RE. Iron defi ciency anaemia. In: Ezza M, Lopez AD, Rodgers A, Murray CLJ, eds. Compara ve
quan fi ca on of health risks Geneva: World Health Organiza on, 2004: 163–209.31 Georgia Na onal Nutri on Survey, UNICEF/NCDC, 201032 IBID

13
The Economic Consequences Of Malnutri on in Georgia
of iron defi ciency found anywhere in the world. Since the survey seems to suff er some systema c error, we therefore, use a well administered iron status survey of 900 women respondents from 2007 which found that 75.3% of anemic women were also iron defi cient (this survey found 27% anemia in women, similar to GNNS).33 For purposes of this analysis, the 2007 survey fi nding of 75.3% of anemia from iron defi ciency is applied to the more recent data from Georgia Na onal Nutri on Survey to project 19.3% IDA in pregnant women. Table 9 below shows parameters used derive a PAR of 12.1% which is applied separately to the 682 s llbirths and 464 es mated neonatal deaths in the fi rst week of life. The results suggest a total 139 deaths in the perinatal natal period as a result of the mother’s iron defi ciency anemia. 3435
Table 9 Projec on of Perinatal Mortality A ributed to Maternal IDA
Prevalence of Condi on (IDA)
X
Rela ve RiskMortality
=
Popula on A ributable Risk
X
Annual Perinatal Deaths =
Annual Deaths A ributed
19.3% IDA- implied defi cit 0.74 g/dL Hb
0.84 each 1 g/DlIncrease in Hb
12.1%S llbirths: 68234 68Neonatal: 46435 56
2.4 Mortality A ributed to Sub-Op mal Breas eeding
Evidence from both developing and developed countries shows the cri cal lifesaving signifi cance of exclusive breas eeding during the fi rst 6 months.36 A recent meta-analysis including studies from mul ple coun es concluded that the increased mortality risk for non-breas ed versus exclusively breas ed babies ranges from RR 10.53 for diarrhea, RR 15.13 for pneumonia and RR 14.4 from all causes.37 The risks were lower, but s ll signifi cant for predominant and par al breas eeding - ranging from RR 1.48 to 2.28. A er the fi rst 6 months, babies who are not breas ed also face higher risk of mortality than par ally breas ed infants – though these risks not as acute as during the fi rst 6 months, ranging from RR 1.52 to RR 3.68. The DAR analysis recognizes that this data is gathered from a number of developing countries in Africa, Asia and La n America where mortality risks due to poor sanita on, lack of hygiene, low access to primary health care and other factors are much more acute than in Georgia. Therefore, in order to not overes mate the impact of subop mal breas eeding in Georgia several adjustments are made to signifi cantly lower the parameters used for risk of mortality. 38
Table 10 Summary Rela ve Risk Infant Mortality by Breas eeding Behavior38
0-6 months 6-23 monthsPredominant Par al None None
Diarrhea 2.28 4.62 10.53 2.83Pneumonia 1.75 2.49 15.13 1.52All Mortality 1.48 2.85 14.4 3.68
Assume the lower rela ve risk for pneumonia as opposed to higher risks from diarrhea. While, diarrhea is not a major cause of morbid-ity and mortality, respiratory
33 Georgian Na onal Iron Defi ciency and Anemia Survey 200734 Health Care Sta s cal Yearbook, 2010, Ministry of Labor, Health and Social Aff airs & Na onal Center for Disease Control and Public
Health.35 Calculated: 52% of Neonatal deaths occur in the fi rst week of life from Health Care Sta s cal Yearbook, 2010, Ministry of Labor,
Health and Social Aff airs & Na onal Center for Disease Control and Public Health.36 Bernardo L. Horta, Rajiv Bahl, José C. Mar nes, Cesar G. Victora, Evidence on the long-term eff ects of breas eeding, Systema c
Reviews and Meta-Analysis, WHO 200737 Robert E Black, Lindsay H Allen, Zulfi qar A Bhu a, Laura E Caulfi eld, Mercedes de Onis, Majid Ezza , Colin Mathers, Juan Rivera,
Maternal and child undernutri on: global and regional exposures and health consequences Maternal and Child Undernutri on Study Group, Lancet Published OnlineJanuary 17, 2008
38 IBID
14
IMPROVING HEALTH AND BUILDING PROSPERITY
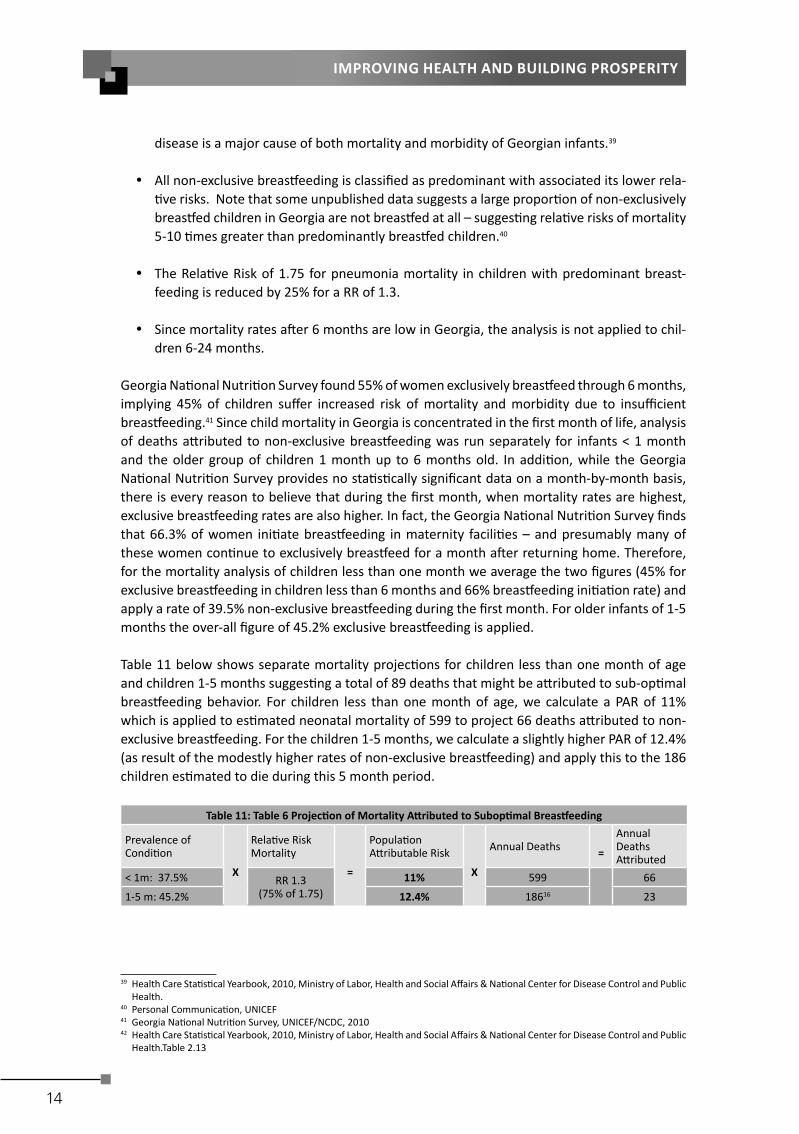
disease is a major cause of both mortality and morbidity of Georgian infants.39
All non-exclusive breas eeding is classifi ed as predominant with associated its lower rela- ve risks. Note that some unpublished data suggests a large propor on of non-exclusively
breas ed children in Georgia are not breas ed at all – sugges ng rela ve risks of mortality 5-10 mes greater than predominantly breas ed children.40
The Rela ve Risk of 1.75 for pneumonia mortality in children with predominant breast-feeding is reduced by 25% for a RR of 1.3.
Since mortality rates a er 6 months are low in Georgia, the analysis is not applied to chil-dren 6-24 months.
Georgia Na onal Nutri on Survey found 55% of women exclusively breas eed through 6 months, implying 45% of children suff er increased risk of mortality and morbidity due to insuffi cient breas eeding.41 Since child mortality in Georgia is concentrated in the fi rst month of life, analysis of deaths a ributed to non-exclusive breas eeding was run separately for infants < 1 month and the older group of children 1 month up to 6 months old. In addi on, while the Georgia Na onal Nutri on Survey provides no sta s cally signifi cant data on a month-by-month basis, there is every reason to believe that during the fi rst month, when mortality rates are highest, exclusive breas eeding rates are also higher. In fact, the Georgia Na onal Nutri on Survey fi nds that 66.3% of women ini ate breas eeding in maternity facili es – and presumably many of these women con nue to exclusively breas eed for a month a er returning home. Therefore, for the mortality analysis of children less than one month we average the two fi gures (45% for exclusive breas eeding in children less than 6 months and 66% breas eeding ini a on rate) and apply a rate of 39.5% non-exclusive breas eeding during the fi rst month. For older infants of 1-5 months the over-all fi gure of 45.2% exclusive breas eeding is applied.
Table 11 below shows separate mortality projec ons for children less than one month of age and children 1-5 months sugges ng a total of 89 deaths that might be a ributed to sub-op mal breas eeding behavior. For children less than one month of age, we calculate a PAR of 11% which is applied to es mated neonatal mortality of 599 to project 66 deaths a ributed to non-exclusive breas eeding. For the children 1-5 months, we calculate a slightly higher PAR of 12.4% (as result of the modestly higher rates of non-exclusive breas eeding) and apply this to the 186 children es mated to die during this 5 month period.
Table 11: Table 6 Projec on of Mortality A ributed to Subop mal Breas eeding
Prevalence of Condi on
X
Rela ve RiskMortality
=
Popula on A ributable Risk
X
Annual Deaths =
Annual Deaths A ributed
< 1m: 37.5% RR 1.3(75% of 1.75)
11% 599 66
1-5 m: 45.2% 12.4% 18616 23
42
39 Health Care Sta s cal Yearbook, 2010, Ministry of Labor, Health and Social Aff airs & Na onal Center for Disease Control and Public Health.
40 Personal Communica on, UNICEF 41 Georgia Na onal Nutri on Survey, UNICEF/NCDC, 201042 Health Care Sta s cal Yearbook, 2010, Ministry of Labor, Health and Social Aff airs & Na onal Center for Disease Control and Public
Health.Table 2.13

15
The Economic Consequences Of Malnutri on in Georgia
2.5 Neural Tube Defects:
Neural Tube Defects (NTD) including serious birth defects such as spina bifi da and anencephaly are a signifi cant cause of death and disability worldwide. Evidence clearly demonstrates that providing addi onal folic acid can avert most cases.43 Data from Iashvili Na onal Children’s Hospital indicates 69 annual cases of NTDs and a mortality rate of ~5%, sugges ng 3 deaths annually as a result of NTDs.44
Global data indicates the prevalence of NTDs tends to be 2/1000 births – sugges ng 126 cases per year for Georgia.45 Given high rates of folic acid defi ciency found among reproduc ve age women of Georgia, we would assume rates of NTD at or above this global average. We presume the diff erence between the data from Iashvili Na onal Children’s Hospital and the global rate, 57 cases, might be accounted for by iden fi ca on of anomalies by ultrasound and subsequent decision to terminate pregnancy,
2.6 Summary of Child Mortality A ributed to 5 Malnutri on Indicators
Based on the individual analysis of 5 indicators above, Table 12 below summarizes fi ndings of morality a ributable to child and maternal nutri on. T he sum of the individual analysis above projects 297 deaths of children from the perinatal period un l 5 years of age. However, during the neonatal period and the period 1-6 months, these children suff er mul ple and over-lapping risks. Therefore, in order to correct for “double-count,” the DAR runs addi onal calcula ons to adjust for simultaneous mul -category exposures.46 A er adjustment, nutri on-related mortality projec on for the neonatal period drop from 179 to 174, for the 1-6 month period decreases from 29 to 27 deaths and the over-all total is lowered from 297 to 291 annual deaths a ributable to these 5 indicators of malnutri on.
Table 12: Summary Individual and Adjusted Mortality A ributed to 5 Nutri on Indicators
# Individual Analysis Adjusted Mul ple Risks
S ll Births Maternal Anemia (Perinatal Death) 83 83 Neonatal Deaths Maternal Anemia (Perinatal Death) 56 55 Low Birth Weight 53 52 Neural Tube Defects 3 3 Sub Op mal Breast Feeding 66 64 Subtotal 179 174 1-6 Month Sub Op mal Breast Feeding 23 21.5 Underweight 6.0 5.6 subtotal 29 27 6-59 months Underweight 7 Total 297 291
43 Medical Research Council Vitamin Study Research Group. Preven on of neural tube defects: results of the Medical Research Council Vitamin Study. Lancet. 1991;338:131–137.
44 Personal communica ons, UNICEF45 Calculated from March of Dimes, Report on Global Birth Defects, Appendix B, 200146 Rockhill et al, Use and Misuse of Popula on A ributable Frac ons, American Journal of Public Health, January 1988,

16
IMPROVING HEALTH AND BUILDING PROSPERITY
The DAR fi ndings summarized in Table 12 suggest that:
Nutri on related deaths may account for ~17% of the total 1715 deaths beginning in the perinatal period up to 5 years of age (s ll births plus under 5 mortality).
29% of neonatal deaths, nearly 600 infants annually, might be a ributed to the maternal anemia, low birth weight, NTDs and subop mal breas eeding in the fi rst month of life - a er adjustment for mul ple exposures.
A er adjustment for mul ple exposures, subop mal breas eeding and underweight may ac-count for 12% of es mated 186 deaths occurring from the 1st month up to 6 months of age.
2.7 Es ma ng Value of Workforce Lost to Child Mortality
What is the na onal economic impact of 291 child deaths? While the loss is immeasurable, the DAR uses in cold economic terms to value these childhood deaths simply as a lost future workforce. The algorithm used in projec ng the fi nancial value of lost earnings poten al of children is shown in Table 13 below.
Table 13 Algorithm Used for Value of Lost Workforce due to Child Mortality
Child Deaths A ributed to Malnutri on X
Average WageX
Labor Force Par cipa on Rate X
Discount rate45 yr work life from ~ 15 yrs old =
Net Present Value of Losses (NPV) (000,000)
291 $4,407 64.2% 51 years @ 3% $11.36
This calcula on produces a Net Present Value (NPV) of $11.36 million annually in lost future earnings. The projec on assumes 51 years of lost wages at $4407 per year for 64.2% of these children that are projected to be wage earners. In other words this economic calcula on a ributes no value at all to ~36% of these child deaths who are not projected to par cipate in the labor force and be economically ac ve. Discoun ng over 64-66 years includes es mates of 13-15 years of no wages before the projected entry into the workforce at age 15 and the ini a on of the “earnings stream.” An economic analysis does not begin to measure the value of human life.

17
The Economic Consequences Of Malnutri on in Georgia
3. DEPRESSED FUTURE PRODUCTIVITY OF CHILDREN Malnutri on coincides with many health and economic depriva ons which also retard children’s growth and development. Isola ng the “nutri on factor” or the “child development factor” is complicated by the countless interac ons of nutri on, nature and nurture. However, there is substan al evidence that a er correc on for poverty and associated threats, nutri on has independent and addi ve impacts on child cogni on and development – and to earnings and produc vity as an adult.47
Weak health and poor nutri on diminish children’s cogni ve development through physiological changes, by reducing the ability to par cipate in learning experiences, or both. Even in mild or moderate cases, malnourished children score poorly on tests of cogni ve func on, psychomotor development and fi ne motor skills. They show lower ac vity levels, interact less frequently with their environments and thus fail to acquire physical and intellectual skills at normal rates. In large part these early childhood defi cits determine their ability to capitalize on educa onal opportuni es, later employment opportuni es – resul ng in an adult produc vity defi cit.
This analysis focuses on childhood anemia and stun ng - indicators strongly associated with depressed cogni on, inferior school performance and reduced future earnings. At current prevalence rates for these two indicators, more than 1 of 3 Georgia’s children will not have the opportunity to grow to their full intellectual and produc ve poten al.
3.1 Stun ng or Small Stature
A number of studies have documented a direct associa on between lower adult height and reduced earnings in physical labor.48 However, the full economic impact of stun ng is be er understood through more recently developed links with reduced cogni ve development. Numerous studies have directly associated stun ng with lower test scores for childhood cogni on. A recent pooled analysis from 5 countries concluded that “being moderately or severely stunted was associated with lower scores for cogni on in every study and the eff ect size varied from 0.4 to 1.05 SD.”49 Substan al evidence shows stunted children start school later, progress through school less rapidly and have lower over-all schooling a ainment. A review of evidence from 79 countries concluded “for every 10% increase in stun ng, the propor on of children reaching the fi nal grade of primary school dropped by 7.9%.”50 Most recently, an authorita ve review in the Lancet found that stunted children suff er a combined grade a ainment and school performance defi cit of 2.91 years - with each year predic ng decreased future wages of 8.3%.51 Based on losses from both grade a ainment and school performance, the review concludes that for a stunted child the impact in “the total percentage loss of adult yearly income” is 19.8%. The DAR uses this last conclusion as the coeffi cient of defi cit to make projec ons for the Georgian economy. According to the Georgia Na onal Nutri on Survey, 11.3% or more than 31 thousand of 275 thousand children aged 6 -59 months are moderately or severely stunted. Applying 19.8% defi cit to the future earnings of this this cohort suggests signifi cant depressed future produc vity to the na onal economy. The NPV of lost life me earnings per child is projected at $1745, totaling more than $54 million annually at the na onal level. The calcula on is shown in Table 14 below.
47 Grantham- McGregor et al, Developmental Poten al in the fi rst 5 Years for Children in Developing Countries, The Lancet, VOl 369, 200748 Behrman (1993), Behrman and Deolalikar (1989), Deolalikar (1988), Foster and Rosenzweig (1993), Glick and Sahn (1997), Haddad
and Bouis (1991), Schultz (1996), Strauss and Thomas (1998) and Thomas and Strauss (1997)49 Psacharopoulos G, Patrinos H. Returns to investment in educa on: A further update. Educ Econ 2004; 12:111–34.50 IBID51 Grantham- McGregor et al, Developmental Poten al in the fi rst 5 Years for Children in Developing Countries, The Lancet, VOl 369, 2007;

18
IMPROVING HEALTH AND BUILDING PROSPERITY
Table 14 Algorithm Used to Project Future Produc vity Losses from Stunted ChildrenNumber Stunted Children X
Average Wage
X
Labor Force Par cipa on
X
Annual Defi cit Adult Earning X
Discount 51 yr work life from 15 yrs =
Net Present Value of Losses
31,120 $4,407 64.2% 19.8% 3% $54.3 million/yr
3.2 Anemia in Children:
A range of evidence links iron status in children to future produc vity defi cits as adults. The evidence shows a direct link of iron status to cogni ve development defi cits and to future earnings defi cits.
Anemia, Iron Defi ciency and Cogni ve Development: A Journal of Nutri on review of the literature documents the posi ve impact of iron interven on on cogni ve scores, generally ranging from 0.5 to 1 SD and concluded that “available evidence sa sfi es all of the condi- ons needed to conclude that iron defi ciency causes cogni ve defi cits and developmental
delays.”52
Cogni ve Scores and Future Earnings or Produc vity: The associa on of childhood cogni- ve scores and produc vity has been extensively documented. A recent review from child
psychology, nutri on and economic science, concluded that development defi cits related to iron status in children less than 5 years old children are associated a 4% drop in earn-ings.53 Several interven on studies show that iron supplementa on in children < 5 years led to cogni ve improvements which were sustained into adolescence with a correla on coeffi cient 0.62.54 Therefore, the DAR corrects the 4% defi cit by a factor of 0.62 to arrive at a 2.5% decrease in wages for children less than 15 years of age.55
The Georgia Na onal Nutri on Survey reports 22.8% of children in Georgia suff er anemia.56
However, this survey seems to suff er some systema c error in analysis of iron defi ciency as discussed earlier, fi nding rates at only a frac on of 1% in both women and children. Therefore, for the purposes of this analysis only, the DAR applies na onal data from 2007 which found 27% anemia and 41% with low serum ferri n or iron defi ciency in women.57 Lacking up-to-date and reliable data for children, for the sake of this analysis, we calculate the propor on of iron defi ciency to anemia found in women in the 2007 survey, 1 to 1.52, and apply this ra o to the 22.8% anemia rate found in children < 5 years of age. Based on this assump on, the DAR es mates 35% prevalence of iron defi ciency in children.
As outlined in Table 15, this suggests future produc vity defi cits in 96.3 thousand children less than 5 years of age with a projected at NPV of nearly $21.2 million in lost produc vity. The life me defi cit for each child is about $220, but given the wide prevalence of anemia and large numbers involved, this rela vely modest defi cit accumulates with signifi cant impact on the na onal economy. The discoun ng at 3% to arrive at the NPV is about 30% of the gross earnings.
52 Haas, J. and Brownlie T., Iron Defi ciency and Reduced Work Capacity: A Cri cal Review of the Research Journal of Nutri on. 2001;131
53 Horton & Ross The Economics of Iron Defi ciency Food Policy 28 (2003) 51–7554 Polli et al. 1995 and Jensen, 1980 in Horton & Ross The Economics of Iron Defi ciency Food Policy 28 (2003) 51–7555 Horton & Ross The Economics of Iron Defi ciency Food Policy 28 (2003) 51–7556 Georgia Na onal Nutri on Survey, UNICEF, NCDC, 201057 Georgian Na onal Iron Defi ciency and Anemia Survey 2007

19
The Economic Consequences Of Malnutri on in Georgia
Table 15 Algorithm Used to Project Future Produc vity Losses from Anemia and IDA Children
# AnemicChildren
X
Average Wage
X
Labor Force Par cipa on
X
Annual Defi cit Adult Earning
X
Discount 51yr work life from 15 yrs old =
Net Present Value of Losses
96,280 $4407 64.2% 2.5% 3% $21.22 million/yr
3.3 Long Term Disability from Folic Acid Related Neural Tube Defects
No data was iden fi ed on the work performance or employment history of children surviving NTDs. Of 69 children annually born with NTDs we have assumed 5% mortality and for the remaining 95% we assume 15% will suff er severe lifelong disability while another 80% will live with moderate disabili es. For the sake of analysis we further assume severe disability implies 100% loss of produc ve poten al and that moderately disabled children will have the capacity for some level of work but at a defi cit of 50% versus normal workers. Based on these assump ons, as shown in Table 20 below, we calculate losses in work poten al of $1.33 million from these children surviving NTDs with life-long disability.
Table 20 Algorithm Used to Project Future Produc vity Losses from Children Surviving with NTDs
# DisabledChildren
X
AverageWage
X
Labor Force Par cipa on
X
Annual Defi cit Adult Earning
X
Discount 51yrwork life 15 yrs
=
Net Present Value of Losses
Severe: 10$4407 64.2%
100%3%
$350 .2 thousand
Moderate: 55 50% $982.4 thousand

20
IMPROVING HEALTH AND BUILDING PROSPERITY
4. DEPRESSED CURRENT PRODUCTIVITY: ANEMIA IN ADULT WORKERS
Weakness, fa gue and lethargy brought on by anemia results in measurable produc vity defi cits in the manual labor. Aerobic capacity, endurance and energy effi ciency are compromised 10-50%.58 A substan al literature shows the nega ve impact on indicators of work performance. The output of iron supplemented rubber tree tappers involved in heavy manual labor in Indonesia was found 17% higher than non-supplemented co-workers.59 There is also evidence anemia impairs less physically demanding work in “blue collar labor” or manufacturing not requiring signifi cant physical exer on.60 61 62 Based on an extensive review of the literature, Ross & Horton es mate a 5% defi cit among all manual or “blue collar” manufacturing work and an addi onal 12% loss for heavy manual labor such as agriculture and construc on.63
The Georgia Na onal Nutri on Survey established na onal prevalence of anemia at 24.1% for reproduc ve age women.64 As discussed earlier, based on the na onal anemia survey of 2007, we assume 75.3% of anemia is from iron defi ciency, sugges ng an iron defi ciency anemia in 18.1% of reproduc ve age women – about 290 thousand women. While there is no available data on anemia or iron defi ciency in men in Georgia, it stands to reason that this condi on exists – but at a much lower level than in women. For the sake of this analysis we will assume anemia in men at one-quarter the female rate – or 6%.
Produc vity defi cits are applied only to individuals with manual jobs and not to administra ve, managerial, educa on and other offi ce or “white collar” jobs. As with previous analysis, produc vity defi cits are only applied to individuals par cipa ng in the labor force, 75% of men and 56% of women.65
While there is reason to believe anemia has a nega ve impact on all kinds of work performance, including “white collar” jobs. However, the published evidence is limited to “blue collar” or manual work requiring physical exer on. Therefore, a series of assump ons and calcula ons are made based on the total number of males and females reported to be employed in various work sectors as reported by the Labor Force Surveys 2009, shown in Table 21. Against Labor Force Survey data for the number employed in the various sectors (Columns A), the DAR makes rough es mates of the propor on likely to be involved in manual labor (Column B). There es mates range from 95% in agriculture, mining, manufacturing and construc on to more modest levels in u lity, transport and defense to 0-5% in other sectors. We apply these propor ons, sector by sector, to roughly project total number of adults employed in manual jobs (Column C). Finally, we take the numbers in column C as a propor on of the total labor force (the totals of column A) to calculate the propor on of the na onal labor force employed in manual jobs (Column D). These rough calcula ons suggest that of 816 thousand employed women, 476 thousand or 58.3% are employed in manual labor. The same calcula on suggests 66% of male employment is manual or “blue collar.” With no iden fi ed data, we further assume 15% of these manual laborers are engaged in heavy manual labor involving signifi cant exer on, energy and endurance.
58 Celsing F., Blomstrand E. Eff ects of iron defi ciency on endurance and muscle enzyme ac vity Med. Sci. Sports Exerc. 1986;18:156-16159 Basta S. S., Soekirman D. S., Karyadi D., Scrimshaw N. S. Iron defi ciency anemia and the produc vity of adult males in Indonesia.
Am. J. Clin. Nutr. 1979;32:916-92560 Li R., Chen X., Yan H., Deurenberg P., Garby L., Hautvast J.G.A.J. Func onal consequences of iron supplementa on in iron-defi cient
female co on workers in Beijing, China. Am. J. Clin. Nutr. 1994;59:908-91361 Scholz B. D., Gross R., Schul nk W., Sastroamidjojo S. Anaemia is associated with reduced produc vity of women workers in even
less-physically-strenuous tasks. Br. J. Nutr. 1997;77:47-5762 Unturo J., Gross R., Schul nk W. Associa on between BMI and hemoglobin and work produc vity among Indonesian female
factory workers. Eur. J. Clin. Nutr. 1998;52:131-13563 Ross L Horton S The Economic Consequences of Iron Defi ciency, Micronutrient Ini a ve 1998 64 Georgia Na onal Nuri on Survey UNICEF/NCDC, 201065 GEOSTAT h p://www.geostat.ge/cms/site_images/_fi les/english/methodology/labour%20force%20sta s cs%20Eng.pdf

21
The Economic Consequences Of Malnutri on in Georgia
Table 21: Labour Market in Georgia 2009, Ministry of Economic Development Department of Sta s cs
Sector A: Total Number B. Manual % C. Total Manual # D. % Labor Force Manual
Female Male Female Male Female Male
Agriculture 462.1 448.5 95% 439.0 426.1 53.8% 48.0%
Mining 0.4 4.3 95% 0.4 4.1 0.0% 0.5%
Manufacturing 22.1 60.6 95% 21.0 57.6 2.6% 6.5%
U lity Supply 3.5 14.7 50% 1.8 7.4 0.2% 0.8%
Construc on 4.6 66.5 95% 4.4 63.2 0.5% 7.1%
Retail 80.5 88.4 5% 4.0 4.4 0.5% 0.5%
Hospitality 11 7 5% 0.6 0.4 0.1% 0.0%
Transport 6 65.7 20% 1.2 13.1 0.1% 1.5%
Finance 9.3 8 0% 0.0 0.0 0.0% 0.0%
Real Estate 13.1 21.6 0% 0.0 0.0 0.0% 0.0%
Public Administra on & Defense 16.7 47.6 20% 3.3 9.5 0.4% 1.1%
Educa on 103 21.2 0% 0.0 0.0 0.0% 0.0%
Health Social Work 50.6 9.3 0% 0.0 0.0 0.0% 0.0%
Other Services 21.7 22.2 0% 0.0 0.0 0.0% 0.0%
Private House 9.8 1.4 0% 0.0 0.0 0.0% 0.0%
Extraterritorial Organiza ons 1.8 1.1 0% 0.0 0.0 0.0% 0.0%
Totals 816.2 888.1 475.6 585.7 58.3% 65.9%
Agriculture, the dominant component of the manual labor sector pays much lower wages than other sectors. Therefore, the average na onal wage of GEL 598 is not applied in projec ng lost produc vity of workers in manual jobs. Based on average wages in the 6 dominant manual labor sectors and the percent of the labor force employed in each sector, we calculate a a composite average monthly wage of GEL 333.6 – or $2435 on an annual basis. The calcula on for this wage adjustment is shown in Table 22.
Table 22: Calcula on for Es mated Average Wage in Manual Labor
Average Monthly Wage GEL
% of Labor Force Employed
Weighted % of Manual Wages
6-Sector Composite Wage
Agriculture 279 53.40% 83% 230.66
Fishing 341 1% 2% 5.28
Mining and quarrying 812 0.03% 0% 0.38
Manufacturing 511 4.90% 8% 38.71
Electricity, gas and water 823 1.10% 2% 14.01
Construc on 671 4.20% 6% 43.61
Totals 65% 100% 332.64
USD Per Year Average Wage USD $ 2,434.96
Based on the assump on above, Table 23 below shows calcula ons for na onal economic losses emerging from iron defi ciency anemia among women and men employed in manual labor. Of more than 3 million working aged adults, we es mate about 127 thousand women and men

22
IMPROVING HEALTH AND BUILDING PROSPERITY
with iron defi ciency anemia engaged in manual jobs. Based on the evidence described earlier, all these manual workers suff er produc vity defi cits of 5% sugges ng losses of about $15.6 million annually. Presuming 15% of are engaged in heavy manual labor, the DAR applies an addi onal 12% defi cit to about 25 thousand workers, to derive a value of $7.5 million annually. To summarize, the 5-17% defi cits accumulate into na onal losses from iron defi ciency anemia of more than $23 million annually.
Table 23: Economic Losses in Manual Labor from Iron Defi ciency Anemia in Working Adults
Women Men Totals
Health Data Background
Prevalence of anemia in women 24.1% 6.03%
% Anemia from IDA 75.30% 75.3%
Iron Defi ciency Anemia 18.1% 4.5%
Demographic and Labor Data Background
Working Age Adults 1,599,000 1,494,200 3,093,200
Employed Popula on 56%/887,445 75%/1,113,179 2,000,624
Working in Manual Labor 58%/517,120 66%/734,120 1,251,240
Workers in Heavy Manual Labor 15%/ 77,568 15%/110,118 187,686
Average Wage Sector $2,453 $2,453
Economic Produc vity Loss Projec ons
Workers with IDA in Manual Labor 93,843 33,306 127,149
Produc vity Defi cit 5% 5%
Manual Labor Loss Subtotal $11,511,376 $4,085,481 $15,596,858
Workers with IDA in Heavy Manual Labor 18,694 6,635 25,328
Addi onal Defi cit 12% 12%
Addi onal Loss for Heavy Manual Labor Subtotal $5,503,447 $1,953,218 $7,456,665
Grand Total $17,014,823 $6,038,700 $23,053,523

23
The Economic Consequences Of Malnutri on in Georgia
5. EXCESS HEALTHCARE EXPENDITURES Malnutri on in children contributes to impaired immunity and infec on. Consequently, malnourished children may suff er more frequent or more severe illness which in turn translates into increased u liza on of health services. This can generate a signifi cant fi nancial burden on the individual families as well as the health and medical system.
5.1 Excess Healthcare Costs Due to Subop mal Breas eeding 66
Table 24 RR of Diarrhea and ARI by Breas eeding Status66 Breas eeding Behavior and Age Segment
Diarrhea Cases ARI Cases
RR RR
0-6 monthsNone 3.65 2.48Par al 3.04 2.07Predominant 1.26 1.796-23 months:
None 1.2 1.17
A long literature has documented the associa on of subop mal breas eeding and increased morbidity from acute respiratory infec on (ARI) and diarrhea. For children 0-6 months, the most recent authorita ve review in the Lancet fi nds that predominantly breas ed infants have a rela ve risk
of 1.26 for diarrhea morbidity and the risk triples for those not breas eeding at all. For ARI the rela ve risk of morbidity is 1.79 for par al breas eeding while infants with no breas eeding are twice likely to suff er respiratory disease. As with previous breas eeding mortality analysis, in order not to over-es mate the impact, the DAR assumes all non-exclusive breas eeding is predominant – the higher rela ve risks of 3.65 for diarrhea and 2.07 for ARI will not be applied. For older children 6-12 months, the modest risks of not breas eeding at all, RR of l1.2 for diarrhea and RR of 1.17 ARI, are applied.
The baseline incidence of ARI and diarrhea is projected as follows. In the Georgia Na onal Nutri on Survey, mothers reported that in the two weeks prior to the survey 8.1% of children < 5 years of age with diarrhea and 19.4% with fever and cough and presumed to be respiratory infec ons.67 Extrapola ng these rates over a full year suggests 2.1 diarrhea cases and 5 cases of respiratory infec on per child. For the es mated cohort of children 31.5 thousand children under 6 months age, this suggests a burden of more than 66 thousand cases of diarrhea and 158 thousand cases of ARI. For the larger cohort of about 95 thousand 6-24 month olds, this translates into 199 thousand cases of diarrhea and 475 thousand cases of ARI. According to the offi cial sta s cs, respiratory disease accounts for more than 63% of all child morbidity in Georgia.68
Health Care Sta s cal Yearbook for 2010 indicates that only a small frac on of these es mated cases are treated in medical facili es – 2% of diarrhea and 14% of ARI.69 Based on the total number of hospitaliza ons recorded for 2010, of cases seen at primary facili es, 80% of diarrhea cases and 29% of ARI cases are referred for further treatment or hospitaliza on. Given only a small por on are seen by the medical system, we presume these are rela vely severe – so this high rate of hospitaliza on may not be surprising. The string of data and assump ons reviewed above are summarized in Table 25 below.
66 Robert E Black, Lindsay H Allen, Zulfi qar A Bhu a, Laura E Caulfi eld, Mercedes de Onis, Majid Ezza , Colin Mathers, Juan Rivera, Maternal and child undernutri on: global and regional exposures and health consequences Maternal and Child Undernutri on Study Group, Lancet Published OnlineJanuary 17, 2008
67 Georgia Na onal Nutri on Survey UNICEF/NCDC, 201068 Health Care Sta s cal Yearbook, 2010, Ministry of Labor, Health and Social Aff airs & Na onal Center for Disease Control and Public
Health69 IBID

24
IMPROVING HEALTH AND BUILDING PROSPERITY
Table 25: Es mated Annual Burden of Diarrhea and ARI in Georgia
Under 6 Months Cohort 31,508 6-24 months Cohort: 94,524
Diarrhea ARI Diarrhea ARI
Es mated Case Rate 8.1% 19.4% 8.1% 19.4%
Es mated Annual Cases 2.11 5.03 2.11 5.03
Calculated Number Cases in Cohort 66,356 158,516 199,067 475,548
Treated in Health Facili es70 1,426 22,434 4,277 67,302
Non-Registered and Assume Home Care 64,930 136,082 194,790 408,246
Assumed Home Care % of Total Cases 2% 14% 2% 14%
Hospitaliza ons 1,13371 6,47972 3,40073 19,437
% Hospitaliza ons 80% 29% 80% 29%
70717273
How many of the es mated cases above can be a ributed to the higher risks of morbidity related to the subop mal breas eeding behaviors among women of Georgia? The Table 26 presents calcula on to es mate an annual burden of 118 thousand cases as follows:
As discussed earlier, the DAR assumes all 45% of all non-exclusive breas eeding is predom-inant and applies the lower RR of 1.26 and 1.79 to derive Popula on A ributable Risk of 11% for diarrhea and 26% for ARI. When applied to the total number of es mated annual cases above, this suggests nearly 7000 cases of diarrhea and 42 thousand cases of ARI in infants less than 6 months may be a result of sub-op mal breas eeding behaviors.
For the 64% of children 6-24 months who are not breas ed, we apply higher rela ve risks of 1.2 for diarrhea and 1.17 for ARI to derive PARs of 11% and 9.8% respec vely.74 When applied to the es mated over-all burden, this suggests 22.5 thousand cases of diarrhea and 46.4 thousand cases of ARI.
Table 26: Cases Diarrhea and ARI A ributed to Sub-Op mal Breas eeding in Children 0-6 and 6-24 Months
Infants 0-6 months: 45.2% Non-Exclusive Child 6-24 Months: 64% No Breas eeding
RR /Lancet PAR RR Lancet PAR
Diarrhea 1.26 11% 1.2 11%
ARI 1.79 26% 1.17 9.8%
A ributed Diarrhea Case 6,978 22,589
A ributed ARI Cases 41,709 46,663
These cases of infec on and morbidity are associated with a range of nega ve growth and development impacts. For example, each episode of diarrhea is associated with a 4% reduc on in chance of stun ng.75 However, only a frac on of these cases are assumed to be treated within the formal health system – 2% of diarrhea and 14% of respiratory cases. Therefore, DAR segments the fi nancial burden into 3 types of costs:
70 Health Care Sta s cal Yearbook, 2010, Ministry of Labor, Health and Social Aff airs & Na onal Center for Disease Control and Public Health Table 4.2: < 6 months es mated as 50% of <1 yr Cases. 6-24 months es mated as 3 mes 6 month cohort.
71 Rotavirus and Pneumococcal Vaccines Informa on for decision-making on vaccines introduc on in Georgia Na onal Immuniza on Program, Cura o Interna onal Founda on, April, 2011
72 Health Care Sta s cal Yearbook, 2010, Ministry of Labor, Health and Social Aff airs & Na onal Center for Disease Control Table3.3373 6-24 month cohort calculated as 3 mes < 6 month cohort74 Georgia Na onal Nutri on Survey, UNICEF, NCDC, 201075 Bhu a t al Maternal and Child Undernutri on, Interven ons for maternal and child undernutri on & survival, Lancet January 17,

25
The Economic Consequences Of Malnutri on in Georgia
Homecare, which seems by far to be the dominant treatment for both diarrhea and ARI, is very roughly es mated to cost $10 per case (no data was iden fi ed).
Outpa ent visits to primary health care centers, represen ng 2% of diarrhea and 14% of ARI cases are es mated to require $107 each for all costs. This is based on an in-depth study for diarrhea done by Cura o Interna onal in 2007 – and ARI costs are presumed to be similar.76
Further treatments and hospitaliza ons are based on an average of GEL 300 and 750 which are reported as average hospitaliza on costs for moderate and severe condi ons respec vely.77
Table 27 applies these assumed case costs to the es mated 118 thousand annual cases of diarrhea and ARI a ributed to subop mal breas eeding to roughly suggest a total fi nancial burden of roughly $3.8 million annually. As expected, the lion’s share of these costs are for treatment of ARI which is by far the most common reported cause of morbidity in children.
Table 27: Es mated Costs for Cases A ributed to Subop mal Breas eeding: by Outpa ent, In-Pa ent and Home Treatments
< 6 Month Cohort 6-24 Month Cohort
Diarrhea ARI Diarrhea ARI
Total BF A ributed Cases 6,978 41,709 22,589 46,663
Cases Accessing Outpa ent Facility
Treated Cases taken to PHC @ 2% and 14% 153 5,903 485 6,604
Costs of Outpa ent Cases @$107/Cased $16,354 $630,137 $51,803 $704,971
Propor on Referred for In Pa ent
# Referred Cases @ 80% and 29% 122 1,705 386 1,907
Cost of Hospital Inpa ent Cases @ $323 $39,300 $550,072 $124,489 $615,399
Cost of Home Treatments
BF A ributed Cases not Taken to PHC 6,825 35,806 22,104 40,059
Total Costs of Home Treatment @ $10/case $68,248 $358,064 $221,038 $400,588
Total Annual Costs of BF A ributed Cases $123,903 $1,538,273 $397,331 $1,720,958
5.2 Costs Associated with Low Birth Weight Deliveries
Of the 5.4% of infants born in Georgia weighing less than 2500 grams, 2954 are between 2000-2499 grams and 458 are more severe cases less than 2000 grams.78 Since actual documenta on of costs for these cases has not been iden fi ed, the DAR we make a series of assump ons.
For 2954 moderate cases weighing 2000-2499 grams, we presume an addi onal 5 days of maternity care for mother and ICU and special treatments for the child.
For 458 severe cases we presume an addi onal 10 days of maternity care for mother and ICU and special treatments for the child.
76 Rotavirus and Pneumococcal Vaccines Informa on for decision-making on vaccines introduc on in Georgia Na onal Immuniza on Program, Cura o Interna onal Founda on, April, 2011
77 Personal Communica on, UNICEF 78 Health Care Sta s cal Yearbook, 2010, Ministry of Labor, Health and Social Aff airs & Na onal Center for Disease Control and Public
Health Table 55

26
IMPROVING HEALTH AND BUILDING PROSPERITY
Cost of added hospital stay in maternity for mothers is es mated at $61.50/dy based on GEL 100/dy.79
Costs of ICU including incubator and other special treatments is es mated at $274.50 based on GEL 450/dy.80
Cost of referral and transports is roughly es mated at $50 case and cost of follow-up visits and treatments is roughly es mated at $100 per case.
Based on these assump ons, we project an annual cost of $7 million per year. The parameters for this calcula on are shown in Table 28.
Table 28: Es mated Excess Hospital and Other Costs for Current Burden of Low Birth Weight
Referral and transports for 3412 Cases @ $50 $170,600
2954 Infants 2000-2500g for 5 days in ICU and Treatments @ $274.5 $4,084,939
2964 Mothers for 5 days $907,764
458 Infants < 2000g for 10 days in ICU and Treatments @ $274.5 $ 1,266,691
Bed For 458 Mother 10 days $ 281,487
Cost Post Maternity Care $335,884
$7,047,364
5.3 Medical and Welfare Costs Associated with Folic Acid Related Birth Defects.
Surviving cases of Neural Tube Defects (NTD), such as spina bifada and anencephaly, result in signifi cant medical, rehabilita on and other care expenses. Data on ongoing cost of treatment is rela vely scarce and for the sake of this DAR analysis we make the following assump ons.
Cost of pediatric correc ve surgery a ributed to all 69 birth defect cases is es mated at $1,352 based on GEL 2200 per case reported by Iashvili Na onal Children’s Hospital.
Average ongoing cost of rehabilita on, medicines and possible average surgeries was also es mated at GEL 2000 or $1,229 by Iashvili Na onal Children’s Hospital.
It’s diffi cult to establish the ongoing non-medical cost of 3rd Party care for these moderately and severely disabled children. We venture and es mate of $1000 per year.
The state provides social security benefi ts to the disabled. According to the severity of the condi on payments are 100 GEL/month for a severely disabled Group I and 70 GEL/month for the moderately disabled Group II.81 With no knowledge of which group are appropriate for surviving NTD cases we take an average of these payments which indicates a cost of $627 annually to the Social Service Agency.
For ongoing future medical and welfare costs, we take a Net Present Value at 3% to assess annual life me costs. We assume the life span for these disabled individuals is about half the life-span of normal healthy individuals or 35 years.
79 Personal Communica ons, UNICEF80 IBID81 h p://ssa.gov.ge/index.php?lang_id=ENG&sec_id=91&info_id=987

27
The Economic Consequences Of Malnutri on in Georgia
Based on these assump ons, Table 29 shows segments costs totaling about $4.1 million annually in health care costs associated with surviving cases of spina bifada, anencephaly and other NTDs. Note that this analysis focuses only on the live births. The cost for an es mated 57 termina ons is not included.
Table 29: Annual Direct Medical and Welfare Costs of NTD Cased
69 Surgeries @ $1352 $93,296
NPV of Ongoing Medical Care, Rehabilita on and 3rd Part Care es mated at $2,229/yr for 65 Cases $3,139,800
NPV of Social Security Agency Payments to 65 Cases at $2950 Annual Cost of Welfare/Social Security $882,969
subtotal $4,116,066

28
IMPROVING HEALTH AND BUILDING PROSPERITY
6. SUMMARY: NATIONAL ECONOMIC CONSEQUENCES OF CHILD MALNUTRITION
At current prevalence for 8 indicators of malnutri on in Georgia, the burden on na onal economy may total about $112 million annually, represen ng about 1% of GDP. About two thirds of this total represents future losses expressed as a Net Present Value of losses due to mortality, depressed cogni ve development and consequent lost future work poten al of children. The remaining one-third are current impacts from defi cits in adult produc vity in manual labor and cash costs of excess and preventable healthcare devoted to low birth weight, diarrhea and respiratory illnesses. This $112 million annually provides a rough outline of magnitude losses from malnutri on - but simultaneously outlines the poten al for signifi cant benefi ts of interven on to lower prevalence of these indicators.
Table 30: Summary Annual Na onal Economic Losses from Malnutri on ($000,000)
Mortality: Lost
Future Work force
Lost Future Work
Poten al
Lost Current Adult
Produc vity
Excess Health
Care Costs
Total
Maternal Anemia (Perinatal) 5.35 5.35
Subop mal Breas eeding 3.38 3.78 7.16
Low Birth Weight 2.05 7.05 9.09
Underweight 0.46 0.46
NTD 0.13 1.09 4.12 5.34
Stun ng 44.60 44.60
IDA 0-5 Years 17.42 17.42
IDA in Adults 23.05 23.05
Total 11.36 63.11 23.05 14.94 112.47
A parallel analysis using a 5% as opposed to 3% discount rate was modeled indica ng annual economic loss of $81.7 million. Discoun ng only impacts pathways calculated via a NPV – lost wages due to mortality and lost produc vity poten al due to cogni ve and schooling defi cits in children. Consequently, the share of losses from current health care expenditures and produc vity defi cits in adults rises to about one half of total economic losses from malnutri on.
Table 31: Summary Annual Na onal Economic Losses from Malnutri on ($000,000)
Mortality: Lost
Future Work force
Lost Future Work
Poten al
Lost Current Adult
Produc vity
Excess Health
Care Costs
Total
Maternal Anemia (Perinatal) 3.04 3.04
Subop mal Breas eeding 1.92 3.78 5.70
Low Birth Weight 1.16 7.05 8.21
Underweight 0.26 0.26
NTD 0.08 0.64 4.12 4.83
Stun ng 26.28 26.28
IDA 0-5 Years 10.26 10.26
IDA in Adults 23.05 23.05
Total 6.47 37.18 23.05 14.94 81.65
29
The Economic Consequences Of Malnutri on in Georgia
INTEGRATED PORTFOLIO OF NUTRITION SERVICES:
An Economic Analysis of Interven ons to Improve Nutri on Status in Georgia

30
IMPROVING HEALTH AND BUILDING PROSPERITY

31
TABLE OF CONTENTS
1. Background: 32
1.1 Introduc on: ...................................................................................................................321.2 Integrated Por olio of Nutri on Services (IPNS) .............................................................331.3 Policy Framework ...........................................................................................................35
2. Projec ng Coverage 37
2.1 Methodology for Projec ng Benefi ts .............................................................................372.2 Review of Current Capacity and Coverage of Public Health System ..............................372.3 Projected Coverage for IPNS Interven ons ....................................................................38
3 Review of Evidence and Projec on of Eff ec veness 41
3.1 Antenatal Supplementa on with Iron: Life Cycle Segment 1 .........................................413.2 Breas eeding Promo on: Life-Cycle Segment 1-4 .........................................................423.3 Interven ons to Reduce Childhood Iron Defi ciency: Life Cycle Segment 4 ...................42 3.4 Stun ng Reduc on: All Life-Cycle Segments ..................................................................433.5 Flour For fi ca on: Iron Defi ciency Anemia and Neural Tube Defects. ...........................43 3.6 Summary IPNS Eff ec veness Es mates ..........................................................................45
4 Calcula ons for 10-Yr Benefi ts of IPNS Package 46
4.1 Projected Reduc ons in Child Mortality at IPNS Scale: .................................................464.2 Benefi ts or Saved Economic Losses ................................................................................46
5 IPNS Program Descrip on and Budget 48
5.1 Life Cycle Segment 1: Pregnancy ....................................................................................49 5.2 Life Cycle Segment 2: Delivery in Maternity Homes: ......................................................50 5.3 Life Cycle Segment 3: First Month a er Birth .................................................................51 5.4 Life Cycle Segment 4: Months 1-5 ..................................................................................51 5.5 Life Cycle Segment 5: Children 6-24 months. ................................................................525.6 Life Cycle Segment 6: Popula on-wide interven on ...................................................545.6.1 Flour For fi ca on .......................................................................................................54 5.6.2 Iron Folic Acid Supplementa on for Women of Reproduc ve Age in Rural Areas ......565.6.3 Annual Mul -Media & Broadcast Campaigns .............................................................575.7 Summary Annual Costs for Baseline Year (2012).............................................................57 5.8 Perspec ves on Costs ......................................................................................................59
6 Financial Overview & Benefi t Cost Analysis of IPNS 60
6.1 Summary Baseline and 10-Year Costs ............................................................................606.2 Benefi t Cost Ra o ..........................................................................................................60

32
IMPROVING HEALTH AND BUILDING PROSPERITY
1. BACKGROUND:
1.1 Introduc on:
The Damage Assessment Report (DAR) reviewed the human and economic consequences emerg-ing from 8 indicators of malnutri on in Georgia projec ng an annual impact of GDP of $112.5 million. Based projected growth in Georgia’s birth rate of 3.4%1, 10 year es mates for economic losses are projected at $1.3 billion as shown in Table 1 below.
Table 1: 10 Yr Economic Consequences of the Status Quo for 8 Indicators of Malnutri on
Yr Underweight
Low Birth
WeightPerinatal Mortality
Sub-OptBreast
feeding
Birth Defects (NTDS)
Stun ng Iron Defi -ciency <5
yrs
IDA Adult
Workers
Annual Totals
1 0.46 9.09 5.35 7.16 5.34 44.60 17.42 23.05 112.47
2 0.47 9.40 5.53 7.40 5.52 46.11 18.01 23.84 116.29
3 0.49 9.72 5.72 7.65 5.71 47.68 18.63 24.65 120.25
4 0.50 10.05 5.91 7.91 5.91 49.30 19.26 25.49 124.34
5 0.52 10.40 6.12 8.18 6.11 50.98 19.91 26.35 128.56
6 0.54 10.75 6.32 8.46 6.32 52.71 20.59 27.25 132.93
7 0.56 11.11 6.54 8.75 6.53 54.50 21.29 28.17 137.45
8 0.58 11.49 6.76 9.04 6.75 56.35 22.01 29.13 142.13
9 0.60 11.88 6.99 9.35 6.98 58.27 22.76 30.12 146.96
10 0.62 12.29 7.23 9.67 7.22 60.25 23.54 31.15 151.96
10y 5.32 106.20 62.47 83.58 62.39 520.75 203.42 269.20 1,313.34
Table 1 defi nes the magnitude losses but simultaneously outlines the poten al for signifi cant benefi ts of interven on to lower prevalence of these indicators. The DAR results also off er some perspec ves on strategic opportuni es where focused interven ons may lower the burden of malnutri on.
Stun ng Reduc on Strategies: Stun ng represents nearly 40% of the impact of malnutri- on. This is a is a complex indicator of chronic malnutri on related to maternal health, nu-
tri on, behaviors and gene c make-up as well as child health, nutri on and environmental factors as well as intergenera onal infl uences. Addressing holis c and complex burden will require mul ple inputs and interven ons. While there is some evidence of single in-terven ons improving linear growth, the evidence suggests that substan al reduc ons in stun ng will require mul ple investments in reinforcing interven ons including health, nu-tri on and educa on programs targe ng both mother and child. Given the high prevalence of stun ng in the fi rst year of life, interven ons focusing on pre-natal and neonatal nutri- on and educa on may yield high returns.
Reducing Child Mortality: The analysis suggests that only about 4% of child mortality losses are from underweight, the tradi onal indicator of child malnutri on. On the other hand, 2/3rds of mortality is related to maternal nutri on status (NTD, low birth weight and peri-natal mortality) and another 30% is related to maternal behavior, i.e. subop mal breast-
1 GEOSTAT. Average 2008-2011

33
Integrated Por olio of Nutri on Services
feeding. Therefore, the DAR indicates signifi cant opportuni es to lower child mortality via improving maternal nutri on status and child caring behaviors.
Breas eeding Promo on: Improving breas eeding behaviors off ers a major opportunity to address both about one-third of nutri on related child mortality as well as about one-quarter of the excess u liza on of healthcare. With current low baseline rates of op mal behaviors, investments in breas eeding promo on may off er substan al returns.
Flour For fi ca on: Flour for fi ca on with at least iron and folic acid off ers a signifi cant oppor-tunity to directly address nearly half the measured burden malnutri on (represented by iron defi ciency anemia in pregnant women and children and adults as well as folic acid related birth defects). While the level of protec on provided by consump on of for fi ed fl our is usually not suffi cient for the needs of pregnant women in the second and third trimesters, for fi ca on can play a key role ensuring that women enter pregnancy with iron and folate status and even pro-vide substan al protec on throughout the fi rst trimester, when iron and other requirements actually decrease. Maternal status in the fi rst trimester has been shown to be cri cal for birth outcomes – including NTDs, low birth weight and other nega ve birth outcomes. Since, during this pre-conceptual period and much of the cri cal fi rst trimester women have not yet sought out ante-care, interven ons targe ng pregnant women with supplements may be too li le too late. A mix of interven ons is required.
1.2 Integrated Por olio of Nutri on Services (IPNS)
Based on the DAR, this paper proposes a package of feasible and aff ordable nutri on supplementa- on and educa on interven ons to reduce the human and fi nancial burden, provisionally labeled
Integrated Por olio of Nutri on Services (IPNS). IPNS specifi cally aims at improvement in specifi c indicators via a package of targeted, low cost and preventa ve products and services. However, indi-cators of malnutri on interact and produce mul plica ve eff ects. No single interven on or nutrient can fully address these complex interac ons. Taken together the full por olio of interven ons off er an integrated and comprehensive approach which, evidence suggests, may be the most eff ec ve.2
Therefore, while interven ons focus on improvement of individual nutri on indicators, the full set of interven ons are likely to have synergis c and mul plica ve eff ects.
IPNS proposes strategic focus on specifi c periods of highest risk, or life-cycle segments, where the documented burden of mortality, morbidity and development. The 1000 days extending from pregnancy through 24 months of age represent a period of acute vulnerability. This 1000 day “window of risk” also defi nes a “window of opportunity” for interven on. Strategically fo-cusing on these 1000 days may yield the highest returns in terms of reduced child mortality, improved child health, physical growth and mental development – and ul mately future gains in na onal produc vity. IPNS segments the 1000 days into 4 life-cycle segments represen ng dis nct risks and vulnerability for mother and child – along with 4 sets interven ons and delivery mechanisms – as follows:
Segment 1: Pregnancy Integra on of nutri on component into antenatal services in-cluding micronutrient supplementa on and nutri on educa on with a focus on mater-nal iron defi ciency anemia.
2 Robert E Black, Lindsay H Allen, Zulfi qar A Bhu a, Laura E Caulfi eld, Mercedes de Onis, Majid Ezza , Colin Mathers, Juan Rivera, Maternal and child undernutri on: global and regional exposures and health consequences Maternal and Child Undernutri on Study Group, Lancet Published OnlineJanuary 17, 2008

34
IMPROVING HEALTH AND BUILDING PROSPERITY
Segment 2: Maternity: Enhanced educa on and counseling promo ng con nued exclusive breas eeding un l 6 months of age as part of rou ne maternity care and integrated with ongoing BFHI.
Segment 3: Infant 0-6 Months Maternal micronutrient supplements with intensive breast-feeding promo on and nutri on educa on delivered to lacta ng women during me of highest mortality risk for infants.
Segment 4: Infant/Toddler 6-24 months: Young child feeding and care educa on along with mul ple micronutrient powders (MMPs or Sprinkles) to improve nutrient density to com-plementary foods.
For a number of reasons, improving the nutri on status of mothers, infants and children also requires interven on outside the 1000 day window of risk. Women o en enter pregnancy with poor iron and folic acid status and they may not begin to access antenatal services un l well into the fi rst and some mes the second trimester. Since, during the pre-conceptual period and much of the cri cal fi rst trimester women have not yet sought out antenatal care, health-system-based interven ons targe ng pregnant women may be too li le too late. Maternal status in the fi rst trimester has been shown to be cri cal for birth outcomes – including NTDs, low birth weight and other nega ve birth outcomes. In addi on, Georgia Na onal Nutri on Survey 2010 fi nds a high prevalence of anemia among reproduc ve age women sugges ng signifi cant economic losses in produc vity in the adult popula on.3 Finally, sustaining the behavior change including breas eeding, compliance with supplements regime and other child care and feeding recom-menda ons will require channels beyond the system. Therefore, IPNS includes interven ons with popula on-wide reach - and capacity beyond the public health or social services sector.
Segment 5: Popula on-wide interven on: Na onal fl our for fi ca on with iron and folic acid; na onal mul -media campaigns to support all behavior change components of IPNS – as well as other health and nutri on issues. Recognizing that fl our for fi ca on may not reach 25-30% of women, mainly in rural areas, IPNS includes iron folic acid supplementa- on for rural women without access to for fi ed fl our.
Table 2 below summarizes proposed IPNS interven on targe ng these 5 life-cycle segments nets and off ers a rough logical framework including goals, objec ves and strategies.
3 Georgia Na onal Nutri on Survey, UNICEF/NCDC, 2010

35
Integrated Por olio of Nutri on Services
Table 2: Overview of 5 Life Cycle SegmentsLife CycleSegment
Goals Objec vesProgramStrategies
Segment 1. Pregnancy
1. Reduce perinatal death, low birth weight deliveries and neural tube defects.
1. Improve iron, folic acid, micro-nutrient status.
2. Improve nutri on $ health behavior
1. Maternal Micronutrient Supplement
2. Nutri on Educa on
Segment 2. Maternity:
1. Reduce neonatal and infant death.
1. Improve rate of breas eeding.2. Enhance BFHI to sustain ini a- on.
1. Breas eeding Promo on
Segment 3 Infants < 6 months
1. Reduce infant morbidity 2. Reduce infant deaths 3. Protect maternal
health.
1. Improve exclusive breas eeding 2. Protect maternal iron status. 3. Reduce Stun ng
1. Breas eeding Promo on, 2. Nutri on Educa on & Support.3. Maternal Micronutrient
Supplement
Segment 46-24 month old children
1. Improve child growth and development
1. Reduce Stun ng 2. Reduce childhood iron
defi ciency.3. Improve con nued breas eeding4. Improve complementary feeding5. Improve child care behaviors.
1. Feeding Educa on & Support.2. Mul ple Micronutrient Pow-
ders for children
Segment 5Popula on-Wide
1. Improve Adult Produc- vity
2. Reduce birth defects3.Improve child growth and development 4. Raise awareness to support all IPNS ac vi es.
1. Reduce adult anemia2. Improve female folic acid status.3. Reduce childhood iron
defi ciency 4. Improve popula on wide health
and nutri on behaviors.
1. Flour For fi ca on2. Annual Mass Media Campaign3. Targeted Iron Folic Acid supple-
ments.
This purpose of this paper is to es mate the general benefi ts and costs of IPNS interven ons and project a benefi t cost ra o. Sec on 2 will develop es mates for coverage. Sec on 3 will review evidence and make projec ons for eff ec veness. Sec on 4 will project benefi ts of interven ons. Sec on 5 will describe interven ons and costs. Sec on 6 will summarize these parameters to develop a 10-Year Benefi t Cost Ra o. This is a “conceptual” approach to describing interven ons and es ma ng the cost and is not intended as a subs tute for in-depth program design, planning and budge ng. The aim is to facilitate general planning and advocacy.
1.3 Policy Framework
IPNS is consistent with an exis ng framework of global recommenda ons and na onal policy. The approach is harmonized with WHO guidelines for maternal and child care which state that “strategies should be built into the primary health care system and exis ng programmes such as maternal and child health, integrated management of childhood illness, adolescent health, mak-ing pregnancy safer/safe motherhood.”4 This integrated delivery model is considered a global public health “best prac ce” off ering cost effi ciencies in implementa on as well as synergis c health and nutri on impacts. Moreover, IPNS interven ons consistent with a number of WHO guidelines, standards or recommenda ons including:
WHO Integrated Management of Pregnancy and Childbirth (IMPAC) Standards for Mater-nal and Neonatal Care: Where prevalence of anemia is higher than 20%, “Give all pregnant women a standard does of 60 mg iron and 400 ug folic acid daily for six months.”
4 Guidelines for the use of iron supplements to prevent and treat iron defi ciency anemia. INACG, WHO and UNICEF. IUNACG. Washington. Edited by Stoltzfus R., Dreyfus M.L. 1998

36
IMPROVING HEALTH AND BUILDING PROSPERITY
World Health Organiza on Guidelines for Use of Mul ple Micronutrient Powders for Home For fi ca on of Foods Consumed by Infants and Children 6–23 months of Age which states: “Home for fi ca on of foods with mul ple micronutrient powders is recommended to im-prove iron status and reduce anemia among infants and children 6–23 months of age” among “popula ons where the prevalence of anemia in children under 2 years or under 5 years of age is 20% or higher.”
World Health Organiza on’s Recommenda ons for Wheat and Maize For fi ca on outline for fi ca on levels and compounds for fl our for fi ca on in varying na onal circumstances.
IPNS is consistent with the goals, objec ves and strategies outlined in the Government of Geor-gia’s 10-Point Plan for Strategic Development which include “Development of accessible, high quality healthcare system” as one of its ten points of focus. This health care component of the na onal strategy aims “to improve popula on health through a reduc on of disease burden and mortality” via two key outcomes.
“Increase of the average life expectancy of the Georgian popula on – by reducing mortal-ity resul ng from averted premature death, primarily among children, as well as other age groups.”
“Improvement of the quality of life of the popula on of the country – by reducing general morbidity and associated disabili es.”5
IPNS supports achievement of these outcomes. First, it focuses on improving a range of malnu-tri on indicators associated with 17% of mortality among young children including perinatal, low birth weight, underweight and birth defects. Second, via reduc on of NTDs and low birth weight well as improvement in breas eeding prac ces, IPNS contributes to a reduc on in morbidity and disability as well as demand for a range of health care service. Finally, IPNS works to reduce the burden of “hidden” disability (or loss of poten al) by targe ng reduc ons in stun ng and iron defi ciency among children and iron defi ciency anemia among working adults.
IPNS most specifi cally supports Strategic Objec ve #4 of the na onal health care strategy which aims at “Preven on of diseases, readiness for health risks.” The nutri on interven ons proposed in IPNS can provide key programma c inputs to three of the eight strategic direc ons or ini a- ves defi ned under Strategic Objec ve #4, namely:
4.3. Enhancement of maternal and child health services 4.5. Preven on and screening of non-communicable diseases 4.7. Facilita on of health and healthy life-style
5 Government of Georgia, 10-Point Strategic Plan for Development of the Country 2011-2015, For Moderniza on and Employment, Access to Quality Healthcare, Tblisi, 2011
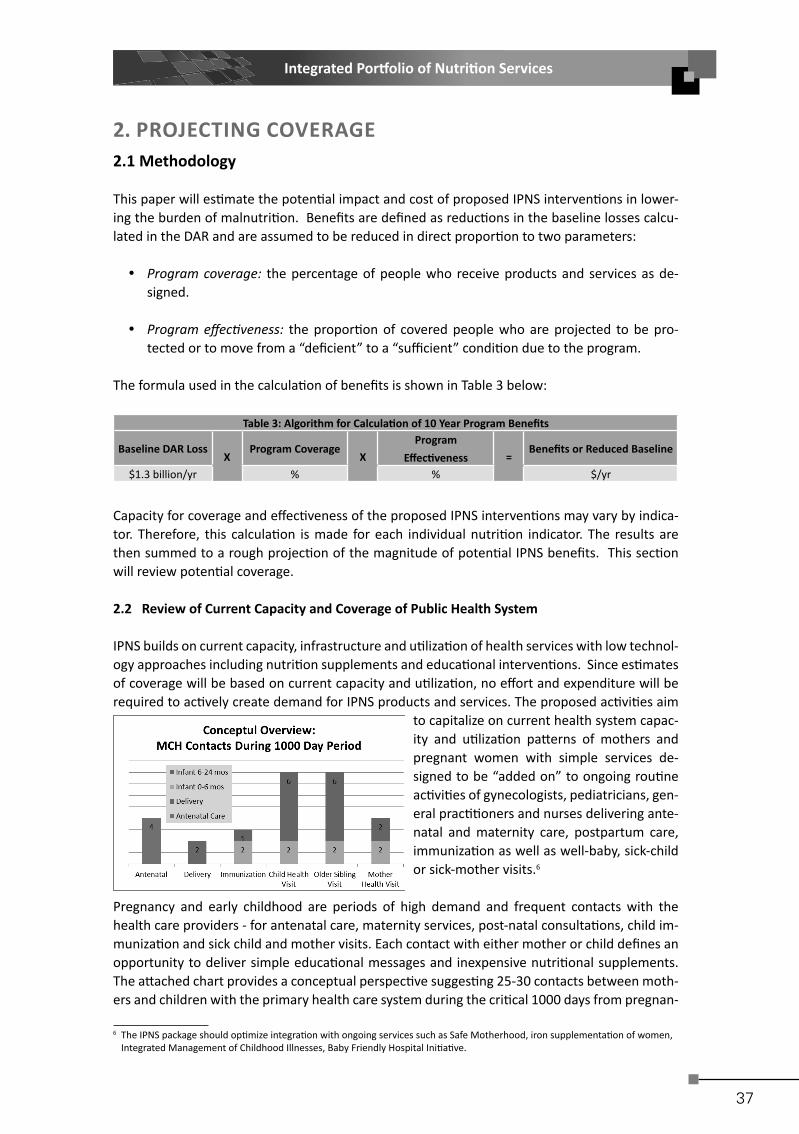
37
Integrated Por olio of Nutri on Services
2. PROJECTING COVERAGE 2.1 Methodology
This paper will es mate the poten al impact and cost of proposed IPNS interven ons in lower-ing the burden of malnutri on. Benefi ts are defi ned as reduc ons in the baseline losses calcu-lated in the DAR and are assumed to be reduced in direct propor on to two parameters:
Program coverage: the percentage of people who receive products and services as de-signed.
Program eff ec veness: the propor on of covered people who are projected to be pro-tected or to move from a “defi cient” to a “suffi cient” condi on due to the program.
The formula used in the calcula on of benefi ts is shown in Table 3 below:
Table 3: Algorithm for Calcula on of 10 Year Program Benefi ts
Baseline DAR Loss X
Program CoverageX
Program Eff ec veness =
Benefi ts or Reduced Baseline
$1.3 billion/yr % % $/yr
Capacity for coverage and eff ec veness of the proposed IPNS interven ons may vary by indica-tor. Therefore, this calcula on is made for each individual nutri on indicator. The results are then summed to a rough projec on of the magnitude of poten al IPNS benefi ts. This sec on will review poten al coverage.
2.2 Review of Current Capacity and Coverage of Public Health System
IPNS builds on current capacity, infrastructure and u liza on of health services with low technol-ogy approaches including nutri on supplements and educa onal interven ons. Since es mates of coverage will be based on current capacity and u liza on, no eff ort and expenditure will be required to ac vely create demand for IPNS products and services. The proposed ac vi es aim
to capitalize on current health system capac-ity and u liza on pa erns of mothers and pregnant women with simple services de-signed to be “added on” to ongoing rou ne ac vi es of gynecologists, pediatricians, gen-eral prac oners and nurses delivering ante-natal and maternity care, postpartum care, immuniza on as well as well-baby, sick-child or sick-mother visits.6
Pregnancy and early childhood are periods of high demand and frequent contacts with the health care providers - for antenatal care, maternity services, post-natal consulta ons, child im-muniza on and sick child and mother visits. Each contact with either mother or child defi nes an opportunity to deliver simple educa onal messages and inexpensive nutri onal supplements. The a ached chart provides a conceptual perspec ve sugges ng 25-30 contacts between moth-ers and children with the primary health care system during the cri cal 1000 days from pregnan-
6 The IPNS package should op mize integra on with ongoing services such as Safe Motherhood, iron supplementa on of women, Integrated Management of Childhood Illnesses, Baby Friendly Hospital Ini a ve.
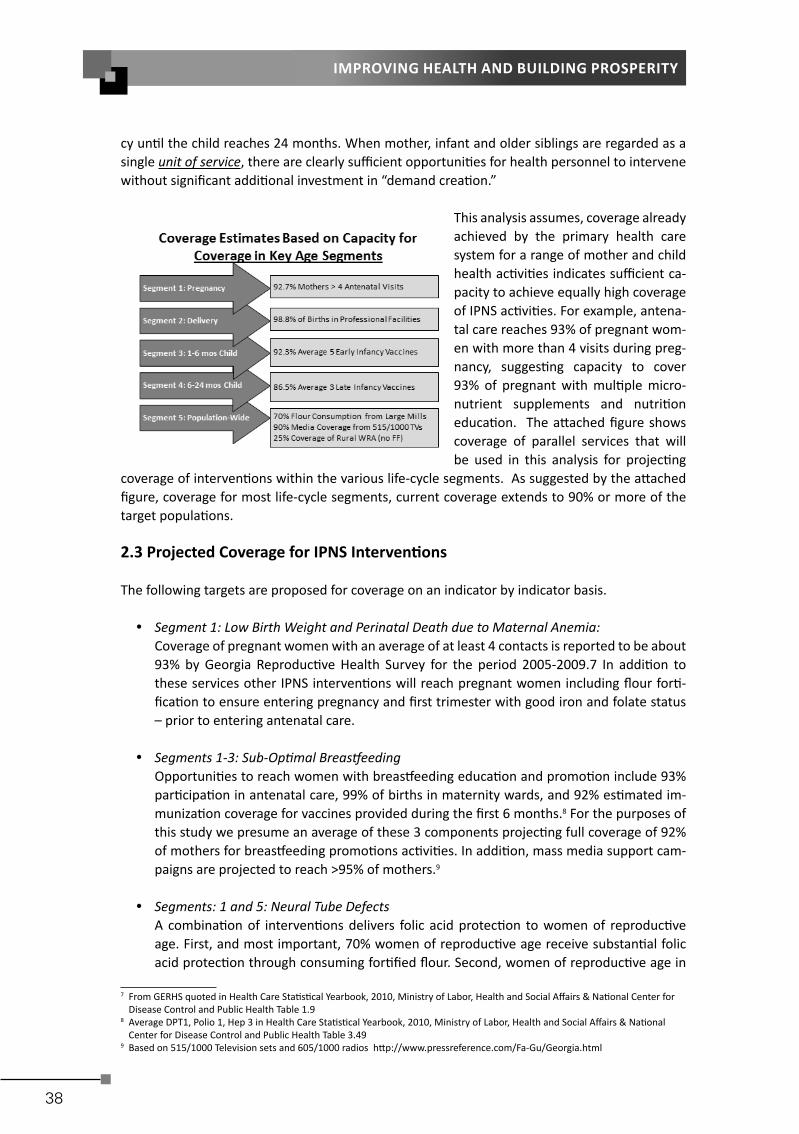
38
IMPROVING HEALTH AND BUILDING PROSPERITY
cy un l the child reaches 24 months. When mother, infant and older siblings are regarded as a single unit of service, there are clearly suffi cient opportuni es for health personnel to intervene without signifi cant addi onal investment in “demand crea on.”
This analysis assumes, coverage already achieved by the primary health care system for a range of mother and child health ac vi es indicates suffi cient ca-pacity to achieve equally high coverage of IPNS ac vi es. For example, antena-tal care reaches 93% of pregnant wom-en with more than 4 visits during preg-nancy, sugges ng capacity to cover 93% of pregnant with mul ple micro-nutrient supplements and nutri on educa on. The a ached fi gure shows coverage of parallel services that will be used in this analysis for projec ng
coverage of interven ons within the various life-cycle segments. As suggested by the a ached fi gure, coverage for most life-cycle segments, current coverage extends to 90% or more of the target popula ons.
2.3 Projected Coverage for IPNS Interven ons
The following targets are proposed for coverage on an indicator by indicator basis.
Segment 1: Low Birth Weight and Perinatal Death due to Maternal Anemia:Coverage of pregnant women with an average of at least 4 contacts is reported to be about 93% by Georgia Reproduc ve Health Survey for the period 2005-2009.7 In addi on to these services other IPNS interven ons will reach pregnant women including fl our for -fi ca on to ensure entering pregnancy and fi rst trimester with good iron and folate status – prior to entering antenatal care.
Segments 1-3: Sub-Op mal Breas eeding Opportuni es to reach women with breas eeding educa on and promo on include 93% par cipa on in antenatal care, 99% of births in maternity wards, and 92% es mated im-muniza on coverage for vaccines provided during the fi rst 6 months.8 For the purposes of this study we presume an average of these 3 components projec ng full coverage of 92% of mothers for breas eeding promo ons ac vi es. In addi on, mass media support cam-paigns are projected to reach >95% of mothers.9
Segments: 1 and 5: Neural Tube DefectsA combina on of interven ons delivers folic acid protec on to women of reproduc ve age. First, and most important, 70% women of reproduc ve age receive substan al folic acid protec on through consuming for fi ed fl our. Second, women of reproduc ve age in
7 From GERHS quoted in Health Care Sta s cal Yearbook, 2010, Ministry of Labor, Health and Social Aff airs & Na onal Center for Disease Control and Public Health Table 1.9
8 Average DPT1, Polio 1, Hep 3 in Health Care Sta s cal Yearbook, 2010, Ministry of Labor, Health and Social Aff airs & Na onal Center for Disease Control and Public Health Table 3.49
9 Based on 515/1000 Television sets and 605/1000 radios h p://www.pressreference.com/Fa-Gu/Georgia.html

39
Integrated Por olio of Nutri on Services
rural areas with limited access to industrially produced fl our will be targeted with iron folic acid supplementa on. Recognizing substan al barriers to high coverage and full compli-ance of healthy non-pregnant women with supplements, we assume only one-quarter of this group can be fully reached, indica ng coverage of an addi onal 7.5% of the female popula on. For the purposes of this study we presume full coverage of 77.5% of women of reproduc ve age will be fully covered with folic acid interven ons.
Segments 3-5: Iron Defi ciency in Children < 5 yearsAddi onal iron nutri on will be delivered to children via several channels. First, for fi ed fl our will reaches 70% of children. However, for younger children 6-24 months, consump- on of fl our may not be suffi cient to deliver the necessary added iron intake to prevent
iron defi ciency – and other micronutrient necessary for op mal physical and intellectual growth. Second, for children < 6 months, improved breas eeding rates will provide a rich and bioavailable source to a wider segment of infant. Finally, sprinkles or Mul ple Micro-nutrient Powders (MMP), provide added iron and micronutrient protec on in the 6-24 month age group. As opposed to infants < 6 month, regular contact with the health sys-tem is expected to fall off from 6-24 months of age, as suggested by a comparison of im-muniza on rates for vaccines provided to younger infants versus older infants – which we es mate as falling from ~92% to 86%.10 For the purposes of this study, we take an average of fl our for fi ca on and sprinkles coverage to assume 78% coverage of children < 5 years of age with iron interven ons.
Segment 5: Iron Defi ciency Anemia in Adults: Based on data provided regarding the fl our industry and milling, coverage of adults with addi onal iron nutri on via fl our for fi ca on is projected to reach 70% of consumers.11 In addi on, iron folic acid supplements are projected to reach one-quarter of rural women who have no access to for fi ed fl our. Coverage of all adult women is therefore assumed to be 75%.
All Segments: Stun ng and UnderweightStun ng is a complex indicator of chronic malnutri on related to maternal health, birth outcomes, feeding and care behaviors as well as environmental factors and intergenera- onal infl uences. All IPNS interven ons taken together may be necessary to realis cally
project a reduc on in rates of stun ng. We therefore, take a factorial of coverage rates for relevant services: antenatal services impac ng birth outcomes (93%), breas eeding pro-mo ons protec ng < 6 months of age (92%), and mul ple micronutrient supplements and nutri on educa on for improved complementary feeding (86%) to es mate the propor- on of children receiving full coverage from all 3 interven ons of about 74%.12
10 Average DPT4, Polio3, MMR1 in Health Care Sta s cal Yearbook, 2010, Ministry of Labor, Health and Social Aff airs & Na onal Center for Disease Control and Public Health Table 3.49
11 Personal Communica ons, UNICEF12 The calcula on is 92.7% antenatal coverage *92.3% breas eeding promo on coverage *86.5% MMP and educa on coverage of
6-24 month olds.

40
IMPROVING HEALTH AND BUILDING PROSPERITY
Table 4 below summarizes assump ons for each of coverage of 8 indicators of malnutri on mod-eled in the DAR:
Table 4: Summary of Coverage Assump on and Ra onale
Indicator & Interven onAssumed Coverage
Ra onale or Basis for Assump on
Maternal Anemia (Perinatal Death) & Low Birth Weight: Antenatal & anemia reduc- on including Micronutrient Supplements &
Nutri on Educa on.
92.7% Segment 1 > 4 visits to Antenatal Services
Sub Op mal Breas eeding: Breas eeding Educa on & Promo on
94.6% Average Coverage: Antenatal Coverage, Birth Facil-ity, Appropriate Early Vaccines
Neural Tube Defect: Provision of Folic Acid 77.5%Average Coverage: Flour For fi ca on+ Rural IFA
Stun ng & Underweight: Antenatal Care, Breas eeding Promo on, MMPs and MMS
74%Factorial of Coverage: Antenatal Services, Breast-feeding Promo on & MMP (Receive all interven- ons)
Iron Defi ciency in Child < 5 yrs: Provision of Iron
78% Average coverage: Flour For fi ca on + MMPs
IDA Adults: For fi ed Flour to Adult Men and Women and targeted supplementa on
75% Flour For fi ca on + Iron Folic Acid Supplementa on of rural women

41
Integrated Por olio of Nutri on Services
3 REVIEW OF EVIDENCE AND PROJECTION OF EFFECTIVENESS Eff ec veness is defi ned as protec on or correc on of the specifi c malnutri on indicator among in-dividuals who receive the interven on as intended or as designed by the program. The literature provides a number of evalua ons and reviews that enable rough projec ons of eff ec veness for each IPNS indicator. However, projec ng real eff ec veness of nutri on interven ons remains more art than science. Therefore, every eff ort is made to interpret the evidence conserva vely and to err on the side of underes ma on. For example, while many evalua ons of eff ec veness are already corrected for coverage parameters, this analysis corrects IPNS coverage a second me. Or while evalua ons of anemia reduc on in supplementa on and for fi ca on programs include popula ons with both iron defi ciency anemia (sensi ve to the interven on) and anemia from other causes, this analysis has al-ready corrected for the propor on who have iron defi ciency anemia in the DAR. Nevertheless, actual benefi t can only be determined by evalua on of the program itself, but for planning purposes the following rough but conserva ve es ma ons are ventured.
3.1 Antenatal Supplementa on with Iron: Life Cycle Segment 1
Several major health organiza ons recommend prophylac c distribu on iron/folic-acid supplements during pregnancy including World Health Organiza on (WHO), United States Centers for Disease Control & Preven on (CDC) and the Interna onal Anemia Consulta ve Group (INACG).13 A recent comprehensive review of 8 programs found maternal supplements reduce risk of anemia by 73%.14
Several studies link maternal iron supplementa on to improved birth outcomes including:
Four studies fi nding reduc ons in low birth weights ranging from 16% to 44% 15
Two studies fi nding perinatal and neonatal deaths reduced by 45% and 86%.16
Based on this evidence, the analysis proposes to use the following projec ons for eff ec veness in improving perinatal mortality and a low birth weight as follows:
25% drop in anemia rates among women consuming full course of mul ple micronutrient supplements during pregnancy and assume lower perinatal morality at a parallel rate.
Low birth weight is complex with mul ple causes beyond maternal iron and over-all nutri- on status. Therefore, DAR assumes a lower reduc on than over-all anemia reduc on in
pregnant women, 10% reduc on in cases of low birth weight.
The literature suggests that although they are marginally more expensive, mul ple micronutrient supplements may be more eff ec ve not only in preven ng anemia during pregnancy but also may achieve be er results in lowering the risk of child mortality. Some fi ndings from studies include:
Propor on of women who became non-anemic was 35% in the vitamin-A- group, 68% in the iron group, 97% in the group supplemented with both.17
13 Dietary Supplement Fact Sheet, Offi ce of Dietary Supplements, United States Na onal Ins tutes of Health; Standards for Maternal and Neonatal Care, WHO, 2006; Guidelines for the Use of Iron Supplements to Prevent and Treat Iron Defi ciency Anaemia, ILSI 1998
14 Bhu a t al Maternal and Child Undernutri on , Interven ons for maternal and child undernutri on & survival, Lancet January 17, 2008
15 Fawzi et al, Lancet 1998 May16;351(9114):1477-82; Chris an P. et al Am J Clin Nutr 1998 Aug;68(2):404; Scholl et al, American Journal of Epidemiology 1997;146:134-41;
16 Atukoral et al, Am J Clin Nutr 1994, Aug;60(2):286-92; DeLong et al Lancet 1997 Sep 13;350(9080):771-3.17 Suharno, D., Muhilal, D., Karyadi, C. E., West, J. G., Hautvast, A. J. & West, C. E. (1993) Supplementa on with vitamin A and iron for nutri onal anaemia in pregnant women in west Java, Indonesia. Lancet 342: 1325–1328.

42
IMPROVING HEALTH AND BUILDING PROSPERITY
Mul ple micronutrient supplements associated with 39% greater reduc on in maternal ane-mia compared with placebo or two or less micronutrients.18
Based on this evidence, IPNS recommends mul ple vitamin and mineral supplements as op-posed to the less expensive iron/folic acid supplements.
3.2 Breas eeding Promo on: Life-Cycle Segment 1-3
IPNS proposes breas eeding promo on stretching from the antenatal period in Segment 1, to maternity in Segment 2 and lacta ng women in Segment 3 - as well as mass media in Segment 5. A Lancet review of mul ple studies and evalua ons of breas eeding promo on programs found:
Chances of exclusive breas eeding in the fi rst month more than tripled (OR 3.45) Chances of exclusive breas eeding from 1-6 months nearly doubled (OR 1.93) Evalua on of mass impact media alone found 68% improvement in exclusive feeding.19
This evidence suggests that the proposed IPNS package of individual counseling, educa on materials and mass media support may have a signifi cant impact in reestablishing op- mal breas eeding behaviors - with signifi cant parallel re-
duc ons in child mortality and morbidity. Based on this concerted eff ort and the summary evidence above we ven-ture a 50% improvement in the rates of exclusive breast-feeding through 6 months of age (from 55% to more than
80% exclusive breas eeding) – as well as improved breas eeding behaviors in the later 6-24 month period.
3.3 Interven ons to Reduce Childhood Iron Defi ciency: Life Cycle Segment 4
Several interven ons aim to improve iron status among children less than 5 years of age. First, improved breas eeding provides a rich bioavailable source of iron during the fi rst 6 months and up to 24 months. Second, nutri on educa on along with “Sprinkles” or Mul ple Micronutrient Supplements (MMP) provide a signifi cant input of iron and other vitamins and minerals during the complementary feeding transi on to family foods during the 6-24 month period. Sachets of-fering 16 or more micronutrients enable “in-home” for fi ca on of complementary foods, creat-ing a more nutri onally dense meal. A key ingredient in MMPs is zinc, a micronutrient that has been associated with decreased morbidity and mortality as well as increased growth in children. Micronutrient sprinkles have been extensively tested in the fi eld with 16 studies with consis-tently signifi cant results and fi nding anemia “cure rates” of up to 90%.20 WHO recently published guidelines recommending universal distribu on of for MMPs when prevalence of anemia is 20% or higher, found that “home for fi ca on of foods with mul ple micronutrient powders reduced anemia at the end of the interven on by 31%.”21 Finally, as the child grows and consump on of adult foods rises, fl our for fi ca on is expected to provide increasingly signifi cant protec on to children 3-5 years of age. The analysis assumes a 30% over-all reduc on in iron defi ciency among children covered by these interven ons.
18 Bhu a t al Maternal and Child Undernutri on, Interven ons for maternal and child undernutri on & survival, Lancet January 17, 200819 Hernandez O, Lani M, Margaret P. Assessment of the impact of a na onal interven on to promote exclusive breas eeding in
Honduras. Washington DC: Academy for Educa onal Development, 1995.20 Studies summarized by Sprinkles Global Health Ini a ve h p://www.sghi.org/about_sprinkles/faqs.html21 Guideline: Mul ple micronutrient powders for home for fi ca on of foods consumed by infants and children 6–23 months, WHO 2011

43
Integrated Por olio of Nutri on Services
3.4 Stun ng and Underweight Reduc on: All Life-Cycle Segments
Stun ng is a holis c indicator of chronic malnutri on sensi ve to a range of factors including ini al birth outcome, breas eeding, caring and feeding prac ces as well as over-all macro and micronutrient content of the diet.22 In some cases, studies suggest some direct associa ons of single interven ons with improvement in stun ng. For example, provision of Sprinkles has shown some impact on linear growth.23 Other evidence suggests indirect pathways. For example, studies have found each episode of diarrhea is associated with a 4% increased chance of stunt-ing, sugges ng that be reducing incidence of diarrhea via improved breas eeding, reduc ons in stun ng can be achieved.24 Nevertheless, a full range of interven ons are more likely to have an eff ect on a complex indicator like stun ng. Recently the impact of 8 key interven ons for which suffi cient evidence of eff ec veness is available was modeled at various levels of coverage as part of the Lancet Child Development Series.25 Many of the interven ons modeled in the Lancet are proposed as part of IPNS, or considered not to be appropriate in the Georgia context, i.e. hygiene interven ons, vitamin A capsules or direct food supplementa on. Table 5 compares the Lancet-reviewed package with the proposed por olio of interven ons for Georgia.
Table 5: Comparison of IPNS and Lancet Modeled Interven onsModeled Interven ons in Lancet 2008 Parallel IPNS Interven ons Balanced Energy Protein Supplements Not considered necessary in GeorgiaCoverage with Preventa ve Treatments Ongoing vaccina on, check-ups and other programsMul ple Micronutrient Supplementa on in Pregnancy Segment 1Breas eeding Promo on and Support Segments 2-3 and 5Complementary Feeding Suppor ve Strategies Segment 3-4 Vitamin A Coverage Not considered necessary for GeorgiaZinc Supplementa on Segment 4: Included in Segment 4 (Sprinkles)Hygiene Interven ons & Promo on Segment 3-5. Part of nutri on and child care educa on
Table 7: Lancet Modeled Impact of 8 Interven ons on Stun ngCoverage Reduced Stun ng at 36 months
99% 35.50%90% 32.10%70% 23.60%
The results of the Lancet modeling are shown in Table 7. Depending on the pro-gram coverage, stun ng reduc on ranges from 24-36%. Elsewhere the Lancet Re-view notes that micronutrient interven- ons alone, might achieve reduc ons of
10-17%.26 Coverage for the full package of relevant interven ons was es mated earlier at 74%. Un-derstanding the diffi culty in making an evidence-based es mate for improvements in stun ng rates, and in the eff ort to err on the conserva ve side, for the purposes of this analysis we will apply a 25% eff ec veness rate in reducing stun ng (which will later by the corrected again by the coverage rate).
3.5 Flour For fi ca on: Iron Defi ciency Anemia and Neural Tube Defects.
While there are numerous effi cacy studies, impact evalua ons of na onal for fi ca on programs on anemia or iron defi ciency are regre ably scarce. The most comprehensive evalua on of a na onal program is from Venezuela during the 1990’s which found a decrease in anemia among
22 Rosado et al Separate and joint eff ects of micronutrient defi ciencies on linear growth. J Nutr. 1999 Feb;129(2S Suppl):531S-533S23 Rosado et al Separate and joint eff ects of micronutrient defi ciencies on linear growth. J Nutr. 1999 Feb;129(2S Suppl):531S-533S24 Bhu a t al Maternal and Child Undernutri on, Interven ons for maternal and child undernutri on & survival, Lancet January
17, 200825 IBID 26 IBID

44
IMPROVING HEALTH AND BUILDING PROSPERITY
lower income children from 16% to 9% - an improvement of 44%. Subsequent evalua ons over a decade found a sustained drop in iron defi ciency from 37% to 15% - an improvement of nearly 60%.27 As shown in the chart above, other subna onal programs found anemia decrease by 21% to 32%. Based on these evalua ons, the sec on below explores poten al impact of fl our for fi -ca on on iron defi ciency and neural tube defects.
Based on average bread consump on of 414 g/day found in the Georgia Na- onal Nutri on Survey, average fl our
consump on in Georgia is es mated at 257 grams a day.28 For countries with average fl our consump on 150-300 g/day, the World Health Organiza on Recommenda ons for Wheat and
Maize For fi ca on defi nes for fi ca on levels of 30 ppm of iron from either ferrous fumarate or fer-rous sulfate along with 1.3 ppm of folic acid as safe and effi cacious.29 Based on average consump on and this recommended for fi ca on level, we venture the following:
For fi ed fl our will provide 7.6 added mg/dy of iron, or 26% of WHO Recommended Nutri- on Intakes (RNI) for iron for an adult women of reproduc ve age consuming a mid bio-
availability diet. A WHO expert panel comprehensively reviewed published evidence from a number of diff erent programs and concluded that for fi ca on with ferrous sulfate or equivalent iron compound delivering a dose of 7.1 mg/day was considered “effi cacious.”30
Presuming reten on of 80% of added folic acid through baking and other processes, the average consumer of 257 grams would benefi t from an added 267 ug/dy or about 2/3rd of WHO RNI. The parameters for these es mates are summarized in Table 8.
31
Table 8: Delivery of Iron and Folic Acid Protec on via For fi ca on at Average Flour Consump on
For fi ca on Level Added Dietary Units @ 257 grams per day Propor on RNI
Added Iron @ 30 ppm @ 99% reten on 7.62 mg/dy 26% of 29.4 mg/dy31
Added Folic @ 1.3 ppm & 80% reten on 267 ug/dy 67% of 400 ug/dy
Implemented in accordance with WHO Recommenda ons, for fi ed fl our is safe as well as ef-fec ve. In the specula ve scenario below, based on the highest segment of individual bread consump on recorded in GNNS 2010, about 1100 bread per day, added iron and folic acid intake is well below interna onal safety thresholds – the IOM Council for Responsible Nutri on Lowest Observed Adverse Eff ects Level (LOAEL) and WHO Upper Tolerable Level (UL).32
Table 9: Propor on of Safety Thresholds Reached by Consump on of 1100 g For fi ed Bread Per Day
Added to Diet % LOAEL % WHO Upper Tolerable Level
Folic Acid 709 ug/dy 71% of 1000 ug/dy 71% of 1000 ug
Iron 20.6 mg/dy 20% of 100 mg/dy 45% of 45 mg/dy
Based on this analysis, we conclude, that fl our for fi ca on in Georgia may be at least, if not more
27 Scrimshaw et al, Success of Micronutrient For fi ca on of Cereal Flours in Venezuela, Micronutrient Ini a ve, 200228 Georgia Na onal Nutri on Survey, UNICEF/NCDC 201029 Recommenda ons on Wheat and Maize Flour For fi ca on Mee ng Report: Interim Consensus Statement, WHO 200930 IBID31 For mid-bioavailability diet32 this behavior would have to be sustained over a long period of me to show adverse eff ects

45
Integrated Por olio of Nutri on Services
eff ec ve in reduc on of iron defi ciency anemia than the na onal programs in Oman and Venezu-ela shown above. First, these programs are not op mally implemented in terms of iron compound and levels. The iron for fi cant recommended for Georgian na onal program, ferrous fumarate off ers higher bioavailability than the electroly c iron used in the Oman and Darjeeling evalua ons above or the par al ferrous fumarate used in Venezuela. Also, these evalua ons report on the reduc on in over-all anemia, while the baseline described in the DAR already corrects for the propor on of anemia a ributable to iron defi ciency – and thus sensi ve to added dietary iron via for fi ca on. Therefore, this analysis conserva vely ventures a projec on of 40% eff ec veness in reduc on of iron defi ciency anemia – midway between the Venezuela and Asian results.
The results of fl our for fi ca on with folic acid in the United States, Canada, Costa Rica, Chile and South Africa provide the background data for projec ng eff ec veness of fl our for fi ca on in reducing rate of NTDs. In each case, folic acid for fi ca on was followed by an immediate in-crease in popula on serum folate concentra ons and signifi cantly reduced rates of NTDs.33 In the United States, 3 studies reported reduc on in spina bifi da and anencephaly ranging up to 50%.34
Two Canadian studies found NTDs reduced from more than 2 per 1000 births to a li le over 1 per 1000.35 Ini al data evalua ng folic acid for fi ca on in Chile suggests up to 47% decline in NTDs.36
Costa Rica found reduc ons in well covered popula ons of 87%.37 Based on the substan al ad-di onal dose of folic acid shown in Table 9 above we speculate eff ec veness of 70% in reducing NTDs in Georgia. Impact on adult women will be supported by other interven ons including supplements to 93% of pregnant women in Segment 1 and projected 25% women of reproduc- ve age with no access to industrial fl our in Segment 5.
3.6 Summary IPNS Eff ec veness Es mates
Based on the literature reviewed above the Table 10 below outlines the eff ec veness es mates that will be used in the IPNS analysis.
Table 10: Summary of Assumed Eff ec veness of IPNS ComponentsAssumed Eff ec veness Ra onale or Source for Assump on
Low Birth Weight 10% Lower end of cited studiesMaternal Anemia & Perinatal Death 25% Mid-Range of Cited studies Sub Op mal Breas eeding 50% Mid-Range from mul ple cited sourcesNeural Tube Defect 70% Based on Costa Rica and Chile evalua onsStun ng & Underweight 25% Based on Lancet Model for integrated interven onsIron Defi ciency Children 30% Based on fl our for fi ca on and sprinkles evalua onsIDA Adults 50% Combined for fi ca on/supplementa on
33 Lawrence JM, Pe DB, Watkins M, Umekubo MA. Trends in serum folate a er food for fi ca on. Lancet 1999; Jacques PF, Selhub J, Bostom AG, Wilson PW, Rosenberg IH. The eff ect of folic acid for fi ca on on plasma folate and Total homocysteine concentra ons. New England Journal of Medicine 1999; 340:1449-54.Ray JG, Vermeulen ; MJ, Boss SC, Cole DE. Increased red cell folate concentra ons in women of reproduc ve age a er Canadian folic acid food for fi ca on. Epidemiology 2002; 13:238-40; Medical Research Council Vitamin Study Research Group. Preven on of neural tube defects: results of the Medical Research Council Vitamin Study. Lancet. 1991;338:131–137.
34 Honein MA, Paulozzi LJ, Mathews TJ, Erickson JD, Wong LY. Impact of folic acid for fi ca on of the US food supply on the occurrence of neural tube defects. JAMA 2001; 285:2981-6; Persad VL, Van den Hof MC, Dube JM, Zimmer P; Incidence of open neural tube defects in Nova Sco a a er folic acid for fi ca on. CMAJ: Canadian Medical Associa on Journal. 2002; 167:241-5; 14. Williams LJ, Mai CT, Edmonds LD. Prevalence of spina bifi da and anencephaly during the transi on to mandatory folic acid for fi ca on in the United States. Teratology 2002; 68:33-39.
35 De Wals P, Rusen ID, Lee NS, Morin P, Niyonsenga T. Trend in prevalence of neural tube defects in Quebec. Birth Defects Research 2003; 67:919-23; Persad VL, Van den Hof MC, Dube JM, Zimmer P. Incidence of open neural tube defects in Nova Sco a a er folic acid for fi ca on. CMAJ: Canadian Medical Associa on Journal. 2002; 167:241-5.
36 Grosse SD, Hopkins DP, Mulinare J, Llanos A, Hertrampf E. Folic acid for fi ca on and birth defects preven on: lessons from the Americas. AGROFood industry hi-tech 2006; 17.
37 Chen LT, Rivera MA. The Costa Rican experience: reduction of neural tube defects following food fortification programs. Nutr Rev 2004;62:S40-3.
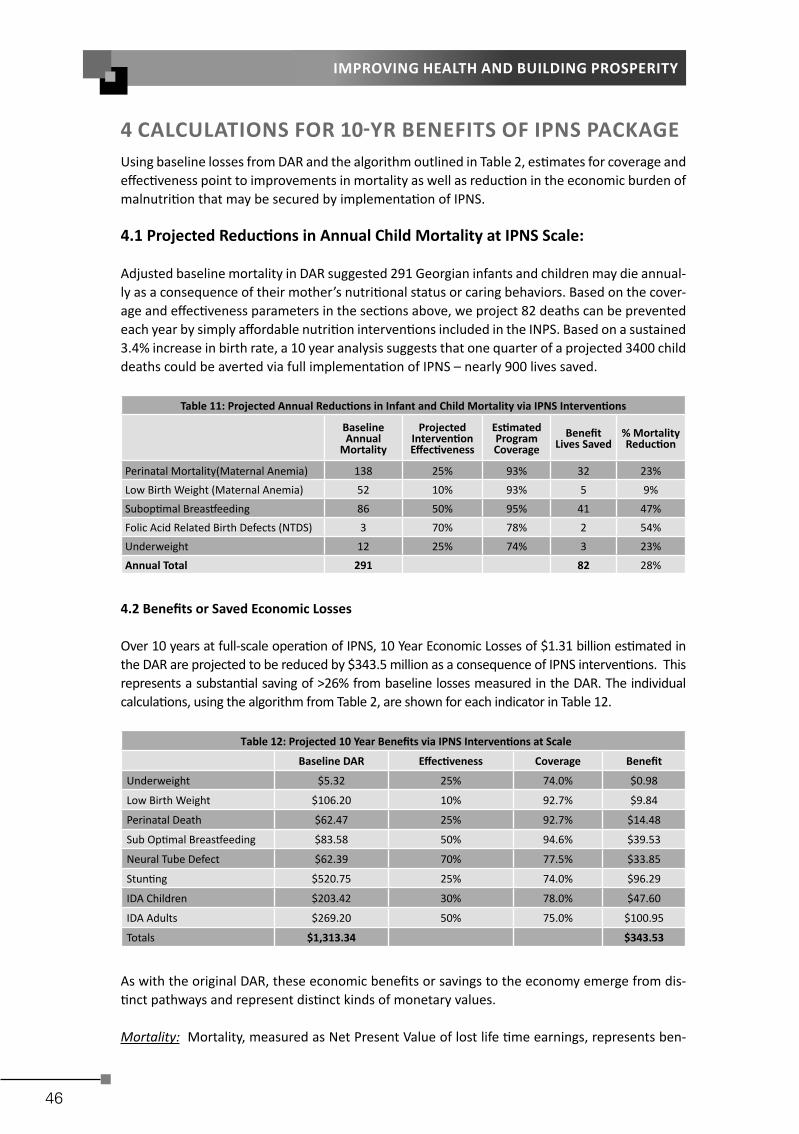
46
IMPROVING HEALTH AND BUILDING PROSPERITY
4 CALCULATIONS FOR 10 YR BENEFITS OF IPNS PACKAGEUsing baseline losses from DAR and the algorithm outlined in Table 2, es mates for coverage and eff ec veness point to improvements in mortality as well as reduc on in the economic burden of malnutri on that may be secured by implementa on of IPNS.
4.1 Projected Reduc ons in Annual Child Mortality at IPNS Scale:
Adjusted baseline mortality in DAR suggested 291 Georgian infants and children may die annual-ly as a consequence of their mother’s nutri onal status or caring behaviors. Based on the cover-age and eff ec veness parameters in the sec ons above, we project 82 deaths can be prevented each year by simply aff ordable nutri on interven ons included in the INPS. Based on a sustained 3.4% increase in birth rate, a 10 year analysis suggests that one quarter of a projected 3400 child deaths could be averted via full implementa on of IPNS – nearly 900 lives saved.
Table 11: Projected Annual Reduc ons in Infant and Child Mortality via IPNS Interven ons
Baseline Annual
Mortality
Projected Interven on Eff ec veness
Es mated ProgramCoverage
Benefi tLives Saved
% Mortality Reduc on
Perinatal Mortality(Maternal Anemia) 138 25% 93% 32 23%Low Birth Weight (Maternal Anemia) 52 10% 93% 5 9%Subop mal Breas eeding 86 50% 95% 41 47%Folic Acid Related Birth Defects (NTDS) 3 70% 78% 2 54%Underweight 12 25% 74% 3 23%Annual Total 291 82 28%
4.2 Benefi ts or Saved Economic Losses
Over 10 years at full-scale opera on of IPNS, 10 Year Economic Losses of $1.31 billion es mated in the DAR are projected to be reduced by $343.5 million as a consequence of IPNS interven ons. This represents a substan al saving of >26% from baseline losses measured in the DAR. The individual calcula ons, using the algorithm from Table 2, are shown for each indicator in Table 12.
Table 12: Projected 10 Year Benefi ts via IPNS Interven ons at Scale
Baseline DAR Eff ec veness Coverage Benefi t
Underweight $5.32 25% 74.0% $0.98
Low Birth Weight $106.20 10% 92.7% $9.84
Perinatal Death $62.47 25% 92.7% $14.48
Sub Op mal Breas eeding $83.58 50% 94.6% $39.53
Neural Tube Defect $62.39 70% 77.5% $33.85
Stun ng $520.75 25% 74.0% $96.29
IDA Children $203.42 30% 78.0% $47.60
IDA Adults $269.20 50% 75.0% $100.95
Totals $1,313.34 $343.53
As with the original DAR, these economic benefi ts or savings to the economy emerge from dis- nct pathways and represent dis nct kinds of monetary values.
Mortality: Mortality, measured as Net Present Value of lost life me earnings, represents ben-

47
Integrated Por olio of Nutri on Services
efi ts of $37 million – a reduc on of 28% from baseline with the largest propor onal improve-ments a ributed to higher rates of exclusive breas eeding and lower rates of NTDs. This repre-sents ~9% of total $380 million IPNS benefi ts. An economic methodology clearly underes mates the value of the projected 1000 lives saved over 10 years.
Table 13: Pathway #1: Benefi ts Projec on for NPV of Lost Wages due to Mortality
Baseline Benefi t % Improvement
Underweight $5.32 $0.98 18%
Low Birth Weight $23.90 $2.22 9%
Perinatal Mortality $62.47 $14.48 23%
Subop mal Breas eeding $39.44 $18.65 47%
Birth Defect NTD $1.55 $0.84 54%
$132.68 $37.17 28%
Future Produc vity and Work Performance: Enabling children to achieve their full poten al rep-resents the greatest pathway to economic impact of IPNS interven ons. The analysis values ben-efi ts of IPNS interven ons at $151 million return via NPV of improved economic ac vity and work performance of today’s children – a reduc on of almost ¼ from baseline losses indicated in the DAR. This pathway represents more than 40% of all gains projected for IPNS.
Table 14: Pathway #2 Benefi ts Projec on for NPV of Future Losses from Defi cits in ChildrenBaseline Benefi t % Improvement
Stun ng $520.75 $96.29 18%Birth Defect NTD $12.78 $6.93 54%Iron Defi ciency in Children < 5 Years $203.42 $47.60 23%
$736.95 $150.82 20%
Reduced Current Medical and Hospital Costs: The model projects $54.6 million in lower u liza on of health care services over 10 years – savings to both public ins tu ons, the social insurance system as well as fami-lies. The projec on is based on reduced need for: surgery, rehabilita on and disability payments related to NTDs; special care in maternity clinics for infants born with low birth weight; and lower incidence of diarrhea and ARI from improved breas eeding prac ces. Baseline losses for this pathway are reduced by almost 1/3rd represen ng about 20% of the total $380 million benefi t projected for IPNS.
Table 15: Pathway #3 Benefi ts Projec on for Current Excess Health Care CostsBaseline Benefi t % Improvement
Subop mal Breas eeding $44.15 $20.88 47%Birth Defect NTD $48.06 $26.08 54%Low Birth Weight $82.29 $7.63 9%
$174.50 $54.58 31%
Adult Work Performance in Manual Labor: Flour for fi ca on and targeted supplementa on for control and preven on of iron defi ciency anemia in adult workers, predominantly women but also including some men, promises ~$100 million in benefi ts over 10 years. This represents more than one-quarter of total IPNS Benefi ts.
Table 16: Pathway #4: Benefi ts Projec on for Current Losses in Working Adults
Baseline Benefi t % Improvement
Current Losses in Working Adults $269.2 $100.9 37.5%
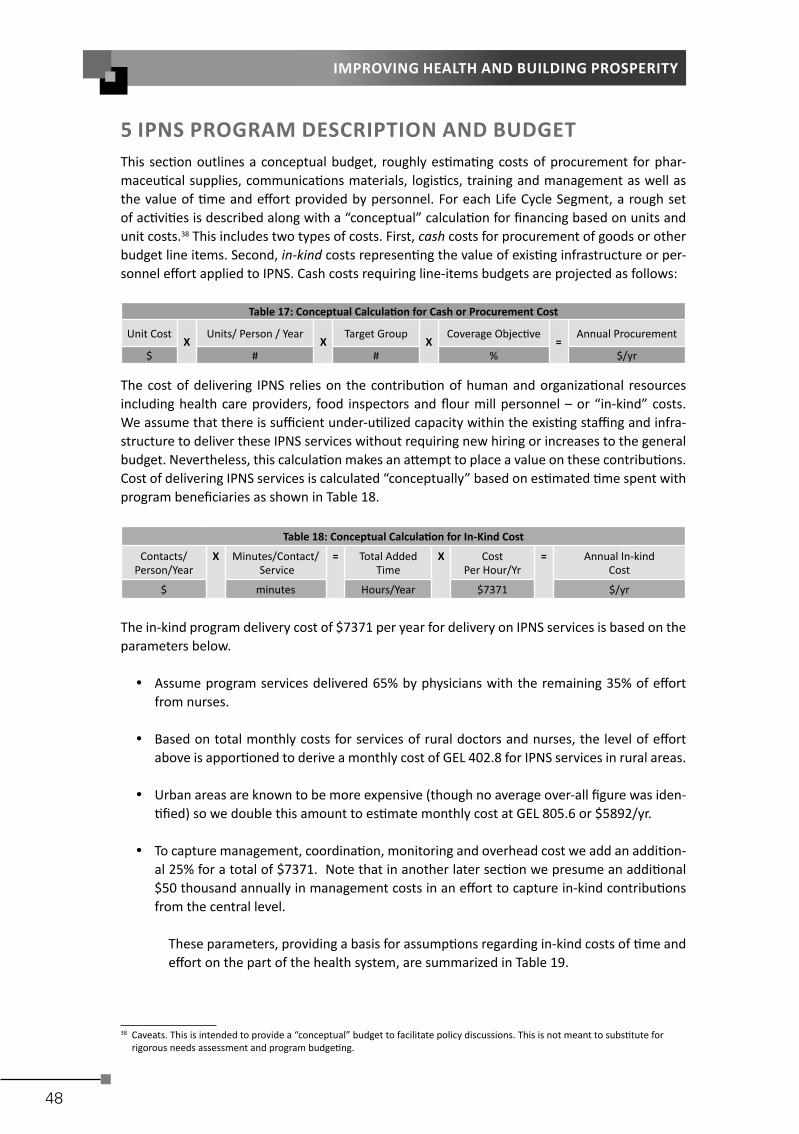
48
IMPROVING HEALTH AND BUILDING PROSPERITY
5 IPNS PROGRAM DESCRIPTION AND BUDGETThis sec on outlines a conceptual budget, roughly es ma ng costs of procurement for phar-maceu cal supplies, communica ons materials, logis cs, training and management as well as the value of me and eff ort provided by personnel. For each Life Cycle Segment, a rough set of ac vi es is described along with a “conceptual” calcula on for fi nancing based on units and unit costs.38 This includes two types of costs. First, cash costs for procurement of goods or other budget line items. Second, in-kind costs represen ng the value of exis ng infrastructure or per-sonnel eff ort applied to IPNS. Cash costs requiring line-items budgets are projected as follows:
Table 17: Conceptual Calcula on for Cash or Procurement Cost
Unit Cost X
Units/ Person / YearX
Target GroupX
Coverage Objec ve=
Annual Procurement
$ # # % $/yr
The cost of delivering IPNS relies on the contribu on of human and organiza onal resources including health care providers, food inspectors and fl our mill personnel – or “in-kind” costs. We assume that there is suffi cient under-u lized capacity within the exis ng staffi ng and infra-structure to deliver these IPNS services without requiring new hiring or increases to the general budget. Nevertheless, this calcula on makes an a empt to place a value on these contribu ons. Cost of delivering IPNS services is calculated “conceptually” based on es mated me spent with program benefi ciaries as shown in Table 18.
Table 18: Conceptual Calcula on for In-Kind Cost
Contacts/Person/Year
X Minutes/Contact/ Service
= Total Added Time
X CostPer Hour/Yr
= Annual In-kindCost
$ minutes Hours/Year $7371 $/yr
The in-kind program delivery cost of $7371 per year for delivery on IPNS services is based on the parameters below.
Assume program services delivered 65% by physicians with the remaining 35% of eff ort from nurses.
Based on total monthly costs for services of rural doctors and nurses, the level of eff ort above is appor oned to derive a monthly cost of GEL 402.8 for IPNS services in rural areas.
Urban areas are known to be more expensive (though no average over-all fi gure was iden- fi ed) so we double this amount to es mate monthly cost at GEL 805.6 or $5892/yr.
To capture management, coordina on, monitoring and overhead cost we add an addi on-al 25% for a total of $7371. Note that in another later sec on we presume an addi onal $50 thousand annually in management costs in an eff ort to capture in-kind contribu ons from the central level.
These parameters, providing a basis for assump ons regarding in-kind costs of me and eff ort on the part of the health system, are summarized in Table 19.
38 Caveats. This is intended to provide a “conceptual” budget to facilitate policy discussions. This is not meant to subs tute for rigorous needs assessment and program budge ng.

49
Integrated Por olio of Nutri on Services
Table 19: Methodology for Calcula ng Cost Per Hour for IPNS Services
1. Rural Physician Total Monthly Cost39 456 GEL/month 65% for IPSN 296.4 GEL/month
2. Rural Nurse Total Monthly Cost40 304 GEL/month 35% for IPNS 106.4 GEL/month
3. Es mated IPNS Program Monthly Cost Sum Lines 1 and 2 above 402.8 GEL/month
4. Adjust for Greater Expense in Urban Areas 402.8 GEL/month X 200% 805.6 GEL/Month
5. Subtotal USD Monthly IPNS Cost Es mate Line 4 Annualized & Converted to USD $5,897
6. Es mate Management, Monitoring, Overhead Line 5 X 125% $1,474
Total USD Monthly IPNS Cost Es mate $ 7,371
3940
5.1 Start-Up and Capital Costs
Capacity building within the health system sector, food control agencies and private sector will be required for delivery of IPNS. For Segments 1-4 this includes development of protocols and standards of care to support IPNS investments including:
Reformed standards for antenatal care and service delivery including protocols for prophy-lac c distribu on of micronutrient supplements to pregnant and lacta ng women.
Establish standards for distribu on of mul ple micronutrient powders for children 6-24 months of age.
Communica ons to physicians, nurses and managers. Development of management and informa on systems to support IPNS.
For Segment 5, fl our for fi ca on, IPNS startup includes:
Promulgate mandatory standards for for fi ca on domes c and imported fl our. Capacity building and lab upgrades for food control sector. Capital investment in feeders, plan renova ons and training for fl our mill personnel. While
we note many of these investments have already been made, these are “counted” for the purposes of making a benefi t cost analysis.
Roughly es mated for start-up investments of $1.3 million are projected for capital equipment planning, advocacy and capacity building in both public and private sectors.
Table 20: Es mates for Start-Up Training and Capital Investments
Private Sector Start-Up 200,000Food Control Start-Up 100,000
Health Systems Start-Up 1,000,000
Some addi onal investments may be required in over-all systems improvement including informa on technology, management and monitoring. However, these are considered requirements aiming to improve the over-all effi ciency of primary health care system – not only the proposed IPNS ac vi es. While the conceptual budget described here will include basic capacity building costs for IPNS, these broader costs for improvements in quality of over-all health system delivery are not included. The sec ons below review ac vi es and cost structure for each Life-Cycle Segment.
39 Personal Communica on, UNICEF40 IBID

50
IMPROVING HEALTH AND BUILDING PROSPERITY
5.2 Life Cycle Segment 1: Pregnancy
High u liza on of antenatal services provides an opportunity to cost eff ec vely integrate simple aff ordable ac vi es to improve maternal health, fetal growth and birth outcomes. IPNS pro-poses that over the course of at least four antenatal consulta ons women are provided with:
180 mul ple micronutrient suppléments per pregnancy. Educa on to enhance supplement awareness and compliance including take-home 2 edu-
ca onal materials per pregnant women. Addi onal nutri on counseling for special needs for pregnancy including take-home edu-
ca onal materials. Content of mul ple micronutrient supplement currently procured by UNICEF including 16 essen- al vitamins and minerals is shown in the at-
tached fi gure. Implementa on of will require harmoniza on of current antenatal supplemen-ta on protocols for pregnant women with WHO guidelines for universal distribu on as reviewed in WHO Integrated Management of Pregnancy and Childbirth (IMPAC) Standards for Maternal and Neonatal Care that states: when prevalence of anemia is > 20% “Give all pregnant women a standard does of 60 mg iron and 400 ug folic acid daily for six months.”41
Table 21 below es mates cash input costs of $20.5 thousand for mul ple vitamin and mineral supplement and $58.9 thousand for 2 educa onal “take-home” materials to be provided during antenatal contacts (Note that communica ons research will determine the media and message for these materials and this budget is meant only to roughly defi ne a $1 per person expenditure). Table 21 outlines the parameters of this calcula on sugges ng roughly $80 thousand annually to include this IPNS component to antenatal care services.
Table 21: Es mated Cash Costs for Procurement of Inputs to IPNS Segment 1
Unit Cost/Unit #/Units pp
Target Group Coverage Program
Cost
Mul ple Micronutrient Supplement Supplement $0.0039 90 63,016 92.7% $20,460
Antenatal and Child Care Educa on Materials $0.500 2 63,016 92.7% $58,416
Subtotal $78,875
Rough es mates for value of eff ort of physicians, nurses, and managers to deliver Segment 1 services include added 40 minutes of me by health workers. The 8 contacts of 5 minutes each during ongoing antenatal visit are illustra ve only – these 40 minutes may be delivered over the course of only 4 consulta ons. Es mates in Table 22 suggests that a er adding 25% to account for management and overhead, delivery of this component will require early 28 person years. At $7371 per person this suggests a value of > $200 thousand in delivery of services – almost 3 mes the cash costs of supplements and educa on materials.
41 Integrated Management of Pregnancy and Childbirth (IMPAC) Standards for Maternal and Neonatal Care, WHO www.who.int/reproduc vehealth/publica ons/maternal_perinatal_health/emergency_preparedness_antenatal_care.pdf

51
Integrated Por olio of Nutri on Services
Table 22: Es mated Value of Added Eff ort by Current Staff to Implement IPNS Segment 1
Target Group Coverage Contacts/ Benefi ciary/yr
Time/ Contact
Total Required Per-son Years In-Kind Cost
# # #/yr minutes @220dys/8hrs @$7371/yrMul ple Micronu-trient Supplement 63,016 92.7% 4 5 13.83 $101,940
Antenatal and Child Care Educa on 63,016 92.7% 4 5 13.83 $101.940
Total in USD $203,880
Total recurring cost of providing Segment 1 IPNS package during pregnancy is es mated at roughly $280 thousand annually as shown in Table 23.
Table 23: Summary Annual Cash and In-Kind Costs for IPNS Segment 1
Life Cycle Segment 1: Pregnancy Cash In-Kind Total
Mul ple Micronutrient Women $20,460 $101,940 $122,400
Antenatal and Child Care Educa on $58,416 $101.940 $160,356
Subtotal $78,875 $203,880 $282,756
5.3 Life Cycle Segment 2: Delivery in Maternity Homes:
With a reported 99% of births in a professional facility, nearly all births are in an environment where health professionals can secure the full a en on of new mothers during their maternity stay. IPNS recommends full expansion and sustained implementa on of the Baby Friendly Hos-pital Ini a ve (BFHI) in all maternity facili es including: full implementa on of rooming-in a er birth; providing support to assure early ini a on of breas eeding; educa on to promote longer term breas eeding behaviors; and ini al counseling for comprehensive child feeding, care and educa on. Given the high losses a ributed to low rates of exclusive breas eeding in Georgia, IPNS proposes suppor ng BFHI with an addi onal 2 half hour counseling sessions per mother along with produc on of suppor ng communica on materials. Added communica on materials, budgeted $2 per pregnant women, might be used in a number ways: produc on of individual take home educa on materials or produc on of audiovisuals to be viewed along with counseling sessions (and related playback equipment). Total costs for in-kind eff ort of maternity personnel is es mated ~$450 thousand annually, about one quarter represen ng cash costs.
Table 24: Es mated Costs for Procurement of Inputs to IPNS Segment 2
Segment II:BF Educa on/Care to BFHI Cost/Unit #/Units per
person Target Group Coverage Cash
Annual Cash Procurement Costs $2.00 1 63,016 98.8% $124,519
Annual In-kind Eff ortCovered Contacts Minutes Person Years In-Kind Cost62,259 2 30 44.22 $325,945
5.4 Life Cycle Segment 3: Months 0-6
IPNS recommends intensive eff orts to ensure op mal maternal nutri on and exclusive breast-feeding during this cri cal period of high mortality risk via a package of services integrated into all primary health care contacts with mothers and children both during clinic visits including:
Con nued mul ple micronutrient supplements for lacta ng mothers. Maternal nutri on status may be an enabling key to healthy breas eeding prac ces.

52
IMPROVING HEALTH AND BUILDING PROSPERITY
Breas eeding educa on during rou ne health center visits including addi on of short counseling session along with 2 dis nct “take-home” materials.
Cash costs for procurement of mul ple micronutrient supplements and educa on materials suf-fi cient to reach the target of 92% of lacta ng women during the fi rst 6 months a er delivery is roughly es mated at $40 thousand annually.
Table 25: Es mated Cash Costs for Procurement of Inputs to IPNS Segment 3
Unit Cost/Unit
#/Units pp
Target Group
Cover-age
Program Cost
Breas eeding Promo onal Materi-als
Materials $0.50 2 31,508 92.3% $29,074
Mul ple Micronutrient Supplement Supplement $0.0039 90 31,508 92.3% $10,183
Subtotal $39.257
This activity projects that 4 routine maternal/child contacts with health workers are enhanced with an added 5 minutes per contact for nutrition and breastfeeding counsel-ing as well as distribution of multiple micronutrient supplements (along with education to increase compliance with supplementation regime) - for a total incremental effort of roughly 20 minutes per mother. This suggests about 7 person years - indicating value of effort roughly $50 thousand.
Table 26: Es mated Value of Added Eff ort by Current Staff to Implement IPNS Segment 3
Target Group Coverage Contacts/
Benefi ciary/yrTime/
ContactTotal Required Person Years In-Kind Cost
# # #/yr minutes @220dys/8hrs @$7371/yrMul ple Micronutrient Supplement 31,508 92% 2 5 3.44 $25,368
Antenatal and Child Care Educa on 31,508 92% 2 5 3.44 $25,368
Total in USD $50,736
Total cash and in-kind cost of Segment 3 is projected at ~$90 thousand per year for providing breas eeding educa on, related materials and supplements
Table 27: Summary Annual Cash and In-Kind Costs for IPNS Segment 3
Cash In-Kind Total
Breas eeding Educa on/Promo on $29,074 $25,368 $54,442
Maternal Mul ple Micronutrient $10,183 $25,368 $35,551
Total $39,257 $50,736 $89,993
5.5 Life Cycle Segment 4: Children 6-24 months.
Less than half of Georgian children 6-24 months consume foods with a minimal level of dietary diversity – sugges ng defi cits in a range of nutrients.42 To address dietary defi ciencies in this cri cal age group – a key to addressing childhood stun ng and anemia – Segment 4 includes two
42 Woodruff et al, Georgia Na onal Nutri on Survey, UNICEF/NCDC 2010

53
Integrated Por olio of Nutri on Services
interven ons to improve low micronutrient intakes and other poten al causes of stun ng and anemia in young children.
Child Feeding & Care Counseling and Educa on: Best prac ces for infant and young child feed-ing and care including food selec on, prepara on, hygiene and con nued breas eeding.
Mul ple Micronutrient Powders (MMPs or Sprinkles): Sachets off ering 16 micronutrients for “in-home” for fi ca on of complementary foods, crea ng a more nutri onally dense meal. A key ingredient in sprinkles is zinc, a micronutrient that has been associated with decreased morbidity and mortality along with increased growth in children.
Total recurring fi nancing for procurement suffi cient to cover an es mated 86% of children in the 6-24 month old cohort totals ~$516 thousand annually as follows:
The cost of sprinkles is based on a 16 micronutrient sachet from UNICEF procurement in Copenhagen at ~ $0.027 per sachet.43 This budgeted scenario is for “fl exible administra- on” of 180 sachets, 90 per 6 month period. This “fl exible administra on,” as opposed
to a more expensive regime of daily doses, has been found to increase acceptability and adherence. In one study fl exible dose of several mes a week was 55% more eff ec ve in reducing anemia long term.44
3 educa on materials for each mother to support infant and child feeding and care coun-seling are budgeted at $0.50 each.
The recurring cost of $516 thousand annually for represents the largest single cash expense in IPNS. But rising anemia and stun ng rates during this 6-24 month period represents about half the economic loss measured in the DAR.
Table 28: Es mated Cash Costs for Procurement of Inputs to IPNS Segment 4
Unit Cost/Unit #/Units pp
Target Group Coverage Program
CostYoung Child Feeding & Care Educa- on Materials $0.50 3 94,524 86% $122,597
Mul ple Micronutrient Supplement Supple-ment $0.0268 180 94,524 86.5% $393,659
Subtotal $516,256
In-kind eff ort in the delivery of this IPNS segment is valued at $304 thousand annually. This es -mate includes a total of 40 minutes of addi onal me per child for distribu ons of MMPs as well as counseling and distribu on of educa onal materials to mothers. Total cash and in-kind costs for Segment 4 total more than $820 thousand annually.
43 UNICEF Procurement, Copenhagen including 26% for distribu on and overages.44 Ip H, Hyder SM, Haseen F, Rahman M, Zlotkin SH Improved adherence and anaemia cure rates with fl exible administra on of
micronutrient Sprinkles: a new public health approach to anaemia control. Eur J Clin Nutr. 2009 Feb;63(2):165-72. Epub 2007 Sep 26.
.

54
IMPROVING HEALTH AND BUILDING PROSPERITY
Table 29 : Es mated Value of Added Eff ort by Current Staff to Implement IPNS Segment 4
Target Group Coverage Contacts/
Benefi cary/yrTime/
ContactTotal Required Person Years In-Kind Cost
# # #/yr minutes @220dys/8hrsMul ple Micronutrient Supplement 94,524 92% 4 5 20.65 $152,209
Antenatal and Child Care Educa on 94,524 92% 4 5 20.65 $152,209
Total in USD $304,418
Table 30 : Summary Annual Cash and In-Kind Costs for IPNS Segment 4
Cash In-Kind Total
Mul ple Micronutrient Powders $393,659 $152,209 $545,868
Feeding/Care/Paren ng Educa on $122,597 $152,209 $274,806
Subtotal $516,256 $304,418 $820,675
5.6 Life Cycle Segment 5: Popula on-wide interven on
This segment includes 3 components focusing on raising popula on wide nutri on status and awareness including:
Flour for fi ca on with at least iron and folic acid Iron-folic acid supplementa on in rural areas not served by for fi ca on Mass media to support awareness of IPNS as well as other health issues
5.6.1 Flour For fi ca on
The following rough fl our for fi ca on budget presumes a na onal policy requiring for fi ca on of all domes c and imported fl our. Global evidence shows that mandatory regula ons also maxi-mize coverage and the opportunity for public health benefi ts. This provides confi dence for investment by the private sector and minimizes management, regulatory, marke ng and moni-toring expenses.45
The major cost for fl our for fi ca on in Georgia will be imported for fi cant premix. Based on iron and folic acid for fi ca on levels recommended by WHO for countries with average consump on 150-300 grams per day, premix costs are es mated at $5.91 per kilogram delivered to a central point in Georgia. With a projected addi on rate of 120 grams per metric ton, this indicates a for fi ca on cost of $0.71 per metric ton of fl our as shown in the Table 31 below.
Table 31: Es mated Cost of Flour For fi ca on Premix Based on WHO Recommended Levels
LevelAdded Compound Compound
Ac vity Compound in
MT Flour Compound
Cost/KgCost per Com-
ponent mg/kg % ppm mg/kg $/kg $
Folic Acid 1.3 Folic Acid 90% 1.4 $40.00 $0.48Iron 30 Ferrous Fumarate 32% 93.8 $4.00 $3.13Excipient 24.8 $1.00 $3.81Nutrient Cost/kg $3.81Premixing Cost /kg 1.50
45 Mandatory is not Op onal Flour For fi ca on Ini a ve, h p://www.sph.emory.edu/whea lour/TOOLKIT/5Types.html

55
Integrated Por olio of Nutri on Services
Transport/Distribu on 0.60Premix Cost/kg 5.91Cost/MT @ 120 g/MT 0.71
Based average per capita consump on of 257 g/dy fl our, na onal annual fl our milling is es -mated at 418,711 metric tons fl our (or more than 570 thousand metric tons of wheat at 73% extrac on).46 However, only 70% of total na onal consump on is produced at Georgia’s large mills that are capable of for fi ca on, indica ng a feasible for fi ed supply of roughly 293 thou-sand metric tons of fl our. For fi ca on of this volume will requires 35,172 kg of premix (@ 120 g/MT addi on rate) at an annual recurring cost of roughly $210 thousand.47 In addi on to the cost of premix, Table 32 below es mates a range of both cash and in-kind inputs from mills for process control, quality assurance, maintenance and management totaling $291 thousand. For- fi cant premix represents about 70% of the total $291 thousand projected recurring cash and
in-kind costs of fl our for fi ca on. This represents less than $1 per metric ton addi onal cost.
Table 32: Es mated Recurring Annual Costs of Flour For fi ca on for Milling SectorCost Descrip on Annual Recurring Cost
Units # Units $/Unit Total Cash In-kind Premix Premix in Kg to Distribu on Point 35.172 5.9 207,977 207,977 Domes c Storage & Distribu on 0.3 8,729 8,792.9 Mill Opera on Process Labor 2 Employees/Mill @ 10% $5k/yr 26 500 13,000 13,000 Maintenance 10% feeder value 130,000 0.1 13,000 13,000 Spot Tests Reagents 12/dy at 200 opera ng days/mill: 31,200 0.50 15,600 15,600 Feeder Adjustment 2/dy @ 200 dy/mill: 15 minutes 5,200 0.625 3,250 3,250 External Lab Analy-sis Monthly shipping and lab cost 156 100 15,600 15,600
Overhead & Mgt, 5% of all mill opera ng costs 357,561 5% 13,421 13,421 $290,642 $260,970 $29,671
A conceptual budget based on a generic approach to regulatory and monitoring ac vi es is of-fered in Table 33 below. The work program includes 4 inspec ons annually at each of 13 domes- c mills and 10 “market sweeps” to monitor the marketplace. Including a number of assump- ons, Table 33 es mates annual recurring cost is $22 thousand with 56% represen ng the value
of me an eff ort in-kind of personnel and infrastructure of the food control system.
46 There are other es mated including FAO es mate of about 700 thousand MT wheat 47 Presuming no Du es, tariff s or VAT

56
IMPROVING HEALTH AND BUILDING PROSPERITY
Table 33: Conceptual Flour For fi ca on Budget for Government Regulatory and Monitoring Ac vi es
Unit Number Cost/Unit Total Recurring Costs
Mill Inspec on Cash In-Kind
Inspector Sala-ries
Days:4/mill/yr @ ½ day/inspec- on
26 dys 22.73 591 591
Transport Km: @ 40km for 4 /Mill/yr 2,080 5.00 10,400 5,200 5,200
Spot Tst Materi-als
Samples: 2/mill/per inspec on 104 0.25 26 26
Shipping to Lab 25% Samples Sent to Lab 26 20.00 520 520
Management 25% of Inspec on Costs 11,537 25% 2,884 2,884
Monitoring in Market
Inspector Sala-ries
Days: 10 Market Sweeps @ 1/dy 10 22.73 227 227
Transport KM @ 40 Sweeps @ 40 km each 400 5.00 2,000 1,000 1,000
Spot Tst Materi-als
50 Samples per Market Sweep 500 0.25 125 125
Shipping to Lab 10% of Tests 50 20.00 1,000 1,000
Management 25% of Market Monitoring Costs 3,352 0.25 838 838
Laboratory Analysis:
Labor Sample @ 1/2 day 76 12.00 912 912
Expendables Sample 76 25.00 1,900 1,900
Overhead & Mgt 25% of Laboratory Analysis Costs
2,812 0.25 703 703
$22,126 $9,771 $12,355
Full annual recurring costs for government and industry, including all cash and in-kind costs total $313 thousand.
5.6.2. Iron Folic Acid Supplementa on for Women of Reproduc ve Age in Rural Areas
About 30% of domes c fl our consump on is not supplied by major milling industry and is not considered technically or fi nancially feasible. This suggests that a parallel propor on of adult women living predominantly in rural areas, es mated at ~248 thousand, may not have access to the iron and folic nutri on protec on of fl our for fi ca on – and this popula on may represent among the highest at-risk females. 48 Therefore, IPNS recommends an eff ort to reach this at-risk popula on with a program of preventa ve weekly iron and folic acid supplements distributed via the health system.
Experience from programs targe ng general female popula on with supplementa on suggests that there are substan al barriers. Awareness of anemia, demand for health services and contacts with the health system among healthy non-pregnant women is limited. Compliance with daily or weekly iron supplementa on is o en diffi cult to achieve. Most women in this target group live in rural hard-to-reach areas that are typically under-served by health and public services. Although social market-ing may have some impact in raising awareness and demand, for the sake of this analysis we project coverage of only 25% of this target group with 52 iron-folic acid supplements annually. While the costs of procurement are minimal, the in-kind eff ort of MOH staff in counseling women and distribu- on of iron folic acid tablets is substan al, more than $430 thousand annually and represen ng 1/3rd
of all in-kind eff ort by health workers towards IPNS.
48 GEOSTAT h p://www.geostat.ge/index.php?ac on=0&lang=eng

57
Integrated Por olio of Nutri on Services
Table 34: Es mated Costs for Procurement of Inputs for Folic Acid Supplementa on of Rural Women
Segment 6 Cost/Unit #/Units per person
Target Group Coverage Cash
Cash Procurement Costs $0.002 52 991,600 25% $25,782
Annual In-kind Eff ortCovered Contacts Minutes Person Years In-Kind Cost247,900 4 5 58.69 $432,607
5.6.3 Annual Mul -Media & Broadcast Campaigns
Most all Georgians have access to television and radio. There are 40 television sta ons in Geor-gia, of which nine are Tbilisi-based. These are the major sources of new informa on among Georgians – 95% get their get poli cal informa on from television.49 Given wide access to televi-sion, radio and other modern communica on channels, broadcast and mass media campaigns to raise over-all nutri on awareness off ers a key opportunity to:
Raise awareness of key behaviors related to malnutri on during the 1000 days window of opportunity from pregnancy through early childhood including breas eeding promo on.
Support popula on-wide IPNS eff orts namely fl our for fi ca on and iron folic acid supple-menta on.
Raise awareness and change behaviors related to diet and nutri on related disease includ-ing obesity, heart disease, diabetes and other chronic diseases.
While the full scope and cost of an annual health and nutri on related campaign should await more specifi c objec ves and concrete planning, we roughly project an annual budget of $300 annually, based on recent cost of na onal campaign for vaccines.
5.7 Summary Annual Costs for Baseline Year (2012)
Baseline annual recurring cost for delivery of all interven ons at scale is es mated at $2.765 mil-lion, about half for procurement of equipment, supplies, pharmaceu cals and related services and the remainder represen ng the es mated value of services (in-kind) devoted to the IPNS by government as well as the milling industry. This analysis assumes the added workload es mated at 179 person years should not involve the hiring of addi onal staff but the realloca on of me and work programs focusing on preventa ve nutri on interven ons and building capacity of families to take provide healthier and more nutri onal environment. Note that this conceptual budget includes an addi onal $50 thousand annually to an cipate a range of expenses and ef-fort in planning, managing and monitoring the na onal program at the central government level.
Table 35: Summary Annual Recurring Costs for IPNS Cash In-Kind Total % Cash Costs % Total Costs
Segments 1-5: Health Service Delivery Feeding/Care/Paren ng Educa on $122,597 $152,209 $274,806 9% 10%Breas eeding Educa on/Promo on $29,074 $25,368 $54,442 2% 2%Maternal Mul ple Micronutrient $10,183 $25,368 $35,551 1% 1%Mul ple Micronutrient Powders $393,659 $152,209 $545,868 29% 20%Antenatal and Child Care Educa on $58,416 $101,940 $160,356 4% 6%
49 European Journalism Center, h p://www.ejc.net/media_landscape/ar cle/georgia/
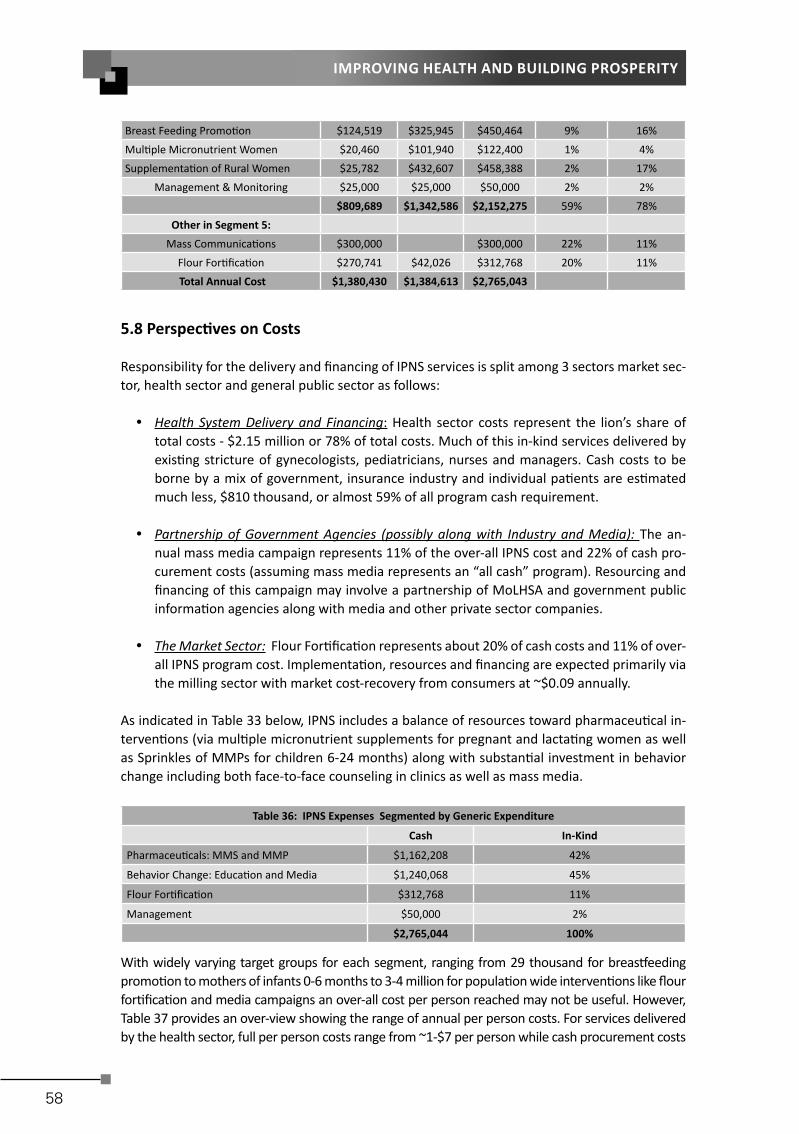
58
IMPROVING HEALTH AND BUILDING PROSPERITY
Breast Feeding Promo on $124,519 $325,945 $450,464 9% 16%Mul ple Micronutrient Women $20,460 $101,940 $122,400 1% 4%Supplementa on of Rural Women $25,782 $432,607 $458,388 2% 17%
Management & Monitoring $25,000 $25,000 $50,000 2% 2% $809,689 $1,342,586 $2,152,275 59% 78%
Other in Segment 5: Mass Communica ons $300,000 $300,000 22% 11%
Flour For fi ca on $270,741 $42,026 $312,768 20% 11% Total Annual Cost $1,380,430 $1,384,613 $2,765,043
5.8 Perspec ves on Costs
Responsibility for the delivery and fi nancing of IPNS services is split among 3 sectors market sec-tor, health sector and general public sector as follows:
Health System Delivery and Financing: Health sector costs represent the lion’s share of total costs - $2.15 million or 78% of total costs. Much of this in-kind services delivered by exis ng stricture of gynecologists, pediatricians, nurses and managers. Cash costs to be borne by a mix of government, insurance industry and individual pa ents are es mated much less, $810 thousand, or almost 59% of all program cash requirement.
Partnership of Government Agencies (possibly along with Industry and Media): The an-nual mass media campaign represents 11% of the over-all IPNS cost and 22% of cash pro-curement costs (assuming mass media represents an “all cash” program). Resourcing and fi nancing of this campaign may involve a partnership of MoLHSA and government public informa on agencies along with media and other private sector companies.
The Market Sector: Flour For fi ca on represents about 20% of cash costs and 11% of over-all IPNS program cost. Implementa on, resources and fi nancing are expected primarily via the milling sector with market cost-recovery from consumers at ~$0.09 annually.
As indicated in Table 33 below, IPNS includes a balance of resources toward pharmaceu cal in-terven ons (via mul ple micronutrient supplements for pregnant and lacta ng women as well as Sprinkles of MMPs for children 6-24 months) along with substan al investment in behavior change including both face-to-face counseling in clinics as well as mass media.
Table 36: IPNS Expenses Segmented by Generic Expenditure
Cash In-Kind
Pharmaceu cals: MMS and MMP $1,162,208 42%
Behavior Change: Educa on and Media $1,240,068 45%
Flour For fi ca on $312,768 11%
Management $50,000 2%
$2,765,044 100%
With widely varying target groups for each segment, ranging from 29 thousand for breas eeding promo on to mothers of infants 0-6 months to 3-4 million for popula on wide interven ons like fl our for fi ca on and media campaigns an over-all cost per person reached may not be useful. However, Table 37 provides an over-view showing the range of annual per person costs. For services delivered by the health sector, full per person costs range from ~1-$7 per person while cash procurement costs

59
Integrated Por olio of Nutri on Services
range from $0.35 per mother covered with maternal micronutrient supplements to nearly $5 to pro-vide children 6-24 months with MMPs. Popula on-wide interven ons in Segment 5 like fl our for fi -ca on and mass media campaigns are much less, ~$0.7-0.10 per person per year.
Table 37: Cost Per Person Reached for Various IPNS Ac vi es and Segments
Reached Per Person Cost
Cash Total
Life Cycle Segment 1: Pregnancy
Mul ple Micronutrient Supplement 58,416 $0.35 $2.10
Antenatal and Child Care Educa on $1.00 $2.75
Life Cycle Segment 2: Birth
BF Educa on/Care to BFHI 62,260 $2.00 $7.24
Life Cycle Segment 3: 0-6 months
Breas eeding Educa on/Promo on 29,074 $1.00 $1.87
Maternal Mul ple Micronutrient $0.35 $1.22
Life Cycle Segment 4: 6-24 months
Mul ple Micronutrient Powders 81,731 $4.82 $6.68
Feeding/Care/Paren ng Educa on $1.50 $3.36
Life Style Segment 6: Popula on-Wide
For fi ed fl our 3,128,440 $0.09 $0.10
Mass Communica ons 4,424,508 $0.07 $0.07
Targeted Iron/Folic Acid 247,900 $0.10 $1.85

60
IMPROVING HEALTH AND BUILDING PROSPERITY
6 FINANCIAL OVERVIEW & BENEFIT COST ANALYSIS OF IPNS
6.1 Summary Baseline and 10-Year Costs
The Table 38 off ers a 10 year perspec ve on IPNS costs segmented by 3 dis nct kinds of pro-grams: fl our for fi ca on, health services delivery and mass media campaign totaling ~$31 mil-lion. Costs for health services delivery is projected to grow along with a birth rate assumed to con nue to grow at 3.4%.50 Flour for fi ca on costs are projected to grow more slowly along - with over-all na onal consump on expanding along with the popula on at a rate of 0.56%.51 The lump sum projected for mass media campaign is held constant at $300,000 annually.
Table 38: 10 Year Recurring Costs Segmented by Health Services, Flour For fi ca on and Media Components
Year Flour For fi ca onGrowing at 0.56%/yr
Health Services CostsGrowing at 3.4%/yr Mass Media GRAND TOTAL
Cash In-kind Cash In-kind Cash Cash In-Kind Total
1 $0.27 $0.04 $0.81 $1.34 $0.30 $1.38 $1.38 $2.77
2 $0.27 $0.04 $0.84 $1.39 $0.30 $1.41 $1.43 $2.84
3 $0.27 $0.04 $0.87 $1.44 $0.30 $1.44 $1.48 $2.92
4 $0.28 $0.04 $0.90 $1.48 $0.30 $1.47 $1.53 $3.00
5 $0.28 $0.04 $0.93 $1.53 $0.30 $1.50 $1.58 $3.08
6 $0.28 $0.04 $0.96 $1.59 $0.30 $1.54 $1.63 $3.17
7 $0.28 $0.04 $0.99 $1.64 $0.30 $1.57 $1.68 $3.25
8 $0.28 $0.04 $1.02 $1.70 $0.30 $1.60 $1.74 $3.35
9 $0.28 $0.04 $1.06 $1.75 $0.30 $1.64 $1.80 $3.44
10 $0.28 $0.04 $1.09 $1.81 $0.30 $1.68 $1.86 $3.54
10 year $2.78 $0.43 $9.45 $15.68 $3.00 $15.23 $16.11 $31.34
This summary projec on indicates 10 year recurring costs $31 million – split evenly between cash and in-kind costs. Almost all in-kind costs are for the delivery of services by physicians, nurses and managers. 62% of cash costs are also for delivery of products and services by the health sector, with 18% represen ng the costs of fl our for fi ca on and 20% the proposed annual mass media campaign.
6.2 Benefi t Cost Ra o
A benefi t-cost ra o (BCR) is an indicator which a empts to summarize the overall “value for money” of a project or proposal. A BCR is the ra o of the benefi ts, expressed in monetary terms, rela ve to costs, also expressed in monetary terms.52 A BCR of more than one indicates an in-vestment with a posi ve return. Based on the 10 year budget in Table 38 above and 10 year projected benefi ts in Table 12, a 10 year benefi t cost scenario for IPNS is calculated in Table 39 below. The calcula on assumes the following.
All start-up costs of $1.3 million are applied in year 1 Year 1 implementa on at 50% scale – with parallel reduc on in both cost and benefi t.
50 GEOSTAT, average growth in birth rate, 2008-2011 51 GEOSTAT, average popula on growth, 2007-201052 Wikipedia h p://en.wikipedia.org/wiki/Costbenefi t_analysis

61
Integrated Por olio of Nutri on Services
Since nutri on interven ons take me to have eff ect, benefi ts are assumed to follow im-plementa on of interven ons by 1 year. Therefore, Year 1 represents a nega ve ra o or net benefi t.
On the other hand, costs for year 10 of implementa on are le blank because these ben-efi ts of year 10 are “paid for” in year 9 of the program. Separate analysis is run for total IPNS program costs and cash procurement costs only.
The analysis shown in Table 39 indicates that for the cash cost scenario, 10 Year Benefi t Cost Ra- o is projected at 20. As the program reaches sustained scale, a er year 2, the Benefi t Cost Ra o
reaches 23. When the denominator is adjusted to refl ect the total cost or in-kind value of IPNS, 10 Year Benefi t Cost Ra o is projected at 10. By either measure, the proposed comprehensive package of nutri on interven ons promises to be a cost-eff ec veness investment in the health and economic development of Georgia. It merits serious considera on.
Table 39: 10 Year Benefi t Cost Ra o Based on Scenarios for both Cash and Total Costs 10 Year Cost 10 Yr Benefi t Benefi t Cost Ra o Cash Total Cash Total1 $1.99 $2.68 - - 2 $1.41 $2.84 $14.71 10.4 5.2 3 $1.44 $2.92 $30.42 21.1 10.4 4 $1.47 $3.00 $31.45 21.4 10.5 5 $1.50 $3.08 $32.52 21.6 10.6 6 $1.54 $3.17 $33.63 21.9 10.6 7 $1.57 $3.25 $34.77 22.2 10.7 8 $1.60 $3.35 $35.95 22.4 10.7 9 $1.64 $3.44 $37.18 22.7 10.8
10 $38.44 10 Year $14.16 $27.72 $289.07 20.4 10.4

62
IMPROVING HEALTH AND BUILDING PROSPERITY