Embed Size (px)
Citation preview

Improving Industrial Energy Efficiency
6th Annual High-Performance Manufacturing
ConferenceCobourg, November, 2010
2
Presentation Overview
Why Energy Efficiency• CME/NRCan benchmarking survey• Government of Canada GHG emissions policy• Prices?
Where to begin
The CIPEC Approach • 7 Steps to improving your energy management practices• Practical examples
3
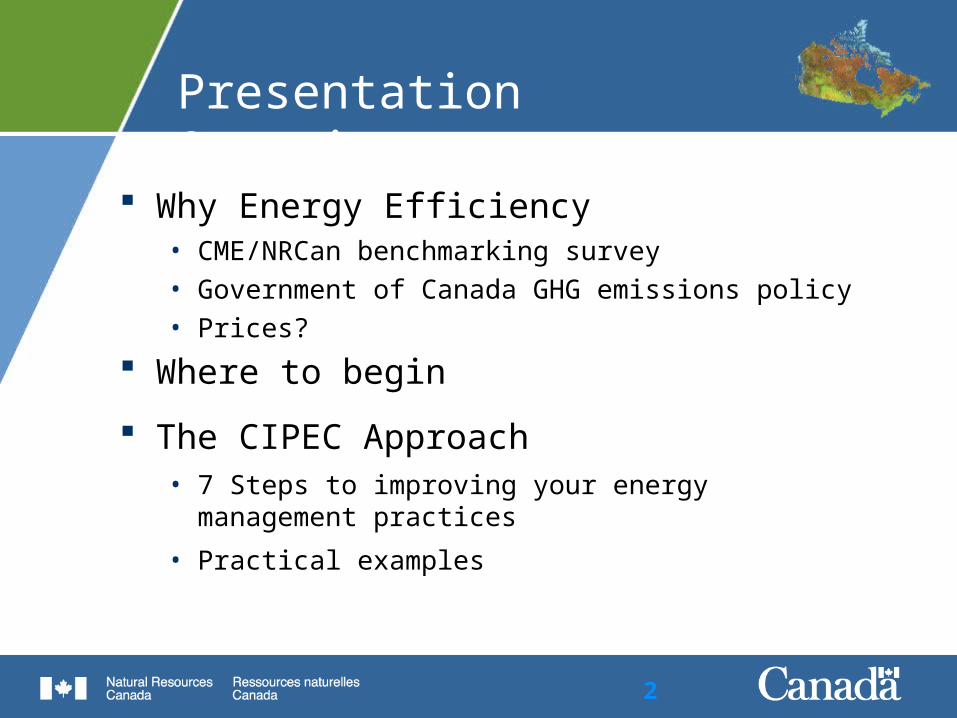
148 plants participated in the study between October 2008 to July 2009
8 86
16
0
26
15
2
26
18
23
Prim
ary
Met
al
Chem
ical
Pape
r
Non
-Met
allic
M
iner
al
Petr
oleu
m a
nd C
oal
Tran
spor
tatio
n Eq
uipm
ent &
M
achi
nery
Food
& B
ever
age
Min
ing
Fabr
icat
ed M
etal
Plas
tics
Oth
er M
fg.
CME/NRCan Survey

4
Low implementation of technical best practices (TBPs)
Most plants have implemented 42 percent of TBPs
Small- and medium-sized plants have implemented almost 10 percent less TBPs than large plants
Technical best practices

5
Low implementation of MBP in• Primary Metal manufacturing• Other manufacturing• Fabricated Metal manufacturing
Low implementation of management best practices (MBPs)
Higher implementation rates of MBPs were observed in:• Chemical• Non-metallic Mineral • Transportation and Machinery• Food and Beverage
Management Best Practices

6
Report findings
Energy projects managed on an ad-hoc basis, while best practices not widely implemented.
Large plants have implemented, on average, close to 30 percent more MBPs than SMEs.
When a company follows management best practices, they generally will have a higher implementation rate for technical best practices.

7
Report findingsIf all the remaining economically feasible best practices were implemented, total Ontario industrial energy use would decrease from 2007 levels by 29%
0
100
200
300
400
500
600
700
800
2007 2010 2015 2020 2025 2030
Tota
l Ene
rgy
Use
(PJ)
Milestone Year
Economic Potential Scenario
Reference Case
29%
Reference Case and Economic Potential Scenario energy use for all industry

8
Source: NRTEE Getting to 2050
Climate Change Policy
0
40
80
120
160
200
240
280
320
2005 2010 2015 2020
Mt
Co
2e
Additional reduction
GHG Emissions for Industry
610 Mt – Canada’s GHG emissions target for 2020
240 Mt – the amount Canada plans to reduce GHG emissions by 2020
120 Mt – the amount of GHG emission reductions to come from the industrial sector by 2020
Under the Government of Canada revised Turning the Corner – a plan to reduce greenhouse gas emissions by 17% from 2005 levels by 2020.
Energy efficiency (EE) key to Canada achieving it’s climate change commitments!
9
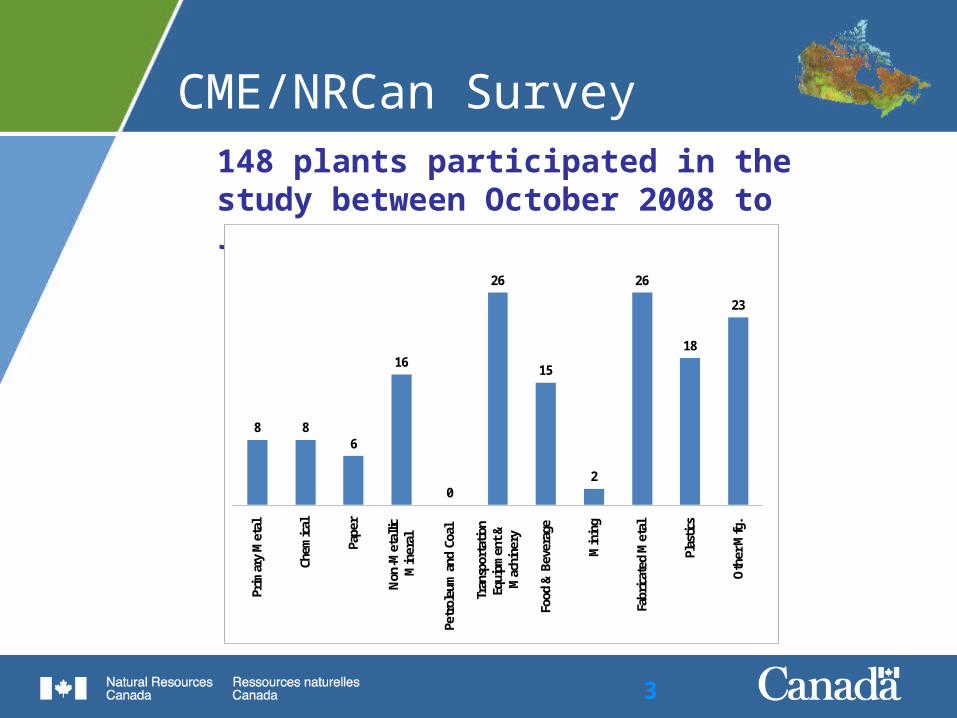
Rising Energy costs
The report, done for Canadian Manufacturers and Exporters (CME) projects electricity costs for business could jump by between 47.1 and 63.7 per cent by 2015.
- CME September, 2010

10
Industry Challenges
Difficult to obtain company financing to implement EE projects. Too much effort to access assistance, funding and incentives. Lack of human resources to focus on energy management. Production is the dominant focus. Do not know where to find reputable energy service providers. Do not know how to identify and assess EE opportunities. Have limited knowledge of EE opportunities/products. Advanced EE products are not easily available.

11
7 Steps to Good Energy Management
1. Get Involved 2. Assemble an Energy Team3. Train Staff4. Assess Energy Use5. Eliminate Waste - Maximize Efficiency6. Capital Projects7. Report and celebrate
Where To Start?
12
An industry/government partnership to promote energy efficiency
cut operating costs improve productivity reduce GHG emissions and air
pollution
Canadian Industry Program for Energy Conservation
CIPEC1.

13
Executive Board
CIPEC Leader Companies
Sector Task Forces & Sector Associations
Task Force Council
Natural Resources Canada supports CIPEC at all levels
CIPEC Structure

14
CIPEC Portfolio
Tools• CanMost• Boiler Efficiency Calculator• Energy Savings Toolbox• RETScreen International
Training• D2$ Energy management workshops• Qualified specialists• Customized for companies and
associations
Incentives• ecoEnergy Retrofit• Industrial assessments• Pilot projects• Solar energy for heating• Tax incentives (Class 29, 43.1, 43.2)
Information•Industrial Sector Task Forces•Technical guide books•Employee Awareness•CIPEC.gc.ca web site•Heads Up CIPEC newsletter
15
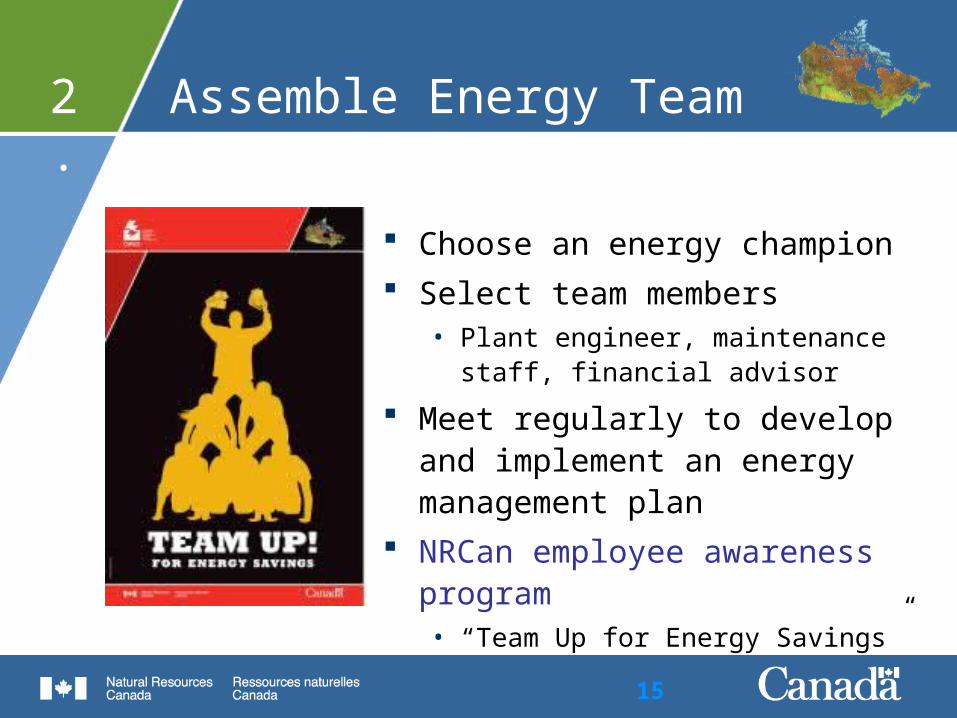
Choose an energy champion Select team members
• Plant engineer, maintenance staff, financial advisor
Meet regularly to develop and implement an energy management plan
NRCan employee awareness program• “Team Up for Energy Savings”
Assemble Energy Team2.

16
Dollars to $ense Workshops
Spot the Energy Savings Opportunities Energy Monitoring and Tracking Energy Master Plan Energy Efficiency Financing
Energy Efficiency Training
NRCan covers 50% of the cost of a customized workshops tailored to companies and sectors
Training to Build Capacity
+
3.
17
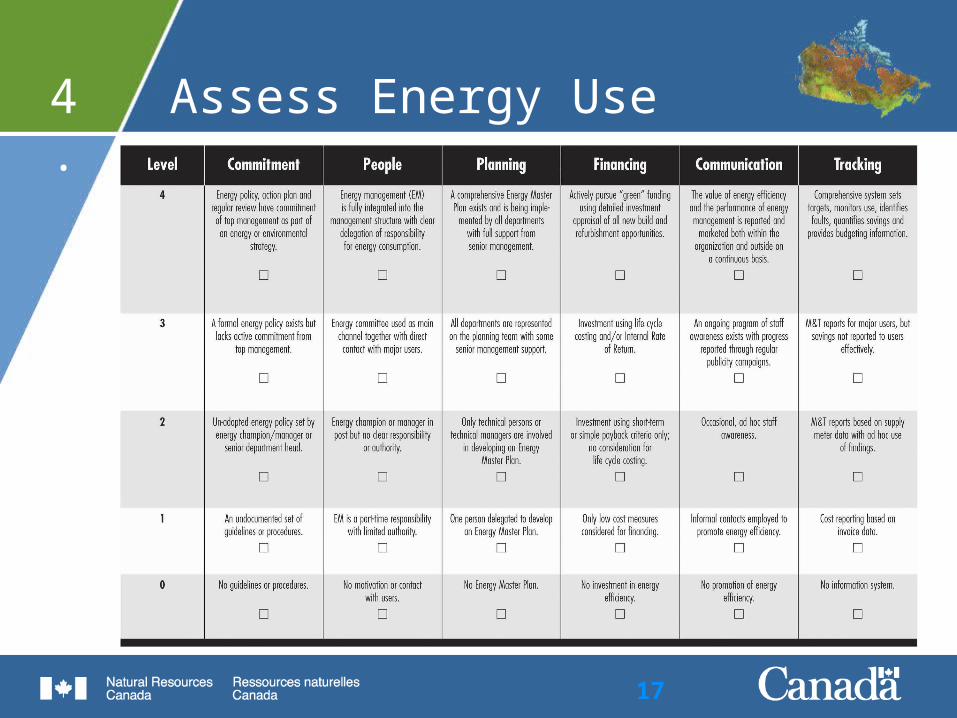
Assess Energy Use4.
18 18
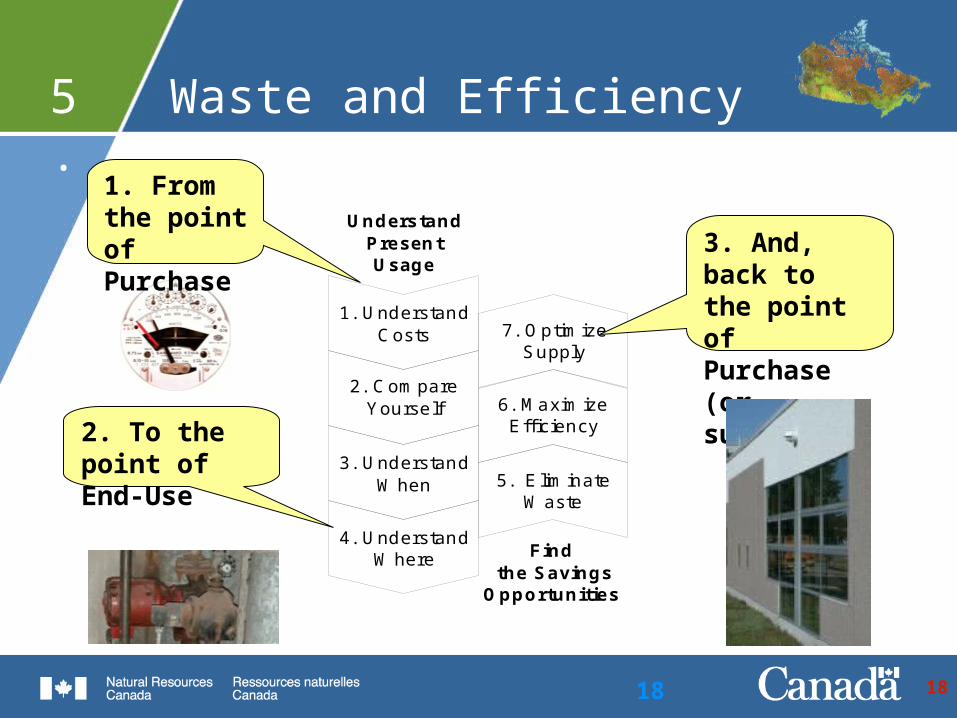
Waste and Efficiency
3. UnderstandWhen
4. UnderstandWhere
6. MaximizeEfficiency
5. EliminateWaste
7. OptimizeSupply
Find the Savings
Opportunities
2. CompareYourself
1. UnderstandCosts
UnderstandPresentUsage
1. From the point of Purchase
2. To the point of End-Use
3. And, back to the point of Purchase (or supply)
5.
19 19
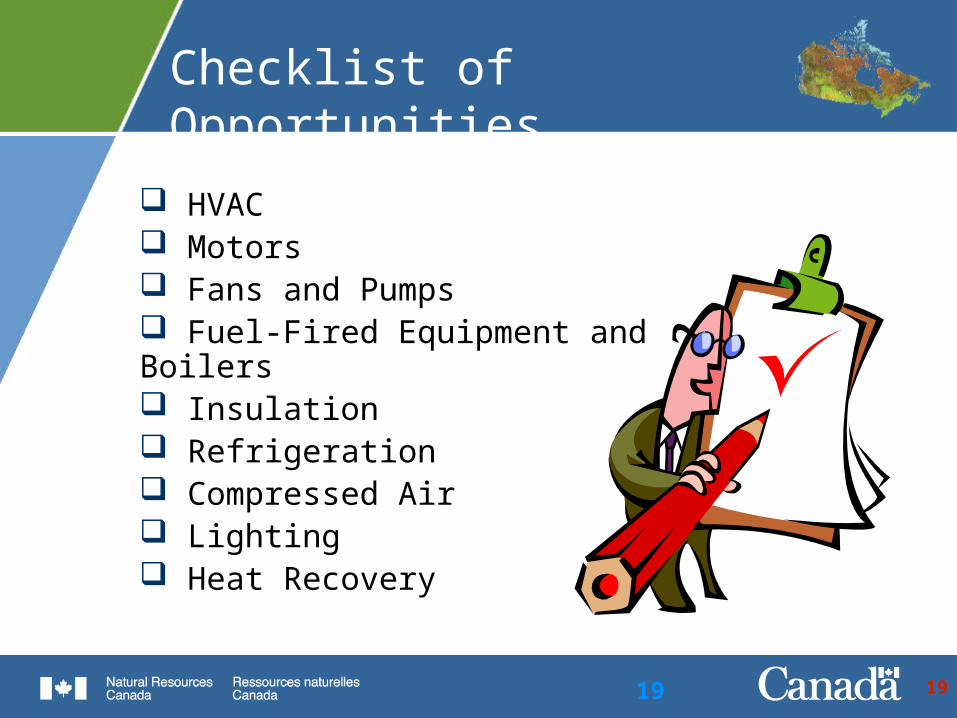
Checklist of Opportunities
HVAC Motors Fans and Pumps Fuel-Fired Equipment and Boilers Insulation Refrigeration Compressed Air Lighting Heat Recovery

20 20
Operating cost after energy
efficiency project
Energy & non-energy savings
0
500,000
1,000,000
1,500,000
2,000,000
2,500,000
1 2 3 4 5 6 7 8 9 10
Years
Annu
al O
pera
ting
Cost
Avoided Cost from EE project
Capital Projects
“Do nothing” operating cost
6.
21
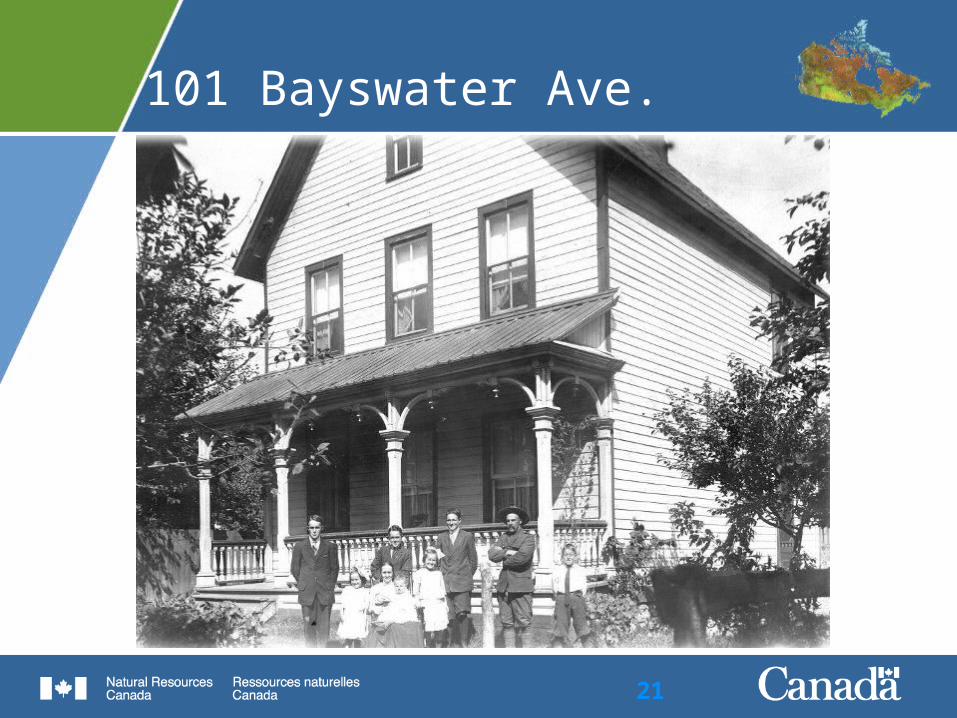
101 Bayswater Ave.

22
Windows vs Furnace
ROI
New Furnace: $1,600 ÷ $4,500 = 37% ROI
Windows: $500 ÷ $15,000 = 3.3% ROI
Simple Payback
New Furnace: 2 years 10 months
Windows: 30 years
Which is the better economic decision?

23
Report and celebrate
Pulp and paper company 85 employees $600,000 annual energy bill $200,000 lighting retrofit project $95,000 in direct incentives
• $37,000 ecoENERGY Retrofit Incentive• $58,000 from utility
7.
Savings: - $100,000 per year - ROI < 13 months

24
ecoENERGY incentive
Auto Parts Manufacturer 70 employees $1 million+ annual energy bill $100,000 air compressor retrofit $30,000 in direct incentives
• $20,000 ecoENERGY Retrofit Incentive
• $10,000 utility
Savings: - $50,000 per year - ROI < 18 months
25
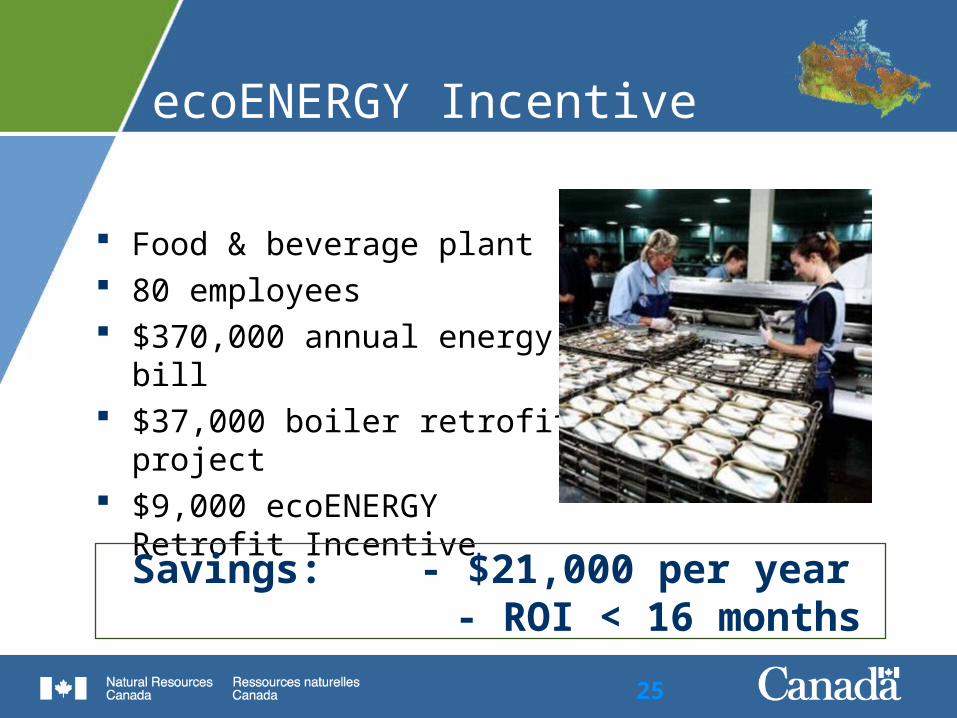
ecoENERGY Incentive
Food & beverage plant 80 employees $370,000 annual energy bill $37,000 boiler retrofit project $9,000 ecoENERGY Retrofit
Incentive
Savings: - $21,000 per year - ROI < 16 months

26
WhoWhat Creates Savings?
Source: Good Practice Guide 84 Managing and Motivating Staff to Save Energy
"...those of us who call ourselves energy analysts have made a mistake...we have analyzed energy. We should have analyzed human behavior." (Cherfas quoting Schipper in Science, 1991)

27
Where to Start
Become a CIPEC Leader! Go to:
CIPEC.gc.caFor more information:
Richard JaneckyOffice of Energy EfficiencyNatural Resources CanadaTel: 613.992.3286Cel.: 613.808-4002E-mail: [email protected]