Embed Size (px)
Citation preview
ScienceEducation
LEARNING
Improving Middle School ScienceLearning Using DiagrammaticReasoning
JENNIFER G. CROMLEY,1 STEVEN M. WEISBERG,2 TING DAI,1
NORA S. NEWCOMBE,3 CHRISTIAN D. SCHUNN,4 CHRISTINE MASSEY,2
F. JOSEPH MERLINO5
1University of Illinois at Urbana–Champaign, Educational Psychology, Champaign,IL 61820, USA; 2University of Pennsylvania, Psychology, Philadelphia, PA 19104, USA;3Temple University, Psychology, Philadelphia, PA 19122, USA; 4University of Pittsburgh,Psychology, Pittsburgh, PA 15260, USA; and 5The 21st Century Partnership for STEMEducation, Conshohocken, PA 19428, USA
Received 8 June 2015; revised 2 May 2016; accepted 4 May 2016DOI 10.1002/sce.21241Published online 0 xxxx 2016 in Wiley Online Library (wileyonlinelibrary.com).
ABSTRACT: We explored whether existing curricula can be adapted to increase students’skills at comprehending and learning from diagrams using an intervention delivered byregular middle-school teachers in intact classrooms. Ninety-two teachers in three statesimplemented our modified materials over six curricular units from two publishers: Holt(a reading-focused curriculum) and Full Option Science System (FOSS) (an inquiry-focusedcurriculum). Results were compared between two interventions—one based on selectedprinciples of cognitive science (cognitive-science-based) that included instruction in dia-gram comprehension and one providing professional development in science content only(content-only)—and a business-as-usual control. We analyze posttest items involving differ-ent degrees of reliance on diagrams to show how instruction in diagram comprehension canimprove comprehension of diagrams during reasoning. At the classroom level, there weresignificant advantages of the cognitive-science-based intervention over both content-onlyand business-as-usual with large effect sizes in all FOSS units (d = 0.41–0.52), but only oneHolt unit (d = 0.11). Analyses by type of diagram suggested these effects were largest fortransfer to diagrams from an uninstructed domain. Further analyses of high-stakes state test
Correspondence to: Jennifer G. Cromley; e-mail: [email protected]
C© 2016 Wiley Periodicals, Inc.
2 CROMLEY ET AL.
scores available for the participants implementing the Holt units showed improved use ofdiagrams (d = 0.45–0.66). Results suggest that making sense of visualizations (diagrams)is not effortless and self-evident, but that students who receive supports for comprehendingcan improve their comprehension, and the learning can transfer to new domains. C© 2016Wiley Periodicals, Inc. Sci Ed 1–30, 2016
INTRODUCTION
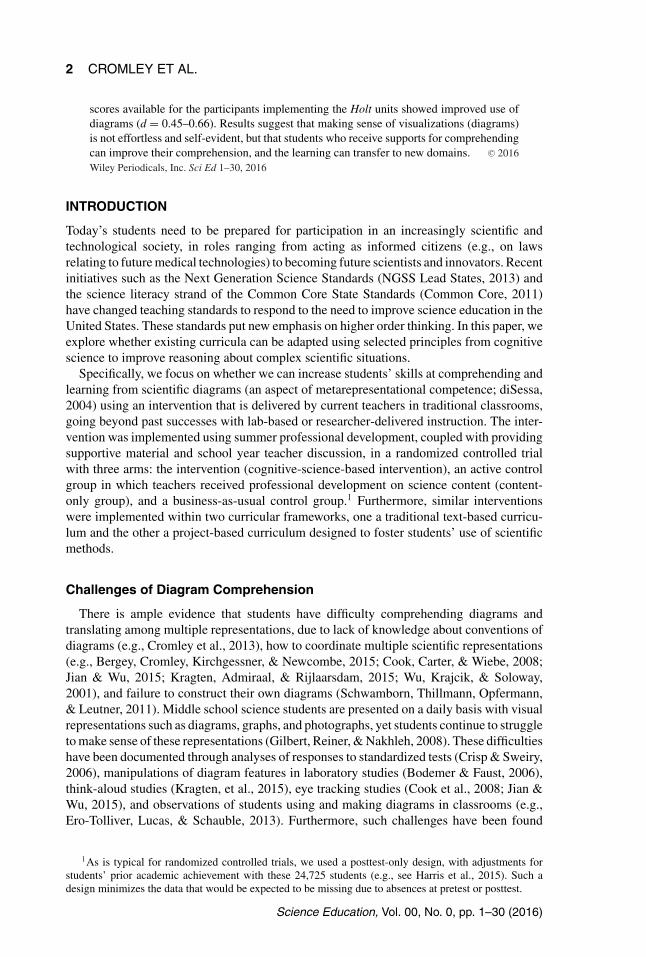
Today’s students need to be prepared for participation in an increasingly scientific andtechnological society, in roles ranging from acting as informed citizens (e.g., on lawsrelating to future medical technologies) to becoming future scientists and innovators. Recentinitiatives such as the Next Generation Science Standards (NGSS Lead States, 2013) andthe science literacy strand of the Common Core State Standards (Common Core, 2011)have changed teaching standards to respond to the need to improve science education in theUnited States. These standards put new emphasis on higher order thinking. In this paper, weexplore whether existing curricula can be adapted using selected principles from cognitivescience to improve reasoning about complex scientific situations.
Specifically, we focus on whether we can increase students’ skills at comprehending andlearning from scientific diagrams (an aspect of metarepresentational competence; diSessa,2004) using an intervention that is delivered by current teachers in traditional classrooms,going beyond past successes with lab-based or researcher-delivered instruction. The inter-vention was implemented using summer professional development, coupled with providingsupportive material and school year teacher discussion, in a randomized controlled trialwith three arms: the intervention (cognitive-science-based intervention), an active controlgroup in which teachers received professional development on science content (content-only group), and a business-as-usual control group.1 Furthermore, similar interventionswere implemented within two curricular frameworks, one a traditional text-based curricu-lum and the other a project-based curriculum designed to foster students’ use of scientificmethods.
Challenges of Diagram Comprehension
There is ample evidence that students have difficulty comprehending diagrams andtranslating among multiple representations, due to lack of knowledge about conventions ofdiagrams (e.g., Cromley et al., 2013), how to coordinate multiple scientific representations(e.g., Bergey, Cromley, Kirchgessner, & Newcombe, 2015; Cook, Carter, & Wiebe, 2008;Jian & Wu, 2015; Kragten, Admiraal, & Rijlaarsdam, 2015; Wu, Krajcik, & Soloway,2001), and failure to construct their own diagrams (Schwamborn, Thillmann, Opfermann,& Leutner, 2011). Middle school science students are presented on a daily basis with visualrepresentations such as diagrams, graphs, and photographs, yet students continue to struggleto make sense of these representations (Gilbert, Reiner, & Nakhleh, 2008). These difficultieshave been documented through analyses of responses to standardized tests (Crisp & Sweiry,2006), manipulations of diagram features in laboratory studies (Bodemer & Faust, 2006),think-aloud studies (Kragten, et al., 2015), eye tracking studies (Cook et al., 2008; Jian &Wu, 2015), and observations of students using and making diagrams in classrooms (e.g.,Ero-Tolliver, Lucas, & Schauble, 2013). Furthermore, such challenges have been found
1As is typical for randomized controlled trials, we used a posttest-only design, with adjustments forstudents’ prior academic achievement with these 24,725 students (e.g., see Harris et al., 2015). Such adesign minimizes the data that would be expected to be missing due to absences at pretest or posttest.
Science Education, Vol. 00, No. 0, pp. 1–30 (2016)
IMPROVING MIDDLE SCHOOL SCIENCE LEARNING 3
specifically with biology diagrams at age ranges from elementary school (e.g., McTigue &Croix, 2010) to adult biologists and biology educators (Kindfield,1993/1994).
Conventions of diagrams are basic representational tools—such as arrows, color keys,and captions—developed since the Enlightenment to convey information about componentsand relations among components in visual representations. Some conventions (e.g., labels)simply name parts, whereas others may explain relations among parts (e.g., captions).Cutaways show interior parts in a two- or three-dimensional format, and color keys can beused to show boundaries of parts with specific functions (e.g., areas of the heart that carryoxygenated vs. deoxygenated blood) or to mark parts that are the same (e.g., a nucleotidebase). Arrows can have several different functions, such as showing the flow or path ofa substance or of energy; showing sequences over time (e.g., evolution of forelimbs);showing physical causes and effects; or showing increases or decreases (e.g., of pressure,temperature).
As such, conventions are central to multiple cognitive (e.g., Hegarty, 2005; Larkin& Simon, 1987; Mayer, 2005) and semiotic (e.g., Roth & McGinn, 1998) theories ofdiagram comprehension. All of these theories assume that to form an internal mentalrepresentation of what is depicted in a diagram, the reader must know what arrows inthe diagram might mean, what symbols such as + or � stand for, and the usefulnessof reading labels of parts. Students weak in science perform especially poorly on testitems that include diagrams, suggesting that these students lack basic understanding ofthese representations. Therefore, intervention at the most basic level should yield largereffects for low-skilled learners, compared to intervention at higher levels such as fos-tering inferences while reading diagrams (Butcher, 2006). Specifically, we reasoned thatlow-skilled learners in large city school systems, which tend to include more students un-derrepresented in the sciences (i.e., African American and Latino/Latina students), mightespecially benefit from such interventions. Given the lack of racial and ethnic diversityof the current science and engineering workforce, it is especially important to investigateinterventions that support, or at least do not disadvantage, students underrepresented in thesciences.
The Design of a Cognitive-Science-Based Intervention
We systematically revised three units from each of two widely used science curricula inour cognitive-science-based intervention in a variety of ways (see http://www.cogscied.orgfor a complete description). We drew on four specific and relatively untested principles ofcognitive science for which there was ample evidence from laboratory studies to suggestthat they might be helpful to students in classrooms: (1) instruction in comprehending visu-alizations, (2) contrasting cases, (3) targeting misconceptions, and (4) spaced testing. Thestudent visualization exercises (described below) and contrasting cases were implementedvia brief 5–10 minute segments delivered by teachers each day in the context of their regularscope and sequence of instruction. Work addressing misconceptions was embedded withinboth of those types of exercises and teacher explanations. Spaced testing was implementedwith daily warm-ups and weekly “pop quizzes” on material presented 2 days to 2 weekspreviously. Each of these components represented a testable intervention, which could becombined with classroom topics taught in the regular scope and sequence and implementedby teachers in situ supported by ongoing professional development, and whose effectscould be tested with end-of-intervention measures. In addition, the components are notcompletely unrelated to prior research in science education (e.g., specific physics miscon-ceptions identified by Hunt & Minstrell, 1994; curricular coherence, Squires, 2009), but
Science Education, Vol. 00, No. 0, pp. 1–30 (2016)
4 CROMLEY ET AL.
were designed based on specific, recent guidelines from cognitive science research such asoptimal spacing for spaced testing.
For the purposes of this paper, we focus on the visualization exercises component of theintervention and visualization-specific posttest measures.2 Our curricular revisions wereaimed at teaching students how to interpret and use figures, graphs, and tables. Classroom-based interventions in diagram comprehension have rarely been tested experimentally,except for those using technology (Bergey et al., 2015; Cromley et al., 2013; Scheiter,Schubert, Gerjets, & Stalbovs, 2015; Schlag & Ploetzner, 2011; Schwamborn et al., 2011).Hence, we designed the diagram instruction within our cognitive-science-based interventionto convey the most basic information about diagrams, such as the meanings of numberingsystems and color keys, and the importance of reading captions. This diagram instructiondelivered in the cognitive-science-based condition was embedded within the same middleschool science curricula as the other modifications, which focused on improving under-standing and retention of core science content. The diagram instruction drew on the researchbase on instruction in comprehension of visuals, both in classes (e.g., Schlag & Ploetzner,2011) and using technology (e.g., Schwamborn et al., 2011).
We specifically designed end-of-unit test items to investigate transfer to uninstructeddiagrams, because there is relatively little research on whether visual representation com-prehension skills can transfer to new stimuli from the same domain or between domains.Specifically, we see the need for students to learn how to approach all different types ofdiagrams across multiple domains, not just be able to answer questions about the specificdiagrams they learned from. This is most consistent with De Corte’s view of transfer as“the broad, productive, and supported use of acquired knowledge, skills, and motivations,as opposed to the direct and sequestered application of skills from one situation to another”(2003, p. 143). Expanding on this definition, our measures tapped what Schonborn andBogeholz (2009) term “horizontal transfer” (within the same level of biological organiza-tion, across organisms) and “vertical transfer” (general principles, applied across differentlevels of biological organization).
Positive results for horizontal transfer of diagram instruction on researcher-developedtests are found in some lab-based research (Hegarty & Just, 1993; Hegarty & Sims, 1994;Hegarty, Kriz, & Cate, 2003; Kozhevnikov, Motes, & Hegarty, 2007; Ozcelik, Karakus,Kursun, & Cagiltay, 2009), whereas some studies find no transfer (Scheiter, Gerjets, &Catrambone, 2006; Schwamborn et al., 2011). In addition to testing both “horizontal”(same-domain) and “vertical (different domain) transfer in the present research, we alsoanalyzed whether positive effects of the intervention could be observed on the items in-volving diagrams within tests that we did not develop–standardized science tests developedby and required for eighth-grade students in those states; these state tests also took placemuch later than the modified units.
Differential Effects on Students Underrepresented in Science
From a policy standpoint, it is critical that innovative interventions do not further disad-vantage students from groups historically underrepresented in science (Under-RepresentedMinorities, hereafter URMs, i.e., African American and Latino/Latina students). Under-represented minorities are more likely to attend underachieving schools in low-Socio-Economic Status (SES) neighborhoods; even after accounting for differences in personalcharacteristics, African American students show lower achievement when they are in high-minority schools (Bohrnstedt, Kitmitto, Ogut, Sherman, & Chan, 2015). Thus, we analyzed
2No results from other components of the larger study have been published.
Science Education, Vol. 00, No. 0, pp. 1–30 (2016)
IMPROVING MIDDLE SCHOOL SCIENCE LEARNING 5
our data using the 90% cutoff which Orfield (2009) defined as “highly segregated.” It isunclear why the high-minority context is harmful, but a number of district-level (e.g., percapita funding from the neighborhood tax base), school-level (e.g., level of teacher expe-rience), and classroom-level (e.g., teacher expectations, percent of fellow students whoseparents have low levels of education) factors have been identified. Based on both policydemands—interventions should not disadvantage URMs—and known higher achievementchallenges in high-URM schools, we investigated school-level percent URM as a moderatorof the effects of our intervention.
Hypotheses
In Study 1, we report results for researcher-developed diagrammatic posttest items acrossboth curricular modifications, examining whether benefits are found for items with differen-tial dependency on diagram content as well as across different learners (URM) and learnercontexts (class URM%). Our specific hypotheses for Study 1 are as follows:
1. Students in the cognitive-science-based intervention will outscore those in eitherthe content-only or business-as-usual control groups on directly instructed diagrams.This represents a form of “horizontal” transfer in the Schonborn and Bogeholz (2009)framework.
2. Students in the cognitive-science-based intervention will outscore those in either thecontent-only or business-as-usual control groups on familiar-content, uninstructeddiagrams. This also represents a form of “horizontal” transfer.
3. Students in the cognitive-science-based intervention will outscore those in either thecontent-only or business-as-usual control groups on unfamiliar-content, uninstructeddiagrams. This represents a form of “vertical” transfer.
4. The proportion of URMs in a school may be associated with lower effectivenessof the intervention, even after controlling for student prior achievement, because ofknown challenges to achievement in high-minority schools.
In Study 2, we investigate whether these findings obtained with researcher-developeddiagram questions are also found on measures less susceptible to confirmation bias–standardized state science tests.
STUDY 1
Method
Participants.
Holt Curriculum Participants. The participants included for data analysis were drawnfrom 88 schools in a large urban school district in the Eastern United States who partici-pated in 2009–2011. There were 9,611 seventh- and eighth- grade students (M = 12.7 years,SD = 0.5) and 129 teachers. Forty of those teachers taught in 30 schools that were classi-fied as academically low-performing schools. Students and teachers participated as part oftheir regular science classes across two consecutive cohorts (in the 2009–2010 and 2010–2011 school years) . Teachers were experienced in teaching science at the sixth- througheighth-grade level (M = 7.1 years, SD = 5.9). Most schools (66 of 94) had only one partic-ipating teacher (M = 1.40, SD = 0.72), and each teacher taught a mean of 2.5 sections ofbiological science (SD = 1.25). After centering previous state achievement scores on thetest mean, average scores (combined math and reading) across classrooms ranged from
Science Education, Vol. 00, No. 0, pp. 1–30 (2016)
6 CROMLEY ET AL.
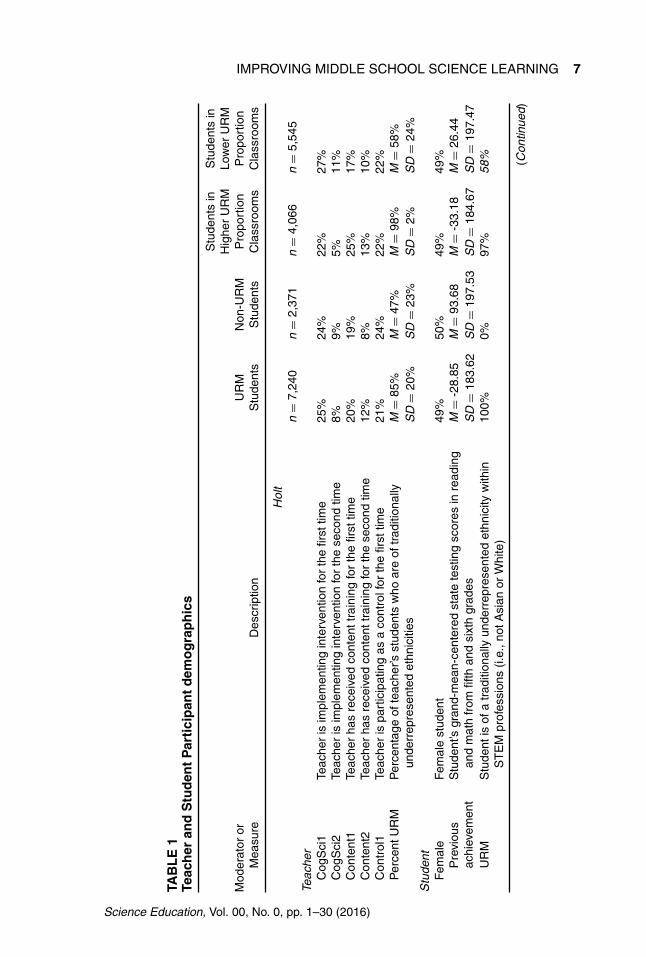
–291.01 to +272.43 (M = 0.88, SD = 95.04). Table 1 presents centered previous achieve-ment scores, and demographic information about the teachers and students organizedby subset (i.e., 7,240 URM students, 2,371 non-URM, 4,066 students in higher-URM-proportion classrooms,3 and 5,545 students in lower-URM-proportion classrooms).
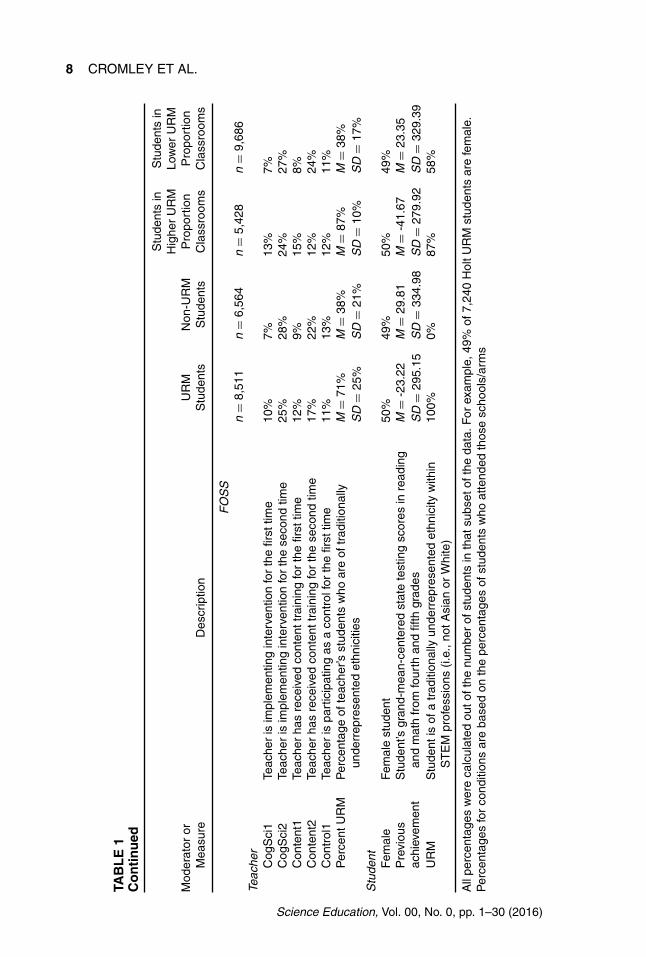
Full Option Science System (FOSS) Curriculum Participants. Participants were drawnfrom 96 schools in a large urban school district in the Eastern United States and a largeurban/suburban district in the Southwestern United States who participated in 2009–2011.There were 15,114 sixth- and seventh-grade students (M = 11.7 years, SD = 0.5) and165 teachers. Students and teachers participated as part of their regular science classesacross two consecutive cohorts (2009–2010 and 2010–2011). The preponderance of schools(46 of 96) had only one participating teacher (M = 1.80, SD = 1.00). Table 1 shows studentsorganized by subset (i.e., 8,511 URM students, 6,564 non-URM, 5,428 students in higher-URM-proportion classrooms, and 9,686 students in lower-URM-proportion classrooms).
Design.
Holt Curriculum. We used a randomized controlled trial design, with 97 schools initiallyrandomly assigned to one of the three arms/conditions (see Table 2). There were 32 schoolsin the cognitive-science-based condition, 34 in the content-only condition, and 31 in thecontrol condition. Within each school, all seventh-grade science teachers were assigned tothe same condition for two consecutive years, provided that they remained employed asscience teachers at that same school. This school-level random assignment was designed tominimize contamination across conditions. If teachers transferred to a school that had beenassigned to a different condition, we terminated their participation in the study to reducethe risk of cross-contamination.
After the first year of the study, 91% (88) of the schools remained; after the secondyear, 80% (78) of the original schools remained. Schools in the cognitive-science-basedcondition were slightly more likely to be retained in Year 2 (84%; 27 schools) than wereschools in the content condition (77%; 26 schools). Students in the control condition weremore likely to have missing end-of-unit test scores in the first year (25% of students) thanstudents in the content (14%) and cognitive-science-based (18%) conditions. In the secondyear, there was more student attrition from the content-only condition (18%) than from thecontrol (15%) and cognitive-science-based (15%) conditions. Because schools had beenrandomly assigned to conditions well before students were enrolled in classes, all studentscan be considered joiners to the three conditions. The attrition rates and differences inattrition rates were within typical levels for Randomized Controlled Trials in education(Valentine, 2009).
FOSS Curriculum. Ninety-six schools were initially randomly assigned to one of thethree arms/conditions (see Table 2). There were 34 schools in the cognitive-science-basedcondition, 30 in the content-only condition, and 32 in the control condition. Assignmentwas done as with the Holt schools. After the first year of the study, 93% (91) of the schoolsremained. Schools in the cognitive-science-based condition were about equally likely to beretained in Year 2 (91%; 31 schools) as were schools in the content-only condition (97%;29 schools). As above, all students can be considered joiners to the three conditions.
Standard Curriculum. The standard curricula for the school districts were Holt orFOSS. Holt Science and Technology (Holt, Rinehart, & Winston, 2007) is widely used in
3Using Orfield’s (2009) definition of highly segregated school settings as those with 90% or moreURMs.
Science Education, Vol. 00, No. 0, pp. 1–30 (2016)
IMPROVING MIDDLE SCHOOL SCIENCE LEARNING 7
TAB
LE
1Te
ach
eran
dS
tud
ent
Par
tici
pan
td
emo
gra
ph
ics
Mod
erat
oror
Mea
sure
Des
crip
tion
UR
MS
tude
nts
Non
-UR
MS
tude
nts
Stu
dent
sin
Hig
her
UR
MP
ropo
rtio
nC
lass
room
s
Stu
dent
sin
Low
erU
RM
Pro
port
ion
Cla
ssro
oms
Hol
tn
=7,
240
n=
2,37
1n
=4,
066
n=
5,54
5Te
ache
rC
ogS
ci1
Teac
her
isim
plem
entin
gin
terv
entio
nfo
rth
efir
sttim
e25
%24
%22
%27
%C
ogS
ci2
Teac
her
isim
plem
entin
gin
terv
entio
nfo
rth
ese
cond
time
8%9%
5%11
%C
onte
nt1
Teac
her
has
rece
ived
cont
entt
rain
ing
for
the
first
time
20%
19%
25%
17%
Con
tent
2Te
ache
rha
sre
ceiv
edco
nten
ttra
inin
gfo
rth
ese
cond
time
12%
8%13
%10
%C
ontr
ol1
Teac
her
ispa
rtic
ipat
ing
asa
cont
rolf
orth
efir
sttim
e21
%24
%22
%22
%P
erce
ntU
RM
Per
cent
age
ofte
ache
r’sst
uden
tsw
hoar
eof
trad
ition
ally
unde
rrep
rese
nted
ethn
iciti
esM
=85
%M
=47
%M
=98
%M
=58
%S
D=
20%
SD
=23
%S
D=
2%S
D=
24%
Stu
dent
Fem
ale
Fem
ale
stud
ent
49%
50%
49%
49%
Pre
viou
sac
hiev
emen
tS
tude
nt’s
gran
d-m
ean-
cent
ered
stat
ete
stin
gsc
ores
inre
adin
gan
dm
ath
from
fifth
and
sixt
hgr
ades
M=
-28.
85M
=93
.68
M=
-33.
18M
=26
.44
SD
=18
3.62
SD
=19
7.53
SD
=18
4.67
SD
=19
7.47
UR
MS
tude
ntis
ofa
trad
ition
ally
unde
rrep
rese
nted
ethn
icity
with
inS
TE
Mpr
ofes
sion
s(i.
e.,n
otA
sian
orW
hite
)10
0%0%
97%
58% (C
ontin
ued)
Science Education, Vol. 00, No. 0, pp. 1–30 (2016)
8 CROMLEY ET AL.
TAB
LE
1C
on
tin
ued
Mod
erat
oror
Mea
sure
Des
crip
tion
UR
MS
tude
nts
Non
-UR
MS
tude
nts
Stu
dent
sin
Hig
her
UR
MP
ropo
rtio
nC
lass
room
s
Stu
dent
sin
Low
erU
RM
Pro
port
ion
Cla
ssro
oms
FO
SS
n=
8,51
1n
=6,
564
n=
5,42
8n
=9,
686
Teac
her
Cog
Sci
1Te
ache
ris
impl
emen
ting
inte
rven
tion
for
the
first
time
10%
7%13
%7%
Cog
Sci
2Te
ache
ris
impl
emen
ting
inte
rven
tion
for
the
seco
ndtim
e25
%28
%24
%27
%C
onte
nt1
Teac
her
has
rece
ived
cont
entt
rain
ing
for
the
first
time
12%
9%15
%8%
Con
tent
2Te
ache
rha
sre
ceiv
edco
nten
ttra
inin
gfo
rth
ese
cond
time
17%
22%
12%
24%
Con
trol
1Te
ache
ris
part
icip
atin
gas
aco
ntro
lfor
the
first
time
11%
13%
12%
11%
Per
cent
UR
MP
erce
ntag
eof
teac
her’s
stud
ents
who
are
oftr
aditi
onal
lyun
derr
epre
sent
edet
hnic
ities
M=
71%
M=
38%
M=
87%
M=
38%
SD
=25
%S
D=
21%
SD
=10
%S
D=
17%
Stu
dent
Fem
ale
Fem
ale
stud
ent
50%
49%
50%
49%
Pre
viou
sac
hiev
emen
tS
tude
nt’s
gran
d-m
ean-
cent
ered
stat
ete
stin
gsc
ores
inre
adin
gan
dm
ath
from
four
than
dfif
thgr
ades
M=
-23.
22M
=29
.81
M=
-41.
67M
=23
.35
SD
=29
5.15
SD
=33
4.98
SD
=27
9.92
SD
=32
9.39
UR
MS
tude
ntis
ofa
trad
ition
ally
unde
rrep
rese
nted
ethn
icity
with
inS
TE
Mpr
ofes
sion
s(i.
e.,n
otA
sian
orW
hite
)10
0%0%
87%
58%
All
perc
enta
ges
wer
eca
lcul
ated
outo
fthe
num
ber
ofst
uden
tsin
that
subs
etof
the
data
.For
exam
ple,
49%
of7,
240
Hol
tUR
Mst
uden
tsar
efe
mal
e.P
erce
ntag
esfo
rco
nditi
ons
are
base
don
the
perc
enta
ges
ofst
uden
tsw
hoat
tend
edth
ose
scho
ols/
arm
s
Science Education, Vol. 00, No. 0, pp. 1–30 (2016)
IMPROVING MIDDLE SCHOOL SCIENCE LEARNING 9
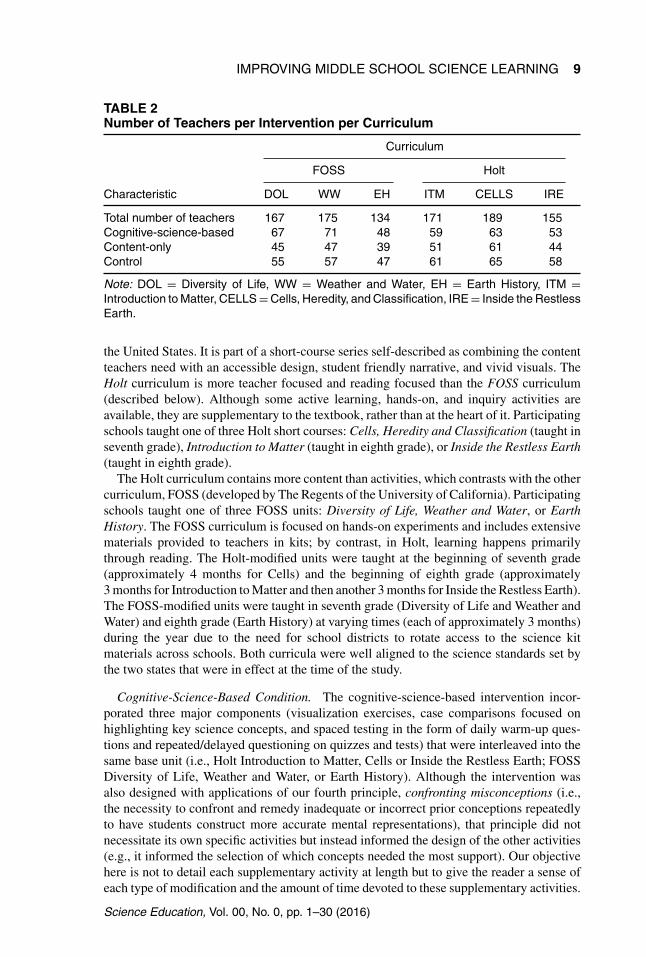
TABLE 2Number of Teachers per Intervention per Curriculum
Curriculum
FOSS Holt
Characteristic DOL WW EH ITM CELLS IRE
Total number of teachers 167 175 134 171 189 155Cognitive-science-based 67 71 48 59 63 53Content-only 45 47 39 51 61 44Control 55 57 47 61 65 58
Note: DOL = Diversity of Life, WW = Weather and Water, EH = Earth History, ITM =Introduction to Matter, CELLS = Cells, Heredity, and Classification, IRE = Inside the RestlessEarth.
the United States. It is part of a short-course series self-described as combining the contentteachers need with an accessible design, student friendly narrative, and vivid visuals. TheHolt curriculum is more teacher focused and reading focused than the FOSS curriculum(described below). Although some active learning, hands-on, and inquiry activities areavailable, they are supplementary to the textbook, rather than at the heart of it. Participatingschools taught one of three Holt short courses: Cells, Heredity and Classification (taught inseventh grade), Introduction to Matter (taught in eighth grade), or Inside the Restless Earth(taught in eighth grade).
The Holt curriculum contains more content than activities, which contrasts with the othercurriculum, FOSS (developed by The Regents of the University of California). Participatingschools taught one of three FOSS units: Diversity of Life, Weather and Water, or EarthHistory. The FOSS curriculum is focused on hands-on experiments and includes extensivematerials provided to teachers in kits; by contrast, in Holt, learning happens primarilythrough reading. The Holt-modified units were taught at the beginning of seventh grade(approximately 4 months for Cells) and the beginning of eighth grade (approximately3 months for Introduction to Matter and then another 3 months for Inside the Restless Earth).The FOSS-modified units were taught in seventh grade (Diversity of Life and Weather andWater) and eighth grade (Earth History) at varying times (each of approximately 3 months)during the year due to the need for school districts to rotate access to the science kitmaterials across schools. Both curricula were well aligned to the science standards set bythe two states that were in effect at the time of the study.
Cognitive-Science-Based Condition. The cognitive-science-based intervention incor-porated three major components (visualization exercises, case comparisons focused onhighlighting key science concepts, and spaced testing in the form of daily warm-up ques-tions and repeated/delayed questioning on quizzes and tests) that were interleaved into thesame base unit (i.e., Holt Introduction to Matter, Cells or Inside the Restless Earth; FOSSDiversity of Life, Weather and Water, or Earth History). Although the intervention wasalso designed with applications of our fourth principle, confronting misconceptions (i.e.,the necessity to confront and remedy inadequate or incorrect prior conceptions repeatedlyto have students construct more accurate mental representations), that principle did notnecessitate its own specific activities but instead informed the design of the other activities(e.g., it informed the selection of which concepts needed the most support). Our objectivehere is not to detail each supplementary activity at length but to give the reader a sense ofeach type of modification and the amount of time devoted to these supplementary activities.
Science Education, Vol. 00, No. 0, pp. 1–30 (2016)
10 CROMLEY ET AL.
The intervention was supplementary to the standard curriculum, not a replacement forit. Consistent with the literature (see Alfieri, Nokes-Malach, & Schunn, 2013 for a meta-analysis), case comparisons were designed as a more effective introduction to a new topic,whereas the visual demands of the chapters drove the visualization exercises, which weredispersed across days of the unit. All of the interventions were integrated into the entireunit, and its implementation took place during the same 3–4 month time span when the unitwas ordinarily delivered.
Each modified unit was content analyzed using the Surveys of Enacted Curriculumframework constructed by Porter and colleagues (Porter, 2002). The Surveys of EnactedCurriculum include ratings for five types of cognitive demand from instructional materials:memorization, performing, communicating, analyzing, and applying, and each topic in thecurriculum is categorized into one of these levels of demand, yielding percentages of eachtype of demand within each curriculum. Cognitive demand quantifies the requirements ofthe tasks that students are asked to undertake; proportions of performing and memorizationwere very similar across the units, except that Cells had a high proportion of memorization(63% of tasks required memorization), suggesting it was an easier unit. Earth History wasrated much higher than the other curricula on analysis (21% of tasks required analysis),suggesting it was the hardest unit, with Inside the Restless Earth highest on communication(31% of tasks required communication) and also high on analysis (15% of tasks requiredanalysis). We return to these differences in the Surveys of Enacted Curriculum demandratings in the discussion.
Teacher Professional Development. Before implementing a modified unit, cognitive-science-based teachers attended 3 paid days of summer professional development per unitthey were implementing. In the professional development, we explained the rationale forthe revised activities (the cognitive principles involved) and how to implement those activ-ities. Each teacher received a binder (CASEbook) that included a written introduction tothe unit-specific intervention: its scope, contents, and goals, along with a CD of preparedPowerPoint presentations and any specialized materials needed to complete activities inthe modified curriculum. The CASEbook also included the entire unit’s planned activi-ties (both standard and supplementary, including our chapter tests), and outlines of eachday’s activities (objectives, materials, schedule, etc.) which included explanations of whatstudents should do during each task, the intended conclusions, and suggestions for howteachers could use the daily PowerPoints. For each unit, teachers also attended four after-school, small group follow-up sessions (one per month of the unit) to discuss challengesand successes.
The study was planned to be implemented for two cohorts of students, each cohort partic-ipating in sixth- and seventh-grade FOSS units (2 years, cross-sectionally) and seventh- andeighth-grade units (also 2 years, cross-sectionally) for Holt. Therefore, when new teachersbegan science teaching in a cognitive science school in the second year of implementation,they received makeup professional development during the summer and the school yearsimilar to that provided in the first year. Teachers returning to the same condition for asecond-year were provided with a brief overview of minor improvements to the interven-tion based on teacher feedback, and with additional after-school follow-up sessions similarin format to those in the first year.
Student Materials. Although most of the modifications were teacher materials, studentmaterials for the intervention included case cards and worksheets. These provided necessaryinformation about cases or prompted explanations of cases (through questions about theirsimilarities, differences, etc.) when teachers presented the cases with PowerPoint slides.
Science Education, Vol. 00, No. 0, pp. 1–30 (2016)
IMPROVING MIDDLE SCHOOL SCIENCE LEARNING 11
Visualization exercises comprised slides that we asked teachers to display and/orinvolved directing student attention to images in their textbooks, whereas the teacher guideda discussion of the components of the image and their interpretations using suggestedprompts. Visualization exercises were most often designed to be carried out as teacher-led, class discussions. The materials rarely asked for students to complete worksheets, butsometimes involved students taking notes in notebooks. As an example, the teacher wasasked to display the three images of organisms (a mushroom photograph at real-life scale,yeast photographed though a microscope, and penicillium mold photographed though amicroscope) and ask, “Which one of these is the largest? And, why do you think so?” ordisplay the diagram and ask, “What does this arrow represent? What are the illustratorstrying to tell us?” Then the teacher would provide explanations as necessary.
A warm-up question was designed to begin each day’s activities, specifically connectingto previously learned content that was randomly selected from material covered 2 days to2 weeks previously consistent with research on spaced testing (see Rawson & Dunlosky,2011). Teachers were either asked to have students write out answers and then led a classdiscussion, or were asked to proceed directly to a class discussion. Because very little spacedtesting research has used materials other than written text, we confined warm-ups to writtenmaterials. Warm-up questions were designed to serve three functions: (1) many warm-upsprompted students to explain previous content, thereby preventing misconceptions as theyrecalled and reaffirmed correct understandings of content. (2) Warm-ups served as a formof spaced testing. (3) Warm-up questions did just that—prepared students for the day’sactivities by reactivating previously covered content.
Spaced testing was also implemented via section quizzes given at the end of each chapterof the unit (five total). These included questions on the current chapter’s content togetherwith previous chapters’ content. The latter typically connected with the big ideas of theunit, but some content was chosen because it was a topic/phenomenon associated withmisconceptions.
Teacher self-report questionnaire data confirmed significant differences between condi-tions in diagram instruction, use of case comparisons, and use of spaced testing: across allunits and cohorts, cognitive-science-based teachers used these more than content-only orbusiness-as-usual control. This suggests that teachers did in fact implement the interventionsas we intended.
Students participated in the study in their regular science classes and completed all of theregular textbook-based activities and tests included in the regular curriculum (as confirmedby teacher surveys). Integration of the interventions into the classes and curriculum waslargely seamless; it is unlikely that students experienced the classes as participation in anexperimental curriculum.
Overall, the intervention had several elements, but only one aspect was likely to directlyinfluence ability to reason with diagrams and visualizations. The spaced testing may haveimproved retention of these newly acquired skills for test items that included visualizationsand diagrams. These we consider as part of the overall visualization intervention (i.e.,additional opportunities to practice visualization reasoning). Furthermore, by analyzingdifferent diagram item types (e.g., directly instructed, uninstructed familiar content), weare able to show that the advantages of the cognitive-science-based instruction are notsimply due to greater content knowledge.
Descriptions of the Conditions.
Content-Only Training (Hawthorne/Active Control) Condition. Teachers in the content-only training condition attended the same amount of professional development as the
Science Education, Vol. 00, No. 0, pp. 1–30 (2016)
12 CROMLEY ET AL.
cognitive science teachers (3 days in the summer and four follow-up, after-school sessionsfor each unit). However, these sessions focused on the curriculum’s underlying sciencecontent only, not on pedagogy or principles of learning. The training sessions were designedfor teachers as adult learners and were provided by content experts who are experiencedin implementing content-deepening training for teachers (e.g., university faculty, museumeducators). These teachers did not receive any modifications to the standard curriculum.With regard to visual representations, the professional development materials containedmany images (similar to a college-level course), but there was no explanation of howto understand the images or how to instruct students in understanding the images. Theprimary purpose of this condition in the current analyses was to rule out the possibility thatstudent learning improvements in the cognitive science condition were due to a Hawthorneeffect (i.e., improvements that stem from teacher perceptions of being actively involvedin an experimental or higher quality condition) or participation in a teacher professionallearning community that actively discussed the challenges of instruction with these units.Indeed, teachers in this condition self-reported that they enjoyed the training and that itwas relevant to their classroom practices (despite the trainers avoiding making referenceto teaching practices). However, the amount of content provided in this intervention isrelatively modest and thus is not and was not intended to be a strong test of the benefits ofteacher content knowledge on student learning.
When new teachers moved into a content-only arm school in the second year, theyreceived makeup summer professional development and workshops during the school year,similar to that provided in Year 1. Returning content-only teachers were provided additionalcontent training matched in duration to the follow-up training provided to the cognitivescience teachers.
Students of teachers in the content-only training condition attended their scheduledscience classes and completed only the activities included in the standard curriculum. Aftereach given unit, students completed the relevant researcher-developed end-of-unit test thatwas standard to all three arms/conditions of our study.
Business-as-Usual Control Condition. Teachers in the business-as-usual control con-dition received neither professional development nor the modified curriculum. Prior torandomization of schools into conditions, they also consented to possible participation;teachers entering the study in control schools in later years were made aware of their partic-ipation within the larger study. Students attended their scheduled classes, completed onlythe activities included in the standard curriculum, and then completed our end-of-unit test.
For one Holt curriculum—Inside the Restless Earth—science teachers reported to usin continuing professional development that they had been asked to focus on reading andwriting in their schools when Inside the Restless Earth was scheduled to be implemented.Hence, for Inside the Restless Earth we do not expect to see differences between conditions.
Materials and Procedure. Participants completed diagram comprehension items thatwere administered after a science content knowledge measure (see Porter, Polikoff,Barghaus, & Yang, 2013 for details of development) whose results are not analyzed here.
Diagram-Specific Items. Six sets of three diagram-specific items each were created foreach curriculum and added onto the science content knowledge measure to create six uniquetest forms. These six test forms were then randomly given to students in the study.
With the exception of the Cells curriculum, which contained three additional diagramitems but did not adhere to the following schema, each set of diagram items consisted ofthree item types. Two items from each set used diagrams taken directly from the curriculum,which were thus familiar to the students. Students of teachers in the cognitive-science-based
Science Education, Vol. 00, No. 0, pp. 1–30 (2016)
IMPROVING MIDDLE SCHOOL SCIENCE LEARNING 13
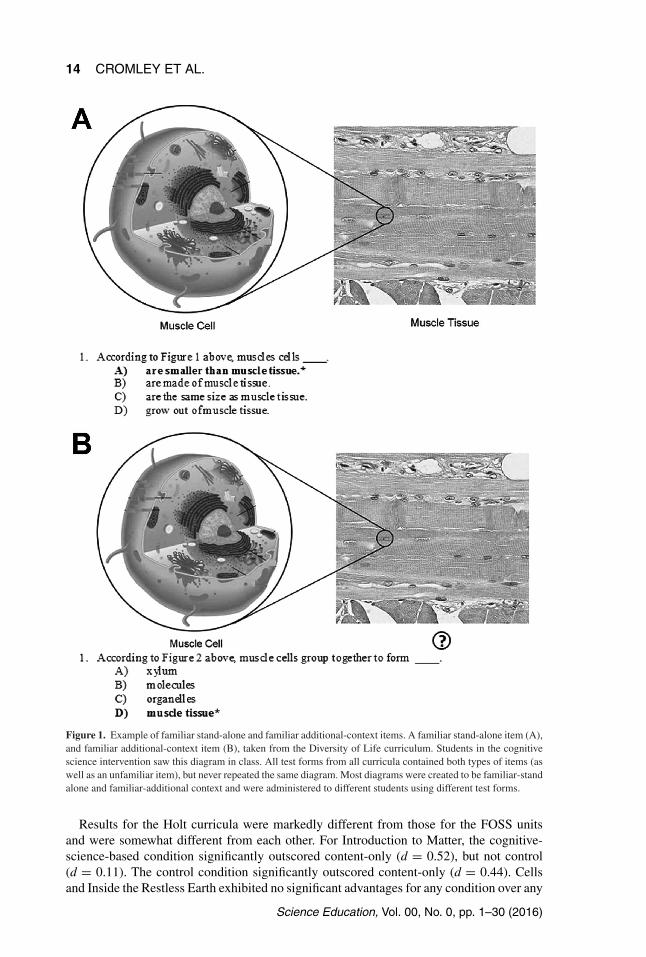
condition were explicitly taught these diagrams in class, but students in the other twoconditions had exposure to the diagrams through class reading assignments, textbooks,and other materials. One of these items in each set contained enough information on thediagram itself to be answerable—this item will be referred to as familiar stand-alone. Theother familiar item in each set required students to recall an additional piece of information(either from the curriculum or in reference to the diagram itself)—this item will be referredto as familiar additional-context (for examples of these items, see Figure 1). The third itemin each set featured a diagram that was taken either from other curricula that the studentshad not had, or, where necessary, was created by the research team. These items were in ascience discipline that was unrelated to the curriculum. This question could be answereddirectly from information contained within the diagram, so this item will be referred to asunfamiliar stand-alone.
For the diagram items, reliability was calculated by first aggregating the data up to theteacher level for each individual item, and using the mean score per item of a teacher’sclasses from one year. Cronbach’s α exceeded .83 for the three diagram items for all sixcurricula (range: .837 – .918). The added diagram items thus formed one cohesive factor,with performance on one diagram item strongly correlating with performance on the othertwo items. This suggests students generally relied on knowledge of diagrams to answerthese items, whether or not the content was familiar or well understood.
Results
Our main hypothesis for end-of-unit diagram items was that students of teachers whoreceived the cognitive-science-based intervention, which included targeted instruction fordiagram conventions and interpretation, should perform better on these items. We conductedanalyses at the teacher level because teachers were randomly assigned to an interventiongroup: business-as-usual control, content-only, and cognitive-science-based. We first fo-cused on all three items together, regardless of item type, within individual curriculum units,to determine whether students in the cognitive-science-based classrooms outperformed theother classrooms on the diagram items overall.
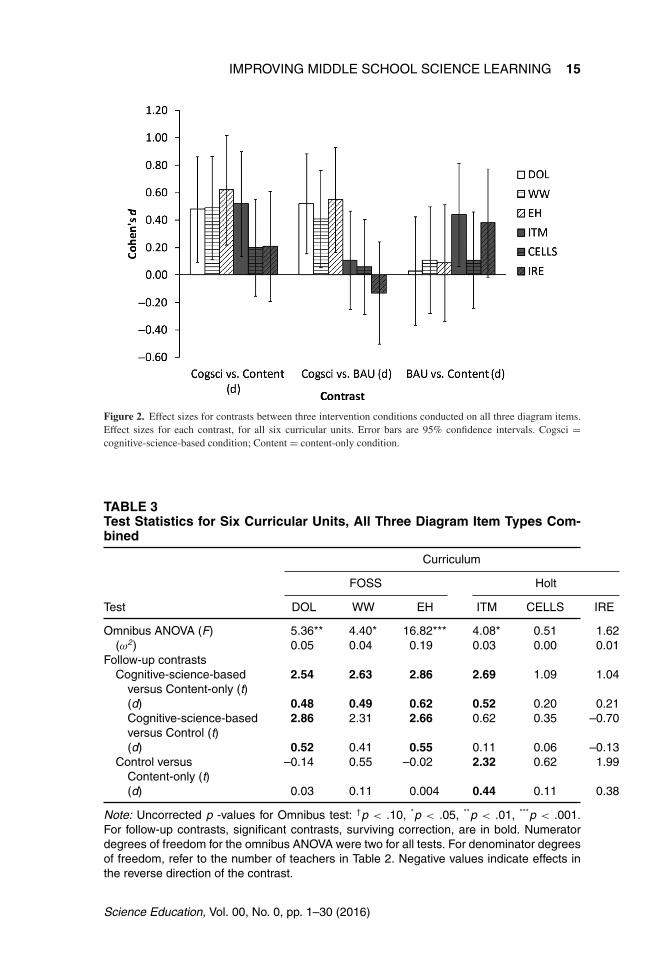
First, we conducted a one-factor analysis of variance (ANOVA) with intervention condi-tion as the factor. Of the five curricula for which the Cogsci intervention was implemented(Diversity of Life, Weather and Water, Earth History, Introduction to Matter, and Cells), allbut Cells revealed significant effects of Condition (all ps < .019; see Figure 2 and Table 3).The significant omnibus ANOVAs were driven by different conditions across the curricula.Follow-up pairwise contrasts and effect sizes were calculated for each contrast separately,corrected for multiple comparisons with Hochberg’s Bonferroni (Hochberg & Benjamini,1990).
For the FOSS curricula, the cognitive-science-based condition consistently outscoredcontent-only: for DOL, d = 0.48, for Weather and Water, d = 0.49, and for Earth History,d = 0.62. Targeted instruction in how to understand diagrams is associated with largeclassroom-level benefits on diagram-specific posttest questions, compared to simply in-creasing teacher content knowledge or generally including teachers in a professional learn-ing community. The cognitive-science-based intervention also significantly outscored thecontrol condition for two of the three units: for Diversity of Life, d = 0.52, and for EarthHistory, d = 0.55, but not for Weather and Water, d = 0.41. The third contrast betweencontent-only and control conditions did not show any significant differences (all ps >
.05), suggesting that content professional development, although it included showing manydiagrams, did not change student learning with diagrams.
Science Education, Vol. 00, No. 0, pp. 1–30 (2016)
14 CROMLEY ET AL.
Figure 1. Example of familiar stand-alone and familiar additional-context items. A familiar stand-alone item (A),and familiar additional-context item (B), taken from the Diversity of Life curriculum. Students in the cognitivescience intervention saw this diagram in class. All test forms from all curricula contained both types of items (aswell as an unfamiliar item), but never repeated the same diagram. Most diagrams were created to be familiar-standalone and familiar-additional context and were administered to different students using different test forms.
Results for the Holt curricula were markedly different from those for the FOSS unitsand were somewhat different from each other. For Introduction to Matter, the cognitive-science-based condition significantly outscored content-only (d = 0.52), but not control(d = 0.11). The control condition significantly outscored content-only (d = 0.44). Cellsand Inside the Restless Earth exhibited no significant advantages for any condition over any
Science Education, Vol. 00, No. 0, pp. 1–30 (2016)
IMPROVING MIDDLE SCHOOL SCIENCE LEARNING 15
Figure 2. Effect sizes for contrasts between three intervention conditions conducted on all three diagram items.Effect sizes for each contrast, for all six curricular units. Error bars are 95% confidence intervals. Cogsci =cognitive-science-based condition; Content = content-only condition.
TABLE 3Test Statistics for Six Curricular Units, All Three Diagram Item Types Com-bined
Curriculum
FOSS Holt
Test DOL WW EH ITM CELLS IRE
Omnibus ANOVA (F) 5.36** 4.40* 16.82*** 4.08* 0.51 1.62(ω2) 0.05 0.04 0.19 0.03 0.00 0.01
Follow-up contrastsCognitive-science-based
versus Content-only (t)2.54 2.63 2.86 2.69 1.09 1.04
(d) 0.48 0.49 0.62 0.52 0.20 0.21Cognitive-science-basedversus Control (t)
2.86 2.31 2.66 0.62 0.35 –0.70
(d) 0.52 0.41 0.55 0.11 0.06 –0.13Control versus
Content-only (t)–0.14 0.55 –0.02 2.32 0.62 1.99
(d) 0.03 0.11 0.004 0.44 0.11 0.38
Note: Uncorrected p -values for Omnibus test: †p < .10, *p < .05, **p < .01, ***p < .001.For follow-up contrasts, significant contrasts, surviving correction, are in bold. Numeratordegrees of freedom for the omnibus ANOVA were two for all tests. For denominator degreesof freedom, refer to the number of teachers in Table 2. Negative values indicate effects inthe reverse direction of the contrast.
Science Education, Vol. 00, No. 0, pp. 1–30 (2016)
16 CROMLEY ET AL.
other. Although combining data sets for different curricula must be done tentatively due todifferences in overall curricular philosophy and in sample characteristics, for both teachersand students, we wanted to determine whether results for the Holt and FOSS curriculashowed different patterns of results. Therefore, all data sets were combined, and a two-factor ANOVA was conducted with intervention condition as one factor with three levels,and data set (Holt or FOSS, with Cells and Introduction to Matter comprising Holt, andEarth History, Weather and Water, and Diversity of Life comprising FOSS). The interactionbetween intervention condition and curriculum producer was not significant, F(2, 830) =1.92, p = .15. The main effect of intervention was significant, F(2, 830) = 11.75, p < .001,as was the main effect of curriculum producer, F(1, 830) = 6.42, p = .01.
Finally, all ANOVAs were repeated with prior year math and reading state scores nor-malized (by subtracting the mean of each state from each teacher’s students’ average scoresand dividing by the standard deviation) and added into the model as covariates. In allmodels, prior math and reading scores were significant (whether in the model separately ortogether). With both math and reading scores added to the model, all effects of interventioncondition that were significant before remained significant (Diversity of Life, Weather andWater, Earth History, Introduction to Matter). The pattern of results was the same withjust math scores in the model. With just reading scores in the model, the effect of inter-vention for Weather and Water, F(2, 171) = 2.64, p = .074 and Introduction to Matter,F(2, 167) = 2.43, p = .091, became marginally significant. While prior achievement affectsthe posttest diagram scores, our intervention has a significant effect above and beyond priorachievement for three FOSS units and one Holt unit (Introduction to Matter).
Specific Diagram Item Types. We wondered whether effects were specific to a certaintype of diagram item, or whether they generalized across the types of items. For example, anoverall null effect could result from differential significant effects across already-taught andtransfer items. As a reminder, in all but the Cells tests, the diagrams in the first and secondtest items had been previously presented in that exact form to students in the cognitive-science-based condition, and thus were both familiar to the students. The first diagramquestion was answerable directly from the diagram (familiar stand-alone), whereas thesecond required an additional piece of information to answer correctly (familiar-additionalcontext). The third diagram was one the students had never seen before, but which couldbe answered directly from the diagram, requiring no additional context (unfamiliar stand-alone). To determine whether the effects of the cognitive-science-based intervention werespecific to questions about diagrams that the students had been seen before, or generalizedto new diagrams, we conducted separate ANOVAs within curriculum on each diagramitem.
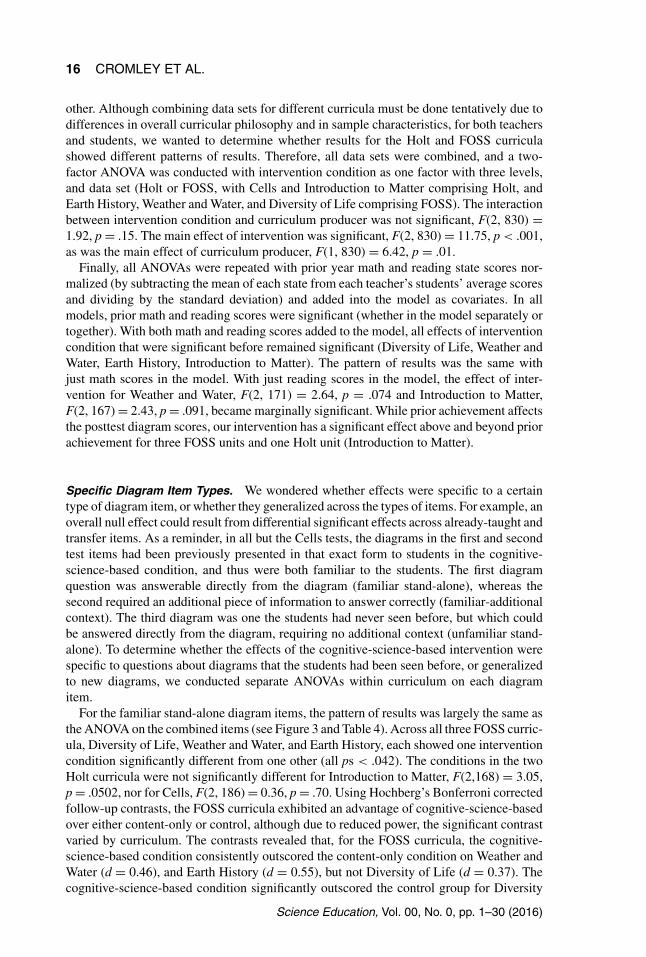
For the familiar stand-alone diagram items, the pattern of results was largely the same asthe ANOVA on the combined items (see Figure 3 and Table 4). Across all three FOSS curric-ula, Diversity of Life, Weather and Water, and Earth History, each showed one interventioncondition significantly different from one other (all ps < .042). The conditions in the twoHolt curricula were not significantly different for Introduction to Matter, F(2,168) = 3.05,p = .0502, nor for Cells, F(2, 186) = 0.36, p = .70. Using Hochberg’s Bonferroni correctedfollow-up contrasts, the FOSS curricula exhibited an advantage of cognitive-science-basedover either content-only or control, although due to reduced power, the significant contrastvaried by curriculum. The contrasts revealed that, for the FOSS curricula, the cognitive-science-based condition consistently outscored the content-only condition on Weather andWater (d = 0.46), and Earth History (d = 0.55), but not Diversity of Life (d = 0.37). Thecognitive-science-based condition significantly outscored the control group for Diversity
Science Education, Vol. 00, No. 0, pp. 1–30 (2016)
IMPROVING MIDDLE SCHOOL SCIENCE LEARNING 17
Figure 3. Effect sizes for contrasts between three intervention conditions conducted on the familiar stand-aloneitems. Effect sizes for each contrast, for all six curricular units. Error bars are 95% confidence intervals. Cogsci= cognitive-science-based condition; Content = content-only condition.
TABLE 4Test Statistics for Six Curricular Units, Familiar Stand-Alone Items
Curriculum
FOSS Holt
Test DOL WW EH ITM CELLS IRE
Omnibus ANOVA (F) 3.69* 3.92* 5.81** 3.05† 0.36 2.03(ω2) 0.03 0.03 0.07 0.02 0.00 0.01
Follow-up contrastsCognitive-science-based
versus Content-only (t)1.94 2.50 2.53 2.29 0.94 1.82
(d) 0.37 0.46 0.55 0.44 0.17 0.37Cogsci versus Control (t) 2.47 2.14 2.99 0.57 0.32 0.41(d) 0.45 0.38 0.62 0.10 0.06 0.08
Control versus Content-only (t) -0.49 0.62 -0.40 1.97 0.50 1.65(d) 0.10 0.12 0.09 0.38 0.09 0.33
Note: Uncorrected p -values for Omnibus test: †p < .10, *p < .05, **p < .01, ***p < .001.For follow-up contrasts, significant contrasts, surviving correction, are in bold. Numeratordegrees of freedom for the omnibus ANOVA were two for all tests. For denominator degreesof freedom, refer to the number of teachers in Table 1. Negative values indicate effects inthe reverse direction of the contrast.
of Life (d = 0.45), and Earth History (d = 0.62), but not Weather and Water (d = 0.38).For these three curricula, the content-only and control conditions did not differ (all ps >
.05). Finally, for Introduction to Matter, no contrasts exceeded the threshold of significanceafter correction. All other contrasts for the other curricula failed to attain significance aftercorrection.
Science Education, Vol. 00, No. 0, pp. 1–30 (2016)
18 CROMLEY ET AL.
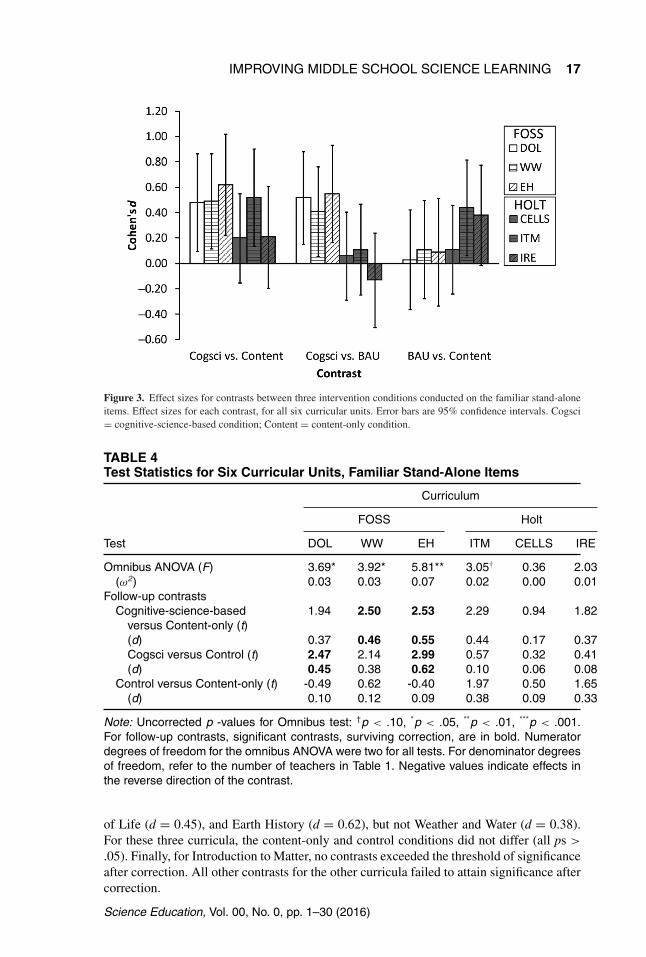
Figure 4. Effect sizes for contrasts between three intervention conditions conducted on the familiar additional-context items. Effect sizes for each contrast, for all six curricular units. Error bars are 95% confidence intervals.Cogsci = cognitive-science-based condition; Content = content-only condition.
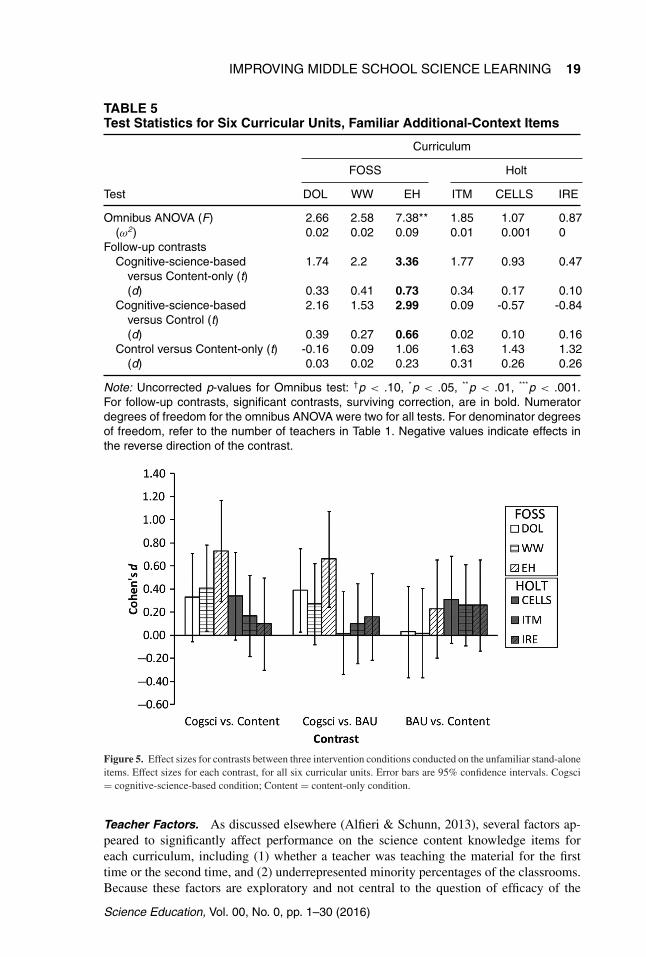
For the familiar additional-context diagram items, the pattern was again very similarto the ANOVA on the combined items, but the effects were weaker across the boardcompared to the familiar stand-alone diagram items (see Figures 3 and 4). The pattern ofperformance for the conditions in Diversity of Life, Weather and Water, Introduction toMatter, and Cells were not different from the combined ANOVA, but the conditions were notsignificantly different across these curricula for familiar additional-context items. Only theone-factor ANOVA for Earth History was significant (see Figure 4 and Table 5). Follow-upcontrasts, corrected with Hochberg’s Bonferroni, reveal that the cognitive-science-basedcondition significantly outperformed content-only (d = 0.73) and control (d = 0.66).For all other curricula, the one-factor ANOVA was not significantly different betweenintervention conditions, (all ps > .073). However, analysis of the Cohen’s d effect sizes foreach curriculum reveals a similar pattern of performance with the cognitive-science-basedcondition outperforming content-only and control overall, despite the familiar additional-context items not reaching significance.
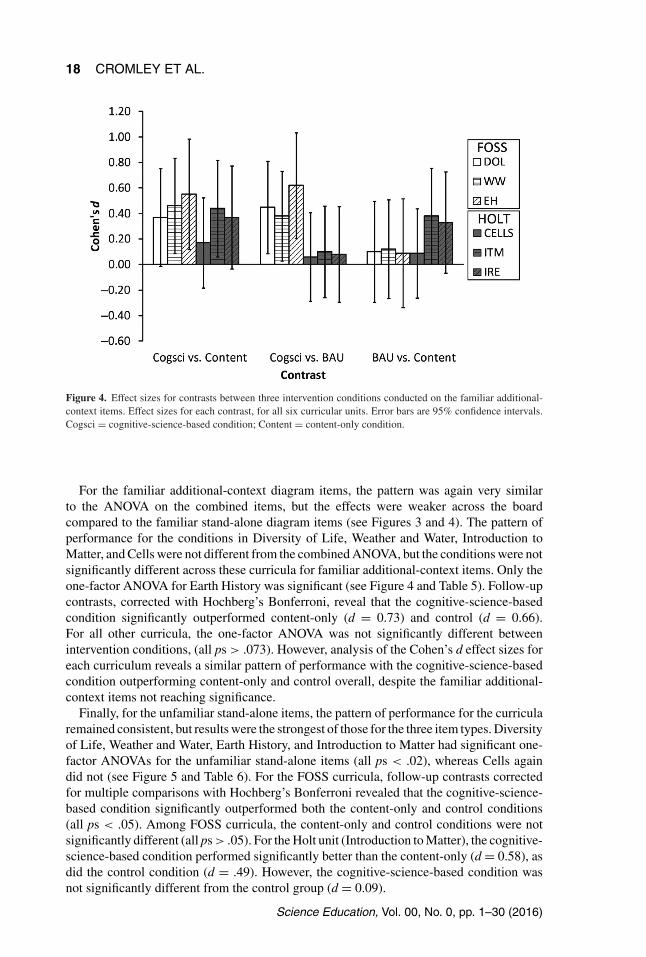
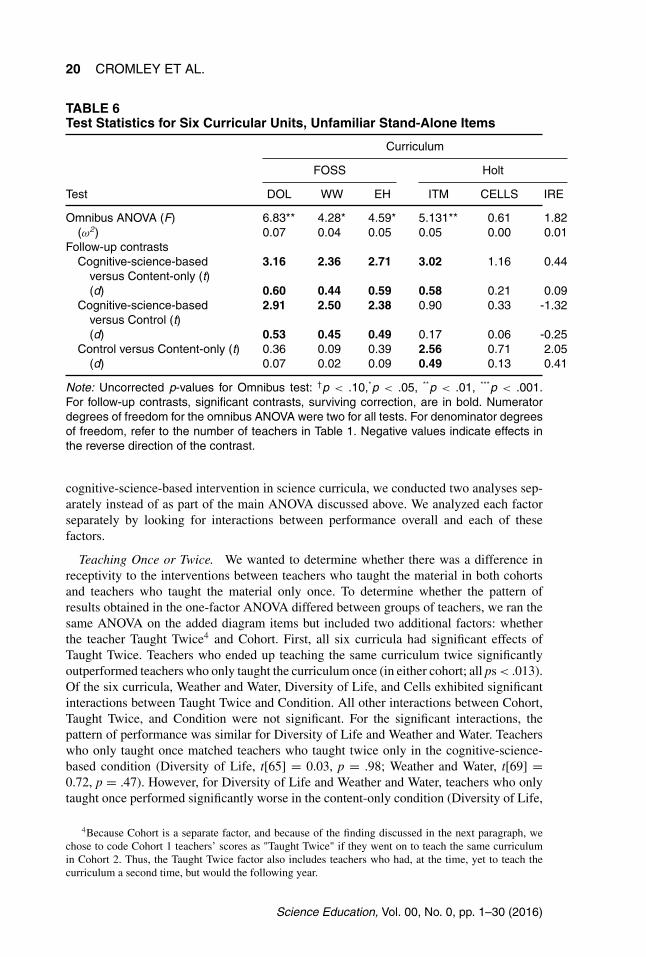
Finally, for the unfamiliar stand-alone items, the pattern of performance for the curricularemained consistent, but results were the strongest of those for the three item types. Diversityof Life, Weather and Water, Earth History, and Introduction to Matter had significant one-factor ANOVAs for the unfamiliar stand-alone items (all ps < .02), whereas Cells againdid not (see Figure 5 and Table 6). For the FOSS curricula, follow-up contrasts correctedfor multiple comparisons with Hochberg’s Bonferroni revealed that the cognitive-science-based condition significantly outperformed both the content-only and control conditions(all ps < .05). Among FOSS curricula, the content-only and control conditions were notsignificantly different (all ps > .05). For the Holt unit (Introduction to Matter), the cognitive-science-based condition performed significantly better than the content-only (d = 0.58), asdid the control condition (d = .49). However, the cognitive-science-based condition wasnot significantly different from the control group (d = 0.09).
Science Education, Vol. 00, No. 0, pp. 1–30 (2016)
IMPROVING MIDDLE SCHOOL SCIENCE LEARNING 19
TABLE 5Test Statistics for Six Curricular Units, Familiar Additional-Context Items
Curriculum
FOSS Holt
Test DOL WW EH ITM CELLS IRE
Omnibus ANOVA (F) 2.66 2.58 7.38** 1.85 1.07 0.87(ω2) 0.02 0.02 0.09 0.01 0.001 0
Follow-up contrastsCognitive-science-based
versus Content-only (t)1.74 2.2 3.36 1.77 0.93 0.47
(d) 0.33 0.41 0.73 0.34 0.17 0.10Cognitive-science-based
versus Control (t)2.16 1.53 2.99 0.09 -0.57 -0.84
(d) 0.39 0.27 0.66 0.02 0.10 0.16Control versus Content-only (t) -0.16 0.09 1.06 1.63 1.43 1.32
(d) 0.03 0.02 0.23 0.31 0.26 0.26
Note: Uncorrected p-values for Omnibus test: †p < .10, *p < .05, **p < .01, ***p < .001.For follow-up contrasts, significant contrasts, surviving correction, are in bold. Numeratordegrees of freedom for the omnibus ANOVA were two for all tests. For denominator degreesof freedom, refer to the number of teachers in Table 1. Negative values indicate effects inthe reverse direction of the contrast.
Figure 5. Effect sizes for contrasts between three intervention conditions conducted on the unfamiliar stand-aloneitems. Effect sizes for each contrast, for all six curricular units. Error bars are 95% confidence intervals. Cogsci= cognitive-science-based condition; Content = content-only condition.
Teacher Factors. As discussed elsewhere (Alfieri & Schunn, 2013), several factors ap-peared to significantly affect performance on the science content knowledge items foreach curriculum, including (1) whether a teacher was teaching the material for the firsttime or the second time, and (2) underrepresented minority percentages of the classrooms.Because these factors are exploratory and not central to the question of efficacy of the
Science Education, Vol. 00, No. 0, pp. 1–30 (2016)
20 CROMLEY ET AL.
TABLE 6Test Statistics for Six Curricular Units, Unfamiliar Stand-Alone Items
Curriculum
FOSS Holt
Test DOL WW EH ITM CELLS IRE
Omnibus ANOVA (F) 6.83** 4.28* 4.59* 5.131** 0.61 1.82(ω2) 0.07 0.04 0.05 0.05 0.00 0.01
Follow-up contrastsCognitive-science-based
versus Content-only (t)3.16 2.36 2.71 3.02 1.16 0.44
(d) 0.60 0.44 0.59 0.58 0.21 0.09Cognitive-science-based
versus Control (t)2.91 2.50 2.38 0.90 0.33 -1.32
(d) 0.53 0.45 0.49 0.17 0.06 -0.25Control versus Content-only (t) 0.36 0.09 0.39 2.56 0.71 2.05
(d) 0.07 0.02 0.09 0.49 0.13 0.41
Note: Uncorrected p-values for Omnibus test: †p < .10,*p < .05, **p < .01, ***p < .001.For follow-up contrasts, significant contrasts, surviving correction, are in bold. Numeratordegrees of freedom for the omnibus ANOVA were two for all tests. For denominator degreesof freedom, refer to the number of teachers in Table 1. Negative values indicate effects inthe reverse direction of the contrast.
cognitive-science-based intervention in science curricula, we conducted two analyses sep-arately instead of as part of the main ANOVA discussed above. We analyzed each factorseparately by looking for interactions between performance overall and each of thesefactors.
Teaching Once or Twice. We wanted to determine whether there was a difference inreceptivity to the interventions between teachers who taught the material in both cohortsand teachers who taught the material only once. To determine whether the pattern ofresults obtained in the one-factor ANOVA differed between groups of teachers, we ran thesame ANOVA on the added diagram items but included two additional factors: whetherthe teacher Taught Twice4 and Cohort. First, all six curricula had significant effects ofTaught Twice. Teachers who ended up teaching the same curriculum twice significantlyoutperformed teachers who only taught the curriculum once (in either cohort; all ps < .013).Of the six curricula, Weather and Water, Diversity of Life, and Cells exhibited significantinteractions between Taught Twice and Condition. All other interactions between Cohort,Taught Twice, and Condition were not significant. For the significant interactions, thepattern of performance was similar for Diversity of Life and Weather and Water. Teacherswho only taught once matched teachers who taught twice only in the cognitive-science-based condition (Diversity of Life, t[65] = 0.03, p = .98; Weather and Water, t[69] =0.72, p = .47). However, for Diversity of Life and Weather and Water, teachers who onlytaught once performed significantly worse in the content-only condition (Diversity of Life,
4Because Cohort is a separate factor, and because of the finding discussed in the next paragraph, wechose to code Cohort 1 teachers’ scores as "Taught Twice" if they went on to teach the same curriculumin Cohort 2. Thus, the Taught Twice factor also includes teachers who had, at the time, yet to teach thecurriculum a second time, but would the following year.
Science Education, Vol. 00, No. 0, pp. 1–30 (2016)
IMPROVING MIDDLE SCHOOL SCIENCE LEARNING 21
t[43] = 2.21, p = .03; Weather and Water, t[45] = 3.49, p = .001) and, for Diversity of Lifebut not Weather and Water, teachers who only taught once performed worse in the controlcondition (Diversity of Life, t[53] = 3.48, p = .001; Weather and Water, t[55] = 1.04,p = .30). Follow-up contrasts for Cells revealed a different pattern. Teachers who taughtonce performed worse in the cognitive-science-based condition, t(61) = 2.05, p = .045,similar in the content-only condition, t(59) = 0.71, p = .48, and worse in the controlcondition, t(63) = 3.71, p < .001. In short, teaching the unit twice led to better meanstudent scores for teachers in the cognitive-science-based condition (Cells) and content-only condition (Weather and Water and Diversity of Life).
Underrepresented Minority Status of the Classrooms. Previous analyses of the sciencecontent knowledge items from each curriculum had revealed differences in student perfor-mance depending on whether the classroom had a majority of underrepresented minority(i.e., black and Hispanic) students (Alfieri & Schunn, 2013). To determine whether thesedifferences manifested in the added diagram items, we conducted a two-factor ANOVAwith intervention condition as one factor and URM-status of the classroom as a secondfactor, using the same a cutoff of 90% URM students (Orfield, 2009).
Higher proportion URM classrooms performed worse than lower proportion URM class-rooms on all five implemented curricula (all ps <.003). Out of the five implemented curric-ula, we found one significant interaction between intervention condition and URM status:Cells, F(2, 183) = 4.16, p = .017. For Cells, follow-up contrasts, corrected for multi-ple comparisons, reveal that cognitive-science-based teachers in lower URM proportionclassrooms had significantly higher performance than cognitive-science-based teachers inhigher URM proportion classrooms, t(63) = 4.22, p < .001, d = 1.05, whereas teachersfrom different URM status classrooms for the other two conditions were not significantlydifferent. This pattern of performance is similar to the science content knowledge items forthis curriculum (Alfieri & Schunn, 2013).
Discussion
The cognitive-science-based intervention appears to help these generally low-achievingstudents develop skills at answering questions that required them to use diagrams. Theintervention was more successful in the FOSS curricula (Diversity of Life, Weather andWater, and Earth History) than in the Holt curriculum (Introduction to Matter alone).Furthermore, the intervention was more successful in classrooms that were not extremelysegregated—even after controlling for prior academic achievement—and in classroomswhere the teacher was teaching with our interventions for the second time, suggesting somepractice in implementing the diagrammatic interventions is useful. We will unpack thesedifferential effects in the general discussion.
Many randomized controlled trials, and indeed much of the literature on smaller scaleclassroom interventions, show effects on researcher-developed tests but not on standard-ized tests, which are less susceptible to confirmation bias. In the state for which our Holtcurriculum study took place, we were able to obtain Cohort 2 item-level data for studentperformance on the statewide standardized science test administered 1 year after our inter-vention. In Study 2, we analyze effects of the three experimental conditions on performanceon diagram items from this standardized test. It is possible that the consistent exposure tothe interventions across three units will produce effects even though the effects were smallon the researcher-developed posttests for each unit.
Science Education, Vol. 00, No. 0, pp. 1–30 (2016)
22 CROMLEY ET AL.
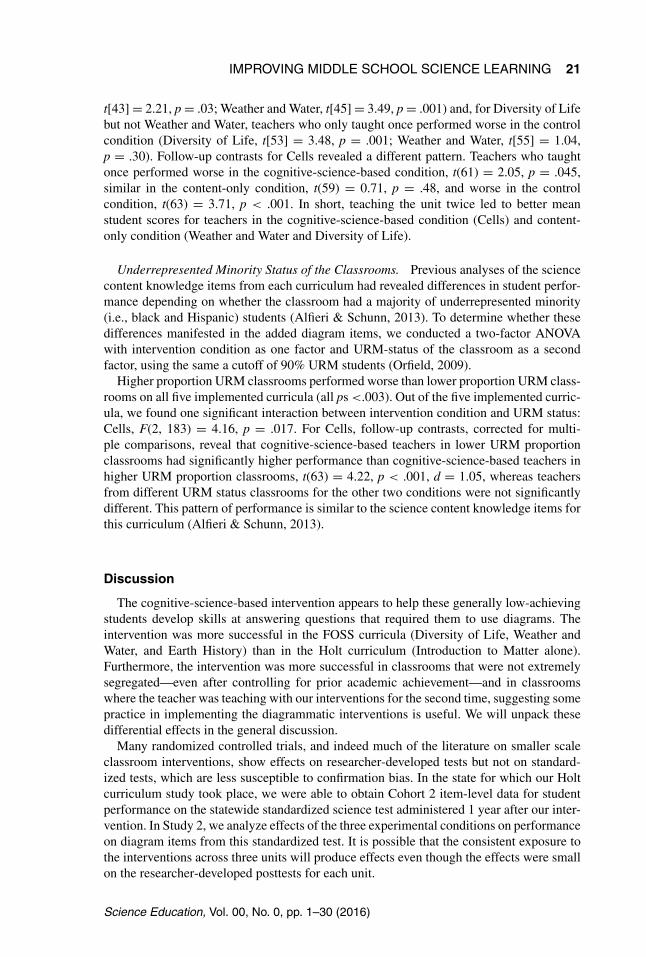
TABLE 7Student-Level Demographics for Students Providing State-Mandated TestScores
Variable n Percent
3,443 100Treatment
Control 1,344 38.6Content-only 860 24.7Cognitive-science-based 1,275 36.6
SexFemale 1,718 50.1Male 1,743 49.4
RaceURM* 2,660 76.5Non-URM 801 23.0
M SDAge (months) 164.1 5.9
Note: URM group includes Hispanic, Black, American Indian, and Others.Non-URM group includes Asian and White.
STUDY 2
To further test the effects of our intervention, we examined group differences betweencognitive-science-based, content-only, and control conditions in performance on a sub-set of questions—the ones using diagrams—from one state-required standardized sci-ence test, which the Holt student participants took in their eighth-grade year in 2011(i.e., 1 year after participating in the intervention). The specific hypotheses were asfollows:
1. Classrooms in the cognitive-science-based condition will outscore those in thecontent-only and control conditions on state science test items on items that re-quire reasoning with diagrams (necessary-sufficient-diagram items), after accountingfor demographics.
2. Classrooms in the cognitive-science-based condition will outscore those in thecontent-only and control conditions on state science test items on items that re-quire reasoning with diagrams and require bringing basic science knowledge to bear(necessary-not-sufficient-diagram items); however, effect sizes may be smaller fornecessary-not-sufficient-diagram items, after accounting for demographics.
Method
Participants. Participants were from the schools that participated in our interventionwho were taught with only the Holt Curriculum by 105 participating science teachers andwhose state test items we were able to analyze. We obtained the standardized sciencetest scores for 3,443 eighth-grade students who had participated in our intervention theprevious year when they were in seventh grade. For the purpose of analysis, classes weresplit into less-segregated (< 90% URMs in the classroom) and more-segregated (90% ormore URMs in the classroom). (See Table 7 for detailed demographic information about theparticipants.)
Science Education, Vol. 00, No. 0, pp. 1–30 (2016)
IMPROVING MIDDLE SCHOOL SCIENCE LEARNING 23
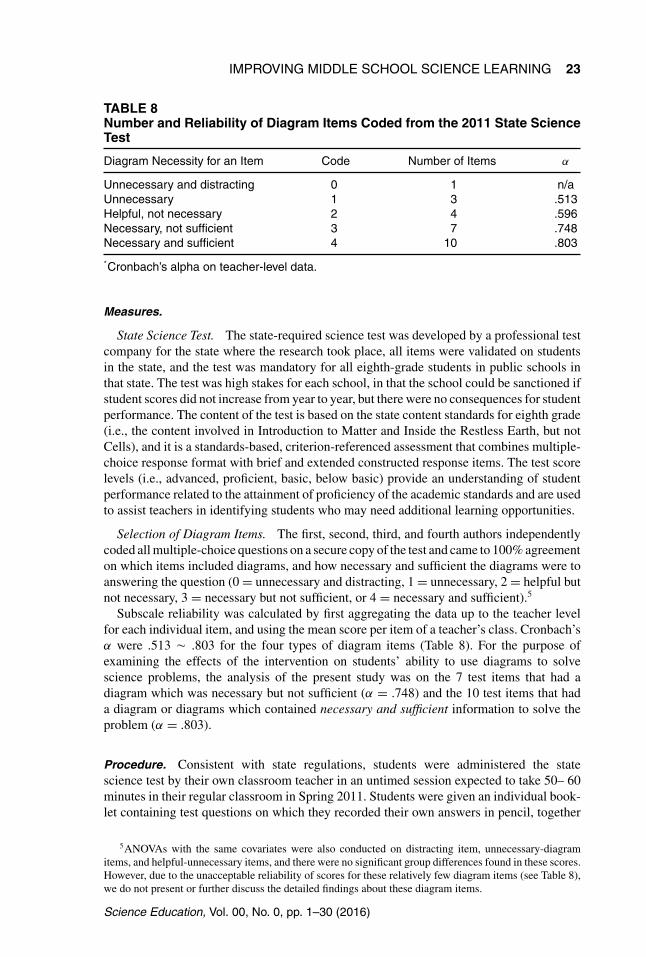
TABLE 8Number and Reliability of Diagram Items Coded from the 2011 State ScienceTest
Diagram Necessity for an Item Code Number of Items α
Unnecessary and distracting 0 1 n/aUnnecessary 1 3 .513Helpful, not necessary 2 4 .596Necessary, not sufficient 3 7 .748Necessary and sufficient 4 10 .803
*Cronbach’s alpha on teacher-level data.
Measures.
State Science Test. The state-required science test was developed by a professional testcompany for the state where the research took place, all items were validated on studentsin the state, and the test was mandatory for all eighth-grade students in public schools inthat state. The test was high stakes for each school, in that the school could be sanctioned ifstudent scores did not increase from year to year, but there were no consequences for studentperformance. The content of the test is based on the state content standards for eighth grade(i.e., the content involved in Introduction to Matter and Inside the Restless Earth, but notCells), and it is a standards-based, criterion-referenced assessment that combines multiple-choice response format with brief and extended constructed response items. The test scorelevels (i.e., advanced, proficient, basic, below basic) provide an understanding of studentperformance related to the attainment of proficiency of the academic standards and are usedto assist teachers in identifying students who may need additional learning opportunities.
Selection of Diagram Items. The first, second, third, and fourth authors independentlycoded all multiple-choice questions on a secure copy of the test and came to 100% agreementon which items included diagrams, and how necessary and sufficient the diagrams were toanswering the question (0 = unnecessary and distracting, 1 = unnecessary, 2 = helpful butnot necessary, 3 = necessary but not sufficient, or 4 = necessary and sufficient).5
Subscale reliability was calculated by first aggregating the data up to the teacher levelfor each individual item, and using the mean score per item of a teacher’s class. Cronbach’sα were .513 � .803 for the four types of diagram items (Table 8). For the purpose ofexamining the effects of the intervention on students’ ability to use diagrams to solvescience problems, the analysis of the present study was on the 7 test items that had adiagram which was necessary but not sufficient (α = .748) and the 10 test items that hada diagram or diagrams which contained necessary and sufficient information to solve theproblem (α = .803).
Procedure. Consistent with state regulations, students were administered the statescience test by their own classroom teacher in an untimed session expected to take 50– 60minutes in their regular classroom in Spring 2011. Students were given an individual book-let containing test questions on which they recorded their own answers in pencil, together
5ANOVAs with the same covariates were also conducted on distracting item, unnecessary-diagramitems, and helpful-unnecessary items, and there were no significant group differences found in these scores.However, due to the unacceptable reliability of scores for these relatively few diagram items (see Table 8),we do not present or further discuss the detailed findings about these diagram items.
Science Education, Vol. 00, No. 0, pp. 1–30 (2016)
24 CROMLEY ET AL.
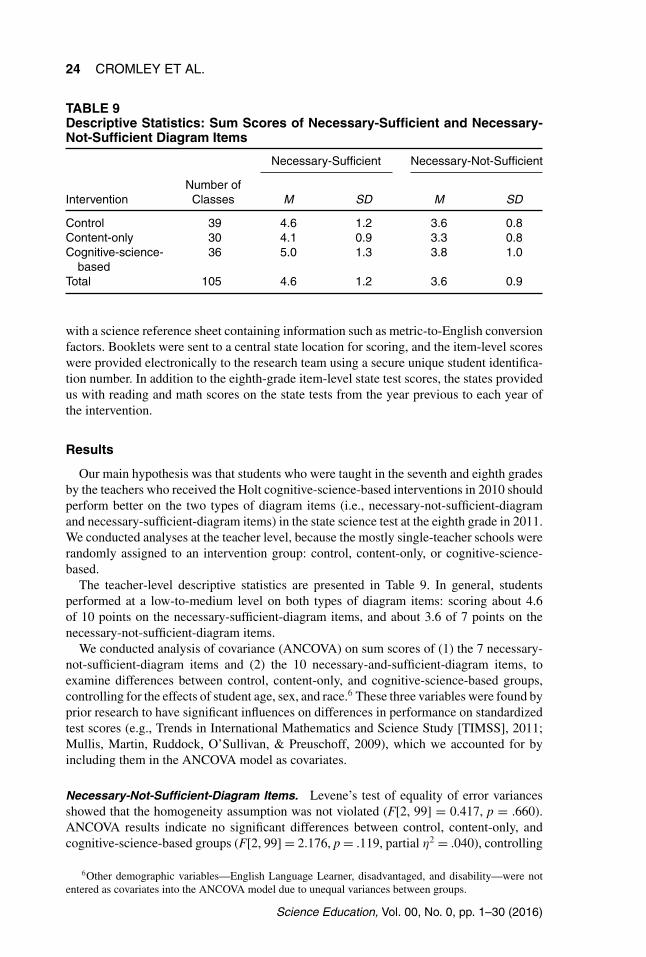
TABLE 9Descriptive Statistics: Sum Scores of Necessary-Sufficient and Necessary-Not-Sufficient Diagram Items
Necessary-Sufficient Necessary-Not-Sufficient
InterventionNumber of
Classes M SD M SD
Control 39 4.6 1.2 3.6 0.8Content-only 30 4.1 0.9 3.3 0.8Cognitive-science-
based36 5.0 1.3 3.8 1.0
Total 105 4.6 1.2 3.6 0.9
with a science reference sheet containing information such as metric-to-English conversionfactors. Booklets were sent to a central state location for scoring, and the item-level scoreswere provided electronically to the research team using a secure unique student identifica-tion number. In addition to the eighth-grade item-level state test scores, the states providedus with reading and math scores on the state tests from the year previous to each year ofthe intervention.
Results
Our main hypothesis was that students who were taught in the seventh and eighth gradesby the teachers who received the Holt cognitive-science-based interventions in 2010 shouldperform better on the two types of diagram items (i.e., necessary-not-sufficient-diagramand necessary-sufficient-diagram items) in the state science test at the eighth grade in 2011.We conducted analyses at the teacher level, because the mostly single-teacher schools wererandomly assigned to an intervention group: control, content-only, or cognitive-science-based.
The teacher-level descriptive statistics are presented in Table 9. In general, studentsperformed at a low-to-medium level on both types of diagram items: scoring about 4.6of 10 points on the necessary-sufficient-diagram items, and about 3.6 of 7 points on thenecessary-not-sufficient-diagram items.
We conducted analysis of covariance (ANCOVA) on sum scores of (1) the 7 necessary-not-sufficient-diagram items and (2) the 10 necessary-and-sufficient-diagram items, toexamine differences between control, content-only, and cognitive-science-based groups,controlling for the effects of student age, sex, and race.6 These three variables were found byprior research to have significant influences on differences in performance on standardizedtest scores (e.g., Trends in International Mathematics and Science Study [TIMSS], 2011;Mullis, Martin, Ruddock, O’Sullivan, & Preuschoff, 2009), which we accounted for byincluding them in the ANCOVA model as covariates.
Necessary-Not-Sufficient-Diagram Items. Levene’s test of equality of error variancesshowed that the homogeneity assumption was not violated (F[2, 99] = 0.417, p = .660).ANCOVA results indicate no significant differences between control, content-only, andcognitive-science-based groups (F[2, 99] = 2.176, p = .119, partial η2 = .040), controlling
6Other demographic variables—English Language Learner, disadvantaged, and disability—were notentered as covariates into the ANCOVA model due to unequal variances between groups.
Science Education, Vol. 00, No. 0, pp. 1–30 (2016)
IMPROVING MIDDLE SCHOOL SCIENCE LEARNING 25
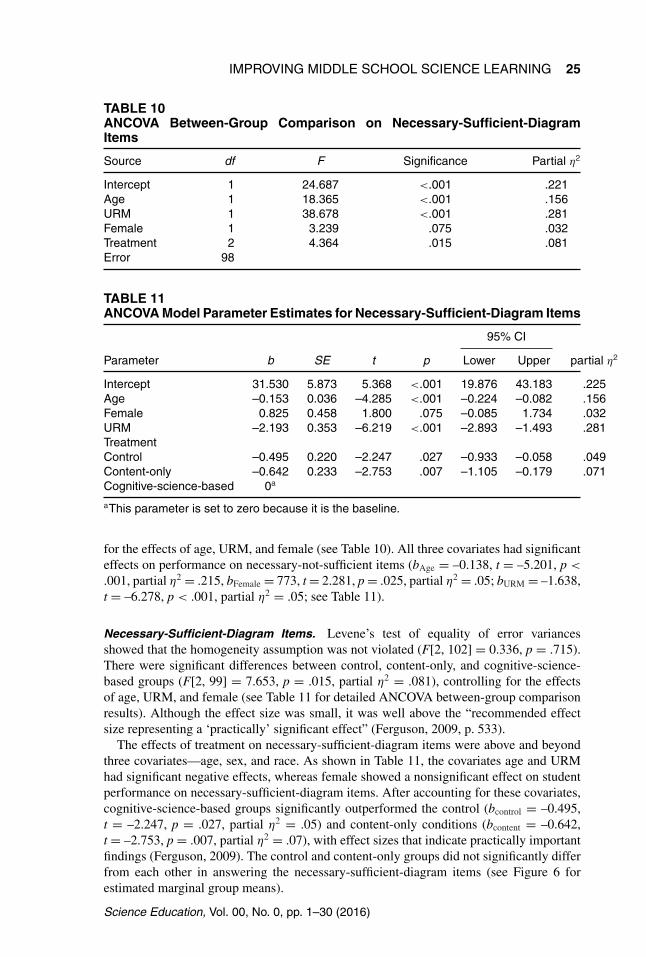
TABLE 10ANCOVA Between-Group Comparison on Necessary-Sufficient-DiagramItems
Source df F Significance Partial η2
Intercept 1 24.687 <.001 .221Age 1 18.365 <.001 .156URM 1 38.678 <.001 .281Female 1 3.239 .075 .032Treatment 2 4.364 .015 .081Error 98
TABLE 11ANCOVA Model Parameter Estimates for Necessary-Sufficient-Diagram Items
95% CI
Parameter b SE t p Lower Upper partial η2
Intercept 31.530 5.873 5.368 <.001 19.876 43.183 .225Age –0.153 0.036 –4.285 <.001 –0.224 –0.082 .156Female 0.825 0.458 1.800 .075 –0.085 1.734 .032URM –2.193 0.353 –6.219 <.001 –2.893 –1.493 .281TreatmentControl –0.495 0.220 –2.247 .027 –0.933 –0.058 .049Content-only –0.642 0.233 –2.753 .007 –1.105 –0.179 .071Cognitive-science-based 0a
aThis parameter is set to zero because it is the baseline.
for the effects of age, URM, and female (see Table 10). All three covariates had significanteffects on performance on necessary-not-sufficient items (bAge = –0.138, t = –5.201, p <
.001, partial η2 = .215, bFemale = 773, t = 2.281, p = .025, partial η2 = .05; bURM = –1.638,t = –6.278, p < .001, partial η2 = .05; see Table 11).
Necessary-Sufficient-Diagram Items. Levene’s test of equality of error variancesshowed that the homogeneity assumption was not violated (F[2, 102] = 0.336, p = .715).There were significant differences between control, content-only, and cognitive-science-based groups (F[2, 99] = 7.653, p = .015, partial η2 = .081), controlling for the effectsof age, URM, and female (see Table 11 for detailed ANCOVA between-group comparisonresults). Although the effect size was small, it was well above the “recommended effectsize representing a ‘practically’ significant effect” (Ferguson, 2009, p. 533).
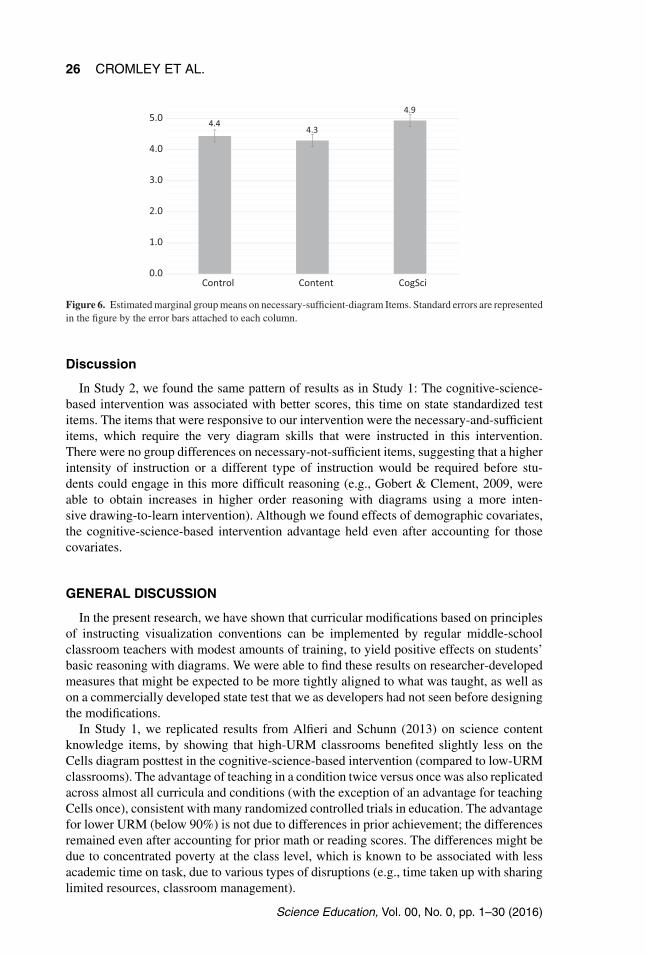
The effects of treatment on necessary-sufficient-diagram items were above and beyondthree covariates—age, sex, and race. As shown in Table 11, the covariates age and URMhad significant negative effects, whereas female showed a nonsignificant effect on studentperformance on necessary-sufficient-diagram items. After accounting for these covariates,cognitive-science-based groups significantly outperformed the control (bcontrol = –0.495,t = –2.247, p = .027, partial η2 = .05) and content-only conditions (bcontent = –0.642,t = –2.753, p = .007, partial η2 = .07), with effect sizes that indicate practically importantfindings (Ferguson, 2009). The control and content-only groups did not significantly differfrom each other in answering the necessary-sufficient-diagram items (see Figure 6 forestimated marginal group means).
Science Education, Vol. 00, No. 0, pp. 1–30 (2016)
26 CROMLEY ET AL.
4.44.3
4.9
0.0
1.0
2.0
3.0
4.0
5.0
CogSciContentControl
Figure 6. Estimated marginal group means on necessary-sufficient-diagram Items. Standard errors are representedin the figure by the error bars attached to each column.
Discussion
In Study 2, we found the same pattern of results as in Study 1: The cognitive-science-based intervention was associated with better scores, this time on state standardized testitems. The items that were responsive to our intervention were the necessary-and-sufficientitems, which require the very diagram skills that were instructed in this intervention.There were no group differences on necessary-not-sufficient items, suggesting that a higherintensity of instruction or a different type of instruction would be required before stu-dents could engage in this more difficult reasoning (e.g., Gobert & Clement, 2009, wereable to obtain increases in higher order reasoning with diagrams using a more inten-sive drawing-to-learn intervention). Although we found effects of demographic covariates,the cognitive-science-based intervention advantage held even after accounting for thosecovariates.
GENERAL DISCUSSION
In the present research, we have shown that curricular modifications based on principlesof instructing visualization conventions can be implemented by regular middle-schoolclassroom teachers with modest amounts of training, to yield positive effects on students’basic reasoning with diagrams. We were able to find these results on researcher-developedmeasures that might be expected to be more tightly aligned to what was taught, as well ason a commercially developed state test that we as developers had not seen before designingthe modifications.
In Study 1, we replicated results from Alfieri and Schunn (2013) on science contentknowledge items, by showing that high-URM classrooms benefited slightly less on theCells diagram posttest in the cognitive-science-based intervention (compared to low-URMclassrooms). The advantage of teaching in a condition twice versus once was also replicatedacross almost all curricula and conditions (with the exception of an advantage for teachingCells once), consistent with many randomized controlled trials in education. The advantagefor lower URM (below 90%) is not due to differences in prior achievement; the differencesremained even after accounting for prior math or reading scores. The differences might bedue to concentrated poverty at the class level, which is known to be associated with lessacademic time on task, due to various types of disruptions (e.g., time taken up with sharinglimited resources, classroom management).
Science Education, Vol. 00, No. 0, pp. 1–30 (2016)
IMPROVING MIDDLE SCHOOL SCIENCE LEARNING 27
With regard to 1 year versus 2 years of teaching in the cognitive-science-based inter-vention, teachers apparently developed enough skills, knowledge, and familiarity (e.g.,metarepresentational competence; diSessa, 2004) with our visualization exercises dur-ing initial and ongoing professional development to use them when teaching, but a sec-ond year of implementation led to larger student gains. This might be due to fluencyin giving initial explanations, more detailed knowledge of student weaknesses and po-tential misunderstandings of visualizations, developing more ways to scaffold studentlearning with the materials, or other development between the first and second year ofimplementation. The greater gains by the second year of implementation is pragmati-cally important: As is common in work with large urban school districts, we observeda high level of teacher “churn,” with many participating teachers moving to differentschools or moving to teach different subjects in the same schools after 1 year. Researchhas consistently associated teacher churn with lower student achievement. We were ableto show significant and relatively large effects despite the high level of churn in ourstudy, but the effects were even larger—and the promise of the intervention is greater—when teachers are able to remain teaching science for 2 years in a row in the sameschool.
The different pattern of results across familiar stand-alone, familiar additional-context,and unfamiliar stand-alone items suggests that benefits come from both better under-standing of how to read diagrams and also from greater content knowledge (Won, Yoon, &Treagust, 2014). Recall that for directly instructed familiar stand-alone items, students in ourcognitive-science-based intervention had an advantage over the content-only group in EarthHistory and Weather and Water, and over the control group in Earth History and Diversityof Life: all three groups saw the diagrams in their textbooks but only the cognitive-science-based condition received instruction in how to make sense of them. For the more cognitivelychallenging familiar additional-context items, the cognitive-science-based group advantageheld for Earth History only, suggesting that the cognitive-science-based intervention wasappropriately targeted at building the most basic diagram comprehension skills. The unfa-miliar stand-alone items, by contrast, required diagram skills to be applied to completelynew science content (Schonborn & Bogeholz, 2009), and here we saw the cognitive-science-based group advantage across both comparison groups on all three FOSS units and oneHolt unit.
Although many educational interventions can produce results on researcher-developeditems such as those in Study 1, improving student performance on standardized testsis known to be more difficult (see, e.g., Rosenshine & Meister, 1994). Strikingly, de-spite the fact that end-of-unit tests had shown scant effects in the traditional curriculumunits, in Study 2 we found that our cognitive-science-based intervention yielded signif-icant effects on diagram-specific items from a state exam administered 1 year after ourintervention. These effects were seen on items that require reasoning with diagrams,even after controlling for demographics. State exam questions that require combiningtext (e.g., a description of an experiment) and diagrams (a drawing of the experimen-tal setup) are likely very difficult for students to answer unless they know how to makesense of the diagrams (Cook et al., 2008), and this is exactly the skill that is instructedin the cognitive-science-based instruction. One possible explanation for finding effects ona delayed statewide test but not on a researcher-designed end-of-unit test is that teach-ers may have continued teaching the diagram comprehensions skills in the subsequentgrade in the intervening year—despite much churn between schools, most students remainwithin the school district. Future work could assess this possibility with direct measures ofcarryover.
Science Education, Vol. 00, No. 0, pp. 1–30 (2016)
28 CROMLEY ET AL.
Limitations
Despite the large sample size, our study does have a number of limitations. First, we do nothave a true test of the Inside the Restless Earth unit, given the low level of implementationby teachers. On the one hand, the learning tasks appear to be the most conceptuallydifficult of the Holt units; on the other hand, it does not appear to be as difficult as theFOSS Earth History unit, on which we were able to show numerous significant effects(see Tables 3 and 5). Second, the activity-focused FOSS units and the textbook-focusedHolt units are qualitatively different from each other, but we do not have the kind ofdetailed classroom observations that would explain how that activity versus textbook focusinteracted with our cognitive-science-based treatment. Such observations could also helpus understand different ways that teachers used to the provided materials (e.g., specificscaffolding provided to students, specific examples used), and possible different sources ofeffectiveness of the materials. Third, the state high-stakes test was taken one full year afterthe interventions, and there might be confounding variables affecting these test scores, suchas teachers continuing to provide diagrams instruction within the same schools after theintervention was over. Fourth, the response formats for the state test are more varied—e.g.,include constructed responses—and possibly more difficult—e.g., include diagram + table+ graph representations—than our end-of-unit tests, making it difficult to compare resultsfrom the two.
Findings from laboratory studies do not always translate into successful classroom inter-ventions (Hulleman & Cordray, 2009); not only are school-aged children different from thetypical undergraduate research participant, but the learning environment is much less con-trolled than laboratory conditions, and teachers delivering interventions have many otherresponsibilities than do research assistants working one-on-one with participants in a lab orin pullout training studies done in schools. Despite the differences between the conditionsin the basic research literature that we built on and the large-scale classroom interven-tion we delivered, the principles of visualization comprehension do in fact transfer to the“blooming, buzzing confusion of classrooms” (Brown, 1992). This suggests that there areat least three strong regularities of visualization comprehension across this growing bodyof basic research and applied research on visualization comprehension: (1) making senseof visualizations—these recent cultural products—is not effortless and self-evident, andthe process frequently breaks down; (2) students who receive supports for comprehend-ing visualizations can improve their comprehension; and (3) the learning can transfer tonew domains. Finally, our study shows that classroom science teachers without a degreein cognitive psychology can learn to effectively provide instruction and scaffold learnersin the process of visualization comprehension, which leads to improved performance of ameaningful magnitude on both researcher-designed and standard-based criterion-referencedbased state tests. These findings imply, in turn, that science teachers can instruct studentsin how to comprehend diagrams as part of the curriculum; in the present research and inrecently published studies, such efforts involved some professional development. Further-more, teachers might expect smaller gains in the first year of directly teaching diagramcomprehension and larger gains in the second year. In addition, they might expect largergains in less-segregated classrooms. Second, such instruction can be beneficial beyond thedirectly instructed diagrams, including both diagrams that represent instructed content andpossibly those that use the same conventions to represent novel content.
This research was supported by award #R305C080009 from the U.S. Department of Education, The21st Century Center for Research and Development in Cognition and Science Instruction (F. JosephMerlino, PI). The opinions are those of the authors and do not represent the policies of the fundingagency.
Science Education, Vol. 00, No. 0, pp. 1–30 (2016)
IMPROVING MIDDLE SCHOOL SCIENCE LEARNING 29
REFERENCES
Alfieri, L., Nokes-Malach, T. J., & Schunn, C. D. (2013). Learning through case comparisons: A meta-analyticreview. Educational Psychologist, 48(2), 87 – 113. doi: 10.1080/00461520.2013.775712
Alfieri, L., & Schunn, C. (2013). Individual and contextual investigations of a cognitive-based intervention.Poster presented at the Conference on Improving Middle School Science Instruction Using Cognitive Science.Washington, DC.
Bergey, B. W., Cromley, J. G., Kirchgessner, A., & Newcombe, N. (2015). Using diagrams versus text for spacedrestudy: Effects on learning in 10th grade biology classes. British Journal of Educational Psychology, 85,57 – 94. doi: 10.1111/bjep.12062
Bodemer, D., & Faust, U. (2006). External and mental referencing of multiple representations. Computers inHuman Behavior, 22, 27 – 42. doi: 10.1016/j.chb.2005.01.005
Bohrnstedt, G., Kitmitto, S., Ogut, B., Sherman, D., and Chan, D. (2015). School composition and the black –white achievement gap (NCES 2015-018). U.S. Department of Education, Washington, DC: National Centerfor Education Statistics.
Brown, A. L. (1992). Design experiments: Theoretical and methodological challenges in creating complex inter-ventions in classroom settings. The Journal of the Learning Sciences, 2(2), 141 – 178.
Butcher, K. R. (2006). Learning from text with diagrams: Promoting mental model development and inferencegeneration. Journal of Educational Psychology, 98(1), 182 – 197.
Common Core State Standards Initiative. (2011). Common Core State Standards for English language arts andliteracy in history/social studies, science, and technical subjects. Retrieved from http://www.corestandards.org
Cook, M., Carter, G., & Wiebe, E. N. (2008). The interpretation of cellular transport graphics by students withlow and high prior knowledge. International Journal of Science Education, 30(2), 239 – 261.
Crisp, V., & Sweiry, E. (2006). Can a picture ruin a thousand words? The effects of visual resources in examquestions. Educational Research, 48(2), 139 – 154.
Cromley, J. G., Perez, A. C, Fitzhugh, S., Newcombe, N., Wills, T. W., & Tanaka, J. C. (2013). Improving students’diagrammatic reasoning: A classroom intervention study. Journal of Experimental Education, 81(4), 511 – 537.doi: 10.1080/00220973.2012.745465
De Corte, E. (2003). Transfer as the productive use of acquired knowledge, skills, and motivations. CurrentDirections in Psychological Research, 12, 142 – 146.
diSessa, A. A. (2004). Metarepresentation: Native competence and targets for instruction. Cognition and Instruc-tion, 22(3), 293 – 331.
Ero-Tolliver, I., Lucas, D., & Schauble, L. (2013). Young children’s thinking about decomposition: Early modelingentrees to complex ideas in science. Research in Science Education, 43(5), 2137 – 2152.
Ferguson, C. J. (2009). An effect size primer: A guide for clinicians and researchers. Professional Psychology:Research and Practice, 40(5), 532 – 538. doi:10.1037/a0015808
Gilbert, J. K., Reiner, M. & Nakhleh, M. (Eds.). (2008). Visualization: Theory and practice in science education(pp. 29 – 52). Dordrecht, The Netherlands: Springer.
Gobert, J. D., & Clement, J. J. (1999). Effects of student-generated diagrams versus student-generated summarieson conceptual understanding of causal and dynamic knowledge in plate tectonics. Journal of Research inScience Teaching, 36(1), 39 – 53.
Harris, C. J., Penuel, W. R., D’Angelo, C. M., DeBarger, A. H., Gallagher, L. P., Kennedy, C. A., . . . Krajcik, J.S. (2015). Impact of project-based curriculum materials on student learning in science: Results of a randomizedcontrolled trial. Journal of Research in Science Teaching, 52(10), 1362 – 1385. doi: 10.1002/tea.21263.
Hegarty, M. (2005). Multimedia learning about physical systems. In R. E. Mayer (Ed). Cambridge handbook ofmultimedia learning. New York, NY: Cambridge University Press.
Hegarty, M., & Just, M. A. (1993). Constructing mental models of machines from text and diagrams. Journal ofMemory & Language, 32(6), 717 – 742.
Hegarty, M., Kriz, S., & Cate, C. (2003). The roles of mental animations and external animations in understandingmechanical systems. Cognition and Instruction, 21(4), 325 – 360.
Hegarty, M., & Sims, V. K. (1994). Individual differences in mental animation during mechanical reasoning.Memory & Cognition, 22(4), 411 – 430.
Hochberg, Y., & Benjamini, Y. (1990). More powerful procedures for multiple significance testing. Statistics inMedicine, 9, 811 – 818.
Holt Science & Technology. (2007). Austin, TX: Holt, Rinehart, & Winston.Hulleman, C. S., & Cordray, D. S. (2009). Moving from the lab to the field: The role of fidelity and achieved
relative intervention strength. Journal of Research on Educational Effectiveness, 2(1), 88 – 110.Hunt, E., & Minstrell, J. (1994). A cognitive approach to the teaching of physics. In K. McGilly, (Ed.), Classroom
lessons: Integrating cognitive theory and classroom practice (pp. 51 – 73). Cambridge, MA: MIT Press.
Science Education, Vol. 00, No. 0, pp. 1–30 (2016)
30 CROMLEY ET AL.
Jian, Y.-C., & Wu, C.-J. (2015). Using eye tracking to investigate semantic and spatial representations of scientificdiagrams during text-diagram integration. Journal of Science Education and Technology, 24(1), 43 – 55.
Kindfield, A. C. H. (1993/1994). Biology diagrams: Tools to think with. The Journal of the Learning Sciences, 3,1 – 36.
Kozhevnikov, M., Motes, M., & Hegarty, M. (2007). Spatial visualization in physics problem solving. CognitiveScience, 31(4), 549 – 579.
Kragten, M., Admiraal, W., & Rijlaarsdam, G. (2015). Students’ learning activities while studying biologicalprocess diagrams. International Journal of Science Education, 37(12), 1915 – 1937.
Larkin, J. H., & Simon, H. A. (1987). Why a diagram is (sometimes) worth ten thousand words. Cognitive Science,11(1), 65 – 100.
Mayer, R. E. (2005). Cognitive theory of multimedia learning. In R. E. Mayer (Ed). Cambridge handbook ofmultimedia learning. New York, NY: Cambridge University Press.
McTigue, E. M. & Croix, A. (2010). Illustration inquiry: Visual literacy in science. Science Scope, 33, 17 – 22.Mullis, I. V. S., Martin, M. O., Ruddock, G. J., O’Sullivan, C. Y., & Preuschoff, C. (2009). TIMSS 2011 assessment
frameworks. Chestnut Hill, MA: TIMSS & PIRLS International Study Center.NGSS Lead States. (2013). Next Generation Science Standards: For states, by states. Washington, DC: National
Academies Press.Orfield, G. (2009). Reviving the goal of an integrated society: A 21st century challenge. Los Angeles, CA: The
Civil Rights Project/ Projecto Derechos Civiles, University of California at Los Angeles.Ozcelik, E., Karakus, T., Kursun, E., & Cagiltay, K. (2009). An eye-tracking study of how color coding affects
multimedia learning. Computers & Education, 53(2), 445 – 453. doi:10.1016/j.compedu.2009.03.002Porter, A. C. (2002). Measuring the content of instruction: Uses in research and practice. Educational Researcher,
31(7), 3 – 14.Porter, A., Polikoff, M. S., Barghaus, K. M., & Yang, R. (2013). Constructing aligned assessments using automated
test construction. Educational Researcher, 42, 415 – 423. doi: 10.3102/0013189X13503038Rawson, K. A., & Dunlosky, J. (2011). Optimizing schedules of retrieval practice for durable and efficient learning:
How much is enough. Journal of Experimental Psychology: General, 140(3), 283 – 302.Rosenshine, B., & Meister, C. (1994). Reciprocal teaching: A review of the research. Review of Educational
Research, 64(4), 479 – 530.Roth, W.-M., & McGinn, M. K. (1998). Inscriptions: Toward a theory of representing as social practice. Review
of Educational Research, 68(1), 35 – 59.Scheiter, K., Gerjets, P., & Catrambone, R. (2006). Making the abstract concrete: Visualizing mathematical
solution procedures. Computers in Human Behavior, 22(1), 9 – 25.Scheiter, K., Schubert, C., Gerjets, P., & Stalbovs, K. (2015). Does a strategy training foster stu-
dents’ ability to learn from multimedia? The Journal of Experimental Education, 83(2), 266 – 289. doi:10.1080/00220973.2013.876603
Schlag, S., & Ploetzner, R. (2011). Supporting learning from illustrated texts: Conceptualizing and evaluating alearning strategy. Instructional Science, 39(6), 921 – 937.
Schonborn, K. J., & Bogeholz, S. (2009) Knowledge transfer in biology and translation across external representa-tions: Experts’ views and challenges for learning. International Journal of Science and Mathematics Education,7, 931 – 955.
Schwamborn, A., Thillmann, H., Opfermann, M., & Leutner, D. (2011). Cognitive load and instructionallysupported learning with provided and learner-generated visualizations. Computers in Human Behavior, 27(1),89 – 93.
Squires, D. A. (2009). Curriculum alignment: Research-based strategies for increasing student achievement.Thousand Oaks, CA: Corwin Press.
Valentine, J. C. (2009). Judging the quality of primary research for research synthesis. In H. Cooper, L. V. Hedges,& J. C. Valentine (Eds.), The handbook of research synthesis and meta-analysis (2nd ed., pp. 129 – 146). NewYork, NY: Russell Sage Foundation.
Won, M., Yoon, H., & Treagust, D. F. (2014). Students’ learning strategies with multiple representations: Expla-nations of the human breathing mechanism. Science Education, 98(5), 840 – 866.
Wu, H. K., Krajcik, J. S., & Soloway, E. (2001). Promoting understanding of chemical representations: Students’use of a visualization tool in the classroom. Journal of Research in Science Teaching, 38(7), 821 – 842.
Science Education, Vol. 00, No. 0, pp. 1–30 (2016)