Embed Size (px)
Citation preview

4825 Mark Center Drive • Alexandria, Virginia 22311-1850
CRM D0014799.A2 / FinalOctober 2006
Improving Navy’s Buying Power Through Cost Savings
Jino Choi • Omer Alper • James Jondrow John Keenan • Richard SperlingMichael Gessner

This document represents the best opinion of CNA at the time of issue.It does not necessarily represent the opinion of the Department of the Navy.
Cleared for public release. Specific authority: N00014-05-D-0500.Copies of this document can be obtained through the Defense Technical Information Center at www.dtic.milor contact CNA Document Control and Distribution Section at 703-824-2123.
Copyright © 2006 The CNA Corporation
Approved for distribution: October 2006
Jino Choi, DirectorCost and Acquisition TeamResource Analysis Division
Contents
Summary . . . . . . . . . . . . . . . . . . . . . . . . . . . . . . 1
Introduction . . . . . . . . . . . . . . . . . . . . . . . . . . . . 3Background. . . . . . . . . . . . . . . . . . . . . . . . . . 3Sponsor and objective . . . . . . . . . . . . . . . . . . . . 4Our approach . . . . . . . . . . . . . . . . . . . . . . . . 4Organization of the paper . . . . . . . . . . . . . . . . . . 4
Manning issues. . . . . . . . . . . . . . . . . . . . . . . . . . . 7Civilianization . . . . . . . . . . . . . . . . . . . . . . . . 7
Military-civilian hybrid crews . . . . . . . . . . . . . . 7Applying civilian practices to military crews . . . . . . 8Potential risks . . . . . . . . . . . . . . . . . . . . . . 9
Competitive sourcing . . . . . . . . . . . . . . . . . . . . 10Function-specific estimates . . . . . . . . . . . . . . . 13
Decrewing . . . . . . . . . . . . . . . . . . . . . . . . . . 14Findings . . . . . . . . . . . . . . . . . . . . . . . . . 15Methodology . . . . . . . . . . . . . . . . . . . . . . 15Accomplishment of the ship force work package . . . 17Overhauls examined . . . . . . . . . . . . . . . . . . 18Post overhaul readiness. . . . . . . . . . . . . . . . . 18
Sea-shore ratio . . . . . . . . . . . . . . . . . . . . . . . . 19Assigning pilots more intensively to flying billets . . . 20
Personnel compensation . . . . . . . . . . . . . . . . . . . . . 23Retirement . . . . . . . . . . . . . . . . . . . . . . . 24Non-quantifiable compensation initiatives . . . . . . 24
Ship issues . . . . . . . . . . . . . . . . . . . . . . . . . . . . . 27Crew rotation . . . . . . . . . . . . . . . . . . . . . . . . . 27Ship maintenance . . . . . . . . . . . . . . . . . . . . . . 28
Aviation issues . . . . . . . . . . . . . . . . . . . . . . . . . . . 31Reducing resupply time for stocks of spare parts . . . . . . 32
i

Sharing AVCALs . . . . . . . . . . . . . . . . . . . . . . . 32Managing aircraft wear. . . . . . . . . . . . . . . . . . . . 32Reducing flight hours early in the training cycle . . . . . . 33
T&E savings . . . . . . . . . . . . . . . . . . . . . . . . . . . . 35
Reducing electricity cost . . . . . . . . . . . . . . . . . . . . . 43
Shipbuilding and aircraft procurement issues . . . . . . . . . . 45Savings from best practices and lean manufacturing
in ship building . . . . . . . . . . . . . . . . . . . . . . . 45Savings from lean principles in aircraft production . . . . 47
Other potential for savings . . . . . . . . . . . . . . . . . . . . 49BRAC . . . . . . . . . . . . . . . . . . . . . . . . . . . . . 49
Conclusions and recommendation . . . . . . . . . . . . . . . . 51
References . . . . . . . . . . . . . . . . . . . . . . . . . . . . . 53
List of tables . . . . . . . . . . . . . . . . . . . . . . . . . . . . 59
Distribution list . . . . . . . . . . . . . . . . . . . . . . . . . . 61
ii
Summary
The Department of the Navy wants to recapitalize but finds that itdoes not have as much buying power as it used to. Last year, Centerfor Naval Analyses examined the trends in the Navy's budgets andprices to understand why the Navy could not buy as many weaponsplatforms as it used to. Basically, it found that the Navy had less tospend on procurement than before and that the Navy's mix of shipsand aircraft cost more on average now than before. To reverse thetrend and buy more platforms, the Navy needs to devote more moneyfor procurement and/or buy less expensive platforms. This study,sponsored by the Deputy Assistant Secretary of the Navy (Manage-ment and Budget), examined various initiatives or savings opportuni-ties that would allow the Navy to allocate more money forprocurement.
Our overall approach was to compile a set of cost savings initiatives,most of which have been identified in previous studies, assess them,and project the overall savings.1 As a part of the assessment, we exam-ined risks associated with each of the initiatives (such as reducedreadiness or retention) and factors that may hinder effective imple-mentation of the initiatives (such as cultural and political barriers).
Table 1 summarizes the specific initiatives, along with the potentialsavings from their full implementation. Taken together, the total sav-ings from these initiatives are about $7 billion to $10 billion. To putthe savings figures in context, they represent 5 to 8 percent of theNavy’s annual budget.
The Navy has control over implementation of all of these ideas,except reforming military retirement pays (the low end of the savingsrange does not include this savings). As mentioned, we assessed the
1. Center for Naval Analyses had undertaken a similar endeavor a fewyears ago with a comparable approach in [1].
1

risk associated with each of these initiatives and deemed most to beminimal to moderate risk in terms of cost uncertainty, effects onreadiness, or other effectiveness measures. Nonetheless, tough deci-sions must be made and cultural and other barriers must be over-come before the Navy may reap the savings. In addition, individualinitiatives, the savings figures, and the associated risks should be morethoroughly assessed before the Navy decides to implement changes.However, this study suggests that there are ample opportunities forsavings that could contribute substantially toward improving theNavy's buying power.
Table 1. Cost-cutting initiatives
Ideas for savingsPotential annual
savingsReducing ship manning through Mil-Civ conversion of some functions
$750M
Using more experienced and specialized sailors and longer tours
$410M
Competitive sourcing $2.5B - $4.3BDecrewing during overhauls $280MReducing shore-based pilots $490MAdjusting to optimal reenlistment rates $17M - $85MReforming military retirement pay Up to $780MApplying crew rotation to cruisers and destroyers $670MUsing changes in depot maintenance norms $600MReducing supply time for AVCALs and SHORECALs $200MSharing AVCALs among carriers $10MManaging aircraft fatigue life $200MReducing flight hours early in training cycle $300MSavings in test and evaluation (T&E) $80MReducing electricity costs $10MApplying lean manufacturing to Navy shipbuilding $430MApplying lean manufacturing to defense aircraft industry Up to $800MSum $6.9B - $10.4B
2
Introduction
Background
An earlier CNA study [2] examined the trends in the Navy's budgetsand prices to understand why the Navy could not buy as many plat-forms as it used to. One of the findings was that the Navy had $4 bil-lion (or 12 percent) less to spend on procurement in FY 2006 thanthe 30-year average. The reasons for the lower procurement levelincluded: lower than average Navy topline, historical high spendingin Research and Development (RDT&E), and Military Personnel andOperations and Maintenance accounts that had not come down asmuch as endstrength and force size (number of ships and aircraft).CNA is currently examining the longer-term (60 years) trends for themajor appropriations within the Navy budget and inferences for thefuture.2
This relatively low level of procurement, coupled with CNO Mullen'slong-term shipbuilding plan that calls for the development of313-ship Navy over the next 30 years, require analysis of potential sav-ings from the Navy’s nonprocurement accounts that could be usedfor the recapitalization goal. The Secretary of the Navy “speculatedthat the Navy could find excesses in operations and maintenance,personnel accounts and other aspects of the Navy budget.”3
2. This study, to be completed early 2007, is examining issues such as: Willthe Navy's projected budget allow buying and sustaining a 313-shipbattle force?
3. “Winter, Mullen Discuss Ways to Achieve Long-Term ShipbuildingPlan,” Inside the Navy, 19 Jun 2006.
3
Sponsor and objective
This study, tasked by the Deputy Assistant Secretary of the Navy (Man-agement and Budget), analyzes ways to improve the Navy’s buyingpower by examining various cost savings initiatives. Studies such asthe one by the Congressional Budget Office suggest the Navy’sbudget is inadequate for its shipbuilding plan.4 This study does notexplicitly address the affordability issue, but it does suggest ways tomake the shipbuilding plan more achievable.
Our approach
Three ways to improve the Navy’s buying power are: (1) obtaininghigher topline and putting more money into procurement, (2) shift-ing money from nonprocurement accounts to procurement, and (3)making greater use of every dollar in procurement. This study focuseson the second means of achieving greater buying power.
Our overall approach was to compile a set of cost savings initiatives,most of which had been identified in previous studies, assess them,and project the overall savings. As a part of the assessment, we exam-ine risks associated with each of the initiatives (such as reduced readi-ness or retention) and factors that may hinder effectiveimplementation of the initiatives (such as cultural and political barri-ers).
Organization of the paper
This paper discusses cost-saving strategies and initiatives for variousaspects of the Navy budget, in the following order:
• Manning issues, including civilianization of part of ship man-ning, competitive sourcing, and partially decrewing Navy sur-face ships during long-term overhauls. We also discuss
4. A recent Congressional Budget Office study [3] states that the “Navyestimates that procuring those new ships would cost about $14.4 billiona year, whereas CBO estimates that they would cost an average of about$19.5 billion annually”.
4
personnel compensation issues, including pay, incentives, andretirement benefits.
• Ship use and maintenance changes.
• Initiatives associated with aircraft usage and support.
• Test and Evaluation (T&E).
• Reductions in electricity costs.
• Best practices and lean manufacturing and their application toNavy shipbuilding and the defense aircraft industry could gen-erate savings.
• The 2005 Base Realignment and Closure (BRAC), an initiativefor which most of the savings may already have been ear-marked.
5

This page intentionally left blank.
6

Manning issues
For FY 2006 the Department of the Navy (DON) anticipates havingendstrength of 353,000 active duty Navy personnel and 175,000 activeduty Marines. The Department also expects an endstrength of about192,500 civilian full-time equivalents (FTEs) [4,5].5 Military person-nel, Navy (MPN) and military personnel, Marine Corps (MPMC) esti-mated costs for FY 2006 are $24.8 billion and $10.4 billion,respectively. The total payroll costs for the civilian employees accountfor an estimated $15.6 billion6 in FY 2006. Direct personnel compen-sation costs,7 therefore, account for around $50 billion, or 38 percentof the Navy’s total obligational authority of $132.5 billion for FY 2006.
The potential savings from personnel initiatives presented here total$3.7 -- $6.7 billion annually, which represents approximately 7–13 per-cent savings.
Civilianization
Military-civilian hybrid crews
Recent literature highlights substantial savings that may be realizedfrom civilianizing parts of ship manning. In [6] the authors estimatethat partially civilianizing the USS Mount Whitney (LCC-20) command
5. According to [5], approximately 164,300 of these civilians are Navy,18,300 are Marine Corps, and 9,900 are departmental.
6. We estimate this as total Department of Navy civilian FTEs (192,500)multiplied by the DOD average pay per civilian FTE in FY 2006($81,000).
7. The MPN and MPMC figures reported here contain some items that arenot direct compensation, such as the social security tax paid by the Navyand personnel change of station (PCS) costs. Also, the appropriationscontain the accrual value of retirement and retiree health care benefits.
7
ship using Military Sealift Command (MSC) civilian mariners savesabout $45 million per year.
The study estimates that adapting this hybrid manning model to civil-ian-man basic supply, food service, and ship’s service (store, barbers,and laundry) on all surface combatants could save $750 million annu-ally and reduce Navy endstrength by about 21,700. Reference [7] esti-mates that turning over ship’s services to MSC would saveapproximately $30 million per year per command ship (four in total).This was similar in flavor to the actual manning plan adopted on theUSS Mount Whitney. The savings in this paper are echoed by anotherCNA study [8] that identifies prospective savings of $23 million to$31 million per carrier per year, or $390 million per year Navy-wide,through smaller, partially civilianized crews.
Applying civilian practices to military crews
As an alternative to replacing military manpower with civilian man-power on ships, another study suggested adopting some of the man-ning practices used by MSC, but with military crews. The savingsidentified in [9] would stem from having fewer, but more experi-enced and specially-trained, officers and sailors. Adopting a two-trackcareer path for officers—operations and engineering—is likely toresult in better engineering management using fewer personnel.
Increasing tour lengths/reducing turnover
Reference [10] estimates that a 10 percent reduction in turnoverwould allow getting the same readiness with 1.43 percent fewer per-sonnel. Civilian ship manning practices typically involve longer toursand lower turnover than current Navy practice, suggesting potentialsavings. In [9] the authors estimate that a 10 percent reduction inturnover carried through to all surface ships would imply annual sav-ings of $152 million.
Reducing time sailors assigned to jobs outside of their training
Reference [9] also estimates that the practice of assigning technicallytrained sailors to menial jobs for the first few months on board coststhe Navy $30 million annually in loss of skills. In addition, the Navytends to provide more narrow training to sailors, which reduces
8
average training time but increases the number of personnelrequired on ship.
Adopting more flexible force-shaping tools
Reference [9] also provides an estimate for one officer community ofthe cost of the closed-loop military manpower system. As of Decem-ber 2004, the Navy carried 1,125 junior Surface Warfare Officers inexcess of requirements (at an estimated cost of $150 million) in prep-aration for future, more senior billets. Reference [8] surveyed115 combatants and found 1,634 overmanned enlisted billets at a costof $80 million per year. Reference [8] notes that one way to reducethese costs would be to move away from the pyramid-shaped work-force profile toward an oval-shaped one using lateral entry. The studyalso notes that “smart ship” and the optimal manning experimenthave reduced some of the watchstanding requirements on USN ships,but more can be done.
Potential risks
Reference [9] discusses at length various performance metrics ofMSC-manned ships and Navy equivalents. The data show that for allthe metrics measured, the smaller MSC crews perform as well as orbetter than the Navy crews. This suggests there is likely to be minimalrisk to mission performance associated with either civilian manningor adopting civilian manning practices. The USS Mount Whitney hasnot encountered problems or has found a way to deal with problemsthat arise when a sizeable fraction of the crew is civilian. Also, ifapplied to all surface combatants, hybrid manning would requireMSC to increase its manning four-fold, from approximately 4,000 toover 17,000. Reference [9] suggests a phased approach to implemen-tation. Finally, adopting civilian manning practices would requireintroducing new force management tools to help move toward anoval force structure. Longer tours may reduce retention, but that maybe countered by the benefits of sailors avoiding mess duty upon initialarrival to the ship.
9

Competitive sourcing
To conduct a current assessment of the potential savings availablefrom competitive sourcing, we consulted DON’s most recent (2005)Inherently Governmental and Commercial Activities (IGCA) inven-tory. This database revealed 73,176 positions which DON has codedas “R - Subject to Review for Competition Under OMB Circular No.A-76,” of which 27,273 are nonoperational active-duty military. Thisrepresents the most conservative count of the positions that can becompeted through A-76, and is the basis for the low end of our esti-mated potential savings range.
The top of the savings range estimate reflects a less restrictiveapproach to coding and assumes that, in the long run, authorizationscould be made available for competition if policy, procedural, or cul-tural changes were put in place. The types of changes required aresignificant and include, for example, lengthening time at sea toreduce authorizations for sea-shore rotation.8 It is unlikely that the
Table 2. Civilian manning or practices: savings, description, and risks
Annual Savingsa Description Risks$750 million Substantial ship manning reduc-
tion by converting galley, basic supply and ship’s service to civil-ian manning
Minimal: Needs to be phased in to allow MSC to ramp up
$410 million Ship (and implied shore) man-ning reductions from better assignment of skilled sailors, using more experienced and spe-cialized sailors/officers and longer tours.
Moderate: Longer tours may affect retention; transition to oval vs. pyramid inventory requires additional force management tools/policy changes
a. Note that the $750 million savings from civilianizing by definition would include a large part of the $410 million potential savings from adopting civilian practices only. To be conservative, we assume a maximum savings of $750 million from this set of initiatives, although slightly more may be possible if civilian practices are applied to the remaining military portion of the hybrid crews.
8. Reference [11] addresses the potential constraint on the degree of out-sourcing posed by the Navy’s sea-shore rotation policy. A sea-shorepolicy of 4:3 implies that only 17–24 percent of shore billets would beavailable for outsourcing.
10
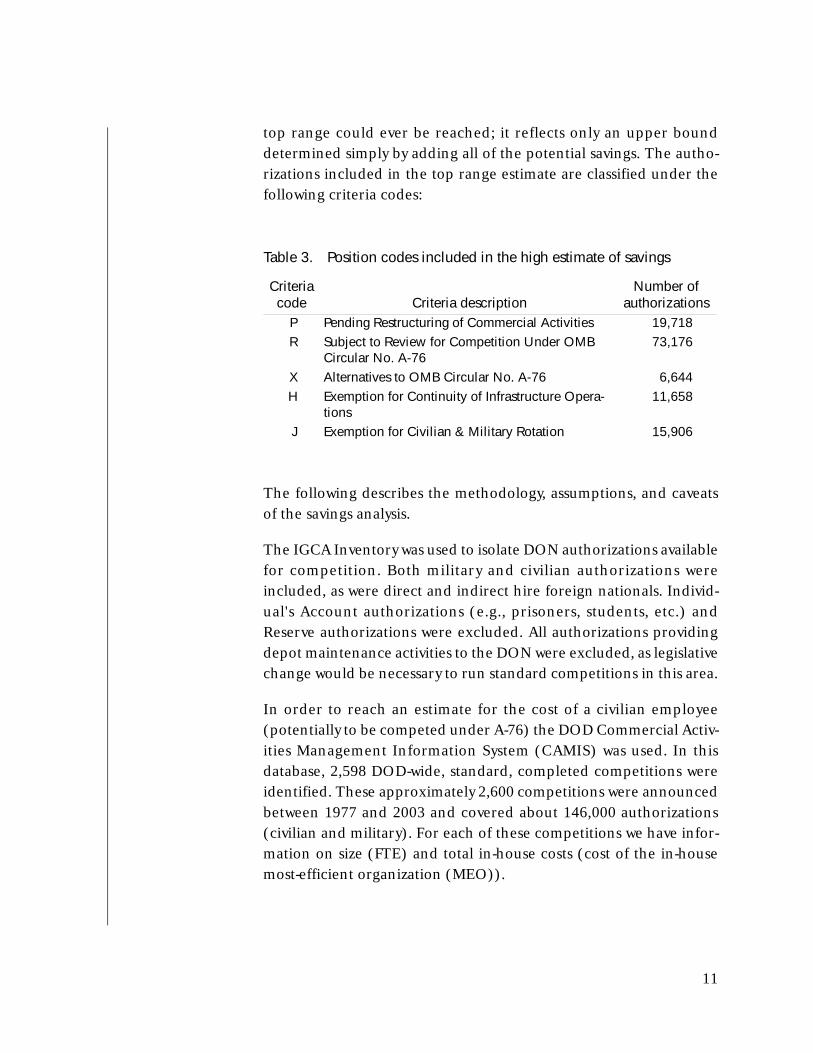
top range could ever be reached; it reflects only an upper bounddetermined simply by adding all of the potential savings. The autho-rizations included in the top range estimate are classified under thefollowing criteria codes:
The following describes the methodology, assumptions, and caveatsof the savings analysis.
The IGCA Inventory was used to isolate DON authorizations availablefor competition. Both military and civilian authorizations wereincluded, as were direct and indirect hire foreign nationals. Individ-ual's Account authorizations (e.g., prisoners, students, etc.) andReserve authorizations were excluded. All authorizations providingdepot maintenance activities to the DON were excluded, as legislativechange would be necessary to run standard competitions in this area.
In order to reach an estimate for the cost of a civilian employee(potentially to be competed under A-76) the DOD Commercial Activ-ities Management Information System (CAMIS) was used. In thisdatabase, 2,598 DOD-wide, standard, completed competitions wereidentified. These approximately 2,600 competitions were announcedbetween 1977 and 2003 and covered about 146,000 authorizations(civilian and military). For each of these competitions we have infor-mation on size (FTE) and total in-house costs (cost of the in-housemost-efficient organization (MEO)).
Table 3. Position codes included in the high estimate of savings
Criteria code Criteria description
Number ofauthorizations
P Pending Restructuring of Commercial Activities 19,718 R Subject to Review for Competition Under OMB
Circular No. A-7673,176
X Alternatives to OMB Circular No. A-76 6,644 H Exemption for Continuity of Infrastructure Opera-
tions11,658
J Exemption for Civilian & Military Rotation 15,906
11

Assuming that a) the composition of the MEOs are a reasonableproxy for the composition of the DON workforce available for com-petition, and b) that the overwhelming majority of MEO costs arepersonnel costs and benefits, a cost per civilian FTE can be estimated.By annualizing total MEO costs and dividing by size of MEO, a costper FTE is developed for each specific competition. Median cost perFTE was about $99,980 (in 2006 dollars).9
Another estimate of average civilian cost can be obtained by calculat-ing average civilian payroll for DOD in FY 2005 (approximately$81,000) and escalating by the Office of the Secretary of Defense(OSD) Comptroller’s fringe benefits multiplier for the Navy of29.5 percent. This yields an estimated cost per civilian of $104,900. Tobe conservative, we use the lower cost estimate ($99,980) in the sav-ings figures reported here.
In order to estimate a savings rate, the CAMIS data was used again.For each completed DON competition the expected savings was cal-culated as compared to baseline. A weighted average was taken basedon size (FTE) of competition. The expected savings rate was calcu-lated at 34 percent. This rate is based on the population of DON com-petitions announced between 1977 and 2003. Long run trend analysisshow this rate steadily increasing, therefore the 34 percent savingsrate can be viewed as conservative.
9. There are a few caveats to bear in mind when using estimates of civiliancosts based on CAMIS data. 1) The total in-house cost estimate includesbenefits, i.e., it is designed to be fully burdened cost. 2) There are othercosts beyond personnel in the in-house cost estimate. While these havetraditionally been small, they are not insignificant and do artificiallyinflate the $99,980 estimate. 3) The data covers 1977 to 2003. Most ofthe earlier competitions covered traditional “blue collar” activities (e.g.,facility maintenance, vehicle operation, etc.). While this type of compe-tition still occurs, the trend in recent years has been toward more pinkor white collar activities (e.g., IT, accounting, human resources, etc.)which have higher pay grades as compared to the traditional blue collaractivities. So, the $99,980 estimate in this case may be conservative giventhe expectation that competitions will involve higher paid positions inthe future. Given all these caveats, the $99,980 estimate is probably fairlyaccurate.
12
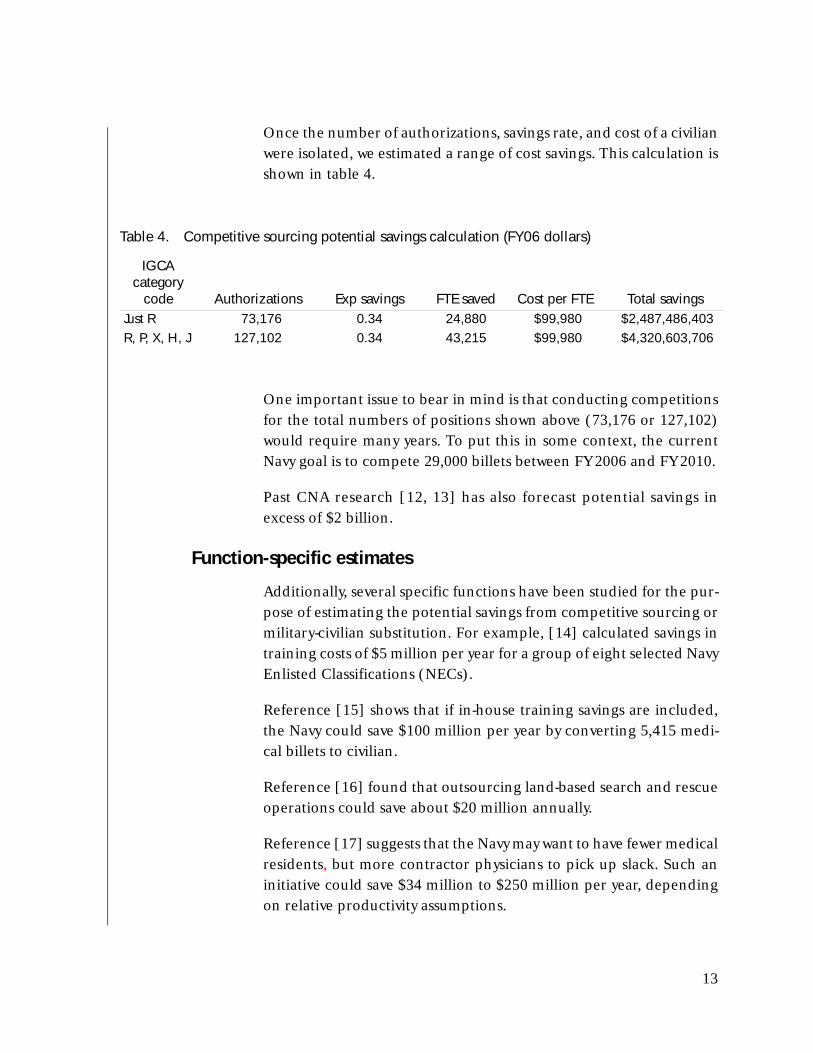
Once the number of authorizations, savings rate, and cost of a civilianwere isolated, we estimated a range of cost savings. This calculation isshown in table 4.
One important issue to bear in mind is that conducting competitionsfor the total numbers of positions shown above (73,176 or 127,102)would require many years. To put this in some context, the currentNavy goal is to compete 29,000 billets between FY 2006 and FY 2010.
Past CNA research [12, 13] has also forecast potential savings inexcess of $2 billion.
Function-specific estimates
Additionally, several specific functions have been studied for the pur-pose of estimating the potential savings from competitive sourcing ormilitary-civilian substitution. For example, [14] calculated savings intraining costs of $5 million per year for a group of eight selected NavyEnlisted Classifications (NECs).
Reference [15] shows that if in-house training savings are included,the Navy could save $100 million per year by converting 5,415 medi-cal billets to civilian.
Reference [16] found that outsourcing land-based search and rescueoperations could save about $20 million annually.
Reference [17] suggests that the Navy may want to have fewer medicalresidents, but more contractor physicians to pick up slack. Such aninitiative could save $34 million to $250 million per year, dependingon relative productivity assumptions.
Table 4. Competitive sourcing potential savings calculation (FY06 dollars)
IGCA category
code Authorizations Exp savings FTE saved Cost per FTE Total savingsJust R 73,176 0.34 24,880 $99,980 $2,487,486,403R, P, X, H, J 127,102 0.34 43,215 $99,980 $4,320,603,706
13
Reference [18] calculates that, holding endstrength constant, DODcan save $20 million annually by offering bonuses to hire private-sector trained medical specialists in shortage. The source of savings islower in-house training costs stemming from the reduction in medi-cal personnel from specialties that are in surplus (those in whichinventory exceeds requirements).
Reference [19] compares costs for three enlisted active duty coursestaught in-house vs. in community colleges. For the courses examined,it found that the community colleges costs were one-sixth those of theNavy.
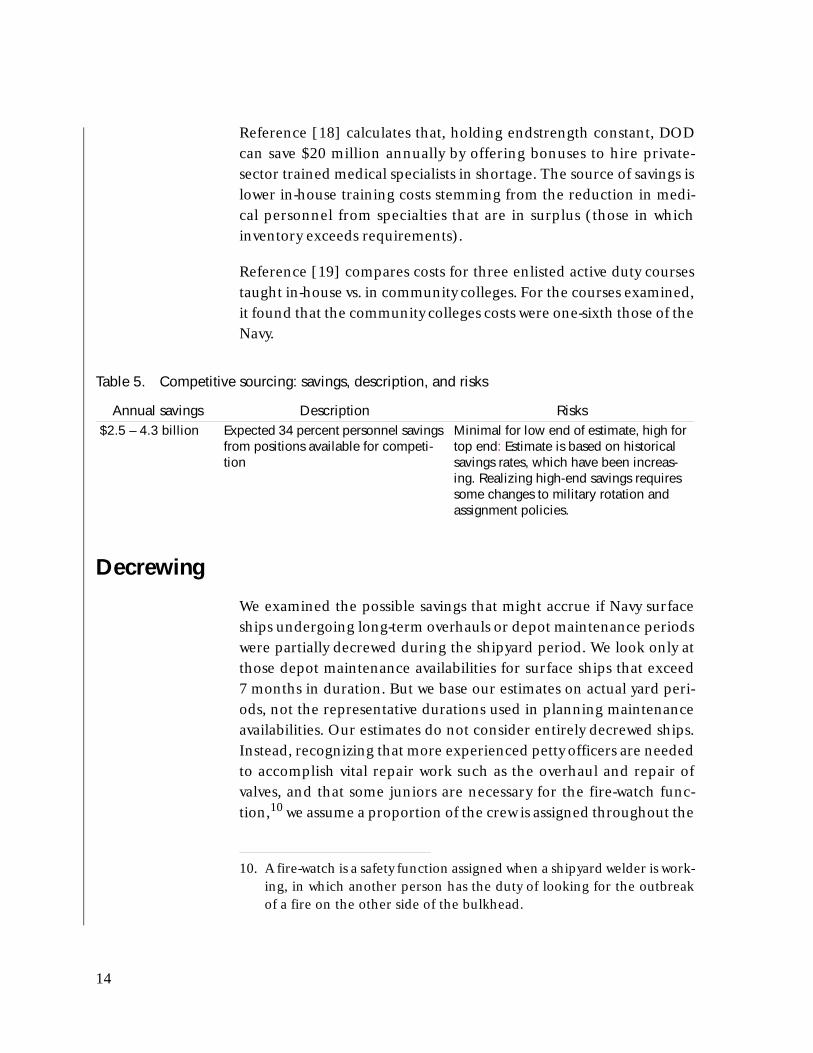
Decrewing
We examined the possible savings that might accrue if Navy surfaceships undergoing long-term overhauls or depot maintenance periodswere partially decrewed during the shipyard period. We look only atthose depot maintenance availabilities for surface ships that exceed7 months in duration. But we base our estimates on actual yard peri-ods, not the representative durations used in planning maintenanceavailabilities. Our estimates do not consider entirely decrewed ships.Instead, recognizing that more experienced petty officers are neededto accomplish vital repair work such as the overhaul and repair ofvalves, and that some juniors are necessary for the fire-watch func-tion,10 we assume a proportion of the crew is assigned throughout the
Table 5. Competitive sourcing: savings, description, and risks
Annual savings Description Risks$2.5 – 4.3 billion Expected 34 percent personnel savings
from positions available for competi-tion
Minimal for low end of estimate, high for top end: Estimate is based on historical savings rates, which have been increas-ing. Realizing high-end savings requires some changes to military rotation and assignment policies.
10. A fire-watch is a safety function assigned when a shipyard welder is work-ing, in which another person has the duty of looking for the outbreakof a fire on the other side of the bulkhead.
14
overhaul. However, that proportion retained is not sufficient to per-form the typical less desirable maintenance jobs in the ship forcework package, and work planning must be adjusted accordingly. Also,the skeleton crew retained is not sized to perform a variety of servicesfor the crew such as food preparation and food service functions,compartment cleaning and head cleaning functions, or typical quasi-security functions such as parking lot security patrols.
Findings
We estimate that annual saving of as much as $295.9 million inFY 2008 values is possible by adapting a new policy to partially decrewsurface ships of the Navy in long-term overhauls. We have includedDocking Planned Incremental Availabilities (DPIAs) for CVNs thatare typically about 10.5 months long, but not the shorter non-dockingPIA events that are usually less than 7 months long. We have alsoincluded the Refueling Complex Overhaul (RCOH) for the CVNwhich typically is planned for 36 months duration but is often up to10 months longer. Though we consider this event for only partialdecrewing in these calculations, it might be worth considering return-ing to an earlier policy were CVs were decommissioned when inextended overhaul periods. The only other classes considered areamphibious assault ships and surface combatants in long-term main-tenance availabilities. Submarine overhauls are not included in thisassessment.
Methodology
We reviewed the last 5 years of depot maintenance events as reportedin the summaries of the daily OPREP-3 reports made by each ship anddocumented in the “Ship Employment Histories,” resident at CNA.We excluded all events that did not exceed 7 months in duration. Wethen examined the personnel and billet files that record all personneltransactions in each ship of the Navy. These files are also resident atCNA. For those ships in long-term overhaul we looked at the actualbillet fills for five periods associated with each overhaul. We estab-lished the manning level by pay grade for a point (1) 3 months priorto the overhaul, (2) at the beginning of the overhaul, (3) 3 monthsinto the overhaul, (4) at the end of the overhaul, and (5) 3 months
15
after the date of completion of the overhaul. We were surprised by thelarge number of E-1 and E-2 personnel in each of these crews.
We then took the Composite Standard Rate of each pay grade’s com-pensation as direct costs and indirect MPN and O&M,N associatedwith each paygrade, in the “True Cost of a Sailor” methodology asdeveloped by the Center for Cost Analysis. We used values for FY 2003and escalated to FY 2008.
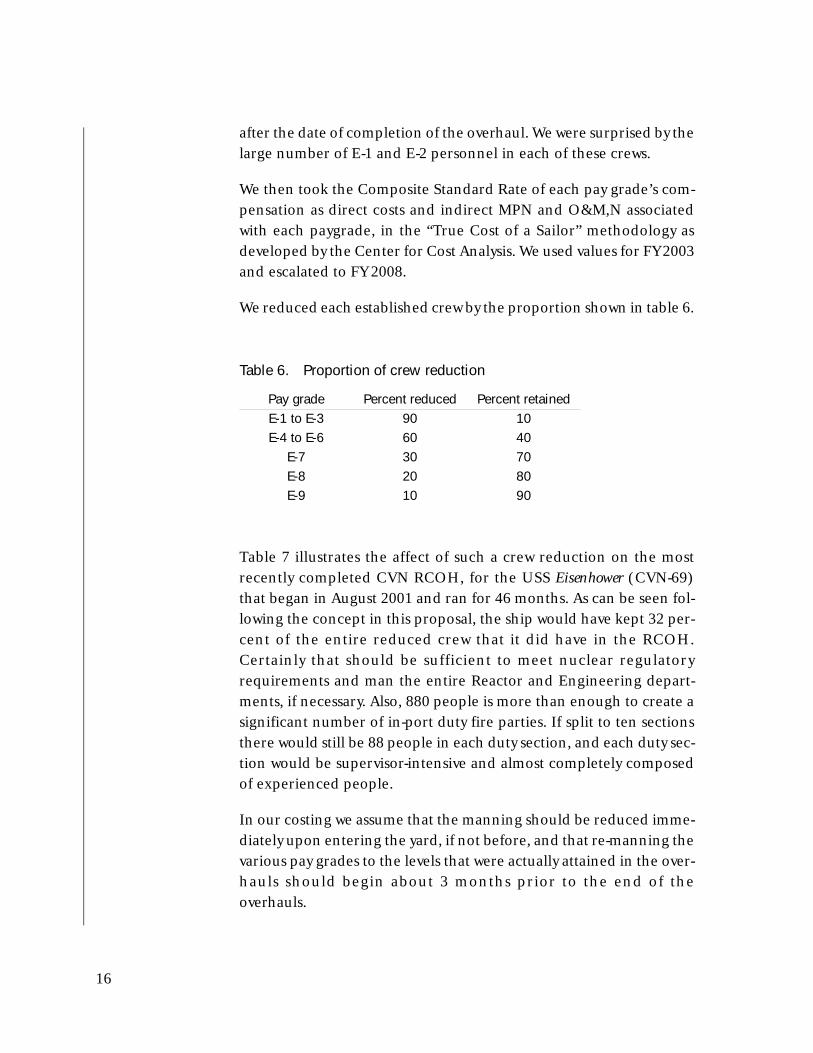
We reduced each established crew by the proportion shown in table 6.
Table 7 illustrates the affect of such a crew reduction on the mostrecently completed CVN RCOH, for the USS Eisenhower (CVN-69)that began in August 2001 and ran for 46 months. As can be seen fol-lowing the concept in this proposal, the ship would have kept 32 per-cent of the entire reduced crew that it did have in the RCOH.Certainly that should be sufficient to meet nuclear regulatoryrequirements and man the entire Reactor and Engineering depart-ments, if necessary. Also, 880 people is more than enough to create asignificant number of in-port duty fire parties. If split to ten sectionsthere would still be 88 people in each duty section, and each duty sec-tion would be supervisor-intensive and almost completely composedof experienced people.
In our costing we assume that the manning should be reduced imme-diately upon entering the yard, if not before, and that re-manning thevarious pay grades to the levels that were actually attained in the over-hauls should begin about 3 months prior to the end of theoverhauls.
Table 6. Proportion of crew reduction
Pay grade Percent reduced Percent retainedE-1 to E-3 90 10E-4 to E-6 60 40
E-7 30 70E-8 20 80E-9 10 90
16

Accomplishment of the ship force work package
In an earlier report [20] in 1999, we were provided estimates of up to$226,000 per man year to contract out the tile work done by juniorNavy sailors in the ship’s force work package. At that time we rejoinedwith the observation that “other studies showed that when such func-tions are competed a man-year cost of less than $30,000 in 1999 valuescan be expected.” Escalating to FY 2008 values indicates such workcould be accomplished for less than $42,000 per man year. Accord-ingly, we have reduced the possible savings of $448.4 million by$152.5 million annually in order to pay for contracting out the ship’sforce work package. That estimate assumes that a number of workers(about 3,600) equivalent to the total number of the E-1 through E-4personnel removed from all 24 ships during long-term overhaul maybe needed to: tile decks; paint compartments; remove dead-endedcables; repair locks, hinges, and door closing mechanism; upgradebunks and lockers; lag pipes, bulkheads, and ventilation ducting;clean and preserve tanks and voids; and clean ventilation ducting. Weanticipate these personnel will also be involved in disposal of hazard-ous materials.
We have left most of the senior petty officers on the ships to performthe more technical repairs, such as repairing valves and overhaulingforklift vehicles, aircraft towing vehicles, and other yellow and whitegear. They also would supervise the juniors11 that remain and
Table 7. Illustrative proportion of crew reduction. USS Eisenhower RCOH
Pay grade Number in crew Number retainedE-1 to E-3 721 72E-4 to E-6 1,843 737
E-7 132 39E-8 37 12E-9 22 20
Total 2,755 880
11. Junior petty officers and none rated personnel.
17

coordinate with the supervisors of the workers performing the ship’sforce work package tasks.
Overhauls examined
We have examined 24 of the Navy surface ship overhauls accom-plished in the last 5-year period. Each has exceeded 7 months in dura-tion, with one, the refueling complex overhaul of USS Eisenhower(CVN-69) extending to 46 months duration, almost 4 years. Figure 1shows the length of time each ship was in the shipyard. The ships areshown in the sequence that the overhauls occurred.
Post overhaul readiness
In the earlier work [20], there was a concern that reducing the size ofa crew while ships are in maintenance will have an adverse effect onreadiness later when the ship is in service. In that report we documentthe record from the early 1980s and found that carriers whose man-ning was reduced did indeed experience readiness problems
Figure 1. Duration of actual overhauls examined
Months in Overhaul
0
5
10
15
20
25
30
35
40
45
50
CVN 65 E
NTERPRISE
CVN 65 E
NTERPRISE
CV 67
KENNEDY JF
CVN 69 E
ISENHOWER DD
LPD
7 CLE
VELAND
LPD
8 DUBUQUE
LPD
9 DENVER
LPD 1
3 NASHVILL
E
LHA
2 SAIPAN
LHA
3 BELL
EAU WOOD
LHA
4 NASSAU
LSD 4
1 WHID
BEY ISLA
ND
LSD 4
1 WHID
BEY ISLA
ND
CVN 71 R
OOSEVELT T
CVN 72 L
INCOLN
A
CG 51
GATES TS
CVN 73 W
ASHINGTON G
CVN 73 W
ASHINGTON G
CG 60
NORMANDY
LHD
1 WASP
CG 65
CHOSIN
CG 66
HUE C
ITY
CVN 74 S
TENNIS JC
CVN 75 T
RUMAN HS
Ship
Mon
ths
Months
18
immediately after the overhauls. We also discovered that such prob-lems were always resolved before the start of the next deployment.
In the 1980s, most of the conventional-powered carriers underwentService Life Extension Periods (SLEP) at the Naval Shipyard in Phil-adelphia. The ships were not decommissioned during these over-hauls, but the crews were reduced substantially.
After the overhauls it took longer than usual to reman the carriers, inpart because the recrewing came at the same time the Navy wasexpanding to 600 ships, with an all-volunteer force. In the short term,the readiness of these carriers, in terms of numbers of missiondegrading CASREPs, was affected.
This suggests that great care and managerial attention is needed toassure the ships are promptly remanned with the right numbers ofappropriate skilled and experienced personnel, long before the over-haul is completed. We believe this is possible as long as the reportingsailors are not diverted to performing the ship’s force work package,and they are allowed to concentrate on getting their ship ready forsea.
Sea-shore ratio
Reference [21] notes that the sea-shore ratio had declined fromaround 1.0 in the 1980s to about 0.8 by 2005 for enlisted personnel,and from 0.5 to 0.4 over the same time period for officers.
Table 8. Decrewing: savings, description, and risks
Annual savings Description Risks$280M Partial decrewing of surface
ships during long-term (more than seven months) overhauls and contracting out the selected jobs in the ship’s force work package.
Minimal to moderate: Readiness problems have been reported immediately after the overhaul, but resolved before the start of next deployment.Remanning must be care-fully managed.
19
The study cautions that we need to understand the structural reasonsunderlying this change before making any policy recommendations.However, the potential savings from returning to the higher sea-shoreratios of the 1980s are substantial. Holding constant the projected seabillets, returning to the sea-shore ratio of the 1980s means it is possi-ble to reduce shore-based endstrength by 20 percent. Future researchmay help us understand the sources of the shift in sea-shore ratios andwhether there are any savings to be had from reversing the trend.
Assigning pilots more intensively to flying billets
Reference [22] illustrates the potential savings the Navy can realizefrom reducing the number of shore-based pilot billets. The Navy hasapproximately two or three pilots per aircraft, a ratio driven to a con-siderable extent by the Navy’s rotation and assignment policies. Thismeans the Navy must train 700 new pilots per year, at a total costbetween $1 billion and $1.5 billion. This works out to about $500,000in training costs per pilot. Even if we assume that only 30 percent ofthe training costs are variable ($300 million), then a 10 percent cutin accessions would lead to a $30 million annual savings.
A recent CNA study considers both undergraduate pilot training andFleet Replacement Squadron costs and has estimated that increasingaviators’ first sea squadron tour of duty from 3 to 5 years wouldreduce the required aviator inventory by 4,000 billets and therebysave $490 million[23]. The savings result from more intensive assign-ment of aviators to sea squadron billets during their first 7 to 10 yearsof service. The sea squadron total man-years requirement can befilled with fewer personnel if each spends more time in a sea squad-ron.
According to [23], required pilot accessions would fall from972 currently to 667 under an alternative. The savings includes$175 million from undergraduate flight training (305 students at$591,000 per student), and $296 million in Fleet Replacement Squad-ron savings (due to 36,000 fewer flight hours). Per capita trainingcosts used in this study come from Taxpayers Per Capita Cost to Train(TAECARS). Note that these are average costs and therefore include
20
many of the fixed costs of pilot training, so these figures may overes-timate potential savings.
Additionally, there is some evidence that the longer tours wouldimprove readiness, as cited in [10].
Potential risks
Increasing the proportion of flying billet duty (or at-sea flying billetduty) in a pilot’s career may have negative retention or attritioneffects, as pilots may have to spend more time away from home. Addi-tionally, continuation to higher ranks will have to be higher than cur-rent rates to fill all legislatively controlled billets. This initiative willalso require a substantial aviation bonus, which would reduce the esti-mated savings reported in the study. The study [23] notes that theNavy will save money on net if the aviation bonus is less than$1.44 million.
Table 9. Assigning pilots more intensively to flying billets: savings, description, and risks
Annual savings Description Risks$490 million Extend aviators’ at sea flying billet tours,
reduce required accessions, training costs
Moderate: May require substantial increase in aviation bonus; includes some fixed costs of training
21

This page intentionally left blank.
22

Personnel compensation
Much of the compensation provided to Navy military and civilians iscontrolled outside of the Navy. Nevertheless, it is useful to highlightsome areas in which savings might be realized.
Reference [24] examines the costs (paying a more senior force) andbenefits (less training and recruitment, higher readiness) of reten-tion, and thus develops rating-specific optimal reenlistment goals forthe Navy. The authors estimate that most enlisted personnel are inratings for which the costs of reenlistment exceed the benefits. Inother words, they conclude that the cost-effective level of reenlist-ment is lower than current goals. Adjusting to the optimal reenlist-ment rates could save the Navy $15 million to $75 million.12 Theauthors caution that the Navy should not make drastic cuts to reen-listment bonuses. Advocating increases in basic pay lower than thosein recent years, without decimating the selective reenlistment bonus(SRB) budget, is a more cost-effective and flexible approach to lower-ing reenlistment.
12. The range is generated by varying the assumption made about whetherthe marginal reenlistment response to additional compensation variesby rating.
Table 10. Adjusting to optimal reenlistment rates: savings, description, and risks
Annual savings Description Risks$15-75 million Move toward cost-effective rating-spe-
cific reenlistment rates by adjusting basic pay
Minimal: Calls for an average reenlist-ment reduction of just 4 percentage points
23
Retirement
An earlier paper [25] estimates that converting to an old-age pensioncoupled with up front active pay increases would save about 4.2 per-cent of the system cost (total lifecycle basic pay plus retired pay for acohort in steady state) while producing the same average experiencelevel. This would amount to about $780 million in savings for DON.The savings stem from reducing the share of compensation that isdeferred, together with the assumption that retention decisionmakers have a discount rate higher than the rate at which the govern-ment can borrow. However, [26] considers several alternatives thatproduce the same experience distribution as under the current systemand finds little difference in costs.
One important qualification for this initiative is that since DON doesnot solely influence the military retirement system, any modificationto policies would require actions by other parties as well.
Non-quantifiable compensation initiatives
There are many other ways the Navy might be able to make its com-pensation system more cost-effective. The potential savings from anyone of these initiatives individually is likely to be small and/or diffi-cult to measure, but when taken together, the savings might be sub-stantial. Reference [27] argues that the force of the future should beoval rather than pyramid. The paper calls for an end to cliff-vestingretirement (becoming eligible for benefits at 20 years of service) andsuggests that the Navy requires lateral entry, pay tied to skill and
Table 11. Reforming military retirement pay: savings, description, and risks
Annual savings Description RisksUp to $780 million Reform retirement pay to an old-age
pension coupled with compensating increases in basic pay (savings result in long run by reducing the present value cost of compensation required to retain the same force)
Moderate: Not fully controlled by DON. Other constraints in manpower system may make potential savings substantially smaller.
24
experience rather than rank, and a two-part retirement plan thatincludes voluntary separation pay.
Reference [28] suggests that incentive pays like voluntary separationshould be narrowly targeted to reduce the amounts paid to those whoelect the voluntary pay but would have left Navy anyway without it.
Reference [22] recommends relaxing the endstrength constraint,retaining a manpower budget constraint instead. Such a policychange would result in savings due to a more efficient personnel mixand better timing of personnel moves and promotions.
In [22], the authors also suggest allowing more choice in rotation.They note that military spouses have lower income when rotation ismore frequent. Finally, they recommend an increased use of pay forperformance.
Reference [29] recommends generally increased flexibility in the waythe Navy compensates its personnel.
25

This page intentionally left blank.
26

Ship issues
The initiatives for ships consider two long-standing questions.
One question is whether the amount of presence provided by surfaceships can be increased. The traditional presence is about 4.5 monthsout of a 24-month cycle. This works out to the Navy’s buying and oper-ating more than five ships for each one forward. How can this ratio of5 to 1 be reduced and what savings would result? Recent studies ofcrew rotation provide the answers to these questions.
A second question is whether it is possible to reduce costs for shipmaintenance. A number of recent changes should provide savings,such as conditional maintenance, the addition of sensors to helpdecide what maintenance is necessary, and the lengthening of thetime between major maintenance availabilities. These would seem tojustify a downward trend in ship maintenance. The instructionsdescribing notional maintenance cycles imply a downward trend; thequestion is whether this trend is evident in the budgets for mainte-nance.
The total potential savings of the two initiatives discussed here totalabout $1.3 billion annually.
Crew rotation
Recent literature suggests that crew rotation can lower the ratio oftotal ships to ships forward. Reference [30] builds on this literatureand estimates savings for the Littoral Combat Ship (LCS). These sav-ings are already built into the LCS budget and so are not counted forthe present study. Further savings would result if rotational crewingwere extended to the Aegis surface combatants (CGs and DDGs).
The potential savings for the Littoral Combat Ship (LCS) are shownin table 12. The savings are derived by comparing the traditional
27

8826
deployment with a deployment involving crew rotation, 4/3/1, whichdenotes 4 crews, 3 hulls generating one ship forward. We have addeda column to show the savings that could result from applying the rota-tion scheme to surface combatants. We have multiplied the savingsfor the LCS by 6 to account for the fact that there are currently abouttwice as many surface combatants as there are planned LCS for 8units of presence (100 surface combatants vice about 50 LCSs) andthat surface combatants have manpower and acquisition costs at leastthree times those planned for LCS.
Whereas crew rotation might postpone new acquisition or modern-ization of surface combatants, the surest savings would be thoseexcluding procurement, about $672 million per year.
Ship maintenance
OPNAV Note 4700 is issued each year, specifying the norms for shipmaintenance. Reference [31] quantifies trends in these norms fromFY 2002 to FY 2005. Over all ship classes taken together, man days ofmaintenance (including continuous maintenance) declined by about16 percent over this period. Time out of service also declined. Costsand savings are calculated including and excluding procurement.
The total budget for ship maintenance has been going up sinceFY 2002. Though the budget declines in the outyears, it does notmeet the FY 2002 actuals, corrected for changes in the norms. Thissuggests that the changes in the norms may not have entered the bud-geting process. If that is the case, since manpower is about 79 percent
Table 12. Estimated savings from crew rotation
Savings from crew rotation: LCS hulls and costs ($M05)1 unit of presence 8 units of presence Aegis ship
savingsTrad 4/3/1 Trad 4/3/1 SavingsHulls 6.1 3.8 Hulls 49.0 30.2 18.8 3Cost per pres $106 $60 Cost $848 $480 $368 (100%) $2,20Cost no proc $45 $31 Cost no proc $360 $248 $112 (30%) $67
Cost proc $488 $232 $256 (70%) $1,53
28
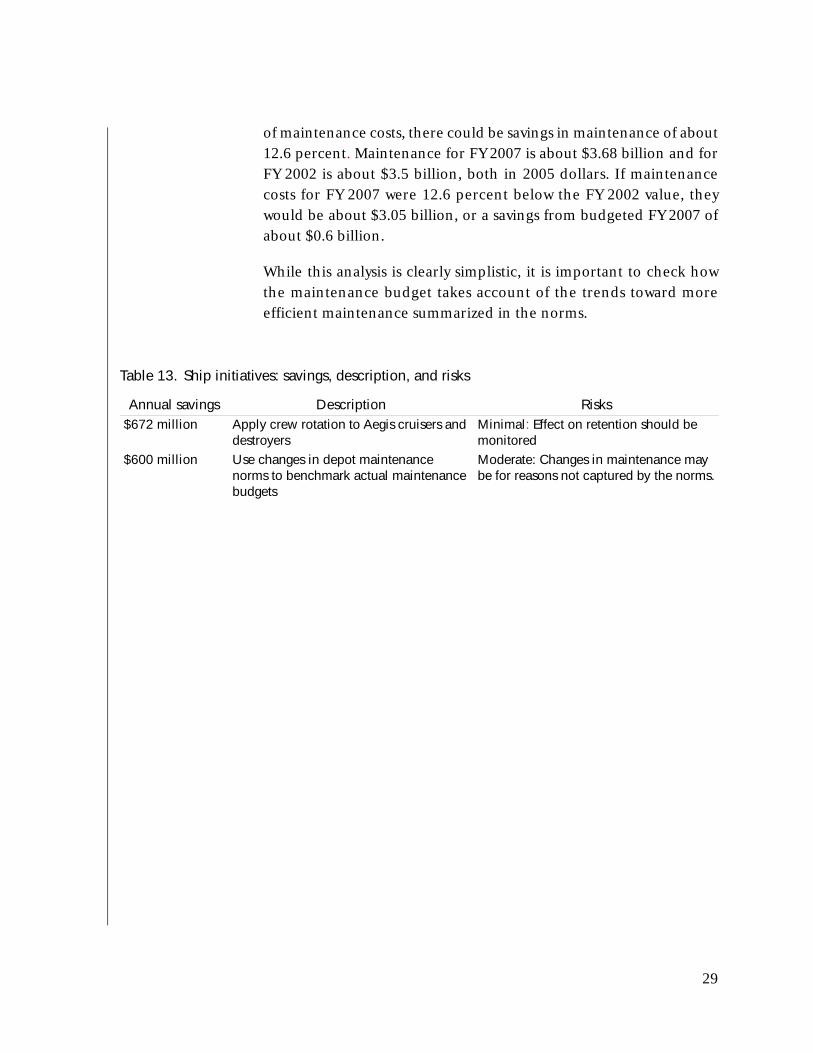
of maintenance costs, there could be savings in maintenance of about12.6 percent. Maintenance for FY 2007 is about $3.68 billion and forFY 2002 is about $3.5 billion, both in 2005 dollars. If maintenancecosts for FY 2007 were 12.6 percent below the FY 2002 value, theywould be about $3.05 billion, or a savings from budgeted FY 2007 ofabout $0.6 billion.
While this analysis is clearly simplistic, it is important to check howthe maintenance budget takes account of the trends toward moreefficient maintenance summarized in the norms.
Table 13. Ship initiatives: savings, description, and risks
Annual savings Description Risks$672 million Apply crew rotation to Aegis cruisers and
destroyersMinimal: Effect on retention should be monitored
$600 million Use changes in depot maintenance norms to benchmark actual maintenance budgets
Moderate: Changes in maintenance may be for reasons not captured by the norms.
29

This page intentionally left blank.
30
Aviation issues
The aviation-related initiatives deal with the stock of spare parts forthe aircraft, the management of aircraft wear, and the reduction ofthe OPNAV minima on flight hours for aircraft.
Costs for the stock of spare parts (AVCAL and SHORECAL)13 areabout $1 billion per year. These are the costs of buying spare parts fornew aircraft, changes in aircraft systems, and changes in the partsthemselves. Two initiatives relate to this stock. First, cutting the resup-ply time for these stocks will result in savings. Second, if operationalplans always involve carriers operating together, the AVCALs for thecarrier airwings can be reduced without reducing wartime readiness.
Aircraft procurement is roughly $5.9 billion per year over the periodFY 2005 to FY 2007. This covers replacing aircraft that wear out withnew aircraft. Reducing the rate of wear would reduce the rate of pro-curement.
The budget for aircraft missions and other aircraft operations isabout $4 billion per year. This budget includes three different catego-ries of flight hours: those required to achieve readiness for surge anddeployment; those required for operations; and those that contributeto neither of the first two categories but are required by the minimaplace by OPNAV instructions. If these flight hours were reduced,there would be savings in operating costs and in procurement.
The aviation initiatives, taken together, account for about $700 mil-lion.
13. Aviation Consolidated Allowance List and Shore Site ConsolidatedAllowance List.
31

Reducing resupply time for stocks of spare parts
A recent study [32] developed a small model relating the parametersof retail inventories and readiness. From running a number of exam-ples with this model it appears that if it were possible to reduce by 50percent the planned resupply time for the AVCALs and SHORECALs,the retail inventory could be cut at least 20 percent without reducingreadiness. This would involve a reduction in resupply time fromabout 20 days to about 10 days.
Since purchases of retail inventories are about $1billion per year, a20-percent reduction would save about $200 million per year.
Sharing AVCALs
Under the Fleet Response Plan, a number of carrier airwings will becapable of surging on short notice. If this surge will be in support ofother carriers in the same operating area, the AVCALs can be shared,reducing the total requirement. Reference [32] gives a variety ofexamples in which two airwings from aircraft carriers operatingtogether can generate the same readiness with smaller AVCALs thanif they were operating separately. The examples all involve savings of12 percent or more.
The AVCAL for a carrier has a value of about $100 million [33] orabout $1 billion for ten airwings. If about 10 percent of the AVCAL isreplaced each year and savings are about 12 percent, the annual sav-ings would be about $1 billion * 10 percent * 12 percent = $12 mil-lion.
Note that the feasibility of this initiative depends critically on beingsure that surging carriers, in time of war, will be supporting and col-located with other carriers.
Managing aircraft wear
Reference [34] notes that making two changes in the management offatigue life expended (FLE) for the FA-18 could save about 6 percentfatigue life. These changes are (1) shifting 50 percent of air-to-air
32
training hours to attack, and (2) restricting transport activities toinvolve simpler forms of flying. The authors estimate that the firstchange would reduce fatigue expenditure by about 5 percent. Thesecond change involves a change in the severity of flying comparableto the first change applying to about 4 percent of total flight hoursvice 17.5 percent for the first change. Thus, we assume the effect isabout 4 percent/17.5 percent * 5 percent = 1 percent. The twochanges together thus reduce fatigue life expended by slightly under6 percent, about 5.8 percent.
This 5.8 percent needs to be adjusted to take account of savings thathave already been taken. Our examination of data on the composi-tion of training flights suggests that the first change above has alreadybeen started, that air-to-air flights have been reduced by about halfthe amount considered above. Thus, about half of the 4.8 percent hasalready been taken, leaving about 2.4 percent, or, including thesecond change, about 3.4 percent.
These changes reduce the present value of future procurement byabout 3.4 percent. Using formulas in [35] this is the equivalent ofbuying 3.4 percent fewer aircraft. If these changes were applied toaverage combat aircraft procurement in FY 2005 to FY 2007 of about$5.9 billion in 2005 constant dollars, it comes to about $200 millionannual savings.
Though air-to-air is rare in combat, training for it consumes 36 per-cent of flight hours. Nevertheless, there could be substantial risk incutting those flight hours too much. The extra training might be jus-tified by the difficulty of the mission. As a hedge, some pilots couldspecialize in this.
Reducing flight hours early in the training cycle
Reference [35] also notes that there are some flight hours early in theairwing workup cycle that, following the OPNAV Flight Hours Readi-ness Model, do not contribute to readiness in the sense of surge.Based on data for the FA-18C, these account for about 18 percent ofthe total flight hour costs.
33

of
is
d n
If these flight hours could be reduced by 20 percent, the savingswould be about 3.6 percent = 18 percent * 20 percent. Applying this3.6 percent reduction to an operations budget of about $4 billion inFY 2005 (mission and other flight operations 1A1A) yields a possiblesavings of about $144 million. Savings related to reducing fatigue lifeexpended would be equal or greater, bringing the total savings up toabout $300 million.
These changes would not come without a substantial risk. The flighthours may be in place for “safety of flight.” They may also contributeto training and readiness in a way not revealed in current models.CNA has an ongoing program of study on these two topics. Results sofar suggest flight hours have an effect on safety of flight and that train-ing early in the workup cycle does have an impact on operationalcapability. These results are not yet at the point of producing equa-tions for programming, but when they reach this point, they shouldbe used to modify the Flight Hour Readiness Model and calculationssuch as those presented in this section. In consequence, we categorizethe risks here as being moderate to high.
Table 14. Aviation initiatives: savings, description, and risks
Annual savings Description Risks$200 million Reducing resupply time for AVCALs
and SHORECALsModerate: Possible unknown costsmaking these reductions
$12 million Sharing AVCALs among carriers deployed in time of war
Moderate to high: Advance notice required for carriers to surge together, otherwise readiness woulbe greatly reduced by the reductioin the AVCAL.
$200 million Managing fatigue life expended. Includes shifting training from air-to-air to strike.
Moderate: Air-to-air is rare in com-bat, but may be a capability that should be protected
$144 million in operations,about $300 million total.
Reducing flight hours early in the training cycle
Moderate to high: May adversely effect training or safety of flight.
34

T&E savings
In 2004, CNO Clark set a goal of reducing test and evaluation (T&E)costs by 20 percent. In that same year the Commander OperationalTest and Evaluation Force (COTF), with support from the AssistantSecretary of the Navy for Research, Development and Acquisition,and the systems commands, led an effort to streamline the T&E pro-cess. Six working groups were established with the goal of developingrecommendations to reduce T&E costs. The working groups arelisted in table 15.
To support the overall effort, the Deputy Assistant Secretary of theNavy for RDT&E asked CNA to assist the Resource Cost workinggroup to assess the impact of the recommendations developed by theworking groups. CNA was assigned two tasks. First, a data call wasdeveloped and sent to 26 Navy managers of major acquisition pro-grams, as detailed in table 16. The purpose of the data call was todetermine how much the programs spent on T&E from FY 2000 toFY 2004, and to use the data to examine trends in T&E spending.Eighteen of the original 26 Navy programs responded to the datacall.
Table 15. T&E working groups
Working group ChairRisk Management CDR James SchmidtTest Planning & Execution (TPE) Jeff BobrowRequirements Rich GilpinModeling & Simulation (M&S) Dr. Charles HutchingsPolicy CDR Bryan HerdlickResource Cost Ramona Franklin
35
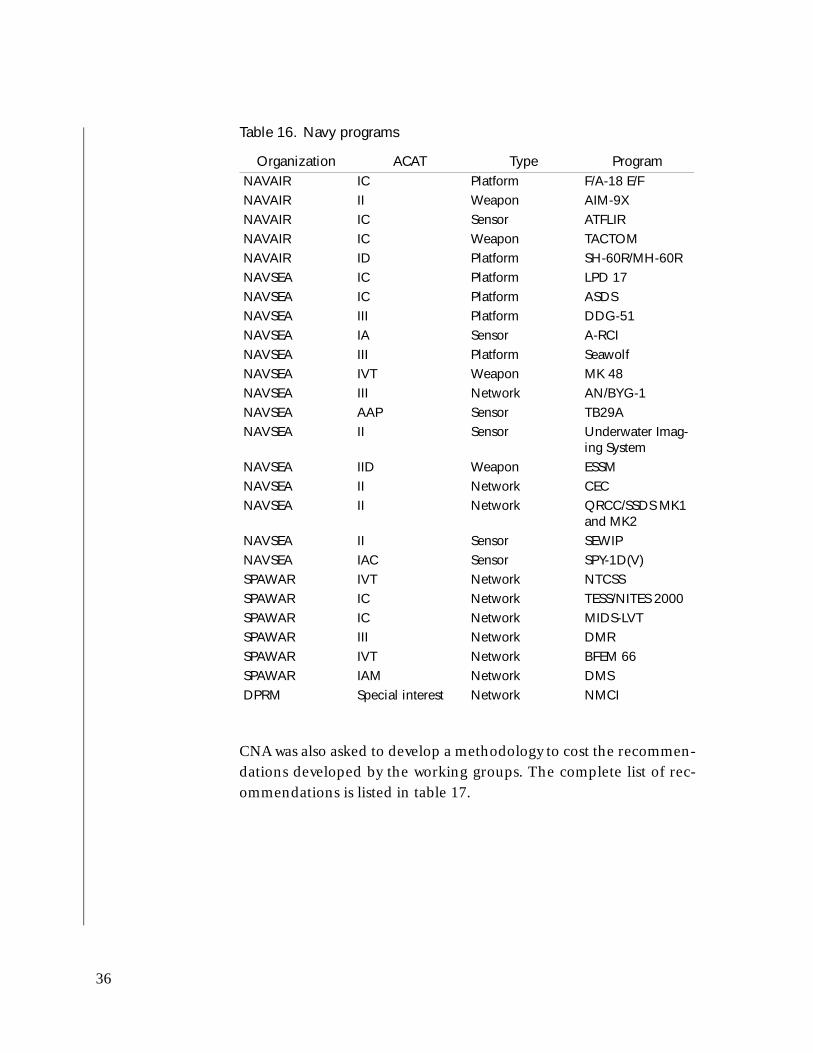
CNA was also asked to develop a methodology to cost the recommen-dations developed by the working groups. The complete list of rec-ommendations is listed in table 17.
Table 16. Navy programs
Organization ACAT Type ProgramNAVAIR IC Platform F/A-18 E/FNAVAIR II Weapon AIM-9XNAVAIR IC Sensor ATFLIRNAVAIR IC Weapon TACTOMNAVAIR ID Platform SH-60R/MH-60RNAVSEA IC Platform LPD 17NAVSEA IC Platform ASDSNAVSEA III Platform DDG-51NAVSEA IA Sensor A-RCINAVSEA III Platform SeawolfNAVSEA IVT Weapon MK 48NAVSEA III Network AN/BYG-1NAVSEA AAP Sensor TB29ANAVSEA II Sensor Underwater Imag-
ing SystemNAVSEA IID Weapon ESSMNAVSEA II Network CECNAVSEA II Network QRCC/SSDS MK1
and MK2NAVSEA II Sensor SEWIPNAVSEA IAC Sensor SPY-1D(V)SPAWAR IVT Network NTCSSSPAWAR IC Network TESS/NITES 2000SPAWAR IC Network MIDS-LVTSPAWAR III Network DMRSPAWAR IVT Network BFEM 66SPAWAR IAM Network DMSDPRM Special interest Network NMCI
36

Table 17. Working group recommendations
Working Group RecommendationTPE Provide full support of the Enterprise T&E Task Force
as chartered by the Corporate Business Council with the goal of better coordination of improving coordi-nation and planning of T&E.
TPE Develop an effective and efficient model that includes an integrated T&E strategy for use in acquir-ing Joint Interoperable Net-Centric FoS and SoS while simultaneously leveraging public-private ventures.
TPE Clearly and explicitly reflect the symbiotic relation-ship between T&E and SE in all Defense Acquisition University (DAU) and SYSCOM training.
TPE As part of the CNO's Human Capital Strategy under Task Force Total Force, and in recognition that T&E is an engineering specialty, develop a progressive T&E career path with incentives comparable to those asso-ciated with other engineering disciplines.
TPE Institute a rigorous and consistent SE risk manage-ment training and implementation strategy through-out the Navy.
TPE Perform robust testing earlier in the development cycle to mitigate the risk of late discovered deficien-cies.
TPE Establish new Navy variable T&E policy and guid-ance that corresponds to differing factors, such as ACAT level or system complexity.
TPE Develop a combination of methodologies for reduc-ing the quantity of tests/test articles while maintaining confidence levels for systems under evaluation.
TPE Develop procedures for FoS/SoS testing that increases the visibility of T&E requirements among programs and optimizes the interconnection of existing naval and DOD facilities for accomplishing T&E on com-plex systems.
TPE Develop process/strategy/philosophy to conduct inte-grated CT/DT/OT, including using the T&E IPT to coordinate DT (including certifications) and OT events and develop and execute an integrated test plan.
Requirements Initiate a study to determine how best to align JCIDS with the budget process.
Requirements Improve the process for requirements generation and refinement of existing requirements/capabili-ties to improve 'testability.’
37
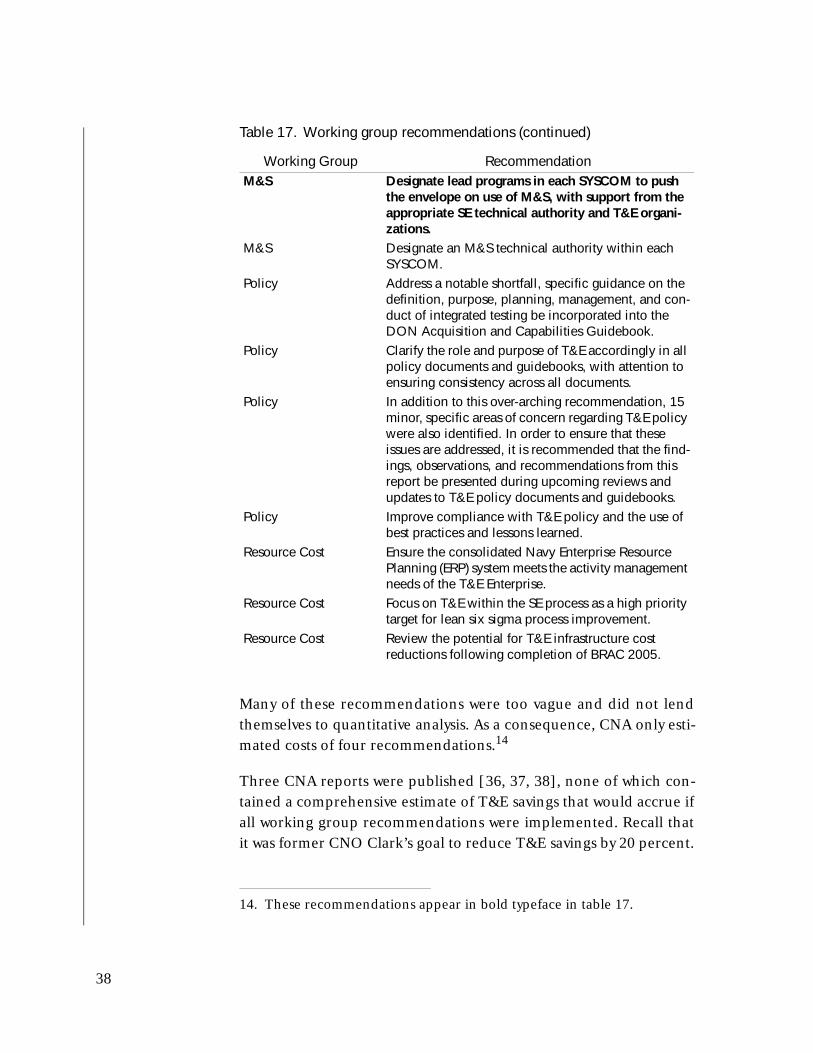
Many of these recommendations were too vague and did not lendthemselves to quantitative analysis. As a consequence, CNA only esti-mated costs of four recommendations.14
Three CNA reports were published [36, 37, 38], none of which con-tained a comprehensive estimate of T&E savings that would accrue ifall working group recommendations were implemented. Recall thatit was former CNO Clark’s goal to reduce T&E savings by 20 percent.
M&S Designate lead programs in each SYSCOM to push the envelope on use of M&S, with support from the appropriate SE technical authority and T&E organi-zations.
M&S Designate an M&S technical authority within each SYSCOM.
Policy Address a notable shortfall, specific guidance on the definition, purpose, planning, management, and con-duct of integrated testing be incorporated into the DON Acquisition and Capabilities Guidebook.
Policy Clarify the role and purpose of T&E accordingly in all policy documents and guidebooks, with attention to ensuring consistency across all documents.
Policy In addition to this over-arching recommendation, 15 minor, specific areas of concern regarding T&E policy were also identified. In order to ensure that these issues are addressed, it is recommended that the find-ings, observations, and recommendations from this report be presented during upcoming reviews and updates to T&E policy documents and guidebooks.
Policy Improve compliance with T&E policy and the use of best practices and lessons learned.
Resource Cost Ensure the consolidated Navy Enterprise Resource Planning (ERP) system meets the activity management needs of the T&E Enterprise.
Resource Cost Focus on T&E within the SE process as a high priority target for lean six sigma process improvement.
Resource Cost Review the potential for T&E infrastructure cost reductions following completion of BRAC 2005.
14. These recommendations appear in bold typeface in table 17.
Table 17. Working group recommendations (continued)
Working Group Recommendation
38
It was the consensus of the working group principals, however, thatachieving 20 percent savings in T&E was unlikely, but that 10 percentsavings was reasonable.
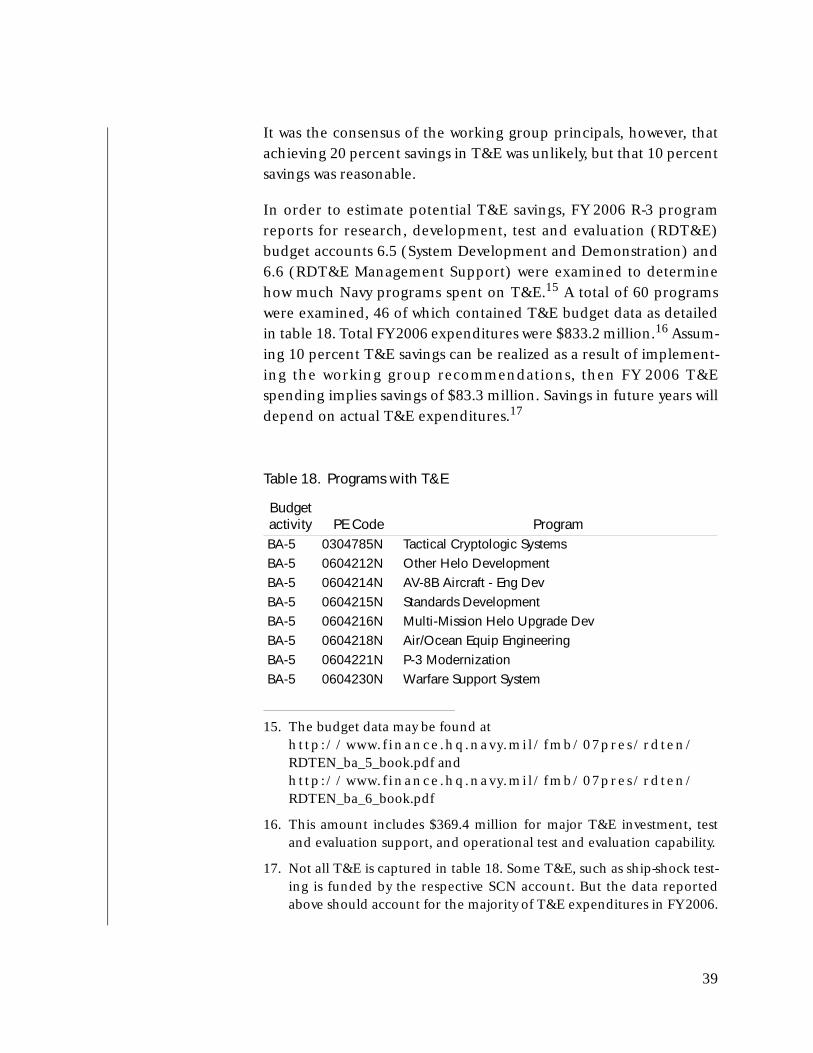
In order to estimate potential T&E savings, FY 2006 R-3 programreports for research, development, test and evaluation (RDT&E)budget accounts 6.5 (System Development and Demonstration) and6.6 (RDT&E Management Support) were examined to determinehow much Navy programs spent on T&E.15 A total of 60 programswere examined, 46 of which contained T&E budget data as detailedin table 18. Total FY 2006 expenditures were $833.2 million.16 Assum-ing 10 percent T&E savings can be realized as a result of implement-ing the working group recommendations, then FY 2006 T&Espending implies savings of $83.3 million. Savings in future years willdepend on actual T&E expenditures.17
15. The budget data may be found at h t tp ://www. f inance .hq .navy.mi l/ fmb/07pres/rdten/RDTEN_ba_5_book.pdf and ht tp ://www. f inance .hq .navy.mi l/ fmb/07pres/rdten/RDTEN_ba_6_book.pdf
16. This amount includes $369.4 million for major T&E investment, testand evaluation support, and operational test and evaluation capability.
Table 18. Programs with T&E
Budget activity PE Code ProgramBA-5 0304785N Tactical Cryptologic SystemsBA-5 0604212N Other Helo DevelopmentBA-5 0604214N AV-8B Aircraft - Eng DevBA-5 0604215N Standards DevelopmentBA-5 0604216N Multi-Mission Helo Upgrade DevBA-5 0604218N Air/Ocean Equip EngineeringBA-5 0604221N P-3 ModernizationBA-5 0604230N Warfare Support System
17. Not all T&E is captured in table 18. Some T&E, such as ship-shock test-ing is funded by the respective SCN account. But the data reportedabove should account for the majority of T&E expenditures in FY 2006.
39
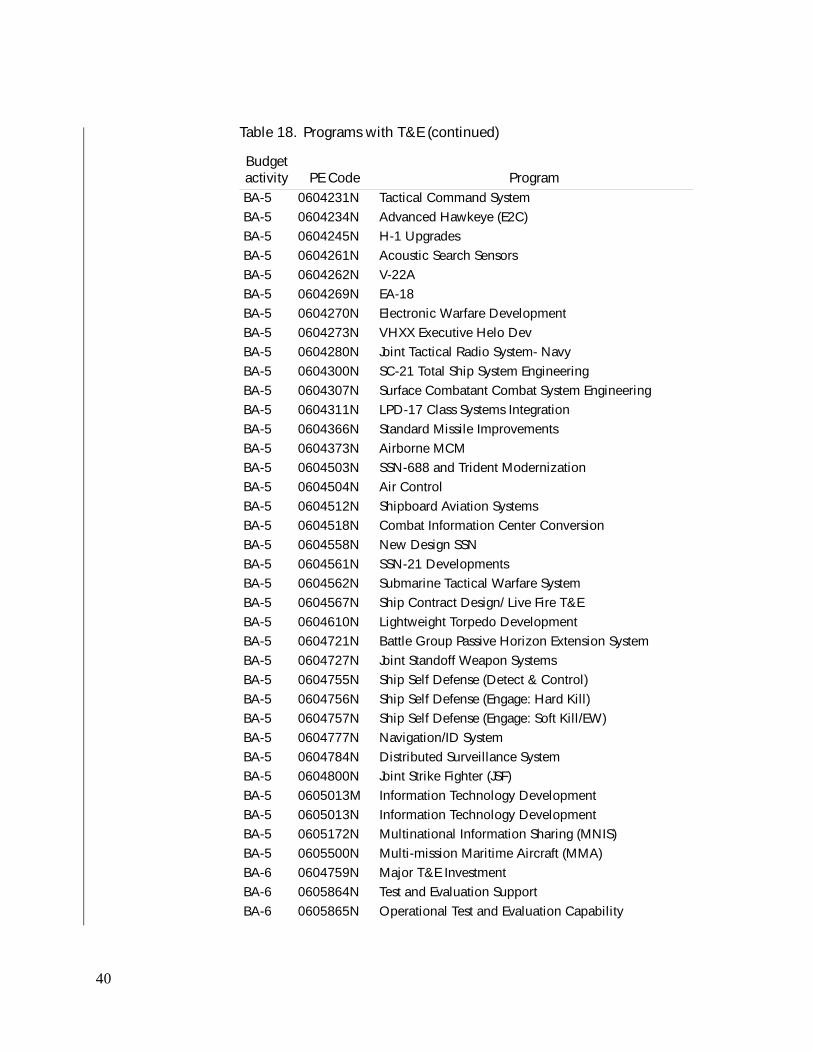
BA-5 0604231N Tactical Command SystemBA-5 0604234N Advanced Hawkeye (E2C)BA-5 0604245N H-1 UpgradesBA-5 0604261N Acoustic Search SensorsBA-5 0604262N V-22ABA-5 0604269N EA-18BA-5 0604270N Electronic Warfare DevelopmentBA-5 0604273N VHXX Executive Helo DevBA-5 0604280N Joint Tactical Radio System- NavyBA-5 0604300N SC-21 Total Ship System EngineeringBA-5 0604307N Surface Combatant Combat System EngineeringBA-5 0604311N LPD-17 Class Systems IntegrationBA-5 0604366N Standard Missile ImprovementsBA-5 0604373N Airborne MCMBA-5 0604503N SSN-688 and Trident Modernization BA-5 0604504N Air ControlBA-5 0604512N Shipboard Aviation SystemsBA-5 0604518N Combat Information Center ConversionBA-5 0604558N New Design SSNBA-5 0604561N SSN-21 DevelopmentsBA-5 0604562N Submarine Tactical Warfare SystemBA-5 0604567N Ship Contract Design/ Live Fire T&EBA-5 0604610N Lightweight Torpedo DevelopmentBA-5 0604721N Battle Group Passive Horizon Extension SystemBA-5 0604727N Joint Standoff Weapon SystemsBA-5 0604755N Ship Self Defense (Detect & Control)BA-5 0604756N Ship Self Defense (Engage: Hard Kill)BA-5 0604757N Ship Self Defense (Engage: Soft Kill/EW)BA-5 0604777N Navigation/ID SystemBA-5 0604784N Distributed Surveillance SystemBA-5 0604800N Joint Strike Fighter (JSF)BA-5 0605013M Information Technology Development BA-5 0605013N Information Technology Development BA-5 0605172N Multinational Information Sharing (MNIS)BA-5 0605500N Multi-mission Maritime Aircraft (MMA)BA-6 0604759N Major T&E InvestmentBA-6 0605864N Test and Evaluation SupportBA-6 0605865N Operational Test and Evaluation Capability
Table 18. Programs with T&E (continued)
Budget activity PE Code Program
40

Table 19. T&E savings, description, and risks
Annual savings Description Risks$83M for FY 2006 and variable thereafter
Implement T&E savings recommendations
Moderate: Recommen-dations will not be fully implemented. Even if all recommendations are implemented, realized savings may be less than expected.
41

This page intentionally left blank.
42
Reducing electricity cost
The study by Ackerman and Shaw [39] recommends that the Navyshould meter its largest energy users. In doing so, the Navy couldachieve annual savings of $8 million by metering 60 percent of totalsquare footage and $10 million by metering 80 percent of total squarefootage. These savings estimates are conservative given the large costsof installing meters assumed in the study.18 Savings will also begreater if electricity prices vary with time of use, i.e., peak load pric-ing. Reference [39] focused on Navy facilities in San Diego that arealready metered. The authors found that, on average, electricityusage and total costs declined 5 and 9 percent. Benefits of meteringelectric facilities include identifying wasteful electricity usage andreducing power demand. When [39] was written in 2003, Congresswas considering legislation requiring electric metering of all federalfacilities. The Congressional bill became The Energy Policy Act of2005, and was signed into law by President Bush on August 8, 2005.There is no current information on the amount of Navy facilitysquare footage that has been metered to date, but given that TheEnergy Policy Act of 2005 was recently enacted, it seems that themajority of savings from metering Navy facilities are still unrealized.
18. “The Naval Facilities Engineering Command estimates that it costs$5,000 to purchase and install a new meter” [39, p. 2].
Table 20. Electricity metering savings, description, and risks
Annual savings Description Risks$10 million Install electricity meters
at Navy facilitiesMinimal: Federal legisla-tion recently passed.
43

This page intentionally left blank.
44

Shipbuilding and aircraft procurement issues
Shipbuilding for the Navy has often been cited as inefficient, and thecommercial side of shipbuilding is even worse in terms of efficiencyand productivity. The Navy’s SCN account budget for FY 2007 is over$8 billion for new construction. With improvements in shipbuildingfrom best practices and lean manufacturing processes, the Navycould save $430 million or more per year.
Like shipbuilding, aircraft production can benefit from the imple-mentation of lean principles and lean manufacturing. The Navy’sAPN account for the procurement of new aircraft is budgeted atnearly $8 billion for FY 2007. Assuming that the defense aircraft man-ufacturers could save 20 percent of this figure and then split the sav-ings equally with the Navy, the Navy could save as much as$797 million per year.
Savings from best practices and lean manufacturing in ship building
According to First Marine International [40], in research done onbehalf of the Deputy Undersecretary of Defense for Industrial Policy,implementation of lean manufacturing principles and best practices
Table 21. Effects of lean manufacturing: savings, description, and risks
Annual savings Description Risks$430M Applying best practices and
lean manufacturing in ship-building and sharing the savings with contractors
Moderate: Depends on cost savings share ratio and proper incentives in con-tracts
Up to $800M Applying lean practices to defense aircraft industry and sharing the savings with contractors
Moderate: Depends on cost savings share ratio and incentives
45

can save shipbuilders up to $860 million per year. Assuming that thegovernment shares these cost reductions equally with contractors, theNavy could save $430 million per year.
These initiatives, proposed by First Marine International, include:increasing the use of best practices in shipbuilding, making moreeffective use of technology employed in shipbuilding, optimizing shipdesigns to reduce work content, and reducing the customer factor(government oversight and regulations). The cost savings calcula-tions have been loosely calculated, but do give an accurate picture ofthe type of improvement that could be expected at the six biggestU.S. shipyards.
Conversations with subject matter experts and examination of otherresearch indicate that projected savings may be very conservative dueto the way contracts are currently structured for Navy shipbuilding.19
The shipyards the Navy contracts with to build its ships are inefficient(compared to competitive international commercial shipyards), anti-quated, and are rewarded for using more labor to build a ship.20 Onesubject matter expert said that the Japanese redesigned the construc-tion of the DDG-51 class for easier assembly and construction andthat the US shipyards and Navy could learn from their practices.
With proper incentives provided in a contract, the Navy and shipyardscould achieve these conservative estimates of savings.21 The totalamount saved for the Navy will vary based on the share ratio. Con-tracting is well within the Navy's control. However, some of the issues
19. Subject matter experts include a CNA research analyst who hasauthored many papers on shipbuilding, shipyard efficiency, and shipmanning; and other research includes various GAO reports [41, 42, 43]that investigated cost growth in shipbuilding and the use of incentiveand award fees in contracting.
20. A Bureau of Industry and Security study [44] states, “Current U.S. DODprocurement policies do not adequately reward innovation in militaryship construction practices, thereby indirectly encouraging shipbuild-ers to maximize labor hours.”
21. A discussion of proper incentives is beyond the scope of this researchand we refer the reader to [41].
46

raised by First Marine, such as government oversight and regulations,may be out of the scope of the Navy’s control.
Savings from lean principles in aircraft production
Similar to the shipbuilding industry, the defense aircraft industry canpotentially see large cost savings from full implementation of leanpractices. Although a firm dollar amount of annual savings is notavailable, a RAND study [45] estimates that savings up to 20 percentare possible (using total aircraft historical cost) if lean principles areimplemented throughout the entire organization. If we assume that20 percent is the ceiling on savings and use the Navy’s FY 2007 esti-mate for aircraft procurement, the savings are about $1.6 billion.
Based on [45] and other studies from MIT's Lean Aerospace Initia-tive [46, 47, 48], the amount of lean implementation in defense aero-space is small. There is substantial room for improvement and someearly reports show cost savings based on pilot programs. However,[45] cautions that these results should not be generalized to an entireprogram for fear of double counting savings.
The Navy should not expect a savings of 20 percent across the boardfor aircraft procurement, so we offer that as a ceiling. In reality, theNavy may have to share these cost savings with industry in order forlean principles to be fully implemented. For example, if the Navywere to share these cost savings equally with industry, the Navy couldsave about $800 million per year (for the 2007 APN estimate).22
As in the case with shipbuilding, contracting for aircraft productionis well within the Navy’s control and providing the proper incentivesfor lean manufacturing is essentially a contracting issue. Similarly,reducing government oversight and regulations for aircraft produc-tion may not be under the Navy’s control. This may impair contrac-tors’ abilities to fully implement lean principles throughout theirenterprise. As such, savings may be less than the projected ceiling of$800 million per year.
22. Fixed price incentive contracts contain share ratios where the govern-ment and contractor share both cost under-runs and cost over-runs. A50-50 share ratio appears to be common now [49].
47

This page intentionally left blank.
48

Other potential for savings
BRAC
On September 8, 2005, the Base Realignment and Closure (BRAC)Commission submitted its final report with recommendations to thePresident. Nineteen of the BRAC Commission's final recommenda-tions directly affected Navy facilities. These recommendations arelisted in table 22.
Table 22. BRAC recommendations affecting DON
Recommendation City StatePayback period
(years)20-year
NPV ($M)Marine Corps Logistics Base Barstow CA Immediate (230.6)Naval Weapons Station Seal Beach Det
Concord CA 1 (199.7)
Submarine Base New London CT 1 (55.5)Officer Training Command Pensacola FL 6 (7.6)Naval Air Station Atlanta GA Immediate (446.0)Navy Supply Corps School Athens GA 18 1.4Naval Support Activity New Orleans LA Immediate (387.7)Naval Air Station Brunswick ME 2 (797.9)Marine Corps Support Activity Kansas City MO Immediate (67.0)Naval Station Pascagoula MS Immediate (665.7)Naval Air Station Joint Reserve Base
Willow Grove PA 2 (757.8)
Naval Station Newport RI 13 (2.1)Naval Air Station Ingleside & Corpus
ChristiTX 3 (614.2)
Engineering Field Division/Activity
Roll up N/A 4 (81.8)
Navy and Marine Corps Reserve Centers
Roll up N/A 6 (76.8)
Navy Recruiting Districts Roll up N/A Immediate (214.5)Navy Regions Roll up N/A 1 (34.6)
49

The 20-year net present value of savings from these recommenda-tions totals about $5 billion. But this amount includes savings associ-ated with elimination of military personnel (Milpers) billets. TheBRAC Commission believes that these savings will not be realized.Adjusting the savings downward and expressing the figure in annualterms yields potential savings of $105.3 million annually over 20 years.A significant issue is whether these savings have already been ear-marked for specific purposes. According to the DOD comptroller,“[t]he distribution of [BRAC] funds across the Department's require-ments is managed in the Office of the Under Secretary of Defense(Comptroller) (OUSD(C)).” Some of the BRAC savings may remainin the BRAC account to fund things like military construction. In thatcase, BRAC savings will not be available to fund new procurement.
Navy Reserve Centers Roll up N/A 1 (236.6)Navy Reserve Readiness Com-mands
Roll up N/A Immediate (91.7)
TOTAL (4,996.4)
Table 23. BRAC savings, description, and risks
Annual savings Description RisksUp to $105 million annually over 20 years
Realignment and clo-sure of Navy facilities
High: BRAC savings may already be earmarked for other purposes.
Table 22. BRAC recommendations affecting DON (continued)
Recommendation City StatePayback period
(years)20-year
NPV ($M)
50

Conclusions and recommendation
In order to achieve the 313-ship battle force, the planned ramp up inthe Navy’s procurement would require finding savings from otheraccounts (or what the Secretary of the Navy termed “excesses in oper-ations and maintenance, personnel accounts and other aspects of theNavy budget”). We examined a wide range of initiatives and foundthat there would be ample opportunities for savings that would allowmore money into procurement, substantially improving the Navy'sbuying power.
The initiatives and ideas we examined, most of which had been iden-tified in previous studies, included:
• Reducing ship manning through Mil-Civ conversion of somefunctions
• Using more experienced and specialized sailors and longertours
• Competitive sourcing
• Decrewing during overhauls
• Reducing shore-based pilots
• Adjusting to optimal reenlistment rates
• Reforming military retirement pay
• Applying crew rotation to cruisers and destroyers
• Using changes in depot maintenance norms
• Reducing supply time for AVCALs and SHORECALs
• Sharing AVCALs among carriers
• Managing aircraft fatigue life
• Reducing FH early in training cycle
51
• Identifying savings in T&E
• Reducing electricity costs
• Applying lean manufacturing to Navy shipbuilding and defenseaircraft industry
We reviewed prior studies on these subjects, assessed the ideas, andprojected the overall savings. Collectively, the total savings from theseinitiatives add up to between $7 billion and $10 billion. The Navyshould have control over implementation of all of these changes,except reforming military retirement pays. Subsequently, the low endof the savings range does not include this one. We assessed the riskassociated with each of these initiatives and deemed most to be mini-mal to moderate in terms of cost uncertainty, effects on readiness, orother effectiveness measures. Nonetheless, tough decisions must bemade and cultural and other barriers must be overcome before theNavy can realize the savings.
Some of the individual initiatives, such as competitive sourcing, havebeen thoroughly researched and partially implemented already.Others have not. We recommend that the latter category of initia-tives,23 the savings figures, and the associated risks be more thor-oughly studied before the Navy decides to implement any of them.
23. This category would include: decrewing, reducing shore-based pilots,applying crew rotations to cruisers and destroyers, using changes indepot maintenance norms, reducing supply time for AVCALs andSHORECALs, sharing AVCALs among carriers, managing aircraftfatigue life, reducing FH early in training cycle, savings in T&E, andapplying to Navy shipbuilding and defense aircraft industry.
52

References
[1] Samuel D. Kleinman, Alan J. Marcus, and Glenn Ackerman.Could the Department of the Navy Improve Resource Productivity by10 Percent?, May 2003 (CNA Research MemorandumD0008427.A1)
[2] Jino Choi, James Jondrow, et al. Changes in the Navy’s BuyingPower: Evidence on Basic Questions, Aug 2005 (CNA AnnotatedBriefing D0012230.A2)
[3] Congressional Budget Office. Options for the Navy’s Future Fleet,May 2006
[4] FY07 DoD Green Book
[5] Navy FY07 Budget Highlights
[6] Albert B. Monroe IV, Jack D. Keenan, and Dan D. Steeples.LCC-20 Manning: Civilianization and the Navy of the Future, May2006 (CNA Research Memorandum D0014300.A1)
[7] Henry L. Eskew, Kletus S. Lawler, Anthony R. DiTrapani, andJohn D. Keenan. Civilian Manning of Navy Command Ships: ThePotential for Cost Savings, Oct 2003 (CNA Research Memoran-dum D0008624.A4)
[8] Adebayo M. Adedeji and Mark E. Rosen. Outsourcing on Air-craft Carriers: An Idea Whose Time has Come, Mar 2000(CNAResearch Memorandum D0000119.A2)
[9] Anthony R. DiTrapani and John D. Keenan. Applying CivilianShip Manning Practices to USN Ships, May 2005 (CNA ResearchMemorandum D0011501.A2)
53

[10] Russell W. Beland and Aline O. Quester. “The Effects of Man-ning and Crew Stability on Material Condition of Ships.” Inter-faces, Vol. 21, Jul-Aug 1991:4.
[11] Martha E. Koopman et. al. Manpower Policy Constraints on theAvailability of Military Billets for Outsourcing, Jun 1998 (CNAResearch Memorandum 98-39)
[12] Christopher M. Snyder, Robert P. Trost and R. Derek Trunkey.Bidding Behavior in DoD’s Commercial Activities Competitions, Jan1998 (CNA Research Memorandum 97-68)
[13] W. Brent Boning et. al. Evidence on Savings from A76 Competi-tions, Nov 1998 (CNA Research Memorandum 98-125)
[14] Flora Tsui, Cori R. Rattelman, and Laura J. Parker. OutsourcingEnlisted Medical Training: Analysis of Eight Selected NECs Jul 1999(CNA Research Memorandum 99-68)
[15] Robert A. Levy, James E. Grefer. Estimating Savings Associatedwith Civilianizing Navy Medical Personnel, Sep 2004 (CNAAnnotated Briefing D0010561)
[16] Perkins C. Pedrick and John D. Keenan. Outsource Land-basedSAR.?, Mar 2003 (CNA Annotated Briefing D0000413.A1)
[17] Neil B. Carey. Savings and Costs from using the “Air Force Model”of Graduate Medical Education (GME), Mar 1995 (CNAResearch Memorandum 95-44)
[18] Robert A. Levy, Eric W. Christensen and Senanu Asamoah.Raising the Bonus and the Prospects for DOD’s Attracting FullyTrained Medical Personnel, Feb 2006 (CNA Research Memoran-dum D0013237.A2)
[19] Peggy A. Golfin, John D. White and Lisa A. Curtin, CDR, USN.A Role for Community Colleges in Navy Training, Mar 1998 (CNAResearch Memorandum 97-97)
54
[20] Jack Keenan, Mary Jo Russell, Darlene Stafford. DecrewingNavy Ships in Overhaul, Nov 1999 (CNA Research Memoran-dum 99-115)
[21] Henry L. Eskew and Jino Choi. U.S. Navy Personnel Require-ments and Costs: Phase I Report, Dec 2004 (CNA AnnotatedBriefing D0011222.A1)
[22] Michael L. Hansen and Sam Kleinman. Military Compensation:When 50-year-olds Decide what 20-year-olds Want, Sep 2005 (CNAResearch Memorandum D0012938.A1)
[23] Albert Monroe, “Analysis of Aviation Officer Career Paths,”briefing given at the 2006 Navy Workforce Conference
[24] Michael L. Hansen and Jennie W. Wenger. Is Enlisted RetentionToo High?, Oct 2003 (CNA Research MemorandumD0008594.A2)
[25] Beth J. Asch and John T. Warner. A Policy Analysis of AlternativeMilitary Retirement Systems, 1994 (RAND MR-465)
[26] John T. Warner. Thinking about Military Retirement, Jan 2006(CNA Research Memorandum D0013583.A1)
[27] Martha E. Koopman. Creating Innovative Career Paths, Jan 2006(CNA Research Memorandum D0013254.A1)
[28] Martha E. Koopman. Resource Implications of Personnel Reduc-tions, Mar 2005 (CNA Research Memorandum D0011429.A2)
[29] Michael L. Hansen and Martha E. Koopman. Military Compen-sation Reform in the Department of the Navy, Dec 2005 (CNAResearch Memorandum D0012889.A1)
[30] Alan J. Marcus et. al., Rotational Crewing Model, July2006,CNA Annotated Brief D0013502.A3/Final.
[31] Ada Ortega-Garay, James M. Jondrow, and John D. Keenan,Trends in the instruction for ship maintenance, memo to
55
LCDR Dale J. Danko, 24 July 2006, CNA MemorandumD0014543.A1
[32] James M. Jondrow and Ronald H. Nickel, Some Retail SparingIssues for the Fleet Response Plan, July 2006, CNA ResearchMemorandum D0014557.A2
[33] Ronald H. Nickel et. al., MIMERBS Update and Sortie Gener-ation Considerations, January 2002, CNA Research Memo-randum D0005434.A2/Final, page 16, table 2.5
[34] Chad D. Meyerhoefer, et. al., Managing Airframe FatigueLife: Results for the FA-18, EA-6B, and S-3B, Dec 2003, (CNAResearch Memorandum D0009223.A2/Final
[35] James M. Jondrow and Darlene E. Stafford, Budgeting forFRP Surge: The Airwing, July 2006, CNA Research Memoran-dum D0014541.A2/Final, p. 16
[36] Donald Birchler, Jino Choi, George Kinoshita, Pete Kusek,Julianne Nelson, and Richard Sperling, Test and EvaluationSavings Analysis, June 2005, CNA Annotated Briefing CABD0012263.A2/Final
[37] Donald Birchler, Jino Choi, Viki Johnson, George Kinoshita,Pete Kusek, Julianne Nelson, and Richard Sperling, Analysisof T&E Spending and the Cost Impact of Recommendationsfor Streamlining the T&E Process, July 2005, CNA ResearchMemorandum D0012661.A1/Final
[38] Donald Birchler, Jino Choi, Viki Johnson, George Kinoshita,Pete Kusek, Julianne Nelson, and Richard Sperling, Test andEvaluation Savings Analysis Follow-on Study, Task 2, AnalysisWriteup: Annex 4.2, Qualitative Results, 25 July 2005 CNAMemorandum D0012667.A1/Final
[39] Glenn H. Ackerman and Geoffrey B. Shaw, Installing ElectricMeters at Navy Facilities: Benefits and Costs, November 2003,CNA Research Memorandum D0008909.A2/Final
56

[40] First Marine International. “Findings for the Global Ship-building Industrial Base Benchmarking Study,” DeputyUndersecretary of Defense (Industrial Policy) study, August2005.
[41] Government Accountability Office. “Defense Acquisitions:DOD has Paid Billions in Award and Incentive Fees Regard-less of Acquisition Outcomes,” GAO-06-66, December 2005.
[42] Government Accountability Office. “Defense Acquisitions:Improved Management Practices Could Help Minimize CostGrowth in Navy Shipbuilding Programs,” GAO-05-183, Febru-ary 2005.
[43] Government Accountability Office. “Incentive Contracts:Examination of Fixed-Price Incentive Contracts,” GAO-NSIAD-88-36BR, November 1987.Cook, Cynthia and Graser,John. “Military Airframe Acquisition Costs: The Effects ofLean Manufacturing,” Rand MR-1325 (2001).
[44] U.S. Bureau of Industry and Security. U.S. Shipbuilding andRepair: National Security Assessment of the U.S. Shipbuilding andRepair Industry, May 2001
[45] Cynthia Cook and John Graser, Military Airframe AcquisitionCosts: The Effects of Lean Manufacturing, 2001, RAND MR-1325
[46] John C. Hoppes, Lean Manufacturing Practices in the Defense Air-craft Industry, Massachusetts Institute of Technology MastersThesis, May 1995.
[47] Michael J. Pozsar, Application of the Lean Aircraft Initiative Fac-tory Operations Model to Case Studies in the Defense Aircraft Indus-try, Sloan School of Management Masters Thesis, May 10,1996.
[48] Thomas Thomas et al. An Assessment of the Degree of Implementa-tion of Lean Aerospace Initiative Principles and Practices within theUS Aerospace and Defense Industr y, Industry AssociationCrosstalk Coalition and Government Electronics and Infor-
57

mation Technology Association and MIT Lean Aerospace Ini-tiative, Feb 2004
[49] Kate Vitasek, et al. Keep Your End Customer in Sight, SupplyChain Strategy, Jun 2006
58

List of tables
Table 1. Cost-cutting initiatives. . . . . . . . . . . . . . . . . 2
Table 2. Civilian manning or practices: savings, description, and risks . . . . . . . . . . . . . . . . . 10
Table 3. Position codes included in the high estimate of savings. . . . . . . . . . . . . . . . . . . . . . . . 11
Table 4. Competitive sourcing potential savings calculation (FY06 dollars). . . . . . . . . . . . . . . 13
Table 5. Competitive sourcing: savings, description, and risks . . . . . . . . . . . . . . . . . . . . . . . . 14
Table 6. Proportion of crew reduction. . . . . . . . . . . . . 16
Table 7. Illustrative proportion of crew reduction. USS Eisenhower RCOH. . . . . . . . . . . . . . . . 17
Table 8. Decrewing: savings, description, and risks . . . . . . 19
Table 9. Assigning pilots more intensively to flying billets: savings, description, and risks. . . . . . . . . 21
Table 10. Adjusting to optimal reenlistment rates: savings, description, and risks. . . . . . . . . . . . . 23
Table 11. Reforming military retirement pay: savings, description, and risks . . . . . . . . . . . . . . . . . 24
Table 12. Estimated savings from crew rotation . . . . . . . . 28
Table 13. Ship initiatives: savings, description, and risks . . . . 29
Table 14. Aviation initiatives: savings, description, and risks . . . . . . . . . . . . . . . . . . . . . . . . 34
59
Table 15. T&E working groups . . . . . . . . . . . . . . . . . 35
Table 16. Navy programs. . . . . . . . . . . . . . . . . . . . . 36
Table 17. Working group recommendations . . . . . . . . . . 37
Table 18. Programs with T&E . . . . . . . . . . . . . . . . . . 39
Table 19. T&E savings, description, and risks. . . . . . . . . . 41
Table 20. Electricity metering savings, description, and risks . . . . . . . . . . . . . . . . . . . . . . . . 43
Table 21. Effects of lean manufacturing: savings, description, and risks . . . . . . . . . . . . . . . . . 45
Table 22. BRAC recommendations affecting DON. . . . . . . 49
Table 23. BRAC savings, description, and risks . . . . . . . . . 50
60
Distribution list
A3828 ASSISTANT SECRETARY OF THE NAVY/ASN M&RAA3926 DEFENSE TECHNICAL INFORMATION CENTERA6351 DCNO N8 RESOURCES WARFARE REQUIREMENTS & ASSESSMENTS (N8)A6528 N4/ CNO /LOGISTICSA6529 N1 ADCNO MANPOWER AND PERSONNELA7159 DEPUTY ASSISTANT SECRETARY OF THE NAVY/MANAGEMENT ANDBUDGET
Attn: Mr. John ThackrahAttn: CAPT Francis Tisak
DEPUTY NAVAL STAFF
61

This page intentionally left blank.
62


CR
M D
0014
799.
A2
/ Fin
al


![Indian Navy’s Inshore Patrol Vessels · Indian Navy’s Inshore Patrol Vessels 1 Indian Navy’s Inshore Patrol Vessels [v1.0][16.Jun.2012][© Aditya Gupta] In the naval scheme](https://img.pdfslide.net/doc/110x75/5e89d0576f98607fc62794b1/indian-navyas-inshore-patrol-vessels-indian-navyas-inshore-patrol-vessels-1.jpg)