Embed Size (px)
Citation preview
102
Improving Nutritional Status and Livelihood for Marginalized Women Households in Southwest Bangladesh through Aquaculture, Part II
IMPROVING NUTRITIONAL STATUS AND LIVELIHOOD FOR MARGINALIZED WOMENHOUSEHOLDS IN SOUTHWEST BANGLADESH THROUGH VALUE CHAIN ANALYSIS
Marketing, Economic Risk Assessment, and Trade/Study/13MER04NC
Wilfred Jamandre1, Sattyananda Biswas Satu2, Upton Hatch3, Emilia Quinitio4, Sadika Haque5, Shahroz Mahean Haque6, and Russell J. Borski7
1Department of Agricultural Management, Munoz, Nueva Ecija, Philippines 2Shushilan, (nongovernmental organization, Khulna, Bangladesh
3Department of Agricultural and Resource Economics, North Carolina State University, Raleigh, NC, USA
4Southeast Asian Development Center — Aquaculture, Iloilo, Philippines 5Department of Agricultural Economics, Bangladesh Agricultural University,
Mymensingh, Bangladesh 6Department of Fisheries Management, Bangladesh Agricultural University,
Mymensingh, Bangladesh 7Department of Biology, North Carolina State University, Raleigh, NC, USA
ABSTRACT This study analyzed the value chain of mud crab in Southwest Bangladesh and identified areas to improve the livelihood opportunities of women crab culturists in this region. Tracer methodology was employed to map the existing value chain of mud crab spanning three districts, namely Khulna, Satkhira and Bagerhat. A total of 156 respondents were interviewed composed of six crab collectors, 45 mudcrab culturists, six assemblers (three in local/district-based depots and three in national or Dhaka-based depots), three soft-shelled crab processors and exporters of live crabs in Dhaka, one exporter association (with 86 active members) in Dhaka, and 10 consumers. A combination of individual and panel interviews as well as focus group discussions were employed to gather data and information needed to answer the key questions related to value chain mapping. This approach enabled the study to provide improved analysis of the dynamics in the chain and the behavioral and institutional features of the transactions involved. Secondary data were used extensively to establish a good understanding of the mud crab industry. These include data on volume and value of production, yield, prices and other market information, among others. Finally, key informants from relevant agencies such as the Bangladesh Ministry of Fisheries and Livestock, Department of Forestry, among others were also interviewed.
The mud-crab industry in Bangladesh has been emerging as an important source of income and employment for its fishery sector. Export value of live crabs is now ranked ninth and the third fastest growing fishery product. The major destination of live crabs is export markets whose demand is growing, particularly China, Singapore, and Malaysia. This rapidly expanding export opportunity contrasts with limited domestic demand from non-Muslim consumers and foreign tourists. Consumption of crab is not yet accepted by the majority Muslim Bangladeshi population; although not forbidden by their faith, it has not generally been an accepted part of their diet.
103
Marketable live crabs are collected in the wild but excessive levels of harvest of these natural populations has resulted in unsustainable volume of catch and inconsistent quality. Crab culture and fattening has recently emerged to improve sustainability.
The crab value chain is composed of crab collectors, crab growers/culturists/fatteners, assembler-agents at local, district and national depots, exporter-processors and end users. At this time, retailers and institutional buyers do not play a significant role.
Schedules of volume, price and product requirements (grade, size, sex, gonad and claw conditions) are provided by exporters through assembler-agents 3 times per week. To meet volume or “quota” requirements, assembler-agents extend credit (dadon) or advanced payments to crab collectors and crab growers to facilitate procurement. Virtually all other transactions are settled in cash. In terms of cost and profit share of value chain players, exporters-processors dominate with 38% and 57%, respectively. District level assemblers and wild crab collectors accounted for 19% and 16% profit share while the local assembler and crab growers have the lowest profit shares of 4.4% and 2.4%, respectively.
High incidence (20%) of in-transit mortality and unmarketable quality result from poor road, transportation and packaging practices. To deal with these problems, exporters have begun to get involved in processing crab to maintain the quality and quantity demanded by their customers. If this trend continues, vertical integration of the crab value chain could result in reduced benefits at the local level. The principal objective of this project initiative to improve the well-being of Bangladeshi women would be greatly undermined.
The major logistical issues and concerns that hamper the overall efficiency and sustainability of the value chain include:
• Natural sources of crab seeds becoming unsustainable;• Poor grow out and feeding technologies in mud crab culture;• Poor road conditions, packaging and handling practices;• Limited working capital; and• Poor processing technology.
Additionally, the external influences that are harmful to the value chain include:
• Frequent floods due to heavy rains;• Poor water quality; and• Lack of government efforts to stimulate domestic demand for crabs.
To address the above issues and concerns, the following measures are recommended:
• Establish crab hatcheries;• Improve cultural and value adding technologies via techno transfer and credit programs;• Improve product packaging and handling systems; and• Provide efficient marketing and promotion programs.
104
INTRODUCTION The culturing or fattening of mud crab (Scylla serrata) is an emerging industry (Azam et al. 1998; Khan et al. 1991) directly benefiting women-led households in coastal Bangladesh. The large-clawed mud crabs are highly sought commodity seafood items due to their delicacy, medicinal value and demand in international markets (Ali et al. 2004, Keenan et al. 1997). Of the 2,428 crab farms in the severely impacted regions (Satkhira, Khulna and Bagerhat), 37.8% are currently owned and operated by women (26%–41% by region; Shushilan unpublished report). Even farms not directly owned by women commonly rely on this demographic for stock collection of juveniles from shrimp ponds or other wetlands. Currently, very little information has been collected or published about these endeavors, yet while women aqua-farmers likely obtain economic benefits from crab fattening, this is solely marketed as an export crop, thus may not directly benefit the dietary needs of local women and children. Given a poorly defined value chain, where the roles and participation of women may be under-estimated or under-appreciated by local government agencies, little protection from exploitation (by market intermediaries) currently exists. Through greater investigation of the mud crab value chain in the lives of women culturists, this study will identify key opportunities and constraints for this industry, for which women play important roles.
OBJECTIVES This study is designed to assess the existing value chain for mud crab and to identify areas for improvement. The specific objectives are as follows:
• To provide an overview of the mud crab industry;• To map out the specific value chain for mud crab;• To analyze the performance of the mud crab value chain in terms of efficiency and overall
responsiveness;• To identify areas for improvement in the value chain such as behavioral, institutional and process;
and• To provide specific policy recommendations to improve the mud crab industry.
THEORETICAL FRAMEWORK Value chains may be referred to as the intra- and inter-linkages of producers, processors, transporters, trans-shipment/depot facilities, and resellers that take part in the production, delivery, and sale of a particular product. In the mud crab value chain, players include the crab collectors, crab culturists, crab traders, depot operators, exporters and key customers both in domestic and export markets.
Value chain should be managed through effective coordination relative to tactical and strategic actions on identified strengths, weaknesses, opportunities, and threats across players of the chain. In the mud crab value chain, one of the most attractive opportunities is the surge in demand. However, such demand has become considerably stringent to meet quality, food safety and reliability requirements. Meeting such requirements appears to be due to the weakness of existing mud crab value chain, especially involving the small-scale or marginal sector. The value chain analysis (VCA) as a systems approach, draws contributions from various disciplines and scrutinizes different areas for improvement, such as economic and operational efficiencies and business relationships:
Economic efficiency. Economic efficiency is achieved when production of goods and services is maximized at lowest possible cost and well-being of sector participants is improved. This condition also includes minimization of transaction costs. Such costs are incurred with market operations entailing the
105
exchange of goods and services, including cost of acquiring information, costs of negotiating and enforcing contracts, among others.
Business relationship. Value-chain players, from upstream to downstream, should work in partnership with each other based on long-term benefits such as increased competitiveness and improved quality. By coordinating value chain processes or activities and working more closely with suppliers, distributors, and customers, business relationships can result in greater benefits.
One indicator of successful value chain performance is a good business relationship based on high level of trust and integrated information sharing and process planning. The lack of trust among negotiating parties often generates a situation where every transaction has to be scrutinized, thereby increasing the transaction costs, resulting in reduced efficiency and cost effectiveness.
Operational efficiency. Operational efficiency is achieved when the right arrangement and coordination of people as well as processes employing improved technology work closely together to enhance productivity and value of the business while driving down cost of operations to a desired level. However, operational efficiency should not be viewed only as a way of enhancing profitability but also vital to ensuring consumer satisfaction.
Operation management and logistics provide conceptual and analytical tools in improving operational efficiency. Achieving such efficiency involves ensuring that value chain processes are efficient in terms of using limited resources and effective in terms of satisfying the consumers’ requirement. This also entails competently managing inbound and outbound logistics with regards to setting up optimal raw material sourcing strategies, distribution schemes, and scheduling.
Crab seed stock reliability and product quality are crucial logistical issues. Earlier studies have identified important constraints associated with this logistic system. This includes instability in supply of crab seed stock and consistency of product quality. Analysis of the logistic system in the mud crab supply chain would generate valuable insight for formulation of effective strategies in addressing these problems.
METHODS Overall strategy of analysis used value-chain methodology used in the Philippine tilapia (Jamandre and Hatch 2010) and Indonesian seaweed marketing systems to analyze the value chain of mud crab in Bangladesh with particular emphasis on improving the benefits that accrue to poor coastal women from this culture system. Ferdoushi and Xiang-Guo (2010a) have provided an excellent description and analysis of mud crab production economics and Ferdoushi and Xiang-Guo (2010b) will be useful in connecting the role of women in production with participation in the market system.
Areas of the study. This study covered the major mud-crab-producing districts of Southwest Bangladesh, namely Khulna, Satkhira and Bagerhat (Figure 1). Tracer methodology was employed to identify the respondents. A total of 156 respondents were interviewed composed of six crab collectors; 45 mudcrab culturists; six assemblers (three in local/district-based depots and three in national or Dhaka-based depots), three soft-shelled crab processors and exporters of live crabs in Dhaka; one exporter association (with 86 active members) in Dhaka; and 10 consumers.
Primary data were gathered through pretested semistructured questionnaires. They were designed to collect quantitative and qualitative information needed in detailing the following six key questions:
106
• Who are key customers and what are their product requirements (quality standards and volumerequirement);
• How do product, information and money flow through the value chain;• What are the activities and services provided at each step in the chain;• What are the roles of each key player involved in the chain;• What are the critical issues related to logistics; and• What external influences impinge on members of the chain.
Answers to these questions enabled an improved understanding of the dynamics in the chain and the behavioral and institutional features of the transactions involved.
Secondary data were used extensively to establish a good understanding of the mud-crab industry in the study area. These include data on volume and value of production, yield, prices and other market information. Finally, key informants from relevant agencies such as the Bangladesh Ministry of Fisheries and Livestock, Department of Forestry were interviewed.
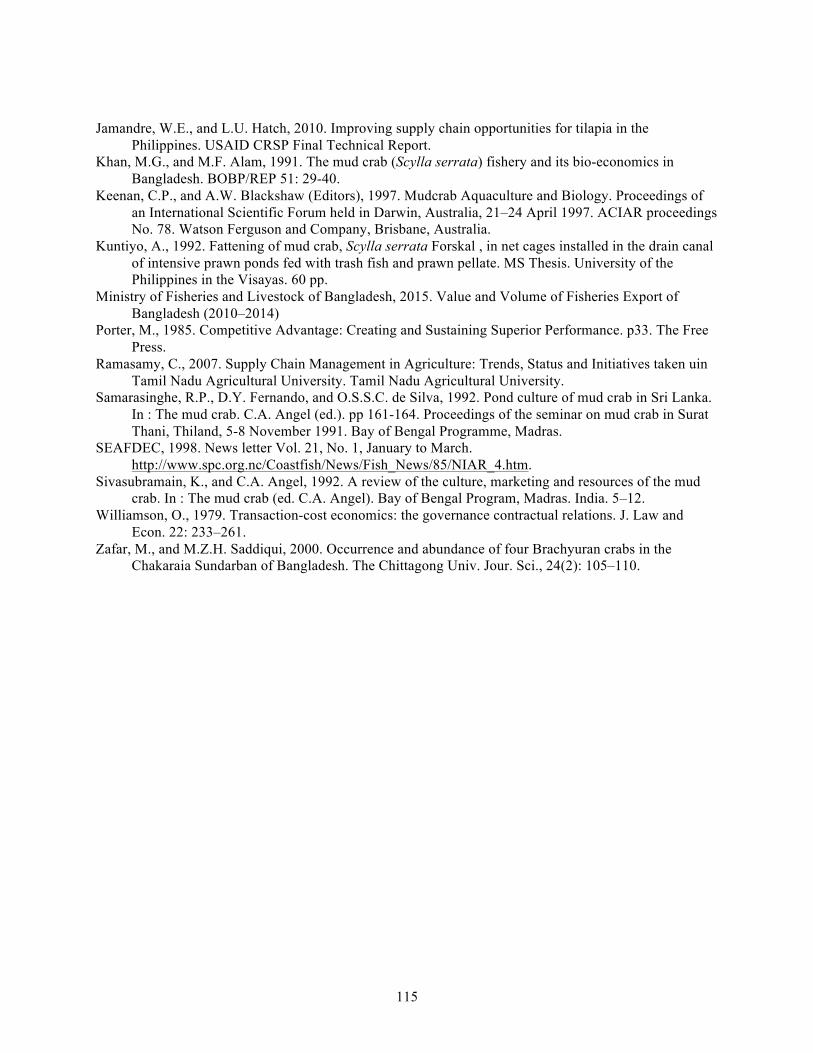
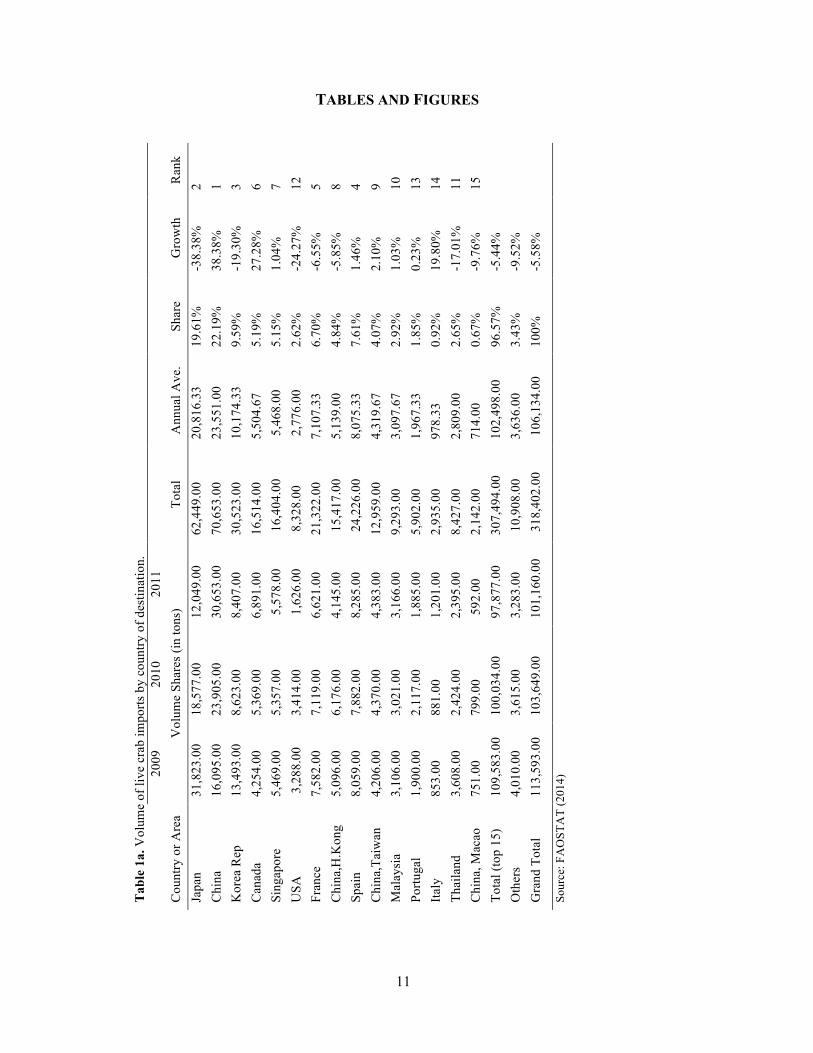
RESULTS AND DISCUSSION Overview of the industry. Mud crab of genus Scylla, also known as green crab or mangrove crab, constitute an important secondary crop in traditional shrimp or fish culture systems in Asian countries including Bangladesh. Mud crab aquaculture has been practiced for many years, based primarily on capture and fattening of juvenile crabs from the wild. There is an unmet demand for mud crabs and this has led to over-exploitation in many areas. The mud crab, Scylla serrata is widely distributed in the Pacific and Indian oceans. It is available in brackish coastal waters and estuaries and has great potential for aquaculture. Crab culture and fattening are however still in the experimental stage in South Asia (Samarasinghe et al. 1992). The importance of live mud crab as an export commodity has opened up great opportunities. Considering its increasing demand in local and international markets, it has been gaining popularity among coastal communities in Khulna and Chittagong regions (Azam et al. 1998). The annual average volume of live crab imports from 2009–11 average to more than 106,000 tons (Table 1a) valued at around US$600 million (Table 1b) with China, Japan and South Korea topping the list of crab importers (FAOSTAT 2014).
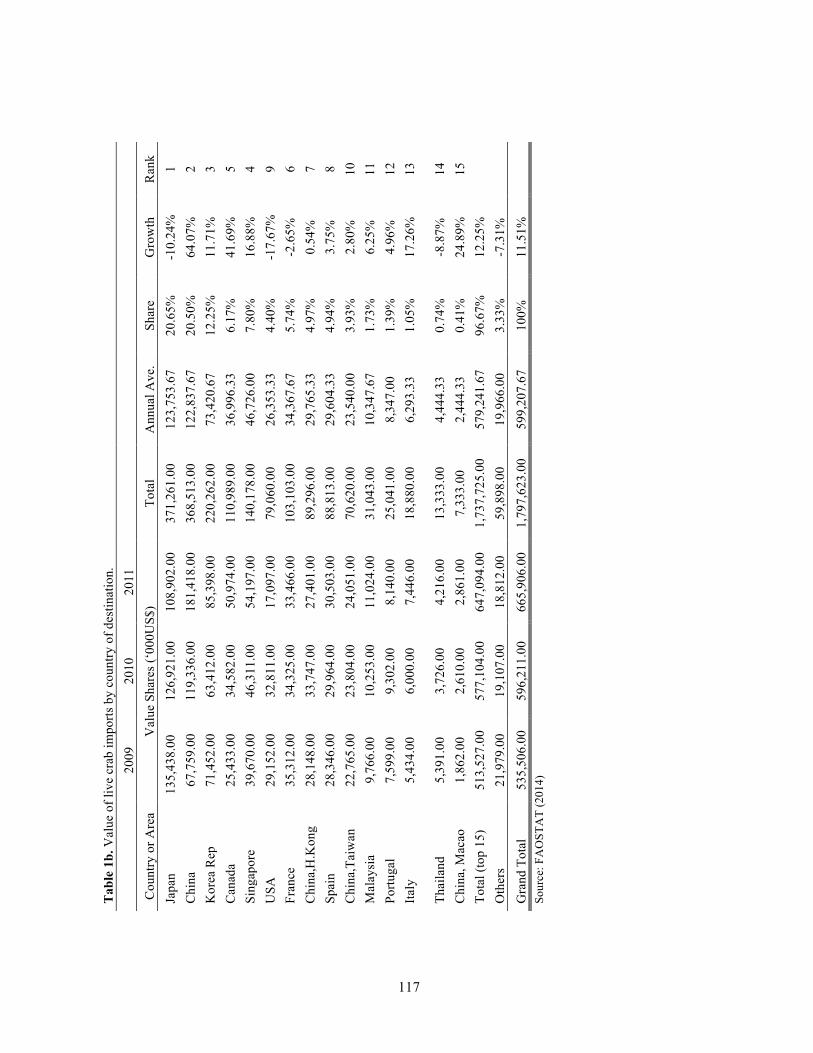
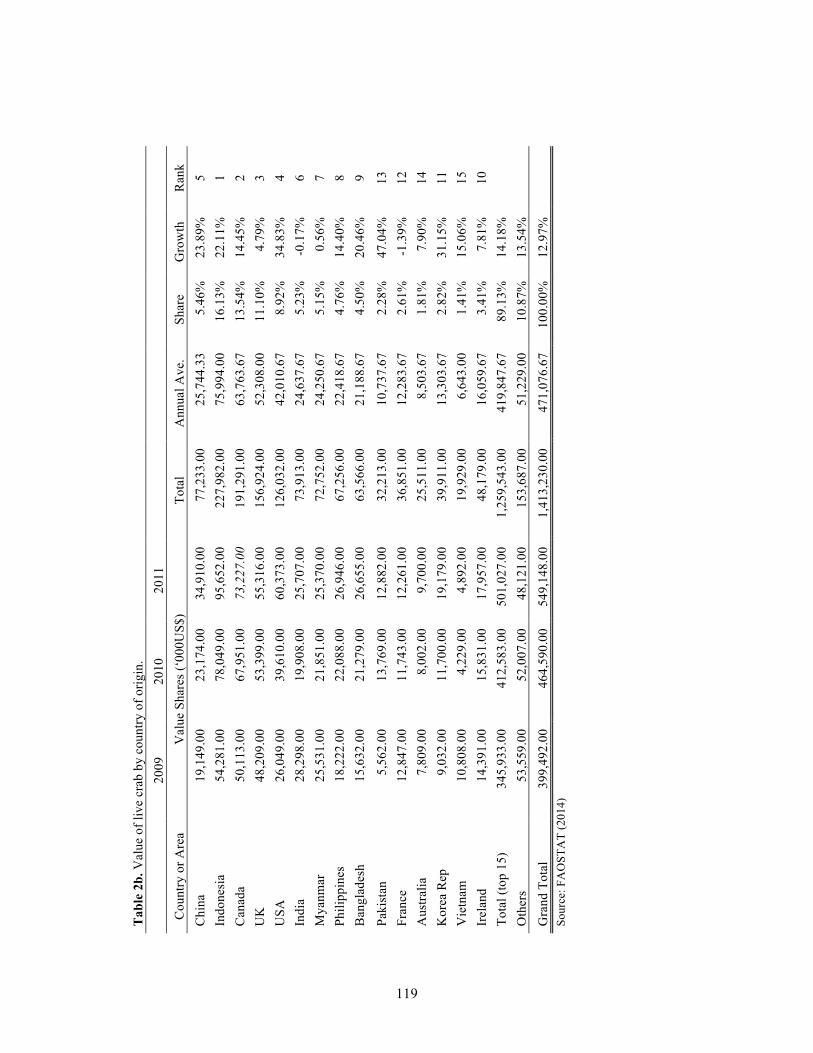
Moreover, the annual export volume of live crab is estimated to be more than 89,000 tons (FAOSTAT 2014). The world’s top three exporters of live crabs (Table 2a) are UK, Myanmar and Indonesia with respective yearly average export volume of 13,000 tons, 11,000 tons and 9,000 tons. Bangladesh is presently world’s ranked 6 earning around US$ 21 million by exporting more than 6,000 tons of live crabs to China, Hong Kong, Singapore and Malaysia.
The mud crab Scylla serrata is currently the most commercially important species and is widely distributed in the Indo-Pacific region, including the Bay of Bengal. Bangladesh has a coastline of 710 km with 618,780 hectares of mangrove tidal flat and 80,000 hectares of prime area which is suitable for brackish water aquaculture (Anon 2003). Mud crabs are indigenous in coastal waters of 15–30 ppt salinity. Shrimp and crab thrive in similar environmental conditions and are quite abundant in places 40–50 km inland from the Bay, in the creeks and canals of the brackish water estuaries (Khan and Alam 1991). Mostly non-Muslims, e.g., Hindu and Buddhists, are the traditional consumers. The majority of Muslim population does not accept mud crab as a food item. Nevertheless, attitudes are gradually changing in the Muslim community recently.
107
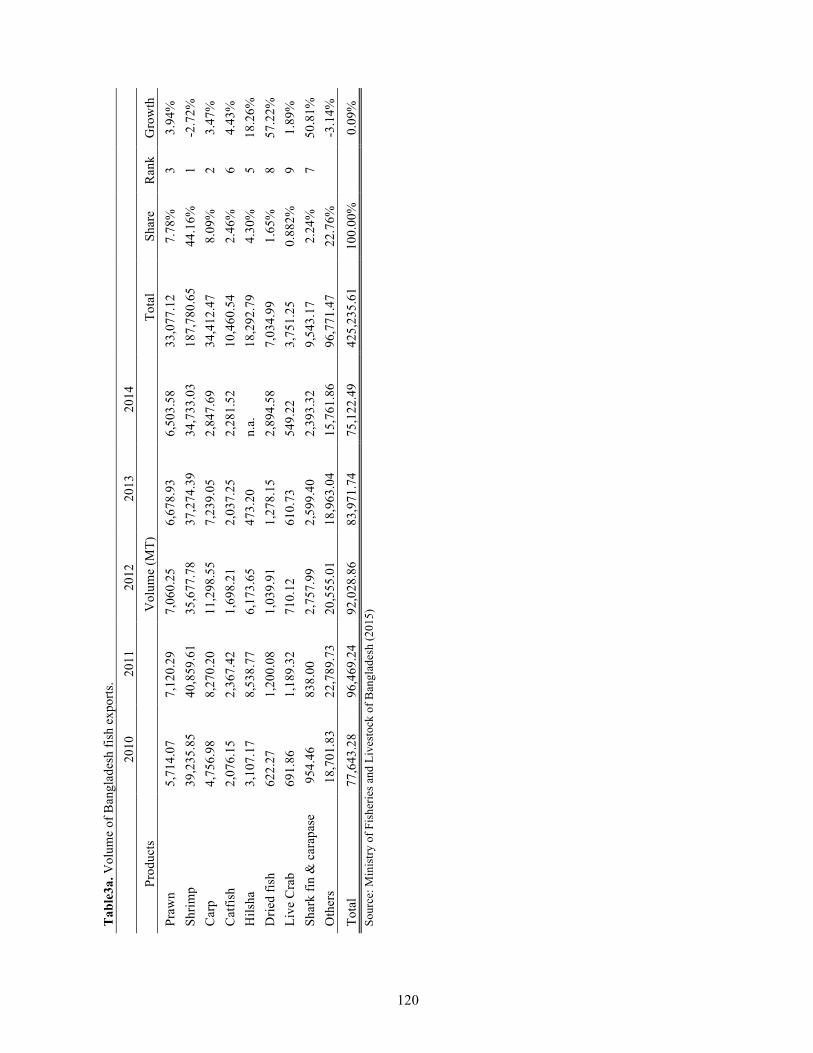
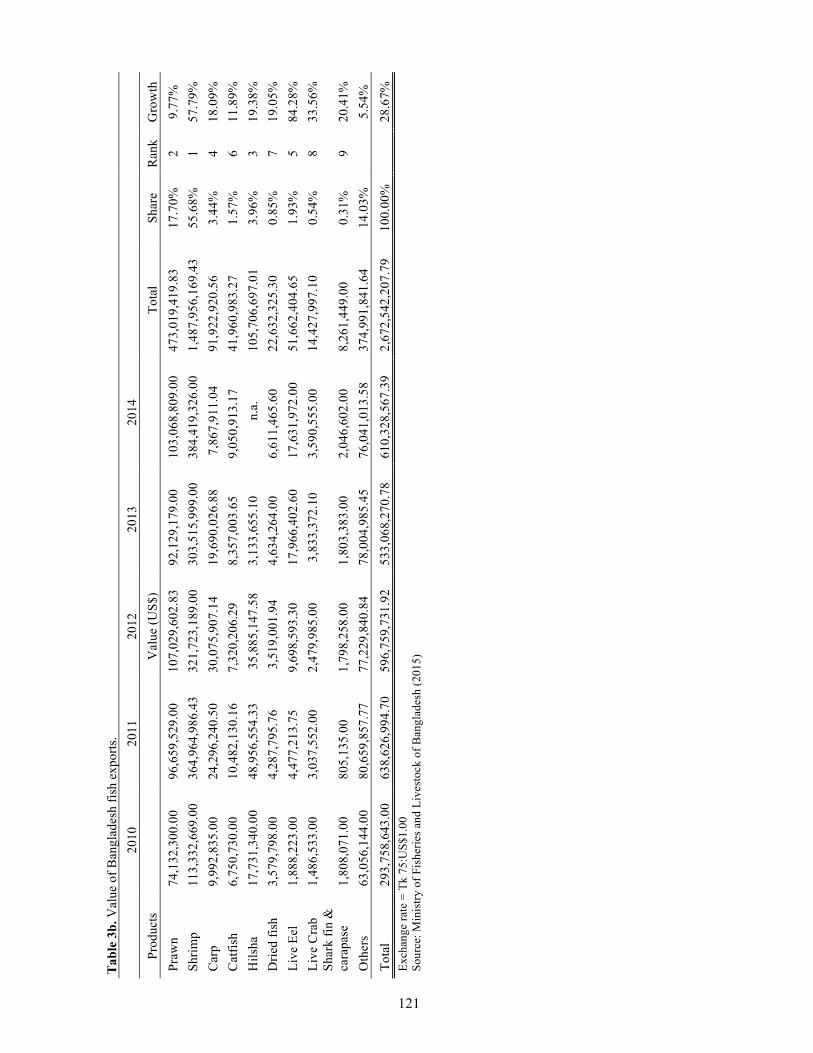
The trade performance of the aquaculture reflects its relative importance in the Bangladesh economy. Tables 3a and 3b registered the volume and value of the top 9 fish exports of Bangladesh from 2010 to 2014. Most of the production areas were located at Dhaka, Chittagong and Khulna districts. The total export earnings during the period are about US$2.7 billion with live crabs contributing around US$14 million. Although live crab is ranked 9 in terms of export share, it is now the third fastest growing export item with annual growth rate of about 34%, next to live eel and shrimp.
Women are more involved at the early stages such as collection of crablets, and fattening. The role of women in latter stages like product packaging, handling (outbound logistics) and processing is not substantial, but could be potential areas for their involvement. Crab collection is getting more risky and less sustainable. Moreover, establishment of crab hatcheries would improve the well being of women through more sustainable and secured sources of crab seedstocks.
Key players and roles in the mud crab value chain. The key players in the value chain generally includes the following:
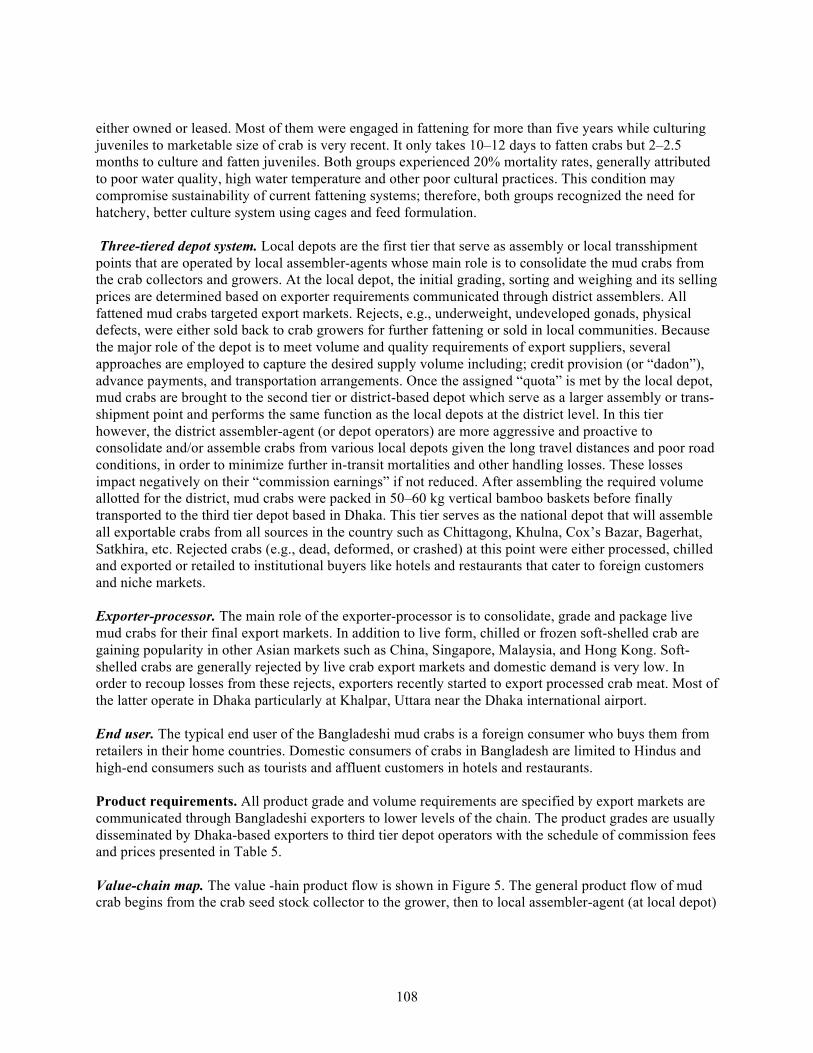
Crab collector. The crab collectors who are most often women are responsible for catching crabs from Sundarbans or mangrove forests (63%), shrimp gher pond (26%), and rivers (11%) then sells them to the nearby mud crab growers and agent-assemblers at local depots. The common collecting gears used are rope with series of baits deployed in shallow part of the mangrove forest or deep canals and crabs lured with the baits are scooped or caught using hook, bamboo tube traps, rakes, scoop nets, and net box-type traps (Figure 2). Usually, traps are deployed from 09:00–10:00 h and retrieved at 18:00 h depending on the tide level and season. The duration of collection is 8–10 hours. Higher volume of crabs (15–20 kg/day) is collected during the peak season (June–August) while about 10 kg/day of crabs is gathered during the lean season (December–February) per collector. The size range of crabs collected is 50–200 g. Crabs with < 150g BW are sold to crab fatteners while crabs with >150 g BW are brought to and sold to primary or local depot. Most collectors have been engaged in this activity for more than 10 years now. Some collectors were also mud crab growers and directly deal with local depots who are their regular creditor-financiers. In addition to the declining and unstable crabs caught in the area, the cost of getting no objection certificate (NOC) and related government fees are becoming more stringent and prohibitive. Accordingly, collection of crabs and small crab deeper into the mangrove forests and rivers are too risky from extortions or harassments by pirates or bandits hovering inside the forests in addition to the threats of wild animal attacks.
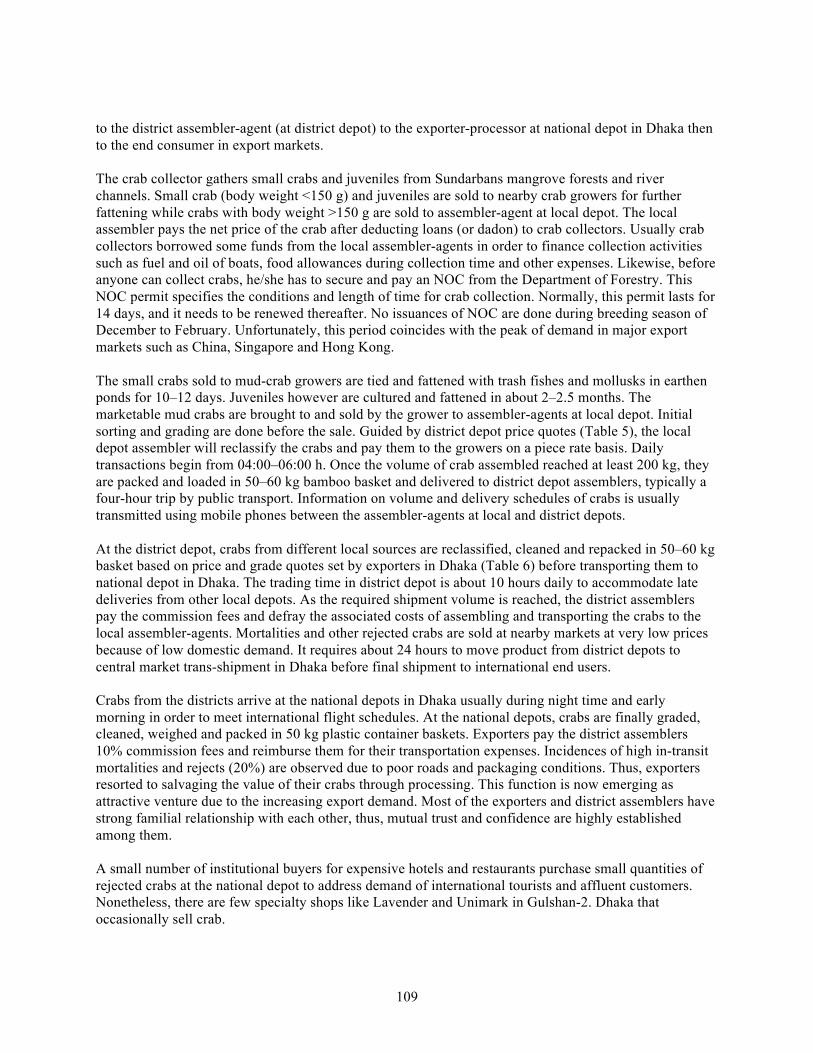
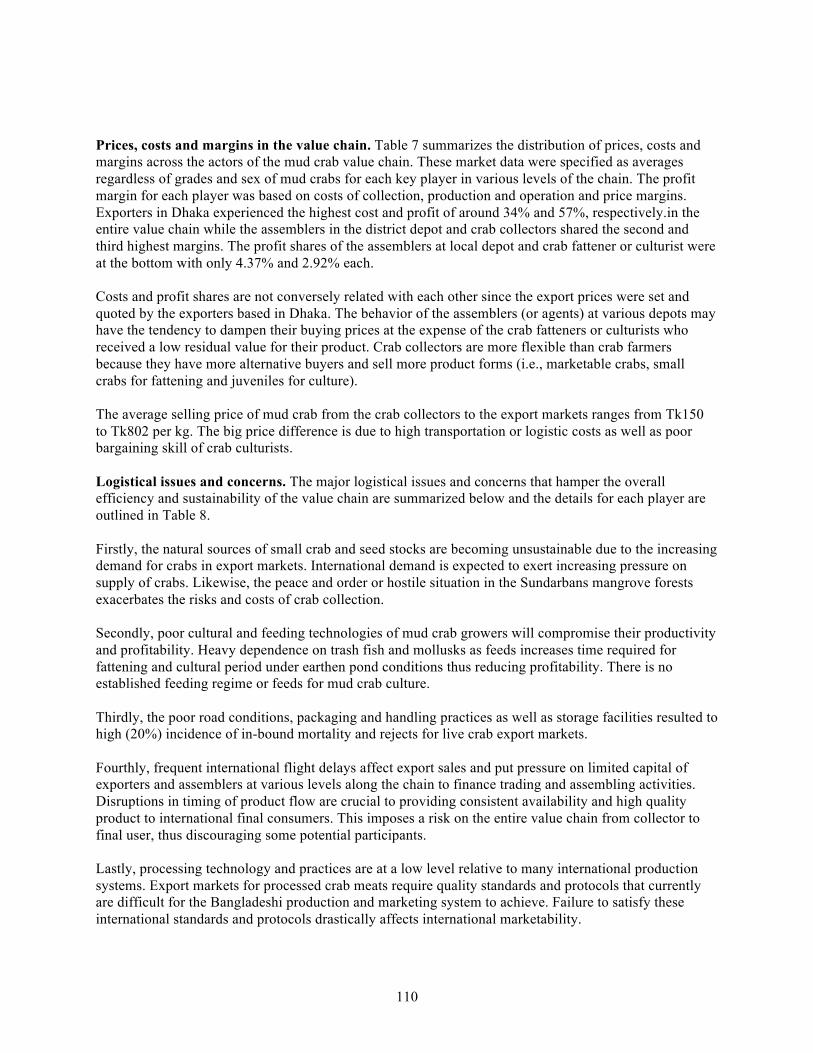
Mud crab grower. The mud crab grower is responsible for fattening small crab collected from mangrove forests, rivers and coastal areas to meet the product grade requirements of the major export markets such as China, Malaysia, Singapore, Hongkong and others. Khulna, Satkhira and Bagerhat Districts of Southwest Bangladesh are the major mud crab farms areas. Scylla olivacea or the orange mud crab is the major mud crab species in the region (Figure 3). Crabs with a body weight (BW) of >150 grams are fattened to 180-200 g BW in about 10–12 days. During the fattening period mud crabs were tied to prevent them from escaping and fed with tilapia and mollusks. The unavailability of formulated diet cannot reduce their dependence on fish and mollusks. Water change is through the natural inflow and outflow of tidal water. The water parameters in the earthen ponds (either with or without bamboo fence, Figure 4.) are normally not monitored.
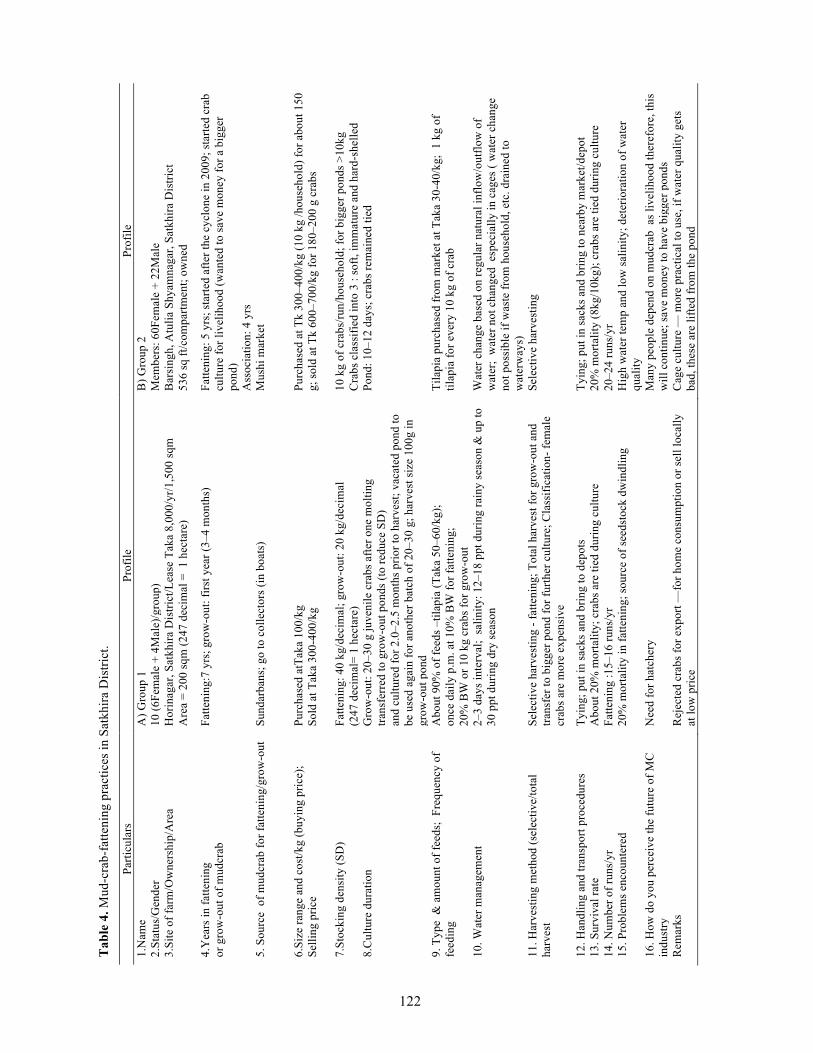
A brief farm profile and crab fattening practices among two groups in Satkhira and Bagerhat districts are outlined in Table 4. Generally, both groups relied on wild crab seed stocks (through crab collectors) that are inconsistent in quality and availability. All growers operated in ponds less than 1 hectare that they
108
either owned or leased. Most of them were engaged in fattening for more than five years while culturing juveniles to marketable size of crab is very recent. It only takes 10–12 days to fatten crabs but 2–2.5 months to culture and fatten juveniles. Both groups experienced 20% mortality rates, generally attributed to poor water quality, high water temperature and other poor cultural practices. This condition may compromise sustainability of current fattening systems; therefore, both groups recognized the need for hatchery, better culture system using cages and feed formulation.
Three-tiered depot system. Local depots are the first tier that serve as assembly or local transshipment points that are operated by local assembler-agents whose main role is to consolidate the mud crabs from the crab collectors and growers. At the local depot, the initial grading, sorting and weighing and its selling prices are determined based on exporter requirements communicated through district assemblers. All fattened mud crabs targeted export markets. Rejects, e.g., underweight, undeveloped gonads, physical defects, were either sold back to crab growers for further fattening or sold in local communities. Because the major role of the depot is to meet volume and quality requirements of export suppliers, several approaches are employed to capture the desired supply volume including; credit provision (or “dadon”), advance payments, and transportation arrangements. Once the assigned “quota” is met by the local depot, mud crabs are brought to the second tier or district-based depot which serve as a larger assembly or trans-shipment point and performs the same function as the local depots at the district level. In this tier however, the district assembler-agent (or depot operators) are more aggressive and proactive to consolidate and/or assemble crabs from various local depots given the long travel distances and poor road conditions, in order to minimize further in-transit mortalities and other handling losses. These losses impact negatively on their “commission earnings” if not reduced. After assembling the required volume allotted for the district, mud crabs were packed in 50–60 kg vertical bamboo baskets before finally transported to the third tier depot based in Dhaka. This tier serves as the national depot that will assemble all exportable crabs from all sources in the country such as Chittagong, Khulna, Cox’s Bazar, Bagerhat, Satkhira, etc. Rejected crabs (e.g., dead, deformed, or crashed) at this point were either processed, chilled and exported or retailed to institutional buyers like hotels and restaurants that cater to foreign customers and niche markets.
Exporter-processor. The main role of the exporter-processor is to consolidate, grade and package live mud crabs for their final export markets. In addition to live form, chilled or frozen soft-shelled crab are gaining popularity in other Asian markets such as China, Singapore, Malaysia, and Hong Kong. Soft-shelled crabs are generally rejected by live crab export markets and domestic demand is very low. In order to recoup losses from these rejects, exporters recently started to export processed crab meat. Most of the latter operate in Dhaka particularly at Khalpar, Uttara near the Dhaka international airport.
End user. The typical end user of the Bangladeshi mud crabs is a foreign consumer who buys them from retailers in their home countries. Domestic consumers of crabs in Bangladesh are limited to Hindus and high-end consumers such as tourists and affluent customers in hotels and restaurants.
Product requirements. All product grade and volume requirements are specified by export markets are communicated through Bangladeshi exporters to lower levels of the chain. The product grades are usually disseminated by Dhaka-based exporters to third tier depot operators with the schedule of commission fees and prices presented in Table 5.
Value-chain map. The value -hain product flow is shown in Figure 5. The general product flow of mud crab begins from the crab seed stock collector to the grower, then to local assembler-agent (at local depot)
109
to the district assembler-agent (at district depot) to the exporter-processor at national depot in Dhaka then to the end consumer in export markets.
The crab collector gathers small crabs and juveniles from Sundarbans mangrove forests and river channels. Small crab (body weight <150 g) and juveniles are sold to nearby crab growers for further fattening while crabs with body weight >150 g are sold to assembler-agent at local depot. The local assembler pays the net price of the crab after deducting loans (or dadon) to crab collectors. Usually crab collectors borrowed some funds from the local assembler-agents in order to finance collection activities such as fuel and oil of boats, food allowances during collection time and other expenses. Likewise, before anyone can collect crabs, he/she has to secure and pay an NOC from the Department of Forestry. This NOC permit specifies the conditions and length of time for crab collection. Normally, this permit lasts for 14 days, and it needs to be renewed thereafter. No issuances of NOC are done during breeding season of December to February. Unfortunately, this period coincides with the peak of demand in major export markets such as China, Singapore and Hong Kong.
The small crabs sold to mud-crab growers are tied and fattened with trash fishes and mollusks in earthen ponds for 10–12 days. Juveniles however are cultured and fattened in about 2–2.5 months. The marketable mud crabs are brought to and sold by the grower to assembler-agents at local depot. Initial sorting and grading are done before the sale. Guided by district depot price quotes (Table 5), the local depot assembler will reclassify the crabs and pay them to the growers on a piece rate basis. Daily transactions begin from 04:00–06:00 h. Once the volume of crab assembled reached at least 200 kg, they are packed and loaded in 50–60 kg bamboo basket and delivered to district depot assemblers, typically a four-hour trip by public transport. Information on volume and delivery schedules of crabs is usually transmitted using mobile phones between the assembler-agents at local and district depots.
At the district depot, crabs from different local sources are reclassified, cleaned and repacked in 50–60 kg basket based on price and grade quotes set by exporters in Dhaka (Table 6) before transporting them to national depot in Dhaka. The trading time in district depot is about 10 hours daily to accommodate late deliveries from other local depots. As the required shipment volume is reached, the district assemblers pay the commission fees and defray the associated costs of assembling and transporting the crabs to the local assembler-agents. Mortalities and other rejected crabs are sold at nearby markets at very low prices because of low domestic demand. It requires about 24 hours to move product from district depots to central market trans-shipment in Dhaka before final shipment to international end users.
Crabs from the districts arrive at the national depots in Dhaka usually during night time and early morning in order to meet international flight schedules. At the national depots, crabs are finally graded, cleaned, weighed and packed in 50 kg plastic container baskets. Exporters pay the district assemblers 10% commission fees and reimburse them for their transportation expenses. Incidences of high in-transit mortalities and rejects (20%) are observed due to poor roads and packaging conditions. Thus, exporters resorted to salvaging the value of their crabs through processing. This function is now emerging as attractive venture due to the increasing export demand. Most of the exporters and district assemblers have strong familial relationship with each other, thus, mutual trust and confidence are highly established among them.
A small number of institutional buyers for expensive hotels and restaurants purchase small quantities of rejected crabs at the national depot to address demand of international tourists and affluent customers. Nonetheless, there are few specialty shops like Lavender and Unimark in Gulshan-2. Dhaka that occasionally sell crab.
110
Prices, costs and margins in the value chain. Table 7 summarizes the distribution of prices, costs and margins across the actors of the mud crab value chain. These market data were specified as averages regardless of grades and sex of mud crabs for each key player in various levels of the chain. The profit margin for each player was based on costs of collection, production and operation and price margins. Exporters in Dhaka experienced the highest cost and profit of around 34% and 57%, respectively.in the entire value chain while the assemblers in the district depot and crab collectors shared the second and third highest margins. The profit shares of the assemblers at local depot and crab fattener or culturist were at the bottom with only 4.37% and 2.92% each.
Costs and profit shares are not conversely related with each other since the export prices were set and quoted by the exporters based in Dhaka. The behavior of the assemblers (or agents) at various depots may have the tendency to dampen their buying prices at the expense of the crab fatteners or culturists who received a low residual value for their product. Crab collectors are more flexible than crab farmers because they have more alternative buyers and sell more product forms (i.e., marketable crabs, small crabs for fattening and juveniles for culture).
The average selling price of mud crab from the crab collectors to the export markets ranges from Tk150 to Tk802 per kg. The big price difference is due to high transportation or logistic costs as well as poor bargaining skill of crab culturists.
Logistical issues and concerns. The major logistical issues and concerns that hamper the overall efficiency and sustainability of the value chain are summarized below and the details for each player are outlined in Table 8.
Firstly, the natural sources of small crab and seed stocks are becoming unsustainable due to the increasing demand for crabs in export markets. International demand is expected to exert increasing pressure on supply of crabs. Likewise, the peace and order or hostile situation in the Sundarbans mangrove forests exacerbates the risks and costs of crab collection.
Secondly, poor cultural and feeding technologies of mud crab growers will compromise their productivity and profitability. Heavy dependence on trash fish and mollusks as feeds increases time required for fattening and cultural period under earthen pond conditions thus reducing profitability. There is no established feeding regime or feeds for mud crab culture.
Thirdly, the poor road conditions, packaging and handling practices as well as storage facilities resulted to high (20%) incidence of in-bound mortality and rejects for live crab export markets.
Fourthly, frequent international flight delays affect export sales and put pressure on limited capital of exporters and assemblers at various levels along the chain to finance trading and assembling activities. Disruptions in timing of product flow are crucial to providing consistent availability and high quality product to international final consumers. This imposes a risk on the entire value chain from collector to final user, thus discouraging some potential participants.
Lastly, processing technology and practices are at a low level relative to many international production systems. Export markets for processed crab meats require quality standards and protocols that currently are difficult for the Bangladeshi production and marketing system to achieve. Failure to satisfy these international standards and protocols drastically affects international marketability.
111
External influences. The most crucial external influences that negatively influence the value chain of mud crab in Bangladesh are both natural and human. Frequent floods associated with heavy rains are natural events that will be difficult to mitigate. Poor water quality from human activities based on increasing population has no readily available short term solutions. Currently, there are few, if any, government programs to stimulate domestic consumption of crab. Fortunately, this is one external influence that can be easily addressed.
Recommendations and areas for improvement. To address the above issues and concerns, the following measures are recommended:
• Establishment of crab hatcheries — With crab hatcheries, the value chain will have more reliablesources of crab seeds that would insure regular and consistent supply of quality products. Apublic-private partnership scheme may be employed to capitalize this action, which would benefitwomen considerably as they are primarily involved in crab collection;
• Improve cultural and value adding technologies through tech transfer and credit programs —With improved technologies, productivity and efficiency would be attained in conformance withgood agricultural and manufacturing practices. These strategies would entail better measures forreducing grow out mortalities, shorter culture periods through better nutrition program, andundisrupted production and marketing schedules;
• Improve product packaging and handling system — Better product packaging will reduce in-transit mortalities and incidence of unmarketable product;
• Provision of efficient marketing infrastructures and promotion programs — The critical role ofgood farm-to-market roads and marketing infrastructure would ensure long-term viability of theentire value chain. Through an aggressive promotion program, domestic demand for crabs will beimproved and help boost overall sales; and
• Women’s role in latter stages of value chain, e.g., product packaging, handling (outboundlogistics) and processing, is not substantial. but could be potential areas for women involvement.Crab collection is getting more risky and less sustainable. Establishment of crab hatcheries wouldimprove the well being of women through more sustainable and secured sources of crabseedstocks.
CONCLUSION Mud crab culture and fattening in ponds is now an emerging activity in Bangladesh mud crab industry. This investigation has assessed the existing value chain of mud crab in Southwest region of Bangladesh and identified areas to improve the opportunities of women crab culturists through the value chain analysis.
The study covered three major producing mud crab districts, namely Khulna, Satkhira and Bagerhat. Tracer methodology was employed to identify respondents. A total of 146 respondents were interviewed composed of six crab collectors; 45 mud crab culturists; six operators (three in local/district-based depots and three in national or Dhaka-based depots), three soft-shelled crab processors and exporters of live crabs in Dhaka; on exporter association (with 86 active members) in Dhaka; and 10 consumers.
Of the world’s top exporters of live crab, Bangladesh is ranked 6, earning around US$21 million by exporting more than 6,000 tons of live crab to China, Hong Kong, Singapore and Malaysia in 2009–11. During that period, average total value and volume of live crab imports of the world’s top importers was US$600 million and 106,000 tons. These data indicate a tremendous opportunity for Bangladesh crab
112
exports. World demand is available if the Bangladesh crab sector can develop an adequate production-marketing system to meet international standards and protocols.
Crab has not been a generally accepted part of the diet of the majority Hindu population of Bangladesh. However, Muslim, who are a minority in Bangladesh, do consume crab and recently crab consumption by Hindu Bangladeshi’s is gaining acceptance. As a result, increasing demand for crab has both international and domestic components.
The trade performance of aquaculture reflects its relative importance in the Bangladesh economy. Most of the production areas were located in Dhaka, Chittagong and Khulna districts. Total export earnings during 2010–14 were about US$2.7 billion, with live crab contributing around US$14 million. Although live crab is ranked 9 in terms of export share, it is now the third fastest growing export item with annual growth rate of about 34%, behind only live eel and shrimp.
The value chain of mud crab is composed of crab collectors, crab growers or fatteners or culturists, assemblers at local depot, assemblers at district depot, assemblers at national depot, exporters-processors and end consumers. Because the major destination of live crabs are the export markets, the requirements regarding product grades, volume, sex and delivery schedules are imposed by the exporter-processors based on demand orders of foreign buyers. The condition of domestic demand at all levels does not make those small retailers and institutional buyers regular members of the value chain.
The product flow begins from collection of crabs from natural sources such as the Sundarbans mangrove forests and river channels. Small crab below marketable size and juveniles are sold to crab growers for fattening and culture. Marketable crabs are brought to and sold at local depot through an assembler-agent. After meeting a reasonable volume (as agreed between the assemblers at district and local depots), crabs are transported to district depots in bamboo baskets. The trading transaction in local depot is shorter (about 4 hours) than the district (about 10 hours) due to wider geographical spread of local depots serving the district depot. Dead, weak, deformed and cracked or broken shells crabs are rejected for export markets. Higher incidence of mortality and rejects are observed the longer the travel distance and time of crabs from the local depots to the national depot in Dhaka owing to the poor road conditions and packaging practices while in transit. The rejects and dead crabs are then processed at the exporters’ area in order to recoup losses in the process. With the continuing surge of export demand for processed crab meat, the processing function is now becoming a regular part of the value chain.
The requirements for export transactions are more rigorous. Delivery requirement is three times per week at 1,000–1,500 kg of per transaction. The quality requirement is more specific of the Scylla serrata species with differences in sizes and kind of fat for the different market such as: 200–500 g/pc, male or female with green fat for the Hong Kong market and 750–1,000 g/pc, male or female with green fat for the Singapore market. The mud crabs are generally packed in 50 kg plastic baskets before being exported.
Information regarding prices, grades, volumes and delivery schedules among chain actors are exchanged through mobile phones but internet exchanges are common between exporter-processor and importers in foreign markets. Only crab collectors, crab growers and assemblers at local depots conduct face-to-face communication. Such mode is more effective to address product quality and volume requirements and to facilitate crab payments and repayments of loans (dadon).
Cash transactions are generally observed across the value chain with some credit arrangements between the assemblers at local and district depots with crab collectors and crab growers. All other transactions
113
between the assemblers and the exporters are done in cash. Moreover, the payments of foreign buyers to the exporters in Dhaka are made through bank transfer.
Because price quotes and product requirements emanate from exporters, they dominated the price determination process across all segments of the value chain. Exporter cost and profit shares (about 57%) of the exporter dominated the other players in the value chain. The rest of the players shared the remaining profit with the crab growers and local assembler at the bottom. However, with the inclusion of loan cost (or dadon) of the crab collectors, the assembler at the local depot had a higher profit share.
Considering the volume of transactions, quality requirements, type of packaging, delivery schedules and payment transactions, the value chain reflected a reasonable degree of efficiency and responsiveness. There is evidence of good business relationships among key players due to trust gained from familial and socio-cultural affiliations.
The major logistical issues and concerns that hamper the overall efficiency and sustainability of the value chain are summarized below but the details for each player are outlined in Table 8.
Firstly, the natural sources of small crab and seed stocks are becoming unsustainable due to increasing export demand. This increasing international demand is expected to exert pressure on the supply of crabs based on wild stocks. Also, security issues in the Sundarbans mangrove forests, where these wild stocks are located, exacerbate the risk and cost of crab collection.
Secondly, the inadequate cultural and feeding technologies of mud crab growers will compromise their productivity and profitability. Heavy dependence on trash fish and mollusks as feeds might prolong the time needed for fattening and cultural period under earthen pond conditions, resulting in reduced profitability. There is no formulated diet for mud crab culture.
Thirdly, the poor road conditions, packaging and handling practices as well as storage facilities resulted to high (20%) incidence of in-transit mortality and rejects for the live crab export markets.
Fourthly, frequent international flight delays affect export sales and put pressure on limited trading capital of exporters and assemblers to finance forthcoming transactions. Inconsistent timing in the chain will add a source of risk that will reduce incentive to participate in the sector.
Lastly, the processing technology and practices are inadequate to meet international standards. Export markets for processed crab meats require rigorous quality standards and protocols. Failure to satisfy these international market standards dramatically affects the Bangladesh crab sector’s ability to become an important player in international markets.
The most crucial external influences that negatively influence the value chain of mud crab in Bangladesh are both natural and human. Frequent floods associated with heavy rains are natural events that will be difficult to mitigate. Poor water quality from human activities based on increasing population has no readily available short term solutions. Currently, there are few, if any, government programs to stimulate domestic consumption of crab. Fortunately, this is one external influence that can be easily addressed.
114
RECOMMENDATIONS To address the above issues and concerns, the following measures are recommended:
Establishment of crab hatcheries. With crab hatcheries, the value chain will have more reliable sources of crab seeds that would insure regular and consistent supply of quality products. A public-private partnership scheme may be employed to useful in pursuing this strategy. Establishment of hatcheries would provide greater security and employment opportunities for women who have traditionally collected crab from the wild.
Improve cultural and value adding technologies through tech transfer and credit programs. With improved technologies, productivity and efficiency would be attained in conformance with good agricultural and/or manufacturing practices. These strategies would entail a better measure of reducing grow out mortalities, shorter culture periods through better nutrition program and undisrupted production and marketing schedules.
Improve product packaging and handling system. With better designs of product packages, in-transit mortalities and rejects will be reduced.
Provision of efficient marketing infrastructures and promotion programs - the critical role of good farm-to-market roads and marketing infrastructures would ensure long term viability of the entire value chain. Through an aggressive promotion program, domestic demand for crabs will be improved and help boost overall sales of the value chain.
LITERATURE CITED Ali, M.Y., D. Kamal, S.M.M. Hossain, M.A. Azam, W. Sabbir, A. Mushida, B. Ahmed, and K. Azam,
2004. Biological studies of the mud crab, Scylla serrata (Forskål) of the Sundarbans mangrove ecosystem in Khulna region of Bangladesh. Pakistan J. Biol. Sci., 19967 (11): 1981–87.
Anon, 2003. Myanmar aquaculture and inland fisheries. RAP Publication 2003/18, FAO Regional Office For Asia and the Pacific, Bangkok, 62 pp.
Azam, K., D. Kamal, and M. Mostafa, 1998. Status and potential of mud crab (Scylla serrata) in Bangladesh. In: Rahman, M.A. M.S Shah, M.G. Murtaza, and M.A. Matin (eds.). Proc. Nat. Sem. Integr. Manage. Ganges Floodplains and Sundarbans Ecosystem, July 16–18, 1994. Khulna University, Bangladesh Agricultural Research Council and Department of Agricultural Extension. Khulna University, Bangladesh, 150–160.
Cooper, M.C., D.M. Lambert, and J.D. Pagh, 1997. Supply Chain Management: More than a New Name in Logistics. The International Journal of Logistics Management. 8 (1).
Department of Agriculture (DA), Region VI, 1988. Fattening mud crabs Scylla serrata in bamboo cages. Fish Extension Rep., Dept. of Agriculture, BFAR, Philippines. Development, dry weight and chemical composition of larvae of the mud crab Scylla paramamosain. Pages 159–166 in Keenan, C.P. and Blackshaw, A. W. (Eds.), Mud crab aquaculture and biology: Proceedings of an international scientific forum April 21–24. 1997. Australian Centre for International Agricultural Research, Canberra.
FAOSTAT (various issues), Food and Agriculture Organization Statistics Division. http://faostat3.fao.org/home/E
Ferdoushi, Z., and Z. Xiang-Guo, 2010a. Economic Analysis of Traditional Mud Crab (Scylla sp.) Fattening in Bangladesh. Marine Resource and Aquaculture 1(1):5-13.
Ferdoushi, Z. and Z. Xiang-Guo. 2010b. Role of Women in Mud Crab (Scylla sp.) Fattening in Southwest Part of Bangladesh. Marine Resource and Aquaculture 1(1):5-13.
115
Jamandre, W.E., and L.U. Hatch, 2010. Improving supply chain opportunities for tilapia in the Philippines. USAID CRSP Final Technical Report.
Khan, M.G., and M.F. Alam, 1991. The mud crab (Scylla serrata) fishery and its bio-economics in Bangladesh. BOBP/REP 51: 29-40.
Keenan, C.P., and A.W. Blackshaw (Editors), 1997. Mudcrab Aquaculture and Biology. Proceedings of an International Scientific Forum held in Darwin, Australia, 21–24 April 1997. ACIAR proceedings No. 78. Watson Ferguson and Company, Brisbane, Australia.
Kuntiyo, A., 1992. Fattening of mud crab, Scylla serrata Forskal , in net cages installed in the drain canal of intensive prawn ponds fed with trash fish and prawn pellate. MS Thesis. University of the Philippines in the Visayas. 60 pp.
Ministry of Fisheries and Livestock of Bangladesh, 2015. Value and Volume of Fisheries Export of Bangladesh (2010–2014)
Porter, M., 1985. Competitive Advantage: Creating and Sustaining Superior Performance. p33. The Free Press.
Ramasamy, C., 2007. Supply Chain Management in Agriculture: Trends, Status and Initiatives taken uin Tamil Nadu Agricultural University. Tamil Nadu Agricultural University.
Samarasinghe, R.P., D.Y. Fernando, and O.S.S.C. de Silva, 1992. Pond culture of mud crab in Sri Lanka. In : The mud crab. C.A. Angel (ed.). pp 161-164. Proceedings of the seminar on mud crab in Surat Thani, Thiland, 5-8 November 1991. Bay of Bengal Programme, Madras.
SEAFDEC, 1998. News letter Vol. 21, No. 1, January to March. http://www.spc.org.nc/Coastfish/News/Fish_News/85/NIAR_4.htm.
Sivasubramain, K., and C.A. Angel, 1992. A review of the culture, marketing and resources of the mud crab. In : The mud crab (ed. C.A. Angel). Bay of Bengal Program, Madras. India. 5–12.
Williamson, O., 1979. Transaction-cost economics: the governance contractual relations. J. Law and Econ. 22: 233–261.
Zafar, M., and M.Z.H. Saddiqui, 2000. Occurrence and abundance of four Brachyuran crabs in the Chakaraia Sundarban of Bangladesh. The Chittagong Univ. Jour. Sci., 24(2): 105–110.
116
Tab
le 1
a. V
olum
e of
live
cra
b im
ports
by
coun
try o
f des
tinat
ion.
20
09
2010
20
11
Cou
ntry
or A
rea
Vol
ume
Shar
es (i
n to
ns)
Tota
l A
nnua
l Ave
. Sh
are
Gro
wth
R
ank
Japa
n 31
,823
.00
18,5
77.0
0 12
,049
.00
62,4
49.0
0 20
,816
.33
19.6
1%
-38.
38%
2
Chi
na
16,0
95.0
0 23
,905
.00
30,6
53.0
0 70
,653
.00
23,5
51.0
0 22
.19%
38
.38%
1
Kor
ea R
ep
13,4
93.0
0 8,
623.
00
8,40
7.00
30
,523
.00
10,1
74.3
3 9.
59%
-1
9.30
%
3 C
anad
a 4,
254.
00
5,36
9.00
6,
891.
00
16,5
14.0
0 5,
504.
67
5.19
%
27.2
8%
6 Si
ngap
ore
5,46
9.00
5,
357.
00
5,5
78.0
0 1
6,40
4.00
5
,468
.00
5.15
%
1.04
%
7 U
SA
3,2
88.0
0 3,
414.
00
1,6
26.0
0 8
,328
.00
2,7
76.0
0 2.
62%
-2
4.27
%
12
Fran
ce
7,58
2.00
7,
119.
00
6,62
1.00
21
,322
.00
7,10
7.33
6.
70%
-6
.55%
5
Chi
na,H
.Kon
g 5,
096.
00
6,17
6.00
4,
145.
00
15,
417.
00
5,13
9.00
4.
84%
-5
.85%
8
Spai
n 8,
059.
00
7,88
2.00
8,
285.
00
24,
226.
00
8,07
5.33
7.
61%
1.
46%
4
Chi
na,T
aiw
an
4,20
6.00
4,
370.
00
4,38
3.00
12
,959
.00
4,31
9.67
4.
07%
2.
10%
9
Mal
aysi
a 3,
106.
00
3,02
1.00
3,
166.
00
9,29
3.00
3,
097.
67
2.92
%
1.03
%
10
Portu
gal
1,90
0.00
2,
117.
00
1,88
5.00
5,
902.
00
1,96
7.33
1.
85%
0.
23%
13
Ita
ly
853.
00
881.
00
1,20
1.00
2,
935.
00
978.
33
0.92
%
19.8
0%
14
Thai
land
3,
608.
00
2,42
4.00
2,
395.
00
8,42
7.00
2,
809.
00
2.65
%
-17.
01%
11
C
hina
, Mac
ao
751.
00
799.
00
592
.00
2,14
2.00
71
4.00
0.
67%
-9
.76%
15
To
tal (
top
15)
109,
583.
00
100,
034.
00
97,8
77.0
0 30
7,49
4.00
10
2,49
8.00
96
.57%
-5
.44%
O
ther
s 4,
010.
00
3,61
5.00
3,
283.
00
10,
908.
00
3,63
6.00
3.
43%
-9
.52%
G
rand
Tot
al
113,
593.
00
103,
649.
00
101,
160.
00
318
,402
.00
106
,134
.00
100%
-5
.58%
Sour
ce: F
AO
STA
T (2
014)
���
7$%/(6�$1'�),*85(6
117
Tab
le 1
b. V
alue
of l
ive
crab
impo
rts b
y co
untry
of d
estin
atio
n.
2009
20
10
2011
C
ount
ry o
r Are
a V
alue
Sha
res (
‘000
US$
) To
tal
Ann
ual A
ve.
Shar
e G
row
th
Ran
k Ja
pan
135,
438.
00
126,
921.
00
108,
902.
00
371,
261.
00
123,
753.
67
20.6
5%
-10.
24%
1
Chi
na
67,7
59.0
0 11
9,33
6.00
18
1,41
8.00
36
8,51
3.00
12
2,83
7.67
20
.50%
64
.07%
2
Kor
ea R
ep
71,4
52.0
0 63
,412
.00
85,3
98.0
0 22
0,26
2.00
73
,420
.67
12.2
5%
11.7
1%
3 C
anad
a 25
,433
.00
34,5
82.0
0 50
,974
.00
110,
989.
00
36,9
96.3
3 6.
17%
41
.69%
5
Sing
apor
e 39
,670
.00
46,3
11.0
0 54
,197
.00
140,
178.
00
46,7
26.0
0 7.
80%
16
.88%
4
USA
29
,152
.00
32,8
11.0
0 17
,097
.00
79,0
60.0
0 26
,353
.33
4.40
%
-17.
67%
9
Fran
ce
35,3
12.0
0 34
,325
.00
33,4
66.0
0 10
3,10
3.00
34
,367
.67
5.74
%
-2.6
5%
6 C
hina
,H.K
ong
28,1
48.0
0 33
,747
.00
27,4
01.0
0 89
,296
.00
29,7
65.3
3 4.
97%
0.
54%
7
Spai
n 28
,346
.00
29,9
64.0
0 30
,503
.00
88,8
13.0
0 29
,604
.33
4.94
%
3.75
%
8 C
hina
,Tai
wan
22
,765
.00
23,8
04.0
0 24
,051
.00
70,6
20.0
0 23
,540
.00
3.93
%
2.80
%
10
Mal
aysi
a 9,
766.
00
10,2
53.0
0 11
,024
.00
31,0
43.0
0 10
,347
.67
1.73
%
6.25
%
11
Portu
gal
7,59
9.00
9,
302.
00
8,14
0.00
25
,041
.00
8,34
7.00
1.
39%
4.
96%
12
Ita
ly
5,43
4.00
6,
000.
00
7,44
6.00
18
,880
.00
6,29
3.33
1.
05%
17
.26%
13
Thai
land
5,
391.
00
3,72
6.00
4,
216.
00
13,3
33.0
0 4,
444.
33
0.74
%
-8.8
7%
14
Chi
na, M
acao
1,
862.
00
2,61
0.00
2,
861.
00
7,33
3.00
2,
444.
33
0.41
%
24.8
9%
15
Tota
l (to
p 15
) 51
3,52
7.00
57
7,10
4.00
64
7,09
4.00
1,
737,
725.
00
579,
241.
67
96.6
7%
12.2
5%
Oth
ers
21,9
79.0
0 19
,107
.00
18,8
12.0
0 59
,898
.00
19,9
66.0
0 3.
33%
-7
.31%
G
rand
Tot
al
535,
506.
00
596,
211.
00
665,
906.
00
1,79
7,62
3.00
59
9,20
7.67
10
0%
11.5
1%
Sour
ce: F
AO
STA
T (2
014)
118
Tab
le 2
a. V
olum
e of
live
cra
b by
cou
ntry
of o
rigin
. 20
09
2010
20
11
Cou
ntry
or A
rea
Vol
ume
Shar
e (to
nne)
To
tal
Ann
ual A
ve.
Shar
e G
row
th
Ran
k C
hina
3,
591.
00
3,58
0.00
3,
457.
00
10,6
28.0
0 3,
542.
67
3.94
%
-1.2
5%
9 In
done
sia
7,74
3.00
9,
347.
00
11,8
15.0
0 28
,905
.00
9,63
5.00
10
.72%
15
.71%
3
Can
ada
6,29
2.00
7,
859.
00
7,15
5.00
21
,306
.00
7,10
2.00
7.
90%
5.
32%
5
UK
14
,008
.00
13,8
24.0
0 13
,096
.00
40,9
28.0
0 13
,642
.67
15.1
8%
-2.1
9%
1 U
SA
5,94
1.00
7,
756.
00
12,1
36.0
0 25
,833
.00
8,61
1.00
9.
58%
29
.01%
4
Indi
a 5,
808.
00
3,21
3.00
3,
102.
00
12,1
23.0
0 4,
041.
00
4.50
%
16.0
4%
8 M
yanm
ar
12,5
87.0
0 11
,731
.00
11,4
42.0
0 35
,760
.00
11,9
20.0
0 13
.27%
-3
.09%
2
Phili
ppin
es
2,98
4.00
3,
316.
00
4,20
8.00
10
,508
.00
3,50
2.67
3.
90%
12
.68%
10
B
angl
ades
h 5,
147.
00
6,89
0.00
7,
044.
00
19,0
81.0
0 6,
360.
33
7.08
%
12.0
3%
6 Pa
kist
an
3,18
5.00
6,
361.
00
5,57
4.00
15
,120
.00
5,04
0.00
5.
61%
29
.12%
7
Fran
ce
2,25
2.00
2,
051.
00
1,94
6.00
6,
249.
00
2,08
3.00
2.
32%
-4
.68%
12
A
ustra
lia
617.
00
506.
00
502.
00
1,62
5.00
54
1.67
0.
60%
-6
.26%
15
K
orea
Rep
54
9.00
49
5.00
71
1.00
1,
755.
00
585.
00
0.65
%
11.2
7%
14
Vie
t Nam
1,
597.
00
720.
00
830.
00
3,14
7.00
1,
049.
00
1.17
%
13.2
1%
13
Irel
and
3,15
9.00
3,
200.
00
3,12
8.00
9,
487.
00
3,16
2.33
3.
52%
-0
.32%
11
To
tal (
top
15)
75,4
60.0
0 80
,849
.00
86,1
46.0
0 24
2,45
5.00
80
,818
.33
89.9
5%
4.54
%
Oth
ers
10,1
47.0
0 9,
602.
00
7,34
9.00
27
,098
.00
9,03
2.67
10
.05%
4.
92%
Gra
nd T
otal
85
,607
.00
90,4
51.0
0 93
,495
.00
269,
553.
00
89,8
51.0
0 10
0.00
%
4.21
%
Sour
ce: F
AO
STA
T (2
014)
119
Tab
le 2
b. V
alue
of l
ive
crab
by
coun
try o
f orig
in.
2009
20
10
2011
C
ount
ry o
r Are
a V
alue
Sha
res (
‘000
US$
) To
tal
Ann
ual A
ve.
Shar
e G
row
th
Ran
k C
hina
19
,149
.00
23,1
74.0
0 34
,910
.00
77,2
33.0
0 25
,744
.33
5.46
%
23.8
9%
5 In
done
sia
54,2
81.0
0 78
,049
.00
95,6
52.0
0 22
7,98
2.00
75
,994
.00
16.1
3%
22.1
1%
1 C
anad
a 50
,113
.00
67,9
51.0
0 73
,227
.00
191,
291.
00
63,7
63.6
7 13
.54%
14
.45%
2
UK
48
,209
.00
53,3
99.0
0 55
,316
.00
156,
924.
00
52,3
08.0
0 11
.10%
4.
79%
3
USA
26
,049
.00
39,6
10.0
0 60
,373
.00
126,
032.
00
42,0
10.6
7 8.
92%
34
.83%
4
Indi
a 28
,298
.00
19,9
08.0
0 25
,707
.00
73,9
13.0
0 24
,637
.67
5.23
%
-0.1
7%
6 M
yanm
ar
25,5
31.0
0 21
,851
.00
25,3
70.0
0 72
,752
.00
24,2
50.6
7 5.
15%
0.
56%
7
Phili
ppin
es
18,2
22.0
0 22
,088
.00
26,9
46.0
0 67
,256
.00
22,4
18.6
7 4.
76%
14
.40%
8
Ban
glad
esh
15,6
32.0
0 21
,279
.00
26,6
55.0
0 63
,566
.00
21,1
88.6
7 4.
50%
20
.46%
9
Paki
stan
5,
562.
00
13,7
69.0
0 12
,882
.00
32,2
13.0
0 10
,737
.67
2.28
%
47.0
4%
13
Fran
ce
12,8
47.0
0 11
,743
.00
12,2
61.0
0 36
,851
.00
12,2
83.6
7 2.
61%
-1
.39%
12
A
ustra
lia
7,80
9.00
8,
002.
00
9,70
0.00
25
,511
.00
8,50
3.67
1.
81%
7.
90%
14
K
orea
Rep
9,
032.
00
11,7
00.0
0 19
,179
.00
39,9
11.0
0 13
,303
.67
2.82
%
31.1
5%
11
Vie
tnam
10
,808
.00
4,22
9.00
4,
892.
00
19,9
29.0
0 6,
643.
00
1.41
%
15.0
6%
15
Irel
and
14,3
91.0
0 15
,831
.00
17,9
57.0
0 48
,179
.00
16,0
59.6
7 3.
41%
7.
81%
10
To
tal (
top
15)
345,
933.
00
412,
583.
00
501,
027.
00
1,25
9,54
3.00
41
9,84
7.67
89
.13%
14
.18%
O
ther
s 53
,559
.00
52,0
07.0
0 48
,121
.00
153,
687.
00
51,2
29.0
0 10
.87%
13
.54%
G
rand
Tot
al
399,
492.
00
464,
590.
00
549,
148.
00
1,41
3,23
0.00
47
1,07
6.67
10
0.00
%
12.9
7%
Sour
ce: F
AO
STA
T (2
014)
120
Tab
le3a
. Vol
ume
of B
angl
ades
h fis
h ex
ports
. 20
10
2011
20
12
2013
20
14
Prod
ucts
V
olum
e (M
T)
Tota
l Sh
are
Ran
k G
row
th
Praw
n 5,
714.
07
7,12
0.29
7,
060.
25
6,67
8.93
6,
503.
58
33,0
77.1
2 7.
78%
3
3.94
%
Shrim
p 39
,235
.85
40,8
59.6
1 35
,677
.78
37,2
74.3
9 34
,733
.03
187,
780.
65
44.1
6%
1 -2
.72%
C
arp
4,75
6.98
8,
270.
20
11,2
98.5
5 7,
239.
05
2,84
7.69
34
,412
.47
8.09
%
2 3.
47%
C
atfis
h 2,
076.
15
2,36
7.42
1,
698.
21
2,03
7.25
2,
281.
52
10,4
60.5
4 2.
46%
6
4.43
%
Hils
ha
3,10
7.17
8,
538.
77
6,17
3.65
47
3.20
n.
a.
18,2
92.7
9 4.
30%
5
18.2
6%
Drie
d fis
h 62
2.27
1,
200.
08
1,03
9.91
1,
278.
15
2,89
4.58
7,
034.
99
1.65
%
8 57
.22%
Li
ve C
rab
691.
86
1,18
9.32
71
0.12
61
0.73
54
9.22
3,
751.
25
0.88
2%
9 1.
89%
Sh
ark
fin &
car
apas
e 9
54.4
6 83
8.00
2,
757.
99
2,59
9.40
2,
393.
32
9,54
3.17
2.
24%
7
50.8
1%
Oth
ers
18,
701.
83
22,7
89.7
3 20
,555
.01
18,9
63.0
4 15
,761
.86
96,7
71.4
7 22
.76%
-3
.14%
Tota
l 77
,643
.28
96,4
69.2
4 92
,028
.86
83,9
71.7
4 75
,122
.49
425,
235.
61
100.
00%
0.
09%
So
urce
: Min
istry
of F
ishe
ries a
nd L
ives
tock
of B
angl
ades
h (2
015)
121
2010
20
11
2012
20
13
2014
Pr
oduc
ts
Val
ue (U
S$)
Tota
l Sh
are
Ran
k G
row
th
Praw
n 74
,132
,300
.00
96,6
59,5
29.0
0 10
7,02
9,60
2.83
92
,129
,179
.00
103,
068,
809.
00
473,
019,
419.
83
17.7
0%
2 9.
77%
Sh
rimp
113,
332,
669.
00
364,
964,
986.
43
321,
723,
189.
00
303,
515,
999.
00
384,
419,
326.
00
1,48
7,95
6,16
9.43
55
.68%
1
57.7
9%
Car
p 9,
992,
835.
00
24,2
96,2
40.5
0 30
,075
,907
.14
19,6
90,0
26.8
8 7
,867
,911
.04
91,9
22,9
20.5
6 3.
44%
4
18.0
9%
Cat
fish
6,75
0,73
0.00
10
,482
,130
.16
7,32
0,20
6.29
8,
357,
003.
65
9,05
0,91
3.17
41
,960
,983
.27
1.57
%
6 11
.89%
H
ilsha
17
,731
,340
.00
48,9
56,5
54.3
3 3
5,88
5,14
7.58
3,
133,
655.
10
n.a
. 10
5,70
6,69
7.01
3.
96%
3
19.3
8%
Drie
d fis
h 3,
579,
798.
00
4,28
7,79
5.76
3
,519
,001
.94
4,63
4,26
4.00
6,
611,
465.
60
22,6
32,3
25.3
0 0.
85%
7
19.0
5%
Live
Eel
1,
888,
223.
00
4,47
7,21
3.75
9,
698,
593.
30
17,9
66,4
02.6
0 17
,631
,972
.00
51,6
62,4
04.6
5 1.
93%
5
84.2
8%
Live
Cra
b 1,
486,
533.
00
3,03
7,55
2.00
2,
479,
985.
00
3,8
33,3
72.1
0 3,
590,
555.
00
14,4
27,9
97.1
0 0.
54%
8
33.5
6%
Shar
k fin
&
cara
pase
1,
808,
071.
00
805,
135.
00
1,79
8,25
8.00
1,
803,
383.
00
2,04
6,60
2.00
8,
261,
449.
00
0.31
%
9 20
.41%
O
ther
s 63
,056
,144
.00
80,6
59,8
57.7
7 77
,229
,840
.84
78,0
04,9
85.4
5 76
,041
,013
.58
374,
991,
841.
64
14.0
3%
5.54
%
Tota
l 29
3,75
8,64
3.00
63
8,62
6,99
4.70
59
6,75
9,73
1.92
53
3,06
8,27
0.78
61
0,32
8,56
7.39
2,
672,
542,
207.
79
100.
00%
28
.67%
Ex
chan
ge ra
te =
Tk
75:U
S$1.
00
Sour
ce: M
inis
try o
f Fis
herie
s and
Liv
esto
ck o
f Ban
glad
esh
(201
5)
Tab
le 3
b. V
alue
of B
angl
ades
h fis
h ex
ports
.
122
Tab
le 4
. Mud
-cra
b-fa
tteni
ng p
ract
ices
in S
atkh
ira D
istri
ct.
Parti
cula
rs
Prof
ile
Prof
ile
1.N
ame
A)G
roup
1B
)Gro
up 2
2.St
atus
/Gen
der
10 (6
Fem
ale
+ 4M
ale)
/gro
up)
Mem
bers
: 60F
emal
e +
22M
ale
3.Si
te o
f far
m/O
wne
rshi
p/A
rea
Hor
inag
ar, S
atkh
ira D
istri
ct/L
ease
Tak
a 8,
000/
yr/1
,500
sqm
A
rea
= 20
0 sq
m (2
47 d
ecim
al =
1 h
ecta
re)
Bar
sing
h, A
tulia
Shy
amna
gar,
Satk
hira
Dis
trict
53
6 sq
ft/c
ompa
rtmen
t; ow
ned
4.Y
ears
in fa
tteni
ngor
gro
w-o
ut o
f mud
crab
Fa
tteni
ng:7
yrs
; gro
w-o
ut: f
irst y
ear (
3–4
mon
ths)
Fa
tteni
ng: 5
yrs
; sta
rted
afte
r the
cyc
lone
in 2
009;
star
ted
crab
cu
lture
for l
ivel
ihoo
d (w
ante
d to
save
mon
ey fo
r a b
igge
r po
nd)
Ass
ocia
tion:
4 y
rs
5.So
urce
of m
udcr
ab fo
r fat
teni
ng/g
row
-out
Su
ndar
bans
; go
to c
olle
ctor
s (in
boa
ts)
Mus
hi m
arke
t
6.Si
ze ra
nge
and
cost
/kg
(buy
ing
pric
e);
Selli
ng p
rice
Purc
hase
d at
Taka
100
/kg
Sold
at T
aka
300-
400/
kg
Purc
hase
d at
Tk
300–
400/
kg (1
0 kg
/hou
seho
ld) f
or a
bout
150
g;
sold
at T
k 60
0–70
0/kg
for 1
80–2
00 g
cra
bs
7.St
ocki
ng d
ensi
ty (S
D)
Fatte
ning
: 40
kg/d
ecim
al; g
row
-out
: 20
kg/d
ecim
al
(247
dec
imal
= 1
hect
are)
10
kg
of c
rabs
/run/
hous
ehol
d; fo
r big
ger p
onds
>10
kg
Cra
bs c
lass
ified
into
3 :
soft,
imm
atur
e an
d ha
rd-s
helle
d 8.
Cul
ture
dur
atio
nG
row
-out
: 20–
30 g
juve
nile
cra
bs a
fter o
ne m
oltin
g tra
nsfe
rred
to g
row
-out
pon
ds (t
o re
duce
SD
) an
d cu
lture
d fo
r 2.0
–2.5
mon
ths p
rior t
o ha
rves
t; va
cate
d po
nd to
be
use
d ag
ain
for a
noth
er b
atch
of 2
0–30
g; h
arve
st si
ze 1
00g
in
grow
-out
pon
d
Pond
: 10–
12 d
ays;
cra
bs re
mai
ned
tied
9.Ty
pe &
am
ount
of f
eeds
; Fr
eque
ncy
offe
edin
g A
bout
90%
of f
eeds
–til
apia
(Tak
a 50
–60/
kg);
on
ce d
aily
p.m
. at 1
0% B
W fo
r fat
teni
ng;
20%
BW
or 1
0 kg
cra
bs fo
r gro
w-o
ut
Tila
pia
purc
hase
d fr
om m
arke
t at T
aka
30-4
0/kg
; 1
kg o
f til
apia
for e
very
10
kg o
f cra
b
10.W
ater
man
agem
ent
2–3
days
inte
rval
; sa
linity
: 12–
18 p
pt d
urin
g ra
iny
seas
on &
up
to
30 p
pt d
urin
g dr
y se
ason
W
ater
cha
nge
base
d on
regu
lar n
atur
al in
flow
/out
flow
of
wat
er;
wat
er n
ot c
hang
ed e
spec
ially
in c
ages
( w
ater
cha
nge
not p
ossi
ble
if w
aste
from
hou
seho
ld, e
tc. d
rain
ed to
w
ater
way
s)
11.H
arve
stin
g m
etho
d (s
elec
tive/
tota
lha
rves
t Se
lect
ive
harv
estin
g - f
atte
ning
; Tot
al h
arve
st fo
r gro
w-o
ut a
nd
trans
fer t
o bi
gger
pon
d fo
r fur
ther
cul
ture
; Cla
ssifi
catio
n- fe
mal
e cr
abs a
re m
ore
expe
nsiv
e
Sele
ctiv
e ha
rves
ting
12.H
andl
ing
and
trans
port
proc
edur
esTy
ing;
put
in sa
cks a
nd b
ring
to d
epot
s Ty
ing;
put
in sa
cks a
nd b
ring
to n
earb
y m
arke
t/dep
ot
13.S
urvi
val r
ate
Abo
ut 2
0% m
orta
lity;
cra
bs a
re ti
ed d
urin
g cu
lture
20
% m
orta
lity
(8kg
/10k
g); c
rabs
are
tied
dur
ing
cultu
re
14.N
umbe
r of r
uns/
yrFa
tteni
ng :1
5–16
runs
/yr
20–2
4 ru
ns/y
r 15
.Pro
blem
s enc
ount
ered
20%
mor
talit
y in
fatte
ning
; sou
rce
of se
edst
ock
dwin
dlin
g H
igh
wat
er te
mp
and
low
salin
ity; d
eter
iora
tion
of w
ater
qu
ality
16
.How
do
you
perc
eive
the
futu
re o
f MC
indu
stry
N
eed
for h
atch
ery
Man
y pe
ople
dep
end
on m
udcr
ab a
s liv
elih
ood
ther
efor
e, th
is
will
con
tinue
; sav
e m
oney
to h
ave
bigg
er p
onds
R
emar
ks
Rej
ecte
d cr
abs f
or e
xpor
t —fo
r hom
e co
nsum
ptio
n or
sell
loca
lly
at lo
w p
rice
C
age
cultu
re —
mor
e pr
actic
al to
use
, if w
ater
qua
lity
gets
ba
d, th
ese
are
lifte
d fr
om th
e po
nd
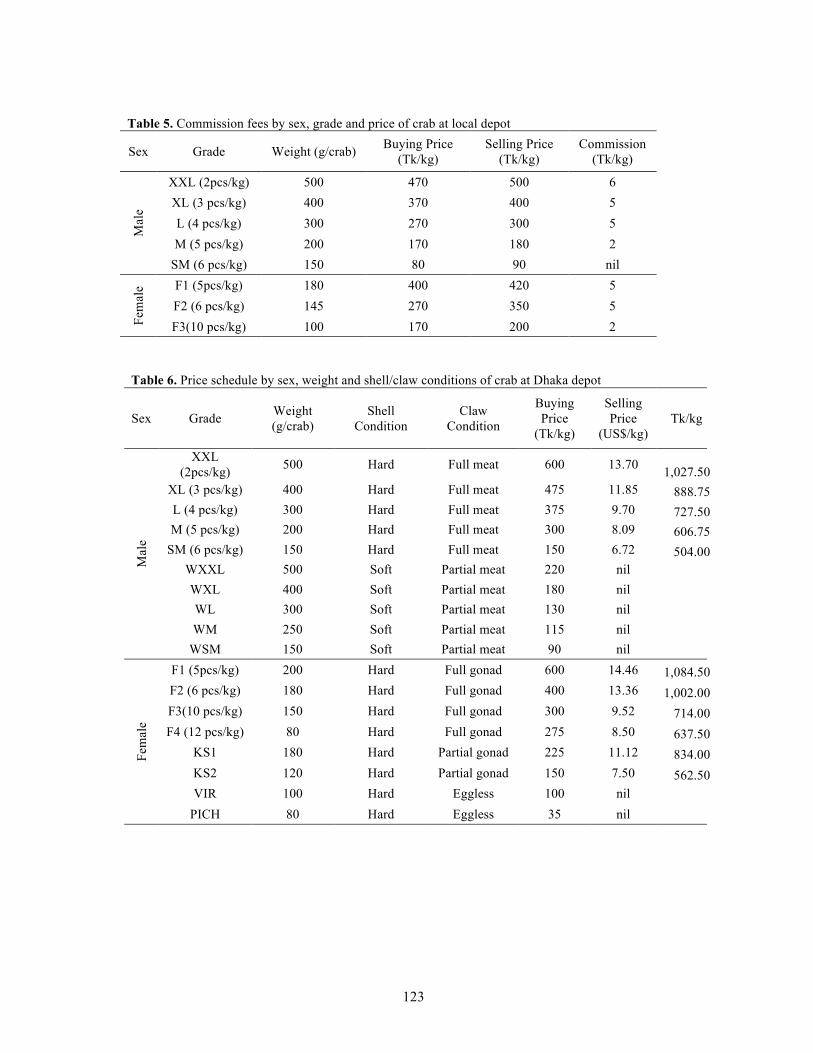
123
Table 5. Commission fees by sex, grade and price of crab at local depot
Sex Grade Weight (g/crab) Buying Price (Tk/kg)
Selling Price (Tk/kg)
Commission (Tk/kg)
Mal
e
XXL (2pcs/kg) 500 470 500 6 XL (3 pcs/kg) 400 370 400 5 L (4 pcs/kg) 300 270 300 5 M (5 pcs/kg) 200 170 180 2
SM (6 pcs/kg) 150 80 90 nil
Fem
ale F1 (5pcs/kg) 180 400 420 5
F2 (6 pcs/kg) 145 270 350 5 F3(10 pcs/kg) 100 170 200 2
Table 6. Price schedule by sex, weight and shell/claw conditions of crab at Dhaka depot
Sex Grade Weight (g/crab)
Shell Condition
Claw Condition
Buying Price
(Tk/kg)
Selling Price
(US$/kg) Tk/kg
Mal
e
XXL (2pcs/kg) 500 Hard Full meat 600 13.70 1,027.50
XL (3 pcs/kg) 400 Hard Full meat 475 11.85 888.75 L (4 pcs/kg) 300 Hard Full meat 375 9.70 727.50 M (5 pcs/kg) 200 Hard Full meat 300 8.09 606.75
SM (6 pcs/kg) 150 Hard Full meat 150 6.72 504.00 WXXL 500 Soft Partial meat 220 nil WXL 400 Soft Partial meat 180 nil WL 300 Soft Partial meat 130 nil WM 250 Soft Partial meat 115 nil
WSM 150 Soft Partial meat 90 nil
Fem
ale
F1 (5pcs/kg) 200 Hard Full gonad 600 14.46 1,084.50 F2 (6 pcs/kg) 180 Hard Full gonad 400 13.36 1,002.00 F3(10 pcs/kg) 150 Hard Full gonad 300 9.52 714.00 F4 (12 pcs/kg) 80 Hard Full gonad 275 8.50 637.50
KS1 180 Hard Partial gonad 225 11.12 834.00 KS2 120 Hard Partial gonad 150 7.50 562.50 VIR 100 Hard Eggless 100 nil
PICH 80 Hard Eggless 35 nil
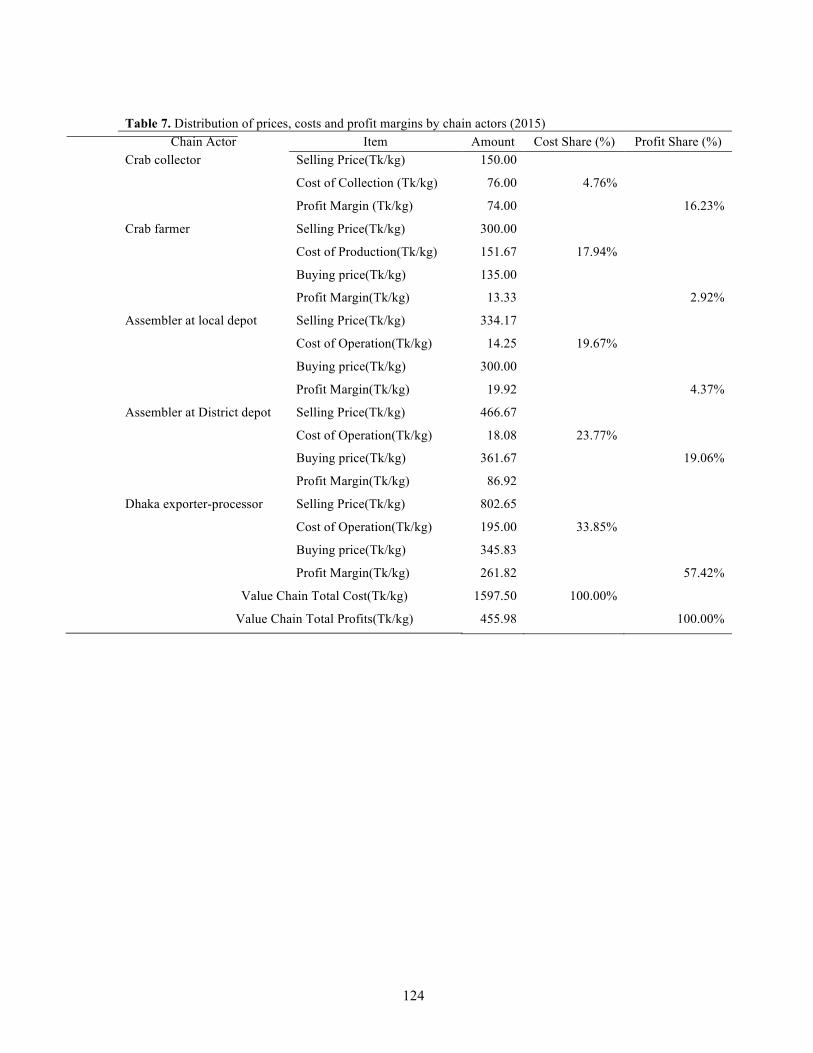
124
Table 7. Distribution of prices, costs and profit margins by chain actors (2015) Chain Actor Item Amount Cost Share (%) Profit Share (%)
Crab collector Selling Price(Tk/kg) 150.00
Cost of Collection (Tk/kg) 76.00 4.76%
Profit Margin (Tk/kg) 74.00 16.23%
Crab farmer Selling Price(Tk/kg) 300.00
Cost of Production(Tk/kg) 151.67 17.94%
Buying price(Tk/kg) 135.00
Profit Margin(Tk/kg) 13.33 2.92%
Assembler at local depot Selling Price(Tk/kg) 334.17
Cost of Operation(Tk/kg) 14.25 19.67%
Buying price(Tk/kg) 300.00
Profit Margin(Tk/kg) 19.92 4.37%
Assembler at District depot Selling Price(Tk/kg) 466.67
Cost of Operation(Tk/kg) 18.08 23.77%
Buying price(Tk/kg) 361.67 19.06%
Profit Margin(Tk/kg) 86.92
Dhaka exporter-processor Selling Price(Tk/kg) 802.65
Cost of Operation(Tk/kg) 195.00 33.85%
Buying price(Tk/kg) 345.83
Profit Margin(Tk/kg) 261.82 57.42%
Value Chain Total Cost(Tk/kg) 1597.50 100.00%
Value Chain Total Profits(Tk/kg) 455.98 100.00%
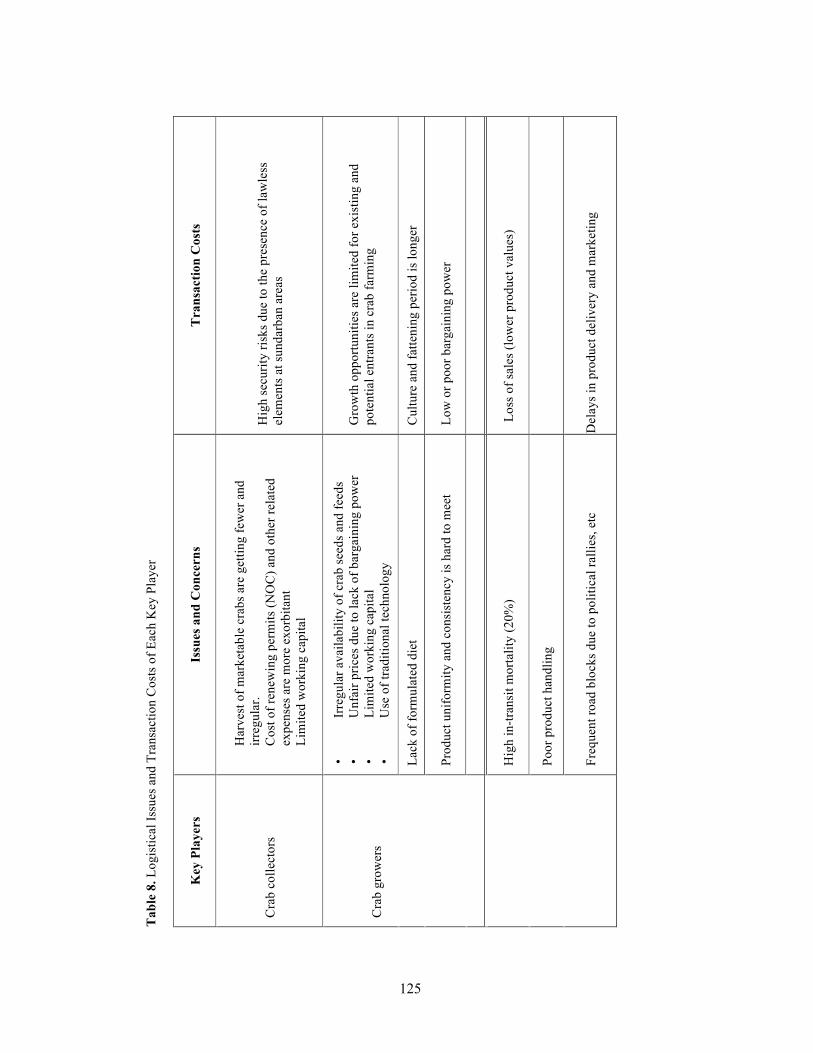
125
Tab
le 8
. Log
istic
al Is
sues
and
Tra
nsac
tion
Cos
ts o
f Eac
h K
ey P
laye
r
Key
Pla
yers
Is
sues
and
Con
cern
s T
rans
actio
n C
osts
Cra
b co
llect
ors
Har
vest
of m
arke
tabl
e cr
abs a
re g
ettin
g fe
wer
and
irr
egul
ar.
Cos
t of r
enew
ing
perm
its (N
OC
) and
oth
er re
late
d ex
pens
es a
re m
ore
exor
bita
nt
Lim
ited
wor
king
cap
ital
Hig
h se
curit
y ris
ks d
ue to
the
pres
ence
of l
awle
ss
elem
ents
at s
unda
rban
are
as
Cra
b gr
ower
s
•Ir
regu
lar a
vaila
bilit
y of
cra
b se
eds a
nd fe
eds
•U
nfai
r pric
es d
ue to
lack
of b
arga
inin
g po
wer
•Li
mite
d w
orki
ng c
apita
l•
Use
of t
radi
tiona
l tec
hnol
ogy
Gro
wth
opp
ortu
nitie
s are
lim
ited
for e
xist
ing
and
pote
ntia
l ent
rant
s in
crab
farm
ing
Lack
of f
orm
ulat
ed d
iet
Cul
ture
and
fatte
ning
per
iod
is lo
nger
Prod
uct u
nifo
rmity
and
con
sist
ency
is h
ard
to m
eet
Low
or p
oor b
arga
inin
g po
wer
Ass
embl
ers-
agen
tsPo
or m
arke
ting
infr
astru
ctur
esH
igh
in-tr
ansi
t mor
talit
y (2
0%)
Los
s of s
ales
(low
er p
rodu
ct v
alue
s)
Poor
pro
duct
han
dlin
g
Freq
uent
road
blo
cks d
ue to
pol
itica
l ral
lies,
etc
Del
ays i
n pr
oduc
t del
iver
y an
d m
arke
ting
���
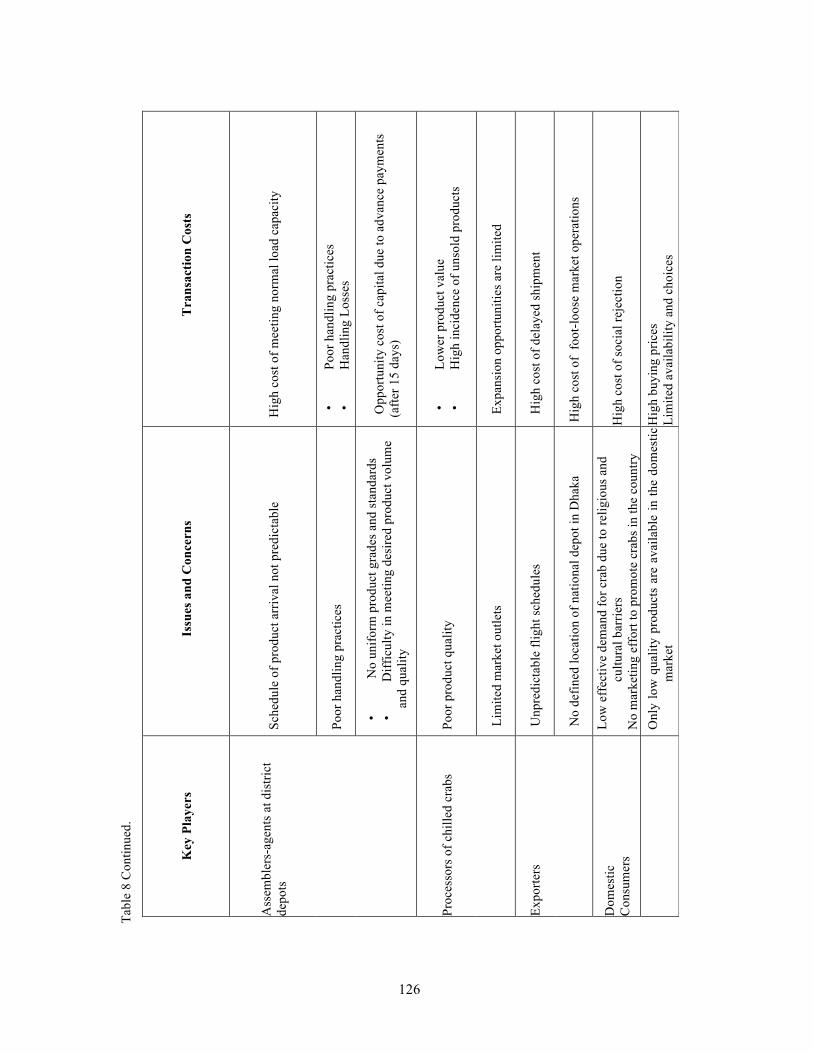
126
Tabl
e 8
Con
tinue
d.
Key
Pla
yers
Is
sues
and
Con
cern
s T
rans
actio
n C
osts
Ass
embl
ers-
agen
ts a
t dis
trict
de
pots
Sc
hedu
le o
f pro
duct
arr
ival
not
pre
dict
able
H
igh
cost
of m
eetin
g no
rmal
load
cap
acity
Poor
han
dlin
g pr
actic
es
•Po
or h
andl
ing
prac
tices
•H
andl
ing
Loss
es
•N
o un
iform
pro
duct
gra
des a
nd st
anda
rds
•D
iffic
ulty
in m
eetin
g de
sire
d pr
oduc
t vol
ume
and
qual
ity
Opp
ortu
nity
cos
t of c
apita
l due
to a
dvan
ce p
aym
ents
(a
fter 1
5 da
ys)
Proc
esso
rs o
f chi
lled
crab
s Po
or p
rodu
ct q
ualit
y •
Low
er p
rodu
ct v
alue
•H
igh
inci
denc
e of
uns
old
prod
ucts
Lim
ited
mar
ket o
utle
ts
Exp
ansi
on o
ppor
tuni
ties a
re li
mite
d
Expo
rters
U
npre
dict
able
flig
ht sc
hedu
les
Hig
h co
st o
f del
ayed
ship
men
t
No
defin
ed lo
catio
n of
nat
iona
l dep
ot in
Dha
ka
Hig
h co
st o
f fo
ot-lo
ose
mar
ket o
pera
tions
Dom
estic
C
onsu
mer
s
Low
eff
ectiv
e de
man
d fo
r cra
b du
e to
relig
ious
and
cu
ltura
l bar
riers
N
o m
arke
ting
effo
rt to
pro
mot
e cr
abs i
n th
e co
untry
H
igh
cost
of s
ocia
l rej
ectio
n
Onl
y lo
w q
ualit
y pr
oduc
ts a
re a
vaila
ble
in th
e do
mes
tic
mar
ket
Hig
h bu
ying
pric
es
Lim
ited
avai
labi
lity
and
choi
ces
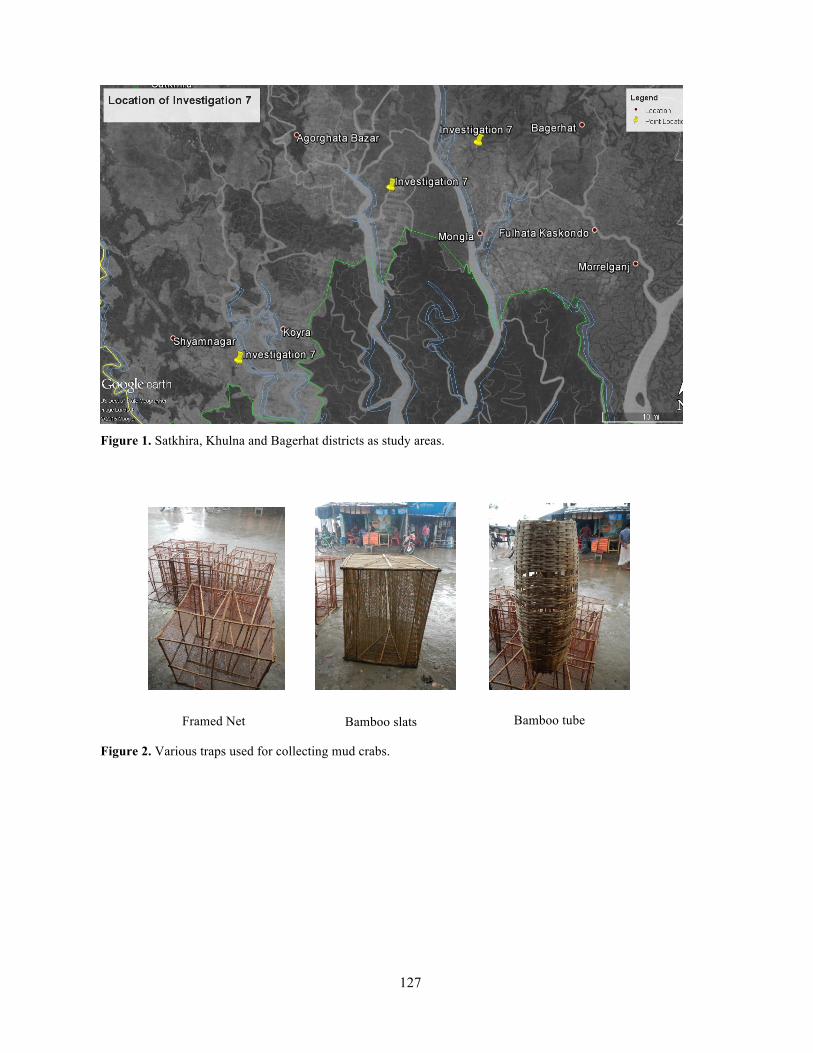
127
Figure 1. Satkhira, Khulna and Bagerhat districts as study areas.
Figure 2. Various traps used for collecting mud crabs.
Bamboo slats Bamboo tube Framed Net
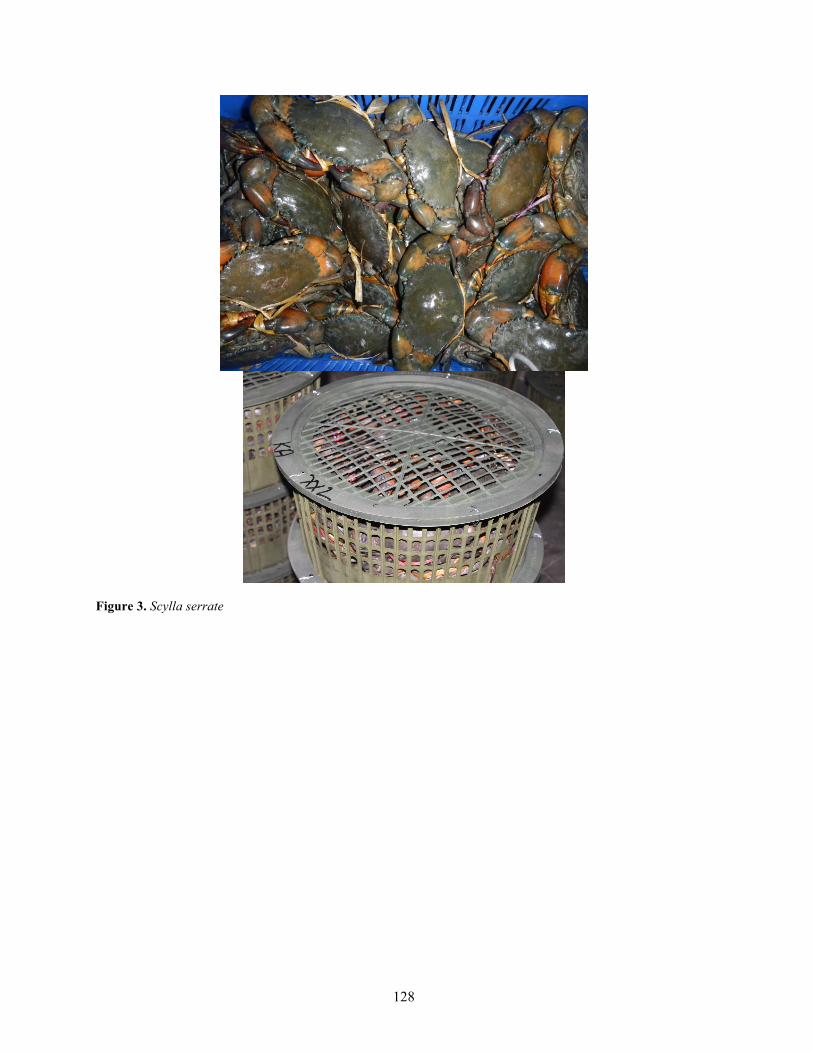
128
Figure 3. Scylla serrate
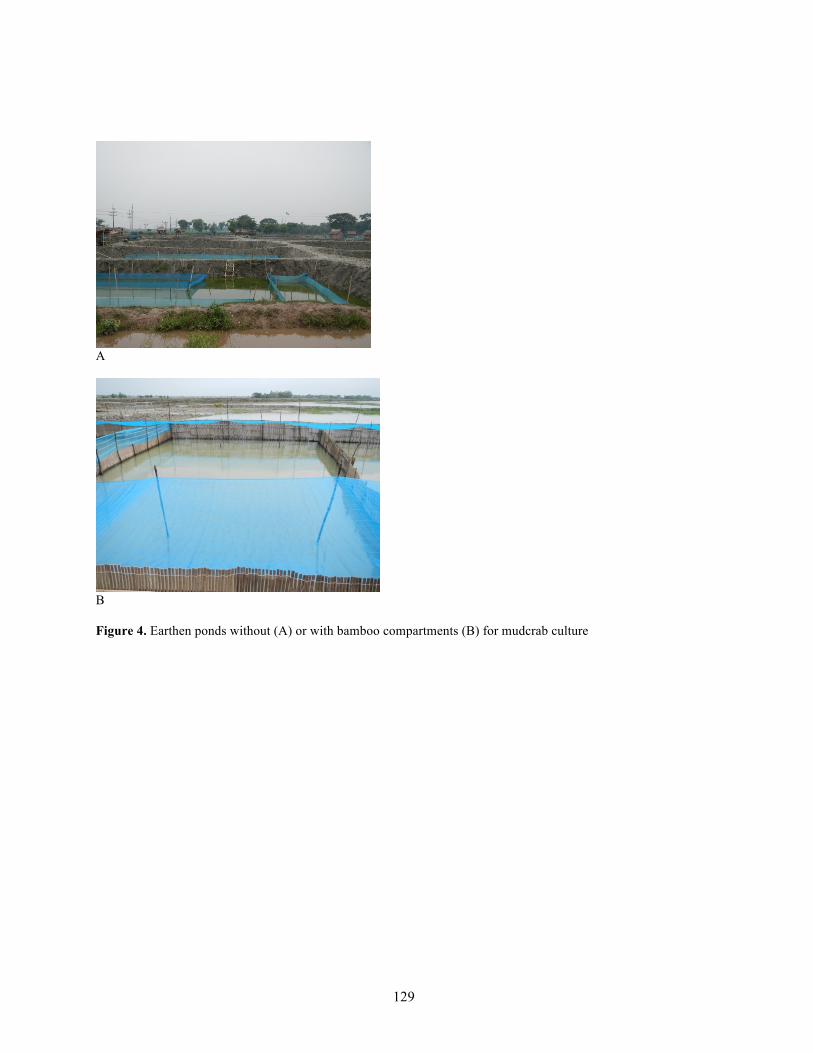
129
A
B
Figure 4. Earthen ponds without (A) or with bamboo compartments (B) for mudcrab culture
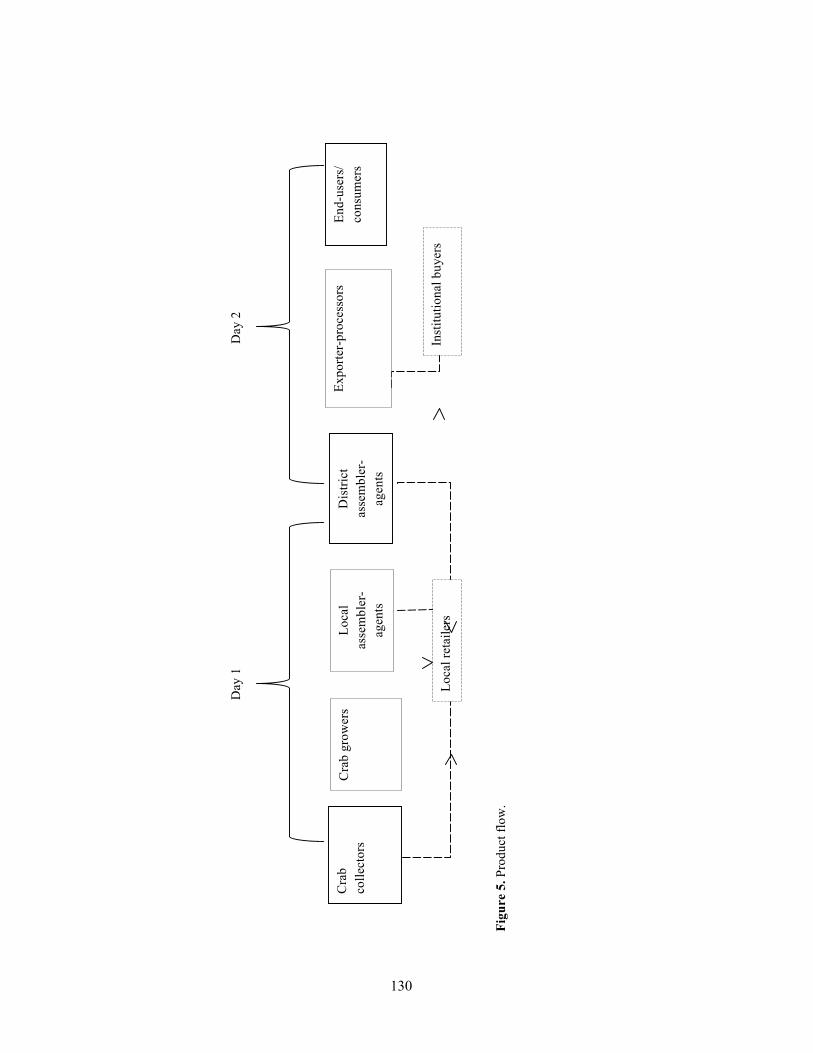
130
Figu
re 5
. Pro
duct
flow
.
Loca
l ret
aile
rs
Inst
itutio
nal b
uyer
s
Cra
b co
llect
ors
Cra
b gr
ower
s Lo
cal
asse
mbl
er-
agen
ts
Dis
trict
as
sem
bler
-ag
ents
Expo
rter-
proc
esso
rs
End-
user
s/
cons
umer
s
Day
1
Day
2
���
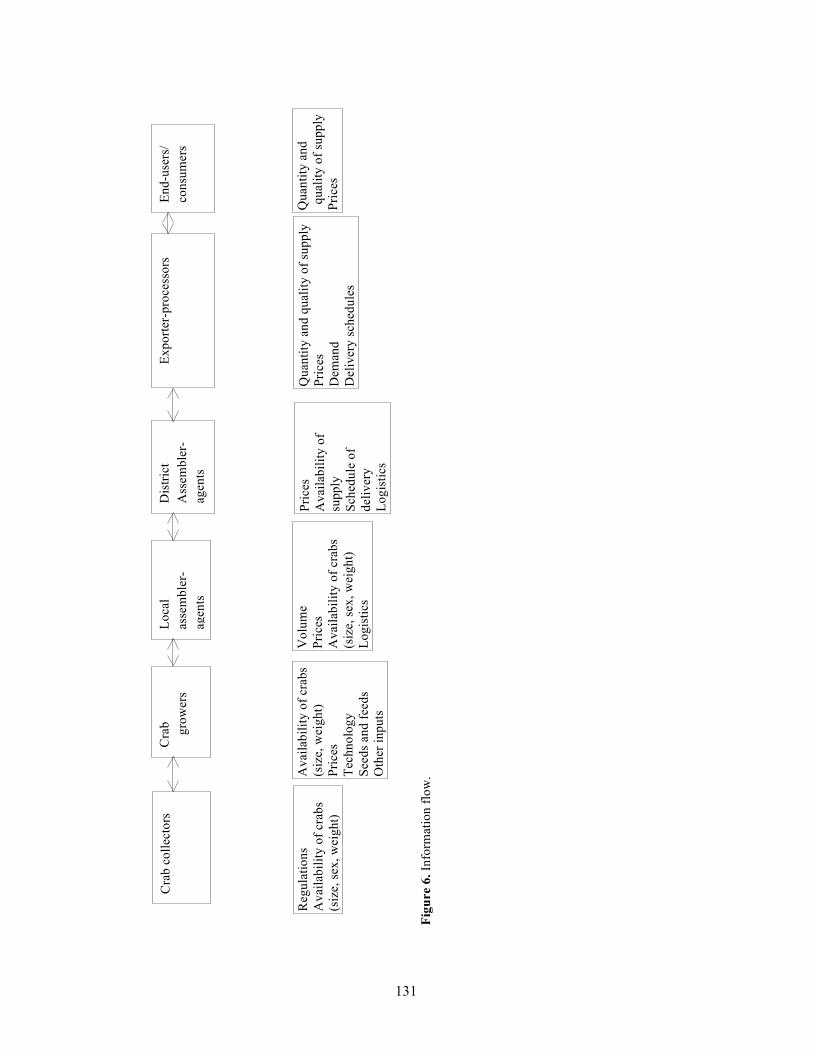
131
Figu
re 6
. Inf
orm
atio
n flo
w.
üR
egul
atio
ns
üA
vaila
bilit
y of
cra
bs
(siz
e, se
x, w
eigh
t)
üA
vaila
bilit
y of
cra
bs
(siz
e, w
eigh
t) ü
Pric
es
üTe
chno
logy
ü
Seed
s and
feed
s ü
Oth
er in
puts
Pric
es
Ava
ilabi
lity
of
supp
ly
Sche
dule
of
deliv
ery
Logi
stic
s
üQ
uant
ity a
nd
qual
ity o
f sup
ply
üPr
ices
ü Q
uant
ity a
nd q
ualit
y of
supp
ly
ü P
rices
ü
Dem
and
ü D
eliv
ery
sche
dule
s
üV
olum
e ü
Pric
es
üA
vaila
bilit
y of
cra
bs
(siz
e, se
x, w
eigh
t) ü
Logi
stic
s
Cra
b co
llect
ors
Cra
b grow
ers
Loca
l as
sem
bler
-ag
ents
Dis
trict
A
ssem
bler
-ag
ents
Expo
rter-
proc
esso
rs
End-
user
s/
cons
umer
s