Embed Size (px)
Citation preview
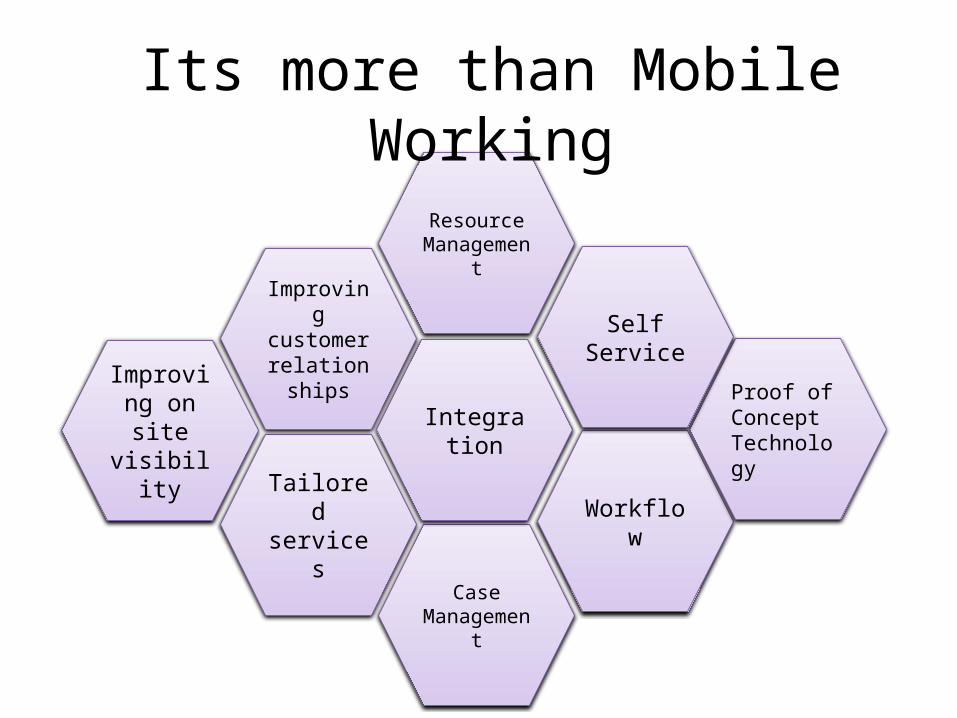
Improving on site
visibility
Tailored services
Improving customer
relationships
Case Management
Resource Management
Workflow
IntegrationProof of Concept Technology
Self Service
Its more than Mobile Working
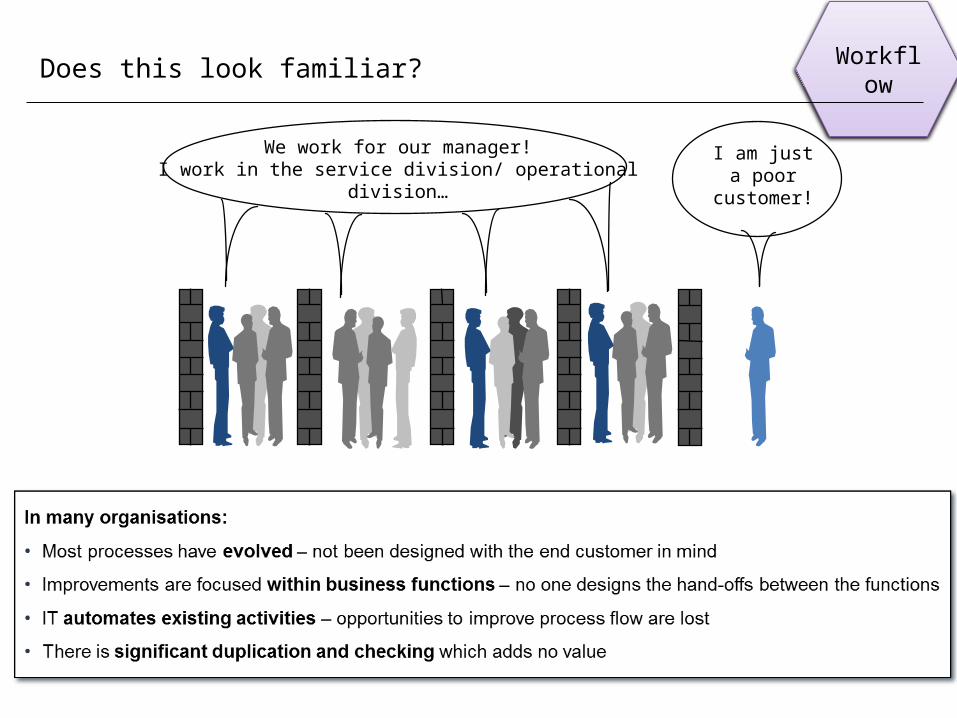
Workflow
We work for our manager!I work in the service division/ operational division…
Does this look familiar?
I am just a poor
customer!
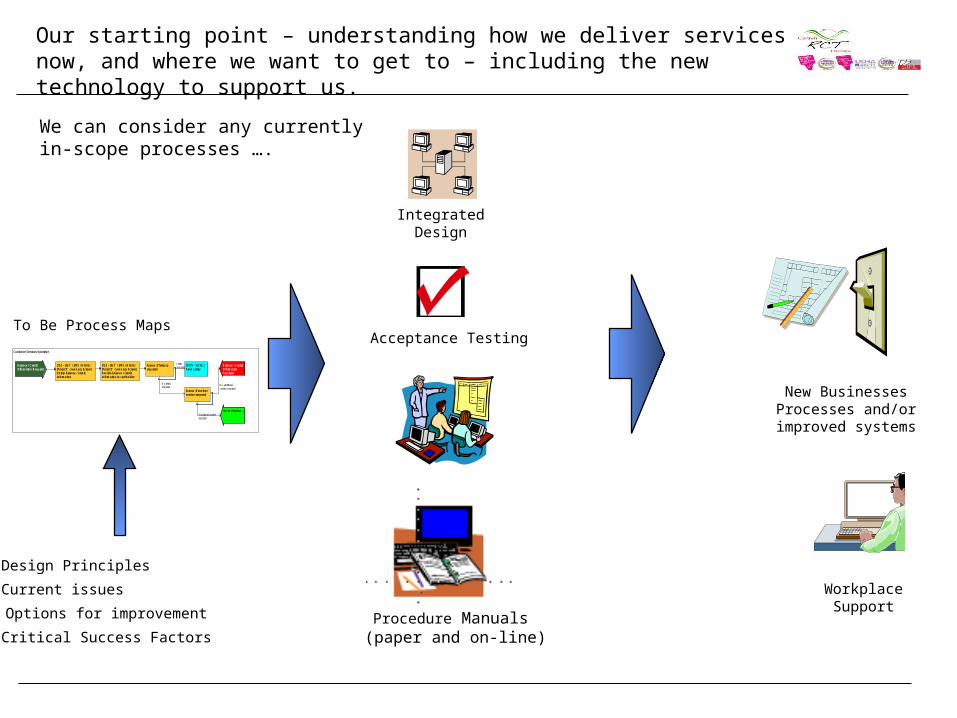
Our starting point – understanding how we deliver services now, and where we want to get to – including the new technology to support us.
Workplace Support
To Be Process MapsAcceptance Testing
New Businesses Processes and/or improved systems
Customer Services Operator
Balance / CreditInformation Required
[TS2 - IACT / IAPS / WAGN][ProphIT - Summary Screen]Obtain balance / creditinformation
[TS2 - IACT / IAPS / WAGN][ProphIT - Summary Screen]Provide balance / creditinformation to cardholder
Balance / CreditInformationProvided
Assess if letter isrequired
[TSYS - RCAC]Send Letter
Letterrequired
Assess if anotherservice required
N o letterrequired
N o additionalservice required
Go to Process...Additional servicerequired
Integrated Design
Design Principles
Current issues
Options for improvement
Critical Success FactorsProcedure Manuals (paper
and on-line)
We can consider any currently in-scope processes ….
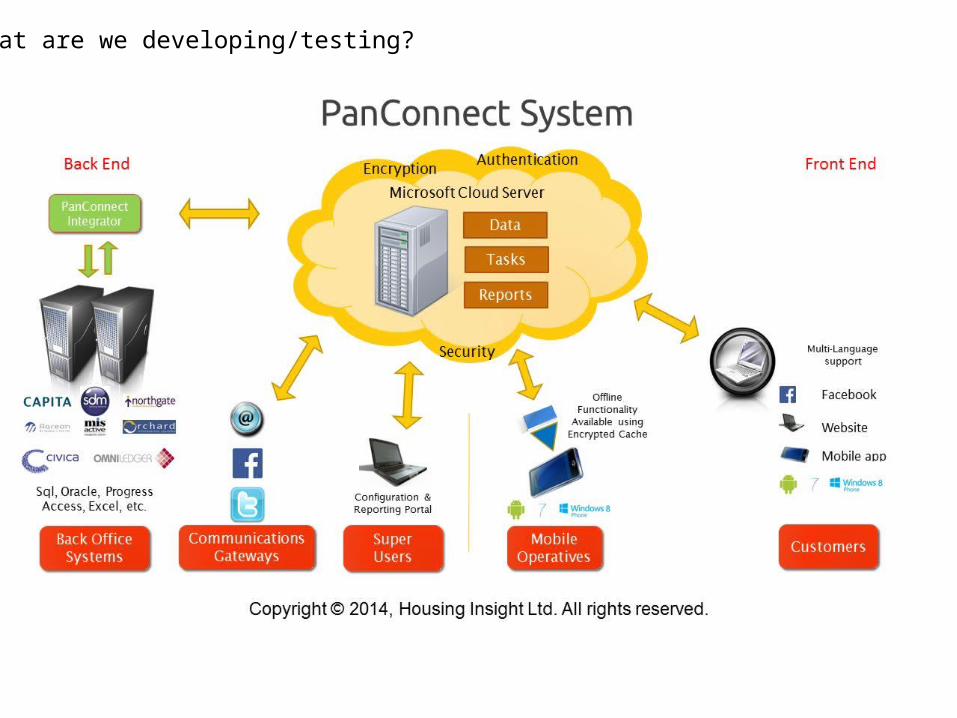
What are we developing/testing?
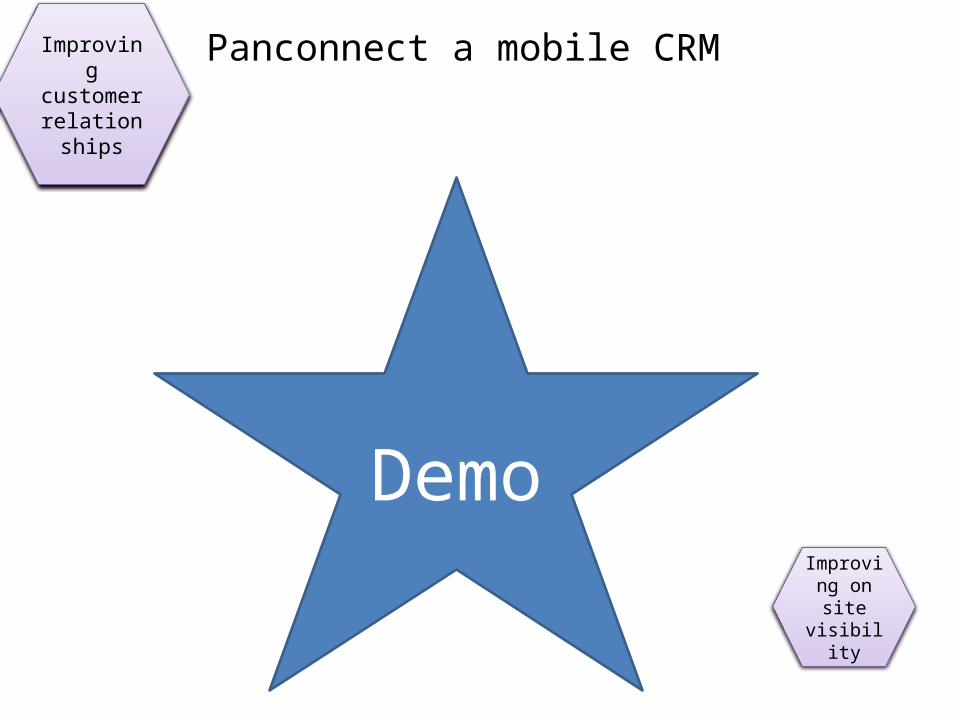
Improving customer
relationships
Demo
Panconnect a mobile CRM
Improving on site
visibility
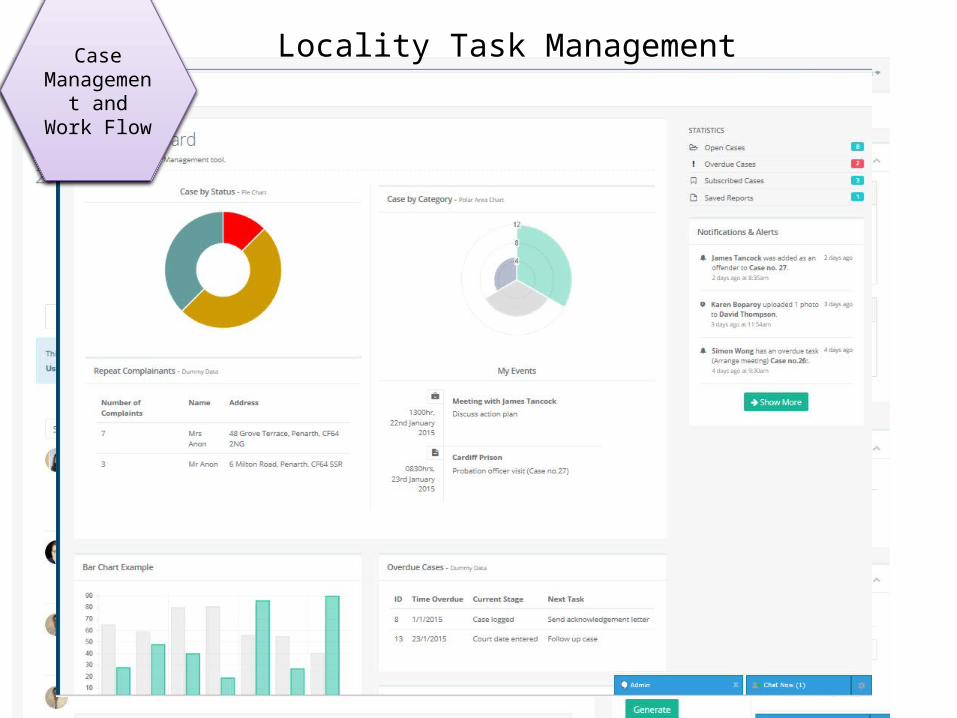
Locality Task ManagementCase Management
and Work Flow
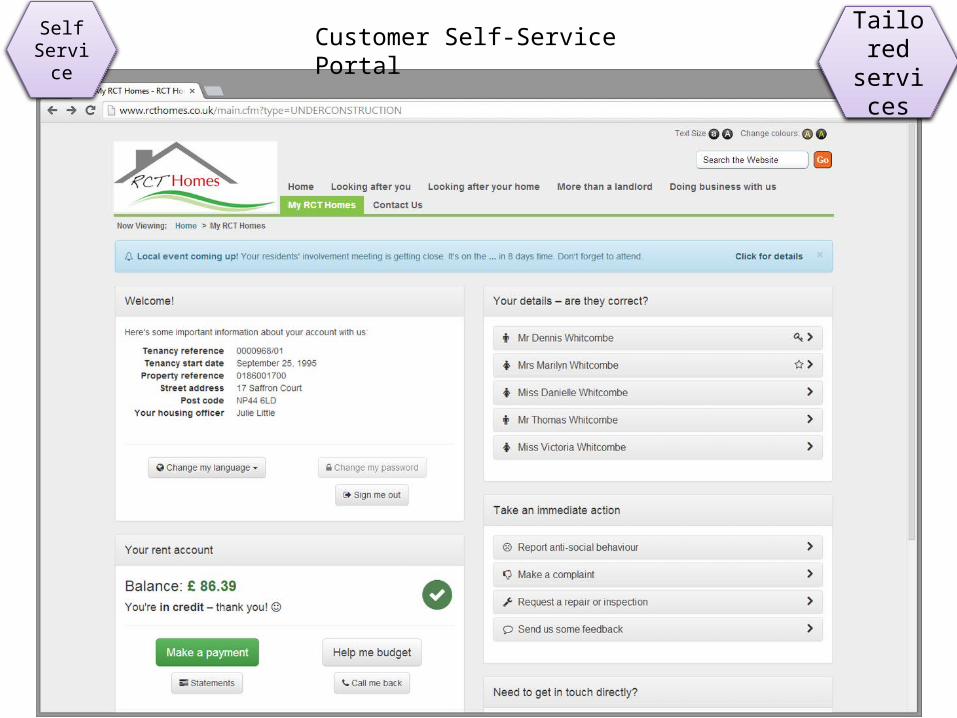
Self Service Tailored
services
Customer Self-Service Portal
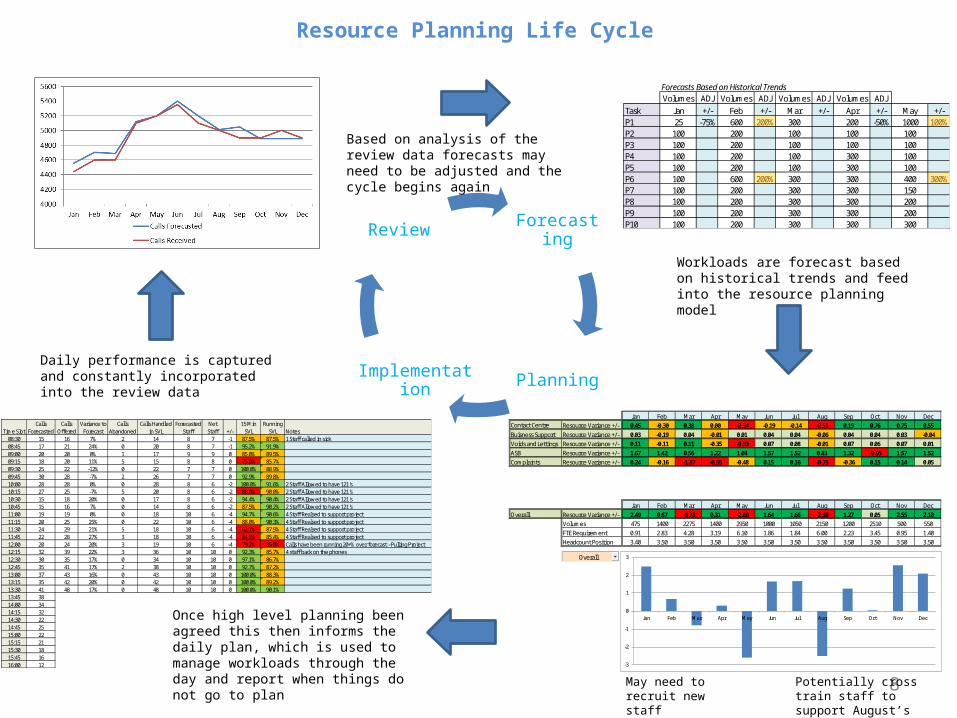
Resource Planning Life Cycle
8
Forecasting
PlanningImplementation
Review
Forecasts Based on Historical TrendsVolumes ADJ Volumes ADJ Volumes ADJ Volumes ADJ
Task Jan +/- Feb +/- Mar +/- Apr +/- May +/-P1 25 -75% 600 200% 300 200 -50% 1000 100%P2 100 200 100 100 100P3 100 200 100 100 100P4 100 200 100 300 100P5 100 200 100 300 100P6 100 600 200% 300 300 400 300%P7 100 200 300 300 150P8 100 200 300 300 200P9 100 200 300 300 200P10 100 200 300 300 300
Jan Feb Mar Apr May Jun Jul Aug Sep Oct Nov DecContact Centre Resource Variance +/- 0.45 -0.30 0.38 0.00 -2.34 -0.19 -0.14 -2.51 0.19 0.76 0.75 0.55Buisness Support Resource Variance +/- 0.03 -0.19 0.04 -0.01 0.01 0.04 0.04 -0.06 0.04 0.04 0.03 -0.04Voids and Lettings Resource Variance +/- 0.11 -0.11 0.11 -0.35 -0.83 0.07 0.08 -0.01 0.07 0.06 0.07 0.01ASB Resource Variance +/- 1.67 1.42 0.56 1.22 1.04 1.57 1.52 0.83 1.32 -0.95 1.57 1.52Complaints Resource Variance +/- 0.24 -0.16 -1.87 -0.55 -0.48 0.15 0.16 -0.75 -0.36 0.15 0.14 0.05
Jan Feb Mar Apr May Jun Jul Aug Sep Oct Nov DecOverall Resource Variance +/- 2.49 0.67 -0.78 0.31 -2.60 1.64 1.66 -2.50 1.27 0.05 2.55 2.10
Volumes 475 1400 2275 1400 2950 1000 1050 2150 1200 2510 500 550FTE Requirement 0.91 2.83 4.28 3.19 6.10 1.86 1.84 6.00 2.23 3.45 0.95 1.40Headcount Position 3.40 3.50 3.50 3.50 3.50 3.50 3.50 3.50 3.50 3.50 3.50 3.50
-3
-2
-1
0
1
2
3
Jan Feb Mar Apr May Jun Jul Aug Sep Oct Nov Dec
Overall
May need to recruit new staff
Potentially cross train staff to support August’s deficit
Time SlotCalls
ForecastedCalls
OfferedVariance to
ForecastCalls
AbandonedCalls Handled
in SVLForecasted
StaffNet Staff +/-
15 Min SVL
Running SVL Notes
08:30 15 16 7% 2 14 8 7 -1 87.5% 87.5% 1 Staff called in sick08:45 17 21 24% 0 20 8 7 -1 95.2% 91.9%09:00 20 20 0% 1 17 9 9 0 85.0% 89.5%09:15 18 20 11% 5 15 8 8 0 75.0% 85.7%09:30 25 22 -12% 0 22 7 7 0 100.0% 88.9%09:45 30 28 -7% 2 26 7 7 0 92.9% 89.8%10:00 28 28 0% 0 28 8 6 -2 100.0% 91.6% 2 Staff Allowed to have 121's10:15 27 25 -7% 5 20 8 6 -2 80.0% 90.0% 2 Staff Allowed to have 121's10:30 15 18 20% 0 17 8 6 -2 94.4% 90.4% 2 Staff Allowed to have 121's10:45 15 16 7% 0 14 8 6 -2 87.5% 90.2% 2 Staff Allowed to have 121's11:00 19 19 0% 0 18 10 6 -4 94.7% 90.6% 4 Staff Realsed to support project11:15 20 25 25% 0 22 10 6 -4 88.0% 90.3% 4 Staff Realsed to support project11:30 24 29 21% 5 18 10 6 -4 62.1% 87.5% 4 Staff Realsed to support project11:45 22 28 27% 3 18 10 6 -4 64.3% 85.4% 4 Staff Realsed to support project12:00 20 24 20% 3 19 10 6 -4 79.2% 85.0% Calls have been running 20+% over forecast - Pulling Project12:15 32 39 22% 3 36 10 10 0 92.3% 85.7% 4 staff back on the phones12:30 30 35 17% 0 34 10 10 0 97.1% 86.7%12:45 35 41 17% 2 38 10 10 0 92.7% 87.2%13:00 37 43 16% 0 43 10 10 0 100.0% 88.3%13:15 35 42 20% 0 42 10 10 0 100.0% 89.2%13:30 41 48 17% 0 48 10 10 0 100.0% 90.1%13:45 3814:00 3414:15 3214:30 2214:45 2515:00 2215:15 2115:30 1815:45 1616:00 12
Workloads are forecast based on historical trends and feed into the resource planning model
Daily performance is captured and constantly incorporated into the review data
Once high level planning been agreed this then informs the daily plan, which is used to manage workloads through the day and report when things do not go to plan
Based on analysis of the review data forecasts may need to be adjusted and the cycle begins again
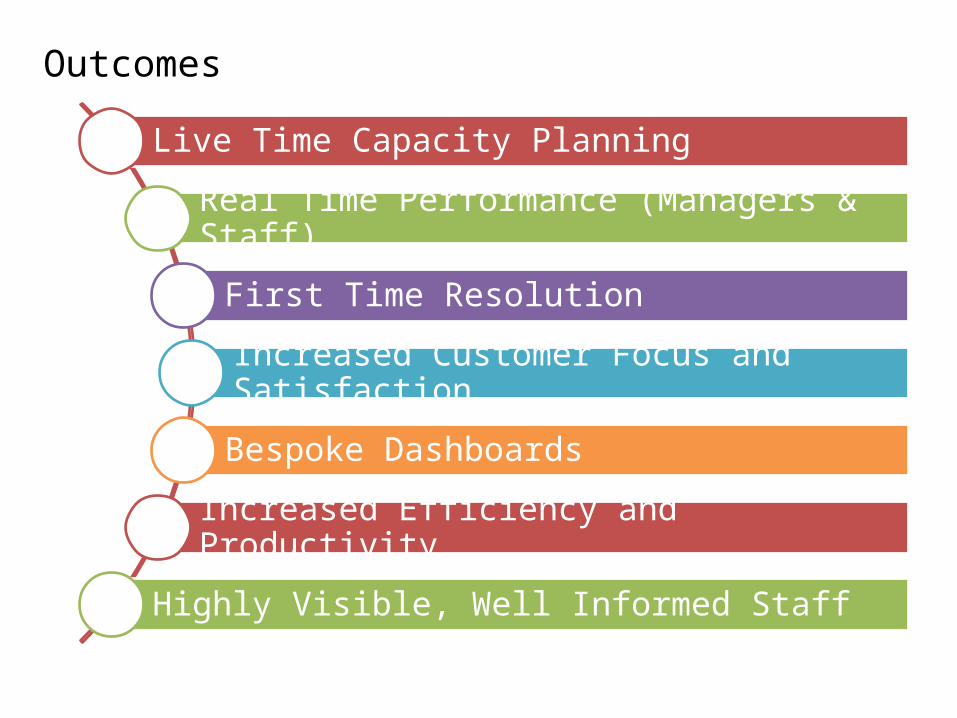
Live Time Capacity Planning
Real Time Performance (Managers & Staff)
First Time Resolution
Increased Customer Focus and Satisfaction
Bespoke Dashboards
Increased Efficiency and Productivity
Highly Visible, Well Informed Staff
Outcomes
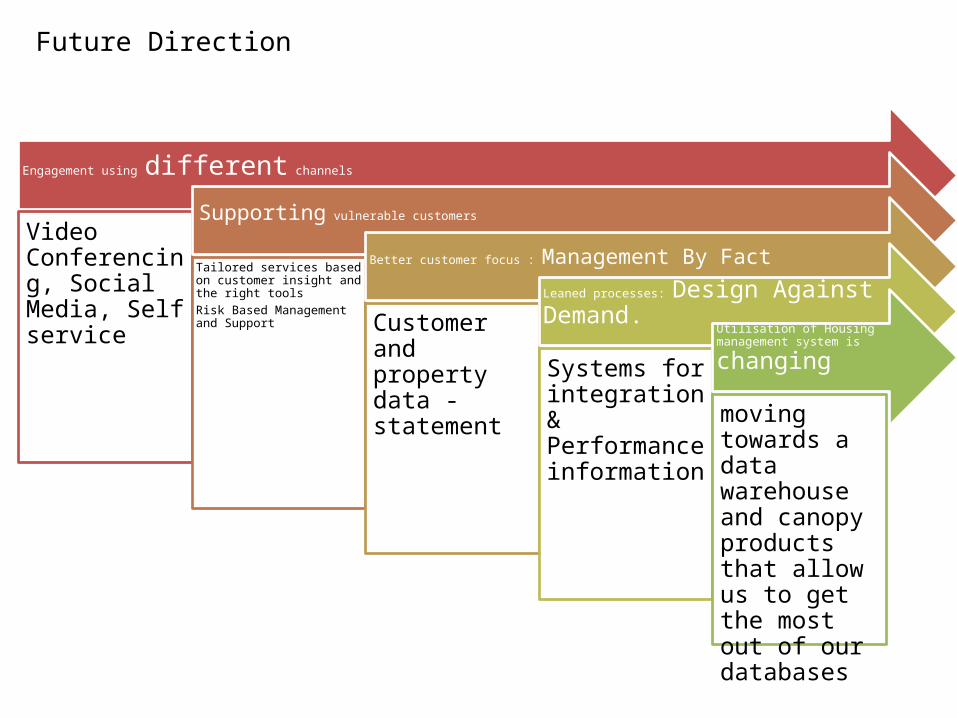
Engagement using different channels
Video Conferencing, Social Media, Self service
Supporting vulnerable customers
Tailored services based on customer insight and the right toolsRisk Based Management and Support
Better customer focus : Management By Fact
Customer and property data - statement
Leaned processes: Design Against Demand.
Systems for integration & Performance information
Utilisation of Housing management
system is changing
moving towards a data warehouse and canopy products that allow us to get the most out of our databases
Future Direction