Embed Size (px)
Citation preview

Improving Outcomes in Geriatric Anemia: A Guide to the Differential Diagnosis of Treatable Causes
1MEDX Mid-Atlantic – October 14, 2016
Improving Outcomes in Geriatric Anemia
A Guide to the Differential Diagnosis of Treatable Causes
Brian Koffman, MDCMMedical Director, CLL Society Inc.
Partner, St. Jude Heritage Medical GroupDiamond Bar, CA
Clinical Professor (Retired)Department of Family Medicine
Keck School of Medicine, USC Family PracticeLos Angeles, CA
B. Douglas Smith, MDProfessor of Oncology
Division of Hematologic Malignancies
Sidney Kimmel Comprehensive Cancer CenterJohns Hopkins Medicine
Baltimore, MD
Improving Outcomes in Geriatric Anemia
A Guide to the Differential Diagnosis of Treatable Causes
Brian Koffman, MDCM
Medical Director, CLL Society Inc.Partner, St. Jude Heritage Medical Group
Diamond Bar, CAClinical Professor (Retired)
Department of Family MedicineKeck School of Medicine, USC Family Practice
Los Angeles, CA
Free Accompanying Mobile App!
A free anemia algorithm mobile app is available that covers concepts in this presentation
The icon is included on slides where the app would be especially useful
To download go to the Google Play store (Android phone/tablet users) or iTunes store (iPhone, iPad users)
App
Anemia Best Practices
Anemia should not be considered a normal part of the aging process and should be evaluated further
A cause can often be determined, and treatment may alter outcomes and improve quality of life (QOL)
Use mean cell volume (MCV) to narrow differential diagnosis of geriatric anemia and determine initial tests
Microcytosis, MCV <80 fL
Normocytosis, MCV 80-100 fL
Macrocytosis, MCV >100 fL
Referral to hematologist for possible bone marrow examination should be carefully considered in patients with unexplained macrocyctic anemia
Who Are We Talking About?
40
50
60
70
80
90
100
2015 2020 2025 2030 2035 2040 2045 2050 2055 2060
US Census Bureau Estimates of Population Aged ≥65 Years
US Census Bureau. Projections of the Population by Sex and Selected Age Groups for the United States: 2015 to 2060 (Table 3)http://www.census.gov/population/projections/data/national/2014/summarytables.html.
Po
pu
lati
on
, m
illio
ns
Year
Population aged ≥65
years expected to
more than double
from 2015-2060 47.8
98.1In 2016
The life expectancy of a 65-year-old US male is:
17 years
The life expectancy of a 65-year-old US female is:
19 years
Social Security Administration. Life Tables for the US Social Security Area 1900-2100. http://www.ssa.gov/oact/NOTES/as120/LifeTables_Body.html
Improving Outcomes in Geriatric Anemia: A Guide to the Differential Diagnosis of Treatable Causes
2MEDX Mid-Atlantic – October 14, 2016
Who Are We Talking About?
According to US Census Bureau projections persons aged ≥85
years are the fastest growing segment of the population
0
5
10
15
20
25
2015 2060
Persons aged ≥85 years
6.3 million (2.0% of the population)
19.7 million (4.7% of the population)
US Census Bureau. Projections of the Population by Sex and Selected Age Groups for the United States: 2015 to 2060 (Table 3)http://www.census.gov/population/projections/data/national/2014/summarytables.html.
Prevalence of Anemia
26% for men20% for women
The oldest old persons, aged 85 years or older, are not only the fastest growing segment of the US population, they also have
the highest prevalence of anemia
Guralnik JM, et al. Blood. 2004;104:2263-2268.Guralnik JM, et al. Hematology. 2005:528-532.
What is a “Normal” Hemoglobin?
PopulationWHO
(1968)
NHANES III (1994)*
(20-59 years)
NHANES III (1994)*
(>60 years)
Scripps-Kaiser(2006)*
Mayo Clinic CCL (2007)
White men 13 13.8 12.8 13.7 13.5
Black men NRS 12.8 11.8 12.9 NRS
White women12
(11 if pregnant)12.2 12.0 12.2 12.0
Black women NRS 11.3 11.3 11.5 NRS
Lower Limits of Normal Hemoglobin (g/dL) in Adults
WHO. World Health Organ Tech Rep Ser. 1968;405:5-37.Guralnik JM, et al. Blood. 2004;104:2263-2268.Beutler E, et al. Blood. 2006;107:1747-1750.Steensma DP, et al. Mayo Clin Proc. 2007;82:958-966.
*5% threshold in Gaussian distributionNRS, not reported separately
Ethnic background, altitude of residence, smoking status, and physiologic fluctuations of plasma volume can influence hemoglobin
App Key Takeaway
The cause of anemia in the elderly,
even if mild, should be evaluated for
treatment to improve quality
and quantity of life
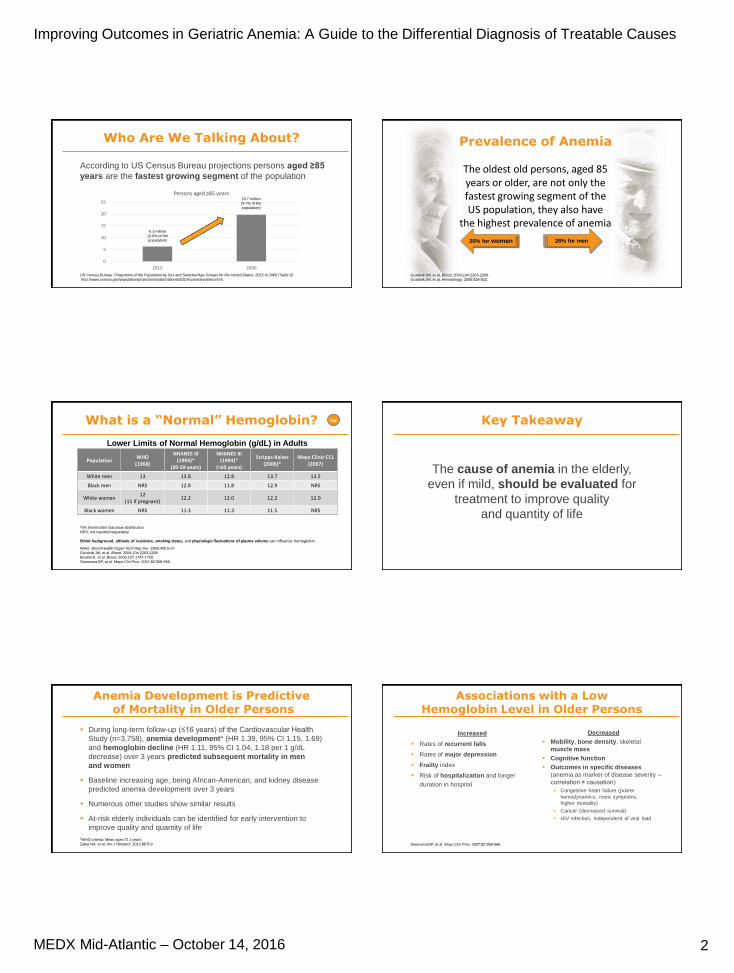
Anemia Development is Predictiveof Mortality in Older Persons
During long-term follow-up (≤16 years) of the Cardiovascular Health
Study (n=3,758), anemia development* (HR 1.39, 95% CI 1.15, 1.69)
and hemoglobin decline (HR 1.11, 95% CI 1.04, 1.18 per 1 g/dL
decrease) over 3 years predicted subsequent mortality in men
and women
Baseline increasing age, being African-American, and kidney disease
predicted anemia development over 3 years
Numerous other studies show similar results
At-risk elderly individuals can be identified for early intervention to
improve quality and quantity of life
*WHO criteria; Mean age=72.1 yearsZakai NA, et al. Am J Hematol. 2013;88:5-9.
Associations with a Low Hemoglobin Level in Older Persons
Increased
Rates of recurrent falls
Rates of major depression
Frailty index
Risk of hospitalization and longer
duration in hospital
Decreased
Mobility, bone density, skeletal
muscle mass
Cognitive function
Outcomes in specific diseases
(anemia as marker of disease severity –
correlation ≠ causation)
Congestive heart failure (poorer
hemodynamics, more symptoms,
higher mortality)
Cancer (decreased survival)
HIV infection, independent of viral load
Steensma DP, et al. Mayo Clin Proc. 2007;82:958-966.

Improving Outcomes in Geriatric Anemia: A Guide to the Differential Diagnosis of Treatable Causes
3MEDX Mid-Atlantic – October 14, 2016
Improving Outcomes in Geriatric Anemia
A Guide to the Differential Diagnosis of Treatable Causes
B. Douglas Smith, MDProfessor of Oncology
Division of Hematologic Malignancies
Sidney Kimmel Comprehensive Cancer CenterJohns Hopkins Medicine
Baltimore, MD
Wolanskyj AP, et al. Hematology. In: Ficalora RD, ed. Mayo Clinic Internal Medicine Board Review. 10th ed. 2013;497-511.
The most useful inexpensive tests for determining etiology of anemia:
peripheral blood smear, reticulocyte count
Inadequate RBC Production
Loss of RBCsPremature
RBC Destruction
Marrow Failure
NutritionalDeficiency
Causes of Anemia
Bleeding(overt or occult)
Hemolysis(intrinsic or extrinsic)
Anemia
Anemia is a sign of disease, not a disease itself
Dozens of causes, many common
Organized approach essential
A specific cause can be found in almost all cases
Wolanskyj AP, et al. Hematology. In: Ficalora RD, ed. Mayo Clinic Internal Medicine Board Review. 10th ed. 2013;497-511.
Anemia Differential Diagnosis by MCV
Normocytosis
Anemia ofchronic disease
Acute bleeding
Renal failure(low EPO)
Combined disorders
Early/mild irondeficiency
Hemolysis
Microcytosis
Iron deficiency
Thalassemia
Anemia of chronic disease
Sideroblasticanemias
Hb C Hb E
Vit C def.
Lead poison.
UnstableHb
Para-neoplastic
Macrocytosis
B12 or folate deficiency
Alcohol abuse
Drugs (AZT, MTX,
chemoRx, etc)
Marrow disorders (esp. MDS)
Reticulocytosis
Artifact
Liver disease or hypothyroidism
MCV <80 fL MCV >100 fL
Hb, hemoglobinEPO, erythropoietinAZT, azathioprineMTX, methotrexate
Rarer causes
App Red Cell Distribution Width (RDW) App
RDW is the variation in RBC volume (reported as part of CBC)
RDW=𝑆𝐷 𝑜𝑓 𝑀𝐶𝑉
𝑀𝐶𝑉X 100
Normal RDW: 11%–15%
Elevated RDW (>15%) known as anisocytosis
RDW useful in identifying anemia of mixed causes
Normal MCVNormal RDW
Normal MCVElevated RDW
• Anemia of chronic inflammation / renal disease
• Acute blood loss or hemolysis
• Early iron, B12, or folate deficiency• Mixed anemia (eg, combined iron
and B12 deficiency)• Sickle cell disease
Low MCVNormal RDW
Low MCVElevated RDW
• Anemia of chronic disease• Heterozygous thalassemia• Hemoglobin E trait
• Iron deficiency• β-thalassemia major
Elevated MCVNormal RDW
Elevated MCVElevated RDW
• Aplastic anemia• Chronic liver disease• Antivirals / chemotherapy /
alcohol
• Folate or vitamin B12 deficiency• Immune hemolytic anemia• Cytotoxic chemotherapy• Chronic liver disease• Myelodysplastic syndrome
SD, standard deviation
Marks PW, Glader B. Approach to Anemia in the Adult and Child. In: Hoffman F, et al. eds. Hematology Basic Principles and Practice. 5th. Philadelphia, PA: Churchill Livingstone/Elsevier;2009:439-446.
Reticulocytes
Brugnara C, et al. Curr Opin Hematol. 2013;20:222-230.
Immature RBCs (typically ~1% of RBCs) containing ribosomal remnants that circulate in blood for about a day before fully developing into RBCs
Serve as a marker of marrow red cell production activity
Increase to compensate for severe loss of mature RBCs in conditions such as hemolytic anemia
Reticulocytosis = elevated number of reticulocytes in the blood
Abnormally low numbers indicate failure of erythropoiesis in marrow
May indicate anemia of chronic inflammation, aplastic anemia, pernicious anemia, bone marrow malignancies, abnormal erythropoietin, vitamin or iron deficiencies, or chemotherapy
App 62-year-old Business Owner
Seen for routine follow up of type 2 diabetes, no complaints
Early retinopathy, neuropathy, and diabetic kidney disease
Laboratory studies:
Hemoglobin: 10.2 g/dL; MCV: 90 fL
Fasting blood sugar: 146 mg/dL; HbA1c: 7.8%
Urine microalbumin screen: 100 mg/g creatinine (normal, <30)
BUN 42 mg/dL; creatinine 1.9 mg/dL; Estimated GFR:35 mL/min/1.73 m2
Vitamin B12 (510 ng/L) and RBC folate within normal range
Improving Outcomes in Geriatric Anemia: A Guide to the Differential Diagnosis of Treatable Causes
4MEDX Mid-Atlantic – October 14, 2016
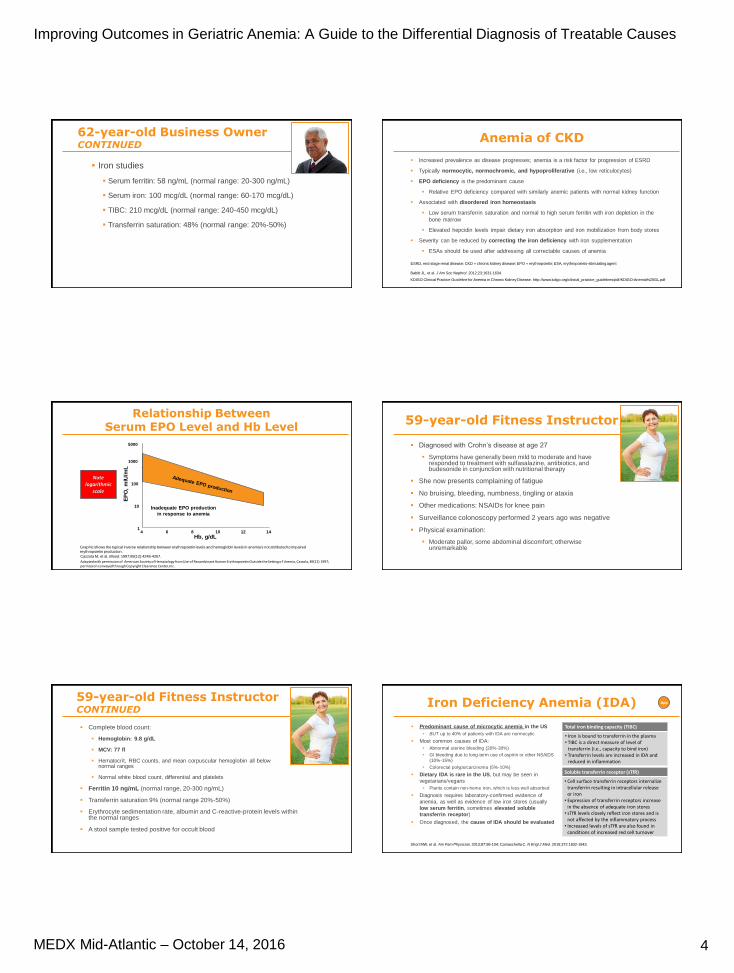
62-year-old Business OwnerCONTINUED
Iron studies
Serum ferritin: 58 ng/mL (normal range: 20-300 ng/mL)
Serum iron: 100 mcg/dL (normal range: 60-170 mcg/dL)
TIBC: 210 mcg/dL (normal range: 240-450 mcg/dL)
Transferrin saturation: 48% (normal range: 20%-50%)
Anemia of CKD
Increased prevalence as disease progresses; anemia is a risk factor for progression of ESRD
Typically normocytic, normochromic, and hypoproliferative (i.e., low reticulocytes)
EPO deficiency is the predominant cause
Relative EPO deficiency compared with similarly anemic patients with normal kidney function
Associated with disordered iron homeostasis
Low serum transferrin saturation and normal to high serum ferritin with iron depletion in the
bone marrow
Elevated hepcidin levels impair dietary iron absorption and iron mobilization from body stores
Severity can be reduced by correcting the iron deficiency with iron supplementation
ESAs should be used after addressing all correctable causes of anemia
Babitt JL, et al. J Am Soc Nephrol. 2012;23:1631-1634.
KDIGO Clinical Practice Guideline for Anemia in Chronic Kidney Disease. http://www.kdigo.org/clinical_practice_guidelines/pdf/KDIGO-Anemia%20GL.pdf
ESRD, end stage renal disease; CKD = chronic kidney disease; EPO = erythropoietin; ESA, erythropoiesis-stimulating agent
Relationship Between Serum EPO Level and Hb Level
4 6 8 10 12 141
10
100
1000
EP
O,
mIU
/mL
Hb, g/dL
5000
Inadequate EPO production
in response to anemia
Graphic shows the typical inverse relationship between erythropoietin levels and hemoglobin levels in anemia's not attributed to impaired erythropoietin production.
Note logarithmic
scale
Cazzola M, et al. Blood. 1997;89(12):4248-4267.
Adapted with permission of American Society of Hematology from Use of Recombinant Human Erythropoietin Outside the Setting of Uremia, Cazzola, 89(12) 1997; permission conveyed through Copyright Clearance Center, Inc.
59-year-old Fitness Instructor
Diagnosed with Crohn’s disease at age 27
Symptoms have generally been mild to moderate and have responded to treatment with sulfasalazine, antibiotics, and budesonide in conjunction with nutritional therapy
She now presents complaining of fatigue
No bruising, bleeding, numbness, tingling or ataxia
Other medications: NSAIDs for knee pain
Surveillance colonoscopy performed 2 years ago was negative
Physical examination:
Moderate pallor, some abdominal discomfort; otherwise unremarkable
59-year-old Fitness InstructorCONTINUED
Complete blood count:
Hemoglobin: 9.8 g/dL
MCV: 77 fl
Hematocrit, RBC counts, and mean corpuscular hemoglobin all below normal ranges
Normal white blood count, differential and platelets
Ferritin 10 ng/mL (normal range, 20-300 ng/mL)
Transferrin saturation 9% (normal range 20%-50%)
Erythrocyte sedimentation rate, albumin and C-reactive-protein levels within the normal ranges
A stool sample tested positive for occult blood
Iron Deficiency Anemia (IDA)
Predominant cause of microcytic anemia in the US
BUT up to 40% of patients with IDA are normocytic
Most common causes of IDA:
Abnormal uterine bleeding (20%-30%)
GI bleeding due to long-term use of aspirin or other NSAIDS
(10%-15%)
Colorectal polyps/carcinoma (5%-10%)
Dietary IDA is rare in the US, but may be seen in
vegetarians/vegans
Plants contain non-heme iron, which is less well absorbed
Diagnosis requires laboratory-confirmed evidence of
anemia, as well as evidence of low iron stores (usually
low serum ferritin, sometimes elevated soluble
transferrin receptor)
Once diagnosed, the cause of IDA should be evaluated
Total iron binding capacity (TIBC)
• Iron is bound to transferrin in the plasma• TIBC is a direct measure of level of
transferrin (i.e., capacity to bind iron)• Transferrin levels are increased in IDA and
reduced in inflammation
Soluble transferrin receptor (sTfR)
• Cell surface transferrin receptors internalize transferrin resulting in intracellular release or iron
• Expression of transferrin receptors increase in the absence of adequate iron stores
• sTfR levels closely reflect iron stores and is not affected by the inflammatory process
• Increased levels of sTfR are also found in conditions of increased red cell turnover
Short MW, et al. Am Fam Physician. 2013;87:98-104; Camaschella C. N Engl J Med. 2015;372:1832-1843.
App

Improving Outcomes in Geriatric Anemia: A Guide to the Differential Diagnosis of Treatable Causes
5MEDX Mid-Atlantic – October 14, 2016
Key Takeaway
Ferritin level is NOT a reliable measure of
iron storage in the body, because it is a
positive acute-phase reactant
Oral Iron Therapy
Short MW, et al. Am Fam Physician. 2013;87:98-104.
Hb increase of ≥1 g/dL after one month of treatment defines an adequate response to
treatment and confirms the diagnosis
Reticulocytes should increase after 1 week
Ferrous (2+ valence) salts are preferred because they are more readily absorbed than ferric (3+)
Vitamin C and an acidic stomach increase iron absorption in some patients
Form Formulation Elemental Iron Typical Dosage
Ferrous fumarate 324-mg tablet 106 mg One tablet twice per day
Ferrous gluconate 300-mg tablet 38 mg 1-3 tablets 2 or 3 times per day
Ferrous sulfate 325-mg tablet 65 mg One tablet 3 times per day
Adherence can be a challenge due to GI adverse events (epigastric discomfort, nausea, diarrhea,
and constipation)
These effects may be reduced when iron is taken with meals, but absorption may decrease by 40%
“Eating more red meat” is never enough! (100 g ribeye steak = 1.94 mg iron = 254 kcal)
Medications such as proton pump inhibitors may reduce absorption of dietary iron and iron tablets
Intravenous Iron Therapy
Considered better tolerated and more effective than oral iron treatment in improving ferritin
Can be used in patients who cannot tolerate/absorb oral iron, eg, those who have undergone
gastrectomy, gastrojejunostomy, bariatric surgery, or other small bowel surgeries
HMW iron dextran should be avoided (and is no longer marketed)
Available as solutions for injection; dose based on weight and desired change in Hb
Iron deficient patients usually need 1000 – 1500 mg to replete
Form Elemental Iron Typical single dose
LMW iron dextran (e.g. InFed®) – can give as total dose infusion 50 mg/mL Up to TDI
Sodium ferric gluconate (Nulecit™) 12.5 mg/mL 62.5 or 125 mg
Iron sucrose (Venofer®) 20 mg/mL 100 mg
Ferumoxytol (Feraheme®) 30 mg/mL 510 mg
Ferric carboxymaltose (Injectafer®) 50 mg/mL 750 mg
LMW, low molecular weight; HMW, high molecular weight.
Short MW, et al. Am Fam Physician. 2013;87:98-104; Rodgers GM, et al. J Am Soc Nephrol. 2008;19:833-840.
Microcytic-hypochromic Anemias (Common Causes)
Cause Clinical/lab clues Next test
Iron deficiency
Low ferritin Low iron with high TIBC = low
TfSat High sTfR High RDW High platelets Low hepcidin*
GI evaluation, unless bleeding source obvious
Consider celiac disease (antigliadin Ab)
Anemia of chronic disease/inflammation
Normal or high ferritin Low iron/low TIBC Low sTfR RDW variable High hepcidin*
ESR, CRP to confirm inflammation Specific immunological evaluation Serum EPO level
*Assays for serum hepcidin are in development
sTfR, soluble transferrin receptor. sTfR is a positive acute-phase reactant that may be used to complement ferritin. In vitro diagnostic (IVD) assays for sTfR are available
TfSat, transferrin saturation; TIBC, total iron-binding capacity
Camaschella C. N Engl J Med. 2015;372:1832-1843.
App
Microcytic-hypochromic Anemias (Thalassemia Syndromes/Sickle Cell Disease)
Test Iron deficiency b-thalassemia a-thalassemia Sickle-cell disease
Family History/ Ethnicity – Chinese, other Asians, African Americans
SE Asian, Middle Eastern, Chinese, African
African descent; rare but still possible in others
MCV (<80 fL in adults*) Low Low Low Normal; low if thalassemia also present
RDW High Normal; occasionally high Normal Normal to high
Ferritin Low Normal Normal Normal to high
Hemoglobin electrophoresis / HPLC
Normal (may havereduced HbA2)
Increased HbA2, reducedHbA, and probablyincreased HbF
Adults: normalNewborns: may have HbHor Hb Bart’s
HbS† ± another abnormal Hb
Treatment GI evaluation, unless bleeding source obvious
Trait: Asymptomatic¥
Intermedia: ± transfusionsMajor: Lifelong transfusions, chelation
Trait: Asymptomatic¥
Intermedia: Hemolysis which may need transfusionsMajor: Usually embryonic/newborn lethal
Trait: Asymptomatic¥
HbSS†: Transfusions to reduce HbS levels, chelation, hydroxyurea for painful venoocclusive crises, BMTHbSC†: Less severe than HBSS
HPLC, high-performance liquid chromatography*<70 fl in children 6 months to 6 years of age; and <76 fl in children 7 to 12 years of age†HbS=hemoglobin S (caused by a b-chain mutation); HbC=hemoglobin C; HbSC=compound heterozygote for HbS and HbC; HbSS=homozygous for HbS¥Persons with trait are asymptomatic and require no treatment or long-term monitoring. They usually do not have IDA.
Muncie HL, Campbell JS. Am Fam Physician. 2009;80:339-344. Yawn BP et al. JAMA. 2014;312(10):1033-1048.
AppMicrocytic-hypochromic Anemias
(Rarer Causes)
Cause Clinical/lab clues Next test
Sideroblastic anemias High RDW/dimorphic picture Bone marrow exam
Vitamin C deficiency Petechiae, loose teeth; patient
is typically alcoholic or malnourished
Vitamin C level
Hemoglobin C African, chronic hemolysis Hemoglobin
electrophoresis/HPLC
Hemoglobin E SE Asian, chronic hemolysis Hemoglobin
electrophoresis/HPLC
RDW = red cell distribution width; SE = Southeast; HPLC = high performance liquid chromatographyWolanskyj AP, et al. Hematology. In: Ficalora RD, ed. Mayo Clinic Internal Medicine Board Review. 10th ed. 2013;497-511.
App

Improving Outcomes in Geriatric Anemia: A Guide to the Differential Diagnosis of Treatable Causes
6MEDX Mid-Atlantic – October 14, 2016
Algorithm for Laboratory Workup of Macrocytic Anemias
*If MCV is very high (>110 fL), suspect: B12/folate deficiency, RBC agglutination
MCV >100 fL*Normal reticulocyte count
Oval macrocytesNo macrocytes on
peripheral blood smearRound macrocytes
• Vitamin B12
• Folate
Consider lab error or:• Cold agglutinins• Hyperleukocytosis• Hyperglycemia
• Liver• Thyroid
Normal Low
Bone marrow & cytogenetics
Evaluate as indicated
App
Reprinted from Med Clin North Am, 76/3, Colon-Otero G, Hook C, Menke D. A practical approach to the differential diagnosis and evaluation of the adult patient with macrocytic anemia. 581-97, Copyright 1992, with permission from Elsevier.
Vitamin B12 / Folate Deficiency
Low intake of animal source foods; may be seen in vegetarians/vegans1,2
While dairy and eggs have vitamin B12, many vegetarians/most vegans will eventually require supplements
Severe vitamin B12 deficiency most commonly caused by autoimmune gastritis
(pernicious anemia)3,4
Methodological problems may compromise the sensitivity and specificity of current
vitamin B12 assays4
Vitamin B12 deficiency may be confirmed by measurement of methylmalonic acid, homocysteine, or both
An elevated level of methylmalonic acid is more sensitive and specific for the diagnosis
If only homocysteine levels are elevated, then a folate deficiency may exist
High-dose oral vitamin B12 tablets (1000 to 2000 μg) taken daily are as effective as
intramuscular monthly injections in correcting blood and neurologic abnormalities3
Pernicious anemia / malabsorption require lifelong vitamin B12 therapy3
1. Gilsing AM et al. Eur J Clin Nutr. 2010;64(9):933-939. 2. Herrmann W et al. Am J Clin Nutr. 2003;78(1):131-6. 3. Kaferle J, Strzoda CE. Am Fam Physician. 2009;79:203-208. 4. Stabler SP. New Engl J Med. 2013;368:149-160.
68-year-old Retired Teacher
Complains of reduced stamina and new dyspnea
upon exertion, no chest pain
Past medical history: breast cancer 6 years ago, treated
with lumpectomy and adjuvant chemotherapy and
radiotherapy, follow up exams all negative
No significant alcohol use or smoking history
Physical examination: lungs clear, mild sinus tachycardia
(heart rate ~102/min.); exam otherwise unrevealing
68-year-old Retired TeacherCONTINUED
Laboratory studies:
Hemoglobin 9.6 g/dL, MCV 102 fL; rest of CBC
within normal range
Folate, B12, thyroid stimulating hormone (TSH), serum
ferritin, serum iron, % iron saturation all within normal range
Fecal occult blood negative x 2
2 years ago, screening colonoscopy was negative
Key Takeaway
Once gastrointestinal bleeding, nutritional cause, and
renal failure have been ruled out, evaluation of
anemia should continue
A bone marrow examination may be indicated even
if anemia is the only cytopenia
Classification of Hematologic Malignancies
Hematologic Malignancies
Myeloid Neoplasms
Acute MyeloidLeukemia
(≥20% blasts)
Chronic Myeloid Disorders
(<20% blasts)
MyelodysplasticSyndromes
Myelodysplastic / Myeloproliferative
Neoplasms
MyeloproliferativeNeoplasms
Chronic Myeloid Leukemia
Polycythemia Vera
Essential Thrombothycemia
Primary Myelofibrosis
Lymphoid Neoplasms
Precursor Lymphoid
Neoplasms
Hodgkin Lymphoma
Mature B-cell Neoplasms
(eg, Myeloma)
Mature T-/NK-cell Neoplasms(eg, NHL)
Swerdlow SH, et al, eds. WHO Classification of Tumours of Haematopoietic and Lymphoid Tissues. Lyon, France: IARC Press; 2008.
Arber DA et al. Blood. 2016;127(20):2391-2405.

Improving Outcomes in Geriatric Anemia: A Guide to the Differential Diagnosis of Treatable Causes
7MEDX Mid-Atlantic – October 14, 2016
Key Features of Myelodysplastic Syndromes (MDS)
“Preleukemia”
Death from infection, bleeding, complications of anemia (50%)
Death from other causes (25%)
AML (25%)
Clinical course
Disease features
Patients
>95% of patients have cytopenias, most commonly anemia; less than half have
neutropenia or thrombocytopenia at diagnosis
MDS Paradox: Bone marrow usually hypercellular
Cells look abnormal (“dysplastic”), Blasts may be increased
~1/2 of patients have abnormal chromosomes on G-banded karyotyping, usually numeric
anomalies; >90% have mutations
Median age at diagnosis ~70 Prior chemotherapy (alkylators, topoisomerase II inhibitors) in 5%-10%
Prior radiation Exposure in <5%
2o MDS
Fenaux P. Semin Hematol. 2004;41(2 suppl 4):6-12.
Key Takeaway
It is important to diagnose/rule out MDS and other
chronic myeloid neoplasms because:
Effective therapies are available
Even if the cause of anemia is not due to MDS or
another chronic myeloid neoplasm, the hematologist
may be able to find a specific cause
Cytopenic and Clonal States and Their Relationship to MDS and Risk
Molecular genetic testing for mutations can complicate diagnosis but is reasonable in elderly
patients with unexplained anemia, especially if cytopenias exist
≥10% of patients older than 70 years of age have detectable clonal mutations
Unexplained cytopenias have varying degrees of risk based on presence of clonal mutation(s)
and/or dysplasia
Cytopenias in the presence of clonal mutations increase risk for a hematological neoplasm such as MDS
aMay be present in elderly; b<10% of cells per lineage; cDoesn’t meet WHO criteria for diagnosis of MDS or other neoplasm; dMDS specific
Republished with permission of American Society of Hematology from Clonal hematopoiesis of indeterminate potential and its distinction from myelodysplastic syndromes, Steensma D, 126, 2015; permission conveyed through Copyright Clearance Center, Inc.
State CytopeniasClonal
Mutation Dyspalsia Comment
Normal hematopoiesis – – –a Healthy state
Idiopathic cytopeniasof uncertain significance (ICUS)
+ – –/+b Heterogeneous. May resolve with time or become MDS/other hematologic neoplasm
Clonal hematopoiesis of indeterminate potential (CHIP)
–/+ + (single)c –/+b Common in healthy aging population. Confers 0.5%-1.0% annual risk of progression. Increased all-cause mortality
Clonal cytopeniasof undetermined significance (CCUS)
+ + (≥2)c –/+Can be considered a subset of CHIP but with higher risk of progression
MDS without blast increase + +d +Specific mutation(s) may define MDS even in the absence of dyplasia
MDS with blast increase + +d + Biologically similar to AML
Risk to patient
Pursuit of Unexplained Anemia in the Elderly – How Common is MDS?
In the NHANES III ~6% of the total anemic population (~17% of those with unexplained anemia) met ≥1 diagnostic criteria for MDS1
Annual incidence of MDS among Medicare beneficiaries aged ≥65 years: 75 per 100,0002
1 Guralnik JM, et al. Blood. 2004;104:2263-2268.2 Cogle CR, et al. Blood. 2011;117:7121-7125. (Using an algorithm that required one or more MDS claims and accounted for recommended diagnostic services during the year before the first claim; 2005 data)
33.3%
33.3%
5.8%
27.5%
Nutritional
Chronic Disease
Meeting criteria for MDS
Unidentified cause
If there are ~60,000 new MDS cases per year then….
MDS is the 2nd most common hematological malignancy after Non-Hodgkin Lymphoma
(NHL) and a top 10 cancer in frequency
Comparison: 18,960 new cases of chronic lymphocytic leukemia and 8720 new cases of testicular cancer in 2016
Cancer Facts and Figures 2016. American Cancer Society. http://www.cancer.org/acs/groups/content/@research/documents/document/acspc-047079.pdf.
249,260
224,390
180,890
95,270
76,960
76,380
72,580
64,300
62,700
60,050
60,000
Breast
Lung
Prostate
Colon
Urinary bladder
Melanoma
NHL
Thyroid
Kidney
Uterine corpus
MDS
Estimated new cases in 2016 (men and women)
2001
Hematopoietic growth factors,
especially ESAs*
Danazol*/androgens
Low-dose cytarabine
Hematopoietic stem cell transplant
in <5% of patients
2016
ESAs* used less
Oral iron chelation (deferasirox is FDA approved for iron overload associated with transfusions and non-transfusion-dependent thalassemia (NTDT); see black box warning about hepatic/renal failure)
G-CSF*/GM-CSF*, pegfilgrastim*, TPO receptor agonists*
Immunosuppressive therapy (IST)*
Decitabine (injectable; FDA approved 2006)†
Azacitidine (injectable; FDA approved 2004)†
Lenalidomide (oral; FDA approved 2005)
Hematopoietic allogeneic stem cell transplant in up to 20% of patients (RIC, URD, umbilical cord for adults, etc.)
Investigational immunotherapies including PD-1 checkpoint inhibitors combined with azacitidine, CAR T-cell therapy
CAR, chimeric antigen receptor; ESA, erythropoiesis-stimulating agent, G-CSF, granulocyte-colony stimulating factor, GM-CSF, granulocyte-macrophage-colony stimulating factor; PD-1, Programmed cell death protein 1; RIC, reduced intensity conditioning; TPO, thrombopoietin; URD, unrelated donor.
*Not FDA approved for MDS; †Oral formulation in development.
Steensma DP. Hematol Oncol Clin North Am. 2010;24:423-441. †Garcia-Manero G, et al. J Clin Oncol. 2011;29:2521-2527.
Commonly Employed Treatments for MDS:Evolution in the Last 15 Years

Improving Outcomes in Geriatric Anemia: A Guide to the Differential Diagnosis of Treatable Causes
8MEDX Mid-Atlantic – October 14, 2016
Many Patients With MDS Become Transfusion Dependent
Transfusions are needed in 39% (lower risk) to 79% (higher risk) of MDS patients1
Transfusion requirements are associated with significantly reduced OS2
Issues with transfusions3-4
Temporary improvement
Risk of infection, reaction
Need for iron chelation after multiple transfusions
Impact on blood supply (MDS accounts for ~3% of transfusions)
Impact on QoL
Inconvenient
Costly (blood product processing, drugs/consumables, staff/overhead, management of
complications and hospitalization)
1 Brechignac S, et al. Blood. 2004;104:263b:Abstract 4716; 2 Cazzola M, et al. N Engl J Med. 2005;352:536-538; 3 Gupta P, et al. Leuk Res. 1999;23:953-959; 4 Hellström-Lindberg E, et al. Br J Haematol. 2003;120:1037-1046.
MDS is Worth Diagnosing Because Effective Therapies Are Available
Drug MOA Indication Efficacy in pivotal studies Toxicities
Lenalidomide1,2 Immunomodulatory (haseffects on MDS cells, the bone marrow microenvironment, and host immunity)
Transfusion-dependent anemia due to low- or int-1-risk MDS associated with a del(5q) abnormality ± additional cytogenetic abnormalities
• 67% transfusion independence• Median Hb ↑ 5.4 g/dL• Median duration of response
>2 years• 45% complete cytogenetic
remission
• Cytopenias• Peripheral neuropathy• Concern about teratogenicity• Rash• VTE (rare when used as
monotherapy as in MDS)
Azacitidine3,4 Hypomethylating agent (affects gene expression)
All MDS subtypes • Significant 9.4 months improvement in OS vs control
• 45% transfusion independent vs 11% for control
• Cytopenias• Febrile neutropenia, especially
in first 2 cycles• Skin reactions (with
subcutaneous azacitidine)• Gastrointestinal side effects
(diarrhea, nausea)• Aphthous ulcers of the mouth• Maculopapular skin rash
Decitabine5-7 Hypomethylating agent (affects gene expression)
All MDS subtypes including previously treated and untreated, de novo and secondary MDS
• 32% ORR• 51% overall improvement rate
including 18% hematologicimprovement
• No OS benefit in EORTC study
1.List A, et al. N Engl J Med. 2006;355:1456 -1465. 2. Revlimid® (lenalidomide) prescribing information. http://www.revlimid.com/wp-content/uploads/2013/11/PI.pdf. 3. FenauxP, et al. Lancet Oncol. 2009;10:223-232. 4. Vidaza® (azacitidine) prescribing information. www.vidaza.com. 5. Steensma DP, et al. J Clin Oncol. 2009;27:3842-3848. 6. Lübbert M, et al. J Clin Oncol. 2011;29:1987-1996. 7. Dacogen (decitabine) prescribing information. http://otsuka-us.com/products/Documents/DACOGEN.PI.pdf.
Review peripheral blood smear and assess MCV
Worrisome peripheral
smear?
Iron studiesnormal?
Consider hemoglobin electrophoresis andmeasurement of creatinine/serum EPO
Supplement ironand evaluatefor bleeding
If EPO elevated, provide supportive care
Supplementnutritionaldeficiency
Consider bone marrowexamination if findings
will change management
Treat as indicated
Review old blood cell countsMeasure ferritin, serum iron/
total iron-binding capacityMeasure creatinine, serum EPO
If cause not obvious from history, measure vitamin B12/folate and MMA/homocysteine
Elevated MCV (>100 fL)
Yes
Yes
Yes
No
NoNo
Low MCV (<80 fL) Normal MCV (80-100 fL)
Major ConsiderationsIron deficiency/bleedingThalassemiaAnemia of chronic inflammation(if MCV mildly low)
Major ConsiderationsAnemia of chronic inflammationRenal insufficiencyConcomitant low MCV and high
MCV disorderEarly iron deficiency
Major ConsiderationsVitamin B12/folate deficiencyDrug effectAlcohol abuseLiver/thyroid diseaseMDS
Vitamin B12/homocysteine/MMA
normal?
If creatinine higher or EPO lower than expected, consider EPO supplementation
EPO, erythropoietinMCV, mean corpuscular volumeMDS, myelodysplastic syndrome
Proposed Algorithm for Evaluation of Low Hemoglobin in Older Patients
App
Adapted from Mayo Clin Proc, 82, Steensma DP, et al. Anemia in the Elderly: How Should We Define It, When Does It Matter, and What Can Be Done? 958-966,
Copyright 2007 with permission from Elsevier.
Anemia Best Practices
Anemia should not be considered a normal part of the aging process and should be evaluated
A cause can often be determined, and treatment may alter outcomes and improve quality of life (QOL)
Use mean cell volume (MCV) to narrow differential diagnosis of geriatric anemia and determine initial tests
Microcytosis, MCV <80 fL
Normocytosis, MCV 80-100 fL
Macrocytosis, MCV >100 fL
Referral to hematologist for possible bone marrow examination should be carefully considered in patients with unexplained macrocyctic anemia
Free Accompanying Mobile App!
A free anemia algorithm mobile app is available that covers concepts in this presentation
The icon is included on slides where the app would be especially useful
To download go to the Google Play store (Android phone/tablet users) or iTunes store (iPhone, iPad users)
App
Thank you!