Embed Size (px)
Citation preview
IMPROVING PATIENT FLOW IN AN
OUTPATIENT CHEMOTHERAPY
INFUSION CENTER
Pamela Martinez Villarreal
Matthew Rouhana
Agenda
2
• The Team
• Cancer Background
• Infusion Overview
• Project Initiatives

The Team
3
Hassan Abbas Nursing Student
Jeremy Castaing, Ph.D Candidate Industrial and Operations Engineering
Ajaay Chandrasekaran Computer Science Student
Chhavi Chaudhry Industrial and Operations Engineering Student
Amy Cohn, Ph.D. Associate Director, CHEPS
Diane Drago Patient & Family Advisory Board (PFAB)
Marian Grace Boxer, MD Professor, Internal Med., Hematology/Oncology
Corinne Hardecki, RN Clinical Care Coordinator, Infusion
Madalina Jiga Nursing Student
Jennifer Mathie Supervisor, Department of Pathology
Jonathon McCormick Industrial and Operations Engineering
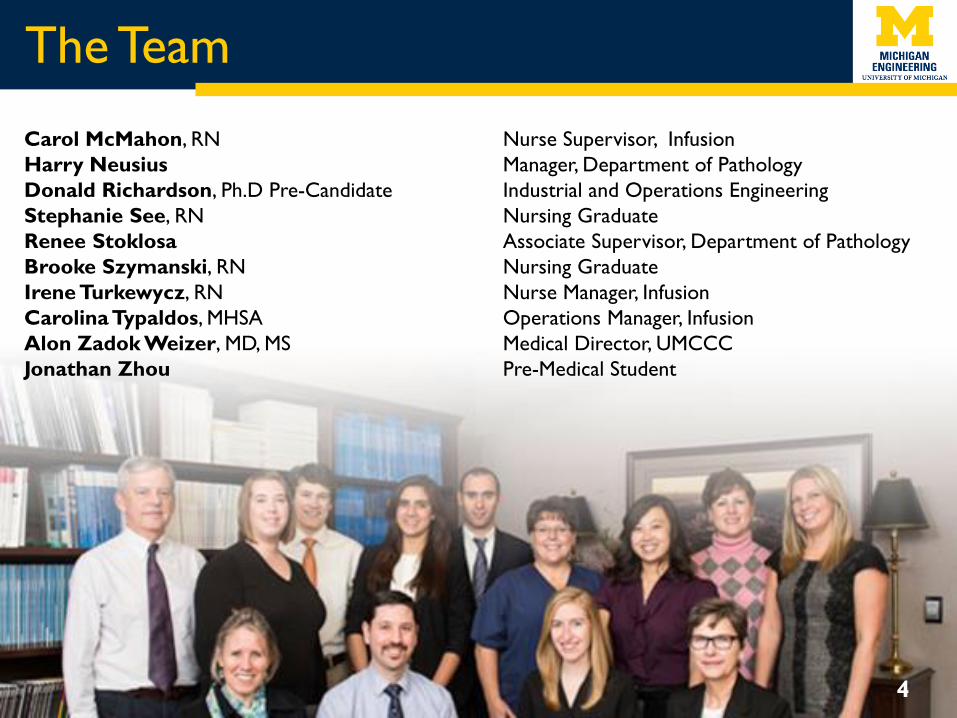
Carol McMahon, RN Nurse Supervisor, Infusion
Harry Neusius Manager, Department of Pathology
Donald Richardson, Ph.D Pre-Candidate Industrial and Operations Engineering
Stephanie See, RN Nursing Graduate
Renee Stoklosa Associate Supervisor, Department of Pathology
Brooke Szymanski, RN Nursing Graduate
Irene Turkewycz, RN Nurse Manager, Infusion
Carolina Typaldos, MHSA Operations Manager, Infusion
Alon Zadok Weizer, MD, MS Medical Director, UMCCC
Jonathan Zhou Pre-Medical Student
4
The Team
Cancer Statistics
– Second leading cause of death in the United States
– In 2015, there will be an estimated 1,658,370 new
cancer cases diagnosed and 589,430 cancer deaths in
the US.
Source:
Centers for Disease Control and Prevention (2015) http://www.cdc.gov
American Cancer Society (2015) http://www.cancer.org
5
U of M Comprehensive Cancer Center
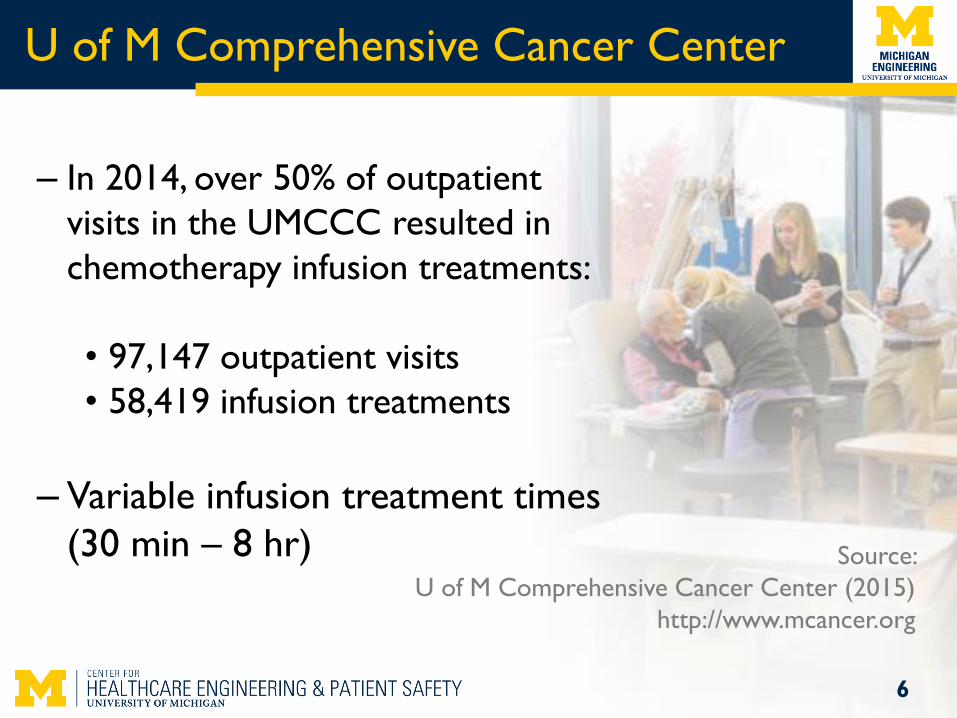
– In 2014, over 50% of outpatient
visits in the UMCCC resulted in
chemotherapy infusion treatments:
• 97,147 outpatient visits
• 58,419 infusion treatments
– Variable infusion treatment times
(30 min – 8 hr)
6
Source:
U of M Comprehensive Cancer Center (2015)
http://www.mcancer.org
Our Goal
7
Reduce patient waiting times
and improve their full-day experience
Infusion Overview
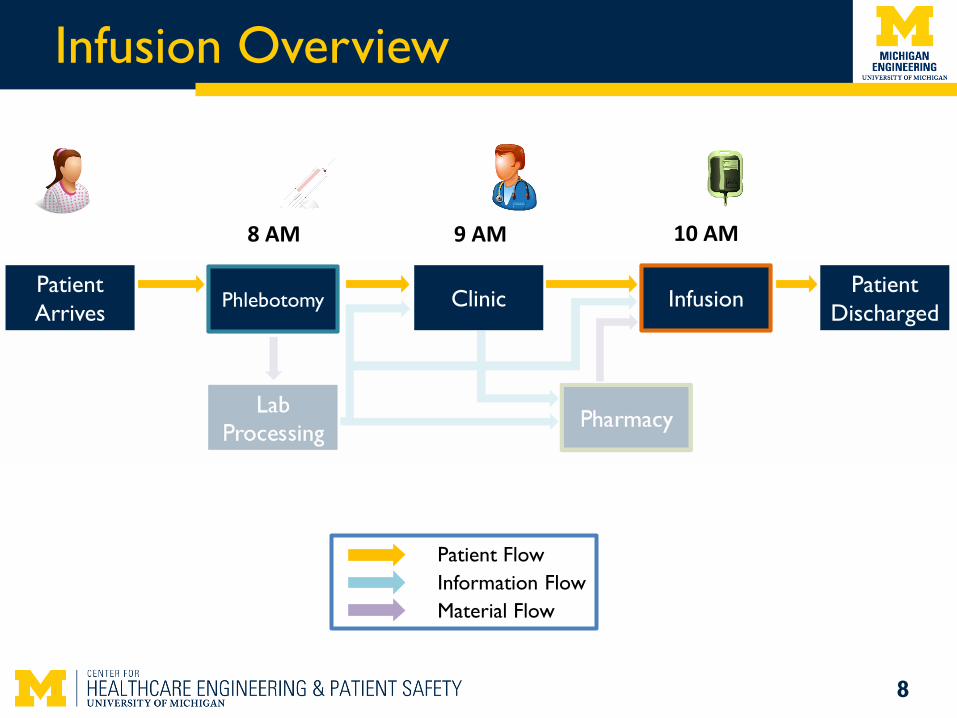
Patient
Arrives
Patient Flow
Information Flow
Material Flow
8
8 AM 9 AM 10 AM
Phlebotomy Clinic Infusion Patient
Discharged
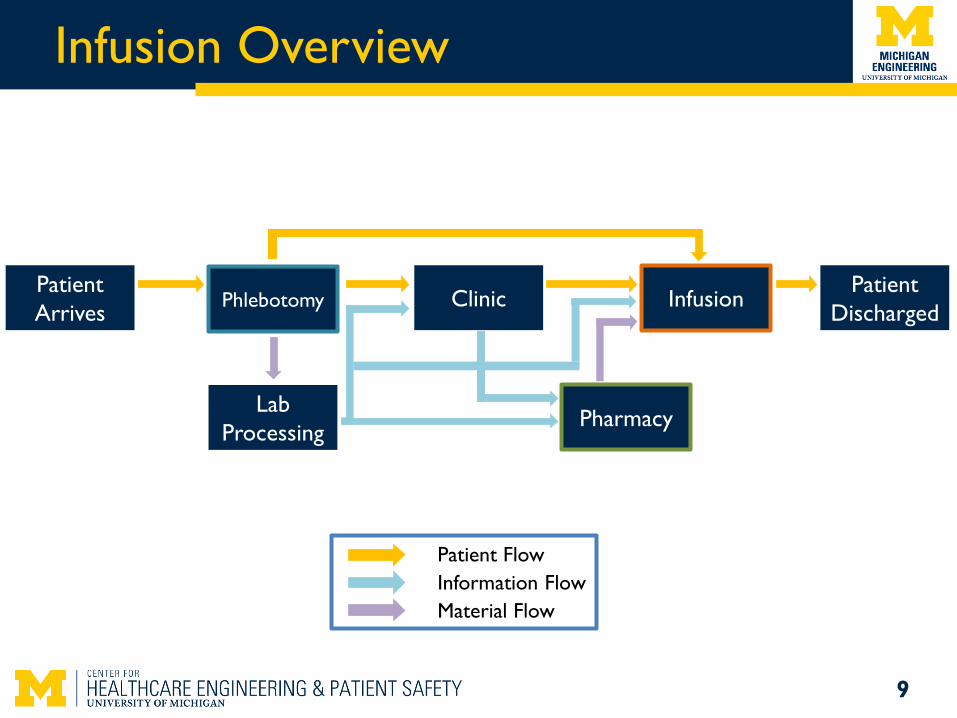
Infusion Overview
Lab
Processing
Phlebotomy Patient
Arrives Clinic
Pharmacy
Infusion Patient
Discharged
Patient Flow
Information Flow
Material Flow
9
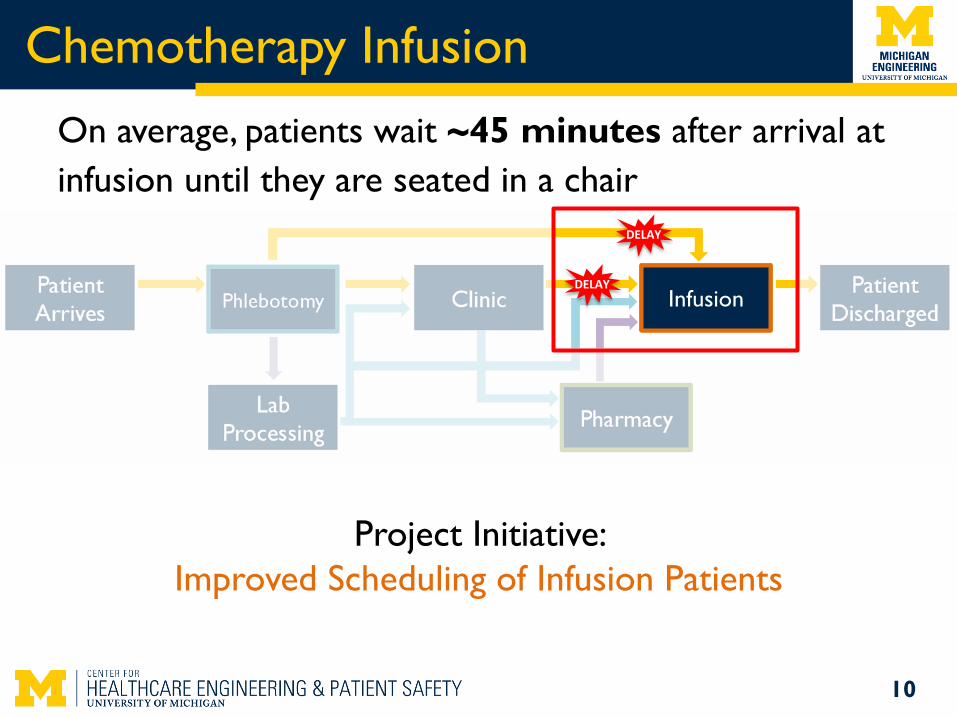
Chemotherapy Infusion
10
On average, patients wait ~45 minutes after arrival at
infusion until they are seated in a chair
Project Initiative:
Improved Scheduling of Infusion Patients
Infusion
DELAY
DELAY
Chemotherapy Infusion
11
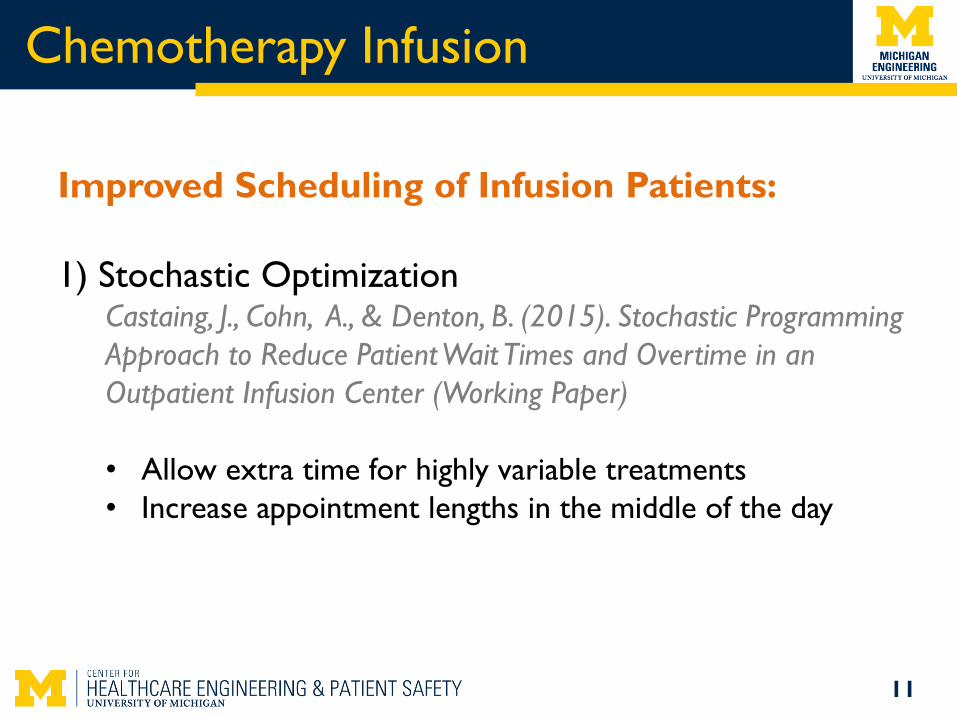
Improved Scheduling of Infusion Patients:
1) Stochastic Optimization Castaing, J., Cohn, A., & Denton, B. (2015). Stochastic Programming
Approach to Reduce Patient Wait Times and Overtime in an
Outpatient Infusion Center (Working Paper)
• Allow extra time for highly variable treatments
• Increase appointment lengths in the middle of the day
Chemotherapy Infusion
12
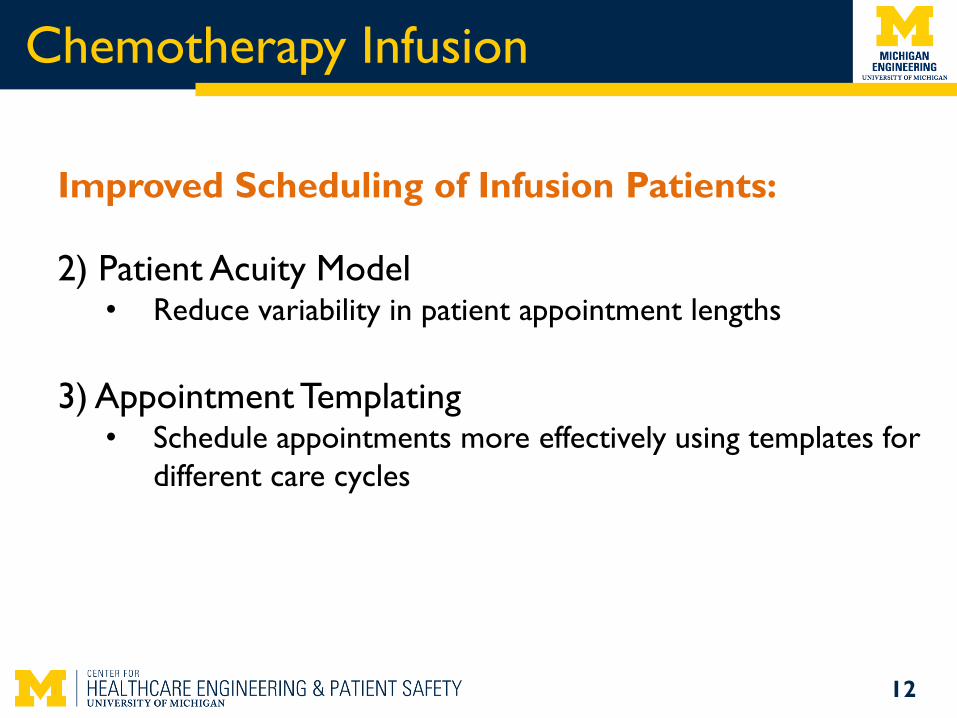
Improved Scheduling of Infusion Patients:
2) Patient Acuity Model • Reduce variability in patient appointment lengths
3) Appointment Templating • Schedule appointments more effectively using templates for
different care cycles
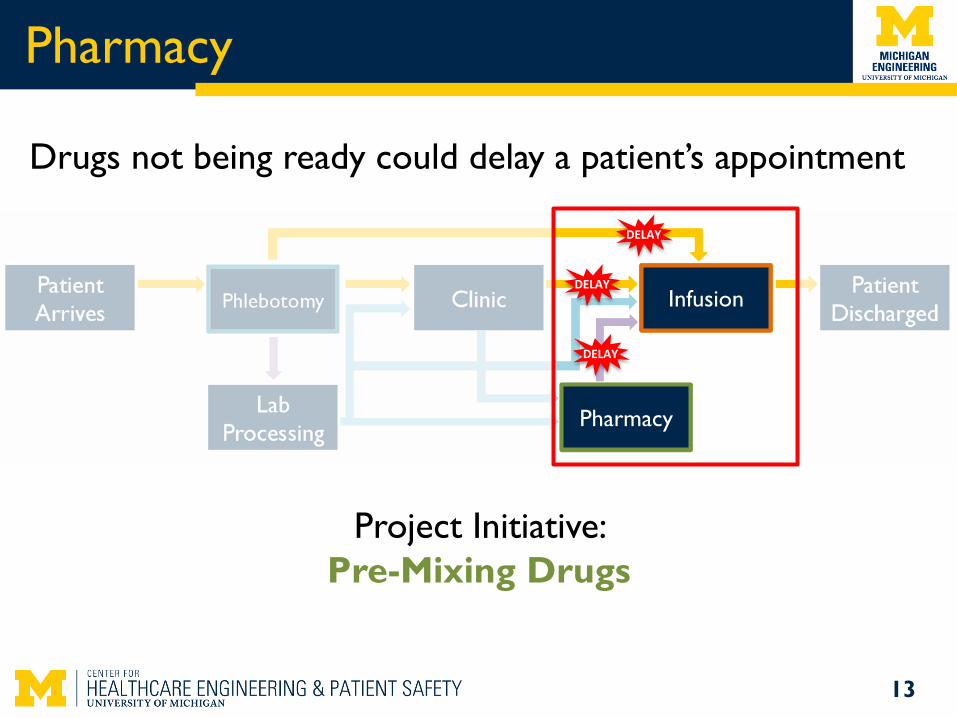
Pharmacy
13
Drugs not being ready could delay a patient’s appointment
Project Initiative:
Pre-Mixing Drugs
Infusion
DELAY
DELAY
Pharmacy
DELAY
Pharmacy
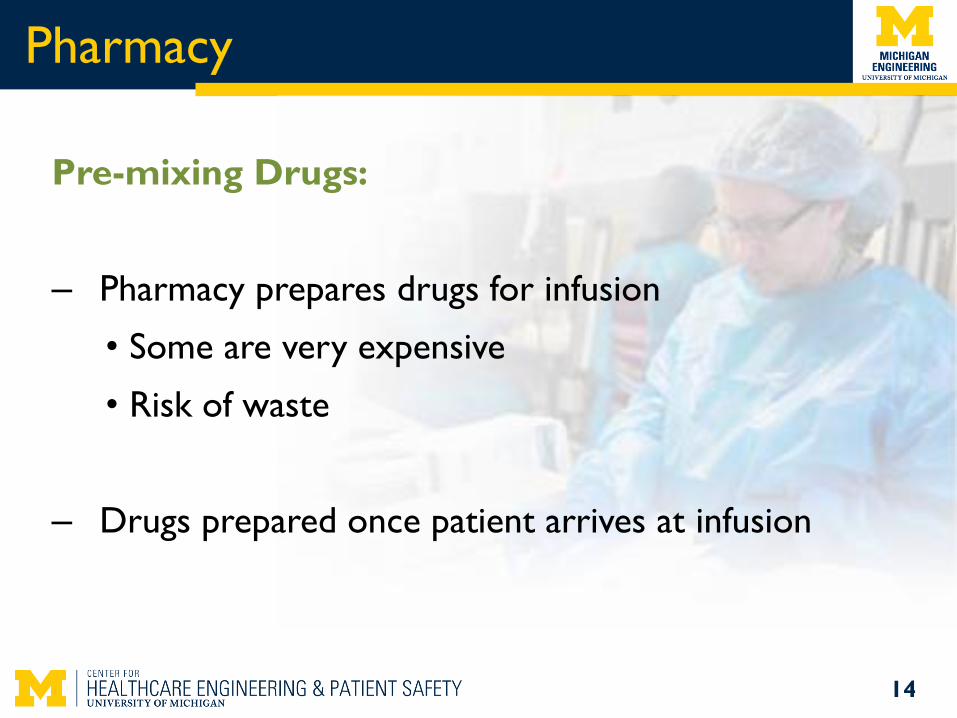
14
Pre-mixing Drugs:
– Pharmacy prepares drugs for infusion
• Some are very expensive
• Risk of waste
– Drugs prepared once patient arrives at infusion
Pharmacy
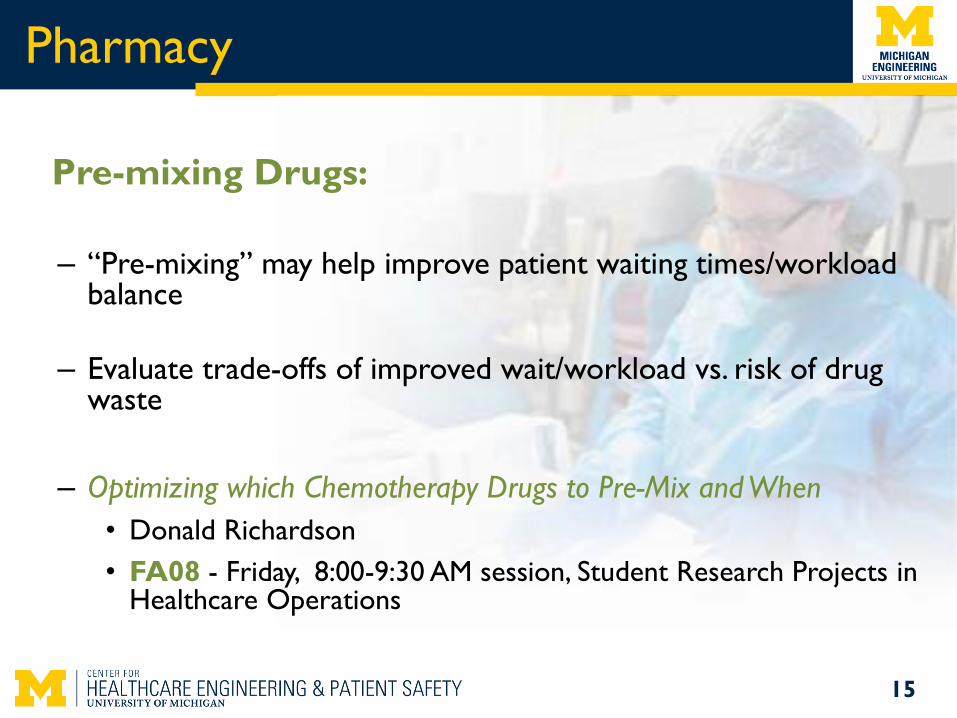
15
Pre-mixing Drugs:
– “Pre-mixing” may help improve patient waiting times/workload balance
– Evaluate trade-offs of improved wait/workload vs. risk of drug waste
– Optimizing which Chemotherapy Drugs to Pre-Mix and When
• Donald Richardson
• FA08 - Friday, 8:00-9:30 AM session, Student Research Projects in Healthcare Operations
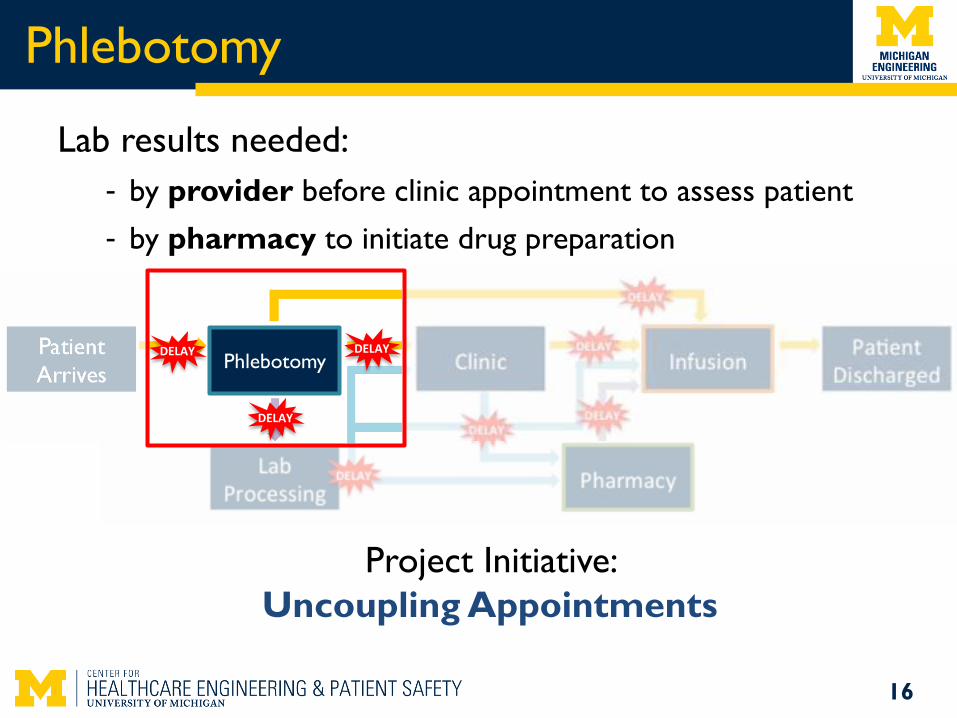
Phlebotomy
16
Lab results needed:
- by provider before clinic appointment to assess patient
- by pharmacy to initiate drug preparation
Project Initiative:
Uncoupling Appointments
Phlebotomy DELAY
DELAY
DELAY
Phlebotomy
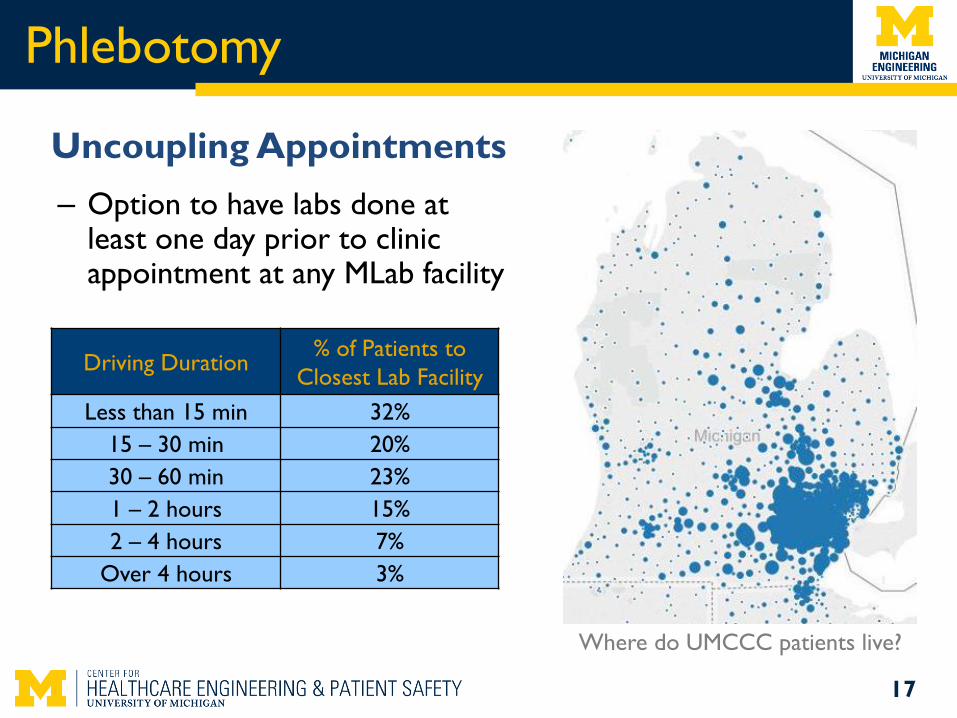
Uncoupling Appointments AD
– Option to have labs done at least one day prior to clinic appointment at any MLab facility
17
Where do UMCCC patients live?
Driving Duration % of Patients to
Closest Lab Facility
Less than 15 min 32%
15 – 30 min 20%
30 – 60 min 23%
1 – 2 hours 15%
2 – 4 hours 7%
Over 4 hours 3%
Phlebotomy
18
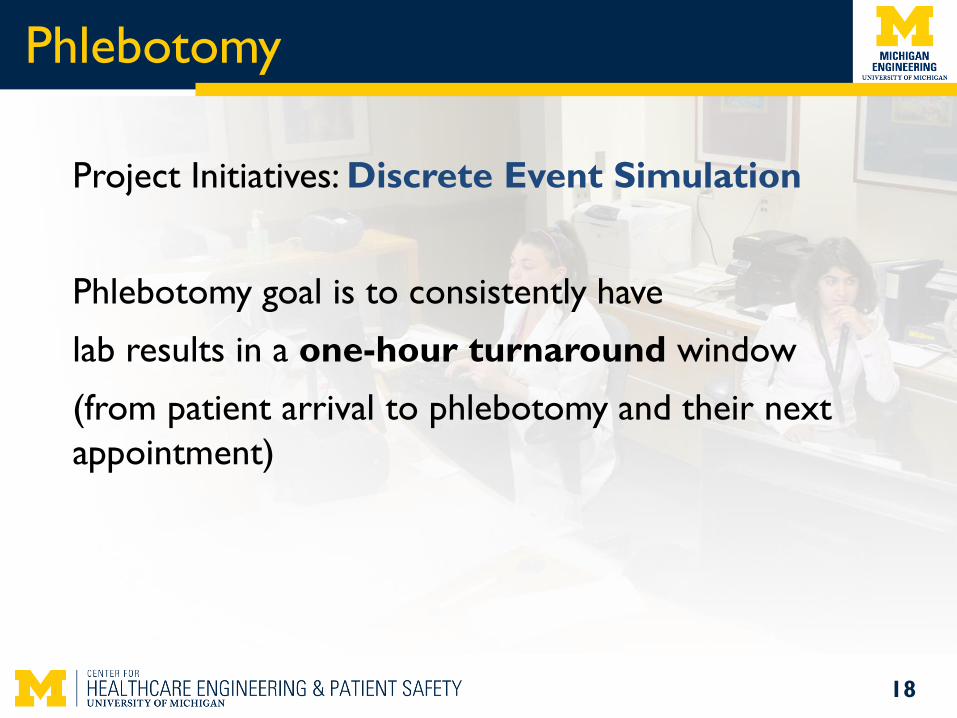
Project Initiatives: Discrete Event Simulation
Phlebotomy goal is to consistently have
lab results in a one-hour turnaround window
(from patient arrival to phlebotomy and their next
appointment)
Phlebotomy
19
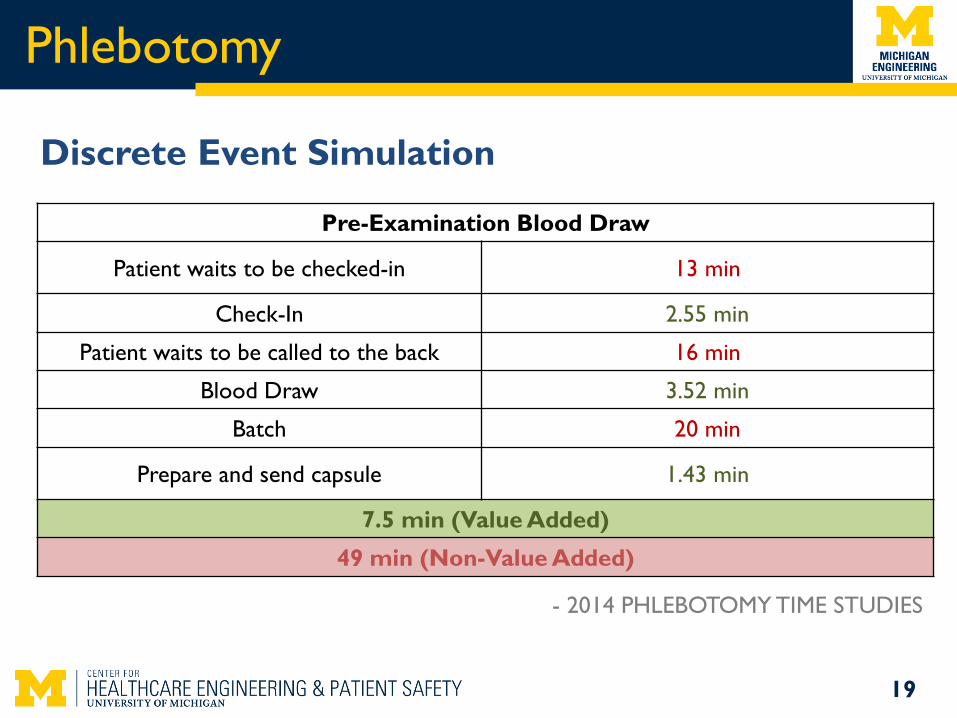
Pre-Examination Blood Draw
Patient waits to be checked-in 13 min
Check-In 2.55 min
Patient waits to be called to the back 16 min
Blood Draw 3.52 min
Batch 20 min
Prepare and send capsule 1.43 min
7.5 min (Value Added)
49 min (Non-Value Added)
- 2014 PHLEBOTOMY TIME STUDIES
Discrete Event Simulation
Phlebotomy
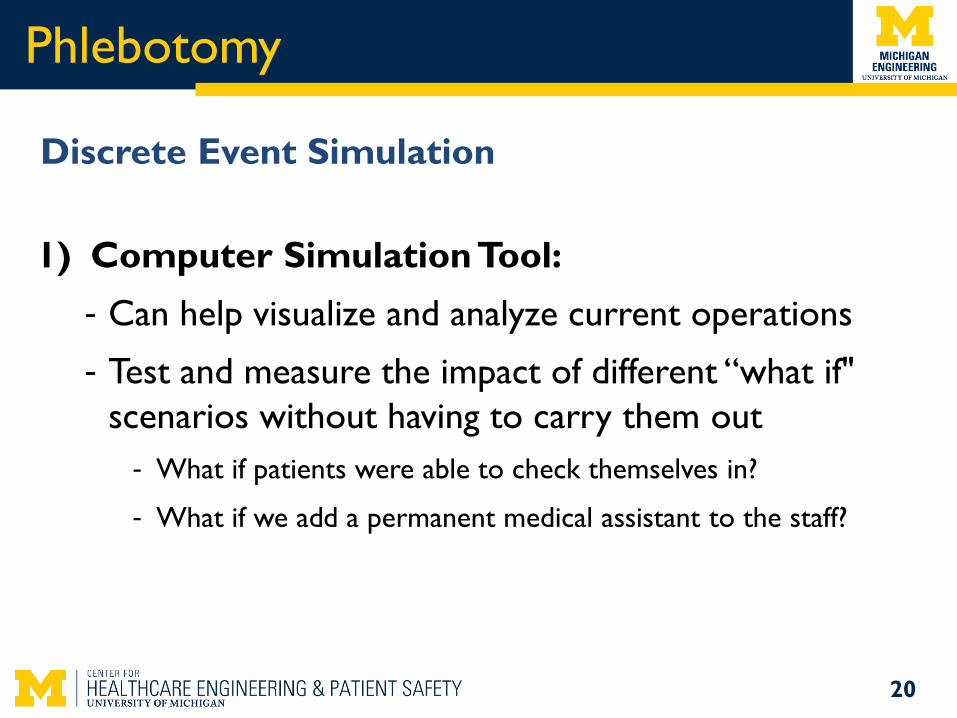
1) Computer Simulation Tool:
- Can help visualize and analyze current operations
- Test and measure the impact of different “what if"
scenarios without having to carry them out
- What if patients were able to check themselves in?
- What if we add a permanent medical assistant to the staff?
20
Discrete Event Simulation
Phlebotomy
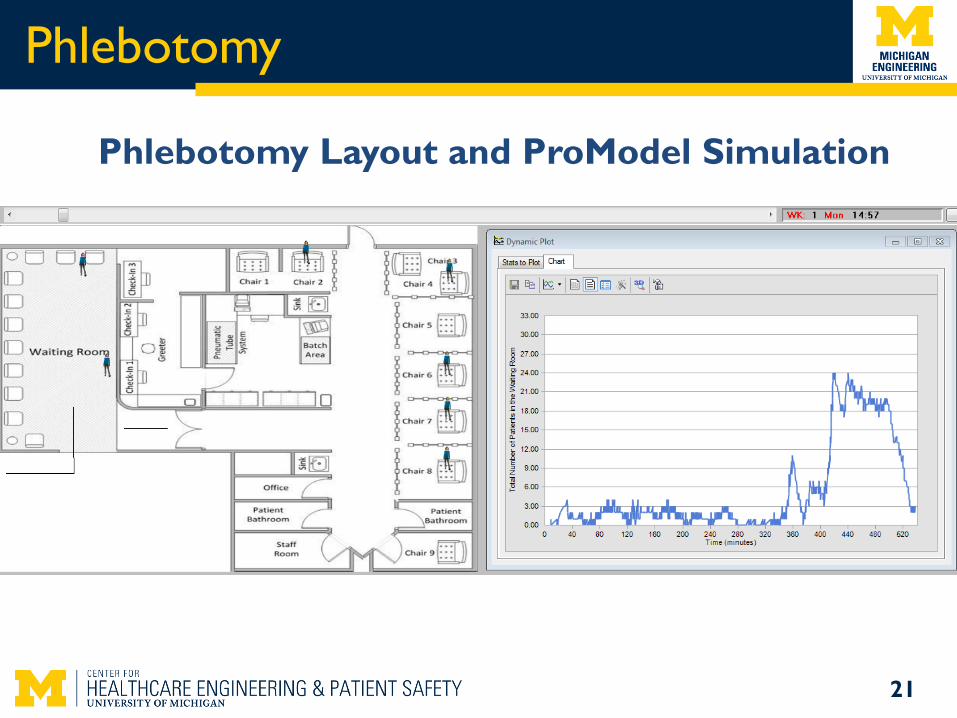
21
Phlebotomy Layout and ProModel Simulation
Phlebotomy
22
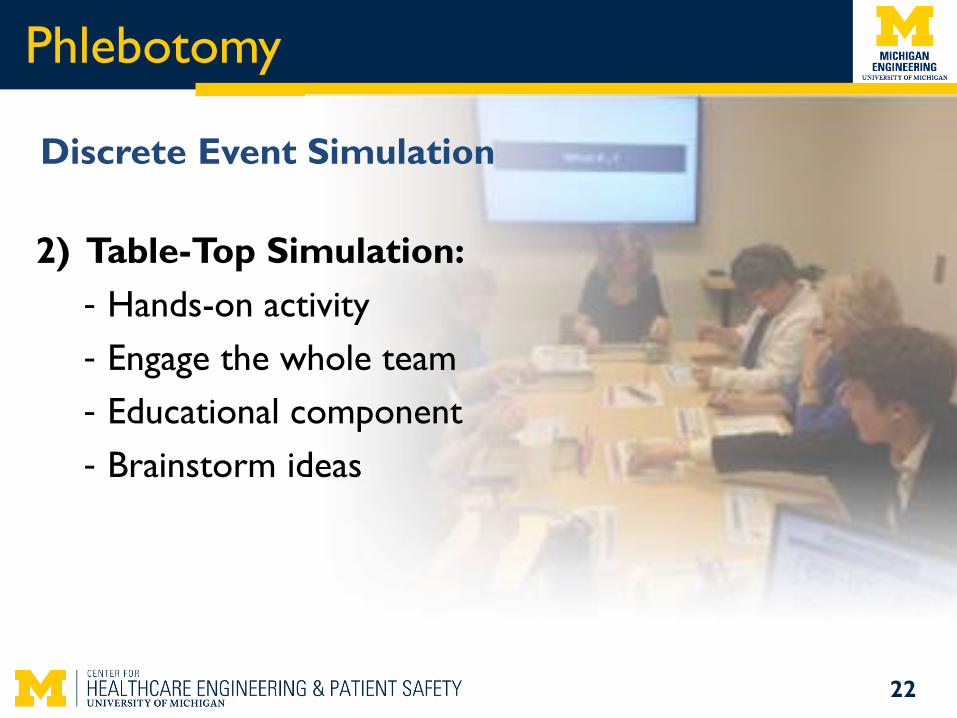
Discrete Event Simulation
2) Table-Top Simulation:
- Hands-on activity
- Engage the whole team
- Educational component
- Brainstorm ideas
Future Work
23
Improved Scheduling of Infusion Patients: - Incorporate acuity and improve scheduling templates and
protocols
Pre-mixing Drugs Tool: - Assist in deciding which drugs to prepare and when
Discrete Event Simulation: - Simulate different “what if" scenarios to test and
measure their impact in the process
QUESTIONS?
Thank you!
24
CONTACT INFORMATION:
Amy Cohn – [email protected]
Pamela Martinez – [email protected]
Matt Rouhana – [email protected]
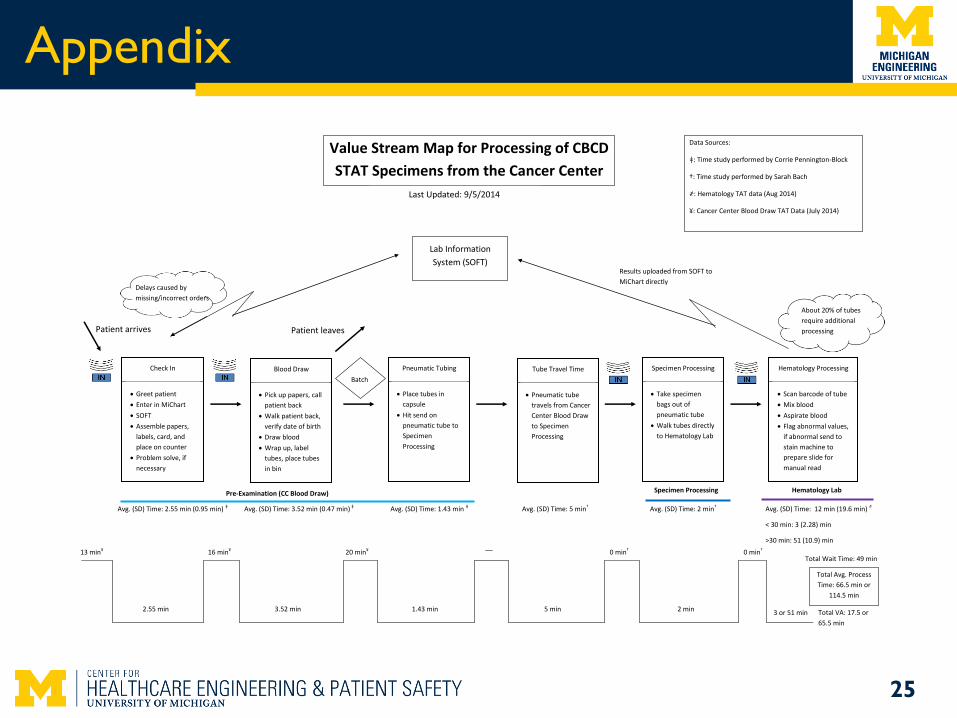
Appendix
25
Delays caused by
missing/incorrect orders
Patient leaves Patient arrives
Check In
Greet patient
Enter in MiChart
SOFT
Assemble papers,
labels, card, and
place on counter
Problem solve, if
necessary
Blood Draw
Pick up papers, call
patient back
Walk patient back,
verify date of birth
Draw blood
Wrap up, label
tubes, place tubes
in bin
Pneumatic Tubing
Place tubes in
capsule
Hit send on
pneumatic tube to
Specimen
Processing
Specimen Processing
Take specimen
bags out of
pneumatic tube
Walk tubes directly
to Hematology Lab
Tube Travel Time
Pneumatic tube
travels from Cancer
Center Blood Draw
to Specimen
Processing
Hematology Processing
Scan barcode of tube
Mix blood
Aspirate blood
Flag abnormal values,
if abnormal send to
stain machine to
prepare slide for
manual read
Value Stream Map for Processing of CBCD
STAT Specimens from the Cancer Center
Lab Information
System (SOFT)
Avg. (SD) Time: 2.55 min (0.95 min) ǂ
Avg. (SD) Time: 3.52 min (0.47 min) ǂ
Avg. (SD) Time: 1.43 min ǂ
Avg. (SD) Time: 5 min†
Avg. (SD) Time: 2 min†
Avg. (SD) Time: 12 min (19.6 min) ҂
< 30 min: 3 (2.28) min
>30 min: 51 (10.9) min
Total Wait Time: 49 min
Total VA: 17.5 or
65.5 min
Batch
20 min¥
Results uploaded from SOFT to
MiChart directly
About 20% of tubes
require additional
processing
Pre-Examination (CC Blood Draw) Specimen Processing Hematology Lab
Last Updated: 9/5/2014
0 min† 0 min† 13 min¥ 16 min¥ __
2.55 min 3.52 min 1.43 min 5 min 2 min 3 or 51 min
Total Avg. Process
Time: 66.5 min or
114.5 min
Data Sources:
ǂ: Time study performed by Corrie Pennington-Block
†: Time study performed by Sarah Bach
҂: Hematology TAT data (Aug 2014)
¥: Cancer Center Blood Draw TAT Data (July 2014)
26
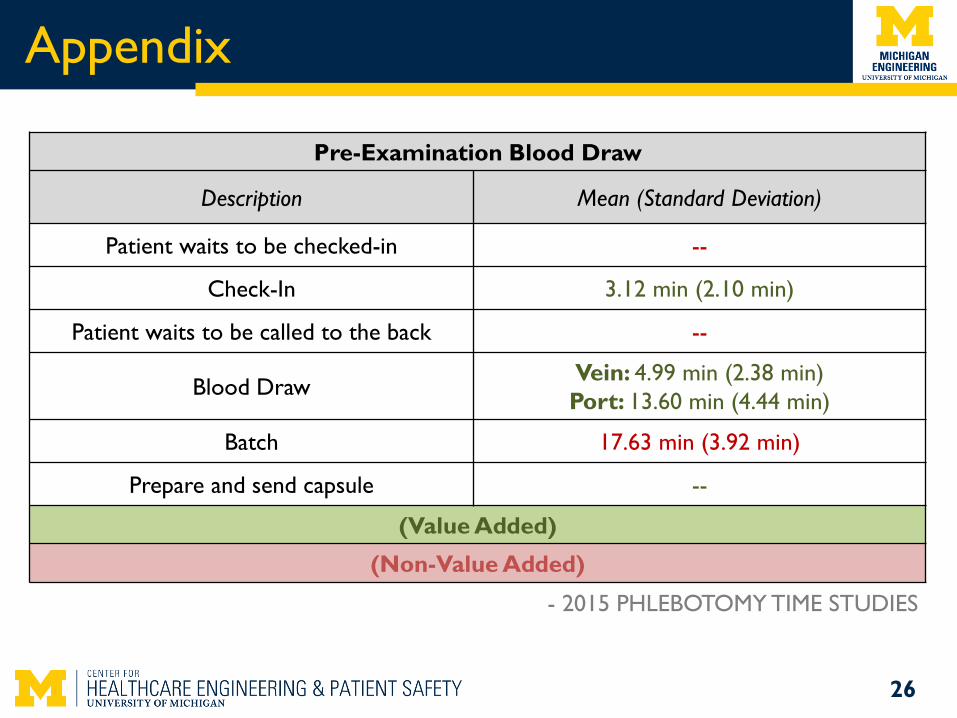
Appendix
Pre-Examination Blood Draw
Description Mean (Standard Deviation)
Patient waits to be checked-in --
Check-In 3.12 min (2.10 min)
Patient waits to be called to the back --
Blood Draw Vein: 4.99 min (2.38 min)
Port: 13.60 min (4.44 min)
Batch 17.63 min (3.92 min)
Prepare and send capsule --
(Value Added)
(Non-Value Added)
- 2015 PHLEBOTOMY TIME STUDIES
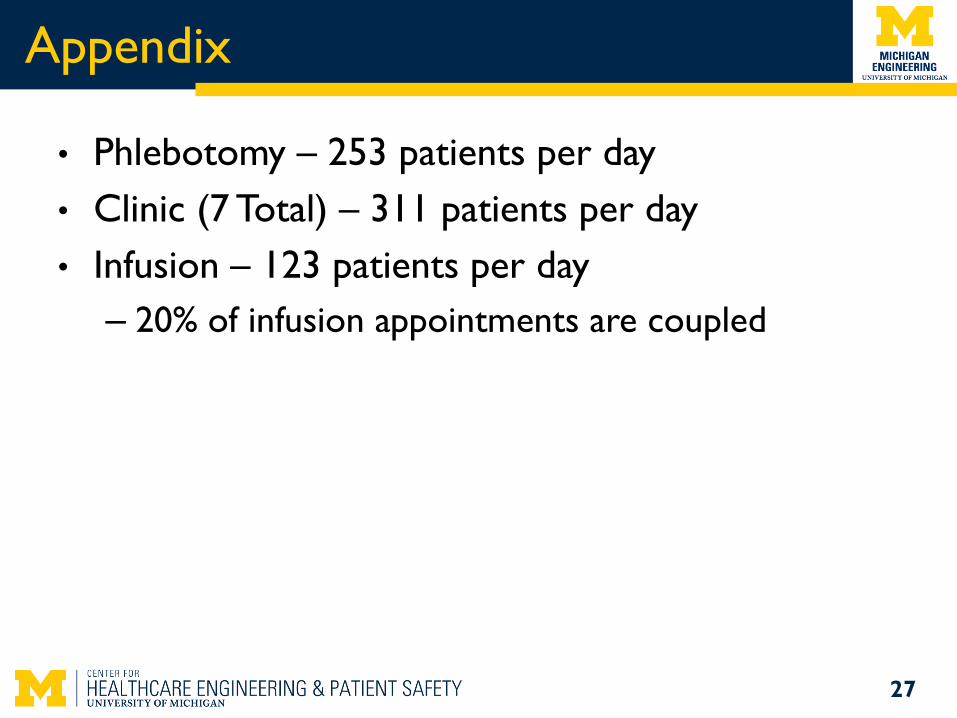
Appendix
• Phlebotomy – 253 patients per day
• Clinic (7 Total) – 311 patients per day
• Infusion – 123 patients per day
– 20% of infusion appointments are coupled
27
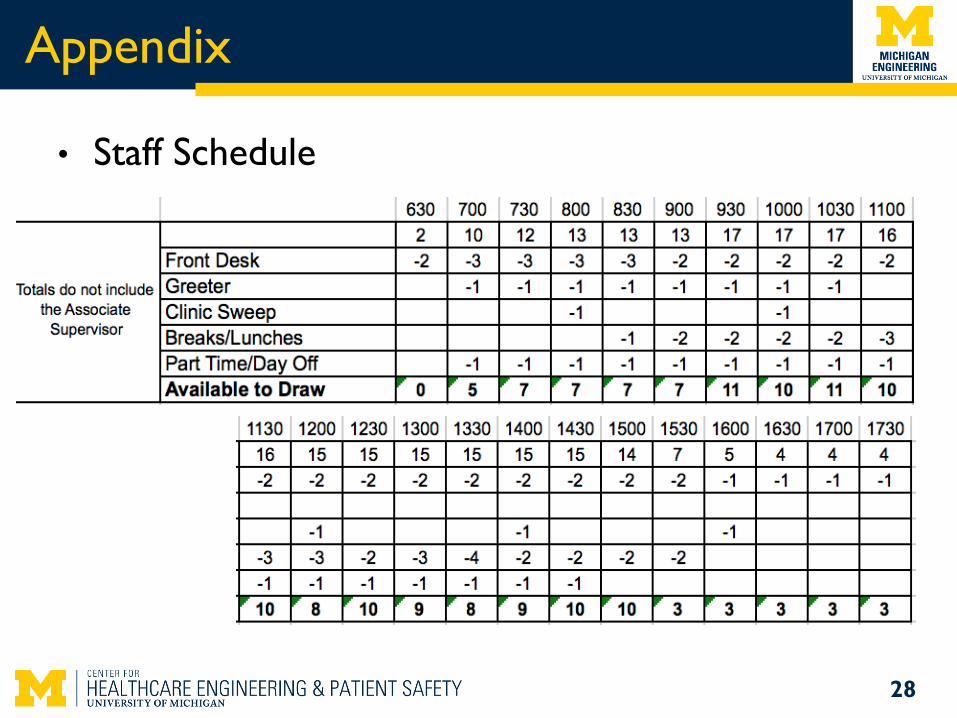
Appendix
28
• Staff Schedule