Embed Size (px)
Citation preview

WP/16/39
Improving Public Infrastructure in the Philippines
by Takuji Komatsuzaki
© 2016 International Monetary Fund WP/16/39
IMF Working Paper
Asia Pacific Department
Improving Public Infrastructure in the Philippines
Prepared by Takuji Komatsuzaki1
Authorized for distribution by Chikahisa Sumi
February 2016
Abstract
This paper explores the macroeconomic effects of improving public infrastructure in the
Philippines. After benchmarking the Philippines relative to its neighbors in terms of level of
public capital and quality of public infrastructure, and public investment efficiency, it uses
model simulations to assess the macroeconomic implications of raising public investment
and improving public investment efficiency. The main results are as follows: (i) increasing
public infrastructure investment results in sustained gains in output; (ii) the effects of
improving public investment efficiency are substantial; and (iii) deficit-financed increases in
public investment lead to higher borrowing costs that constrain output increases over time,
underscoring the importance of revenue mobilization.
JEL Classification Numbers: E22, E62, H54
Keywords: Infrastructure, Public Investment Efficiency, Philippines
Author’s E-Mail Address: [email protected]
1 The author would like to thank the Philippines authorities, Chikahisa Sumi, Ha Vu, Prakash Loungani, Grace
Li, IMF’s Philippines team, and seminar participants at the Central Bank of the Philippines and the International
Monetary Fund for insightful comments.
IMF Working Papers describe research in progress by the author(s) and are published to
elicit comments and to encourage debate. The views expressed in IMF Working Papers are
those of the author(s) and do not necessarily represent the views of the IMF, its Executive Board,
or IMF management.
2
Contents
I. Introduction ........................................................................................................................ 3
II. Literature Review ............................................................................................................... 5
III. The State of Public Infrastructure in the Philippines ......................................................... 5
A. Level of Public Capital ............................................................................................... 5
B. Quality of Infrastructure .............................................................................................. 6
C. Public Investment Efficiency ...................................................................................... 6
IV. GIMF Simulations .............................................................................................................. 9
A. Model and Calibration ................................................................................................ 9
B. Baseline Results ........................................................................................................ 11
C. Sensitivity Analysis................................................................................................... 14
V. Conclusion ........................................................................................................................ 16
References ............................................................................................................................... 21
Figures
1. Philippines: Investment ...................................................................................................... 3
2. ASEAN: Public Investment and Public Capital Stock ....................................................... 6
3. ASEAN: Quality of Public Infrastructure .......................................................................... 7
4. Philippines: Governance Quality—Cross-Country Percentile Ranking ............................ 6
5. PIMA Framework .............................................................................................................. 8
6. Cross-Country Comparison of Public Investment Efficiency ............................................ 9
7. Main Stimulation Results ................................................................................................. 13
8. Sovereign Risk Premium for Different Assumption ........................................................ 14
9. Alternative Borrowing Cost Results ................................................................................ 15
10. Alternative Revenue Mobilization Results ...................................................................... 17
Annex
1. Data Description ............................................................................................................... 19
3
I. INTRODUCTION
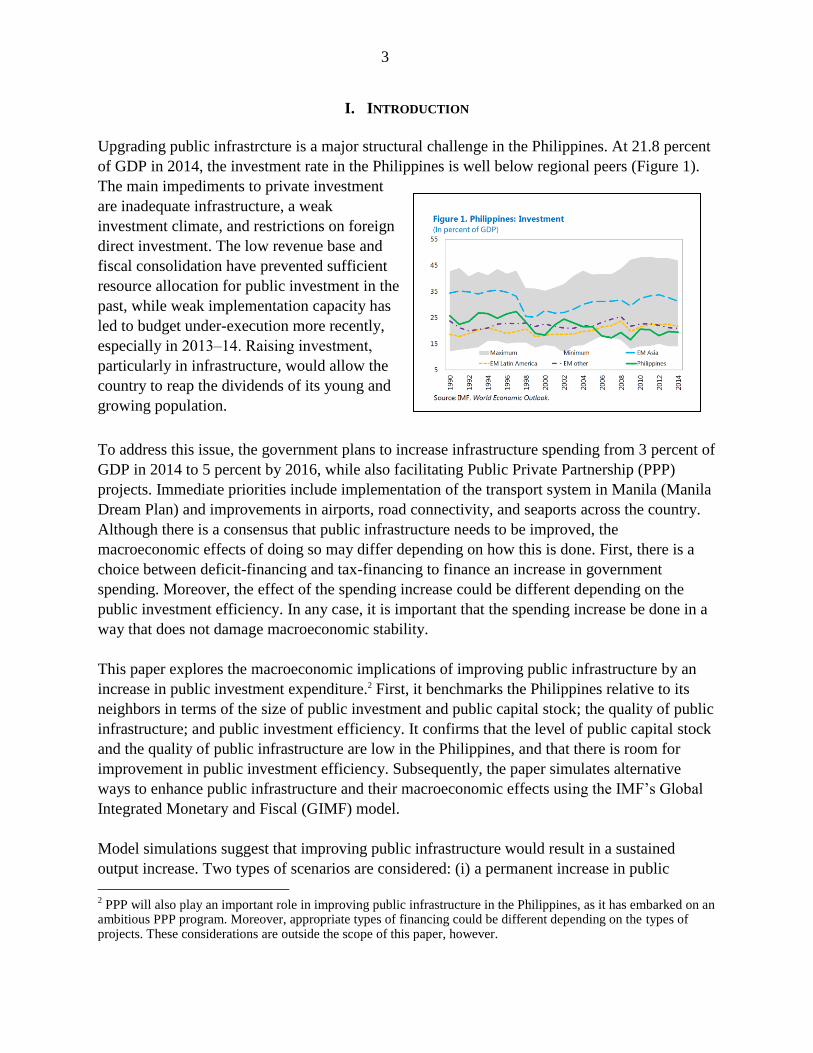
Upgrading public infrastrcture is a major structural challenge in the Philippines. At 21.8 percent
of GDP in 2014, the investment rate in the Philippines is well below regional peers (Figure 1).
The main impediments to private investment
are inadequate infrastructure, a weak
investment climate, and restrictions on foreign
direct investment. The low revenue base and
fiscal consolidation have prevented sufficient
resource allocation for public investment in the
past, while weak implementation capacity has
led to budget under-execution more recently,
especially in 2013‒14. Raising investment,
particularly in infrastructure, would allow the
country to reap the dividends of its young and
growing population.
To address this issue, the government plans to increase infrastructure spending from 3 percent of
GDP in 2014 to 5 percent by 2016, while also facilitating Public Private Partnership (PPP)
projects. Immediate priorities include implementation of the transport system in Manila (Manila
Dream Plan) and improvements in airports, road connectivity, and seaports across the country.
Although there is a consensus that public infrastructure needs to be improved, the
macroeconomic effects of doing so may differ depending on how this is done. First, there is a
choice between deficit-financing and tax-financing to finance an increase in government
spending. Moreover, the effect of the spending increase could be different depending on the
public investment efficiency. In any case, it is important that the spending increase be done in a
way that does not damage macroeconomic stability.
This paper explores the macroeconomic implications of improving public infrastructure by an
increase in public investment expenditure.2 First, it benchmarks the Philippines relative to its
neighbors in terms of the size of public investment and public capital stock; the quality of public
infrastructure; and public investment efficiency. It confirms that the level of public capital stock
and the quality of public infrastructure are low in the Philippines, and that there is room for
improvement in public investment efficiency. Subsequently, the paper simulates alternative
ways to enhance public infrastructure and their macroeconomic effects using the IMF’s Global
Integrated Monetary and Fiscal (GIMF) model.
Model simulations suggest that improving public infrastructure would result in a sustained
output increase. Two types of scenarios are considered: (i) a permanent increase in public
2 PPP will also play an important role in improving public infrastructure in the Philippines, as it has embarked on an
ambitious PPP program. Moreover, appropriate types of financing could be different depending on the types of projects. These considerations are outside the scope of this paper, however.
4
investment by 2 percent of GDP, financed by borrowing, (ii) the same increase in public
investment, financed by higher taxes. Two sub-scenarios are included within each scenario; ones
with and without improvements in public investment efficiency. All scenarios exhibit sustained
gains in output because improving public infrastructure leads to gains in productivity, which
crowds in private investment. Specifically, real GDP is higher than the steady state by
4.5‒6 percent after 15 years even without an improvement in public investment efficiency. The
improvement in public investment efficiency generate substantial additional benefits. Assuming
half of the inefficiency is eliminated in five years, the increase in real GDP after 15 years is
9‒11 percent.
Alternative financing scenarios generate different dynamics in public debt, consumption, and
investment. The deficit-financing scenario results in a substantial increase in the public debt-to-
GDP ratio, while the tax-financing scenario results in its slight decrease. The incraese in the
public debt increases the borrowing cost and constrains investment over time in the deficit-
financing scenario. In contrast, consumption is initially subdued in the tax-financing scenario
because the increase in the consumption tax lowers households’ disposal income. While the
output gains are initially higher in the deficit-financing scenarios, these gains become higher in
the tax-financed scenarios over time, with the increase in the government’s borrowing cost in
the deficit-financed scenarios playing a key role.
Public infrastructure improvement influences the external current account and inflation. It leads
to a worsening current account, thereby facilitating external rebalancing. It also generates
additional domestic demand initially and thus inflationary pressures. Over time, the increase in
supply capacity alleviates the inflationary pressures.
Sensitivity analyses exhibit expected results. In the deficit-financing scenario, the size of the
increase in output, private investment and consumption, inflation, and the decrease in current
account is negatively associated with the size of the premium in the borrowing cost. In the
taxfinancing case, the equal distribution of revenue mobilization to corporate income tax (CIT),
personal income tax (PIT), and consumption tax results in a smaller negative effect on
consumption initially, larger negative effect on investment, and lower output, relative to the
baseline scneario of exclusively consumption tax financing. It should be noted, however, that
rationalization of tax incentives have the potential to mobilize revenue while also mitigating
negative effects on growth.
With a low capital stock and a fast growing young population, addressing the large
infrastructure gap is needed to raise potential growth and reduce poverty and external
imbalances. This paper shows that increasing public investment spending can generate sustained
output growth, and improving public investment efficiency can bring about substantial
additional benefits. It also shows that deficit-financing and tax-financing can have different
dynamics in some macroeconomic variables. Given the need to ensure debt sustainability amid
the large spending needs in other priority spending areas for inclusive growth, continued efforts
mobilize revenue will be critical, including by enacting measures to offset any revenue eroding
5
policy changes and preferably through a comprehensive tax reform that focuses on broadening
the tax base.
II. LITERATURE REVIEW
This study is closest to the studies that investigate the quantitative effects of public investment
increase on economic growth using dynamic general equilibrium models (DGE). While DGE
has been applied to a wide variety of countries to examine the effect of public investment scale-
up (see Elekdag and Muir (2014) for application to Germany, for example), few of them
incorporate public investment efficiency outside of application to low income countries.3 IMF
(2014) takes a first step in modeling the effect of public investment efficiency. This paper
extends it by allowing for dynamic changes in the public investment efficiency and interacting
them with the public investment scale-up.
There is an extensive empirical literature on the effect of public investment and public
infrastructure on economic growth, but results are not conclusive. There are several issues,
including data availability on infrastructure, measurement of infrastructure spending and its
efficiency, and potential reverse causation in which higher economic growth generates an
increase in public capital spending. Straub (2008), Romp and de Haan (2005), and Pereira and
Andraz (2013) provide comprehensive reviews. IMF (2014) and IMF (2015a) are among the
attempts to control for public investment efficiency. They estimate stronger growth effects of
public investment for the high public investment efficiency regime, consistent with the
specification in our model.
Weak public infrastructure and low public investment in the Philippines have been well-
documented in the literature. Historical accounts include Montes (1986), Dohner and Intal
(1989), Rodlauer and others (2000), Bocchi (2008), and Warner (2014). The literature
consistently document low investment rates for the Philippines and consider this a major
challenge. It also documented governance and public investment management problems.
III. THE STATE OF PUBLIC INFRASTRUCTURE IN THE PHILIPPINES
A. Level of Public Capital
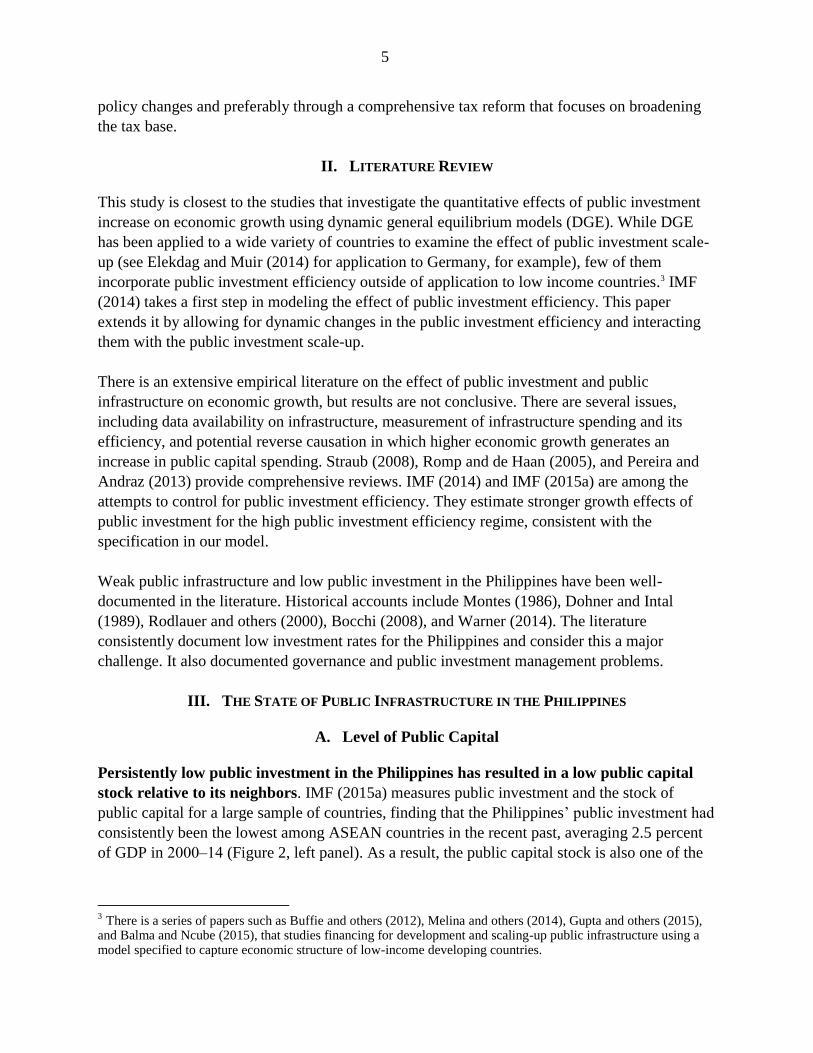
Persistently low public investment in the Philippines has resulted in a low public capital
stock relative to its neighbors. IMF (2015a) measures public investment and the stock of
public capital for a large sample of countries, finding that the Philippines’ public investment had
consistently been the lowest among ASEAN countries in the recent past, averaging 2.5 percent
of GDP in 2000‒14 (Figure 2, left panel). As a result, the public capital stock is also one of the
3 There is a series of papers such as Buffie and others (2012), Melina and others (2014), Gupta and others (2015), and Balma and Ncube (2015), that studies financing for development and scaling-up public infrastructure using a model specified to capture economic structure of low-income developing countries.
6
lowest among ASEAN countries, at around 35 percent of GDP in 2013 compared to the ASEAN
average of 72 percent of GDP (Figure 2, right panel).
Figure 2. ASEAN: Public Investment and Public Capital Stock
Source: IMF (2015a); and IMF staff estimates.
B. Quality of Infrastructure
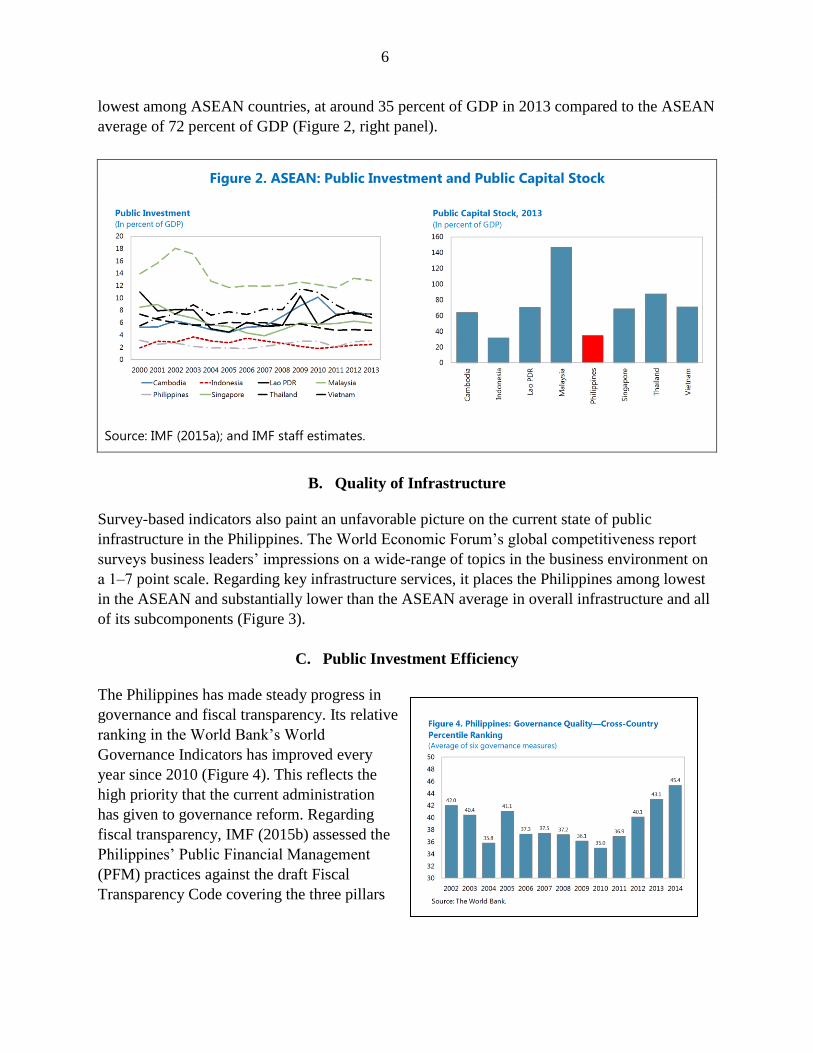
Survey-based indicators also paint an unfavorable picture on the current state of public
infrastructure in the Philippines. The World Economic Forum’s global competitiveness report
surveys business leaders’ impressions on a wide-range of topics in the business environment on
a 1‒7 point scale. Regarding key infrastructure services, it places the Philippines among lowest
in the ASEAN and substantially lower than the ASEAN average in overall infrastructure and all
of its subcomponents (Figure 3).
C. Public Investment Efficiency
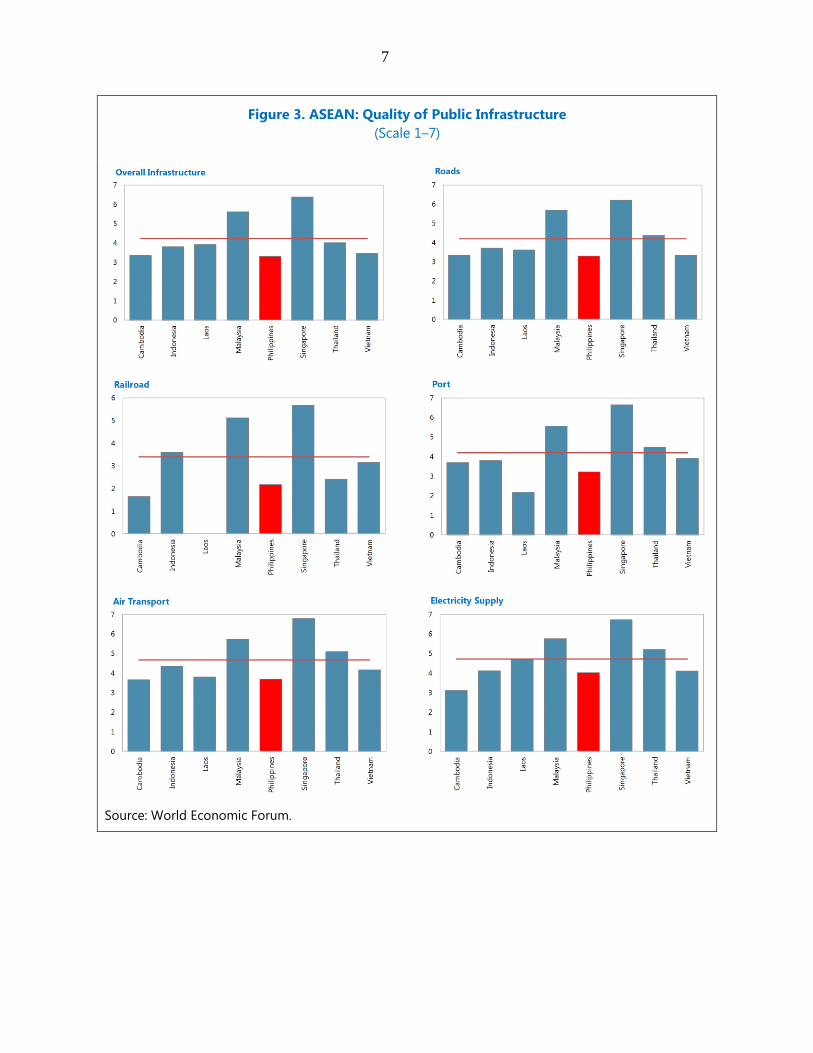
The Philippines has made steady progress in
governance and fiscal transparency. Its relative
ranking in the World Bank’s World
Governance Indicators has improved every
year since 2010 (Figure 4). This reflects the
high priority that the current administration
has given to governance reform. Regarding
fiscal transparency, IMF (2015b) assessed the
Philippines’ Public Financial Management
(PFM) practices against the draft Fiscal
Transparency Code covering the three pillars
7
Figure 3. ASEAN: Quality of Public Infrastructure
(Scale 1–7)
Source: World Economic Forum.
8
of fiscal reporting, fiscal forecasting, and fiscal analysis and management. It acknowledged the
authorities’ reform efforts and reached broadly favorable conclusions. These developments
indicate that there is a smaller risk of inefficient public investment due to governance issues.
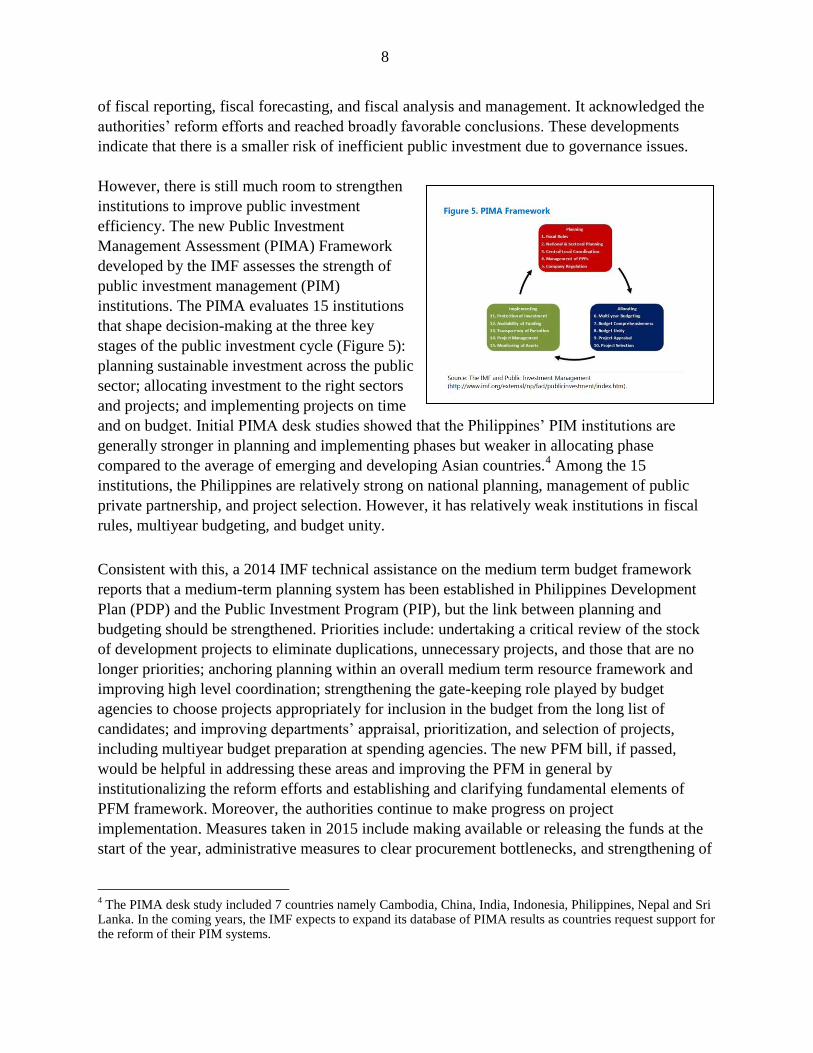
However, there is still much room to strengthen
institutions to improve public investment
efficiency. The new Public Investment
Management Assessment (PIMA) Framework
developed by the IMF assesses the strength of
public investment management (PIM)
institutions. The PIMA evaluates 15 institutions
that shape decision-making at the three key
stages of the public investment cycle (Figure 5):
planning sustainable investment across the public
sector; allocating investment to the right sectors
and projects; and implementing projects on time
and on budget. Initial PIMA desk studies showed that the Philippines’ PIM institutions are
generally stronger in planning and implementing phases but weaker in allocating phase
compared to the average of emerging and developing Asian countries.4 Among the 15
institutions, the Philippines are relatively strong on national planning, management of public
private partnership, and project selection. However, it has relatively weak institutions in fiscal
rules, multiyear budgeting, and budget unity.
Consistent with this, a 2014 IMF technical assistance on the medium term budget framework
reports that a medium-term planning system has been established in Philippines Development
Plan (PDP) and the Public Investment Program (PIP), but the link between planning and
budgeting should be strengthened. Priorities include: undertaking a critical review of the stock
of development projects to eliminate duplications, unnecessary projects, and those that are no
longer priorities; anchoring planning within an overall medium term resource framework and
improving high level coordination; strengthening the gate-keeping role played by budget
agencies to choose projects appropriately for inclusion in the budget from the long list of
candidates; and improving departments’ appraisal, prioritization, and selection of projects,
including multiyear budget preparation at spending agencies. The new PFM bill, if passed,
would be helpful in addressing these areas and improving the PFM in general by
institutionalizing the reform efforts and establishing and clarifying fundamental elements of
PFM framework. Moreover, the authorities continue to make progress on project
implementation. Measures taken in 2015 include making available or releasing the funds at the
start of the year, administrative measures to clear procurement bottlenecks, and strengthening of
4 The PIMA desk study included 7 countries namely Cambodia, China, India, Indonesia, Philippines, Nepal and Sri
Lanka. In the coming years, the IMF expects to expand its database of PIMA results as countries request support for the reform of their PIM systems.
9
procurement units at government agencies. These measures appear to have led to an
improvement in government disbursements for infrastructure spending.
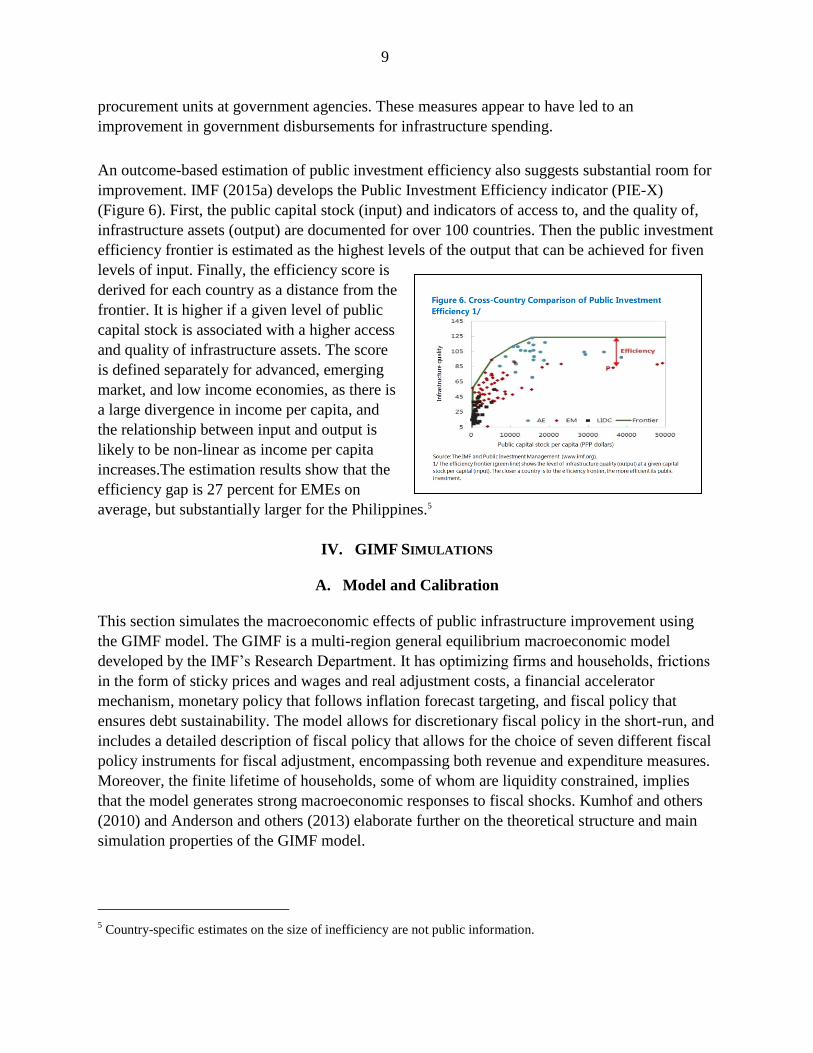
An outcome-based estimation of public investment efficiency also suggests substantial room for
improvement. IMF (2015a) develops the Public Investment Efficiency indicator (PIEX)
(Figure 6). First, the public capital stock (input) and indicators of access to, and the quality of,
infrastructure assets (output) are documented for over 100 countries. Then the public investment
efficiency frontier is estimated as the highest levels of the output that can be achieved for fiven
levels of input. Finally, the efficiency score is
derived for each country as a distance from the
frontier. It is higher if a given level of public
capital stock is associated with a higher access
and quality of infrastructure assets. The score
is defined separately for advanced, emerging
market, and low income economies, as there is
a large divergence in income per capita, and
the relationship between input and output is
likely to be non-linear as income per capita
increases.The estimation results show that the
efficiency gap is 27 percent for EMEs on
average, but substantially larger for the Philippines.5
IV. GIMF SIMULATIONS
A. Model and Calibration
This section simulates the macroeconomic effects of public infrastructure improvement using
the GIMF model. The GIMF is a multi-region general equilibrium macroeconomic model
developed by the IMF’s Research Department. It has optimizing firms and households, frictions
in the form of sticky prices and wages and real adjustment costs, a financial accelerator
mechanism, monetary policy that follows inflation forecast targeting, and fiscal policy that
ensures debt sustainability. The model allows for discretionary fiscal policy in the short-run, and
includes a detailed description of fiscal policy that allows for the choice of seven different fiscal
policy instruments for fiscal adjustment, encompassing both revenue and expenditure measures.
Moreover, the finite lifetime of households, some of whom are liquidity constrained, implies
that the model generates strong macroeconomic responses to fiscal shocks. Kumhof and others
(2010) and Anderson and others (2013) elaborate further on the theoretical structure and main
simulation properties of the GIMF model.
5 Country-specific estimates on the size of inefficiency are not public information.
10
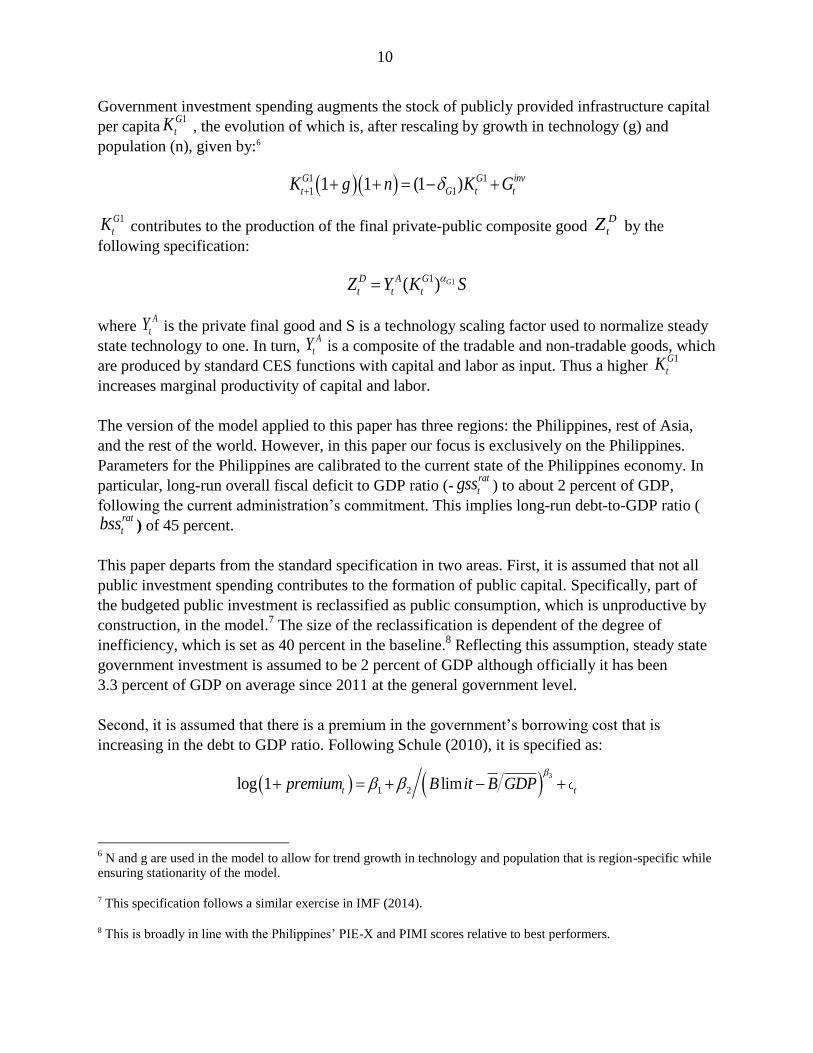
Government investment spending augments the stock of publicly provided infrastructure capital
per capita1G
tK , the evolution of which is, after rescaling by growth in technology (g) and
population (n), given by:6
1 1
1 1(1 1 1 )G G inv
t G t tK g Kn G
1G
tK contributes to the production of the final private-public composite good D
tZ by the
following specification:
11( ) GD A G
t t tY K SZ
where A
tY is the private final good and S is a technology scaling factor used to normalize steady
state technology to one. In turn, A
tY is a composite of the tradable and non-tradable goods, which
are produced by standard CES functions with capital and labor as input. Thus a higher 1G
tK
increases marginal productivity of capital and labor.
The version of the model applied to this paper has three regions: the Philippines, rest of Asia,
and the rest of the world. However, in this paper our focus is exclusively on the Philippines.
Parameters for the Philippines are calibrated to the current state of the Philippines economy. In
particular, long-run overall fiscal deficit to GDP ratio (-rat
tgss ) to about 2 percent of GDP,
following the current administration’s commitment. This implies long-run debt-to-GDP ratio (rat
tbss ) of 45 percent.
This paper departs from the standard specification in two areas. First, it is assumed that not all
public investment spending contributes to the formation of public capital. Specifically, part of
the budgeted public investment is reclassified as public consumption, which is unproductive by
construction, in the model.7 The size of the reclassification is dependent of the degree of
inefficiency, which is set as 40 percent in the baseline.8 Reflecting this assumption, steady state
government investment is assumed to be 2 percent of GDP although officially it has been
3.3 percent of GDP on average since 2011 at the general government level.
Second, it is assumed that there is a premium in the government’s borrowing cost that is
increasing in the debt to GDP ratio. Following Schule (2010), it is specified as:
3
1 2log 1 limt tpremium B it B GDP
6 N and g are used in the model to allow for trend growth in technology and population that is region-specific while
ensuring stationarity of the model.
7 This specification follows a similar exercise in IMF (2014).
8 This is broadly in line with the Philippines’ PIE-X and PIMI scores relative to best performers.
11
See annex for detailed properties of this specification. It is assumed that the premium increase
by 3 basis points per increase in the debt-to-GDP ratio in the baseline, but we will also perform
sensitivity analyses given the uncertainty on this calibration. The changes in the borrowing cost
by the government are translated to the borrowing cost of the private sector in the GIMF model.
Two scenarios are considered: (i) a permanent increase in public investment by 2 percent of
GDP, financed by borrowing; and (ii) the same increase in public investment, financed by
higher consumption taxes. (i) implies a 2 percent of GDP increase in overall fiscal deficit.9
In (ii), consumption tax increases are chosen over labor and capital taxes in the baseline, in line
with the Fund’s recommendations.10 Expenditure reallocation is not considered as a tool to
finance public investment given the small size of total government expenditure in the
Philippines and the existence of other spending priorities that makes it difficult to reallocate
expenditure at a large scale.
Two sub-scenarios of public investment efficiency are included within each scenario. While the
public investment inefficiency remains 40 percent in the status-quo case, half of the inefficiency
is eliminated gradually over five years in the efficiency-improvement case.
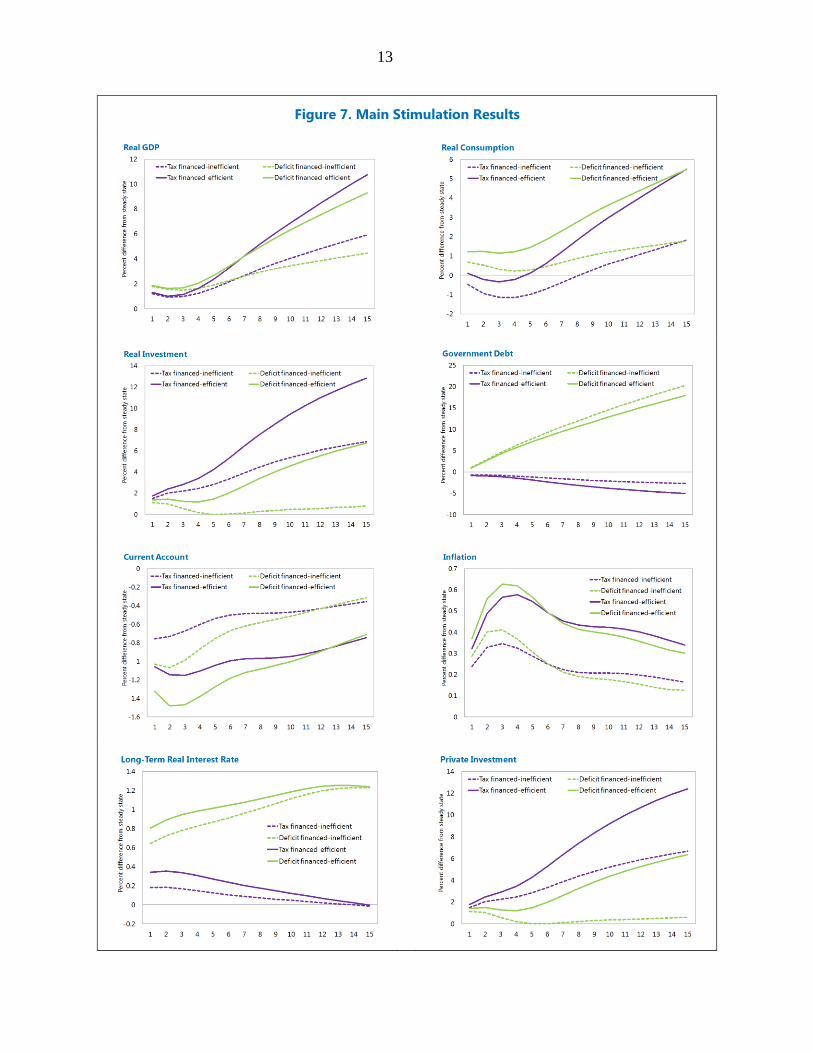
B. Baseline Results
Both the deficit-financed and tax-financed public investment increases lead to sustained gains in
real GDP (Figure 7). Public investment increases have sustained output effects beyond the direct
demand effect of the spending increase because of the productivity-enhancing impact of public
infrastructure. As public capital is an input to the aggregate production function of the economy,
the improved public infrastructure raises the overall productivity, akin to an increase in total
factor productivity from the perspective of the private sector. The resulting increase in marginal
productivity of capital and labor crowd in the private investment and increase demand for labor,
which induce a higher consumption due to higher household income. Even without an
improvement in public investment efficiency, the increase in public investment results in a
4.5‒6 percent cumulative increase in real GDP relative to the steady state after 15 years.
While the output gains are initially higher in the deficit-financed scenarios, these gains become
larger in the tax-financed scenarios over time, with the increase in the government’s borrowing
cost in the deficit-financed scenarios playing a key role. The tax-financed scenario results in
smaller output gains in the in the short-to-medium term because the tax increase reduces
consumption, partially offsetting the demand increase from higher public investment. Over time,
9 In order to ensure that all scenarios go back to the same level of debt-to-GDP ratio in the long-run, the deficit-
financed public investment scale up is limited to the first 25 years in (i). Our comparison focuses on the periods in which the public investment scale up is financed by the deficit in (i).
10 IMF (2015c) states, “The authorities are urged to ensure net revenue enhancement in their tax reform package by
rationalizing tax incentives, streamlining VAT exemptions, and raising fuel excises, to offset the losses from the proposed reductions in corporate and personal income taxes.”
12
however, the continuous increase in the debt-to-GDP ratio in the deficit-financed scenario
increases domestic interest rates, with negative effects on private investment and consumption,
and leading to decelerating output growth.
The increasing influence of the government’s borrowing cost over time can be seen by
comparing the paths of long-term real interest rates, the interest rate most relevant for
investment decisions of the private sector. In the GIMF model, an increase in the government’s
borrowing cost due to an increase in the risk premium leads to a parallel increase in all domestic
interest rates. Additionally, domestic interest rates are also affected by monetary policy. The
long-term real interest rates reflect both of these factors, and increase on impact for both deficit-
financed and tax-financed scenarios. However, the increase is larger for the former partly due to
the stronger demand effect but also in anticipation of the future increase in the risk premium.
The paths further diverge from each other over time, driven by the increasing risk premium in
the deficit-financed scenario.
Improving public investment efficiency generates a significant additional impact. Raising public
investment efficiency to about 80 percent efficiency increases output by 5 percent after 15 years
compared with the unchanged efficiency scenarios, for both tax-financed and deficit-financed
scenarios. The difference in public infrastructure contribution is sizable because of the large
efficiency gap. For example, given the 40 percent assumed inefficiency, the 5 percent of GDP
public investment results in only about 3 percent of GDP contribution to public infrastructure.
When public investment efficiency is improved to the 20 percent inefficiency, the same
5 percent of GDP public investment results in over 4 percent of GDP contribution to public
infrastructure and a cumulative increase in GDP of 9‒11 percent after 15 years. This
improvement in efficiency generates balanced effects, increasing consumption and investment
and decreasing the debt-to-GDP ratio relative to the scenarios without improvements in public
investment efficiency.
Additional demand from higher public infrastructure gives rise to inflationary pressures and a
positive output gap, inducing an increase in the policy interest rate. Different degrees of
inflation can be explained by the different sizes of private investment crowding in and the
resulting consumption increase. Over time, the increase in supply capacity alleviates the
inflationary pressures and the policy rate increase is gradually reversed in all scenarios.
The current account exhibits a sustained deterioration, mostly because of higher imports.
Exports also decline initially due to the initial real appreciation associated with the policy
interest rate increase. Subsequently, exports increase as investment stimulates production and
the initial real appreciation is reversed in line with the reversal of initial monetary tightening,
which partially offsets the reduction of the current account. The size of the current account
deficit increase is roughly proportional to the output increase and reaches 0.7–1.5 percent of
GDP after two years.
13
Figure 7. Main Stimulation Results
14
C. Sensitivity Analysis
This subsection considers two types of sensitivity analysis: changes in the assumption on the
borrowing cost premium in the deficit-financed scenarios; and changes in the tax mix in the tax-
financed scenarios.11
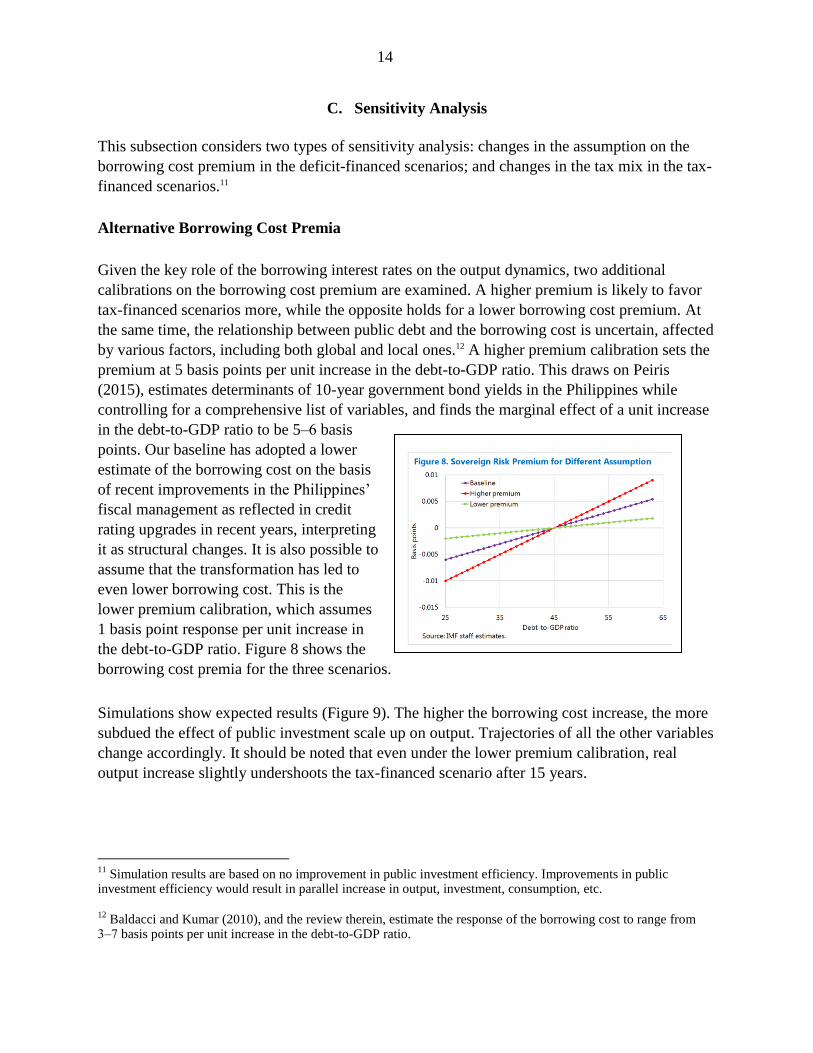
Alternative Borrowing Cost Premia
Given the key role of the borrowing interest rates on the output dynamics, two additional
calibrations on the borrowing cost premium are examined. A higher premium is likely to favor
tax-financed scenarios more, while the opposite holds for a lower borrowing cost premium. At
the same time, the relationship between public debt and the borrowing cost is uncertain, affected
by various factors, including both global and local ones.12 A higher premium calibration sets the
premium at 5 basis points per unit increase in the debt-to-GDP ratio. This draws on Peiris
(2015), estimates determinants of 10-year government bond yields in the Philippines while
controlling for a comprehensive list of variables, and finds the marginal effect of a unit increase
in the debt-to-GDP ratio to be 5‒6 basis
points. Our baseline has adopted a lower
estimate of the borrowing cost on the basis
of recent improvements in the Philippines’
fiscal management as reflected in credit
rating upgrades in recent years, interpreting
it as structural changes. It is also possible to
assume that the transformation has led to
even lower borrowing cost. This is the
lower premium calibration, which assumes
1 basis point response per unit increase in
the debt-to-GDP ratio. Figure 8 shows the
borrowing cost premia for the three scenarios.
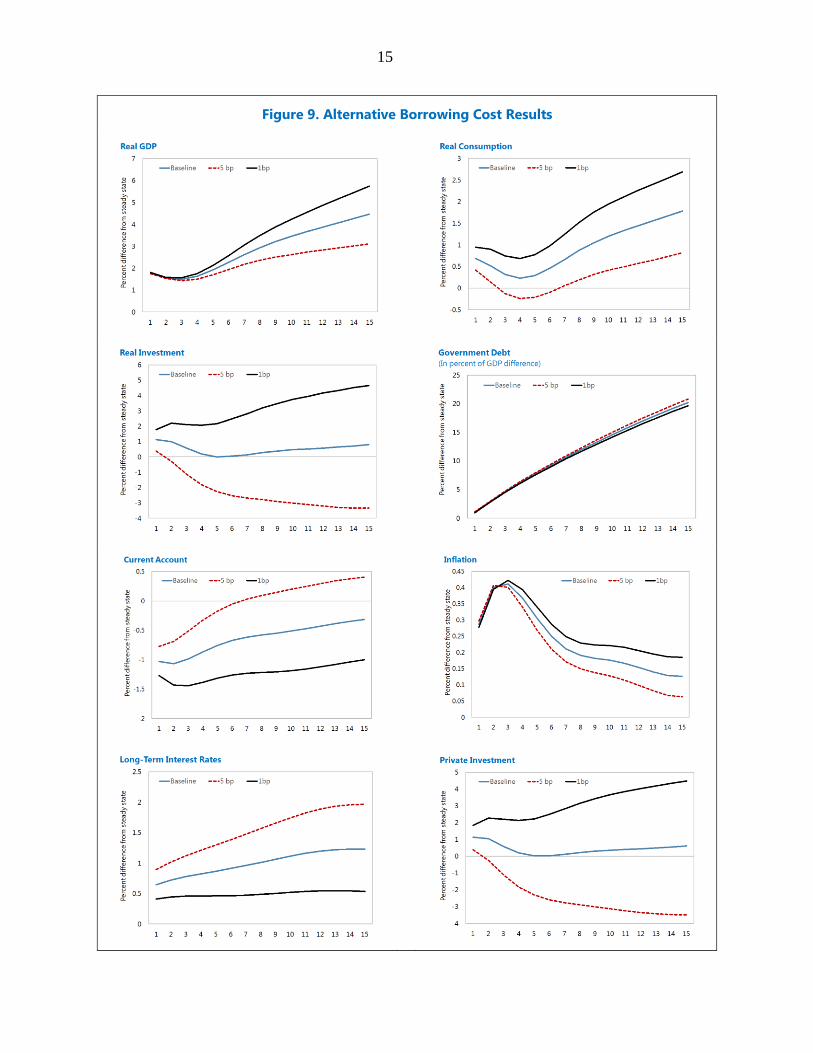
Simulations show expected results (Figure 9). The higher the borrowing cost increase, the more
subdued the effect of public investment scale up on output. Trajectories of all the other variables
change accordingly. It should be noted that even under the lower premium calibration, real
output increase slightly undershoots the tax-financed scenario after 15 years.
11
Simulation results are based on no improvement in public investment efficiency. Improvements in public investment efficiency would result in parallel increase in output, investment, consumption, etc.
12 Baldacci and Kumar (2010), and the review therein, estimate the response of the borrowing cost to range from
3‒7 basis points per unit increase in the debt-to-GDP ratio.
15
Figure 9. Alternative Borrowing Cost Results

16
Alternative Tax Incidence
Revenue mobilization to finance public investment may require the use of multiple sources.
Reliance solely on the consumption tax, assumed in the baseline scenario, implies an increase in
the tax rate of around 3 percent. This may not be politically feasible. In order to capture this
possibility, we assume that the revenue mobilization is equally distributed to CIT, PIT, and
consumption tax in the alternative scenario.
Results show that there is less negative effect on consumption initially and more negative effect
on investment (Figure 10). Output growth is lower in this alternative scenario than the baseline.
The superiority of indirect taxes on growth is a general feature of the GIMF model (Anderson
and others (2013)), and consistent with Lucas (1990) and Chari and others (1994), which
demonstrate the distortionary effect of capital and labor taxation on investment and labor
supply. It has also been established empirically on average, as documented in Johansson and
others (2008) and Acosta-Ormaechea and Yoo (2012).
Rationalization of tax incentives have the potential to mobilize revenue while mitigating
negative effects on growth. It has been shown that tax incentives in the Philippines are not well-
targeted (Botman and others (2008)). Their rationalization could raise revenue without raising
statutory rates, thus mitigating the negative effects on private investment. Tax exemptions are
outside of the model in this paper, however.
V. CONCLUSION
This paper studied the macroeconomic implications of public investment scale up in the
Philippines. After benchmarking the Philippines relative to its neighbors in terms of level of
public capital and quality of public infrastructure, and public investment efficiency, it uses
model simulations to assess the macroeconomic implications of raising public investment and
improving public investment efficiency. It found the following results.
Philippines’ public infrastructure is below that in the neighboring countries. Persistently low
public investment in the Philippines has resulted in a low public capital stock relative to its
neighbors. Survey-based indicators also paint an unfavorable picture on the current state of
public infrastructure in the Philippines.
Public investment efficiency has room for improvement. The Philippines has made steady
progress in governance and fiscal transparency. However, there is still much room to strengthen
institutions to improve public investment efficiency. Both institution-based assessment and an
outcome-based estimation of public investment efficiency suggest substantial room for
improvement.

17
Figure 10. Alternative Revenue Mobilization Results

18
Public investment scale-up results in a sustained growth. Even without an improvement in
public investment efficiency, the increase in public investment results in a 4.5‒6 percent
cumulative increase in real GDP relative to the steady state after 15 years. Improving public
investment efficiency has substantial additional benefits. Eliminating half of the inefficiency
would lead to real GDP higher by 5‒6 percentage points.
With a low capital stock and a fast growing young population, addressing the large
infrastructure gap is needed to raise potential growth and reduce poverty and external
imbalances. This paper shows that increasing public investment spending can generate sustained
output growth, and improving public investment efficiency can bring about substantial
additional benefits. It also shows that deficit-financing and tax-financing can have different
dynamics in some macroeconomic variables. Given the need to ensure debt sustainability amid
the large spending needs in other priority spending areas for inclusive growth, continued efforts
mobilize revenue will be critical, including by enacting measures to offset any revenue eroding
policy changes and preferably through a comprehensive tax reform that focuses on broadening
the tax base.
19
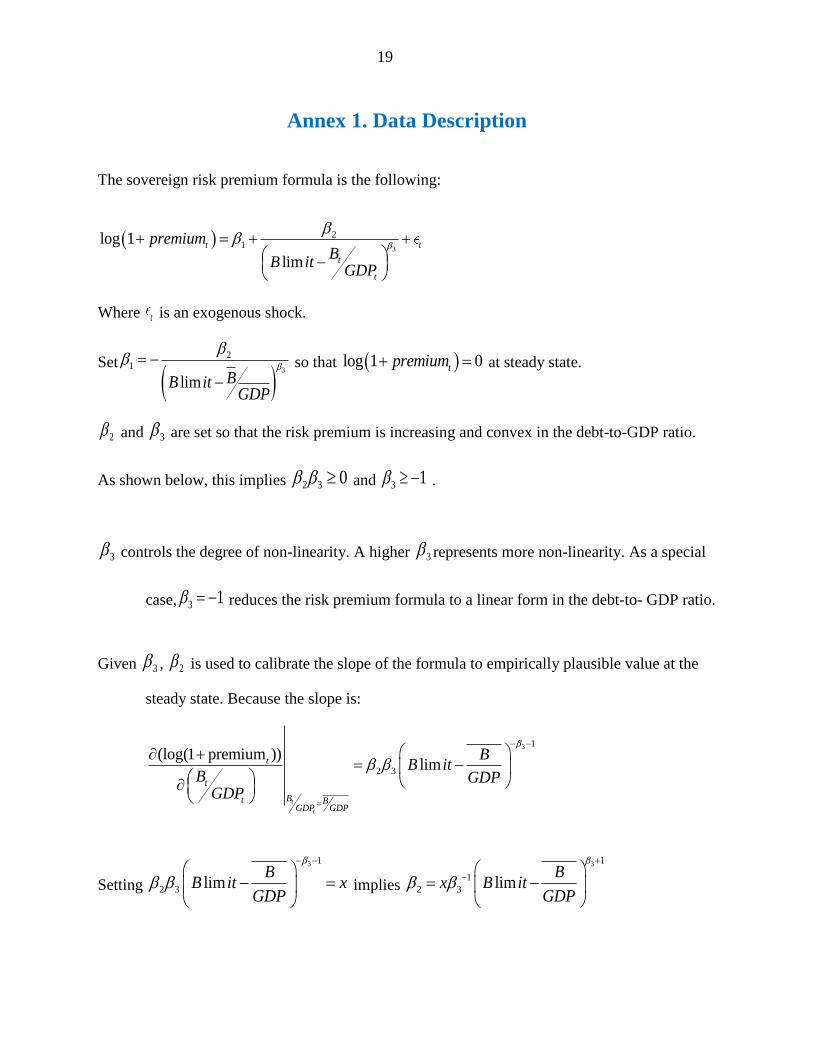
Annex 1. Data Description
The sovereign risk premium formula is the following:
3
21log 1
lim t
t t
t
premiumB
B itGDP
Where t is an exogenous shock.
Set
3
21
lim BB itGDP
so that log 1 0tpremium at steady state.
2 and 3 are set so that the risk premium is increasing and convex in the debt-to-GDP ratio.
As shown below, this implies 2 3 0 and 3 1 .
3 controls the degree of non-linearity. A higher 3 represents more non-linearity. As a special
case, 3 1 reduces the risk premium formula to a linear form in the debt-to- GDP ratio.
Given 3 , 2 is used to calibrate the slope of the formula to empirically plausible value at the
steady state. Because the slope is:
3 1
2 3
log(1 premiu( )li
)m
m
t
t
B BGD
t
t
tP GDP
BB it
B GDPGDP
Setting
3
2
1
3 limB
B it xGDP
implies
3
1
2 3
1
limB
x B itGDP

20
Proposition
Assuming that the debt-to-GDP ratio is always below the debt limit, the risk premium is
increasing and convex in the debt-to-GDP ratio if and only if 2 3 0 and 3 1 .
Proof:
3
2 3
1
log(1 premium )( )lim 0t t
t t
t
BB it
B GDPGDP
if and only if 2 3 0
32
2 3
2
32
log(1 premium( )1 li
)m 0t t
t t
t
BB it
B GDPGDP
if and only if 3 1 0
If t
t
B
GDPincreases from the steady state, risk premium increases faster. On the other hand,
if t
t
B
GDPdecreases from the steady state, risk premium decreases slower.
Blimit should be set slightly higher than the historical maxium debt-to-GDP ratio.
21
References
Acosta-Ormaechea, Santiago and Jiae Yoo 2012, “Tax Composition and Growth: A Broad
Cross-Country Perspective”, IMF Working Paper No. 12/257 (Washington: International
Monetary Fund).
Anderson, Derek, Benjamin Hunt, Mika Kortelainen, Michael Kumhof, Douglas Laxton, Dirk
Muir, Susanna Mursula, and Stephen Snudden, 2013, “Getting to Know GIMF: The
Simulation Properties of the Global Integrated Monetary and Fiscal Model”, IMF
Working Paper No. 13/55 (Washington: International Monetary Fund).
Baldacci, Emanuele, and Manmohan S. Kumar, 2010, “Fiscal Deficits, Public Debt, and
Sovereign Yields”, IMF Working Paper No. 10/184 (Washington: International
Monetary Fund).
Balma, Lacina and Mthuli Ncube, 2015, “Macroeconomic Challenges of Structural
Transformation: Public Investment, Growth and Debt Sustainability in Sierra Leone”,
IMF Working Paper No. 15/164 (Washington: International Monetary Fund).
Bocchi, Alessandro Magnoli, 2008, “Rising Growth, Declining Investment: The Puzzle of the
Philippines”, World Bank Policy Research Working Paper 4472
Botman, Dennis, Alexander Klemm, and Reza Baqir, 2008, “Investment Incentives and
Effective Tax Rates in the Philippines: A Comparison with Neighboring Countries”,
IMF Working Paper No. 08/207 (Washington: International Monetary Fund).
Buffie, Edward F., Berg, A., Pattillo, C.A., Portillo, R., and L.F. Zanna, 2012, “Public
Investment, Growth, and Debt Sustainability: Putting Together the Pieces,” IMF
Working Paper No. 12/144 (Washington: International Monetary Fund).
Chari, V.V., Lawrence J. Christiano, and Patrick J. Kehoe, 1994, “Optimal Fiscal Policy in a
Business Cycle Model”, Journal of Political Economy 102 (4): 617-52
Dohner and Intal 1989, “The Marcos Legacy: Economic Policy and Foreign Debt in the
Philippines”, in Developing Country Debt and Economic Performance, Volume 3:
Country Studies- Indonesia, Korea, Philippines, Turkey, National Bureau of Economic
Research
Elekdag, Selim and Dirk Muir, 2014 “Das Public Kapital: How Much Would Higher Germany
Public Investment Help Germany and the Euro Area?”, IMF Working Paper No. 14/227
(Washington: International Monetary Fund).

22
Gupta, Pranav., Li, G.B., and Yu, J., 2015, “From Natural Resource Boom to Sustainable
Economic Growth: Lessons for Mongolia” IMF Working Paper No. 15/90 (Washington:
International Monetary Fund).
International Monetary Fund, 2014, World Economic Outlook, October 2014, World Economic
and Financial Survey, Chapter 3 (Washington).
International Monetary Fund, 2015a, “Making Public Investment More Efficient,” IMF Policy
Paper. Available via the Internet:
http://www.imf.org/external/np/pp/eng/2015/061115.pdf.
International Monetary Fund, 2015b, Philippines—Fiscal Transparency Evaluation, IMF
Country Report No. 15/156 (Washington).
International Monetary Fund, 2015c, Philippines—2015 Article IV Consultation, IMF Country
Report No. 15/246 (Washington).
Johansson, Asa, Christopher Heady, Jens Arnold, Ber Brys and Laura Vartia , 2008, “Tax and
economic growth”, mimeo.
Kumhof, Michael, Douglas Laxton, Dirk Muir, and Susanna Mursula, 2010, “The Global
Integrated Monetary and Fiscal Model (GIMF)—Theoretical Structure,” IMF Working
Paper No. 10/34 (Washington: International Monetary Fund).
Lucas, Robert E. 1990, “Supply-side economics: an analytical review”, Oxford Economic
Papers, vo.42, 293-316
Melina, Giovanni, Yang, S., and L.F. Zanna., 2014, “Debt Sustainability, Public Investment, an
Natural Resources in Developing Countries: the DIGNAR Model” IMF Working Paper
No. 14/50 (Washington: International Monetary Fund).
Montes, Manuel, 1986, “Financing Development: The Political Economy of Fiscal Policy in the
Philippines,” Philippines Institute for Development Studies
Peiris, Jaynath Shanaka, 2015, “Global Financial Cycles, Volatility and the Philippines”, IMF
Country Report No. 15/247, Chapter 1 (Washington: International Monetary Fund)
Pereira, Alfredo Marva᷉o, Jorge M. Andraz, 2013, “On the economic effects of public
infrastructure investment: A survey of the international evidence”, mimeo.

23
Rodlauer, Markus, Prakash Loungani, Vivek Arora, Charalambos Christofides, Enrique G. de la
Piedra, Piyabha Kongsamut, Kristina Kostial, Victoria Summers, and Athanasios
Vamvakidis, 2000, “Philippines: Toward Sustainable and Rapid Growth Recent
Developments and the Agenda Ahead”, Occasional Paper 187 (Washington:
International Monetary Fund)
Romp, Ward, and Jakob de Haan, 2005, “Public capital and economic growth: a critical survey”,
EIB papers Vol. 10 No. 1
Straub, Stéphane, “Infrastructure and Growth in Developing Countries”, World Bank Research
Working Paper 4460
Warner, Andrew, 2014, “Public Investment as an Engine of Growth”, IMF Working Paper
No. 14/148 (Washington: International Monetary Fund)
Schule, Werner, 2010, “The Potential Contribution of Fiscal Policy to Rebalancing and Growth
in New Zealand”, IMF Working Paper No.10/28 (Washington: International Monetary
Fund)