Embed Size (px)
Citation preview
IMPROVING STUDENTS’ ABILITY
IN WRITING PROCEDURE TEXT BY USING PICTURE
(An Experimental Research at The 9th
Grade of MTs Nahdlatusy
Syubban Sayung Demak in the Academic Year of 2014/ 2015)
A Final Project
Submitted in Partial Fulfillment of the Requirement
For the Degree of Bachelor of Education
In English Language Education
By :
Lailatul Faizah
113411128
TARBIYAH AND TEACHER TRAINING FACULTY
ENGLISH DEPARTMENT
WALISONGO STATE ISLAMIC UNIVERSITY
SEMARANG
2015
THESIS PROJECT STATEMENT
I am, the student with the following identity:
Name : Lailatul Faizah
Student Number : 113411128
Department : English Language Education
Certify that this thesis is definitely my own work. I am completely
responsible for the content of this thesis. Other writer’s opinions or
findings included in the thesis are quoted or cited in accordance with
ethical standards.
Semarang, July 2015
The Writer,
Lailatul Faizah
Student Number:
113411128
ii
ADVISOR NOTE
Semarang, July 2015
To
The Dean of Education Faculty
Walisongo State Islamic University
Assalamu’alaikum wr.wb
I inform that I have given guidance, briefing and correction to
whatever extent necessary to thesis with the following identity:
Title : IMPROVING STUDENTS’ ABILITY IN
WRITING PROCEDURE TEXT BY
USING PICTTURE (An Experimental
Research at 9th
Grade of MTs
Nahdlatusy Syubban Sayung Demak In the
Academic year of 2014/ 2015)
Name of the student : Lailatul Faizah
Student Number : 113411128
Department : Tadris
Field of Study : English Language Education
I state that thesis is ready to be submitted to education Faculty
Walisongo State Islamic University for Islamic Studies to be
examined at munaqasah session.
Wassalamu’alaikum wr.wb.
Advisor,
Dra. Hj. Siti Maryam M.Pd
NIP. 196507271992032002
iii
MOTTO
ان مع العسريسرا Verily with every difficulty there is relief
1
So, There is a will There is a way
No successful without God helping and hard
efforts
1
Mushaf Al-Qur’an Terjemah Departemen Agama RI Edisi
2002(Jakarta Al-Huda ) P. 597
iv
ABSTRACT
Title : Improving students’ Ability in Writing Procedure Text By
Using Picture (an Experimental Research at 9th
Grade of
MTs Nahdlatusy Syubban Sayung Demak in the
Academic Year of 2014/2015
Writer : Lailatul Faizah
Student Number : 113411128
The background of the study in this research is based on the students have
difficulties in comprehending writing procedure texts, because in the teaching and learning process the teacher only explains what the procedure texts is. To develop this
skill, the teacher needs strategy through using a medium that will make students enjoy
and easy to write. Picture is a medium that can be used in teaching writing procedure
texts. The problem of this research can be stated as following question: 1) How
well does picture give contribution to teach procedure text to the ninth grade students
of MTs Nahdlatusy Syubban Sayung Demak in the academic year of 2014/2015. 2)
Are there any differences in writing procedure text achievement between students taught using pictures and those taught using the traditional method of ninth grade
students of MTs Nahdlatusy Syubban Sayung Demak in the academic year of
2014/2015?. Its purposes are: 1) To describe how well pictures give contribution to
teach procedure text of the ninth grade students of MTs Nahdlatusy Syubban Sayung Demak in academic year 2014/2015. 2) To search whether there are different effect on
writing procedure text achievement between those taught using pictures and those
taught using the traditional method.
The population of this research was the ninth grade students of MTs Nahdlatusy Syubban Sayung Demak. The research method was an experimental
research, which was conducted in two classes; the experimental class (IX B) and
control class (IX A) . The experimental class was taught using picture, while the
control class was taught without picture (using text). The writer gave writing test to get the data. There are two test; pre test and post test. The formula that was used to
analyze the data was t-test. It was used to determine a significant difference between
students’ score in experimental class and students’ score in control class.
After the data had been collected by using test, it was found that the pretest average of the experimental class was 51.14 and control class was 49.24. While, the
post-test average of the experimental class was 83.63 and control class were 72.79.
The obtained t-test was 6.770, whereas the t-table was 1.67 for a = 5%. The t-test
score was higher than the t-table (6.770 > 1.67). It meant that Ha was accepted while Ho was rejected. Since t-test score was higher than the t-table, picture was an
effective medium in improving students’ procedure writing MTs Nahdlatusy Syubban
Sayung Demak.
Based on the finding, the writer assumes that picture may be used as one of
alternative medium in the teaching of procedure writing.
v
ACKNOWLEDGMENT
Bismillahirrohmanirrohim,
Assalamu’alaikum Wr. Wb
Praise be to Allah who has give blessing and mercies so that
the writer can finish in creating this thesis. Shalawat and Salam may
be grated to our noble prophet Muhammad SAW and his family, his
friends, and his followers who has brought Islam until this present.
As a ordinary human who has the weakness and limitedness,
the writer realized that the thessis by the title “Improving Students
Ability in Writing Procedure Texts by Using Picture (An
Experimental Research at 9th
grade students of MTs Nahdlatusy
Syubban Sayung Demak in the academic year of 2014/ 2015)” cannot
be finished without any support, guidance, and help from the other
people side. For that, by the honour of this, the writer wants to say
thanks very much to the honorable :
1. Dr. H. Darmuin, as the Dean of Tarbiyah Faculty
2. Dr. H. Muslih, MA as the Head of English Department, Thanks
for all his supports and permission to write this thesis.
3. Dra. Hj. Siti Mariam, M.Pd as the advisor, who guided and
advised patiently during the arrangement of the thesis.
4. Lectures in English Department of Tarbiyah Faculty for valuable
knowledge, and guidance, and advices during the years of my
duty.
5. H. Nur Hasan M.PdI, as the headmaster of MTs Nahdlatusy
Syubban Sayung Demak who Had allowed the writer to carry out
the research in our school.
6. My Husband and My Daughters who always give me motivation
and give the pray for the writer.
vi
7. Last but not least, all side who cannot mentioned one by one who
helped in finishing in this thesis.
By expecting pray, may the goodness be charity and get the
reward from Allah SWT. The writer realized that this thesis is still far
from completeness so that, the writer so expect constructive
suggestion and criticism from all side for the advantages of this thesis.
Finally the writer expect may this thesis useful, especially for the
writer and generally for the reader.
Wassalamu’alaikum, Wr. Wb
Semarang, March 2015
The writer,
Lailatul Faizah
Student’s Number:
113411128
vii
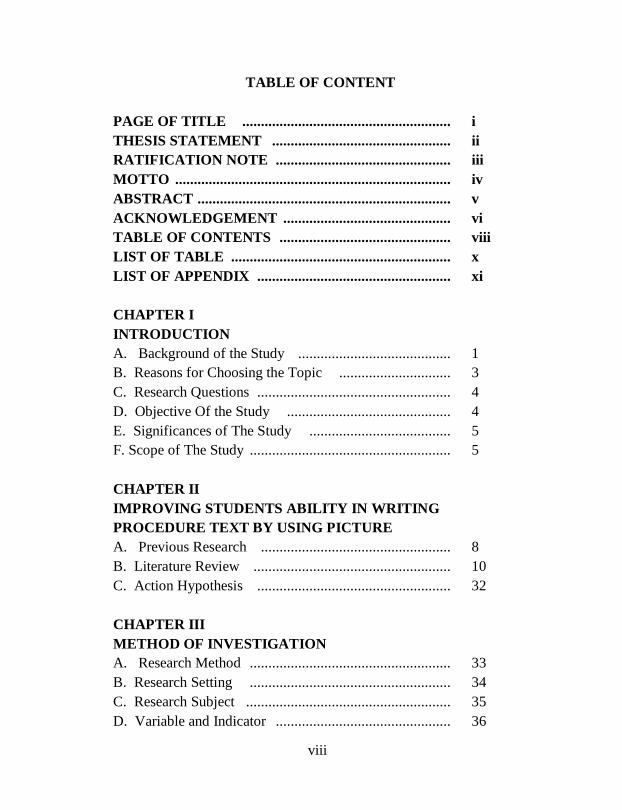
TABLE OF CONTENT
PAGE OF TITLE ........................................................ i
THESIS STATEMENT ................................................ ii
RATIFICATION NOTE ............................................... iii
MOTTO .......................................................................... iv
ABSTRACT .................................................................... v
ACKNOWLEDGEMENT ............................................. vi
TABLE OF CONTENTS .............................................. viii
LIST OF TABLE ........................................................... x
LIST OF APPENDIX .................................................... xi
CHAPTER I
INTRODUCTION
A. Background of the Study ......................................... 1
B. Reasons for Choosing the Topic .............................. 3
C. Research Questions .................................................... 4
D. Objective Of the Study ............................................ 4
E. Significances of The Study ...................................... 5
F. Scope of The Study ...................................................... 5
CHAPTER II
IMPROVING STUDENTS ABILITY IN WRITING
PROCEDURE TEXT BY USING PICTURE
A. Previous Research ................................................... 8
B. Literature Review ..................................................... 10
C. Action Hypothesis .................................................... 32
CHAPTER III
METHOD OF INVESTIGATION
A. Research Method ...................................................... 33
B. Research Setting ...................................................... 34
C. Research Subject ....................................................... 35
D. Variable and Indicator ............................................... 36
viii
E. Data Collection Technique ......................................... 38
F. Data Analysis Technique .......................................... 40
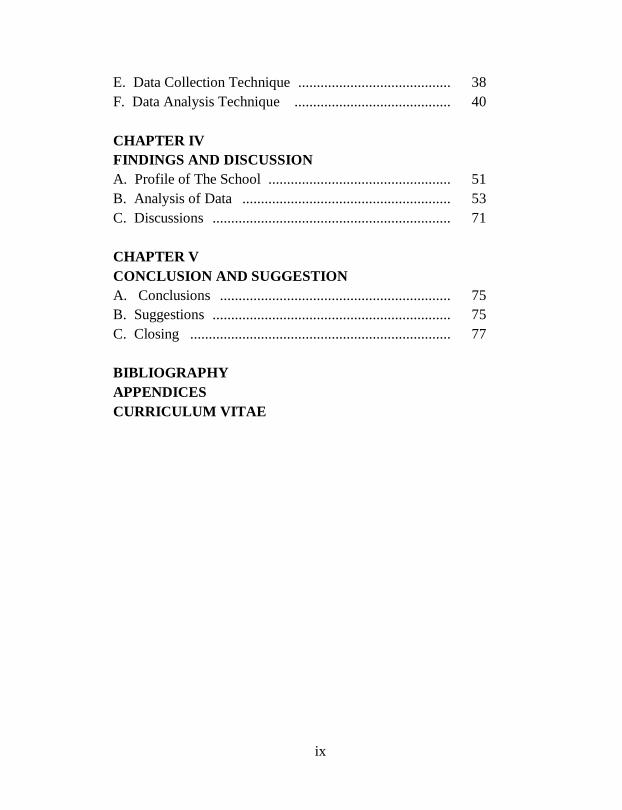
CHAPTER IV
FINDINGS AND DISCUSSION
A. Profile of The School ................................................. 51
B. Analysis of Data ........................................................ 53
C. Discussions ................................................................ 71
CHAPTER V
CONCLUSION AND SUGGESTION
A. Conclusions .............................................................. 75
B. Suggestions ................................................................ 75
C. Closing ...................................................................... 77
BIBLIOGRAPHY
APPENDICES
CURRICULUM VITAE
ix
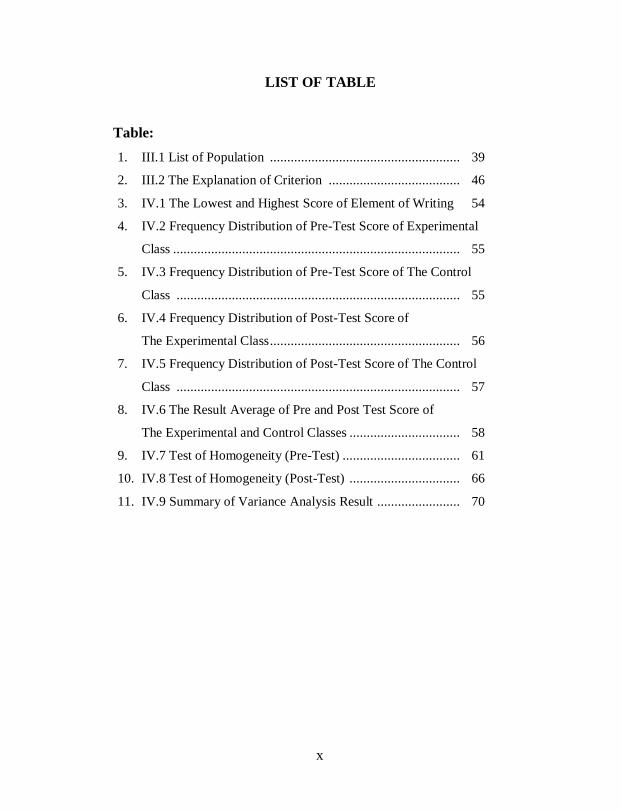
LIST OF TABLE
Table:
1. III.1 List of Population ....................................................... 39
2. III.2 The Explanation of Criterion ...................................... 46
3. IV.1 The Lowest and Highest Score of Element of Writing 54
4. IV.2 Frequency Distribution of Pre-Test Score of Experimental
Class ................................................................................... 55
5. IV.3 Frequency Distribution of Pre-Test Score of The Control
Class .................................................................................. 55
6. IV.4 Frequency Distribution of Post-Test Score of
The Experimental Class ....................................................... 56
7. IV.5 Frequency Distribution of Post-Test Score of The Control
Class .................................................................................. 57
8. IV.6 The Result Average of Pre and Post Test Score of
The Experimental and Control Classes ................................ 58
9. IV.7 Test of Homogeneity (Pre-Test) .................................. 61
10. IV.8 Test of Homogeneity (Post-Test) ................................ 66
11. IV.9 Summary of Variance Analysis Result ........................ 70
x
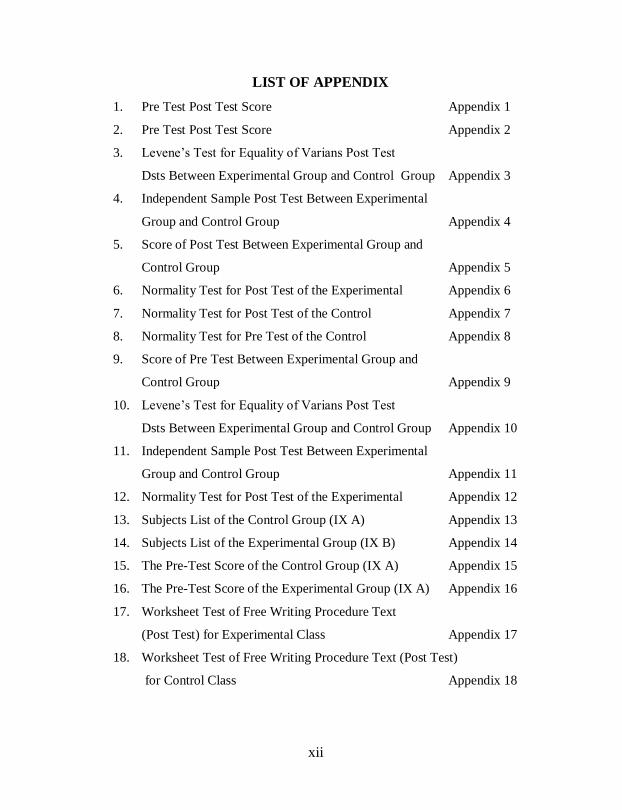
LIST OF APPENDIX
1. Pre Test Post Test Score Appendix 1
2. Pre Test Post Test Score Appendix 2
3. Levene’s Test for Equality of Varians Post Test
Dsts Between Experimental Group and Control Group Appendix 3
4. Independent Sample Post Test Between Experimental
Group and Control Group Appendix 4
5. Score of Post Test Between Experimental Group and
Control Group Appendix 5
6. Normality Test for Post Test of the Experimental Appendix 6
7. Normality Test for Post Test of the Control Appendix 7
8. Normality Test for Pre Test of the Control Appendix 8
9. Score of Pre Test Between Experimental Group and
Control Group Appendix 9
10. Levene’s Test for Equality of Varians Post Test
Dsts Between Experimental Group and Control Group Appendix 10
11. Independent Sample Post Test Between Experimental
Group and Control Group Appendix 11
12. Normality Test for Post Test of the Experimental Appendix 12
13. Subjects List of the Control Group (IX A) Appendix 13
14. Subjects List of the Experimental Group (IX B) Appendix 14
15. The Pre-Test Score of the Control Group (IX A) Appendix 15
16. The Pre-Test Score of the Experimental Group (IX A) Appendix 16
17. Worksheet Test of Free Writing Procedure Text
(Post Test) for Experimental Class Appendix 17
18. Worksheet Test of Free Writing Procedure Text (Post Test)
for Control Class Appendix 18
xii
19. Worksheet Test of Free Writing Procedure Text (Pre Test)
Appendix 19
20. Curriculum Vitae Appendix 20
xiii
1
CHAPTER I
INTRODUCTION
A. Background of The Study
Language is an important means of communication which
used in the world. In the Oxford Learner’s Dictionary, Language is a
system of communication in speech and writing used by people of a
particular country. It plays an important role in our life. English as the
foreign language in our country is considered to be important to learn
and to be used to develop science, technology, art and culture1.
English as a foreign language in Indonesia is very important
to learn and used to develop science, technology and also important to
build relationship with others.
There are four skills that must be mastered by English learners
in learning English. Those are: reading, speaking, listening and
writing. Among the four skills, writing is the important skill for
almost everyone who is learning English.
In writing, people can express their ideas or convey feeling a
piece of information fluently . Writing is an effective action for the
students to improve their skill.
Writing skill is often perceived as a difficult skill in learning
English. Some efforts have been done to solve the problems. The main
objective is to make writing became easier to learn for students. In
1
Oxford, Oxford Learns Pocket Dictionary (New York: Oxford
University Press, 4th,
Edition, 2008) P. 247
2
order to make writing become easier to learn, teacher has to make an
interesting teaching method. The teacher needs media to convey the
lesson more easily. Brown states that using a variety of media will
increase the probability that the students will learn more and retain
better what they learn in improving the performance of skill they are
expected to develop2. Longman Advanced Dictionary stated that
“writing is words that have been written or printed, and activity or
making words on a page with a pen or pencil “3
One of media that can be used to teach writing is picture. The
use of pictures for teaching writing procedure text can make students
interested in the teaching and learning process. Picture is flexible
media to teach English because, it can’t be separated from other media.
By using picture, students can see object, and they will be able to
describe more accurate and they can express imagination, feeling and
mind in written form.
Procedure text is one of genres which are taught in written
class. In writing procedure text, the students should be able to deliver
their knowledge. To make learning writing procedure text easier to
learn for the students, teacher can use picture to help students create
their knowledge in written procedure text form based on the picture.
2 Douglas Brown, Teaching by Principle : An Interactive Approach to
Language Pedagogy, ( San Francisco : Longman, 2001 ), 2nd
Ed,P.2
3 Longman Advanced American Dictionary (America, Printed by U.S
2000 ) p. 1829

3
The study will be focused on writing a procedure text which
one of the materials in English lesson for SMP/MTs especially on the
nine grades students. Procedure is one of text that is to help the
readers how to do, use, or make something completely. Sometimes,
the students create the procedure text without care about the generic
structure specifically. They also get problem in using imperative verb
and temporal conjunction. So, the result of leaning procedure text is
not optimal.
Finally, based on the writer experiment and observation, the
writer chooses MTs. Nahdlatusy Syubban Sayung Demak to conduct
the research. I would like to take this school because most of learners
at MTs, Nahdlatusy Syubban Sayung Demak are lazy to learn English
especially writing. To solve the problem, the writer chooses the title
“Improving Students’ Ability in Writing Procedure Text by Using
Picture” (An Experimental at 9th
Grades of MTs. Nahdlatusy Syubban
Sayung Demak in the Academic Year of 2014/2015)
B. Reasons For Choosing the Topic
Writing is one of basic skills that have to be mastered by
students in 9th
grades of Junior High School. So the writer chooses the
following reasons.
1. Writing is one of important skills for language skills in mastering
English. The writer believes that using pictures as media in
writing could improve student’s ability in writing procedure text.
4
2. Procedures text is one of the genres that must be taught to
students of Junior High School beside report, recount, descriptive
and narrative.
3. Picture is one of the media that can be used in language teaching
especially as teacher aids in writing class.
C. Research Question
1. How well does picture give contribution to teach procedure text?
2. Are there any differences on writing procedure text achievement
between students taught using pictures and those taught using the
traditional method?
D. Objective Of the Study
The objective of the study can be stated as follows:
1. To describe how well pictures give contribution to teach
procedures text?
2. To search whether there are different effect on writing procedure
text achievement of Junior High School students between those
taught using pictures and those taught using the traditional
method?
E. Significances of The Study
The result of the study are expected to be useful for
1. Students
Students are expected to be able to develop their ideas in
writing a procedure text through pictures.
5
2. Teachers
Teachers are expected to increase their knowledge to motivate
students to be interested in learning writing through pictures.
3. The Writer
The writer hopes that this study could facilitate with
knowledge and experience about writing procedure text through
pictures.
F. Scope of The Study
The scope of English study is so broad. We may not be able to
reach all the aspects to be studied as a whole. Particularly in English
learning context, there are so many components that may become the
concern of the study such as the students, the textbook used, the
materials, the process of teaching and learning, etc. Thus, the
boundary of this study specifies on the teaching of writing focusing on:
1. The research subjects of this research are the students of grade
ninth of MTs. Nahdlatusy Syubban Sayung Demak in the
Academic Year of 2014/2015 )
2. Picture as an aid that can be used to apply teaching writing
procedure text.
The improvement of students’ ability in writing procedure text.
8
CHAPTER II
IMPROVING STUDENTS ABILITY IN WRITING
PROCEDURE TEXT BY USING PICTURE
A. Previous Research
The writer describes some works which are relevant to this thesis
to make the thesis arrangement easier and to avoid repeating the
same study:
1. Thesis entitled The Use of Picture as Media for Teaching
Writing (The Case Study of the third Grade Students of
SMUN 1 Wirosari Grobogan in the academic year of
2008/2009) written by Dian Rahmawati, NIM: 2201404651
(Language and Art Faculty of State University of Semarang,
2008). She stated that one of the ways to make the students
are interested in writing is using pictures in teaching writing.
Pictures can represent the real situation and the students can
express their ideas more easily. This study is an
experimental research. It tried to know how well picture give
contribution to teach writing and to know if there is
significant difference in the achievement between the
students who are taught writing using pictures and the
students who are taught writing without pictures as media.
The findings showed that teaching by using pictures can
improve the students’ achievement in writing and it is more
effective than teaching writing without pictures.
9
2. The second thesis entitled “The Effectiveness of Using
Chain Pictures In Teaching Writing a Recount Text (A Case
Study with Eight Year Students of SMPN 1 Demak in
Academic Year of 2007/2008)”. Written by Mayasari
(220140315), Language and Art Faculty of State Semarang
University, 2008. Her thesis explained that the students
usually difficulties in doing writing because it requires their
creativity in developing their feelings and ideas, and chain
pictures are very interesting media that can help students
arrange the story. In this study, she attempted to offer the
chain picture to be used for teaching writing a recount text.
She tried to compare between students who are taught
writing a recount text by using chain picture and those who
are taught using conventional method. The result of this
research shown using chain pictures was more effective than
teaching writing using a conventional way.
3. Thesis entiled “ The Effectiveness of Pictures as Media in
Teaching Writing of Report Text (An Experimental
research with Eight Grade student of MTs N Jeketro
Gorobogan in academic year of 2008/2009 )” Writen by
Siti Mahmudah (3104288), Tarbiyah Faculty, IAIN
Walisongo Semarang. Her Thesis explained about
procedure result and effect of teaching report text using
pictures in writing. She states that one of the ways to
make students are interested in writing is using pictures in
teaching writing. Picture can represent to real situation
10
and the students can express their ideas more easily. This
study is an experimental research. It tried know well
picture give contribution to teach writing and to know if
there is difference in the achievement between the
students who are taught writing using picture and the
students who are taught writing without picture as media.
And the result was significant: picture could be more
effective in teaching writing report text at MTs N Jeketro
in academic year of 2008/2009
From the third thesis above, there are similarities in this
research that are discussed about teaching writing and
pictures. But in this study, the researcher uses pictures to
teach writing procedure text. The setting and the
respondent of this research are also different from the
third research above. This research was conducted at MTs
Nahdaltusy Syubban Sayung Demak.. The respondents of
this research are nineth grade students of MTs Nahdlatusy
Syubban Sayung Demak. So, this research still has
relevance and significance factors why it is interested
enough to be observed.
B. Literature Review
1. Writing
a. Definition of writing
In learning English, there are four skills that should be
mastered by the student. They are: reading, speaking, listening, and
11
writing. Writing is an important skill that can’t ignore. Because in
teaching writing students have to know how to write a grammatically
correct text and need to realize the meaning of sentences. Based on the
Longman Advanced Dictionary, writing is word that have been written
or printed9.
Writing is central to our personal experience and social
identities, and we are often evaluated by our control of it. The various
purposes of writing, then the increased complexity of its context of
use and the diverse backgrounds and needs of those wishing to learn it,
all push the study of writing into wider frameworks of analysis and
understanding10
. Written language is simply the graphic representation
of spoken language is simply the graphic representation of spoken
language, and that written performance is much like oral performance,
the only different lies is graphic for writing instead of auditory signals
for speaking11
.
The Writer considers that writing is the hardest skill for
people who learn English because in writing process, students will
face many difficulties in transferring thought and ideas in writing form.
To make the students motivated and enjoyable to learn, the teacher
should use interesting teaching methods, as Jeremy Hammer said that
teacher’s method in teaching could be intrinsic motivation which
9 Longman Advanced American Dictionary (America, Printed by U.S.
2000). P.1829
10 Ken Hyland, Teaching and Researching Writing, (Britain: Pearson
Education Limited, 2002, p.1
11 H. Douglas Brown, Teaching by principle, (San Francisco:
Longman, 2001), p.335
12
motivated the students to learn. Therefore, it is important for teachers
to gain some knowledge Hamer’s statement is supported by Al-Qur’an
Allah states in the glorious Al-Qur’an:
(1ن . والقلم ومايسطرون )القلم : 12
“Nun, by the pen and by the (record) which (men) write”.
وهو محيم(قيد واالعلم بالكتابه )اخرخه الطبرا وي والحيم عه عبداهلل به عمر 13
“Tie the knowledge with writing”
The Verse and Atsar above contain an order to write by using
qalam (pen). Writing is a great gist coming from Allah. Writing has a
function as a means to understand human-interest if there are not
writing, the knowledge will be lost, religion track will not exist and
life will not be comfortable.
Based on the explanation above, the researcher concludes that
writing is an activity to express ideas, feeling, and opinions through
words to readers in written form. Therefore, writer communicates his
ideas in the form of a written text. And by reading his writing, readers
are able to catch his message.
b. Process of writing
According to Jack C. Richards, the process of writing contains six
steps that must be tried by students and applied to make a good
writing, they are14
:
12
A. Yusuf Ali. The Holy Qur’an, (USA:Amana Corp 1983) P. 1585
13 Wahbah Al-Zuhaily, Tafsir Munir (Libanon dari Al-Fiks Al-
Mu’ashir 1994) Juz Ke 29 P. 318
13
1) Pre-Writing Phase
The first step is through discussion of the topic, reading of the
model composition or the example of beginning of one, brainstorming
on the topic or interviews, students generate ideas and collect
information related to the topic, and then make notes.
2) Free Writing
The second step is students use their ideas, information, and
notes to plan their composition. During this phase, students write
freely on the topic. The focus here is on organizing their ideas-not yet
on having to worry about perfecting grammar and spelling.
3) Drafting
The third step is students now write complete draft in sentence
and paragraph form, but again without worrying too much about
spelling, grammar, or pronunciation.
4) Revising
The fourth step is in pair small group feedback sessions,
students read their own or classmate’s composition. Then they ask
question for clarification, or they can give suggestion for what
additional information might be included. After this type of feedback
session, each student works alone again to recognize, revise, and
rewrite his or her draft.
14
Jack C. Richards with Jonathan Hull and Susan Proctor , New
Interchange English for International communication, (Cambridge
University Press, 1998), p.2
14
5) Editing
The fifth step is student works alone or in pairs, checks their
second draft for accuracy. This time, they concentrate first on
checking that their ideas are clearly organized and that have included
enough details. When content and organized seem fine to them,
students then focus their attention on correcting grammar, spelling,
and punctuation.
6) Final Phase
The last step is students write, word process, or type a clean
third (final) draft to hand in for comment, or they can put their
compositions up on classroom bulletin board for others to read
In this study the researcher assumes that writing never one
step action, it is a process that has several steps. When we first write
something we have already been thinking about what we are going to
say. and how we are going to say. Then after we have finished writing,
we read over what we write and make changes and correction, and the
last we can publish our writing as our composition.
c. Types of writing
Finnochiaro stated “that naturally, the type of writing system
exists in the native language in an important factor in determining to
easy of speech with which students learn to write”15
.
According to Finnochiaro, there are two types of writing:16
15
Marry Finnochiaro, English as a Second Language: From Theory to
Practice, (NY: Regents Publishing Company, Inc., 1974); p.85
16 Ibid, p. 86.
15
a) Factual or Practical Writing
This type of writing deals with facts. The writer can find it in
the writing of letter and summaries.
b) Imaginary Creative Writing
This type of writing usually exists in literature. The examples
of imaginary writing are novel, romance, fantasy, science fiction,
adventure, etc.
c) The Importance of Writing
Ramelan says that writing is a part of man’s culture because it
can be used to preserve thought ideas and also speech sounds17
. From
the explanation we can conclude that writing is means of recording of
what we want to store in the form of written language. Writing is the
most complex skills to develop; it plays an important role in the
modern society. By writing we can earn money when we work i.e. as a
journalist, authors, novelists, interpreters, script writers etc.
Writing is one way of making experience for students and for
others. To be able to write we must master the learning concept that is
we must learn to select and use from any possible combinations of
words. In learning English, writing is very important to support
student’s ability to speak to the other because having a good ability in
writing sentences can make us speak correctly. So our speaking can be
understood by the listener.
Writing as skill is by for the most important reason for
teaching writing; of course. It is a basic language skill, just as
17
Ramelan, Introduction to Linguistic Analysis, (Semarang: IKIP
Semarang Press,1992), p. 9
16
important as speaking, listening and reading. Students need to know
how to write letters, how to put written reports together and how to
reply to advertisements, etc.
As one of the language skills, writing has given an important
contribution to human work. The importance of writing can be seen in
people daily activities and business activities. Writing is very
important to help students learn English. According to Ann Raimes,
writing has many benefits for students. They are:
a. Writing reinforces the grammatical structures, idioms and
vocabulary.
b. Writing gives students chance to be adventurous with the
language.
c. When students write, they become involved with the new
language.
The efforts to express ideas and the constant of eye, hands and
brain are unique way to reinforce18
.
A lot of people can communicate to another over long
distance only in short limit of time through writing. I also make the
possibility for people to send message because it can store the
message as long we wished. Besides, writing activity has more and
more meaning in daily life.
18
Ann Raimes, Teaching English as A Second Language; from Theory
to Practice, (New York: Regent Publishing Company, 1974), p. 85.
17
d. Purpose of Writing
Based on O’Malley and Pierce thought, there are three
purposes of writing classified on the types of writing in English
language learning. Those are informative, expressive or narrative, and
persuasive.19
Firstly, informative is represented by “informative writing” or
“expository writing” that is purposed to share knowledge or
information, give directions, and state ideas. Informative writing
involves describing events or experiences, analyzing concept,
speculating on causes and effect, and developing new ideas and
relationships that are purposed to inform something may important to
the readers.
Secondly, expressive or narrative is represented by
“expressive writing” or “narrative writing” that is purposed to share a
personal or imaginative expression. Commonly it is composed by the
writer story or essay. Expressive or narrative often used to perform a
pleasure discovery, story, poems, or short play.
Finally, persuasive is represented by “persuasive writing” that
is purposed to persuade the readers to do something. It efforts to
influences others and initiate action or change. This type of writing
includes evaluation of book, movie, consumer product, or
controversial issues.20
19
J. Michael O’Malley and Lorraine Valdez Pierce, Authentic
Assessment for English Language Learners (London: Longman, 1996) p. 137
20 . Michael O’Malley and Lorraine Valdez Pierce, Authentic
Assessment for English Language Learners, p.138
18
2. Text
a. Definition of Text
Oxford Advanced Learner’s Dictionary stated that text is the
main written or printed part of a book or page, contrasted with notes.21
.
Creating a text requires us to make choices about the words they use
and how they put them together. If they make the right choices then
we can communicate with others. Our choice of words will depend on
our purpose and our surroundings (context). In other references also
state at the same point that text is a discourse or composition on which
a note or commentary is written; the original words of an author, in
distinction from a paraphrase, annotation, or commentary22
. And
Longman Dictionary of Applied Linguistics stated that text/ teks/ is a
piece of spoken or written language. A text may be considered from
the point of view of its structure and/ or its functions23
Thus from the explanation above, the researcher concludes that text is
a passage that has composition on which a note is written, also it has
structure and function.
21
A. S. Hornby, Oxford Advanced Learners� Dictionary, (NY:
Oxford University Press, 1987), p.1234.
22Horland, Retrieved on Friday, March 12th 2010 at 16.05 from
http://www.brainyquote.com/words/te/tex229385.html.
23 Jack Richards and friends, Longman Dictionary of Applied
Linguistics, (England: Longman, 1990), p.292.
19
b. Types of Text
There are two types of the text, they are24
:
Literary texts
Literary texts include Aboriginal Dreaming Stories, movie
scripts, limericks, fairy tales, plays, novels, song lyrics, mimes, and
soap operas. They are constructed to appeal to our emotions and
imagination. Literary texts can make us laugh or cry, think about on
our life and considers our beliefs. There are three main text types in
this category: narrative, poetic and dramatic. Media text such as films,
videos, television shows, and CDs can also fall in this category.
Factual texts
Factual texts include advertisement, announcements, Internet
web sites, current affairs shows, debates, recipes, reports and
instructions. They present information or ideas and aim to show, tell
or persuade the audience. The main text types in this category are
recount, response, explanation, discussion, information report,
exposition and procedure.
3. Genre
a. Definition of Genre
The word genre comes from the French (and original Latin)
word for kind or class. The term is widely used in rhetoric, literary
theory, media theory, and more recently linguistics. Robert Allen
24
Mark Anderson and Kathy Anderson, Text Types in English 1,
(South Yarra: Macmillan Education Malaysia,1997),p.1-3
20
notes that for most of its 2,000 years, genre study has been primarily
numerological and typological in function25
.
Swales (1990) defines26
, Genre as a class of communicative
events which has (1) a shared set of communicative purposes that are
recognized by the parent discourse community, (2) established
constraints on contributions in terms of their content, positioning and
form, and (3) nomenclature for genres that is determined by the
discourse community. The feasibility study, progress report, and
research report are all examples of what today we would call genres.
Each genre is characterized by a distinctive schematic structure, that is,
by a distinctive beginning, middle and end structure through which the
social function of the genres is realized. While some purposes for
speaking and writing remain constant across cultures, the ways in
which these purposes are realized vary. Thus it is likely that there will
be considerable variation of genres between cultures27
.
Thus from the explanation above, the researcher concludes that
genre (in classroom context) is simple texts or type of literature which
is communicative in its explanation to the students.
25
Daniel Chandler, An Introduction of Genre Theory, Retrieved on
Monday, March 22nd 2010 at 11.03 from
http://www.aber.ac.uk/media/Documents/intgenre1.html#*
26 Master, Peter. Responses to ESP, (San Jose: State University,
1998).p.37.
27 Jenny Hammond and friends, English for Social Purposes,
(Australian: Macquarie University, 1992), p. 2.
21
b. Kinds of Genre
There are twelve kinds of genre28
, they are:
1) Recount
Recount is a piece of text that retells events for the purpose of
informing or entertaining.
2) Report
Report is a piece of text that describes the way things are, with
reference to a range of natural, man-made and social phenomena in
our environment.
3) Discussion
Discussion is a piece of text that presents (at least) two points
of view about an issue.
4) Explanation
Explanation is a piece of text that explains the processes
involved in the formation or workings of natural or socio cultural
phenomena.
5) Exposition (Analytical)
Exposition: analytical is a piece of text that persuades the
reader or listener that something needs to get attention.
6) Exposition (Hortatory)
Exposition: hortatory is a piece of text that persuades the
reader or listener that something should or should not be the case.
28
Mark Anderson and Kathy Anderson, op.cit, p.3.
22
7) News item
News item is a piece of text that informs readers, listeners and
viewers about events of the day which are considered newsworthy or
important.
8) Anecdote
Anecdote is a piece of text that shares with others an account
of an unusual or amusing incident.
9) Narrative
Narrative is a piece of text that amuses, entertain and to deal
with actual or vicarious experience in different ways. Narratives deal
with problematic events which lead to a crisis or turning point of some
kind, which in turn finds a resolution.
10) Procedure
Procedure is a piece of text that describes how something is
accomplished through a sequence of actions or steps.
11) Description
Description is a piece of text that describes a particular person,
place or thing.
12) Review
Review is a piece of text that critiques an art work, event for a
public audience.
4. Procedure Text
a. Definition of Procedure Text
According to Nystrand and Himley (1986: 81) A text is
explicit not because it says everything all by itself but rather because it
23
strikes a careful balance between what needs to be said and what may
be assumed. The writer’s problem is not just being explicit; the
writer’s problem knowing what to be explicit about.29
Writing is the last skill in English that we cannot ignore.
When the students write a text, they should not only write
semantically correct but also should use correct grammar. Generally,
writing is a complex process that involves a range of skills and tasks
because by writing process, each of which focuses on specific tasks.
Creating a text requires us to make choices about the words they use
and how they put them together. If students make the right choices
then they can communicate with others. Our choice of words will
depend on our purpose and our surroundings (context).30
As procedure, therefore, is a piece of text that gives us
instructions for doing something.31
Thus, from the explanation above,
the researcher concludes that procedure text is any meaningful stretch
of language in oral and written that has social purpose to describe how
something is accomplished through a sequence of actions or steps.
b. Social Function of Procedure Text
Especially, the social function of Procedure Text is to tell
someone how to do something or how to make something and how to
operate something.
29
Key Hyland, op.cit, p.8
30 Mark Anderson and Kathy Anderson, op.cit,p.1.
31 Ibid.p.50
24
c. Generic Structure of Procedure Text
According to Swales, structure of texts is a device that
supports communicative purpose32
Some with other text type,
procedure text also has generic structure according to communicative
purpose of the text itself. However there are certain similarities within
the texts with the same purpose. The similarities create an expectation
of the general schematic structure of the text that is called generic
structure of a text. The generic structure of procedure text also called
as constructing a procedure text. Constructing itself comes from the
verb construct, which has meaning: to build something, to put or fit
something together, to form together33
. Both of them have same
meaning, there are three generic structure of procedure text, they are34
:
An Introductory statement that gives the aim or goal.
A list of the materials that will be needed for completing the
procedure (not required for all procedural texts).
A sequence of steps in the order they need to be done, because
goal followed by a series of steps oriented to achieve the goal.
Thus from the explanation above, it can be concluded that there are
three points of generic structure of procedure text which is crucial and
it can be stated without ones. Because they are in one unity to achieve
a social function, it is to tell someone how to do something or how to
make/ how to operate something.
32
J.Swales, Genre Analysis, (UK: Cambridge University
Press,1990),p.42.
33 Oxford, op.cit p. 247.
34 Mark Anderson and Kathy Anderson, op.cit, p. 53.
25
d. Significant Lexicogrammatical Features
Besides having social function and generic structure,
procedure text also has significant lexicogrammatical features that
support the form of a procedure text. They are:
Simple Present Tense, especially imperative form
Eventually, procedure text has the social function is to tell
someone to do something. So, the instruction here is used by
imperative verb in present tense. For examples get, chop, cut, stir, add,
boil, grind, etc.
Connective of sequence
Sometimes, that is not enough to make a good instruction just
using imperative form of present tense. But, to make it better and easy
to follow, we need the word like as then, after that, next, finally, etc.
These are called comparative sequence.
Numbering
The function of numbering here is same as comparative of
sequence. It will be needed if the writer wants to show some variant of
sequence, for examples: first, second, third, fourth and etc.
e. The Example of Procedure Text
Goal : How to Make a Cheese Omelet
Ingredients : 1 egg, 50 g cheese, cup milk, 3 tablespoons cooking
oil, a pinch of salt and pepper.
Utensils : Frying pan, fork, spatula, cheese grater, bowl and
plate.
Steps :
26
a) First, crack an egg into a bowl
b) Second, whisk the egg with a fork until it is smooth
c) Third, add milk and whisk well
d) Fourth, grate the cheese into the bowl and stir
e) Fifth, heat the oil in a frying pan
f) Sixth, pour the mixture in a frying pan
g) Seventh, turn the omelet with a spatula when it browns
h) Next, cook both sides
i) Then place on a plate; season with salt and pepper.
j) Finally, Eat while warm
Thus from an example above, everybody know how to write
procedure text. First, they must write a goal. Second, they write a list
of materials that will be needed for completing the procedure, such as
kind of ingredients and utensils. And the last, they need steps to
achieve the goal with the purpose: to tell the making process of a
cheese omelet to the reader.
Procedure text is a piece of text that gives us instructions for
doing something. The purpose is to explain how something can be
done35
. Writing procedures help us do a task or make something. They
can be a set of instructions or directions e.g. step by step method to
germinate seeds.
35
Anderson, Mark and Kathy Anderson, Text Types in English 1,
(South Yarra: Machmillan Education Malaysia, 1997), p.50.
27
5. Pictures
a. Definition of Pictures
Nagaraj states that another effective way of getting learners to
learn words is through using picture. Picture can be drawn on the
black board, chart papers or even cutouts36
.
Harmer states that pictures are clearly indispensable for
language teachers since they can be used in many ways. A picture is
an art that can express the lifestyle of someone or something, for
example to express the lifestyle of flowers, animals or peoples in their
simple characteristics37
.
b. Types of Pictures
Oemar Hamalik states that the types of pictures in detail as
follows:
a) Sketch, painting product whether it is complete or incomplete.
b) Draft, the communication between lines or writing and picture
presented and arranged logically to show off relation between
the fact or idea.
c) Graphs, the picture which gives information about numbers
and important relationship within the information.
d) Comics, series of pictures or paintings which forms a story.
e) Poster, a picture or painting which explain an intention or idea.
36
G. Nagaraj, English Language Teaching; Approach, Methods,
Techniques, (Orient: Longman Ltd., 1990), p. 168
37 Jeremy Harmer, Op. Cit.,p. 3
28
f) Cartoon, a picture or painting or sketch with is used to
entertain, to critic or to suggest an idea.
g) Diagram, the combination between lines and picture which
shows internal relationship, and
h) Map, the picture which describes a real situation38
.
c. The Characteristics of Pictures
A still picture is a record or a copy of real object or even
which may be larger or smaller than the object. Even though there is
no motion, it may be suggested and it may be also full color or white
and black39.
Gerlach and Elly state that still picture are visual
representation of person, places or things, which are two dimensional
and have characteristics, such as they may be drawn, printed or
photographically processed, abstract and they vary in size and color40
.
Pictures may be used as teaching media in classroom. It is
depended on the characteristics of pictures that are interesting and
informing about something. By representing pictures, it will
encourage students interested and giving them any kind of
information41
.
38
Oemar Hamalik, Metode Belajar dan Kesulitan-kesulitan Belajar,
(Bandung: Tarsito, 1985), pp. 43-44.
39 Dyah Maya Sari, Op. Cit., p. 14
40 Vernon S. Gerlach, Op. Cit., p. 273
41 Anik Nur Aeni, The Use of Pictures as Media in teaching
Speaking,(Semarang: Walisongo State Institute for Islamic Studies, 2009),
Unpublished Thesis
29
d. Picture as Medium
The word media are derived from Latin “medium” that
means “between” or mediator. In Arabic media is “wasaaila”
intermediary or mediator42
. Picture as visual aid is medium that can
be used in teaching and learning process which helps the
students to understand the material.
As Harmer stated, we use variety of teaching aids to
explain language meaning of construction, engage students in a
topic or as the basis of the whole activity43
.
To make the students motivated and enjoyable to learn, the
teacher should use interesting teaching methods, as Jeremy
Harmer said that teacher’s method in teaching could be intrinsic
motivation which motivates the students to learn44
.
Based on the explanation above, using picture in teaching
leaning process is of one an alternative medium that can be use in the
class. Students will be interested in understanding the material.
And the existence of medium is absolutely needed.
Media are kinds of substances that are used by a teacher
during teaching and learning process to support the presentation of
the lesson. Media have important roles in teaching and learning
process. Students‟ motivation can be increased by using media in
teaching.
42
Azhar Arsyad, Media Pembelajaran, ( Jakarta: PT: Raja Grafindo
Persada, 2001)
43 Jeremy Harmer, The Practice of Language Teaching,P.134
44 Jeremy Harmer, How To Teach Writing.,p.20
30
e. The Advantages of Using Pictures to teach Procedure Texts
Teaching in general or English teaching in particular is a
combined effort of various components to achieve a certain goal. It
means that the success of teaching is not determined by a single
component, but by the roles of all components involved. However, in
teaching-learning process, a teacher must bring all components into a
classroom and apply them. We can imagine that it will be hard to do
because of some limitations. Therefore, a teacher often uses pictures
as a means to improve the students’ ability in learning English45
.
Pictures are one of kind of media, which can help the teacher
draw the students’ interest and arouse their motivation. If the students
are motivated, they will participate actively and will learn hard during
the teaching learning process. A teacher should be able to plan and
organize an instructional design, the learning environment and the
learning activities in the classroom in which he/she can stimulate the
students in active ways and encourage them to take part in the
activities where they have opportunities to produce English sentences
or to use English communicatively. Thus, a teacher utilizes pictures to
help students to get the students’ interest and motivation46
.
A picture is an excellent media in which this can be done
pictures arouse play fullness in the pupils because pictures are
interesting. It provides variety of fun and games, furthermore, it is also
45
Dyah Maya Sari, Op. Cit., p. 16
46 Ibid
31
means that the use of picture may offer parallel opportunities both for
teacher-students and students-students interaction47
.
According to Gerlach, there are several advantages of pictures, such as:
a) Pictures are inexpensive and widely available.
b) They provide common experiences for entire group.
c) The visual detail makes it possible to study subjects, which would
otherwise be impossible.
d) Pictures can help to prevent and correct misconception.
e) Pictures offer a stimulus to further study, reading and research.
Visual evidence is a powerful tool.
f) They help to focus attention and to develop critical judgments.
g) They are easily manipulated48
.
Therefore, the teacher will choose the pictures as media.
Pictures are more understandable than words. The responses to
pictures are often considerably faster than words. Another advantage
of the use of pictures is that retention of pictorial information is quite
remarkable over long periods of time.
47
Dian Candra Prasetyani, A Study on the Ability in Writing A
Recount Text By Using Pictures, (Semarang: English of Languages and Arts
Semarang State University, 2006), Unpublished Thesis
48 Vernon S. Gerlach, Op. Cit.,p. 277
32
f. The Limitation of Using Pictures in Teaching Learning
Activity
Sari states:
“Although pictures have many advantages, they still have
some limitations. They are sizes and distances are often
distorted, lack of color in some pictures limits proper
interpretations, and students do not always know how to
read pictures”49
.
C. Action Hypothesis
Based on the title of Improving Students Ability in Writing
Procedure Text Using Picture, the researcher has hypothesis that
Picture can improve students ability in Writing Procedure Text,
because students ability in writing can be improved by true strategies
in teaching writing through Picture as an teaching aid. These students’
ability improvement in writing can be showed by some indicators and
all of them is writing as a cooperative activity.
49
Dyah Maya Sari, Op. Cit., p. 17
33
CHAPTER III
METHOD OF INVESTIGATION
There are six points to be discussed in this chapter. They are
research method, research setting, population and sample, variable and
indicator, data collection technique, and data analysis technique.
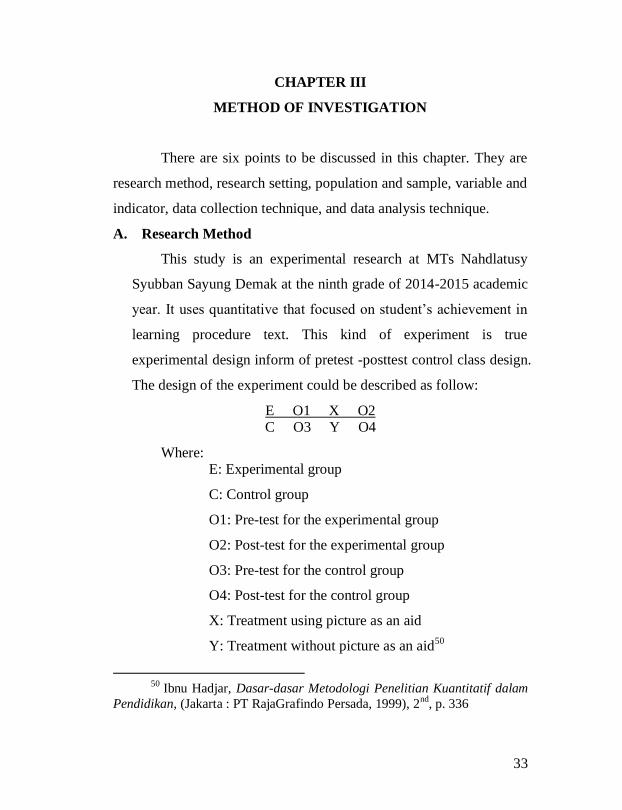
A. Research Method
This study is an experimental research at MTs Nahdlatusy
Syubban Sayung Demak at the ninth grade of 2014-2015 academic
year. It uses quantitative that focused on student’s achievement in
learning procedure text. This kind of experiment is true
experimental design inform of pretest -posttest control class design.
The design of the experiment could be described as follow:
E O1 X O2 C O3 Y O4
Where: E: Experimental group
C: Control group
O1: Pre-test for the experimental group
O2: Post-test for the experimental group
O3: Pre-test for the control group
O4: Post-test for the control group
X: Treatment using picture as an aid
Y: Treatment without picture as an aid50
50
Ibnu Hadjar, Dasar-dasar Metodologi Penelitian Kuantitatif dalam
Pendidikan, (Jakarta : PT RajaGrafindo Persada, 1999), 2nd
, p. 336
34
From design above, subjects of research were grouped into an
experimental group (top line), and control group (bottom line). The
quality of subject was first checked by pre-testing them (01 and 03).
Then, the experimental treatment (taught by picture) was applied to
experimental group, while control group was taught using text only.
The result of post-test (02 and 04) were then computed statistically.
B. Research Setting
1. Time of the research
This research was implemented on 1 March – 25 May 2015,
counted since the proposal was submitted until the end of research.
2. Place of the research
The writer conducted the research at MTs Nahdlatusy
Syubban Sayung Demak. It is located at Jl. Semarang-Demak KM. 10
Purwosari Sayung Demak.
This research was conducted at the ninth grade students of
MTs Nahdlatusy Syubban Sayung Demak. IX A class the
experimental group and IX B the control group. Every class consists
of 34 and 33 students as participants, who were mostly 14-15 years
old.
35
C. Research Subject
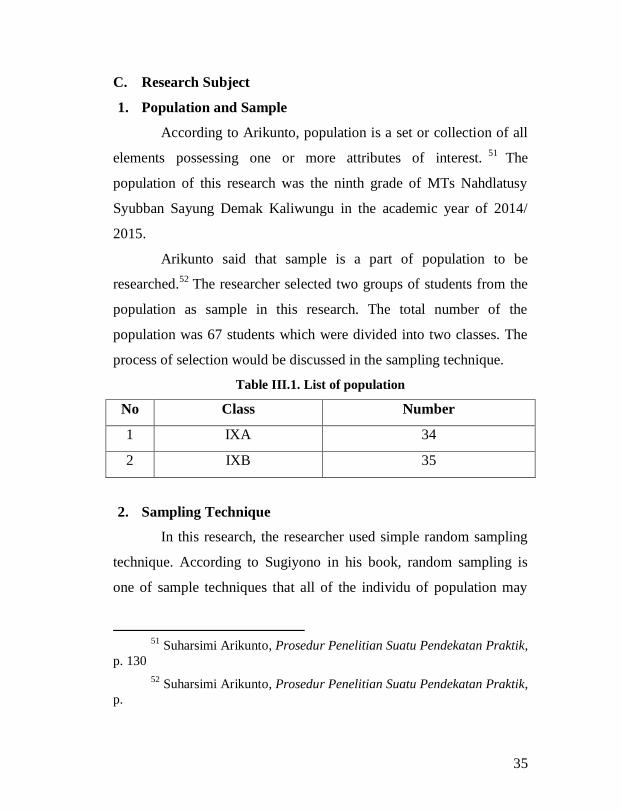
1. Population and Sample
According to Arikunto, population is a set or collection of all
elements possessing one or more attributes of interest.51
The
population of this research was the ninth grade of MTs Nahdlatusy
Syubban Sayung Demak Kaliwungu in the academic year of 2014/
2015.
Arikunto said that sample is a part of population to be
researched.52
The researcher selected two groups of students from the
population as sample in this research. The total number of the
population was 67 students which were divided into two classes. The
process of selection would be discussed in the sampling technique.
Table III.1. List of population
No Class Number
1 IXA 34
2 IXB 35
2. Sampling Technique
In this research, the researcher used simple random sampling
technique. According to Sugiyono in his book, random sampling is
one of sample techniques that all of the individu of population may
51
Suharsimi Arikunto, Prosedur Penelitian Suatu Pendekatan Praktik,
p. 130
52 Suharsimi Arikunto, Prosedur Penelitian Suatu Pendekatan Praktik,
p.
36
have a same opportunity and have chosen as the independent sample.53
So, the researcher was taken two classes as a sample, they are IX A
and IX B. 69 students as participants. In IX A class consists of 34
students and in the IX B consists 0f 35 students. Students in class IX
B was taught by using picture and considered as experimental group.
While students in class IX A was taught without picture (using text)
and considered as control group. Both of those classes have the same
teacher who taught them and on the available time to teach them.
D. Variable and Indicator
Variable is the object of research or something that become
the concern by researcher to be studied to get any information and
then make a conclusion of that object.54
The researcher used picture as
a medium in teaching writing procedure text. In this research had two
variables, the variable in this study were:
a. Independent Variable
Independent variable is the variable that influences the change of
dependent variable.55
The independent variable in this research
was the use of picture as medium. The experimental group which
taught by picture, while the control group which taught by text
only.
53
Sugiyono, Statistika untuk penelitian, (Bandung : Alfabet,
2007).p.64
54 Sugiyono, Statistika untuk penelitian, (Bandung : Alfabet, 2007).p.2
55 Sugiyono, Statistika untuk penelitian, (Bandung : Alfabet, 2007).
P.4
37
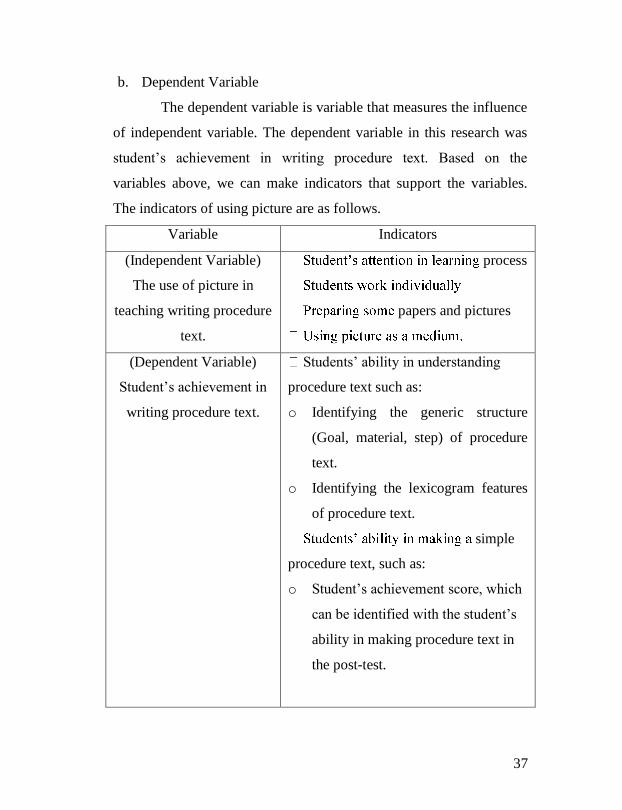
b. Dependent Variable
The dependent variable is variable that measures the influence
of independent variable. The dependent variable in this research was
student’s achievement in writing procedure text. Based on the
variables above, we can make indicators that support the variables.
The indicators of using picture are as follows.
Variable Indicators
(Independent Variable)
The use of picture in
teaching writing procedure
text.
process
papers and pictures
(Dependent Variable)
Student’s achievement in
writing procedure text.
Students’ ability in understanding
procedure text such as:
o Identifying the generic structure
(Goal, material, step) of procedure
text.
o Identifying the lexicogram features
of procedure text.
simple
procedure text, such as:
o Student’s achievement score, which
can be identified with the student’s
ability in making procedure text in
the post-test.
38
E. Data Collection Technique
In gaining this data, the researcher attempted to employ these
following methods:
1. Observation
Observation was the activity that was done by the researcher
to get data. There were two kinds of observation, they were:
a. Non systematic observation’ which was done by the
researcher without using instrument.
b. Systematic observation which was done by the researcher
using instrument as the guide of the research.56
The observation focused on teacher and students activity in
classroom. In this part, the researcher used checklist as instrument to
take information related to the activity in the class room.
2. Test
Test is a set of questions and exercises used to measure the
achievement or capability of the individual or group.57
This method is
used to get data about score o f the pre-test and post-test which was
given to both groups, the experimental and control classes. The test in
this study is an essay test or subjective test. In essay test of writing,
the student was given freedom to think as much as possible. They can
freely express and organize their ideas in written form.
56
Burhan Nurgiyantoro, Penilaian dalam Pengajaran, p.157
57 Suharsimi Arikunto, Prosedure Penelitian Suatu Pendekatan
Praktik,( Jakarta : PT Rineka Cipta, 2006),edisi revisi. p.139
39
There were two kinds of test, pre-test and post-test. Those
tests were given to the students as participants, either the experimental
or the control group.
a. Pre- test
Before carrying out the teaching, the pre-test was
given to experimental and control classes in order to make
sure that the two groups have similar and equal level of
proficiencies. It was used to find out the initial condition of
students before treatment. The researcher gave an assignment
to write a procedure text based on theme. The students had to
pay attention to the five aspects of writing which would be
used in the assessment. These five aspects were as follow;
grammar, vocabulary, mechanic, relevance and fluency.
b. Post- test
The post- test was given to the experimental class
after being taught by picture and was given to the control class
after being taught without picture (by using text only). The
test was given in order to know the improvement of students’
ability in writing procedure text.
3. Documentation
Documentation method is used to look for the data concerning
matters or the variable that are taken in the form of the note, transcript,
book, newspaper, magazine, inscription, agenda, etc.58
58
Suharsimi Arikunto, Prosedure Penelitian Suatu Pendekatan
Praktik, p. 158
40
It refers to the archival data that help the writer to collect the
needed data. In this study, this method is used to get the data that were
related to the research object such as students name list are included in
the population. In this case, the data was gained by the help of the
English teacher.
F. Data Analysis Technique
1. Technique of scoring test
In scoring the test , the researcher used analytic scale which
categorized by some categories. O’Malley and Pierce stated that
analytic scale separates the features of a composition into components
that are scored separately.59
This analytic score has five items and
each item scores five. So, the maximum score is 25. The items are:
First is Grammar, Brown states that grammar is the system of rules
governing the conventional arrangement and relationship of words in
a sentence.60
And the researcher states grammar is the employing
grammatical and syntactic form.
Second is vocabulary, according to Caroline T. Linse, vocabulary is
the collection of words that an individual knows61
.
59
J. Michael O'Malley and Lorraine Valdez Pierce, Authentic
Assessment for English Language Learners, (London: Longman, 1996),
p.144.
60 H. Douglas Brown, Teaching by Principle (San Fransisco:
Longman,2001), p. 362.
61 Caroline T. Linse, Practical English Language Teaching: Young
Learners, (New York: MC Graw Hill, 2006), p.121
41
Third is mechanic, the mechanic is the use of graphic convention of
the language.62
Mechanic will make students’ writing well and reasonable to
be read. The examples of mechanic are capital letter, quotation,
comma, semicolon, and others. And the last are relevance and fluency
(style and ease of communications). Relevance contains reasonable
sentences (supporting sentences).63
that support to the main idea. If
students write paragraph without state the main idea, the reader will
confuse to decide the main topic of the text, while fluency refers to the
sentences that flow easily and not too hard to understand by audiences
(readers). If the researcher uses strange vocabulary, the readers will
confuse what the purpose of writing. It means the writer uses a simple
vocabulary not strange vocabulary.
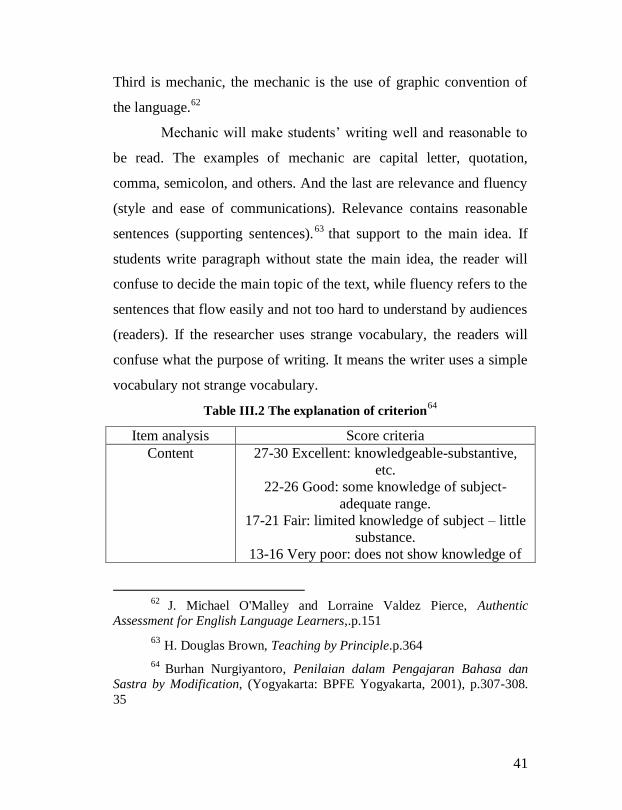
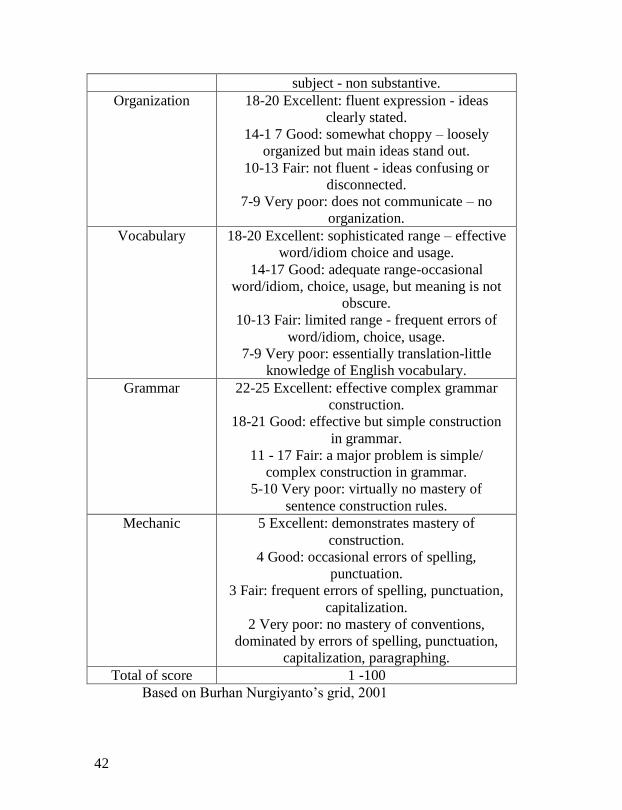
Table III.2 The explanation of criterion64
Item analysis Score criteria
Content
27-30 Excellent: knowledgeable-substantive,
etc.
22-26 Good: some knowledge of subject-
adequate range.
17-21 Fair: limited knowledge of subject – little
substance.
13-16 Very poor: does not show knowledge of
62
J. Michael O'Malley and Lorraine Valdez Pierce, Authentic
Assessment for English Language Learners,.p.151
63 H. Douglas Brown, Teaching by Principle.p.364
64 Burhan Nurgiyantoro, Penilaian dalam Pengajaran Bahasa dan
Sastra by Modification, (Yogyakarta: BPFE Yogyakarta, 2001), p.307-308.
35
42
subject - non substantive.
Organization 18-20 Excellent: fluent expression - ideas
clearly stated.
14-1 7 Good: somewhat choppy – loosely
organized but main ideas stand out.
10-13 Fair: not fluent - ideas confusing or
disconnected.
7-9 Very poor: does not communicate – no
organization.
Vocabulary 18-20 Excellent: sophisticated range – effective
word/idiom choice and usage.
14-17 Good: adequate range-occasional
word/idiom, choice, usage, but meaning is not
obscure.
10-13 Fair: limited range - frequent errors of
word/idiom, choice, usage.
7-9 Very poor: essentially translation-little
knowledge of English vocabulary.
Grammar 22-25 Excellent: effective complex grammar
construction.
18-21 Good: effective but simple construction
in grammar.
11 - 17 Fair: a major problem is simple/
complex construction in grammar.
5-10 Very poor: virtually no mastery of
sentence construction rules.
Mechanic
5 Excellent: demonstrates mastery of
construction.
4 Good: occasional errors of spelling,
punctuation.
3 Fair: frequent errors of spelling, punctuation,
capitalization.
2 Very poor: no mastery of conventions,
dominated by errors of spelling, punctuation,
capitalization, paragraphing.
Total of score 1 -100
Based on Burhan Nurgiyanto’s grid, 2001
43
In giving scoring of the writing test, the writer
processes the result of the students’ test. The writer gave the score for
each element of writing as follows:
a. Content : The lowest score is 13 and the highest score is 30
b. Organization : The lowest score is 7 and the highest score is 20
c. Vocabulary : The lowest score is 7 and the highest score is 20
d. Grammar : The lowest score is 5 and the highest score is 25
e. Mechanic : The lowest score is 2 and the highest score is 5
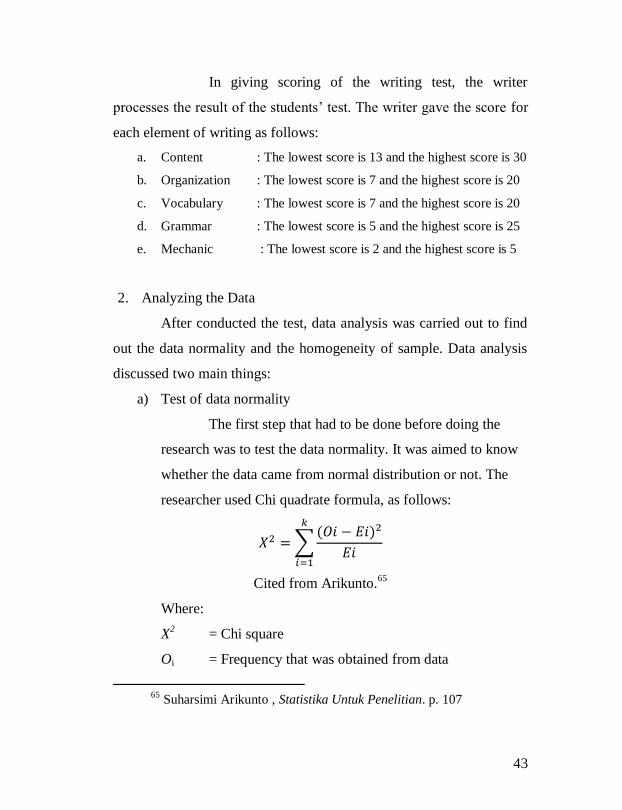
2. Analyzing the Data
After conducted the test, data analysis was carried out to find
out the data normality and the homogeneity of sample. Data analysis
discussed two main things:
a) Test of data normality
The first step that had to be done before doing the
research was to test the data normality. It was aimed to know
whether the data came from normal distribution or not. The
researcher used Chi quadrate formula, as follows:
∑
Cited from Arikunto.65
Where:
X2 = Chi square
Oi = Frequency that was obtained from data
65
Suharsimi Arikunto , Statistika Untuk Penelitian. p. 107
44
Ei = Frequency that was hoped
k = the sum of interval class
If the obtained score was lower than t -table score by
using 5% alpha of significance, Ho was accepted. It was
meant that Ha was rejected.
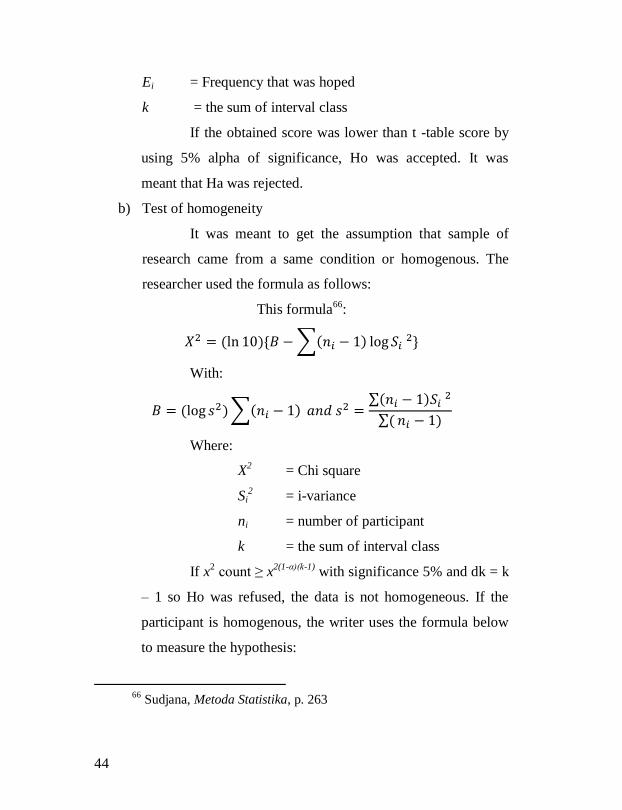
b) Test of homogeneity
It was meant to get the assumption that sample of
research came from a same condition or homogenous. The
researcher used the formula as follows:
This formula66
:
∑
With:
∑ ∑
∑
Where:
X2 = Chi square
Si2 = i-variance
ni = number of participant
k = the sum of interval class
If x2 count ≥ x2(1-α)(k-1)
with significance 5% and dk = k
– 1 so Ho was refused, the data is not homogeneous. If the
participant is homogenous, the writer uses the formula below
to measure the hypothesis:
66
Sudjana, Metoda Statistika, p. 263
45
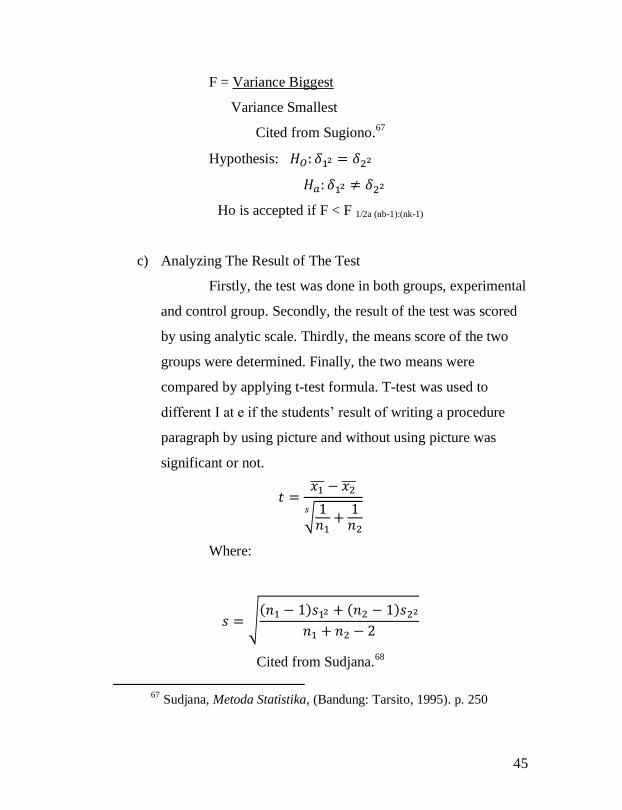
F = Variance Biggest
Variance Smallest
Cited from Sugiono.67
Hypothesis:
Ho is accepted if F < F 1/2a (nb-1):(nk-1)
c) Analyzing The Result of The Test
Firstly, the test was done in both groups, experimental
and control group. Secondly, the result of the test was scored
by using analytic scale. Thirdly, the means score of the two
groups were determined. Finally, the two means were
compared by applying t-test formula. T-test was used to
different I at e if the students’ result of writing a procedure
paragraph by using picture and without using picture was
significant or not.
√
Where:
√
Cited from Sudjana.68
67
Sudjana, Metoda Statistika, (Bandung: Tarsito, 1995). p. 250
46
Where:
= the mean score of the experimental group
= the mean score of control group
= the number of the experimental group
= the number of the control group
s = standard deviation
= variance
If the obtained score was higher than t -table score by
using 5% alpha of significance, Ho was rejected. It meant that
Ha was accepted: “There was a significant difference in
writing achievement between the experimental and control
group.”
d) Analysis of Variance
Analysis of variance (ANAVA) is a collection of
statistical models, and their associated procedures, in which
the observed variance in a particular variable is partitioned
into components attributable to different sources of variation.
In its simplest form ANAVA provides a statistical test of
whether or not the means of several groups are all equal, and
therefore generalizes t-test to more than two groups. For this
reason, ANOVAs are useful in comparing two, three or more
68
Suharsimi Arikunto, Statistika Untuk Penelitian, (Bandung IKAPI
2007), p.138
47
means.69
The reason for doing an ANOVA is to see if there is
any difference between groups on some variable.70
This
research focuses on students’ achievement on test of
prohibition. Hence, in this research, the data analysis was
done by comparing students’ achievement among students’
pre-test and post-test achievement using double ANAVA
(Analysis of Variance). ANAV A is an inferential technique
which is used to examine the difference of value average. As
an analysis technique, ANAVA have some advantages, they
are71
:
1) ANAVA can be used to determine two or more average
of sample is different significantly or not.
2) Calculation of ANAVA results Fratio value which is
significantly shows to researcher whether sample that is
researched comes from different population.
3) ANAVA can be used to analyze data which is resulted by
using complex factorial design. In a factorial design that
results double F values, ANAVA can finish them all at
once. By using ANAVA, researcher can understand
69
http://en.wikipedia.org/wiki/Analysis_of_variance, retrieved on
19Th
December 2011 70
http://www.csse.monash.edu.au/~smarkham/resources/anova.htm
retrieved on 19th March 2015
71 Nurul Zuhriyah, Metodologi Penelitian Sosial dan Pendidikan:
Teori –Aplikasi, (Jakarta:PT. Bumi Aksara, 2009), P. 210
48
which variables that have difference significantly and
which variables that interact each other.
4) The ability of ANAVA can test the significance of
tendency of a hypothesized trend. The result of the test
called analysis of tendency.
5) ANAVA technique can be used to examine significance
of two or more different variable.
The main element of variance analysis is variable among
groups that be placed as numerator and variance in the group that be
placed as denominator. Hence, a bigger variance in the group, Fratio
value will decrease. Thus, more subjects which researched caused the
denominator value increases.
After getting Fratio value, it should be compared with Ftable in a
particular real degree and particular degree of freedom. Hypothesis
that is examined through Fratio is as follow:
Ho : M1 = M2
Ha : M1 ≠M2
Ho will be refused and Ha will be received if the value of Fratio
≥ Ftable in a particular real degree and particular degree of freedom.
After getting data, the data are analyzed by using double ANAVA.
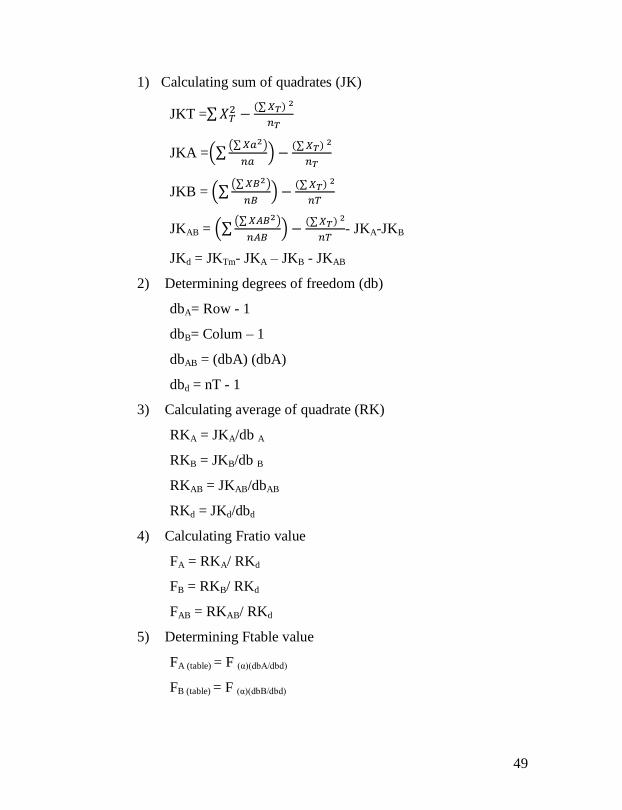
The steps are as follow:
49
1) Calculating sum of quadrates (JK)
JKT =∑
∑
JKA =(∑(∑ )
)
∑
JKB = (∑(∑ )
)
∑
JKAB = (∑(∑ )
)
∑
- JKA-JKB
JKd = JKTm- JKA – JKB - JKAB
2) Determining degrees of freedom (db)
dbA= Row - 1
dbB= Colum – 1
dbAB = (dbA) (dbA)
dbd = nT - 1
3) Calculating average of quadrate (RK)
RKA = JKA/db A
RKB = JKB/db B
RKAB = JKAB/dbAB
RKd = JKd/dbd
4) Calculating Fratio value
FA = RKA/ RKd
FB = RKB/ RKd
FAB = RKAB/ RKd
5) Determining Ftable value
FA (table) = F (α)(dbA/dbd)
FB (table) = F (α)(dbB/dbd)
50
FAB (table) = F (α)(dbAB/dbd)
6) Examining hypothesis by compare Fratio with Ftable
Examination criteria:
- if Fratio < Ftable
So, Ho is not receivable.
- If Fratio > Ftable
So, Ha is receivable.
But for the use of manual way of double ANAVA, the
researcher used Walisongo Statistics (W-stat) application which was
published in 2011 by Ibnu Hadjar. The result of correlation between X
and Y variables is compared with the value (Ft). The table value is 5 %
or 1 %. Fratio > Ftabel is significant or there is differences between
students’ achievement of pre-test and post –test between experimental
group and control group.
51
CHAPTER IV
FINDINGS AND DISCUSSION
This chapter presents the data that were collected during the
experimental research. This analysis focuses on the overview MTs.
Nahdlatusy Syubban Sayung Demak, and the result of pre & post test
which were done both in experimental and control group.
A. Profile of the School
This research was conducted in MTs. Nahdlatusy Syubban
Sayung Demak which is located in street Raya Semarang – Demak
Km 10. The profile of the school is as follow.
Name of school : MTs. Nahdlatusy Syubban
Address : Street Raya Semarang – Demak Km. 10
Village : Purwosari
Subdistrict : Sayung
Regency : Demak
1. Name of Organizer : Nahdlotul Ulama
2. NSS : 2040 32408502
3. Year of Existence : 1967
4. Year of Operational : 1967
5. The Tool and Infrastructure
The tools that are available in MTs Nahlatusy Syubban Sayung
Demak are as follow:
- Classroom : 18
- office room : 4
52
- Head master room : 1
- Teacher room : 2
- Student’s toilet : 5
- Teacher’s toilet : 2
- Football field : 1
6. The Number of Teachers and official employees
The number of teacher and employee in MTs. Nahdlatusy
Syubban Sayung Demak is 21. It consists of 5 permanent
teachers, 3 non permanent teacher, 7 PNS teachers, 12
administration staffs and 2 school keepers.
7. The Perspective and Mission of the School
The perspective of MTs. Nahdlatusy Syubban Sayung
Demak
The perspective of MTs. Nahdlatusy Syubban Sayung
Demak is to raise the multiple intelegence of students with
the base of faith and good fearing.
The mission of MTs. Nahdlatusy Syubban Sayung Demak
To reach the perspective that was mentioned above, there
are some missions to do:
1) To organize the education with respect and trying to
raise all the potential of students.
2) To reinforce the characteristic of education to achieve
students those have a certain character.
53
3) To equip students with a various skill of their life and
productive enterprises to establish entrepreneurship
mentally.
4) To develop the attitudes open with the mastery of
language and technology information.
5) To preserve and develop the local culture as identify
of students.
B. Analysis of Data
The research had been conducted since March 9th
of 2015 to
March 25th
of 2015 in Mts Nahdlatusy Syubban Sayung Demak.
This research had been carried through 4 steps. They involved pre-
test, two times treatment and post-test.
The experimental class (class IX B) was given a pre-test on
March 12, 2015 and control class (class IX A) was given a pre-test
on March 13, 2015. They were asked to make a procedure text
based on their own knowledge.
Before the activities were conducted, the researcher
determined the materials and lesson plan of learning. The learning
process in the experimental class used picture as a medium, while
the control class without using picture.
The data in this study were gotten from the test result, as
follow:
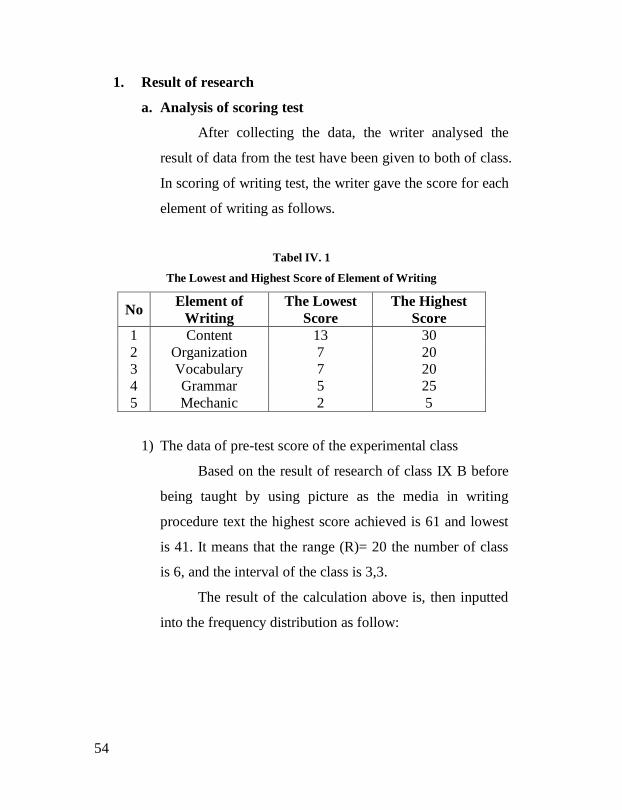
54
1. Result of research
a. Analysis of scoring test
After collecting the data, the writer analysed the
result of data from the test have been given to both of class.
In scoring of writing test, the writer gave the score for each
element of writing as follows.
Tabel IV. 1
The Lowest and Highest Score of Element of Writing
No Element of
Writing
The Lowest
Score
The Highest
Score
1 Content 13 30
2 Organization 7 20
3 Vocabulary 7 20
4 Grammar 5 25
5 Mechanic 2 5
1) The data of pre-test score of the experimental class
Based on the result of research of class IX B before
being taught by using picture as the media in writing
procedure text the highest score achieved is 61 and lowest
is 41. It means that the range (R)= 20 the number of class
is 6, and the interval of the class is 3,3.
The result of the calculation above is, then inputted
into the frequency distribution as follow:
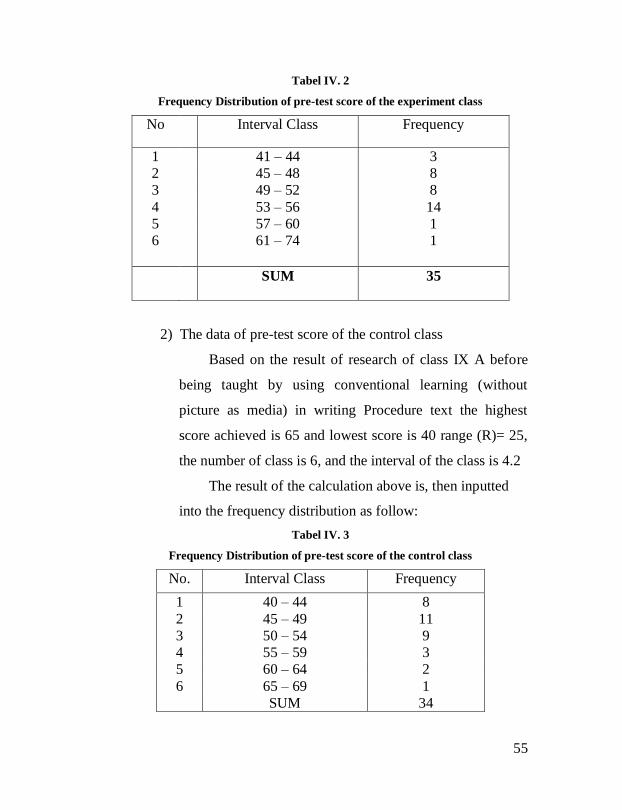
55
Tabel IV. 2
Frequency Distribution of pre-test score of the experiment class
No Interval Class Frequency
1 41 – 44 3
2 45 – 48 8
3 49 – 52 8
4 53 – 56 14
5 57 – 60 1
6 61 – 74 1
SUM 35
2) The data of pre-test score of the control class
Based on the result of research of class IX A before
being taught by using conventional learning (without
picture as media) in writing Procedure text the highest
score achieved is 65 and lowest score is 40 range (R)= 25,
the number of class is 6, and the interval of the class is 4.2
The result of the calculation above is, then inputted
into the frequency distribution as follow:
Tabel IV. 3
Frequency Distribution of pre-test score of the control class
No. Interval Class Frequency
1 40 – 44 8
2 45 – 49 11
3 50 – 54 9
4 55 – 59 3
5 60 – 64 2
6 65 – 69 1
SUM 34
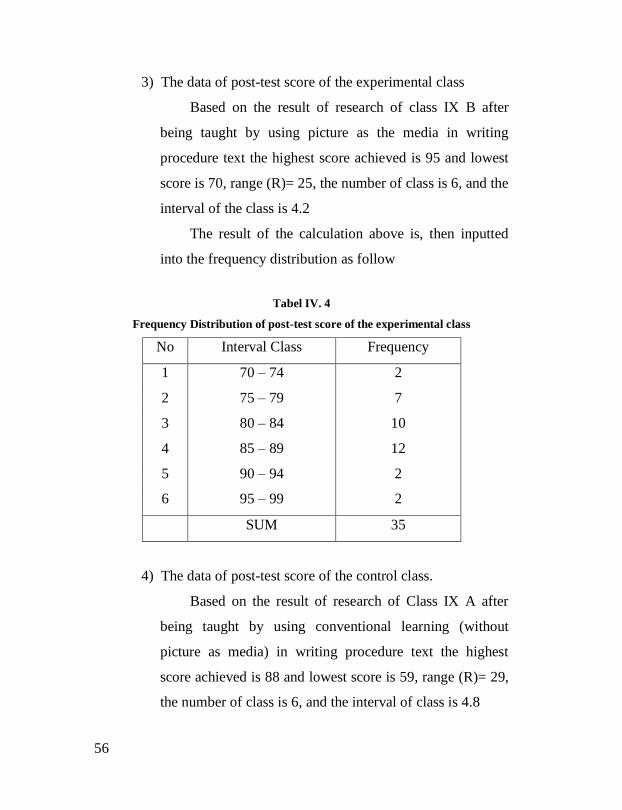
56
3) The data of post-test score of the experimental class
Based on the result of research of class IX B after
being taught by using picture as the media in writing
procedure text the highest score achieved is 95 and lowest
score is 70, range (R)= 25, the number of class is 6, and the
interval of the class is 4.2
The result of the calculation above is, then inputted
into the frequency distribution as follow
Tabel IV. 4
Frequency Distribution of post-test score of the experimental class
No Interval Class Frequency
1 70 – 74 2
2 75 – 79 7
3 80 – 84 10
4 85 – 89 12
5 90 – 94 2
6 95 – 99 2
SUM 35
4) The data of post-test score of the control class.
Based on the result of research of Class IX A after
being taught by using conventional learning (without
picture as media) in writing procedure text the highest
score achieved is 88 and lowest score is 59, range (R)= 29,
the number of class is 6, and the interval of class is 4.8
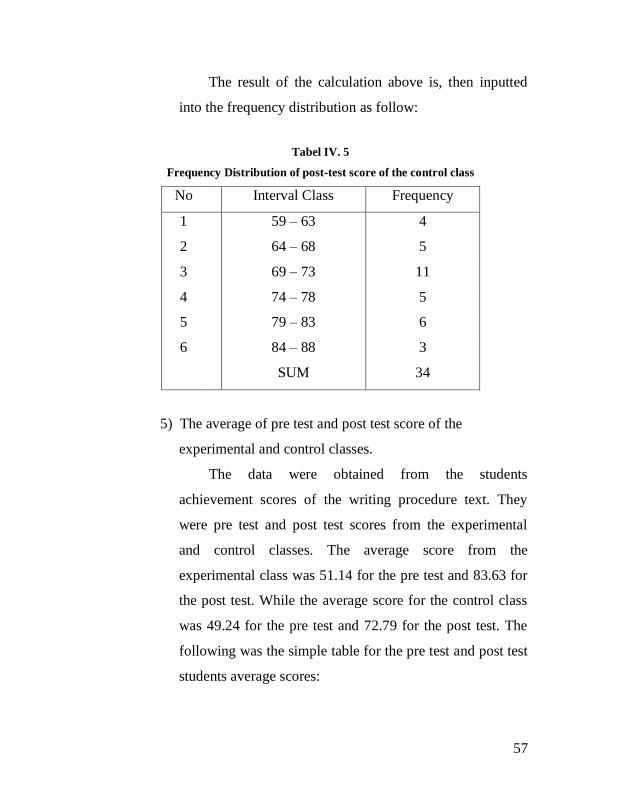
57
The result of the calculation above is, then inputted
into the frequency distribution as follow:
Tabel IV. 5
Frequency Distribution of post-test score of the control class
No Interval Class Frequency
1 59 – 63 4
2 64 – 68 5
3 69 – 73 11
4 74 – 78 5
5 79 – 83 6
6 84 – 88 3
SUM 34
5) The average of pre test and post test score of the
experimental and control classes.
The data were obtained from the students
achievement scores of the writing procedure text. They
were pre test and post test scores from the experimental
and control classes. The average score from the
experimental class was 51.14 for the pre test and 83.63 for
the post test. While the average score for the control class
was 49.24 for the pre test and 72.79 for the post test. The
following was the simple table for the pre test and post test
students average scores:
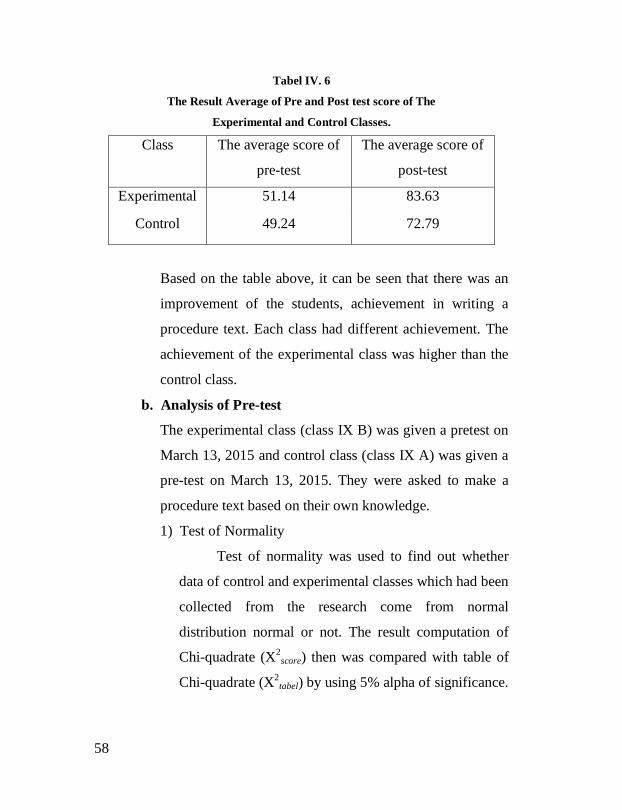
58
Tabel IV. 6
The Result Average of Pre and Post test score of The
Experimental and Control Classes.
Class The average score of
pre-test
The average score of
post-test
Experimental 51.14 83.63
Control 49.24 72.79
Based on the table above, it can be seen that there was an
improvement of the students, achievement in writing a
procedure text. Each class had different achievement. The
achievement of the experimental class was higher than the
control class.
b. Analysis of Pre-test
The experimental class (class IX B) was given a pretest on
March 13, 2015 and control class (class IX A) was given a
pre-test on March 13, 2015. They were asked to make a
procedure text based on their own knowledge.
1) Test of Normality
Test of normality was used to find out whether
data of control and experimental classes which had been
collected from the research come from normal
distribution normal or not. The result computation of
Chi-quadrate (X2
score) then was compared with table of
Chi-quadrate (X2
tabel) by using 5% alpha of significance.
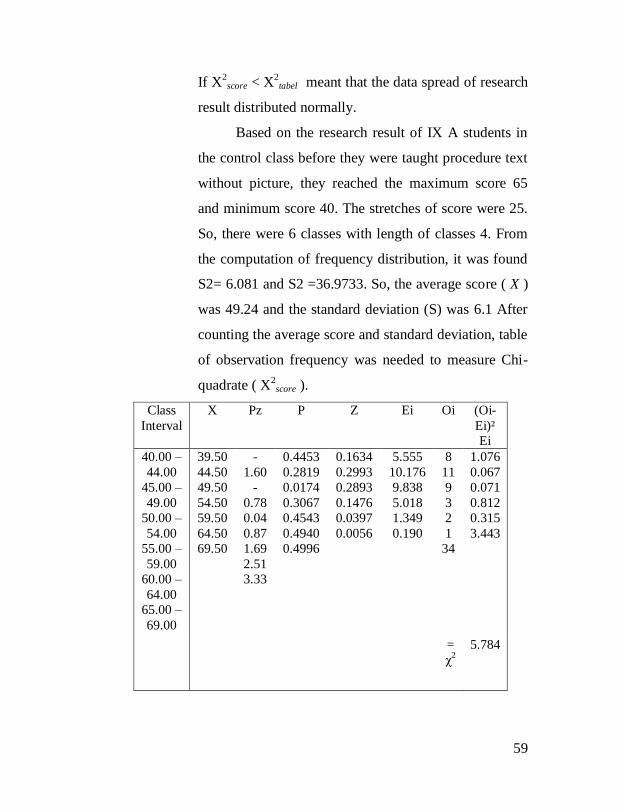
59
If X2
score < X2
tabel meant that the data spread of research
result distributed normally.
Based on the research result of IX A students in
the control class before they were taught procedure text
without picture, they reached the maximum score 65
and minimum score 40. The stretches of score were 25.
So, there were 6 classes with length of classes 4. From
the computation of frequency distribution, it was found
S2= 6.081 and S2 =36.9733. So, the average score ( X )
was 49.24 and the standard deviation (S) was 6.1 After
counting the average score and standard deviation, table
of observation frequency was needed to measure Chi-
quadrate ( X2
score ).
Class
Interval
X Pz P Z Ei Oi (Oi-
Ei)²
Ei
40.00 –
44.00
45.00 –
49.00
50.00 –
54.00
55.00 –
59.00
60.00 –
64.00
65.00 –
69.00
39.50
44.50
49.50
54.50
59.50
64.50
69.50
-
1.60
-
0.78
0.04
0.87
1.69
2.51
3.33
0.4453
0.2819
0.0174
0.3067
0.4543
0.4940
0.4996
0.1634
0.2993
0.2893
0.1476
0.0397
0.0056
5.555
10.176
9.838
5.018
1.349
0.190
8
11
9
3
2
1
34
1.076
0.067
0.071
0.812
0.315
3.443
=
χ2
5.784
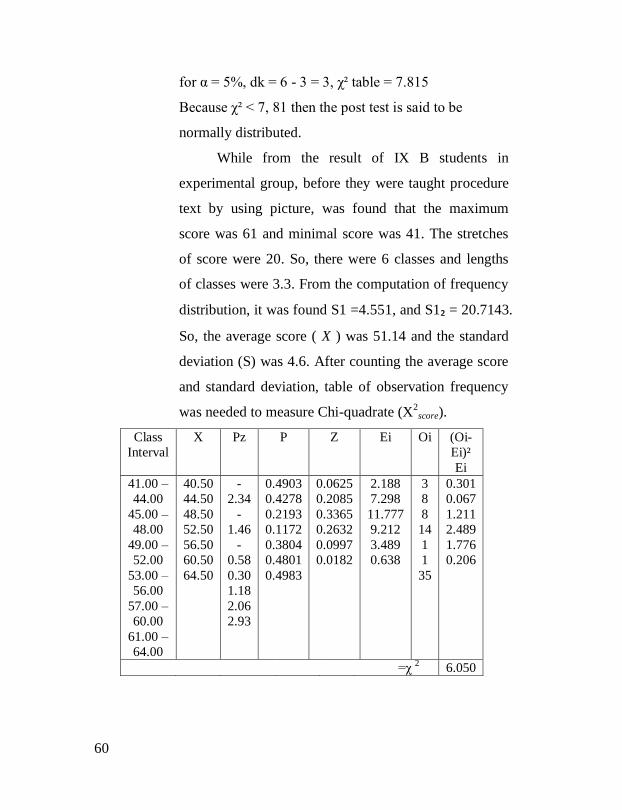
60
for α = 5%, dk = 6 - 3 = 3, χ² table = 7.815
Because χ² < 7, 81 then the post test is said to be
normally distributed.
While from the result of IX B students in
experimental group, before they were taught procedure
text by using picture, was found that the maximum
score was 61 and minimal score was 41. The stretches
of score were 20. So, there were 6 classes and lengths
of classes were 3.3. From the computation of frequency
distribution, it was found S1 =4.551, and S1₂ = 20.7143.
So, the average score ( X ) was 51.14 and the standard
deviation (S) was 4.6. After counting the average score
and standard deviation, table of observation frequency
was needed to measure Chi-quadrate (X2
score).
Class
Interval
X Pz P Z Ei Oi (Oi-
Ei)²
Ei
41.00 –
44.00
45.00 –
48.00
49.00 –
52.00
53.00 –
56.00
57.00 –
60.00
61.00 –
64.00
40.50
44.50
48.50
52.50
56.50
60.50
64.50
-
2.34
-
1.46
-
0.58
0.30
1.18
2.06
2.93
0.4903
0.4278
0.2193
0.1172
0.3804
0.4801
0.4983
0.0625
0.2085
0.3365
0.2632
0.0997
0.0182
2.188
7.298
11.777
9.212
3.489
0.638
3
8
8
14
1
1
35
0.301
0.067
1.211
2.489
1.776
0.206
=χ 2
6.050
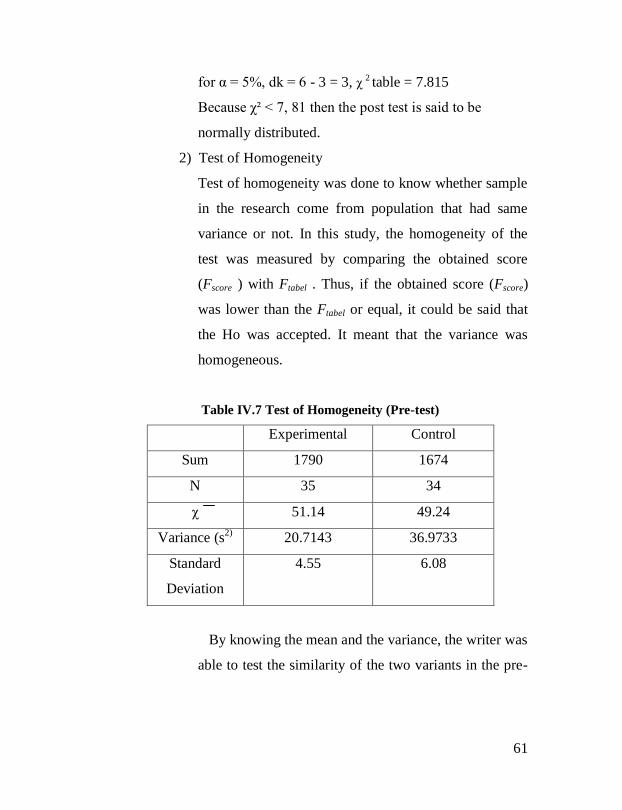
61
for α = 5%, dk = 6 - 3 = 3, χ 2 table = 7.815
Because χ² < 7, 81 then the post test is said to be
normally distributed.
2) Test of Homogeneity
Test of homogeneity was done to know whether sample
in the research come from population that had same
variance or not. In this study, the homogeneity of the
test was measured by comparing the obtained score
(Fscore ) with Ftabel . Thus, if the obtained score (Fscore)
was lower than the Ftabel or equal, it could be said that
the Ho was accepted. It meant that the variance was
homogeneous.
Table IV.7 Test of Homogeneity (Pre-test)
Experimental Control
Sum 1790 1674
N 35 34
χ 51.14 49.24
Variance (s2)
20.7143 36.9733
Standard
Deviation
4.55 6.08
By knowing the mean and the variance, the writer was
able to test the similarity of the two variants in the pre-
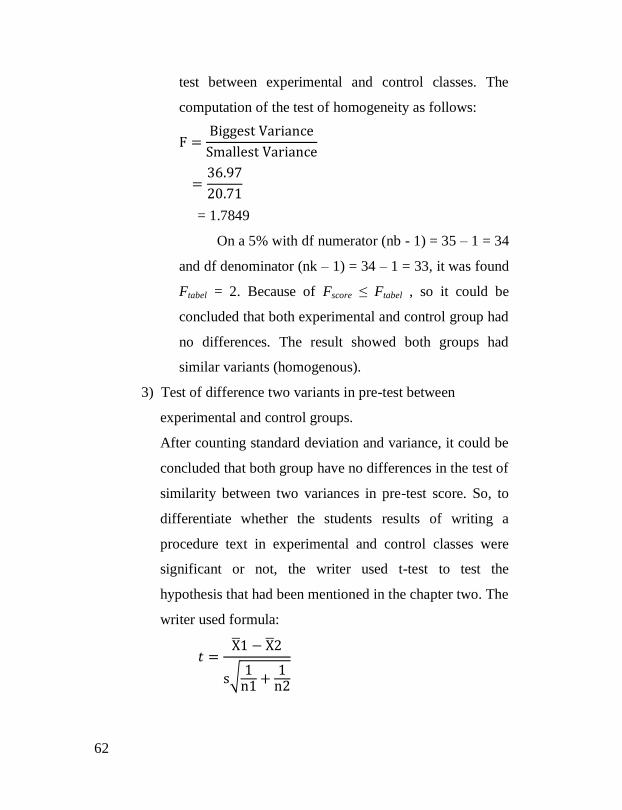
62
test between experimental and control classes. The
computation of the test of homogeneity as follows:
= 1.7849
On a 5% with df numerator (nb - 1) = 35 – 1 = 34
and df denominator (nk – 1) = 34 – 1 = 33, it was found
Ftabel = 2. Because of Fscore ≤ Ftabel , so it could be
concluded that both experimental and control group had
no differences. The result showed both groups had
similar variants (homogenous).
3) Test of difference two variants in pre-test between
experimental and control groups.
After counting standard deviation and variance, it could be
concluded that both group have no differences in the test of
similarity between two variances in pre-test score. So, to
differentiate whether the students results of writing a
procedure text in experimental and control classes were
significant or not, the writer used t-test to test the
hypothesis that had been mentioned in the chapter two. The
writer used formula:
√
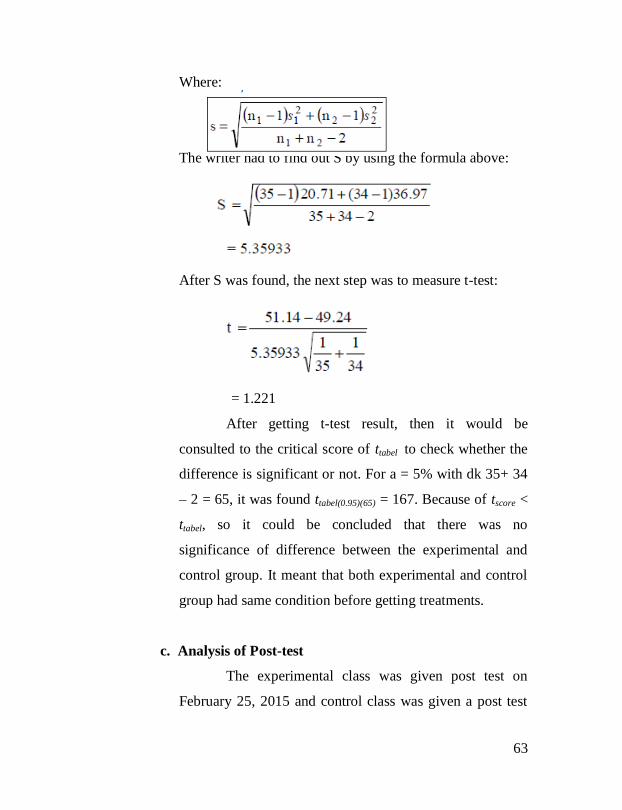
63
Where:
The writer had to find out S by using the formula above:
After S was found, the next step was to measure t-test:
= 1.221
After getting t-test result, then it would be
consulted to the critical score of ttabel to check whether the
difference is significant or not. For a = 5% with dk 35+ 34
– 2 = 65, it was found ttabel(0.95)(65) = 167. Because of tscore <
ttabel, so it could be concluded that there was no
significance of difference between the experimental and
control group. It meant that both experimental and control
group had same condition before getting treatments.
c. Analysis of Post-test
The experimental class was given post test on
February 25, 2015 and control class was given a post test
64
on February 25, 2015. Post-test was conducted after all
treatments were done. Picture was used as aid in the
teaching of procedure writing to students in experimental
class. Meanwhile, the students in control class were given
treatment without picture. Post-test was aimed to measure
students ability after they got treatments.
1. Test of Normality
Test of normality was used to find out whether
data of control and experimental classes, which had
been collected after they got treatments, came from
normal distribution normal or not. The formula, that
was used, was Chi-quadrate. The result computation of
Chi-quadrate (X2
score) then was compared with table of
Chi-quadrate (X2
tabel) by using 5% alpha of significance.
If X2
score < X2
tabel meant that the data spread of research
result distributed normally.
Based on the research result of students in the
control class after they got usual treatments (using text)
in the teaching of procedure writing, they reached the
maximum score 88 and minimum score 59. The
stretches of score were 29. So, there were 6 classes with
length of classes 5. From the computation of frequency
distribution, it was found s2 = 7.623, and s22= 58.1978.
So, the average score (X) was 72.8 and the standard
deviation (S) was 7,6. It meant that there was an
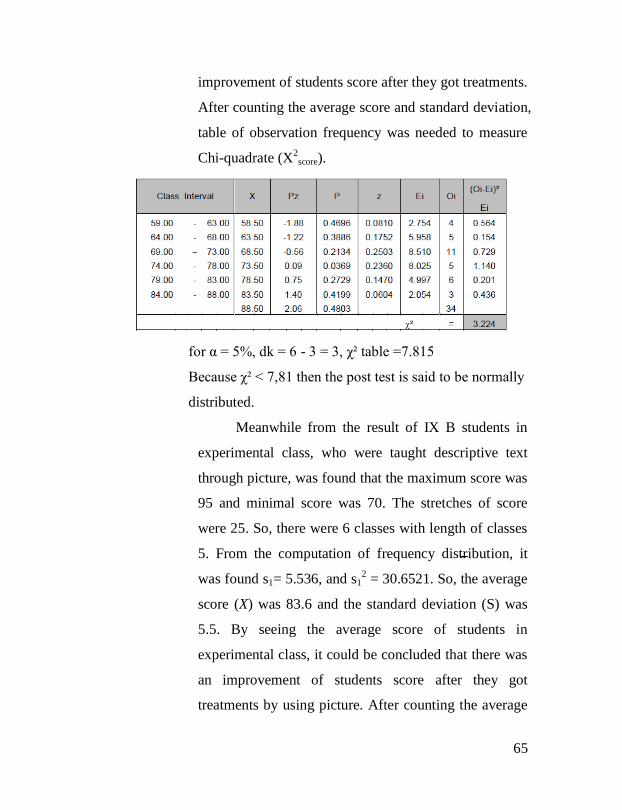
65
improvement of students score after they got treatments.
After counting the average score and standard deviation,
table of observation frequency was needed to measure
Chi-quadrate (X2
score).
for α = 5%, dk = 6 - 3 = 3, χ² table =7.815
Because χ² < 7,81 then the post test is said to be normally
distributed.
Meanwhile from the result of IX B students in
experimental class, who were taught descriptive text
through picture, was found that the maximum score was
95 and minimal score was 70. The stretches of score
were 25. So, there were 6 classes with length of classes
5. From the computation of frequency distribution, it
was found s1= 5.536, and s12 = 30.6521. So, the average
score (X) was 83.6 and the standard deviation (S) was
5.5. By seeing the average score of students in
experimental class, it could be concluded that there was
an improvement of students score after they got
treatments by using picture. After counting the average

66
score and standard deviation, table of observation
frequency was needed to measure Chi-quadrate (X2
score).
for α = 5%, , dk = 6 - 3 = 3, χ² table =7.815
Because χ² < 7,81 then the post test is said to be normally
distributed.
2. Test of Homogeneity
The writer determined the mean and variance of the
students score either in experimental or control classes. By
knowing the mean and variance, the writer was able to test
the similarity of the two variance in the post-test between
experimental and control classes.
Table IV.8 Test of Homogeneity (Post-test)
Experimental Control
Sum 2927 2475
N 35 34
χ 83.63 72.79
Variance (s2)
30.6521 58.1078
Standart
Deviasi
5.54 7.62
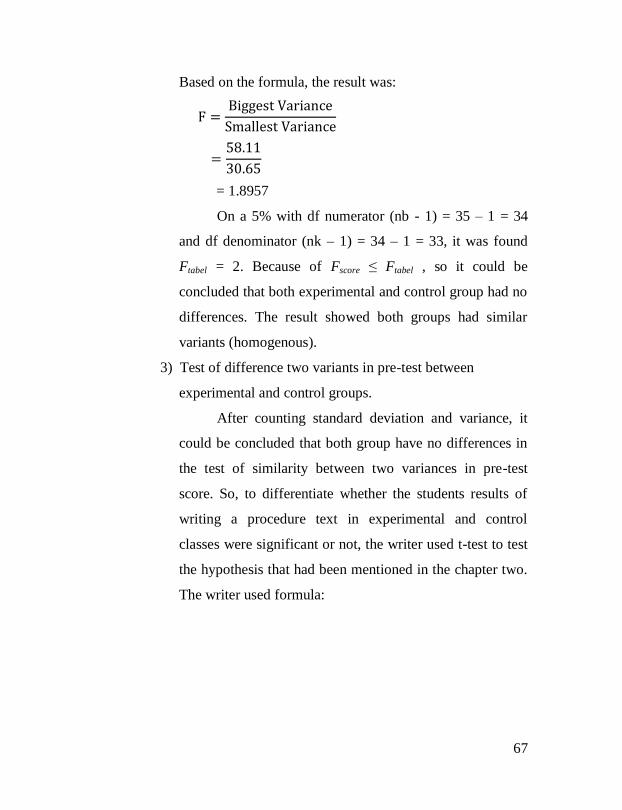
67
Based on the formula, the result was:
= 1.8957
On a 5% with df numerator (nb - 1) = 35 – 1 = 34
and df denominator (nk – 1) = 34 – 1 = 33, it was found
Ftabel = 2. Because of Fscore ≤ Ftabel , so it could be
concluded that both experimental and control group had no
differences. The result showed both groups had similar
variants (homogenous).
3) Test of difference two variants in pre-test between
experimental and control groups.
After counting standard deviation and variance, it
could be concluded that both group have no differences in
the test of similarity between two variances in pre-test
score. So, to differentiate whether the students results of
writing a procedure text in experimental and control
classes were significant or not, the writer used t-test to test
the hypothesis that had been mentioned in the chapter two.
The writer used formula:
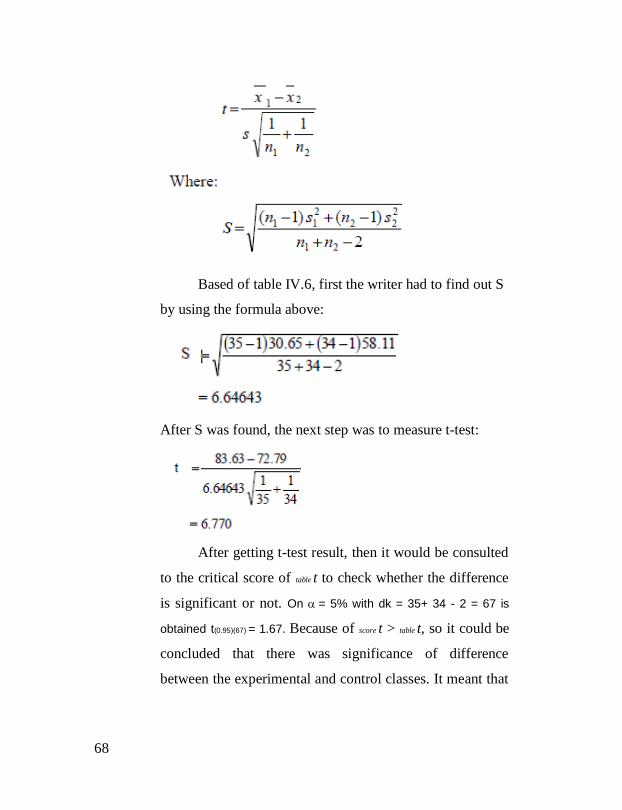
68
Based of table IV.6, first the writer had to find out S
by using the formula above:
After S was found, the next step was to measure t-test:
After getting t-test result, then it would be consulted
to the critical score of table t to check whether the difference
is significant or not. On = 5% with dk = 35+ 34 - 2 = 67 is
obtained t(0.95)(67) = 1.67. Because of score t > table t, so it could be
concluded that there was significance of difference
between the experimental and control classes. It meant that
69
experimental class was better that control class after
getting treatments.
Since the obtained t-score was higher than the
critical score on the table, the difference was statistically
significance. Therefore, based on the computation there
was a significance difference between the teaching of
procedure text using picture and the teaching of procedure
text without picture for the nine grade students of MTs
Nahdlatusy Syubban Sayung Demak. Teaching procedure
with picture seemed to be more effective than teaching
procedure without picture. It can be seen from the result of
the test where the students taught writing by using picture
got higher scores than the students taught writing without
picture.
4. Analysis of Variance (ANAVA)
In examining ANAVA, the researcher used Walisongo
Statistic (W-Stat) application which was published in 2011
by Ibnu Hadjar. Here is the result of variance analysis:
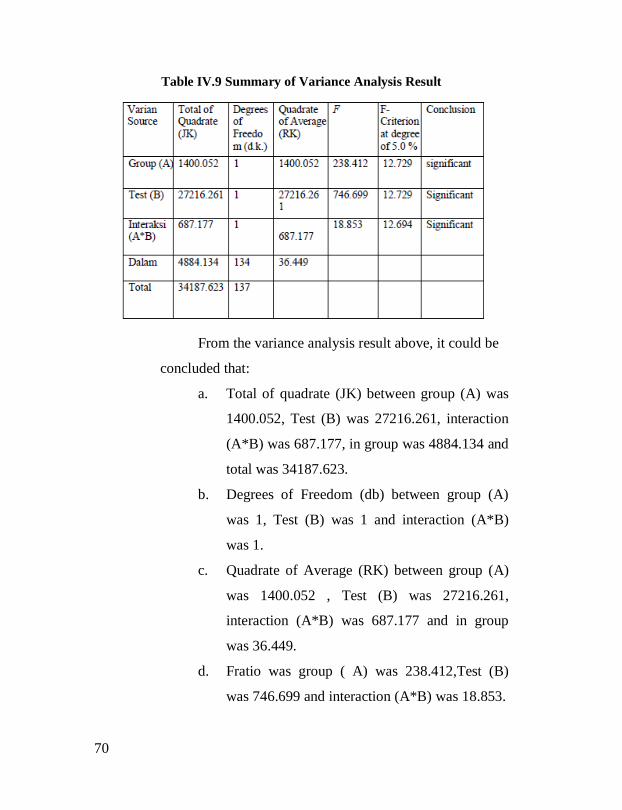
70
Table IV.9 Summary of Variance Analysis Result
From the variance analysis result above, it could be
concluded that:
a. Total of quadrate (JK) between group (A) was
1400.052, Test (B) was 27216.261, interaction
(A*B) was 687.177, in group was 4884.134 and
total was 34187.623.
b. Degrees of Freedom (db) between group (A)
was 1, Test (B) was 1 and interaction (A*B)
was 1.
c. Quadrate of Average (RK) between group (A)
was 1400.052 , Test (B) was 27216.261,
interaction (A*B) was 687.177 and in group
was 36.449.
d. Fratio was group ( A) was 238.412,Test (B)
was 746.699 and interaction (A*B) was 18.853.
71
e. Ftable at degree of 5 % was 12.729
f. From the variance analysis result, it could be
concluded that the result of group (A) was
significant, test (B) was significant and
interaction (A*B) was significant in degree of
5%.
C. Discussion
1. The score of initial ability in the Pre test
Based on the research result of IX A students in the
control class before they were taught procedure text without
picture, they reached the maximum score 65 and minimum
score 40. The stretches of score were 25. So, there were 6
classes with length of classes 4. After counting the average
score and standard deviation,χ² was 5.784 and for χ² table was
7.815. Because χ² <7.81 the test is said to be normally
distributed.
While for the result of VIII B in experimental group,
before they were taught procedure text using picture, was found
that the maximum score was 61 and minimum score was 41.
The stretches of score were 20. So there were 6 classes and
lengths of classes were 3.3. After counting the average score
and standard deviation,χ² was 6.050 and for χ² table was 7.815.
id to be normally distributed
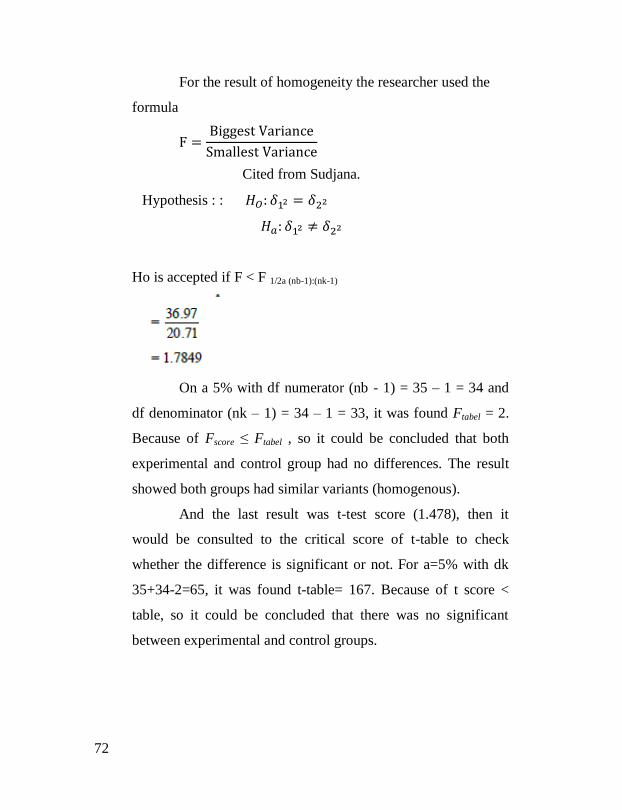
72
For the result of homogeneity the researcher used the
formula
Cited from Sudjana.
Hypothesis : :
Ho is accepted if F < F 1/2a (nb-1):(nk-1)
On a 5% with df numerator (nb - 1) = 35 – 1 = 34 and
df denominator (nk – 1) = 34 – 1 = 33, it was found Ftabel = 2.
Because of Fscore ≤ Ftabel , so it could be concluded that both
experimental and control group had no differences. The result
showed both groups had similar variants (homogenous).
And the last result was t-test score (1.478), then it
would be consulted to the critical score of t-table to check
whether the difference is significant or not. For a=5% with dk
35+34-2=65, it was found t-table= 167. Because of t score <
table, so it could be concluded that there was no significant
between experimental and control groups.
73
2. The score of final ability in the Post test
The result of this research is obtained the average score
of experimental class was 83.63 which were higher than the
result of control class 72.79 The average score of experimental
class was 83.63 and standard deviation (s) was 3.72. Teaching
writing in experimental class by using picture as media to
teaching procedure text can encourage the students to be more
active and motivated. The picture can make students easier to
describe the object. It can be seen on average score of
experimental class which better result than control class.
The average score of control class was 72.79 and
standard deviation (s) was 5.70. Teaching writing in control
class by using conventional method to teaching writing
procedure text make the students feel saturated with object that
usually they describe. The students still had difficult in
transferring their taught and ideas in writing.
Based on the result of calculation, t-test is obtained t
count = 6.770 and t table = 1.67, this showed that t count > t table (t
count higher than t table ). So it means that there is a significant
difference between writing skill improvement of students taught
by picture and taught by conventional learning in writing
procedure text.
3. Students Condition in Control Group
In this study, source of data that was become as control
group was class IX A. In the control group, there was not a new
74
treatment in a teaching learning process. They were given a
usual treatment. They were taught procedure writing using text
as they had got. Using text as an aid in the teaching learning
process, teacher had used a monotonous media that could not
increase students procedure writing. Students could not enjoy in
writing and explore their ideas because they had to write what
they had read from the text. It was proven with the control
groups average in the post-test (72,79) which was lower than
the experimental group (83.63); although, the control groups
average in the pre-test (49.24) and for the experimental group
(51,14).
4. Students Condition in Experimental Group
a. Analysis of Students Writing Before Treatment (Pre-test)
In the pre-test, students ability in writing procedure text was
low. Pre-test was conducted before the treatment. From the
result of pre-test, it was known that students faced many
difficulties in procedure writing. Sentences, which were
made by students, were influenced by Indonesian language.
Students ability was in low level when they had to arrange
sentences to be a good paragraph by considering main idea.
It meant that the idea was not clearly stated and the
sentences were not well-organized to support the main idea.
Students word choice (fluency) was also far from being
perfect. Not only the sequence of sentences which were
made by students was not complete but also there were
75
many difficulties in grammar and mechanic; therefore,
students ability of procedure writing could not be understood.
To minimize the number of students mistakes in their
writing, the researcher collected students writing, gave
correction, and returned the paper to them. From the
correction of their mistakes, students were supposed to learn
more and improve their ability in procedure writing.
b. Analysis of Students Writing After Treatment (Post-test)
In the term of the product of the students work,
students ability were collected and analyzed on the basis of
Burhan which had been provided. Based on the analysis of
students ability, it was found that students‟ ability after
getting treatment improved. In the treatment, students were
given picture that was in line with the function of procedure
text, its linguistic features, and its generic structure.
Based on Burhan Nurgiyanto as the indicator of the
students ability in procedure writing, the finding showed that
students ability was in good level; although, there were still
some mistakes that students had made like grammar. So, it
could be concluded that the implementation of using picture
as media in the teaching writing procedure text was very
effective. It was proven with students‟ average score in
experimental group was higher than control group. By
considering the students‟ final score after getting treatment,
76
the teaching of procedure text using picture as media was
better than without picture (text).
Based on t-test analysis that was done, it was found
that the t-score (6,770) was higher than t-table by using 5%
alpha of significance (1.67). Since score t > table t , it
proved that there was a significant difference between the
improvement of students achievement .
75
CHAPTER V
CONCLUSION AND SUGGESTION
A. Conclusion
The conclusion of this research is drawn in accordance
with the result of the data analysis in the previous chapter. There
are some significant differences between experimental and control
class. Based on the finding and discussion in chapter IV, It could
be concluded that:
1. The achievement of the experimental class was higher than the
control class In the result of post test of experimental class was
83,63 which higher than the control class 72,79. It means that
writing a procedure text by using picture as media was better
than the writing procedure text without picture.
2. The t score was higher than the table t score 6.7700, there was
a significant difference in the achievement between students in
IXA who were taught procedure text using the picture and
student in class IXB who were taught procedure text without
using picrure.
B. Suggestions
From the conclusion above, there are some suggestions
that are proposed by the writer:
76
1. For Teacher
a. Teacher may consider using picture become alternative
media in teaching writing especially in a procedure text.
Because it can inspire students mind what they have to write.
By looking a picture, students will not find difficulties in
getting an idea to write.
b. The teacher can find the references of the picture from
magazine, book, newspaper, internet, or make the picture by
themselves based on their creativities in order to get the
students interest in writing activities.
c. Before teaching and learning process, the teacher should
prepare the media well. It means that before using the
picture as a media in teaching writing, it will be better if the
teacher check the qualities of equipment are well, besides,
the text is appropriate to their level or not.
2. For Students
a. The students should pay attention to the teacher
b. The students should learn the elements of good writing
especially grammar and its application in the writing process
c. Students should be more interested in English lesson.
d. Students should be more respond in learning process
e. The students should practice their ability of writing from the
simple to the complex.
77
3. For next researchers
The writer hopes to next researchers who intend to use
an interesting media like picture in teaching learning process;
he or she must prepare the equipment are used by having a good
preparation.
C. Closing
Giving the true praise only to Allah almighty, who gives
power, spirit and power until this final project can be finished. The
writer realizes this paper is far from being perfect, because of that;
constructive critics and advice are really expected for the perfection of
the thesis. Hopefully, this thesis will be useful for all of us. Amin.
BIBLIOGRAPHY
Aeni, Anik Nur, The Use of Pictures as Media in Teaching Speaking,
Semarang: Walisongo State Institute for Islamic Studies, 2009,
Unpublished Thesis.
Anderson, Mark and Kathy Anderson, Text Types in English I, South
Yarra: Macmillan Education Malaysia, 1997.
Arikunto, Suharsimi, Prosedur Penelitian: Suatu Pendekatan Praktik,
13th ed., Jakarta: PT Rineka Cipta, 2006.
Arsyad, Azhar, Media Pembelajaran, Jakarta: PT Raja Grafindo
Persada, 2003.
Celce, Marianne-Murcia and Olshtain Elite, Disscouse and Context in
Language Teaching, (New York: Cambridge University Press,
2000.
Chandler, Daniel, An Introducing of Genre Theory, Retrieved on
Monday, March 22rd
2010 at 11.30 WIB from
http//aberac.UK/media.document/ingenre1.html
Douglas, Brown, Teaching by Principle: An Interactive Approach to
Language Pedagogy, San Fransisco: Longman Pearson Education,
2001, 2nd
edition.
Principle of Language Learning and Teaching, San Fransisco:
Longman Pearson Education, 2000, 4th edition.
Finocchiaro, Mary, English as a Second Language: From Theory to
Practice, New York: New York Regent Publishing Company,
Inc., 1974.
Hajar, Ibnu, Dasar-dasar Metodologi Penelitian Kuantitatif dalam
Pendidikan, Jakarta: PT Raja Grafindo Persada, 1990.
Hamalik, Oemar, Metode Belajar dan Kesulitan-kesulitan Belajar,
Bandung: Tarsito, 1985.
Hammond, Jenny and Friends, English for Social Purpose, Australia:
Macqua
Harmer, Jeremy, How to Teach Writing, England: Pearson Education
Limited, 2004.
Horland, Retrieved on Friday, March 12th
2010 at 16.05 from
http//www.brainyquote.com/words/te/tex.229385.html
Hornby, A. S., Oxford Advanced Learners Dictionary, New York:
Oxford University Press, 1995.
Hyland, Ken, Teaching and Researching Writing, London: Longman,
2002.
L. Gerrot and P. Wignell, Making Sense of Functional Grammar,
Sidney: Antepodean Educational Enterprises, 1995.
Longman Advanced American Dictionary, America: Printed by U.S,
2000.
Linse, T. Caroline, Practical English Language Teaching: Young
Learners, New York: MC Graw Hill, 2006.
Master, Peter, Responses to ESP, San Jose State University, 1998.
Nagaraj, G., English Language Teaching; Approach, Methods,
Techniques, Orient: Longman Ltd., 1990.
Nurgiyantoro, Burhan, Penilaian dalam Pengajaran Bahasa dan
Sastra, 3rd ed., Yogyakarta: BPFE, 2001.
Penelitian dalam Pengajaran Bahasa dan Sastra, Yogyakarta: BPFE,
2001
O’Malley J. Michael and Lorraine Valdez Pierce, Authentic Assesment
for English Language Learners Practical Approaches for
Teacher, Great Britain: Longman, 1996.
Oxford, Oxford Learns Pocket Dictionary, New York: Oxford
University Press, 4th
edition, 2008.
Prasetyani, Dian Candra, A Study on the Ability in Writing A Recount
Text By Using Pictures, Semarang: English of Languages and
Arts Semarang State University, 2006, Unpublished Thesis.
Raimes, Ann, Teaching English as A Second Language; from Theory
to Practice, New York: Regent Publishing Company, 1974.
Ramelan, Introduction to Linguistic Analysis, Semarang: IKIP
Semarang Press, 1992.
Richards C. Jack, Hull. Jonathan, Proctor. Susan, New Interchange
English for International Communication, New York: Cambridge
University Press, 1998.
Richards Jack and Friends, Longman Dictionary of Applied
Linguistics, England: Longman, 1990.
Sudjana, Metoda Statistika,
Sugijono, Statistika untuk Penelitian, Bandung: Alfabet, 2007.
Swales, J., Genre Analysis, UK: Cambridge University Press, 1990.
Zuhriyah, Nurul, Metodologi Penelitian Sosial dan Pendidikan: Teori
dan Aplikasi, Jakarta: PT Bumi Aksara, 2009.
Http://en.wikipedia.org/wiki/analysisofvariance, retrieved on 19th
December 2011
Http://www.cssemonashedu.au/smarkham/resources/anova.html,
retrieved on 19th
March 2015
Http://explorable.com/experimental.research, retrieved on 5th March
2015
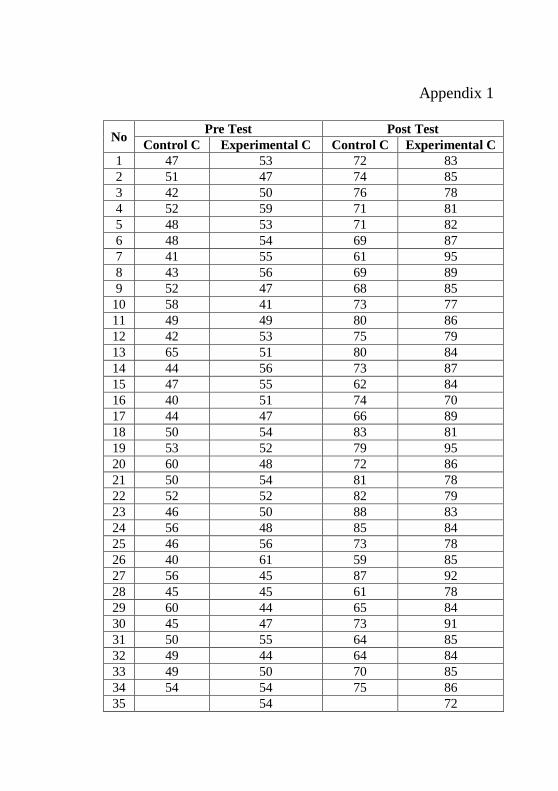
Appendix 1
No Pre Test Post Test
Control C Experimental C Control C Experimental C
1 47 53 72 83
2 51 47 74 85
3 42 50 76 78
4 52 59 71 81
5 48 53 71 82
6 48 54 69 87
7 41 55 61 95
8 43 56 69 89
9 52 47 68 85
10 58 41 73 77
11 49 49 80 86
12 42 53 75 79
13 65 51 80 84
14 44 56 73 87
15 47 55 62 84
16 40 51 74 70
17 44 47 66 89
18 50 54 83 81
19 53 52 79 95
20 60 48 72 86
21 50 54 81 78
22 52 52 82 79
23 46 50 88 83
24 56 48 85 84
25 46 56 73 78
26 40 61 59 85
27 56 45 87 92
28 45 45 61 78
29 60 44 65 84
30 45 47 73 91
31 50 55 64 85
32 49 44 64 84
33 49 50 70 85
34 54 54 75 86
35 54 72
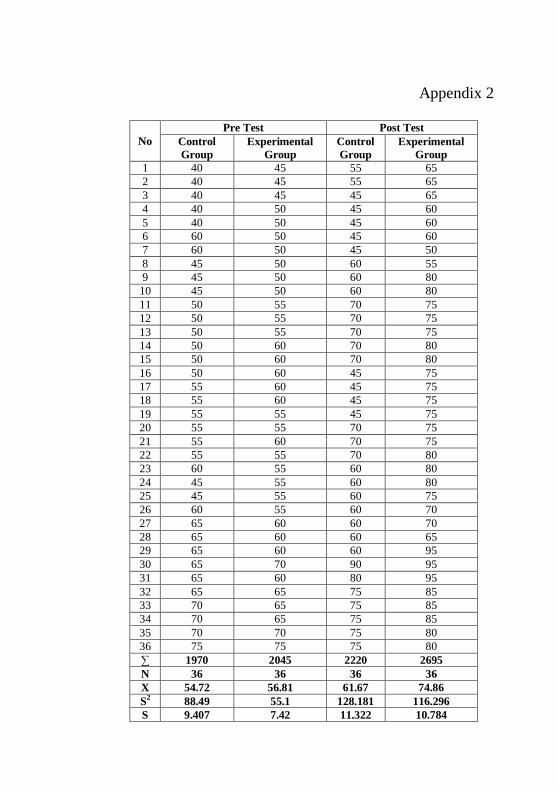
Appendix 2
No
Pre Test Post Test
Control
Group
Experimental
Group
Control
Group
Experimental
Group
1 40 45 55 65
2 40 45 55 65
3 40 45 45 65
4 40 50 45 60
5 40 50 45 60
6 60 50 45 60
7 60 50 45 50
8 45 50 60 55
9 45 50 60 80
10 45 50 60 80
11 50 55 70 75
12 50 55 70 75
13 50 55 70 75
14 50 60 70 80
15 50 60 70 80
16 50 60 45 75
17 55 60 45 75
18 55 60 45 75
19 55 55 45 75
20 55 55 70 75
21 55 60 70 75
22 55 55 70 80
23 60 55 60 80
24 45 55 60 80
25 45 55 60 75
26 60 55 60 70
27 65 60 60 70
28 65 60 60 65
29 65 60 60 95
30 65 70 90 95
31 65 60 80 95
32 65 65 75 85
33 70 65 75 85
34 70 65 75 85
35 70 70 75 80
36 75 75 75 80
∑ 1970 2045 2220 2695
N 36 36 36 36
X 54.72 56.81 61.67 74.86
S2
88.49 55.1 128.181 116.296
S 9.407 7.42 11.322 10.784
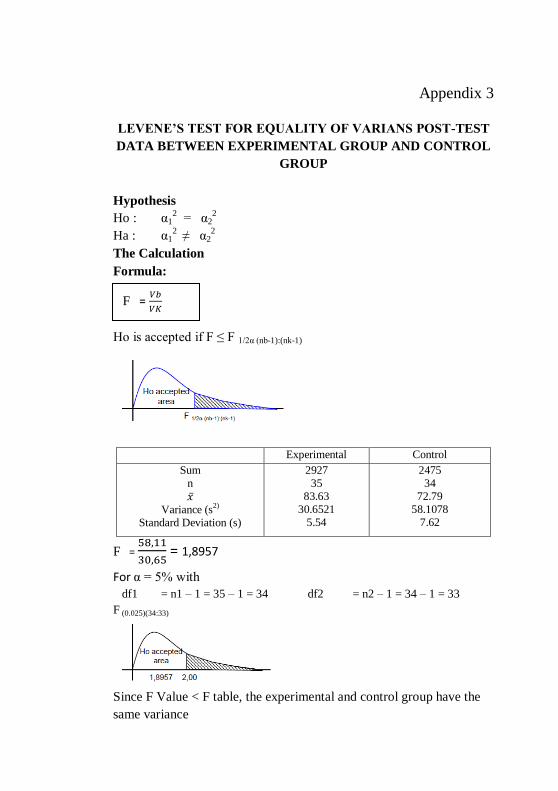
Appendix 3
LEVENE’S TEST FOR EQUALITY OF VARIANS POST-TEST
DATA BETWEEN EXPERIMENTAL GROUP AND CONTROL
GROUP
Hypothesis
Ho : α12 = α2
2
Ha : α12 ≠ α2
2
The Calculation
Formula:
Ho is accepted if F ≤ F 1/2α (nb-1):(nk-1)
Experimental Control
Sum
n
Variance (s2)
Standard Deviation (s)
2927
35
83.63
30.6521
5.54
2475
34
72.79
58.1078
7.62
F =
= 1,8957
For α = 5% with
df1 = n1 – 1 = 35 – 1 = 34 df2 = n2 – 1 = 34 – 1 = 33
F (0.025)(34:33)
Since F Value < F table, the experimental and control group have the
same variance
F =
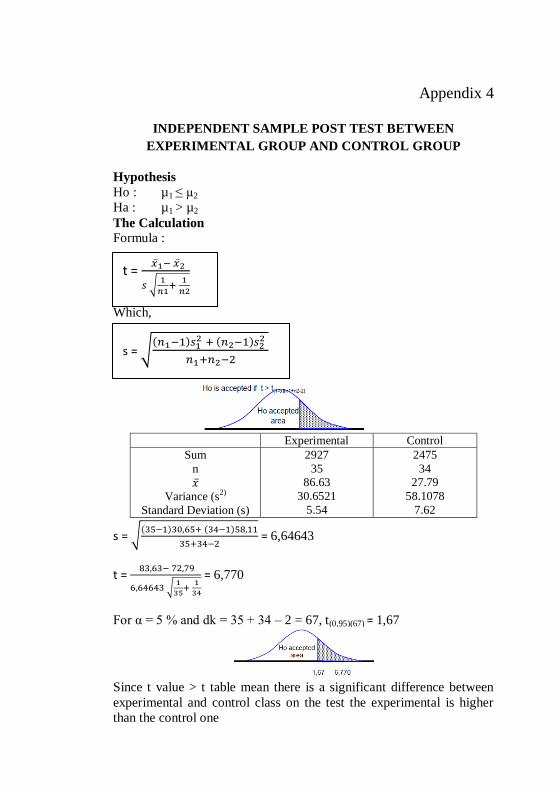
Appendix 4
INDEPENDENT SAMPLE POST TEST BETWEEN
EXPERIMENTAL GROUP AND CONTROL GROUP
Hypothesis
Ho : µ1 ≤ µ2
Ha : µ1 > µ2
The Calculation
Formula :
Which,
Experimental Control
Sum
n
Variance (s2)
Standard Deviation (s)
2927
35 86.63
30.6521
5.54
2475
34 27.79
58.1078
7.62
s = √( ) ( )
= 6,64643
t =
√
= 6,770
For α = 5 % and dk = 35 + 34 – 2 = 67, t(0,95)(67) = 1,67
Since t value > t table mean there is a significant difference between
experimental and control class on the test the experimental is higher
than the control one
t =
√
s = √( )
( )
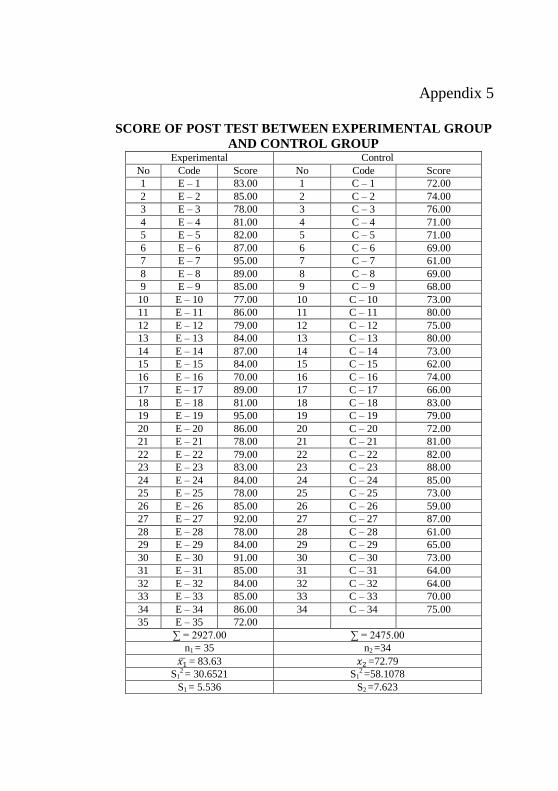
Appendix 5
SCORE OF POST TEST BETWEEN EXPERIMENTAL GROUP
AND CONTROL GROUP Experimental Control
No Code Score No Code Score
1 E – 1 83.00 1 C – 1 72.00
2 E – 2 85.00 2 C – 2 74.00
3 E – 3 78.00 3 C – 3 76.00
4 E – 4 81.00 4 C – 4 71.00
5 E – 5 82.00 5 C – 5 71.00
6 E – 6 87.00 6 C – 6 69.00
7 E – 7 95.00 7 C – 7 61.00
8 E – 8 89.00 8 C – 8 69.00
9 E – 9 85.00 9 C – 9 68.00
10 E – 10 77.00 10 C – 10 73.00
11 E – 11 86.00 11 C – 11 80.00
12 E – 12 79.00 12 C – 12 75.00
13 E – 13 84.00 13 C – 13 80.00
14 E – 14 87.00 14 C – 14 73.00
15 E – 15 84.00 15 C – 15 62.00
16 E – 16 70.00 16 C – 16 74.00
17 E – 17 89.00 17 C – 17 66.00
18 E – 18 81.00 18 C – 18 83.00
19 E – 19 95.00 19 C – 19 79.00
20 E – 20 86.00 20 C – 20 72.00
21 E – 21 78.00 21 C – 21 81.00
22 E – 22 79.00 22 C – 22 82.00
23 E – 23 83.00 23 C – 23 88.00
24 E – 24 84.00 24 C – 24 85.00
25 E – 25 78.00 25 C – 25 73.00
26 E – 26 85.00 26 C – 26 59.00
27 E – 27 92.00 27 C – 27 87.00
28 E – 28 78.00 28 C – 28 61.00
29 E – 29 84.00 29 C – 29 65.00
30 E – 30 91.00 30 C – 30 73.00
31 E – 31 85.00 31 C – 31 64.00
32 E – 32 84.00 32 C – 32 64.00
33 E – 33 85.00 33 C – 33 70.00
34 E – 34 86.00 34 C – 34 75.00
35 E – 35 72.00
∑ = 2927.00 ∑ = 2475.00
n1 = 35 n2 =34
= 83.63
=72.79
S12 = 30.6521 S1
2 =58.1078
S1 = 5.536 S2 =7.623
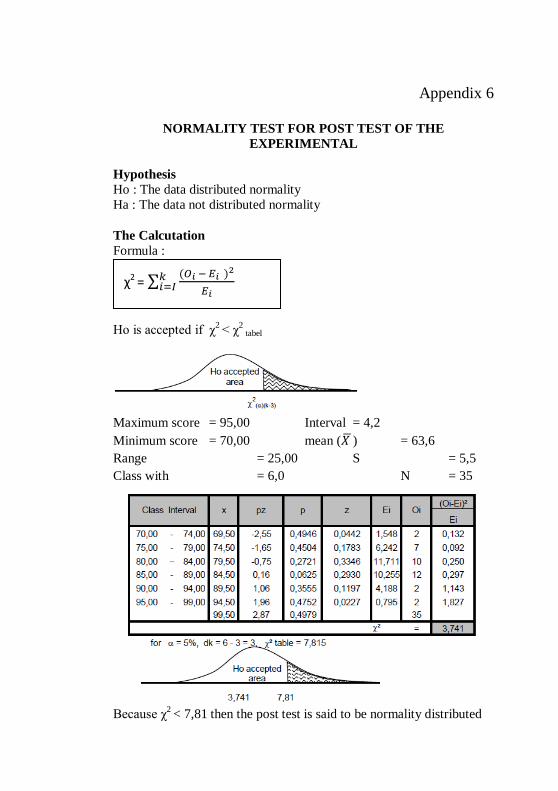
Appendix 6
NORMALITY TEST FOR POST TEST OF THE
EXPERIMENTAL
Hypothesis
Ho : The data distributed normality
Ha : The data not distributed normality
The Calcutation
Formula :
Ho is accepted if χ2 < χ
2 tabel
Maximum score = 95,00 Interval = 4,2
Minimum score = 70,00 mean ( ) = 63,6
Range = 25,00 S = 5,5
Class with = 6,0 N = 35
Because χ2
< 7,81 then the post test is said to be normality distributed
χ2 = ∑( )
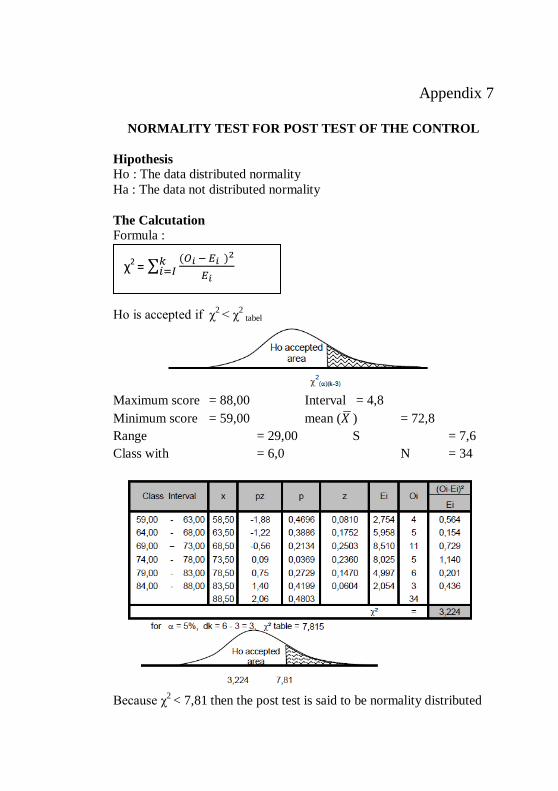
Appendix 7
NORMALITY TEST FOR POST TEST OF THE CONTROL
Hipothesis
Ho : The data distributed normality
Ha : The data not distributed normality
The Calcutation
Formula :
Ho is accepted if χ2 < χ
2 tabel
Maximum score = 88,00 Interval = 4,8
Minimum score = 59,00 mean ( ) = 72,8
Range = 29,00 S = 7,6
Class with = 6,0 N = 34
Because χ2
< 7,81 then the post test is said to be normality distributed
χ2 = ∑( )
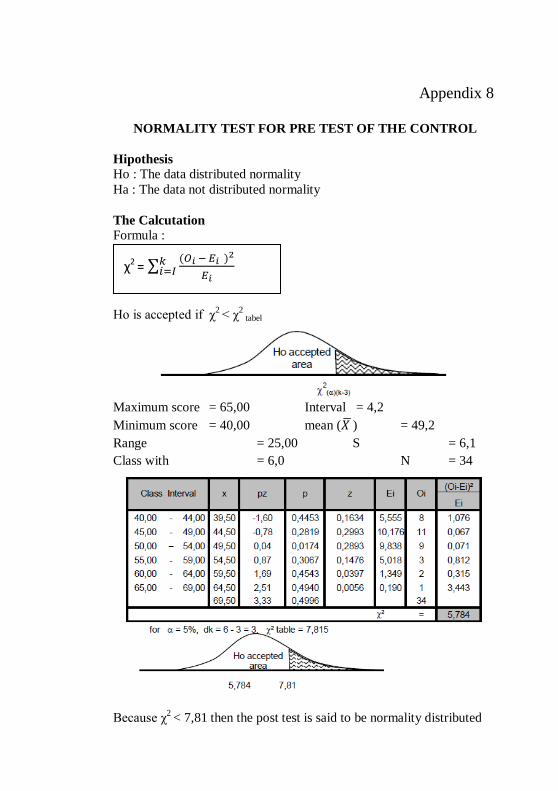
Appendix 8
NORMALITY TEST FOR PRE TEST OF THE CONTROL
Hipothesis
Ho : The data distributed normality
Ha : The data not distributed normality
The Calcutation
Formula :
Ho is accepted if χ2 < χ
2 tabel
Maximum score = 65,00 Interval = 4,2
Minimum score = 40,00 mean ( ) = 49,2
Range = 25,00 S = 6,1
Class with = 6,0 N = 34
Because χ2
< 7,81 then the post test is said to be normality distributed
χ2 = ∑( )
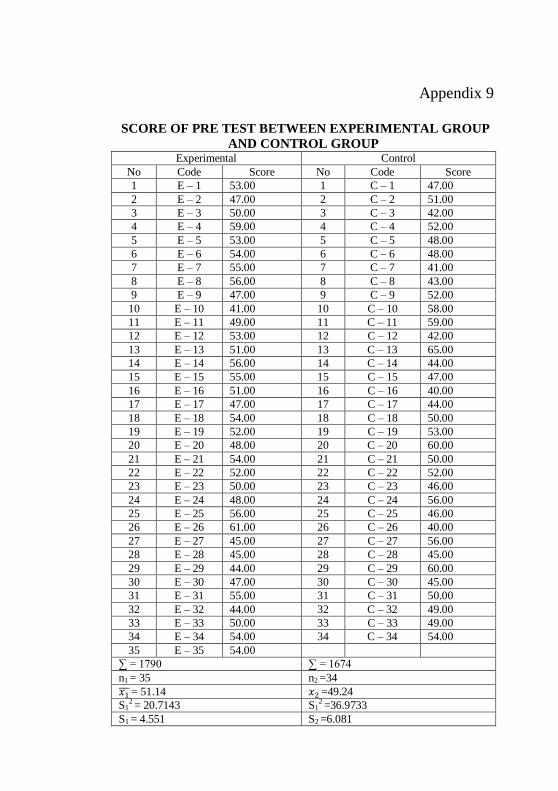
Appendix 9
SCORE OF PRE TEST BETWEEN EXPERIMENTAL GROUP
AND CONTROL GROUP Experimental Control
No Code Score No Code Score
1 E – 1 53.00 1 C – 1 47.00
2 E – 2 47.00 2 C – 2 51.00
3 E – 3 50.00 3 C – 3 42.00
4 E – 4 59.00 4 C – 4 52.00
5 E – 5 53.00 5 C – 5 48.00
6 E – 6 54.00 6 C – 6 48.00
7 E – 7 55.00 7 C – 7 41.00
8 E – 8 56.00 8 C – 8 43.00
9 E – 9 47.00 9 C – 9 52.00
10 E – 10 41.00 10 C – 10 58.00
11 E – 11 49.00 11 C – 11 59.00
12 E – 12 53.00 12 C – 12 42.00
13 E – 13 51.00 13 C – 13 65.00
14 E – 14 56.00 14 C – 14 44.00
15 E – 15 55.00 15 C – 15 47.00
16 E – 16 51.00 16 C – 16 40.00
17 E – 17 47.00 17 C – 17 44.00
18 E – 18 54.00 18 C – 18 50.00
19 E – 19 52.00 19 C – 19 53.00
20 E – 20 48.00 20 C – 20 60.00
21 E – 21 54.00 21 C – 21 50.00
22 E – 22 52.00 22 C – 22 52.00
23 E – 23 50.00 23 C – 23 46.00
24 E – 24 48.00 24 C – 24 56.00
25 E – 25 56.00 25 C – 25 46.00
26 E – 26 61.00 26 C – 26 40.00
27 E – 27 45.00 27 C – 27 56.00
28 E – 28 45.00 28 C – 28 45.00
29 E – 29 44.00 29 C – 29 60.00
30 E – 30 47.00 30 C – 30 45.00
31 E – 31 55.00 31 C – 31 50.00
32 E – 32 44.00 32 C – 32 49.00
33 E – 33 50.00 33 C – 33 49.00
34 E – 34 54.00 34 C – 34 54.00
35 E – 35 54.00
∑ = 1790 ∑ = 1674
n1 = 35 n2 =34
= 51.14
=49.24
S12 = 20.7143 S1
2 =36.9733
S1 = 4.551 S2 =6.081
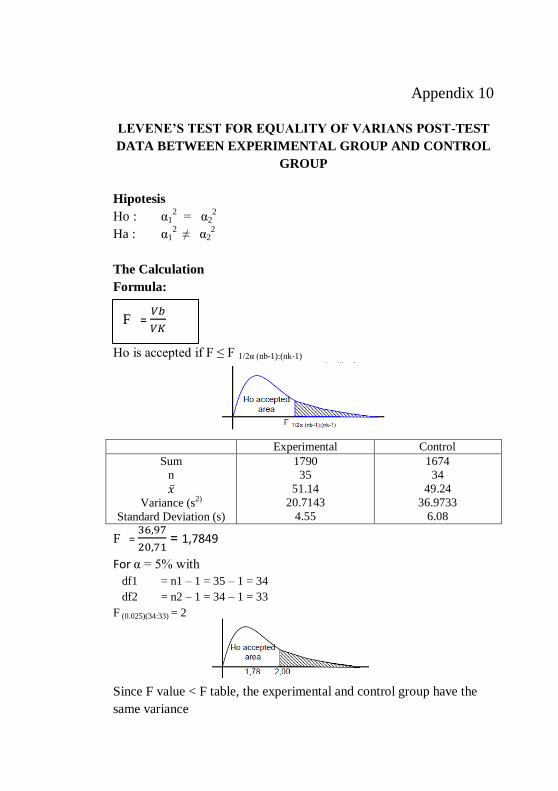
Appendix 10
LEVENE’S TEST FOR EQUALITY OF VARIANS POST-TEST
DATA BETWEEN EXPERIMENTAL GROUP AND CONTROL
GROUP
Hipotesis
Ho : α12 = α2
2
Ha : α12 ≠ α2
2
The Calculation
Formula:
Ho is accepted if F ≤ F 1/2α (nb-1):(nk-1)
Experimental Control
Sum n
Variance (s2)
Standard Deviation (s)
1790 35
51.14
20.7143
4.55
1674 34
49.24
36.9733
6.08
F =
= 1,7849
For α = 5% with
df1 = n1 – 1 = 35 – 1 = 34
df2 = n2 – 1 = 34 – 1 = 33
F (0.025)(34:33) = 2
Since F value < F table, the experimental and control group have the
same variance
F =
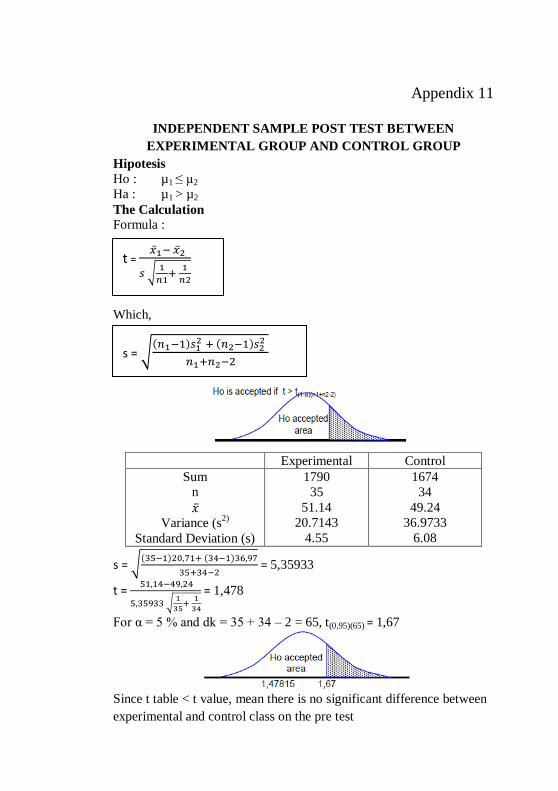
Appendix 11
INDEPENDENT SAMPLE POST TEST BETWEEN
EXPERIMENTAL GROUP AND CONTROL GROUP
Hipotesis
Ho : µ1 ≤ µ2
Ha : µ1 > µ2
The Calculation
Formula :
Which,
Experimental Control
Sum
n
Variance (s
2)
Standard Deviation (s)
1790
35
51.14
20.7143
4.55
1674
34
49.24
36.9733
6.08
s = √( ) ( )
= 5,35933
t =
√
= 1,478
For α = 5 % and dk = 35 + 34 – 2 = 65, t(0,95)(65) = 1,67
Since t table < t value, mean there is no significant difference between
experimental and control class on the pre test
t =
√
s = √( )
( )
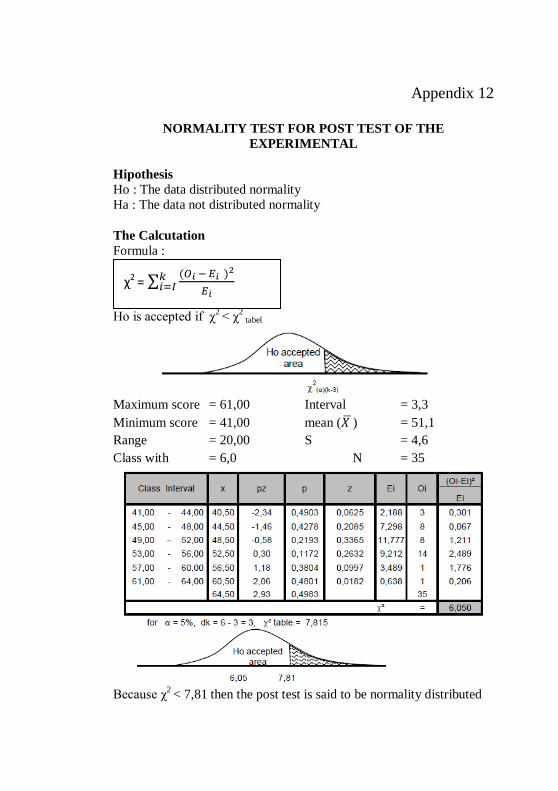
Appendix 12
NORMALITY TEST FOR POST TEST OF THE
EXPERIMENTAL
Hipothesis
Ho : The data distributed normality
Ha : The data not distributed normality
The Calcutation
Formula :
Ho is accepted if χ2 < χ
2 tabel
Maximum score = 61,00 Interval = 3,3
Minimum score = 41,00 mean ( ) = 51,1
Range = 20,00 S = 4,6
Class with = 6,0 N = 35
Because χ
2 < 7,81 then the post test is said to be normality distributed
χ2 = ∑( )
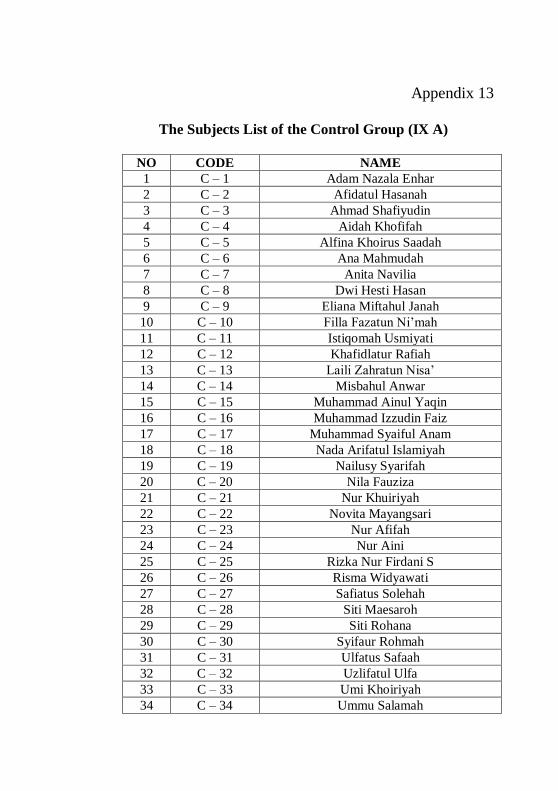
Appendix 13
The Subjects List of the Control Group (IX A)
NO CODE NAME
1 C – 1 Adam Nazala Enhar
2 C – 2 Afidatul Hasanah
3 C – 3 Ahmad Shafiyudin
4 C – 4 Aidah Khofifah
5 C – 5 Alfina Khoirus Saadah
6 C – 6 Ana Mahmudah
7 C – 7 Anita Navilia
8 C – 8 Dwi Hesti Hasan
9 C – 9 Eliana Miftahul Janah
10 C – 10 Filla Fazatun Ni’mah
11 C – 11 Istiqomah Usmiyati
12 C – 12 Khafidlatur Rafiah
13 C – 13 Laili Zahratun Nisa’
14 C – 14 Misbahul Anwar
15 C – 15 Muhammad Ainul Yaqin
16 C – 16 Muhammad Izzudin Faiz
17 C – 17 Muhammad Syaiful Anam
18 C – 18 Nada Arifatul Islamiyah
19 C – 19 Nailusy Syarifah
20 C – 20 Nila Fauziza
21 C – 21 Nur Khuiriyah
22 C – 22 Novita Mayangsari
23 C – 23 Nur Afifah
24 C – 24 Nur Aini
25 C – 25 Rizka Nur Firdani S
26 C – 26 Risma Widyawati
27 C – 27 Safiatus Solehah
28 C – 28 Siti Maesaroh
29 C – 29 Siti Rohana
30 C – 30 Syifaur Rohmah
31 C – 31 Ulfatus Safaah
32 C – 32 Uzlifatul Ulfa
33 C – 33 Umi Khoiriyah
34 C – 34 Ummu Salamah
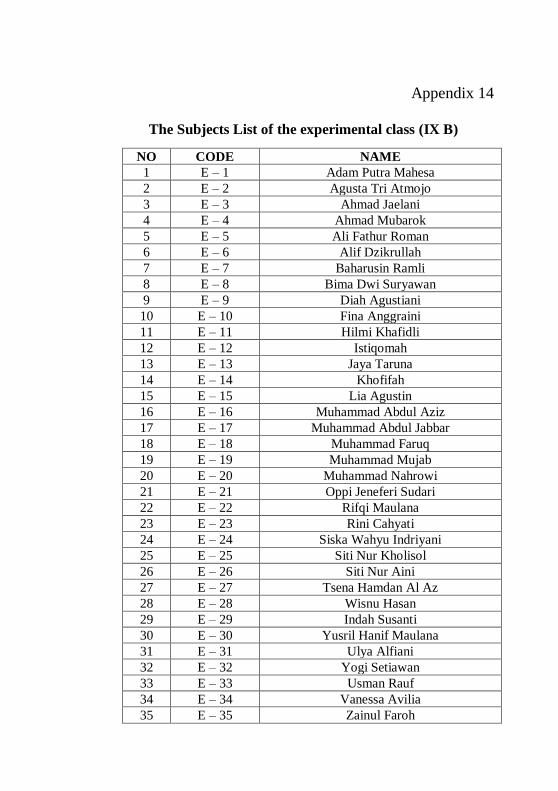
Appendix 14
The Subjects List of the experimental class (IX B)
NO CODE NAME
1 E – 1 Adam Putra Mahesa
2 E – 2 Agusta Tri Atmojo
3 E – 3 Ahmad Jaelani
4 E – 4 Ahmad Mubarok
5 E – 5 Ali Fathur Roman
6 E – 6 Alif Dzikrullah
7 E – 7 Baharusin Ramli
8 E – 8 Bima Dwi Suryawan
9 E – 9 Diah Agustiani
10 E – 10 Fina Anggraini
11 E – 11 Hilmi Khafidli
12 E – 12 Istiqomah
13 E – 13 Jaya Taruna
14 E – 14 Khofifah
15 E – 15 Lia Agustin
16 E – 16 Muhammad Abdul Aziz
17 E – 17 Muhammad Abdul Jabbar
18 E – 18 Muhammad Faruq
19 E – 19 Muhammad Mujab
20 E – 20 Muhammad Nahrowi
21 E – 21 Oppi Jeneferi Sudari
22 E – 22 Rifqi Maulana
23 E – 23 Rini Cahyati
24 E – 24 Siska Wahyu Indriyani
25 E – 25 Siti Nur Kholisol
26 E – 26 Siti Nur Aini
27 E – 27 Tsena Hamdan Al Az
28 E – 28 Wisnu Hasan
29 E – 29 Indah Susanti
30 E – 30 Yusril Hanif Maulana
31 E – 31 Ulya Alfiani
32 E – 32 Yogi Setiawan
33 E – 33 Usman Rauf
34 E – 34 Vanessa Avilia
35 E – 35 Zainul Faroh
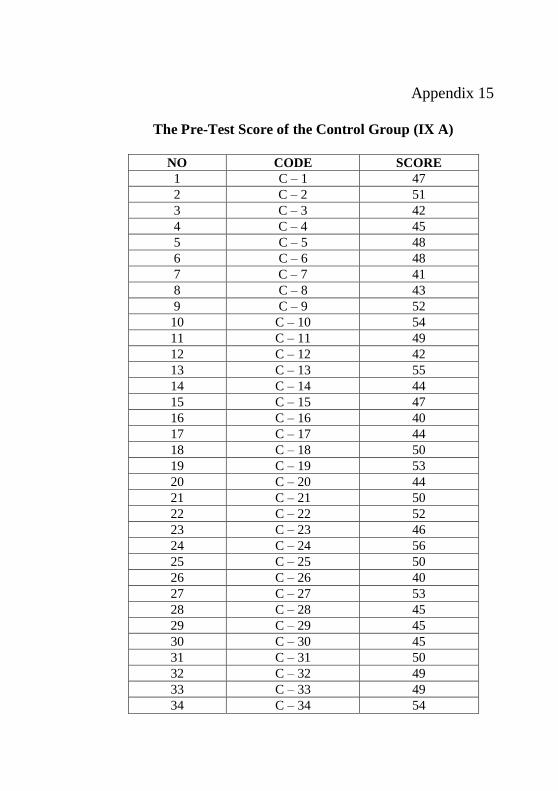
Appendix 15
The Pre-Test Score of the Control Group (IX A)
NO CODE SCORE
1 C – 1 47
2 C – 2 51
3 C – 3 42
4 C – 4 45
5 C – 5 48
6 C – 6 48
7 C – 7 41
8 C – 8 43
9 C – 9 52
10 C – 10 54
11 C – 11 49
12 C – 12 42
13 C – 13 55
14 C – 14 44
15 C – 15 47
16 C – 16 40
17 C – 17 44
18 C – 18 50
19 C – 19 53
20 C – 20 44
21 C – 21 50
22 C – 22 52
23 C – 23 46
24 C – 24 56
25 C – 25 50
26 C – 26 40
27 C – 27 53
28 C – 28 45
29 C – 29 45
30 C – 30 45
31 C – 31 50
32 C – 32 49
33 C – 33 49
34 C – 34 54
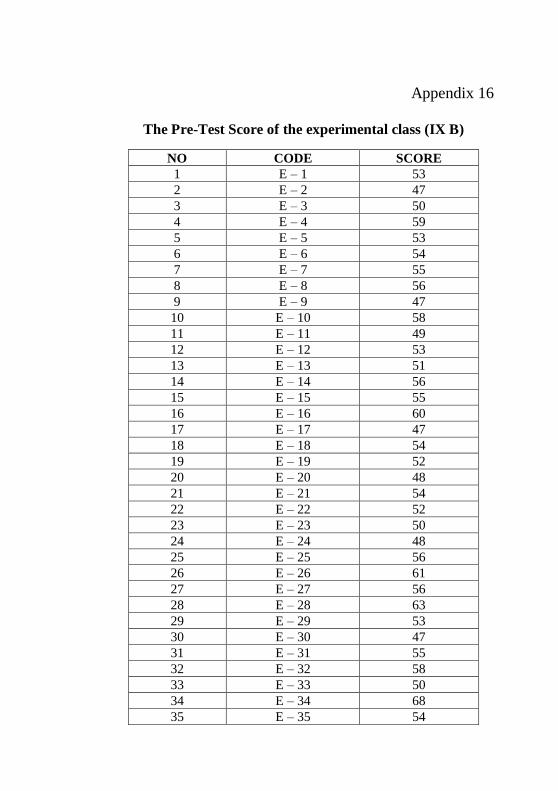
Appendix 16
The Pre-Test Score of the experimental class (IX B)
NO CODE SCORE
1 E – 1 53
2 E – 2 47
3 E – 3 50
4 E – 4 59
5 E – 5 53
6 E – 6 54
7 E – 7 55
8 E – 8 56
9 E – 9 47
10 E – 10 58
11 E – 11 49
12 E – 12 53
13 E – 13 51
14 E – 14 56
15 E – 15 55
16 E – 16 60
17 E – 17 47
18 E – 18 54
19 E – 19 52
20 E – 20 48
21 E – 21 54
22 E – 22 52
23 E – 23 50
24 E – 24 48
25 E – 25 56
26 E – 26 61
27 E – 27 56
28 E – 28 63
29 E – 29 53
30 E – 30 47
31 E – 31 55
32 E – 32 58
33 E – 33 50
34 E – 34 68
35 E – 35 54
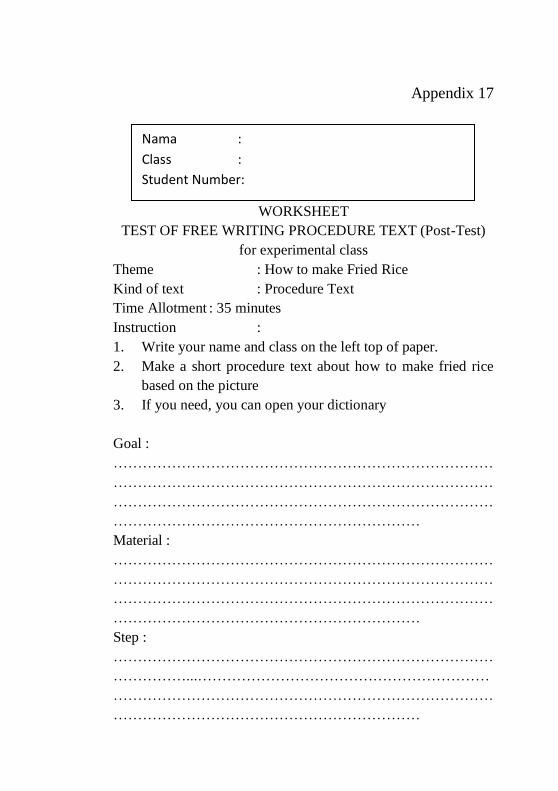
Appendix 17
WORKSHEET
TEST OF FREE WRITING PROCEDURE TEXT (Post-Test)
for experimental class
Theme : How to make Fried Rice
Kind of text : Procedure Text
Time Allotment : 35 minutes
Instruction :
1. Write your name and class on the left top of paper.
2. Make a short procedure text about how to make fried rice
based on the picture
3. If you need, you can open your dictionary
Goal :
……………………………………………………………………
……………………………………………………………………
……………………………………………………………………
………………………………………………………
Material :
……………………………………………………………………
……………………………………………………………………
……………………………………………………………………
………………………………………………………
Step :
……………………………………………………………………
……………...……………………………………………………
……………………………………………………………………
………………………………………………………
Nama :
Class :
Student Number:
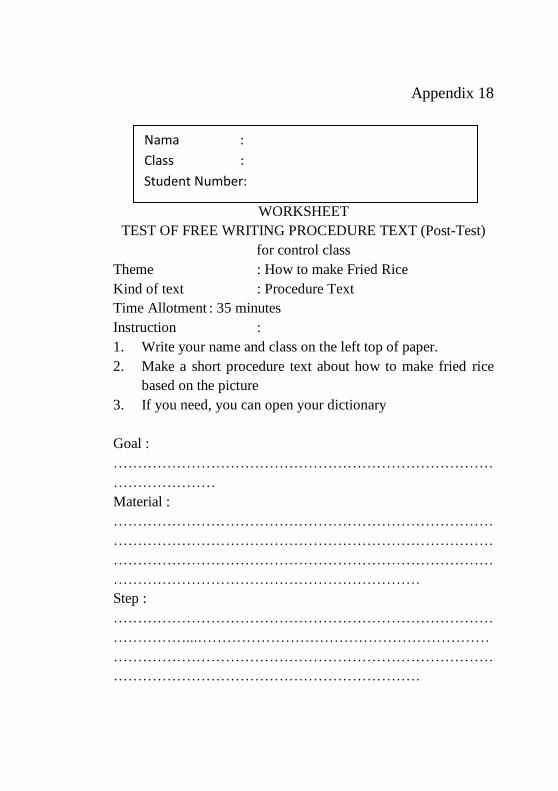
Appendix 18
WORKSHEET
TEST OF FREE WRITING PROCEDURE TEXT (Post-Test)
for control class
Theme : How to make Fried Rice
Kind of text : Procedure Text
Time Allotment : 35 minutes
Instruction :
1. Write your name and class on the left top of paper.
2. Make a short procedure text about how to make fried rice
based on the picture
3. If you need, you can open your dictionary
Goal :
……………………………………………………………………
…………………
Material :
……………………………………………………………………
……………………………………………………………………
……………………………………………………………………
………………………………………………………
Step :
……………………………………………………………………
……………...……………………………………………………
……………………………………………………………………
………………………………………………………
Nama :
Class :
Student Number:
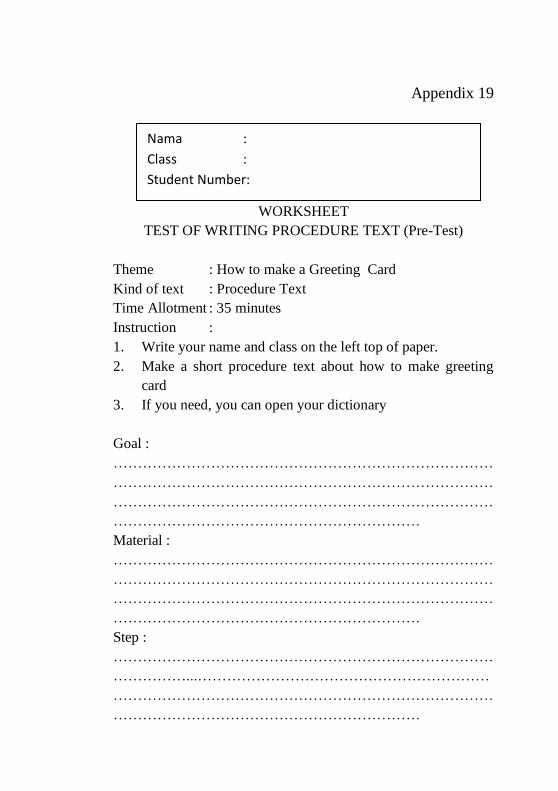
Appendix 19
WORKSHEET
TEST OF WRITING PROCEDURE TEXT (Pre-Test)
Theme : How to make a Greeting Card
Kind of text : Procedure Text
Time Allotment : 35 minutes
Instruction :
1. Write your name and class on the left top of paper.
2. Make a short procedure text about how to make greeting
card
3. If you need, you can open your dictionary
Goal :
……………………………………………………………………
……………………………………………………………………
……………………………………………………………………
………………………………………………………
Material :
……………………………………………………………………
……………………………………………………………………
……………………………………………………………………
………………………………………………………
Step :
……………………………………………………………………
……………...……………………………………………………
……………………………………………………………………
………………………………………………………
Nama :
Class :
Student Number:
Appendix 20
CURRICULUM VITAE
Name : Lailatul Faizah
Place and Date of Birth : Demak, 2 Juni 1959
Student Number : 113411128
Address : Home : Purwosari 99 Rt.01/Rw I
Sayung Demak
Telp/HP : 085290326444
Academic Background : 1.TK Pertiwi Purwosari
2. SDN I Purwosari Sayung
3. PGAP NU Demak
4. PGAA NU Demak
5. UIN Walisongo Semarang