Embed Size (px)
Citation preview

IMPROVING THE EFFFECTIVENESS OF THE GRAMEEN BANK OF UGANDA
Mahati Sridhar
An honors thesis submitted to the faculty of the Kenan-Flagler Business School at the
University of North Carolina at Chapel Hill
Chapel Hill 2015
Approved by _____________________________ (Dr. Larry Chavis)

Grameen Bank of Uganda ii
ABSTRACT Mahati Sridhar
Improving the Effectiveness of the Grameen Bank of Uganda (Under the direction of Dr. Larry Chavis)
Micro-finance is a lending solution for low-income and developing regions of the world.
However, creating the most effective model for microfinance requires specific tailoring
for each region and each target segment. One specific organization that is facing the
challenges from the lack of an effective model is the Grameen Bank in Uganda. In
comparison to some of its peer institutions, the Grameen Bank has much lower women
outreach and rural penetration. Through my research, I provide qualitative and
quantitative analyses of various microfinance ventures throughout Africa. These analyses
discuss the importance of rural penetration, women inclusion, financial education, and
deposit vs loan ratios. In the end, I provide solutions to the Grameen Bank of Uganda for
how they can improve their outreach with more tailored solutions in line with their peer
institutions.

Grameen Bank of Uganda iii
TABLE OF CONTENTS
ABSTRACT ....................................................................................................................... ii
LIST OF TABLES ............................................................................................................. v
LIST OF FIGURES .......................................................................................................... vi
Chapter
I. Introduction ........................................................................................................... 1
A. Microfinance Definition .............................................................................. 2
B. History of Microfinance .............................................................................. 2
C. Microfinance in Africa ................................................................................ 4
D. Types of Microfinance Institutions ............................................................. 4
E. Bank of Uganda Current Situation .............................................................. 6
II. Literature Review .................................................................................................. 7
A. How effectiveness has been quantified ....................................................... 8
1. Variables ...................................................................................... 8
2. Limitations ................................................................................... 9
B. How the Grameen Bank model is structured ............................................ 10
1. Grameen Model ......................................................................... 11
2. Microfinance Studies ................................................................. 12
C. How other African models compare ......................................................... 13
Grameen Bank of Uganda iv
1. African MFIs .............................................................................. 13
III. Research Methodology ........................................................................................ 18
A. Data Selection ........................................................................................... 18
B. Quantitative Analysis ................................................................................ 21
C. Qualitative Research ................................................................................. 24
D. Limitations ................................................................................................ 26
IV. Results ................................................................................................................. 27
A. Urban vs Rural Programs .......................................................................... 29
B. Central Institutions Analysis ..................................................................... 31
C. Institution Type and Location Breakdown ............................................... 32
D. Deposits and Loans Analysis .................................................................... 33
V. Discussion ........................................................................................................... 34
A. Recommendations ..................................................................................... 36
VI. REFERENCES .................................................................................................... 38

Grameen Bank of Uganda v
LIST OF TABLES Table 3.1 Initial Data Selection ........................................................................................... 25 Table 4.1 Regression Results ............................................................................................... 33 Table 4.2 Data Segmented Groups ...................................................................................... 34 Table 4.3 Segmented Group Data Averages ........................................................................ 34 Table 4.4 Borrower and Depositor Group Averages ............................................................ 38

Grameen Bank of Uganda vi
LIST OF FIGURES
Figure 3.1 Narrowing Data ................................................................................................... 25 Figure 4.1 Rural Penetration vs Women Outreach Graph ................................................... 33 Figure 4.2 Four Central Institutions ..................................................................................... 36 Figure 4.3 Data Graph Broken Down .................................................................................. 37

Grameen Bank of Uganda 1
I. INTRODUCTION Microfinance is a popular lending solution for low-income and developing
regions of the world. However, there are many different types of institutions with a
variety of methods of reporting their success. My research will attempt to provide the
Grameen Foundation of Uganda with recommendations for improving their programs
based on a quantitative and qualitative analysis of other similar organizations.
My interest in microfinance stems from Muhammad Yunus’ Banker to the Poor
(1999). Mohammad Yunus discussed his experiences with poverty and inequality in
many of the homes and villages across Southeast Asia. He implemented a micro-lending
program, called the Grameen Foundation, to stimulate the economies in these
impoverished centers through short-term investments in handicrafts, farm tools, and
small-scale manufacturing shops (Yunus, 1999). As a result, families gained additional
income to spend on food and education for their children. The Grameen Foundation is
extremely successful in Southeast Asia, but the same model is struggling in other
geographic areas of the world—specifically in Africa. According to the Grameen
Foundation’s 2014 annual report, over 600,000 new savings accounts were created in the
Southeast Asian region in comparison to 200,000 accounts in sub-Saharan Africa (Scott,
2014).

Grameen Bank of Uganda 2
In this next section, I will give define more broadly what microfinance is and
provide a brief overview of the history of microfinance, with a deeper look at
microfinance in Africa, the various types of microfinance institutions, and an
understanding of the current situation at the Grameen Bank of Uganda.
Microfinance Definition
Microfinance is a term defined for the “formal and informal institutions offering
financial services to the poor” (Brau & Woller, 2004). Microfinance aims at providing
smaller (micro) loans with low interest to low-income individuals to help further their
small businesses, agricultural practices, and other needs. Microfinance is practiced all
around the world—extending financial inclusion universally.
History of Microfinance
Microfinance has been around for centuries in many informal manners in different
cultures. For instance, “chit funds” in India, “tontines” in West Africa, “tandas” in
Mexico, and “susus” in Ghana are all names for informal microfinance lending practices
deeply rooted in these cultures (Helms & Goodwin-Groen, 2006).
One of the earliest documented forms of a formal microfinance institution was the
Irish Loan Fund, founded in the 1700s by Jonathan Swift (Helms & Goodwin-Groen,
2006). Swift created funds across Ireland to stimulate the growing agrarian economy
(Helms & Goodwin-Groen, 2006). At one point, the Irish Loan Fund accounted for 20%
of all Irish lending activity (Helms & Goodwin-Groen, 2006).
Through the Industrial Revolution, formal lending institutions developed and
became the more prominent lending facility. The poor were viewed as “unreliable”
populations that could not provide collateral for loans and therefore were hardly
Grameen Bank of Uganda 3
considered as customers at these formal lending institutions (Yunus, 1999). The number
of microfinance programs remained stagnant as the demand grew.
The importance of microfinance resurfaced in the 20th century with specific
programs targeted at agricultural and craft markets in lesser-developed countries (LDCs).
These rural programs initially failed because the rural development banks could not
maintain their capital pool as a result of subsidized lending interest rates and low
repayment rates. Additionally, much of this capital remained in the hands of a few
fortunate farmers, while majority of the poor farmers could not gain access (Helms &
Goodwin-Groen, 2006).
In the 1970s, Muhammad Yunus—the father of modern day microfinance—
experimented with micro-lending in groups. By incorporating the social component, the
loan repayments drastically increased and these programs brought much needed capital
and credit opportunities to the poorest of communities. The social component involved
creating small lending groups consisting of non-family members. These members held
each other accountable for making loan repayments. If a single member did not make a
payment, the entire group faced the repercussions.
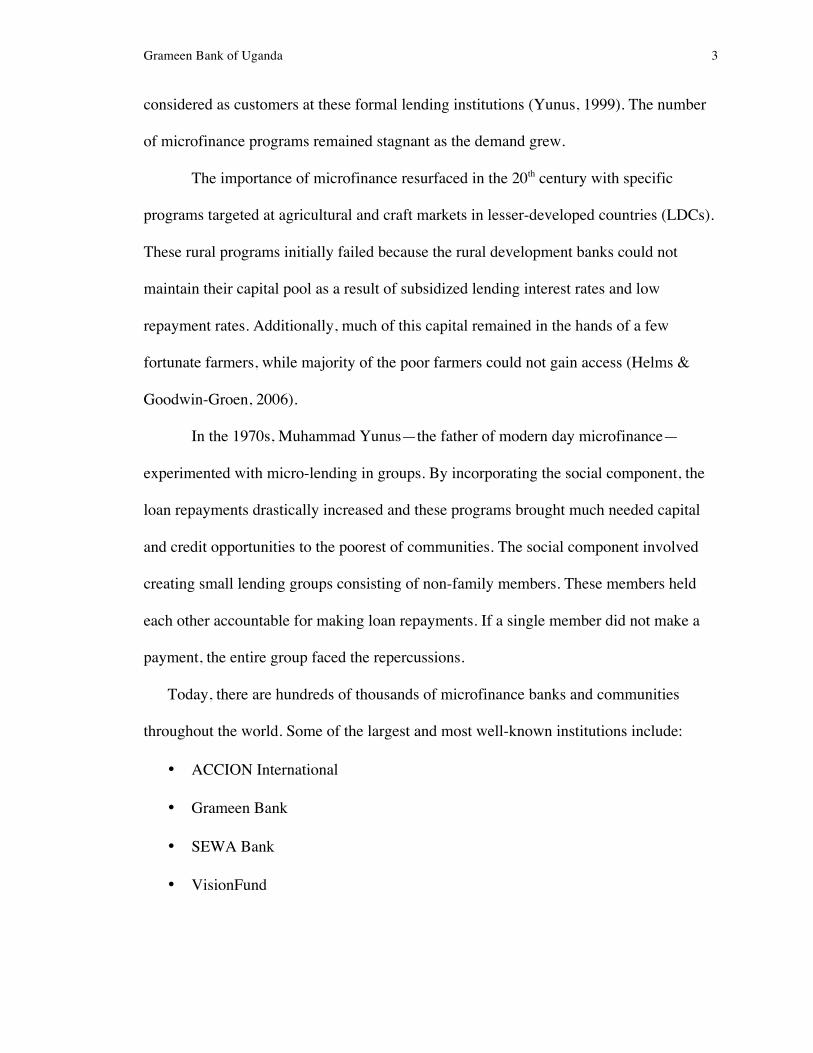
Today, there are hundreds of thousands of microfinance banks and communities
throughout the world. Some of the largest and most well-known institutions include:
• ACCION International
• Grameen Bank
• SEWA Bank
• VisionFund

Grameen Bank of Uganda 4
Microfinance in Africa
Microfinance in Africa has as deep of roots as the rest of the global community—
with informal group lending practices popular all throughout the continent. However,
formal lending institutions, particularly those with access to the poor, never gained
traction in history up until recently. Through the early part of the 20th century, the average
financial inclusion rate for an African nation was a mere 25%--meaning majority of the
population did not have access to a financial institution (Jarotschkin, 2013). As a result,
introducing such practices has been difficult because the culture in many rural parts of
Africa is not accustomed to an external party managing family and business financials
(Maarse, 2014). However once more established organizations, such as the Grameen
Bank and ACCION International, began to branch off with working microfinance
institution (MFI) models, financial inclusion started to grow in Africa (Linthorst, 2013).
As of today, “Africa’s microfinance industry has been growing” (Jarotschkin,
2013). Since 2013, the number of microfinance institutions in Africa has increased by
5.3% (Cull, 2014). This growth is attributed to increased political stability throughout the
region, and technological advances that have improved connectivity and communication
from rural villages to urban settings (Basu & Blavy, 2004). This industry “weathered the
financial crisis better than most industries, according to asset growth rates” and is poised
to continue to grow rapidly over the next twenty years (Jarotschkin, 2013).
Types of Microfinance Institutions Microfinance Institutions can be classified into four main types of organizations.
These classifications stem from government requirements and product offerings by the
various organizations. The four main types are:

Grameen Bank of Uganda 5
• Microfinance Institutions (MFIs)
• Micro-depository Institutions (MDIs)
• Microfinance banks (MfBs)
• Savings and credit Cooperatives (SACCOs)
A microfinance institution is a more common term for a micro-lending institution. These
organizations specialize in making loans. They do not have a depository function;
therefore, they cannot store money for clients. Micro-depository institutions are a step up
and include the ability to receive deposits as well as make loans. In order to take deposits,
these organizations must be registered with their respective countries in order to conduct
business. MFIs do not have this requirement. Microfinance banks are capable of making
loans and taking deposits. These institutions are usually subgroups from a government
bank or local commercial bank. As a result, these programs are more stable but follow
very traditional lending practices. Finally, SACCOs also have the ability to make loans
and receive deposits. However, these organizations are completely government owned
and receive their funding solely from the government budgets. These organizations are
popular in many African nations, included Uganda and Kenya (Kariobangi, 2012).
Grameen Bank of Uganda Current Situation
The Grameen Bank of Uganda has been present in the nation on and off since
2002. Because of various political instabilities as well as economic turmoil, there has
been a significant amount of inconsistency with this program. This program is defined as
a microfinance institution—meaning they do not have any formal depository practices.
However, this institution—like many in the region—still accept and conduct depository
practices as long as the amount is not anything large (Sharma-interview, 2015).

Grameen Bank of Uganda 6
This program is based out of Kampala, the Ugandan capital. Most of the Grameen
offices are located in the southern, more urban portion of the country. Their mission is to
empower the rural through lending primarily to women (Cheston, 2002). Currently, the
Grameen Bank program is popular with urban women—with over 20% women outreach.
This number is much higher than other micro-lending institutions in the region. However,
the Grameen Bank is suffering with its focus on improving rural villages and providing
increased opportunities for these villagers.
The Grameen Bank of Uganda is trying to refocus its efforts to improve its
presence in this area. The institution has set goals for the coming years in order to meet
the goals and standards of the Grameen Foundation International organization. Currently,
the institution is partnered with the Bill and Melinda Gates Foundation to bring a mobile
money solution to the region (Sharma-interview, 2015). Because of the growing presence
of mobile devices in rural Africa, the Grameen Bank believes that this program could be
a solution to improving their presence in rural regions of Uganda.

Grameen Bank of Uganda 7
II. LITERATURE REVIEW The realm of microfinance is vast and well researched. The analyses range
anywhere from historical comparisons of programs, to studies that quantify the
effectiveness of these financial institutions. For this literature review, I will discuss:
• How effectiveness has been quantified
• How the Grameen Foundation model for microfinance is structured
• How other models in Africa compare
• How new innovations have stemmed in this field
This research will serve as a foundation and background for my thesis.
How effectiveness has been quantified
This section will discuss how the effectiveness of microfinance programs has
been quantified with a focus on the variables measured and the limitations associated
with these methods.
Variables
Multiple studies and reports have been created that quantify the effectiveness of
microfinance institutions. I will group these studies and discuss their respective
contributions to this space based on the variables they have. The variables are:
• Number of depositors

Grameen Bank of Uganda 8
• Rate of repayment
• Average loan sizes
• Percentage of rural clients
• Percentage of rural automated teller machines (ATMs) / points of sale (POS)
• Percentage of women borrowers
• Contraceptive use
• Children’s nutrition
The first two variables, number of depositors and rate of repayment, are the most
common variables used to quantify the effectiveness of microfinance practices. These
variables are used in Measuring the Impact of Microfinance by Odell (2010), From
Financial Exclusion to Formal Inclusion: Empirical Evidence from the Microfinance and
Disability Project in Uganda by Maarse (2014), Financial Sector Development in Africa
by Jarotschkin (2013), and Microfinance in Ghana: an Overview by Asaima (2007). All
of these articles cite number of depositors and rate of repayment as crucial indicators of
the microfinance institution’s health.
If the number of depositors does not remain constant or positive, the MFI faces
the danger of a shrinking lending population (Maarse, 2014). If the rate of repayment is
not positive, then the MFI is not receiving enough of its principal back through monthly
payments and cannot lend additional credit out to prospective new clientele (Maarse,
2014). Additionally, these variables are easy to measure given that each MFI carefully
records each depositor in the books, as well as the monthly loan payments.
The next three variables, average loan sizes, percentage of rural clients, and
percentage of rural ATMs and POS were variables used by Jarotschkin (2013) in

Grameen Bank of Uganda 9
Financial Sector Development in Africa. These variables are used to paint a demographic
picture of the types of clients each MFI serves. The average loan size variable correlated
strongly with the use of the loan. For instance, longer loans (36-60 months) typically
involved agrarian based investments. While shorter loans (12-24 months) typically
involved handicraft based investments (Jarotschkin, 2013). The percentage rural clients
and the percentage of rural ATMs measured the financial inclusion of MFIs in rural
African towns and villages. This metric is important because more than 70% of Africa’s
population live in rural areas (Rural Poverty Portal, 2009). In the past twenty years, these
variables have dramatically increased (Jarotschkin, 2013).
The final three variables are: percentage of women borrowers, contraceptive use,
and children’s nutrition. Jarotschkin (2013) uses the first variable, while Odell (2010)
uses the latter two. I decided to group these variables together because they all present a
“noneconomic” method to quantify the effect of microfinance institutions by measuring
related changes in the base population. It is important to look at these variables because
Cheston (2002) concluded that women are the “poorest of the poor.” Women generally
receive lower salaries and have a higher unemployment rate than males in similar
developing markets (Cheston, 2002). Of the income women make, 55% goes towards
household items, 18% goes towards the children’s schooling, and 15% goes towards
family clothing. The remaining 12% is used for food and reinvestment for the women
into their own jobs and business (Cheston, 2002). These numbers came specifically from
women in rural settings who generated their income from handicrafts such as basket
weaving and homemade textiles (Cheston, 2002). Both Odell (2010) and Jarotschkin

Grameen Bank of Uganda 10
(2013) acknowledge the breadth of impact women in microfinance programs have on
their families and therefore chose these variables accordingly.
Limitations
Though all these variables are popular for quantifying effectiveness, they present
certain limitations when interpreting the data. First and foremost, the data collection
process, especially for the noneconomic variables, is heavily reliant on self-reported data.
In doing so, only certain populations that may be comfortable reporting or being
submitted to medical tests in order to determine their level of effectiveness (Maarse,
2014). Additionally, many women may not feel comfortable sharing this data because of
certain social stigmas in their family structure—if they are found to be too “empowered,”
they could be ostracized by their families and communities for overstepping cultural
bounds (Odell, 2010; Maarse 2014).
How the Grameen Bank model is structured
For my analysis, I chose the Grameen Bank model in Uganda to analyze and
compare to various other microfinance models in the African region. I selected this model
because I have access to data and people working within this organization. In this section,
I will discuss the Grameen model in depth and discuss some of the limitations of the
model as discovered through various case studies.
Grameen Model
The Grameen Bank is one of the most popular and successful MFI models. It is
referenced and used as a benchmark in many research studies; therefore, I chose this
model to serve as the base model for my research. This model was developed by

Grameen Bank of Uganda 11
Muhammad Yunus in the 1970s to address the extreme poverty in Bangladesh. This
organization has since gone international, with locations in many countries all across the
globe (Yunus, 1999).
The Grameen Bank is a peer lending solution that relies on the idea of social
capital (Yunus, 1999). Borrowers form groups of five or seven non-family members to
receive a base loan amount. These individuals go through a brief training with the
Grameen Bank to understand lending practices and basics of financial institutions.
Following the training, the group receives a small base amount that anyone from the
group, upon group consensus, may receive as a loan. Once a week, the group will meet
and the member(s) with loans must repay. For every successfully repaid loan, the group
receives additional principal to increase the base loan pool. For every default, the group is
ineligible for a new loan (Yunus, 1999).
This model, though very successful, has been criticized by many on varying
grounds. I will review several studies that analyze this specific model in Bangladesh as
well as in other geographic locations.
Microfinance Studies
In Magner’s Microfinance: A Platform for Social Change (2007), he discusses
how participants with “continued access to loans have a lower rate of poverty than those
without, 57% compared to 76%, respectively.” He also discusses how microfinance
accounted for “40% of the entire reduction of moderate poverty in rural Bangladesh”
(Magner, 2007). However, the Grameen Bank does have its pitfalls. Specifically, this
program has a high percentage drop out (5-30% annually for most cases) and many
“ultra-poor” families never feel comfortable joining in the first place (Magner, 2007). On
Grameen Bank of Uganda 12
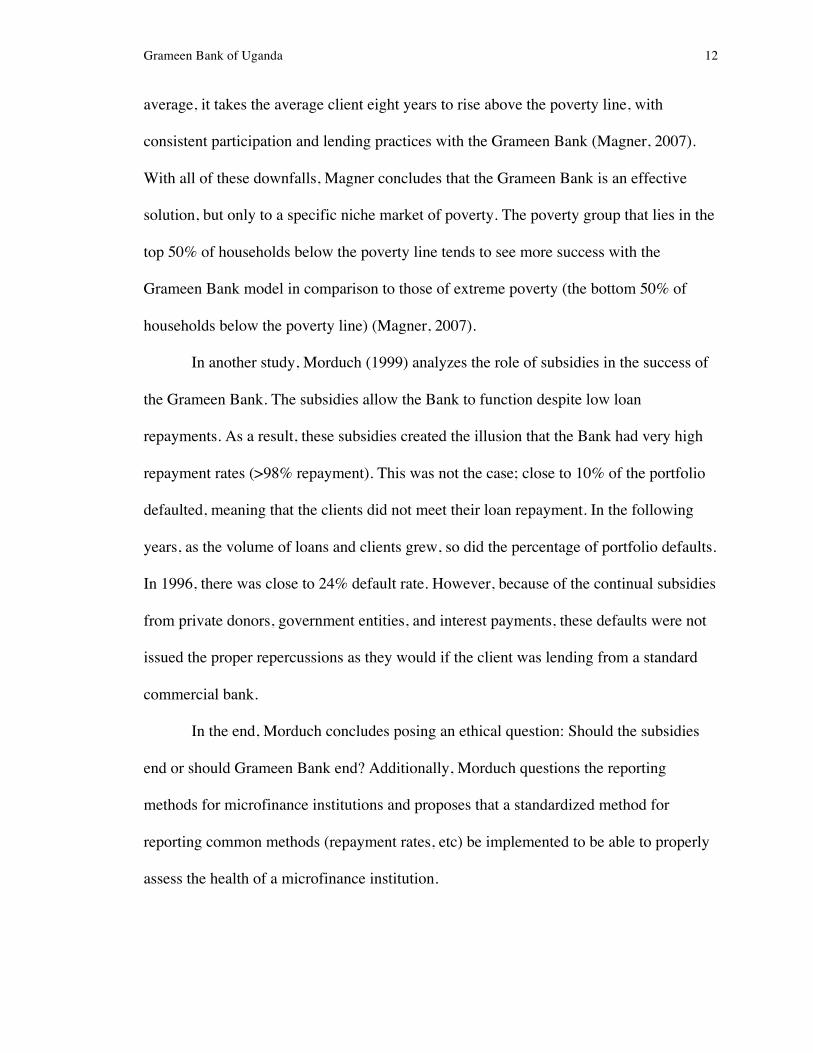
average, it takes the average client eight years to rise above the poverty line, with
consistent participation and lending practices with the Grameen Bank (Magner, 2007).
With all of these downfalls, Magner concludes that the Grameen Bank is an effective
solution, but only to a specific niche market of poverty. The poverty group that lies in the
top 50% of households below the poverty line tends to see more success with the
Grameen Bank model in comparison to those of extreme poverty (the bottom 50% of
households below the poverty line) (Magner, 2007).
In another study, Morduch (1999) analyzes the role of subsidies in the success of
the Grameen Bank. The subsidies allow the Bank to function despite low loan
repayments. As a result, these subsidies created the illusion that the Bank had very high
repayment rates (>98% repayment). This was not the case; close to 10% of the portfolio
defaulted, meaning that the clients did not meet their loan repayment. In the following
years, as the volume of loans and clients grew, so did the percentage of portfolio defaults.
In 1996, there was close to 24% default rate. However, because of the continual subsidies
from private donors, government entities, and interest payments, these defaults were not
issued the proper repercussions as they would if the client was lending from a standard
commercial bank.
In the end, Morduch concludes posing an ethical question: Should the subsidies
end or should Grameen Bank end? Additionally, Morduch questions the reporting
methods for microfinance institutions and proposes that a standardized method for
reporting common methods (repayment rates, etc) be implemented to be able to properly
assess the health of a microfinance institution.

Grameen Bank of Uganda 13
In Odell’s 2010 study, she poses the question: Does microfinance work? She
analyzes this question based on a case study analysis of the Grameen Bank and a
comparison of various studies on the topic. The conclusions were very similar to
Magner’s conclusions. Odell concluded the Grameen Bank is an effective method to
alleviate poverty for the “entrepreneurial poor” (Odell, 2010). For other population
segments, the success rate is much lower and not as consistent.
Odell proposes that in order for microfinance to be a “tool to alleviate poverty,” a
suite of programs and products must be offered. Similar to ACCION International and
Kiva, institutions should provide lending and saving institutions. In doing so, these
institutions are teaching their clients to be financially aware individuals (Odell, 2010).
The final study I looked at is Schreiner’s Cost-Effectiveness Analysis of the
Grameen Bank of Bangladesh (2003). In this study, Schreiner conducts a cost-benefit
present value analysis of the Grameen Bank understand whether or not this industry is a
lucrative investment. His findings state that this specific MFI, and more broadly, this
industry, as a whole, is worth the investment.
More interestingly, Schreiner compares his analysis to Morduch (1999) and states
how Morduch “misunderstood” the role of subsidies for the Grameen Bank. Instead of
hindering the Bank’s abilities long term, Schreiner claims that these subsidies provide a
“unique” manner through which the Grameen Bank can mitigate their losses while
continuing to lend out the micro-loans. Additionally, Schreiner factored in the social
(noneconomic) benefits through metrics and algorithms he created. Morduch (1999) only
speculated about the related noneconomic factors and did not include these variables in
his calculations. For MFIs within Uganda, subsidies play a large role. The government
Grameen Bank of Uganda 14
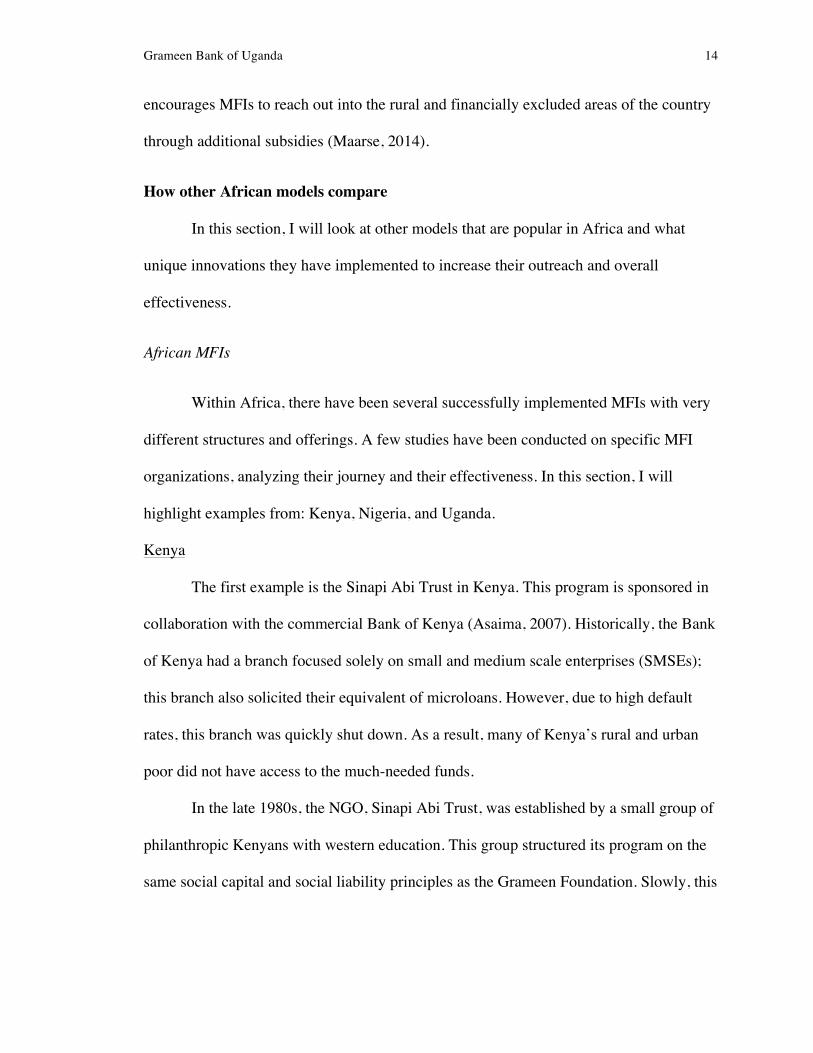
encourages MFIs to reach out into the rural and financially excluded areas of the country
through additional subsidies (Maarse, 2014).
How other African models compare
In this section, I will look at other models that are popular in Africa and what
unique innovations they have implemented to increase their outreach and overall
effectiveness.
African MFIs
Within Africa, there have been several successfully implemented MFIs with very
different structures and offerings. A few studies have been conducted on specific MFI
organizations, analyzing their journey and their effectiveness. In this section, I will
highlight examples from: Kenya, Nigeria, and Uganda.
Kenya
The first example is the Sinapi Abi Trust in Kenya. This program is sponsored in
collaboration with the commercial Bank of Kenya (Asaima, 2007). Historically, the Bank
of Kenya had a branch focused solely on small and medium scale enterprises (SMSEs);
this branch also solicited their equivalent of microloans. However, due to high default
rates, this branch was quickly shut down. As a result, many of Kenya’s rural and urban
poor did not have access to the much-needed funds.
In the late 1980s, the NGO, Sinapi Abi Trust, was established by a small group of
philanthropic Kenyans with western education. This group structured its program on the
same social capital and social liability principles as the Grameen Foundation. Slowly, this

Grameen Bank of Uganda 15
group grew and the Bank of Kenya reached out for a partnership and offered a larger pool
of capital to distribute loans from (Asaima, 2007).
Asaima (2007) analyzes this group’s history and its current synergy with the
government and concludes that such integration is only possible with a stable political
system and a strong subsidy base. Kenya’s government stabilized after the early 1980s
and with the Bank of Kenya supporting the Sinapi Abi Trust, up to 20% of the defaults
are backed (Asaima, 2007).
Nigeria
In Nigeria, Yahaya (2011) did a study to understand the effect of microfinance
ventures in the Kwara State of Nigeria. His findings revealed that the microfinance
institutions have the ability to “greatly impact the economy, for the better” (Yahaya,
2011). As a result, Yahaya recommends that the government partner with these entities to
provide the proper infrastructure and transportation methods to most efficiently meet the
populations in need of these financial services. Currently, 60% of all Nigerian MFIs are
located in urban settings while 70% of the need for MFIs is in rural settings (Yahaya,
2011). However, Yahaya discusses how such partnership may not be possible for the near
future given the political instability within Nigeria (Yahaya, 2011).
In both of these sources, Yahaya (2011) and Asaima (2007) highlight the
importance of government interaction and government synergies in order to further the
reach of microfinance institutions.
Uganda
In Uganda, there have been several noteworthy studies completed on various
microfinance entities as well as the industry as a whole. First, I will discuss Kagaba and

Grameen Bank of Uganda 16
Kirya’s overview of The State of Microfinance in Uganda (2013). Then, I will compare
Jarotschkin’s (2013) specific examples from the space, as well as the Grameen Bank’s
presence in Uganda.
Kagaba and Kirya (2013) present an overview of the financial sector of Uganda
and discuss how microfinance plays a large role in the country’s financial activities.
However, the Ugandan government poses unique requirements of such organizations
within the country. These organizations must be recognized and registered with the
government in order to serve as depository institution (MDIs) (Kagaba & Kirya, 2013).
Without this government recognition, MFI organizations can only lend; they cannot hold
the savings of individuals or accumulate interest from payments for an increased
principal base (Kagaba & Kirya, 2013).
Additionally, Kagaba and Kirya (2013) recognize the major problem within
Uganda—majority of the microfinance need lies in the northern rural populations while
most of the microfinance institutions are based in southern urban areas. This issue
appears to be a consistent theme throughout the entire African region.
Jarotschkin (2013) discusses how certain microfinance institutions within Uganda
have implemented interesting partner programs to grow their depositor rates. One
noteworthy initiative focused on women empowerment. Jarotschkin (2013) found that
one MFI with 68% women borrowers had a much higher repayment rate in comparison to
an MFI with a rate closer to 50% women borrowers.
Kendall (2012) discusses how mobile banking is a popular microfinance program
being implemented in Uganda and several other African nations. The number of mobile
phones per household in sub-Saharan Africa was 65% in 2013, up from 26% in 2008,
Grameen Bank of Uganda 17
with 27% of the growth in rural regions (Tortora, 2014). These devices increase access to
rural Africa, regions that Basu and Blavy (2004) describe as “financial deserts” or regions
with little to no access to financial institutions. Understanding that this was a problem,
the Bill & Melinda Gates Foundation funded a mobile money initiative in Uganda
(Kendall, 2012). Mobile money has been a rapidly growing program all over the world to
help increase access to financial services; this industry has predicted growth of 63% by
2017 (Kurkinen, 2012). This program utilizes virtual money to facilitate financial
obligations between various parties (Kendall, 2012). This program provides a secure and
safe alternative to the typical brick and mortar lending facility while increasing ease of
access through a secure wireless network.
Finally, Linthorst (2013) discusses why the Grameen Bank of Uganda is not as
successful as many of its other global locations. The structure of the Grameen Bank MFI
relies on social capital of non-family members and the interaction with a financial loan
officer once a week (Yunus, 1999). Linthorst (2013) found that the family unit is very
strong within Uganda and the base population prefers to lend within family than without.
Additionally, given the political instability outside urban settings, the loan officer may
not be able to travel to the various groups and centers for the weekly meetings. Though
the Grameen Bank has made constant strides to reach out to the rural populations, the
inconsistency has cast a negative light on the reputation of the Grameen Bank in Uganda
(Linthorst, 2013).
After understanding all of the existing literature, I recognize that there is a need to
fix the Grameen Bank’s model, specifically for Uganda. Many of the researchers
discussed above, provide “best practices” and methods for analyzing the effectiveness of

Grameen Bank of Uganda 18
various microfinance institutions, but none of the researchers attempt to take a specific
model and improve the institution within Uganda. Additionally, many of the researchers
look solely at quantitative variables or qualitative variables. I hope to analyze the
Grameen Foundation in Uganda, by comparing this MFI to other MFIS in a peer group,
quantitatively and qualitatively, and make recommendations on how to best improve this
microfinance program through programs better targeted at the Ugandan demographic. My
research will be structured as a case study, combining many of the research methods
mentioned above in a quantitative and qualitative analysis.

Grameen Bank of Uganda 19
III. RESEARCH METHODOLOGY
My research methodology will include both qualitative and quantitative analysis
to determine how to best improve the Ugandan Grameen Bank model. A quantitative
analysis will be conducted first to group together similar microfinance institutions to
better compare the Grameen Foundation to others in its peer group. Once these groups
are established, I will conduct a qualitative analysis to highlight the similarities and
differences across the groups and institutions.
This section will discuss: data selection, quantitative analysis, qualitative analysis,
and limitations.
Data Selection
My quantitative approach to my research involves comparing various
microfinance institutions, of the hundreds that exist, to the Grameen Bank of Uganda to
gauge a sense of its effectiveness against similar organizations. I chose my microfinance
institutions based on the following criteria:
1) Organizations that lie in the central and eastern regions of the African
subcontinent
2) Organizations that are classified as microfinance institutions (MFIs), micro-
depository institutions (MDIs), and bank-owned micro-lending practices

Grameen Bank of Uganda 20
3) Organizations with data reported on the Microfinance Information Exchange
(MIX, 2014a, b, c, d)
I am looking at the countries in this geographic location because the
demographics and geographic layout of the countries are fairly similar to Uganda—with a
large percentage of the microfinance organizations located in urban settings and a large
percentage of the need located in rural villages (Linthorst, 2013). The countries I chose
are: Kenya, Nigeria, Tanzania, and Uganda because Linhorst (2013) used a similar set of
countries in his comparison for his research on microfinance inclusion and policy.
I narrowed my scope to three specific types of organizations—MFIs, MDIs, and
banks—because both the micro-depository and the bank-owned organizations seem to be
gaining popularity in other countries and may present possible solutions for the Ugandan
Grameen Bank. Please refer back to the literature review for more in depth explanation
for the differences between these three types of organizations.
Finally, the selected organizations have some data present in the Microfinance
Information Exchange (MIX, 2014a, b, c, d). There are more than 100 different
institutions that offer microfinance products in each of the four countries I am looking at.
However, most of these organizations have outdated data and no updated profiles. After
filtering the data, only 50 organizations have consistent published data from 2013. From
there, I excluded organizations labeled as SACCOs (savings and credit cooperatives).
These organizations are collaborated institutions that are typically partnered with
government entities (Kariobangi, 2012). Additionally, these entities are only found in two
of the four of my chosen countries. Finally, I included organizations that have appeared
in prior microfinance literature as noteworthy institutions.
Grameen Bank of Uganda 21
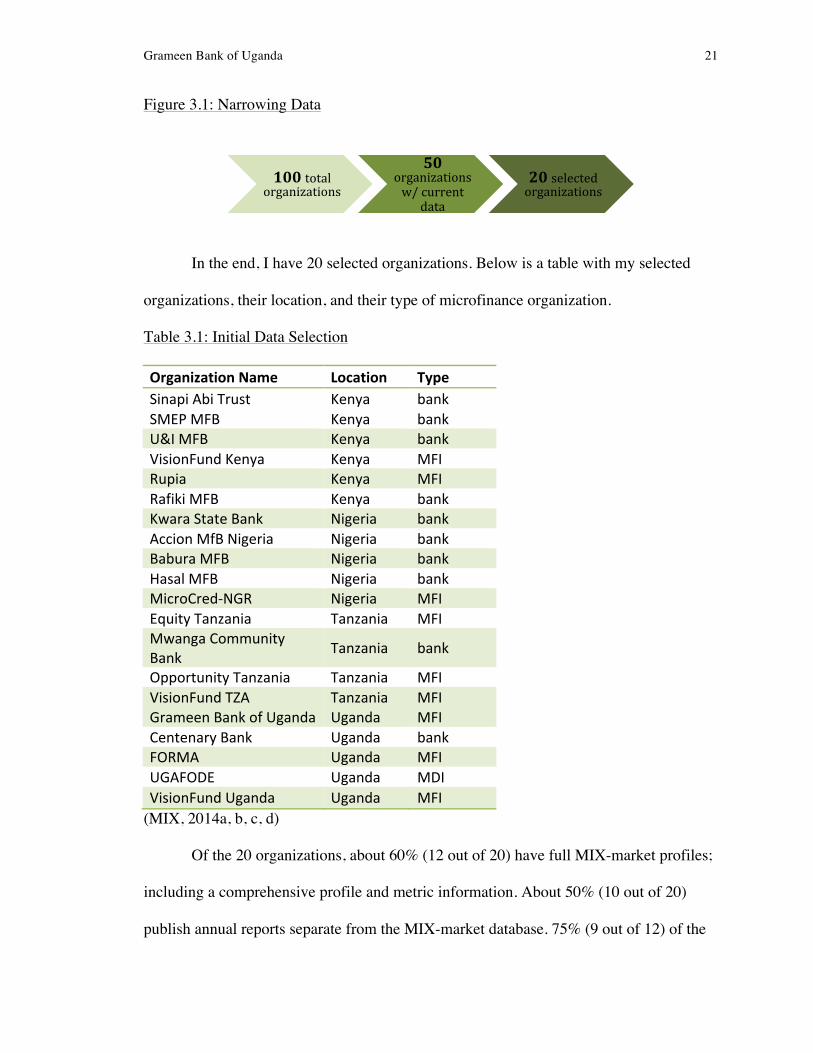
Figure 3.1: Narrowing Data
In the end, I have 20 selected organizations. Below is a table with my selected
organizations, their location, and their type of microfinance organization.
Table 3.1: Initial Data Selection
Organization Name Location Type Sinapi Abi Trust Kenya bank SMEP MFB Kenya bank U&I MFB Kenya bank VisionFund Kenya Kenya MFI Rupia Kenya MFI Rafiki MFB Kenya bank Kwara State Bank Nigeria bank Accion MfB Nigeria Nigeria bank Babura MFB Nigeria bank Hasal MFB Nigeria bank MicroCred-‐NGR Nigeria MFI Equity Tanzania Tanzania MFI Mwanga Community Bank Tanzania bank
Opportunity Tanzania Tanzania MFI VisionFund TZA Tanzania MFI Grameen Bank of Uganda Uganda MFI Centenary Bank Uganda bank FORMA Uganda MFI UGAFODE Uganda MDI VisionFund Uganda Uganda MFI
(MIX, 2014a, b, c, d)
Of the 20 organizations, about 60% (12 out of 20) have full MIX-market profiles;
including a comprehensive profile and metric information. About 50% (10 out of 20)
publish annual reports separate from the MIX-market database. 75% (9 out of 12) of the
100 total organizations
50 organizations w/ current
data
20 selected organizations

Grameen Bank of Uganda 22
organizations that publish data on MIX-market also have separate annual reports
available off the organizations’ websites. 20% (4 out of 20) of the organizations provide
only basic metrics and do not have any form of reporting extensive financial data.
All of the data I will be analyzing is self-reported data from each of the
institutions; therefore, the data may contain some bias in terms of what data each
institution chooses to report and withhold. Additionally, I understand that by limiting the
types of organizations and the locations of these organizations, I may not be addressing
all of the possible factors that contribute to successful MFIs.
Quantitative Analysis My quantitative analysis serves as the first step for my research. I have used some
commonly used financial ratios as well as a few variables I created to help quantify the
effectiveness of my selected microfinance institutions. My goal is to find a relationship
between any of these variables to help segment my data for my qualitative analysis of the
programs offered by these institutions. I will run regressions to determine the correlations
between the different variables to find out if there is any causal relationship between any
two factors. In the end, I will compare the various segmented groups to the Grameen
Foundation to best provide recommendations for how the Grameen Bank of Uganda can
improve its operations and outreach.
The variables I will be using in my analysis are:
• Capital Asset Ratio
• Debt/Equity Ratio
• Deposits/Loans
• Cost/Borrower
Grameen Bank of Uganda 23
• Cost/Depositor
• % Women Outreach
• % Rural Penetration
• % Technology Integration
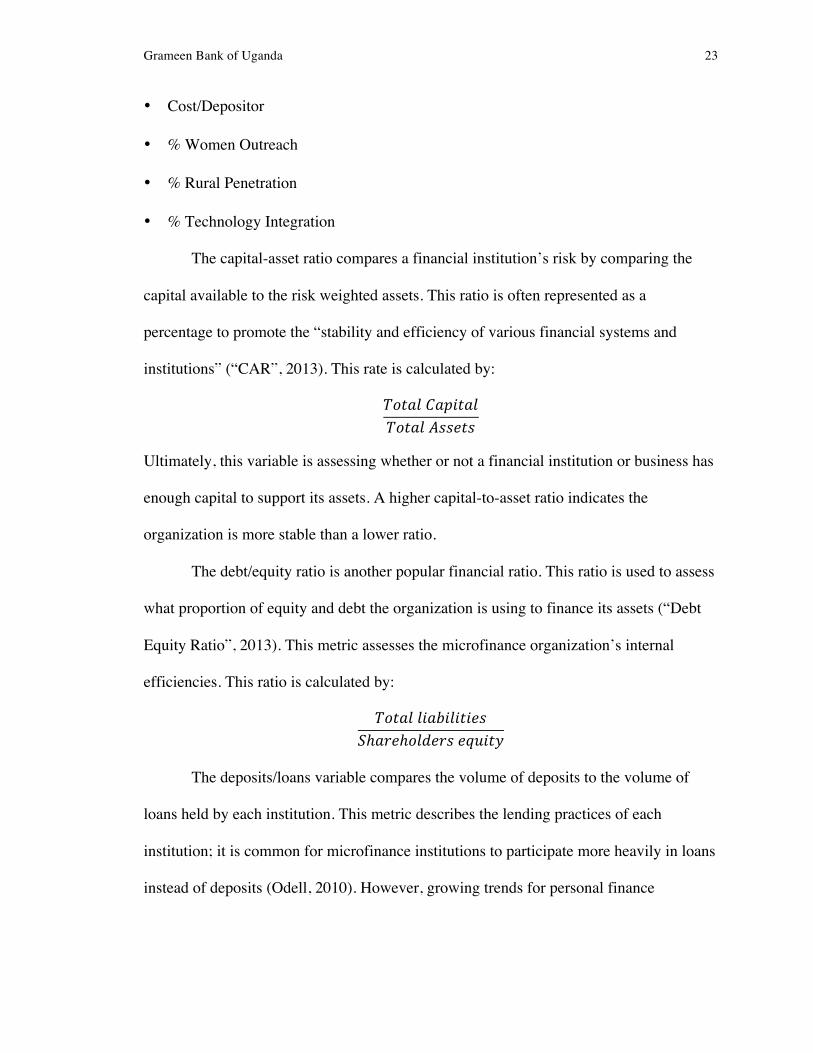
The capital-asset ratio compares a financial institution’s risk by comparing the
capital available to the risk weighted assets. This ratio is often represented as a
percentage to promote the “stability and efficiency of various financial systems and
institutions” (“CAR”, 2013). This rate is calculated by:
𝑇𝑜𝑡𝑎𝑙 𝐶𝑎𝑝𝑖𝑡𝑎𝑙𝑇𝑜𝑡𝑎𝑙 𝐴𝑠𝑠𝑒𝑡𝑠
Ultimately, this variable is assessing whether or not a financial institution or business has
enough capital to support its assets. A higher capital-to-asset ratio indicates the
organization is more stable than a lower ratio.
The debt/equity ratio is another popular financial ratio. This ratio is used to assess
what proportion of equity and debt the organization is using to finance its assets (“Debt
Equity Ratio”, 2013). This metric assesses the microfinance organization’s internal
efficiencies. This ratio is calculated by:
𝑇𝑜𝑡𝑎𝑙 𝑙𝑖𝑎𝑏𝑖𝑙𝑖𝑡𝑖𝑒𝑠𝑆ℎ𝑎𝑟𝑒ℎ𝑜𝑙𝑑𝑒𝑟𝑠 𝑒𝑞𝑢𝑖𝑡𝑦
The deposits/loans variable compares the volume of deposits to the volume of
loans held by each institution. This metric describes the lending practices of each
institution; it is common for microfinance institutions to participate more heavily in loans
instead of deposits (Odell, 2010). However, growing trends for personal finance

Grameen Bank of Uganda 24
education is increasing the amounts of deposits and depository institutions, particularly in
Africa (Basu & Blavy, 2004). This ratio is calculated by:
𝑇𝑜𝑡𝑎𝑙 𝑉𝑜𝑙𝑢𝑚𝑒 𝑜𝑓 𝐷𝑒𝑝𝑜𝑠𝑖𝑡𝑠𝑇𝑜𝑡𝑎𝑙 𝑉𝑜𝑙𝑢𝑚𝑒 𝑜𝑓 𝐿𝑜𝑎𝑛𝑠
The next two variables are cost per borrower and cost per depositor. These ratios
describe how much each institution invests in their depository and loan practices.
Typically, larger and more established institutions have lower costs. These ratios are
calculated by:
𝑇𝑜𝑡𝑎𝑙 𝐶𝑜𝑠𝑡 𝑜𝑓 𝑃𝑟𝑜𝑣𝑖𝑑𝑖𝑛𝑔 𝐷𝑒𝑝𝑜𝑠𝑖𝑡𝑠 𝑇𝑜𝑡𝑎𝑙 𝑁𝑢𝑚𝑏𝑒𝑟 𝑜𝑓 𝐷𝑒𝑝𝑜𝑠𝑖𝑡𝑜𝑟𝑠
𝑇𝑜𝑡𝑎𝑙 𝐶𝑜𝑠𝑡 𝑜𝑓 𝑃𝑟𝑜𝑣𝑖𝑑𝑖𝑛𝑔 𝐿𝑜𝑎𝑛𝑠𝑇𝑜𝑡𝑎𝑙 𝑁𝑢𝑚𝑏𝑒𝑟 𝑜𝑓 𝐵𝑜𝑟𝑟𝑜𝑤𝑒𝑟𝑠
The next three metrics are measure the social and demographic impact of the
institutions; the first is % women outreach. This metric measures how many outreach
programs each institution offers specifically targeted towards women. This variable is
calculated by dividing the number of programs for women by the total programs offered
by each institution:
𝑁𝑢𝑚𝑏𝑒𝑟 𝑜𝑓 𝑝𝑟𝑜𝑔𝑟𝑎𝑚𝑠 𝑓𝑜𝑟 𝑊𝑜𝑚𝑒𝑛𝑁𝑢𝑚𝑏𝑒𝑟 𝑜𝑓 𝑡𝑜𝑡𝑎𝑙 𝑝𝑟𝑜𝑔𝑟𝑎𝑚𝑠 𝑜𝑓𝑓𝑒𝑟𝑒𝑑
The next variable is % rural penetration. First, I found a geographic map of an
institution’s locations throughout a specific country and then I cross-listed this map with
a map showing the population breakdown by region. These resources were available on
the MIX market. Any location established in a region where the total population is less
than 20% of the overall population is classified as rural. Finally, I took the rural office
locations over the total number of offices established to calculate the % rural penetration:

Grameen Bank of Uganda 25
𝑁𝑢𝑚𝑏𝑒𝑟 𝑜𝑓 𝑅𝑢𝑟𝑎𝑙 𝑂𝑓𝑓𝑖𝑐𝑒 𝐿𝑜𝑐𝑎𝑡𝑖𝑜𝑛𝑠𝑁𝑢𝑚𝑏𝑒𝑟 𝑜𝑓 𝑇𝑜𝑡𝑎𝑙 𝑂𝑓𝑓𝑖𝑐𝑒𝑠
Rural penetration describes the amount of offices that are located outside the main
populated regions within each nation. For many of the countries in Africa, the need for
financial inclusion is strongest in rural settings (Jarotschkin, 2013). It is important for
MFIs to have a presence in these regions in order to bring about the most change for
these populations.
The final variable is % technology integration. This variable describes the amount
of new technologies that have been integrated into the programs of these institutions to
better reach and serve their clientele. Such technologies include utilizing mobile banking
and mobile money; this is a growing field of access, especially in Africa, because as of
2013, nearly 65% of all African households owned at least one mobile device (Tortora,
2014). This variable is calculated by:
𝑁𝑢𝑚𝑏𝑒𝑟 𝑜𝑓 𝑝𝑟𝑜𝑔𝑟𝑎𝑚𝑠 𝑤𝑖𝑡ℎ 𝑡𝑒𝑐ℎ𝑛𝑜𝑙𝑜𝑔𝑦 𝑖𝑛𝑡𝑒𝑔𝑟𝑎𝑡𝑖𝑜𝑛𝑁𝑢𝑚𝑏𝑒𝑟 𝑜𝑓 𝑡𝑜𝑡𝑎𝑙 𝑝𝑟𝑜𝑔𝑟𝑎𝑚𝑠 𝑜𝑓𝑓𝑒𝑟𝑒𝑑
After analyzing all these variables, I will run correlations to see what variables
have the strongest relationships and use those variables to classify my data into two
groups to compare and contrast with the rest of the variables.
Qualitative Research Once the two groups have been formed, I will compare them based on other
quantitative factors, but I will also dive deeper into the various facets and differentiating
factors of these institutions based on their programs and product offerings. The specific
types of offerings I will be looking into include:
• Programs specifically targeted at women

Grameen Bank of Uganda 26
• Technology integrated programs
• Programs for student education
• Programs for improving personal finance skills
Financial programs for women are targeted initiatives that many microfinance
organizations implement in order to reach out to women entrepreneurs. Women in
microfinance tend to have higher loan repayment rates and tend to bring more income
home to the family (Basu & Blavy, 2004). As a result, many microfinance organizations
want to focus on women in order to bring about a greater impact in rural African
communities (Basu & Blavy, 2004).
Mobile banking and mobile money are technology-integrated programs that
provide a banking platform synced through mobile devices with “virtual money.” These
types of programs are more readily available and secure than other banking
infrastructures in rural Africa (Kendall, 2012). Given the increasing amount of mobile
devices found in Africa, many microfinance and mobile phone providers have been
jumping to meet the demand in this market (Tortora, 2014).
Another popular program offering is for student education. Some MFIs believe
that one of the top ways to improve a nation’s economy is to provide more opportunity
and education for the youth (Asaima, 2007). Therefore, investing in the youth early on
may reap benefits in years to come. These programs sponsor and assist with student loans
and schooling fees for families that want to educate their children.
The final type of program offering is a program for improving personal finance
skills. These programs are highly educational and encourage clientele to engage in both
borrowing and depository practices. As previously mentioned, the culture in these

Grameen Bank of Uganda 27
African nations is not keen on allowing an external party to handle financial matters;
therefore, these sorts of programs have not done very well in these regions (Maarse,
2014).
In addition to comparing and contrasting the program-based data, I will also
compare using averages and medians of the variables previously mentioned to understand
how the two groups are differentiated and see if there are any overlaying trends in the
data. Finally, I will use this data analysis to discuss how my data relates to the pre-
existing literature in this space. I will also make some recommendations for the Ugandan
Grameen Bank for how they can best improve their operations to match the success of
their peer group.
Limitations One of the biggest limitations of my research is the potential bias present in all the
raw data I am analyzing. Because there is no standardized manner or need for
microfinance institutions to report data, every institution only reports what they feel is
necessary, or what they may excel in. These institutions can very easily hide any flaws in
their programs and cover up any shortcomings their programs may face.
As a result, there is a lack of institutions that report consistent data. I only have 20
observations that I will be analyzing in this paper. Because this sample size is so low, an
outlier in the group can easily skew these numbers. However, I hope my careful selection
of institutions will help alleviate this issue and generate noteworthy results.

Grameen Bank of Uganda 28
V. RESULTS
The first step in conducting my research is to run a regression analysis between
different combinations of the variables I have data for to see if any strong relationships
materialize. These regressions helped determine whether or not there is an actual causal
relationship between any of these given variables. For this exercise, I analyzed the
following relationships:
• Rural penetration vs Loan size
• Rural penetration vs Deposits/Loans
• Rural penetration vs Women outreach
• Technology involvement vs Rural penetration
• Volume of deposits vs Technology involvement
• Cost/Borrower vs Rural penetration
• Cost/Loan vs Rural penetration
I chose to look at these relationships because they have been cited as important
and related factors in some of the literature including Jarotschkin’s Financial Sector
Development in Africa (2013), Basu and Blavy’s Microfinance in Africa: Experience and
Lessons from Selected African Countries (2004), and Odell’s Measuring the Impact of
Microfinance (2010). Additionally, the Grameen Foundation values women
Grameen Bank of Uganda 29
empowerment and rural outreach. Therefore, I chose to look more closely at these two
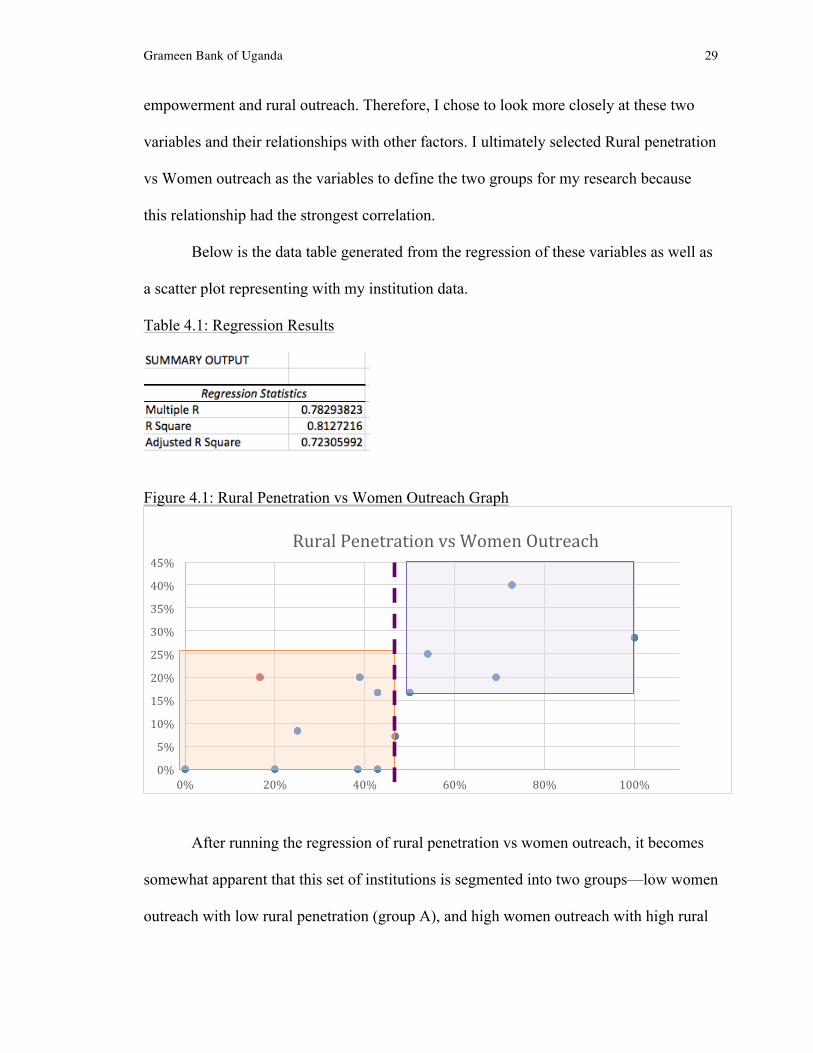
variables and their relationships with other factors. I ultimately selected Rural penetration
vs Women outreach as the variables to define the two groups for my research because
this relationship had the strongest correlation.
Below is the data table generated from the regression of these variables as well as
a scatter plot representing with my institution data.
Table 4.1: Regression Results
Figure 4.1: Rural Penetration vs Women Outreach Graph
After running the regression of rural penetration vs women outreach, it becomes
somewhat apparent that this set of institutions is segmented into two groups—low women
outreach with low rural penetration (group A), and high women outreach with high rural
0%
5%
10%
15%
20%
25%
30%
35%
40%
45%
0% 20% 40% 60% 80% 100%
Rural Penetration vs Women Outreach
Grameen Bank of Uganda 30
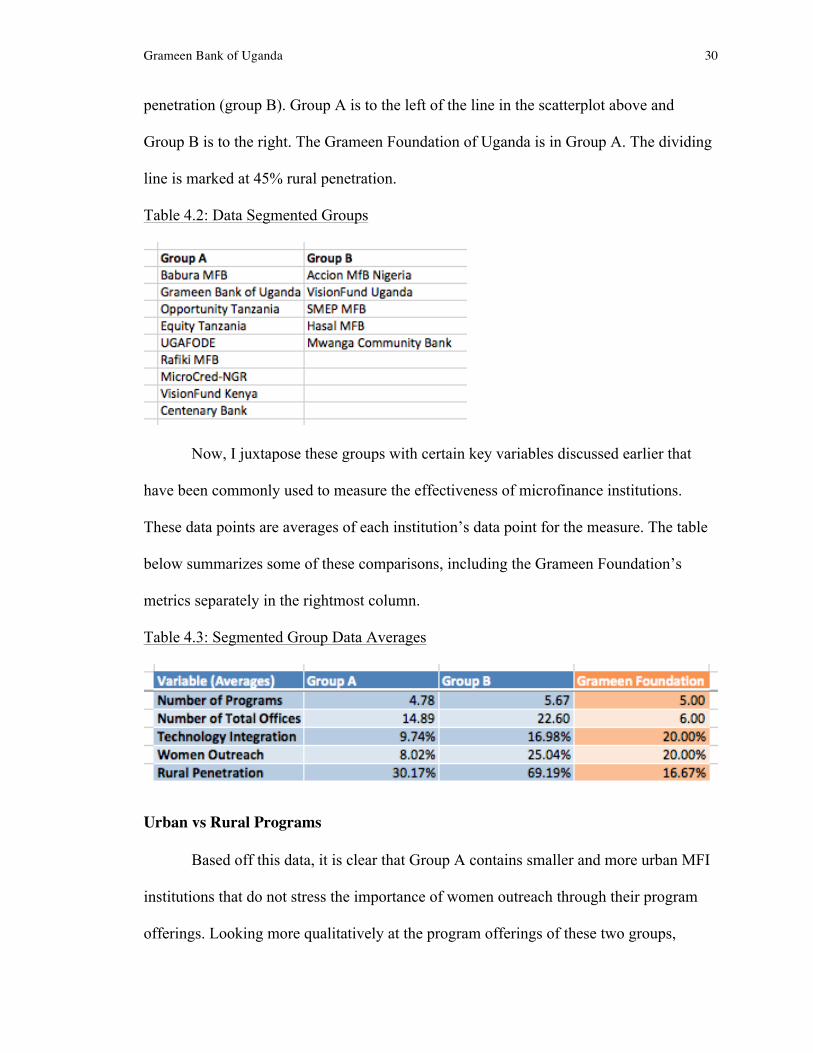
penetration (group B). Group A is to the left of the line in the scatterplot above and
Group B is to the right. The Grameen Foundation of Uganda is in Group A. The dividing
line is marked at 45% rural penetration.
Table 4.2: Data Segmented Groups
Now, I juxtapose these groups with certain key variables discussed earlier that
have been commonly used to measure the effectiveness of microfinance institutions.
These data points are averages of each institution’s data point for the measure. The table
below summarizes some of these comparisons, including the Grameen Foundation’s
metrics separately in the rightmost column.
Table 4.3: Segmented Group Data Averages
Urban vs Rural Programs Based off this data, it is clear that Group A contains smaller and more urban MFI
institutions that do not stress the importance of women outreach through their program
offerings. Looking more qualitatively at the program offerings of these two groups,

Grameen Bank of Uganda 31
Group A tends to have more programs focused on youth education and schooling than
Group B. For instance, Opportunity Tanzania offers an education finance program that
includes school fees loans and school improvement loans and VisionFund Kenya offers
their Mkopo Sokomi loan program with youth empowerment loans (Opportunity
Tanzania, 2014; KADET, 2013). These programs are heavily promoted by these MFIs
through their community outreach tactics and internet presence (Interview data, 2015).
Group B institutions offer primarily agriculture based finance loan programs,
small business programs, and personal finance programs. Many of the women outreach
programs fall under the small business programs umbrella, with programs encouraging
women to sell/trade their “womencrafts” to bring more money to their households
(Cheston, 2002). Additionally, four of the five MFIs with a strong rural presence are
classified as banks; these institutions not only offer microfinance products, but also
function as a community bank. As a result, these entities are more stable, with higher
volumes of loans and a greater ability to branch into rural areas.
Looking at the Grameen Bank relative to these two groups, the Grameen
foundation lies in Group A and follows similar trend in this group. The Grameen Bank
has similar women outreach, but much lower rural penetration than other institutions in
Group A. In contrast to the Grameen’s well known model of empowering rural women,
this specific group has been heavily involved in educational programs and technological
integration programs. Currently, this Grameen Bank is working with the Bill and Melinda
Gates Foundation to conduct a new initiative that teaches the importance of personal
finance and banking with collaborations with regional mobile money providers. This new
initiative could be one of the primary reasons this chapter is lagging in performance—too

Grameen Bank of Uganda 32
much emphasis on this new program with not enough attention on other ventures
(interview data, 2015).
Central Institutions Analysis Figure 4.2: Four Central Institutions
Another point of interest from these results are the four institutions right around
the dividing line separating Groups A and B. These points are highlighted in the red box
above. These four institutions are MicroCred-NGR, Rafiki MFB, Accion MfB Nigeria,
and SMEP MFB. The first two are in Group A and the latter two are in Group B. I
selected to look at these institutions more closely because they all are very similar in
terms of their performance in rural penetration and women outreach. Interestingly, all
four of these institutions are located in either Nigeria or Kenya. Three out of four of them
are classified as MFBs or microfinance banks—with synergies and partnerships with
national banks and government entities.
Institution Type and Location Breakdown

Grameen Bank of Uganda 33
This next graph highlights each of the plotted institutions by what type of
institution they are (MFI, MDI, or MFB) and where they are located (Nigeria, Kenya,
Tanzania, or Uganda).
Figure 4.3: Data Graph Broken down with Bank Type and Location
Key:
The different countries are spread pretty evenly across the different rates of rural
penetration and women outreach. The most successful and unsuccessful institutions are
all classified as MFBs; these institutions are found in the top right corner and bottom left
corner of the graph. Most of the MFIs and MDIs are found just left of center in the graph;
all but one are classified in Group A.
One cause for the MFBs’ levels of success could be their age. These organizations
have been around much longer than the MDIs and MFIs because they are government
sponsored (Jarotschkin, 2013). As a result, these institutions are more stable and have a
MFI MDI Bank Nigeria Kenya Uganda Tanzania
0%
10%
20%
30%
40%
50%
0% 20% 40% 60% 80% 100%
Rural Penetration vs Women Outreach

Grameen Bank of Uganda 34
better reputation in these nations. The MFBs that are not doing so well are primarily
based out of urban settings; their mission is not to spread into rural areas (Babura, 2013).
Deposits and Loans Analysis The last finding involves data surrounding the deposits and loans made by these
various institutions. Below are the group averages for deposits, loans, and the
deposits/loans ratio for Group A, Group B, and the Grameen Bank of Uganda.
Table 4.4: Borrower and Depositor Group Averages
Group A has just over $4 million in loans and $6.6 million in deposits, while
Group B has $11 million in loans and $7.6 million in deposits. It is interesting to note that
Group A has a higher volume in deposits while Group B has a higher volume in loans.
Both groups also have their loans and deposits averages within one standard deviation of
each other. The Grameen Foundation, though categorized into Group A, follows a similar
pattern with the deposit and loan volumes as Group B. However for both groups, the
deposits/loans percentage is within ~4% of each other.
Looking at the same data and taking the median instead of the average, we see
that Group B has significant outliers with one entity, SMEP MFB, being much larger than
the rest. This institution skews the average numbers accordingly.
Grameen Bank of Uganda 35
VI. DISCUSSION In this section, I will discuss the implications of my results, their relation to
existing literature for microfinance research, and my recommendations for the Grameen
Foundation of Uganda.
My results support the overall idea that women outreach is closely related with
rural penetration. Both Jarotschkin (2013) and Basu & Blavy (2004) found similar
findings with their research. Jarotschkin (2013) discussed how women in rural situations
find “house money” harder to come by. This house money helps provide clothing and
assistance for women and the children of the family. Yunus (1999) reaffirms this finding
in his book. As a result, Yunus (1999) founded the Grameen Bank’s model to aid
primarily women in these settings because the greatest change for the family can be felt
through the mother figure.
Basu & Blavy (2004) determined that rural settings provide a better starting point
for these organizations because of the trust and cultural changes that occur as a result of a
microfinance institution coming to an area. For traditional African families, many of the
personal and business financial matters are kept to the male elders of the family; trusting
an outside entity, such as an MFI or bank, with this information is a huge step away from
“normal business practices” (Basu & Blavy, 2004). However, women in these areas are

Grameen Bank of Uganda 36
more prone to participate such programs despite what the men in their family say with
hopes for a better future for their offspring (Jarotschkin, 2013).
The higher loan amounts in rural areas also reflects the shift in culture and the
growing trust rural individuals have with financial institutions. For the institutions with
higher rural penetration (categorized as Group B in my research), the loan volume is
higher than the deposits volume. The rural population is more comfortable receiving
loans from an external party than letting the external party hold their money safe through
deposits. Maarse (2014) supported this finding and expanded on the hesitatation of rural
populations to work with financial institutions by looking specficially at another
disadvantaged population—the handicapped and disabled individuals of rural Africa.
This minority faced the same oppression as many of the rural women and therefore were
also early adapters of new programs promising a better quality of life (Maarse, 2014).
Looking at institution popularity, my research differed from some of the research
in this field—namely pertaining to the types of microfinance institutions that are popular
in comparison to the less successful ventures. Morduch (1999) and Linhorst (2013)
discuss the role that government subsidies play and the popularity of government-
supported programs. These resources cited these types of programs, such as SACCOs and
MFBs are less popular due to their allegience with the governments. Because government
entities tend to be polarizing forces, countries and regions are often divided as to whether
or not they will lend with a given institution. Additionally, these institutions are heavily
reliant on government subsidies to function; because there are no external supporters for
capital, the government must absorb all defaults and faulty payments from these

Grameen Bank of Uganda 37
institutions. As a result, governments often shut down these programs and these programs
have short lives (Morduch, 1999).
However, my research supports MFBs as the more popular and successful
entities, particularly within rural populations of my select nations. Four of the main
institutions in Group B are classified as MFBs. These institutions had the highest women
outreach, highest rural penetration, and larger average loans and deposits. These
institutions have also been in existence longer than most of the organizations in Group A.
The Group B institutions average ten years old while Group A averages around five years
old. Their age and government link may be a reason for their success and presence in
more rural parts of these African nations.
Recommendations Taking all my research and findings into consideration, I have a few
recommendations for the Grameen Bank of Uganda in order to improve efficiencies and
outreach. The biggest place for improvement for this institution would be their rural
penetration. This institution needs to focus on manners through which they can reach the
villages of Uganda. Recently, the Bill and Melinda Gates Foundation have partnered with
this institution to help bring mobile money to the region and help reach more individuals.
In conjunct with this effort, the Grameen Foundation should also work towards
improving their depository practices. The more successful practices have gained their
strong holds in various communities—and maintained them—through building trust with
clients primarily by developing a strong depository institution (Kagaba & Kirya, 2013).
Yunus (1999) also stresses the importance of cultural fit and trust between the program

Grameen Bank of Uganda 38
members and employees in order to facillitate growth and longevity of programs in new
areas.

Grameen Bank of Uganda 39
VI. REFERENCES Asaima, J. (2007). Microfinance in Ghana: An Overview. Retrieved from Bank of Ghana, Economics Web Institute: http://www.economicswebinstitute.org/essays/microfinanceghana.htm Basu, A., & Blavy, R. (2004). Microfinance in Africa: Experience and Lessons from Selected African Countries. Retrieved from The International Monetary Fund: https://www.imf.org/external/pubs/cat/longres.aspx?sk=17710.0 Brau, J., & Woller, G. (2004). Microfinance: A comprehensive review of existing literature. Journal of Entrepreneurial Finance, 9 (1), 1-27. Cheston, S. (2002). Empowering Women through Microfinance. Retrieved from GlobalCitizen.net: http://storage.globalcitizen.net/data/topic/knowledge/uploads/201101311419705.pdf Cull, R. (2014). Benchmarking the Performance, Growth, and Outreach of Microfinance Institutions in SubSaharan Africa. Retrieved from The Microfinance Gateway: http://www-wds.worldbank.org/external/default/WDSContentServer/WDSP/IB/2014/09/15/000158349_20140915084416/Rendered/PDF/WPS7029.pdf Helms, B. & Goodwin-Groen, R. (2006). The History of Microfinance. Retrieved from Global Envision: https://www.globalenvision.org/library/4/1051 Jarotschkin, A. (2013). Microfinance of Africa. In T. Beck & S Maimbo (Eds.), Financial Sector Development in Africa (pp. 7-38). Retrieved from https://openknowledge.worldbank.com/bitstream/handle/10986/11881/9780821396285.pdf?sequence=2#page=29 Kagaba, S. & Kirya, J. (2013). Country & Financial Sector Overview. The State of Microfinance in Uganda (pgs 4-25). Retrieved from http://www.amfiu.org.ug/images/docs/Studies/State%20of%20Microfinance%20in%20Uganda.pdf Kariobangi, M. (2012). Differences between SACCOS, MFIS, and Banks. Retrieved from Kariobangi Finance: http://kariobangi.com/2012/11/26/differences-between-saccos-mfis-and-banks/ Kendall, J. (2012). Mobile Money in Uganda. Retrieved from The Microfinance Gateway: http://www.microfinancegateway.org/sites/default/files/mfg-en-paper-mobile-money-in-uganda-use-barriers-and-opportunities-oct-2012.pdf Kurkinen, L. (2012). Mobile Money in Emerging Markets. Retrieved from BerginSight: http://www.berginsight.com/ReportPDF/ProductSheet/bi-mm2-ps.pdf

Grameen Bank of Uganda 40
Linthorst, A. (2013). Uganda Map of Financial Inclusion: Analysing datasets for better policy decision-making. Retrieved from The Microfinance Information Exchange: http://www.themix.org/publications/mix-microfinance-world/2013/07/uganda-map-financial-inclusion-analyzing-datasets-better-policy-decision-making Maarse, A. (2014). From Financial Exclusion to Formal Inclusion: Empirical Evidence from the Microfinance and Disability Project in Uganda. Retrieved from: http://www.light-for-the-world.org/uploads/media/financial_exclusion_formal_inclusion.pdf Magner, M. (2007). Microfinance: A Platform for Social Change. Retrieved from Grameen Foundation Publication Series: http://www.promujer.org/publications/our_publications_2_Pdf_EN_Marge%20Magner%20Paper-Grameen-2007.pdf Morduch, J. (1999). The role of subsidies in microfinance: evidence from the Grameen Bank. Journal of Development Ecoomics, 60 (1), 229-248. Odell, K. (2010). Measuring the Impact of Microfinance. Retrieved from Grameen Foundation Publication Series: http://ww.w.bankerswithoutborders.com/sites/default/files/Updated2_Measuring%20the%20Impact%20of%20Microfinance%20-%20Taking%20Another%20Look.pdf Schreiner, M. (2003). A Cost-Effectiveness Analysis of the Grameen Bank of Bangladesh. Development Policy Review, 21 (3), 357-382. Scott, C. (2014). Grameen Foundation Annual Report 2013-2014. Retrieved from Grameen Foundation: http://www.grameenfoundation.org/sites/grameenfoundation.org/files/Grameen_Foundation_2014_Annual-Report_web.pdf Tortora, B. (2014). Africa Continues Going Mobile. Retrieved from Gallup: http://www.gallup.com/poll/168797/africa-continues-going-mobile.aspx Yahaya, A. A. (2011). Effectiveness of Microfinance banks in Alleviating Poverty in Kwara State Nigeria. Global Journal of Management and Business Research , 11 (4), 13-20. Yunus, M. (1999). Banker to the Poor. New York: PublicAffairs.