Embed Size (px)
Citation preview
Improving the process ofdebugging communication patternsin 5G Layer 1
Tommi Saarinen
School of Science
Thesis submitted for examination for the degree of Master ofScience in Technology.Espoo 30.9.2019
Supervisor
Prof. Jukka K. Nurminen
Advisors
PhD Liang Wang
MSc Juha Sarmavuori

Copyright c¥ 2019 Tommi Saarinen

Aalto University, P.O. BOX 11000, 00076 AALTOwww.aalto.fi
Abstract of the master’s thesis
Author Tommi Saarinen
Title Improving the process of debugging communication patterns in 5G Layer 1
Degree programme Computer, Communication and Information Sciences
Major Computer Science Code of major SCI3042
Supervisor Prof. Jukka K. Nurminen
Advisors PhD Liang Wang, MSc Juha Sarmavuori
Date 30.9.2019 Number of pages 9+62 Language English
AbstractDebugging lower protocol layers in distributed mobile communication systemscan be a complicated and a time-consuming task. Although software toinspect communication patterns between network endpoints exist, the processmay require a lot of effort from software developers in the form of additionalsoftware installation and overall data processing to arrive into conclusions thatcan actually be used in solving reported faults in base station software and hardware.
The primary goal of this thesis is to study the required fault debugging stepsfrom 5G Layer 1 (L1) perspective. Previously, the typical workflow has consistedof acquiring a packet capture containing message exchange between endpoints,parsing it into a readable format and visually inspecting packet contents. Eventhough expert opinion is always needed in the final evaluation of a reported fault,the current process as a whole includes manual, repetitive and redundant phasesthat have potential for automation and improved tools. Thus, the priority for thisthesis is to design and implement a framework automating these steps to speed upproblem solving for L1 faults. Aside from the manual workflow, a lot of subtle faultscan easily be missed by sheer human inspection. This thesis additionally discussesthe use of graph-based modeling to automatically report discrepancies in commu-nication sequences. This goal is realized in the form of a model checker, whichis implemented to locate anomalies in message exchange with strict time constraints.
The solution proposed in this thesis reduces the number of necessary debuggingsteps significantly. It implements relevant software components required to upload,dissect, index and store packet capture data and combines all the components intoa software stack. To initiate the debugging sequence, also a clear user interfaceis included to require minimal effort from the user. The processed data in all itsintermediate steps is included in the stack and made easily sharable, which canfurther reduce the total time spent if several people are included in the process.
Keywords Distributed systems, 5G, Anomaly detection, Finite state automata

Aalto-yliopisto, PL 11000, 00076 AALTOwww.aalto.fi
Diplomityön tiivistelmä
Tekijä Tommi Saarinen
Työn nimi Kommunikaatiomallien virheenjäljitysprosessin kehittäminen 5G:n 1.kerroksella
Koulutusohjelma Computer, Communication and Information Sciences
Pääaine Tietotekniikka Pääaineen koodi SCI3042
Työn valvoja Prof. Jukka K. Nurminen
Työn ohjaajat FT Liang Wang, DI Juha Sarmavuori
Päivämäärä 30.9.2019 Sivumäärä 9+62 Kieli Englanti
TiivistelmäVirheiden jäljitys hajautettujen tietoliikennejärjestelmien alimmilla protokol-latasoilla voi olla sekä monimutkainen että hidas prosessi. Vaikka verkonpäätelaitteiden välisen kommunikaation tutkimiseen on kehitetty työkaluja, käyt-täjät joutuvat usein asentamaan ohjelmia ja ylipäänsä käsittelemään dataa paljonvikojen alkuperän paikantamiseksi tukiasemien ohjelmistoista ja laitteistoista.
Tämän diplomityön tavoitteena on tutkia vianpaikannuksen vaiheita 5G:nprotokollapinon kerroksen 1 näkökulmasta. Tähän asti työjärjestys on koos-tunut kommunikaatiota kuvaavan pakettidatan tallentamisesta, jäsentelystäja visuaalisesta pakettien sisällön tutkinnasta. Vaikka asiantuntijatietämys-tä tarvitaan aina lopulta, prosessissa on lukuisia manuaalisia, toisteisia jatarpeettomia vaiheita jotka on mahdollista automatisoida. Tämän diplomi-työn ensisijainen tavoite on osallistua fyysisen kerroksen ongelmanratkaisuanopeuttavan ohjelmiston suunnitteluun ja toteuttamiseen. Hitauden lisäksihienovaraisia virheitä saattaa jäädä visuaalisella tarkastelulla huomaamatta.Tämä diplomityö pohtii myös graafeihin perustuvan mallintamisen käyttöäautomatisoituun poikkeavuuksien paikantamiseen kommunikaatiosekvensseistä.Tämä tavoite on suoraan sidottu toteutettuun model checkeriin, jota voidaankäyttää epäsäännöllisyyksien etsimiseen sanomista, joilla on tiukat aikavaatimukset.
Tämän diplomityön tarjoama ratkaisu vähentää tarpeellisia vianpaikannuksen vai-heita huomattavasti. Se luo olennaiset ohjelmat pakettidatatiedostojen lähetykselle,paloittelulle, indeksoinnille ja tallennukselle ja yhdistää nämä kaikki yhdeksi oh-jelmistopaketiksi. Ratkaisu sisältää myös helppokäyttöisen käyttöliittymän, jottakäyttäjän työmäärä jäisi mahdollisimman vähäiseksi. Prosessoitu data kaikkinevälivaiheineen on sisällytetty tuotteeseen ja tehty helposti jaettavaksi, mikä saattaaedelleen nopeuttaa virheenjäljitysprosessia jos siihen osallistuu useita henkilöitä.
Avainsanat Hajautetut järjestelmät, 5G, Poikkeavuuksien tunnistaminen,Äärelliset tilakoneet

v
PrefaceI would like to thank my thesis advisors Liang Wang and Juha Sarmavuori as well asmy supervisor Jukka K. Nurminen for their guidance and feedback throughout thethesis. I also want to express my gratitude to Markku Niiranen and Mikko Volanenfor introducing me to Nokia 5G L1 in the first place, and my line manager MattiRintamäki for his help in providing me with a thesis topic.
To my fellow thesis workers Henry, Jesse, Miikka, Paavo and Ville, thank you for allyour time during this work. Having a group to share the pressure with truly helpedme keep pushing forward.
Last but definitely not least, I want to thank my family and friends for all the yearsduring my studies, without you I would have never made it this far.
Espoo, 30.9.2019
Tommi Saarinen
vi
ContentsAbstract iii
Abstract (in Finnish) iv
Preface v
Contents vi
Abbreviations viii
1 Introduction 11.1 Background and motivation . . . . . . . . . . . . . . . . . . . . . . . 11.2 Problem description . . . . . . . . . . . . . . . . . . . . . . . . . . . . 11.3 Goals . . . . . . . . . . . . . . . . . . . . . . . . . . . . . . . . . . . . 31.4 Scope . . . . . . . . . . . . . . . . . . . . . . . . . . . . . . . . . . . 3
2 5G motivation and use cases 52.1 Enhanced Mobile Broadband . . . . . . . . . . . . . . . . . . . . . . . 62.2 Ultra-Reliable and Low Latency Communications . . . . . . . . . . . 72.3 Massive Machine Type Communications . . . . . . . . . . . . . . . . 7
3 5G Radio Access Network architecture 93.1 Next Generation Radio Access Network . . . . . . . . . . . . . . . . . 93.2 Radio interface protocol stack . . . . . . . . . . . . . . . . . . . . . . 10
3.2.1 Radio Resource Control . . . . . . . . . . . . . . . . . . . . . 113.2.2 Service Data Adaptation Protocol . . . . . . . . . . . . . . . . 113.2.3 Packet Data Convergence Protocol . . . . . . . . . . . . . . . 123.2.4 Radio Link Control Protocol . . . . . . . . . . . . . . . . . . . 123.2.5 Medium Access Control . . . . . . . . . . . . . . . . . . . . . 123.2.6 Physical Layer . . . . . . . . . . . . . . . . . . . . . . . . . . . 13
3.3 New Radio frame structure . . . . . . . . . . . . . . . . . . . . . . . . 143.4 Data transmission and processing . . . . . . . . . . . . . . . . . . . . 16
3.4.1 Channels . . . . . . . . . . . . . . . . . . . . . . . . . . . . . . 163.4.2 Transport channel processing and physical layer control signaling 173.4.3 Spatial multiplexing in multi-antenna transmission . . . . . . 18
4 Fault management automation methods 204.1 Anomaly detection . . . . . . . . . . . . . . . . . . . . . . . . . . . . 20
4.1.1 Designing an anomaly detection system . . . . . . . . . . . . . 204.1.2 Anomaly detection and network data . . . . . . . . . . . . . . 21
4.2 Anomaly detection techniques . . . . . . . . . . . . . . . . . . . . . . 214.2.1 Rule-based detection . . . . . . . . . . . . . . . . . . . . . . . 224.2.2 Graph-based detection . . . . . . . . . . . . . . . . . . . . . . 224.2.3 Statistical detection . . . . . . . . . . . . . . . . . . . . . . . . 234.2.4 Motivation for deterministic anomaly detection . . . . . . . . 23

vii
4.3 Basics of automata theory . . . . . . . . . . . . . . . . . . . . . . . . 244.3.1 Finite State Automata and Finite State Transducers . . . . . 24
4.4 Model checking . . . . . . . . . . . . . . . . . . . . . . . . . . . . . . 27
5 Comparison of debugging processes 305.1 Current debug process in Nokia 5G L1 . . . . . . . . . . . . . . . . . 305.2 Proposed debugging solution . . . . . . . . . . . . . . . . . . . . . . . 32
5.2.1 Machi-Shark: Packet data dissection . . . . . . . . . . . . . . 335.2.2 Machi-Checker: Model checking . . . . . . . . . . . . . . . . . 345.2.3 Machi-ELK: Elastic stack integration . . . . . . . . . . . . . . 385.2.4 Machi-Web: Service combining backend components with a
web-based user interface . . . . . . . . . . . . . . . . . . . . . 395.2.5 Machi-Stack: ELK-Stack combined with Machi . . . . . . . . 41
5.3 Machi Applicability in common L1/L2 failure inspection . . . . . . . 425.3.1 Use case: Missing messages . . . . . . . . . . . . . . . . . . . 425.3.2 Use case: CRC failure for a specific message format . . . . . . 465.3.3 Use case: Multiple UE inspection . . . . . . . . . . . . . . . . 475.3.4 Use case: UE attach failure . . . . . . . . . . . . . . . . . . . 48
6 Evaluation 526.1 Discussion and future work . . . . . . . . . . . . . . . . . . . . . . . . 53
7 Conclusion 55
References 57

viii
Abbreviations
AM Acknowledged ModeAMF Access and Mobility Management FunctionAPI Application program interfaceARQ Automatic Repeat RequestBIP Base Station Intranet ProtocolBTS Base Transceiver StationCBG Codeblock GroupCP Control PlaneCP Cyclic PrefixC-RNTI Cell Radio Network Temporary IdentifierCSI Channel State InformationCSI-RS Channel State Information Reference SignalCSV Comma Separated ValuesCU Centralized UnitDCI Downlink Control InformationDU Distributed UniteMBB Enhanced Mobile BroadbandETSI European Telecommunication Standards InstituteFFT Fast Fourier TransformFSM Finite State MachineFST Finite State TransducerHARQ Hybrid Automatic Repeat RequestIFFT Inverse Fast Fourier TransformIoT Internet of ThingsIP Internet ProtocolITU International Telecommunication UnionJSON JavaScript Object NotationKPI Key Performance IndicatorL1 Layer 1L2 Layer 2LTE Long Term EvolutionMAC Medium Access ControlmMTC Massive Machine Type CommunicationsNAS Non Access StratumNR New RadioNG-RAN Next Generation Radio Access NetworkOFDM Orthogonal Frequency Division MultiplexingOPEX Operating ExpensePBCH Physical Broadcast ChannelPDCCH Physical Downlink Control ChannelPDCP Packet Data Convergence ProtocolPDSCH Physical Downlink Shared ChannelPDU Protocol Data Unit

ix
PHY Physical LayerPRACH Physical Random Access ChannelPUCCH Physical Uplink Control ChannelPUSCH Physical Uplink Shared ChannelQoS Quality of ServiceRAN Radio Access NetworkRA-RNTI Random Access Radio Network Temporary IdentifierRB Resource BlockRLC Radio Link Control ProtocolRNTI Radio Network Temporary IdentifierRT Real-TimeRRC Radio Resource ControlSDAP Service Data Adaptation ProtocolSDU Service Data UnitSSB Synchronization Signal BlockSR Scheduling RequestSRS Sounding Reference SignalTB Transport BlockTF Transport FormatTM Transparent ModeUCI Uplink Control InformationUE User EquipmentUM Unacknowledged ModeUP User PlaneURLLC Ultra-reliable and Low Latency Communications

1 Introduction
1.1 Background and motivationFault management and correction is an everyday task in mobile communicationsystems development. Since the modern communication networks are implementedas distributed systems with multiple endpoints communicating with each other bymessages, debugging them may be an arduous task. Even though the patterns visiblein the communication flow between several processes typically follow strict protocols,the asynchronous nature or simply the large amount of data can make it difficultfor humans to interpret. Time used on correcting errors is naturally away from newsoftware development, and the total number of man-hours used on debugging mayaccumulate quite high on an annual level, overall leading to a very expensive process.
As the number of required debugging steps grows, also the need for multiple toolsincreases. With no automated or otherwise streamlined process, the developer incharge of debugging may need a lot of extra effort to manage data in one tool, exportit and pass it along to another software with a specific goal such as filtering orvisualizing the data. When the data is manually processed, any information duringthe process is prone to be lost or misinterpreted, especially if the information needsto be shared in any way.
Although an expert opinion is typically required to completely solve a reported fault,many of its intermediate steps have potential for an automated approach. Additionally,the protocols in a mobile communications system typically follow strictly definedspecifications, which presents opportunities for modeling the communication withdeterministic methods. This thesis studies how the existing debugging solutionscan be enhanced and experiments on automated communication pattern anomalydetection with a solution based on model checking.
1.2 Problem descriptionThis thesis was made to Nokia Solutions and Networks, specifically to the MobileNetworks department responsible for implementing software of 5G Layer 1. Forsimplicity, the department is referred as Nokia 5G L1 in the remaining sections ofthe work. The thesis mainly focuses on messages between layers 1 and 2 (L1 andL2, respectively), which both refer to the implementations of their correspondingradio interface protocol stack layers. Particularily, the study concentrates on faultmanagement and correction from L1 standpoint.
Starting with the collection of relevant trace and log data, the current debug processin Nokia 5G L1 consists of a relatively high number of steps. A typical task inthe beginning of a fault analysis is to look for discrepancies in the captured packetdata, which, unfiltered, may reach over gigabyte file sizes with several million lines,each line representing a single transmitted or received message. Inspection of such

2
data requires installation of dedicated software combined with a means to read dataconforming to different protocols, some of which may be very specific for a singledomain. If the manual inspection does not reveal any obvious faults, the data mayneed further processing with additional tools.
In addition to the time-consuming process as a whole, a number of its steps can beconsidered repetitive or redundant. they are most of the time necessary to be repeatedby every person involved in the process. The increasing amount of participatingdevelopers may further cumulate the problem - with no unified means to share theintermediate results, repeating all the steps can often be the only way to arriveinto similar conclusions. One possibility is to share a highly filtered version of thedata, but with conventional tools this means that if the omitted data contains usefulinformation to another developer partaking in the debug process, the only way is toaccess and filter the original file again.
The existing solution in Nokia 5G L1 consists of a software called Wireshark [1],which is used to display captured packet traces, combined with customised dissectorrequired to handle different data protocols within packets. The current tools arecapable of filtering the data well and provide a graphical view to browse packets andtheir contents. Especially for larger files, however, they entail quite a large overheadwhen performing virtually any operation on the data, including opening the file forreading, filtering the data and extracting the packet dissections into a suitable formatfor further analysis. Even more importantly, the structure of the data may also makeit tedious to analyze, since the packet contents are highly nested due to multipleencapsulated protocols, which in practice means a lot of user interaction is requiredto inspect the packets.
Generally, the interesting content of a packet trace falls into one of two categories -message sequences and message parameters. The sequential interest points in the datamay include missing messages within a specific transmission burst or combinations oflonger communication patters that should still conform to a specified sequence. Anexample of the latter could involve a mobile device initially attaching to the network.The second class, message parameters, involves the inspection of the actual payloadcarried in a packet. Depending on whether it is user data or control information thatis carried within the message, the intriguing content may range from ids assignedto different devices to values of various error checks performed on the data. Sheervisual inspection of these data charasteristics is a difficult task, and a lot of subtledeviations can easily be missed without any automated support.
Apart from the aforementioned core activities in the debug process, also capturingthe packet data and reporting the fault analysis results have their shortcomings.Considering all the different phases of the whole process, a systematic approachstarting from logging, having a unified data format for the data, diagnosing thesystem all the way to reporting the results is missing.

3
1.3 GoalsThis thesis has two primary goals. Its major contribution is in designing and imple-menting a unified framework with the aim of providing a holistic solution combiningthe essential steps in the initial analysis of a fault. Reflecting on the different problemareas in the current debug workflow, the major improvements are intended to reducemanual and repetitive work that is necessary in the majority of fault analysis cases,as well as to offer an easy way to share filtered data without extraneous effort. Thecomplexity of the current debug workflow is partly due to its lacking convention ofcommon tools used, which may result in the necessity to install additional softwareto proceed in the debug process. For instance, this could include visualization ofrelevant data or just processing the data into a more compact format. To addressthis, also a clear user interface is necessary to speed up all the interaction with thedata, remove the need for additional software installation and decrease the overalltime required for debugging.
The second goal is more oriented towards an additional and automated way of pro-viding analysis on the actual problem cases. The scope of this goal is directly tiedto a proposed model checker sofware called Machi-Checker, which was the startingpoint for the whole project of enhancing fault analysis in Nokia 5G L1. The firstimplementation of Machi-Checker was finished in early 2019 by Liang Wang workingin L1 and included automated communication pattern analysis for messages betweenNokia L1 and L2 software. It quickly showed promise in detecting common faultsin the message sequences, which led to enlarging the project into other areas suchas packet dissection and data indexing for processing it more efficiently. Eventually,the project came to consist of a software stack, further involving a web-based userinterface and a backend to include all relevant software components as executableentities. The Thesis contribution to the model checker involves study of communica-tion patterns between L1 and L2, with the goal of a more fine-tuned model checkercapable of detecting potential discrepancies in the data.
The results show that the current debugging workflow can be largely streamlined.With the software stack implemented in this thesis, the user is only required to knowa single interface version number before uploading a packet capture file througha browser-based user inteface. Subsequent file processing is automated, and theinspection of resulting dataset is efficient as soon as it becomes available. Despite theseimprovements, additional sources of information such as system logs are inevitablefor most of the fault investigations to find their root causes, which leaves room forfuture development of the proposed solution.
1.4 ScopeThis thesis consists of six chapters. Chapter 2 is a high-level introduction of theevolution of mobile networks towards 5G. It explains the most significant technicalrequirements that need to be resolved with the new mobile network architecture

4
and technology, presents some of the challenges these requirements have from dataanalysis perspective as well as briefly discusses the three major use cases acting asmotivators for the next generation communication networks.
The third chapter takes a closer look at the new Radio Access Network (RAN),which is the major element responsible for enabling devices to access the networkservices. The purpose of the chapter is to introduce the major RAN changes affectingthe structure of the the new radio interface protocol stack, which is then graduallynarrowed down to theory more relevant to this thesis, concentrating on the datatransmission methods and timing between the lower layers of the protocol stack.
Chapter 4 establishes the essential background for the practical part of the thesis. Itstarts by a presenting different aspects that are necessary to consider when designingan anomaly detection system and follows with an introduction of various anomalydetection methods, more specifically those that had potential or were actually utilizedin this thesis. The chapter proceeds with the essentials of automata theory, whichpaves way for the whole model checking solution proposed later in this work. Theoryfor model checking, and its parent category system verification, are included in thesection following automata theory.
Chapter 5 provides a more detailed description of the current debug workflow inNokia 5G L1 and describes the proposed enhanced solution to the debug process,which is the contribution of this thesis. It contains an explanation of each of thedeveloped software components separately, as well as their combined solution in theform of a software stack. Having explained the role of the new software, the analysisof several real fault analysis cases using the new tools are described.
Chapter 6 evaluates the software components that were implemented to enhancedebugging workflow and discusses the shortcomings and possible future of the devel-oped solution. Finally, Chapter 7 summarizes the content of the thesis.

5
2 5G motivation and use casesSimilarily to previous generations of mobile communication networks, 5G is moti-vated by a demand for new kinds of services and an extension to the capability ofexisting technology. The ever growing number of devices requiring connection toInternet Protocol (IP) network presents the challenge of utilizing higher frequenciesto expand bandwidth for data transmission. This demand for increased bandwithcombined with reduced latency has been a recurring theme for previous mobilenetwork generations, but 5G extends the problem field to areas such as energyefficiency as well as flexibility to address specific needs of different industries. Fromthe application point-of-view, a new kind of division between human-to-machineand machine-to-machine communication can be seen. Besides the increased amountof connected devices, also the nature of communication in these different scenariosneeds to be taken into account. Pushing the idea behind these communicationtypes, the coming of 5G can also be seen as the evolution of Internet of Things(IoT) to the Internet of Everything. That is, the emphasis on machine-to-machinecommunication is broadening the IoT scope to cover people, devices and things. [2, 3]
International Telecommunication Union (ITU) has set a number of Key PerformanceIndicators (KPIs) to clarify the minimum expected requirements for the upcoming5G infrastructure, commonly described as next generation access technology [4]:
Table 1: 5G requirements and Key Performance Indicators
Requirement Downlink (DL) Uplink (UL)Peak data rate 20 Gb/s 10 Gb/s
Peak spectral efficiency 30 b/s/Hz 15 b/s/HzUser experienced data rate 100 Mb/s 50 Mb/s
5th percentileuser spectral efficiency
Indoor Hotspot 0.3 b/s/Hz 0.21 b/s/HzDense Urban 0.225 b/s/Hz 0.15 b/s/Hz
Rural 0.12 b/s/Hz 0.045 b/s/Hz
Average spectral efficiencyIndoor Hotspot 9 b/s/Hz/TRxP 6.75 b/s/Hz/TRxPDense Urban 7.8 b/s/Hz/TRxP 5.4 b/s/Hz/TRxP
Rural 3.3 b/s/Hz/TRxP 1.6 b/s/Hz/TRxP
MobilityIndoor Hotspot Stationary, PedestrianDense Urban Stationary, Pedestrian, Vehicular
Rural Pedestrian, Vehicular, High speed vehicularUser plane latency 4 ms (eMBB), 1 ms (URLLC)
Control plane latency 20 msConnection density 1 000 000 devices/km2
Energy efficiency a) Efficient data transmission in a loaded caseb) Low energy consumption when no data
Reliability
1 − 105 probability of transmitting layer 2PDU of 32 bytes in 1 ms, assuming small applicationdata and quality of coverage edge for Urban Macro-URLLCtest environment
Mobility interruption time 0 ms
(Maximum aggregated system) Bandwidth At least 100 MHz,up to 1 GHz in frequency bands above 6 GHz

6
The mobility classes in Table 1 define the following velocity ranges [4]:
• Stationary: 0 km/h
• Pedestrian: 0 km/h to 10hm/h
• Vehicular: 10 km/h to 120 km/h
• High speed vehicular: 120 km/h to 500 km/h
Many of the requirements for 5G systems have a direct effect on system complexity.The increase in supported bandwidth requires even more consideration on differenthardware configurations than before. On a general level, a higher frequency leadsto more strict timing requirements for communication, which is discussed more insection 3.3. Moreover, increased throughput demand needs to rely on highly paralleldata transmission, which is further reviewed in section 3.4.3 and the use case studyunder section 5.3. All this complexity reflects to the data level when inspectingcommunication traces between different network endpoints. Compared to LTE, thenumber of messages sent within a time window can be up to 16 times higher [5], andhigher parallelism can make the already asynchronous data even more difficult toanalyze.
One proposed division of 5G use cases are the categories, or service types, of En-hanced Mobile Broadband (eMBB), Ultra-Reliable and Low Latency Communications(URLLC) and Massive Machine Type Communications (mMTC) [2, 6]. Beyene [7]suggests a generalization of these use cases to "More throughput" (eMBB), "Morereliability" (URLLC) and "More connected devices" (mMTC). Each of the use casesfurther divides into smaller performance requirements, which are realized as KPIs.The use cases are in no way mutually exclusive, since requirements and typicalsolutions of different cases conflict with each other. This also holds true for someinternal use case requirements such as low latency and ultra-high reliability forURLLC applications. [8]
The following sections describe these three use cases, and explain how they relate tosome of the most relevant KPI values.
2.1 Enhanced Mobile BroadbandThe eMBB requirement presents a challenge in multiple dimensions. The demandfor high data rates stands for a need to improve the rates of both peak and userexperienced data. Applications such as 4K video streaming and both Augmented andVirtual Reality, due to their huge data amount requirements, will have more potentialwith increased throughput. Another major force driving 5G, "a fully connected andmobile society" [9], signifies the increasing number of devices attaching to the cellularnetwork. A higher number of connections is directly linked to the performancerequirement for device density, which sets the minimum requirement for data traffic

7
within a unit area. Affecting all the previous requirements, the aspect of mobilityshows as higher service quality demand for situations where a mobile device is movingat various, possibly high speeds. [7, 10]
Wider bandwidths, and subsequently the delivery of higher data rates calls for anexpansion to higher frequency bands. In the first part of 5G standard named release15, 3GPP [11] has designated two frequency ranges to classify these bands - FR1, alsocalled sub 6Hz spectrum, and millimeter wave spectrum FR2. FR1 covers frequenciesfrom 450 MHz to 6000 MHz, while FR2 ranges from 24.25 GHz to 52.6 GHz.
2.2 Ultra-Reliable and Low Latency CommunicationsThe emphasis in URLLC is in reduced latency with sufficient reliability to enablenew kinds of safety- or otherwise critical services. The problem is far from trivial,since striving towards higher reliability typically requires mechanisms such as packetretransmission or redundancy that in turn have a negative impact on latency. Systemdesign acknowledging these latency and reliability issues is no small task either,since the earlier communication networks have heavily leaned on human-centriccommunication needs. Albeit human users and user experience are still a centraltarget for communication network design, the emergence of machine-to-machinecommunication represents a new category of applications improving quality of life, oreven mission critical services that need the capability to be addressed more urgentlythan any other communication. [12, 13] This includes communication of self-drivingcars and environments where access to the communication network is restricted,such as outages or natural disasters. For human-centric communication, URLLC hasapplications for instance in remote surgeries, where instantaneous feedback to theuser’s actions is crucial. [6, 10]
Reliability is the probability of packet transmission success within a defined latencyrestriction. The minimum requirement of User Plane latency for URLLC is 1ms, anddepending on the application, the reliability in that time frame can require precisionranging from 1 − 105 to 1 − 107. Reliability this accurate cannot be easily achievedwith an approach similar to eMBB. Retransmission mechanisms such as Hybrid AutoRepeat Request (HARQ) would directly work against the latency requirements ofURLLC. Despite this, applications without extreme throughput requirements enablethe design of systems fulfilling URLLC criteria by sacrificing data rate while keepingpacket sizes small. [12]
2.3 Massive Machine Type CommunicationsWhere eMBB targets high data rates, mMTC requirements start from small packetsand low user data rates. On the other hand, devices in mMTC could have significantlyhigh expectations for battery life, which more elaborately means up to several yearswithout the need for maintenance. [7, 14] A single Base Transceiver Station (BTS)can also be expected to connect a massive number of devices, with estimations

8
reaching hundreds of thousands devices per single cell. Contrasted to the needs ofhuman-centric communication, this growth of device amount operating with low datarates again represents a combination that previous communication networks haven’tbeen designed for. [15]

9
3 5G Radio Access Network architectureData transmission and its timing between the lower RAN protocols play a major partin this thesis. When faults are investigated on behalf of L1, the required knowledge fordebugging includes a lot of details on system configurations and techniques used fordata transmission. In 5G, the data transmission scheme is more complex comparedto previous generations due to several alternatives for the transmission time interval.Furthermore, advancements in the signal transmitting and receiving hardware enableeven higher parallelism for the data traffic. Both of the aforementioned aspectscomplicate the structure of the transmitted data and subsequently the data tracescaptured between network endpoins such as L1 and L2. Additionally, the data isdivided into several categories depending on its type and transmission direction, andeach of the types further include different message types with various formats.
The following sections explain some of the most significant changes 5G brings tothe RAN architecture starting from a higher level view and advancing towards radiointerface protocol stack layers 2 and 1. Following that is the description of theadapted 5G New Radio (NR) physical layer time frame structure, which is also usedas a basis in the model checker design explained in section 5.2.2. Furthermore, thegeneral RAN protocol stack structure is introduced before a more detailed view intothe transmission channels and methods used especially between layers 1 and 2.
3.1 Next Generation Radio Access NetworkThe major components in mobile networks are the RAN and the core network (CN).RAN represents the infrastructure connecting User Equipment (UE), which are thedevices used to access the network services, to the network through base stations.[16, 17] The logical base transceiver station element for 5G is called gNodeB (gNB).CN offers both connectivity between gNBs as well as serves as an endpoint to networksoutside RAN. The High Layer Split of gNodeB shows the interconnectivity betweengNodeB units, their suggested split into Centralized Units (CU) and DistributedUnits (DU) as well as the interface between gNodeB and 5G CN, which is alsoabbreviated as 5GC. [18]
The introduction of the CU-DU split originates from a need to centralize RAN func-tions with the main goal of reducing their operating expense (OPEX). 3GPP RAN3working group [19] concludes that whereas the implementation lower protocols cannotbe separated from the base station due to their strict synchronization requirementsbetween each other, it is possible to isolate the remaining, higher-level protocols intoa centralized location. Besides the OPEX benefit, the functional split is intended toreduce network latency and synchronization issues, enhance real-time performanceand offer better network integration.

10
5GC
Xn
NG-RAN
gNB gNB
gNB-CU
gNB-DU gNB-DU
gNB-CU
gNB-DUgNB-DU
F1F1 F1F1
NGNG
Figure 1: NG-RAN Architecture and Higher Layer Split of gNB
In consequence of the suggested base station split, also the general architecture forthe data and signalling traffic of the NG-RAN is divided into two planes, specificallyuser plane (UP) and control plane (CP). The planes include a representation ofNetwork Functions, which essentially mean functional entities and the definition fortheir interfaces and operation within a network infrastructure [20]. Both planesdefine a diverse set of functions, but the major difference between them is thatwhereas UP concentrates on the delivery of service with user data, CP is responsiblefor enabling that service by providing a path for control signals between networkendpoints. An example of such a responsibility split is CP defining a packet routeand UP transferring the actual packet data [19, 21].
3.2 Radio interface protocol stackA separate radio interface protocol stack is defined for both UP and CP, and gNBterminates both of them towards UE. For each protocol in the stack on gNB side,there is a corresponding peer entity for UE. From bottom-to-top, both stacks includefunctionality for Physical Layer (PHY), Medium Access Control (MAC), Radio LinkControl Protocol (RLC) and Packet Data Convergence Protocol (PDCP). On topof these protocols, UP defines Service Data Adaptation Protocol (SDAP), and CPthe protocol of Radio Resource Control (RRC). The uppermost CP protocol, NonAccess Stratum (NAS), is the only protocol not terminated in gNB but instead inthe core network. The endpoint in 5GC side, the Access and Mobility Manage-ment Function (AMF), is used for higher level control such as authentication and

11
user data security. Each layer provides a selected set of services to the layer abovethem, and vice versa each layer expects a set of services from the layer below. [22, 23]
UE
SDAP
PDCP
MAC
RLC
PHY
gNB
SDAP
PDCP
MAC
RLC
PHY
UP Protocol Stack
UE AMF
NAS
RRC
PDCP
RLC
MAC
PHY
gNB
RRC
PDCP
RLC
MAC
PHY
NAS
CP Protocol Stack
Figure 2: 5G NR Protocol stacks
From bottom-to-top, the layers are additionally numbered, with Layer 1 equalingthe Physical Layer, Layer 2 mapping to MAC, RLC, PDCP and SDAP and Layer3 representing RRC. Each layer defines a Protocol Data Unit (PDU) for its dataformat, which is different on each layer. Alternatively, when a layer in the protocolstack receives data from a layer above, the data is called a Service Data Unit (SDU)before the receiving layer encapsulates it with layer-specific information. [24]
The following sections briefly describe the most important aspects of each layer inboth UP and CP protocol stacks. A more detailed view into Layer 1 and Layer 2signaling is provided in section 3.4.2 as well as in the study cases in section 5.3.
3.2.1 Radio Resource Control
The CP procedures offered by RRC include system information broadcasting tohelp UEs communicate and attach to a cell, paging information to notify UEs ofconnection requests coming to them and managing an RRC context needed to enablecommunication between a UE and the access network, which can alternate in itsrequirements based on the current device state. The three possible RRC statesare RRC_IDLE, RRC_INACTIVE and RRC_CONNECTED, which range from requiring noparameter configuration for communication to establishing RRC context, core networkconnection and data transfer with all necessary parameters. [23]
3.2.2 Service Data Adaptation Protocol
SDAP, which is the topmost protocol on UP, is the only new protocol in the UPprotocol stack compared to LTE. It is in charge of pairing IP flows to radio bearers.Specifically, based on the new Quality of Service (QoS) model 5G core network candefine QoS requirements to IP flows individually. The practical use case for this is inthe 5G requirement for network slicing. A device served by 5G NR can have multipleassigned QoS flows, and each IP packet can be mapped to one of the flows based

12
on QoS requirements such as the required data rate. This is to say that the servicerequirements originate from the core network, which NG-RAN then maps to differentreadio bearers used between gNB and the devices connected to it. Alternatively,RRC on CP can be utilized for a static configuration or reconfiguration for the sameIP flow to radio bearer mapping. [22, 23]
3.2.3 Packet Data Convergence Protocol
PDCP performs several operation related to data integrity and security. It offersciphering and deciphering for protection against interception, integrity protectionby validating control message sources and special handling of packets in a handover.PDCP evolution in 5G has two considerable goals: the reliability aspect of URLLCapplications in the form of data duplication over different transmission paths, andaforementioned PDU integrity protection concerning UP data. [22, 23]
3.2.4 Radio Link Control Protocol
The responsibilities for RLC are primarily about PDU segmentation and retransmis-sion. Each data transmission schedulation contains information on the amount ofdata to be delivered which RLC uses to divide the SDUs it has received into properlysized blocks. Generally, RLC can be configured to handle detection of duplicatePDUs as well as to address retransmission of erronously received packets. [23]
An RLC entity is configurable to provide data transfer in one of three alternativemodes, which are Transparent Mode (TM), Unacknowledged Mode (UM) and Ac-knowledged Mode (AM). The selected configuration defines the classification of theentity, respectively, into TM, UM or AM RLC entity. A more detailed separationof RLC entity roles, namely the RLC sub layer, further divides the configuration ofRLC entities into receiving or transmitting sides. An exception to this separation ofduties is AM RLC entity, which contains both a transmitting and a receiving side. [25]
Besides the transfer of upper layer PDUs, the main functions of RLC sub layerinclude segmentation and reassembly of RLC SDUs for UM and AM data, as wellas re-segmentation of RLC SDU segments and duplicate detection for AM data.[22, 25] In addition, AM RLC provides error correction through Automatic RepeatRequest (ARQ). In practice, this means that the receiving end is validating thepackets it receives - in case of an error, the packet is discarded and the transmittingside is notified, resulting into resending the packet. [26] In contrast to LTE RLC,some NG-RAN RLC responsibility is transferred to other layers. These include theabsence of SDU reordering, which is now handled on PDCP level, as well as RLCSDU concatenation which has been moved to MAC. [22]
3.2.5 Medium Access Control
MAC handles the majority of channel-related NG-RAN configuration. It providesa mapping between logical and control channels and defines priorities for channel

13
utilization. It is also involved in multiplexing MAC SDUs from logical channelsto prepare them for transmission to PHY. On the contrary, data received fromPHY is demultiplexed by MAC. The media for multiplexing are Transport Blocks(TB), which are transmitted along transport channels. [27] For error correction MACuses HARQ, which combines the aforementioned ARQ protocol with Forward ErrorCorrection with the attempt to reduce corresponding Frame Error Rate. HARQ isintroduced in more detail in section 5.3.2.
3.2.6 Physical Layer
Physical layer in 5G utilizes Orthogonal Frequency Division Multiplexing (OFMD)in its data transmission for both UL and DL. The basic idea in Frequency DivisionMultiplexing is to use multiple frequency bands for data transmission at the sametime. One of the challenges in simultaneous transmission is that adjacent signalscan easily interfere with each other, which in turn causes distortion in the signals onthe receiver side. The signals can be separated in frequency-domain by using guardperiods, but the downside is an increase in the required bandwidth for transmission.[28, 29]
OFMD is based on using multiple, typically a very large amount of orthogonalsubcarriers and transmitting them in parallel over the same radio link. It resemblesmulti-carrier transmission, but most notably differs by having a higher number ofnarrowband subcarriers instead of only a few subcarriers with a wider band. In thecontext of carriers, orthogonality means that each subcarrier peak lines up with thenulls of other subcarries, so that the interference of overlapping carrier signals andtheir sidebands does not affect the reconstruction of the original signals. With noextraneous guard periods in frequency, the required bandwidth for data transmissionis reduced. [5, 28]
To prepare for transmission, the frequency-domain subcarriers are transformed tothe time-domain OFDM symbols using Inverse Fast Fourier Transform. In time-domain, a guard period is appended to each symbol to counter possible inter-symbolinterference in the receiver. To construct the original data, Fast Fourier Transform(FFT) is performed in the receiver to arrive at frequency-domain presentation of thedata again. [29]

14
Carrier 1 Carrier n
Sidebands fromother carriers cancel
on carrier nfrequency
Figure 3: Orthogonal Frequency Division Multiplexing [30]
For this thesis especially Layers 1 and 2 are significant, since the research focusesfor the most part on message interchange between L1 and L2 by the means of anL1/L2 interface. Common problems related to the communication between L1 andL2 are discussed in section 5.3. On the other hand, the requirements for differentfrequency ranges and reduced latency has lead to the utilization of multiple frequencyvariations for subcarrier spacing, which is explained in the following section 3.3.
3.3 New Radio frame structurePhysical layer data transmission is based on the concept of frames. In time domain,a frame is a period of 10 milliseconds, which further divides into 10 subframes with 1ms duration each. Subsequently, a subframe splits into slots. In contrast to an LTEframe which always contains two slots per subframe, a 5G NR subframe can have avarying, integer number of slots in the 1 ms period. This is analoguous to the factthat instead of the constant 0.5 ms slot duration that is the only alternative in LTE,a 5G NR slot can vary in its length. [5, 28]
Due to the support of broader bandwidths at higher frequencies, 5G NR enablesseveral combinations of different subcarrier spacings. The combinations are calledtransmission numerologies, which are all multiples of subcarrier spacing of 15KHzwhich is the only alternative in LTE. [31] The need for multiple numerologies is moreconcretely seen in the split of supported spectrum width. The higher numerologiesused in higher frequency bands increases the number of symbols transmitted overgiven time, addressing the new capacity and massive throughput requirements.Numerologies used in sub 6Hz spectrum, on the other hand, help address continuouscoverage and mobility targets in urban, suburban and rural areas, as well as offerreliability to support e.g. IoT devices. [32]

15
Table 2: Supported 5G NR transmission numerologies
µ ∆f = 2µ ∗ 15[kHz] Cyclic prefix0 15 Normal1 30 Normal2 60 Normal, Extended3 120 Normal4 240 Normal
Using a higher numerology leads to an increase in the number of slots per subframeand equivalently slots per frame. Typically one slot contains 14 OFDM symbols,which are used to carry control and data signals. The amount of symbols can alsobe lower, if longer cyclic prefixes are needed. Cyclic prefix insertion is a techniqueto prevent interference between subcarriers by copying a part from the end of anOFDM symbol to its beginning, thus increasing symbol length. If an extended cyclicprefix is used, then with the numerology µ = 2 the number of OFDM symbols perslot is only 12. [5, 28, 31]
As higher numerologies directly affect the density of data transmitted, they cancomplicate the analysis of captured traffic between network endpoints. Practically,monitoring network traffic for a fixed period of time may cumulate into trace files withmultiplied size, as the previous maximum of two slots per subframe can grow up to 16.
The direction of data transmission in communication systems is denoted by uplink(UL) and downlink (DL). In uplink, UE acts as the transmitter and gNB as thereceiver, whereas in downlink data is sent from gNB to UE. On a more generallevel, each symbol in a NR slot can be configured as either uplink, downlink orflexible to specify scheduling for different signaling variants for data transmission.All the symbols can be configured as uplink or downlink, but in total there exists 61predefined slot combinations, where the majority of the alternatives contain flexiblesymbols configurable to either UL or DL. [5, 31]
Similarily to LTE, the smallest physical resource in 5G is called a resource element. Inthe frequency domain, a resource element always consists of a single subcarrier. Thewidth of an element is tied to a single symbol duration in time domain, which meansit is not constant due to the alternatives in subcarrier spacing. OFDM symbolsconstituting a single slot, together with 12 consequtive subcarriers in frequencydomain, form a resource block (RB), which is the smallest set of resources that canbe allocated to a user. [28, 33] Furthermore, a single NR carrier consists of a limitedset of subcarriers. In the first part of 5G standard release - release 15 - the number ofsubcarriers in a NR carrier is limited to 3300, and depending on the frequency range,the maximum carrier bandwidth is either 400MHz (FR1) or 100MHz (FR2). [33]

16
3.4 Data transmission and processing3.4.1 Channels
Data transmission between different layers of RAN protocols is done using commu-nication channels. The definition of a channel has multiple alternatives dependingon the layer. Physical channels are actual sets of radio resources allocated for thetransmission of specific data. They are managed by the physical layer, which inaddition to various signal processing is responsible of mapping the signals to theircorresponding transport channels. Transport channels specify how information istransmitted between PHY and MAC as well as classify the charasteristics for thedata to be transmitted. A unit of data in a transport channel is called a transportblock (TB), and each transport block includes the Transport Format (TF) carryinginformation such as the block size and the used modulation scheme. Finally, MACoffers data transmission towards RLC through logical channels, which are categorizedby the type of data they carry. In contrast to a simple mapping between physicaland transport channels, multiple logical channels can be multiplexed into a singletransport channel as can be observed in Figure 4. Logical channels are furtherdivided into control channels for transmission of control signals and traffic channelsfor delivering user plane data. [28, 34]
PCCH DCCHBCCH DTCH
PCH BCH DL-SCH UL-SCH RACH
PBCH
DM-RSPSS
SSS
CSI-RS
DM-RS
PDCCHPDSCH
DM-RS
PT-RS
PUSCH
DM-RS
PT-RS
DM-RS
PUCCHSRS
PRACH
Logical Channels
Physical Channels
Transport Channels
SS Block UL Data UL ControlDL DataDL Control UL Sync
Downlink Uplink
CCCH
Figure 4: 5G NR mapping between physical, transport and logical channels
Even further categorization of transmitted data can be seen in Figure 4, where theuplink- and downlink-specific channels are separated. Some physical channels arenot mapped to corresponding transport channels at all - specifically, channels for DLand UL Control, Sounding Reference Signal (SRS) and Channel-State InformationReference Signal (CSI-RS). Reference signals are generally used for channel quality

17
estimation and don’t carry any data, and the control signals support user data trans-mission by providing network- and channel-related information. [28, 34] For downlink,there exists an additional synchronization construct called Synchronization SignalBlock (SSB) that defines a combination of OFDM symbols that are periodically sentas bursts towards UEs. [35]
5G defines six physical channels, three for both DL and UL [28, 33, 34, 36, 37]:
• Physical Broadcast Channel (PBCH): Used in combination with synchroniza-tion signals to form SSBs, which are used by the receiving UEs to obtain basicsystem information and to synchronize in both time and frequency domains.The contained system information, such as physical cell identities, help UEs toinitially access the network.
• Physical Downlink Shared Channel (PDSCH): Channel mainly used for trans-ferring user data, but also carries system information not included in PBCH.Used additionally for paging, which is a method to locate a UE when there isa packet scheduled for it.
• Physical Downlink Control Channel (PDCCH): Carries Downlink ControlInformation (DCI) that UEs use to to decode received data. The informationincludes the selected modulation scheme as well as knowledge on the resourceblocks allocated for the data.
• Physical Random Access Channel (PRACH): Used by UEs attempting randomaccess on time-frequency resources provided by a gNB. Specifically, a UE usesPRACH in the transmission of a preamble, which is a known complex-valuedsequence that a gNB can use to handle simultaneous uplink data transmissionof multiple UEs.
• Physical Uplink Shared Channel (PUSCH): Channel used in the transmissionof uplink data and the control information of L1 and L2.
• Physical Uplink Control Channel (PUCCH): Contains Uplink Control Infor-mation (UCI) for transmission scheduling and error checking. This includesHARQ for addressing erroneous received packets, Scheduling Request (SR)for uplink data transmission resources and Channel State Information (CSI)describing physical properties of the channel.
3.4.2 Transport channel processing and physical layer control signaling
The general transport channel processing follows a sequence of operations performedon transport blocks delivered from L2 to L1. Every TB is first attached with a CyclicRedundancy Check (CRC), which is an error detection code used to indicate whetherthe integrity of a received packet has persisted over a transmission or not. A failure inCRC can, for instance, be used by a receiver to request a retransmission of a transportblock. Following CRC are error-correcting codes, which differ from error-detecting

18
codes by enabling the reconstruction of corrupted data without retransmitting it.Next, the blocks are rate matched, which generally means extracting the correctamount of bits from the TB to match the amount of bits that can be transmitted atonce. Furthermore, it is possible to construct multiple coded versions of the sameinformation in order to increase the reliability of successful data transmission. Thecoded bits are then processed with a bit-level scrambling sequence to reduce thepossibility for an interfering signal to be misinterpreted as the intended one at thereceiver side. Finally, the scrambled bits are modulated and mapped to physicalradio resources. [23]
Transmission in both UL and DL transport channels requires support in the form ofcontrol signaling. Downlink control signaling contains information required by a UEto receive and process data from Downlink Shared Channel properly. The signalingalso includes information on the format and available resources to use in an uplinktransmission. For uplink, the signaling is controlled by PUCCH with the HARQ, CSIand SR mentioned in section 3.4.1. Downlink and uplink combined, physical layercontrol signaling is also called L1/L2 control signaling due to the fact that the infor-mation carried in the signals in part originates from Layer 1, in part from Layer 2. [23]
5G NR PDCCH differs from its LTE counterpart in the sense that all of its instancesare processed separately. The general procedure for data transmission control, how-ever, is identical to that in LTE. Every UE periodically, usually once per slot, searchesfor PDCCHs and attempts to decode any candidate signal received. The DCI carriedas the payload of PDCCH always contains an attached CRC to check data integrityin the received message. The calculation of the CRC includes a scrambling operationwhich takes device identity as an input, which is to say that CRC only indirectlycontains information to determine if the message was intended for that particularterminal. Hence, from the UE perspective, a message that was corrupted and amessage not intended for that UE are processed in a similar manner. [23, 38]
3.4.3 Spatial multiplexing in multi-antenna transmission
The support for an increasing number of antennas in both transceiver and receiverside is an important advancement for 5G NR in many aspects. From control pointof view, multiple antennas allow beamforming where the direction of transmission isfocused to specific directions. Equivalently, the reception of a signal can be directedwhile mitigating the interfering effects of signals from other directions. To counterphysical phenomena disrupting the transmitted signal, such as channel fading andinterference, it is possible to utilize the differences between individual antennas suchas their in-between distance or polarization. [23, 38]
Another opportunity offered by multiple transceiver and receiver antennas is simulta-neous transmission using the same time and frequency resources. The method oftransmitting multiple spatial streams in parallel, also called spatial multiplexing, is

19
conducted with the aim to increase peak user throughput by spatially separating thestreams in receiver and processing them independently [39]. Using multiple antennaports for transmission and reception is also called Multiple Input, Multiple Output(MIMO), and the throughput increases can be realized in either single-user (SU) ormulti-user (MU) MIMO transmission depending on the technique used. [40]
In Nokia 5G L1, one of the important concepts realising spatial multiplexing is calleda subcell. The capacity of an L1 signal processing board is divided on an abstractlevel to multiple subcells, which each cover a number of subcell slots. Generally, asubcell slot is a unit of the L1 resources required to process a single MIMO layer,which depending on the selected subcell configuration can mean from one to fourlayers assigned to each subcell. The significance of subcells and transmission of datausing shared time and frequency resources is discussed in section 5.3.4.

20
4 Fault management automation methodsIncreased system and data complexity calls for more creative system verificationtechniques. While on one hand a lot of time is used on complex systems verification,the growing need for reduced development times can drastically decrease the proba-bility of defect-free systems. [41]
The sections in Chapter 4 study the possibilites of detecting faults from networkdata. After a generic view on different anomaly detection techniques, the modelchecking approach implemented in this thesis both motivated and explained with itsrelevant background on automata theory.
4.1 Anomaly detectionAnomaly detection is the process of recognizing unusual system activity based ondata patterns. Defining anomalies can be a a difficult task itself, but generallythey can be characterized as deviations from a set of normal values that are definedagainst some metrics. [42, 43] In communication systems, this definition can includemissing or extraneous messages between interfaces, abnormal message sequences andparameter values that fall out of their suitable range.
A common approach for anomaly detection is to come up with a definition of normalsystem behaviour, which is used as a basis to extract suspicious data. Setting thelimits for normal behaviour can be difficult for multiple reasons. The differencebetween anomalous and non-anomalous behaviour can be minimal, which can causeclassification errors - that is, false positives and false negatives are possible forobservations that lie close to their defined border. The definition of normal data canalso change, which leads to problems when designing and developing an anomalydetection system. Reusing existing anomaly detection tools is often difficult, sincean anomaly may have a completely different meaning in another domain. Finally,the amount and quality of available data can have an impact on the way that datais processed. Filtering noise from the data is not trivial if the noise resemblesanomalies, and on the other hand a statistical approach to detecting anomalies canbe troublesome without a lot of labeled data. [42]
4.1.1 Designing an anomaly detection system
Toledano et al. [43] observe a number of common factors affecting the design ofanomaly detection systems. In time-critical applications, anomaly detection may haveto be implemented to operate in real-time. A non-real-time tool may be a better solu-tion if there are no strict time constraints. The amount of metrics the systems needsto handle can vary, which can have a large impact on system performance - especiallyif it needs to process large-scale datasets. Depending on the number of measuredmetrics, the system can also be required to produce either a metric-level report ofanomalies, or a more complete analysis of the problem in the system. Ultimately, the
21
setting for the system can range from fully unsupervised to one that has human in-put in its modeling choices, such as algorithms or parameters used to process the data.
Requirements for anomaly detection can also be defined by recognizing differentclasses of anomalies that are interesting in the observed system. A possible divisioninto anomaly classes for time-series data is described in [44], where the differentanomaly types and their algorithm design are categorized into outliers, change pointsand anomalous time-series. Each of the classes determine that an anomaly must differsignificantly from the values of their non-anomalous counterparts in time, but theydiffer in the way an anomaly is formatted. For outliers, an anomaly is a combinationof a value and a timestamp where the value deviates from its expected value atthat time. Change points are used to indicate a point in time where the time-seriesstarts behaving differently, making it suitable for more large-scale change detectioncompared to outliers. Finally, a whole time-series can be flagged anomalous if it onaverage differs a lot from other time-series originating from the same source.
4.1.2 Anomaly detection and network data
Anomaly detection for network data can be split into two categories depending onhow accurately the data can be inspected. In flow-based detection network traffic isperceived as a continuum of packets, the objective being the detection of patterns inthe combined information of the packets. Alternatively, if the data is accessible forpacket-level inspection, the anomaly detection can be directed to individual packets,namely their headers and payloads. [45]
The important measurements for each type of anomaly detection vary significantly.Flow-based approach can find useful information in source and destination addressesand ports as well as packet and byte counts of network traffic over time. For thishigher-level view of the traffic, some common processing steps include visualizationand statistical analysis of the data. [46] Anomalous activity can be found in theflow charasteristics such as the amount and direction of traffic between two networkend points. Availability of raw packet data offers alternative methods for anomalydetection. Instead of the aggregation of multiple packets in a flow, the focus is in thecontent carried in a packet. With access to the packet contents, anomaly detectioncan be performed on a more detailed level but it can imply for instance increaseddata storage costs, especially if the captured packets are not filtered or sampled. [47]
4.2 Anomaly detection techniquesEven though anomaly detection has been vastly studied in communication networks,the majority of the research has been focused on various aspects of informationsecurity such as intrusion and fraud detection [48, 49, 50]. Communication patternsin these scenarios are typically viewed as flows where for instance unusual amounts ordirections of communication can indicate suspicious activity. Considering the natureof the research in this thesis, a number of different anomaly detection techniques were

22
considered focusing especially on those with suitable characteristics for distributedsystems debugging, which specifically entails packet-level network inspection. Thefollowing sections introduce some of the potential techniques with examples of relatedwork on them.
4.2.1 Rule-based detection
Rule-based anomaly detection is a classification-based technique where the desiredbehaviour of a system is described by a set of rules. Typically, the first step indefining a rule-based method is to learn the rules with a separate algorithm such asdecision trees. Furthermore, every test instance, such as a communication pattern,needs to be associated with a rule that best describes them. When test instances arechecked against the trained rules, any deviation from the rules should indicate ananomaly. One of the advantages in a classification-based approach is their efficiency,given that test instances are run against pre-defined models, but they also requiredetailed labeling for multiple classes of correct system behaviour. Defining correctbehaviour in distributed communication systems is relatively difficult, especially dueto the high number of co-existing processes. [42, 51]
Rule-based anomaly detection has a lot of use cases in intrusion detection, especiallyin flow-based network traffic analysis. Duffield et al. [52] utilize the idea that both theheaders and payloads of packets in normal network traffic contain common signatures,and that deviations from those signatures can be detected with rules. A signaturecould for instance be the destination IP address for a packet, and its associated rulecould state the destination to be a specific server.
4.2.2 Graph-based detection
Especially in concurrent systems, the focus of anomaly detection can rely on modelingthe different states a system can achieve. For systems comprising a finite number ofobservable states, a graph-based approach may be suitable to describe their desiredfunctionality. Transition systems represent graph-based modeling by using nodes todescribe system states and edges as the transitions between states. Depending onthe properties that are modeled, an anomaly can occur in the form of unexpected,extraneous, missing or incoherently labeled edges and vertices. [41, 53, 54]
Noble & Cook [53] rationalize using the word anomaly to describe an unusualevent and propose two graph-based anomaly detection techniques. First, anomaloussubstructure detection is a method that attemps to detect out of the ordinarysubstructures within a whole graph. The idea behind the method is to compareanomalies to patterns - whereas patterns are frequently appearing substructureswithin a graph, anomalies in contrast should be expected to occur rarely. Theapproach cannot solely depend on discovering infrequent substructures, however,since large substructures would always be flagged anomalous. The solution comprisesof assigning values for substructures based on their size and number of occurrences,with low values indicating probable anomalies. The second technique, anomalous

23
subgraph detection, attempts to evaluate smaller parts of a graph by splitting it intosubgraphs and estimating how anomalous those subgraphs are in contrast to eachother. The hypothesis for the latter approach follows from a nested inspection of theoriginal graph: if a subgraph consists of common substructures, it is less likely to beanomalous when compared to a subgraph with a lot of infrequencies.
4.2.3 Statistical detection
Statistical anomaly detection methods can be considered if there is a reason to believethat majority of the data follows an underlying distribution. Since any distribution-based approach builds on the use of probablities, an anomaly in statistical detectionis any observation that falls in the low probability area of the distribution. Statisticalanomaly detection can be coarsely divided into the categories of parametric andnonparametric techniques. The former is based on the assumption that the datadistribution can be explicitly formulated with a probability density function. Thedensity function parameters are evaluated from the dataset, and a data sampleanomalousness is calculated from the function. Parametric techniques can derivetheir models from the assumption of a single distribution, such as Gaussian distribu-tion in Gaussian Model-based detection, or a mixture of several distributions, eithermodeling all the data in a single distribution or dedicating a separate distribution forboth normal and anomalous data. Another popular choice for parametric techniquesare regression models. They follow a two-step procedure by fitting a regressionmodel on the data and determing a residual for each tested instance. The residualis essentially a score attached to each test instance, and is based on the differencebetween the predicted and observed values of that instance. [42]
The latter technique builds its models directly from the data, the major differencebeing that less assumptions of the data are made beforehand. One straightforwardnonparametric method is to use histograms to dynamically preserve knowledge ofthe normal data. A training phase in histogram-based detection creates histogrambins based on training samples, and a discrepancy in the test data is reported if atest sample does not fall into any of the bins. [42] Kind et al. [55] apply histogram-based anomaly detection by representing single feature values, feature value rangesor combination of multiple feature values to identify patterns and feature valueabnormalities in network flows. The detection follows a 4-step routine of featureselection and histogram construction, mapping similar histograms close to each otherin metric space, further clustering the similar histograms into their own groups andfinally comparing tested feature vectors to the models that are constructed based onthe histogram groups. Although histogram-based detection may offer a potent wayto find dissimilarities in data attributes, they easily fail to capture more complexrelations such as rare combinations of attribute values [42].
4.2.4 Motivation for deterministic anomaly detection
As discussed above, the decision to use a specific anomaly detection method canbe affected by the nature of data inspected. The project this thesis relates to was

24
initially presented with the same issue, and at first a probabilistic approach to theproblem was considered. With probablistic methods, the relevant question wouldhave been if something can be learned from the data captured from faulty systemexecutions. Several remarks about the available information and the nature of thedata, however, directed the research towards more deterministic detection:
• The view on available data: As its specifications are known, the system canbe viewed as a white box. An accurate description of the system based onthe specification can thus be attempted instead of a learning approach, whichwould be more applicable if there was more uncertainty about the studiedphenomena.
• Variance of available data: Determining a reference for normal data couldprove difficult for a multitude of reasons. The packet traces gained from testenvironments or deployed systems can vary a lot, since the rapidly changingsoftware means there exists several different versions of it that are concurrentlytested or in use. The way the packet captures are taken can slightly vary aswell, so the data format may not be completely uniform.
• The efficiency of selected solution: Although not the primary goal for the project,one of its possible future perspectives could include running the analysis softwarein the inspected system in real time. In such setup, the performance benefitsof a deterministic solution could prove essential.
These considerations combined with the general aim of modeling communicationpatterns affected the choice of graph-based detection, and model checking based onfinite state machines was chosen as the concrete approach to modeling the problem.
4.3 Basics of automata theoryAutomata theory concentrates on the study of computing machines. It involves afew key concepts that apply to all of its variants. A fundamental construct for statemachines is an alphabet, which is a finite set of symbols. A language consists ofset of strings that are selected from an alphabet and considered valid within thedefinition of that language. Strings, in turn, are simply finite sequences selected froman alphabet. Essentially, an automaton is used to provide an answer to the problemof whether a string given as an input belongs to a specific language. Depending onthe type of automata used, the motivation for using them can range from softwareand hardware modeling to the studying capabilities and efficiency of computers. [56]
4.3.1 Finite State Automata and Finite State Transducers
Finite state automata, also called finite state machines (FSM), define a model con-sisting of states and transitions. Input given to a machine in a specific state causesa transition taking the machine in a new state. For deterministic FSM, only onestate at a time is possible, and consequently a transition caused as a response to the

25
next input, often referenced as input character, will always lead to a single state. Incontrast, a non-deterministic automaton can end up in different new states based onthe input given a certain state. In a sense, the purpose of a state is to represent the"history" of the input that has already been parsed, and the possible "futures" theinput can lead to. Additionally, a FSM always defines a single start state, as well asa set of accepting or final states with the purpose of producing output to a problem -if the automaton stops in an accepting state after consuming its input, that input isrecognized to belong in the problem-language. [56]
q₀ q₁ q₂ 1 1
Figure 5: A simple FSM accepting binary sequence 11
Simple FSMs use single streams of input characters, which are read to transitionbetween the different machine states. When the purpose of a state machine is tocheck if an input string belongs to a language, it is called an acceptor. A subsetof FSMs also associate output to each of their transitions. These machines, alsocalled Finite State Transducers (FSTs), do not necessarily define a set of final states.Regardless of their structure, the goal of FSTs is to take input strings and convertthem to output strings based on conditions attached to the machine states. FiniteState Transducers cover two kinds of FSMs: Moore and Mealy Machines.
The output of a Moore machine only depends on the present machine state. It canbe defined as a tuple M = (I, O, Q, q0, δ, λ), where I is a finite set of inputs, O is afinite set of outputs, Q is a finite set of states, q0 ∈ Q is the initial state, δ: Q ×I is a transition function and λ: Q → O is an output function. [57] For the Mooremachine in Figure 6, an input sequence 01010 would produce output 011100, sincealso the initial state is associated with an output symbol.

26
q₀/0
q₁/1
q₂/0
q₃/1
1
0
1
0
1
0
0, 1
Figure 6: An example Moore Machine with no accepting state
A Mealy Machine takes into account both the current machine state and the inputcharacter. Its tuple representation is the same M = (I, O, Q, q0, δ, λ), with theexception that the output function includes the set of characters: δ : Q × I → O.[57, 58] The example Mealy machine in Figure 7 shows how the input charactersdefine transitions that each have an output character associated with them. Inthe example case, every input sequence produces an output of equal length, sincesingle input character always maps to a single output character. Therefore, an inputsequence ababab produces output ABBCCB.
q₀ q₁ q₂
a/A a/B
b/C
a/C
b/B
b/BFigure 7: A Mealy Machine with character input and output
27
When describing state machines programmatically, especially Mealy machines areuseful. For instance, ensuring the number of occurrences for a single message type canbe implemented using a single, parametrized output function returning an acceptingstatus as soon as the required number of appearances is fulfilled. This approach isutilized in the model checker implementation explained in section 5.2.2.
4.4 Model checkingModel checking is a form of verification that is dedicated to answer qualitativequestions regarding a system. These questions may range from more generic ones,for instance if the system is in a state that is acceptable, to more specific queriessuch as does an operation always finish within a time limit. In turn, a model checkertypically refers to a software capable of modeling a system with some descriptionlanguage. The checker can be run to validate a given property, and the producedoutput can be analyzed to decide that property was satisfied. [41]
Whereas the objective of model checking is to verify correct system behaviour, it isimportant to remark that it is not used to establish proof of correctness. In the earlysystem correctness study, proof construction was a prominent idea when definingformal system verification. The method was applicable especially to small, sequentialprograms which were verified with axioms and inference rules. The complex andarduous process of coming up with manual proof, let alone the inability to scale upto larger programs eventually led to a need for alternative verification approaches.The realization that programs can be described with temporal logic brought up theidea of model checking, since the inspection of system change over time could beembodied in finite state machines. [59]
As model checking is an aspect of verification, it can suffer from the validationproblem. In software development, verification typically means ensuring the softwaredoes correctly what it has been built to do, that often implies conforming to aspecification of some kind. Validation, on the other hand, is the process of makingsure that the software meets its informal requirements and has the properties thatare required from it. In modern, more agile development, the latter can includecommunication with a customer to confirm the right kind of a product is being built.The validation problem in model checking relates directly to this division, as it maybe difficult to conclude if a model represents a problem that needs to be verified.[41, 60]
The model checking software, simply called model checkers, are usually composed ofthree components. First, the system under verification needs a spefication languagethat can capture the temporal aspect of the system’s progress. Second, the statemachine used to represent the system needs to be encoded as an executable part ofthe model checker. Finally, a verification procedure is needed to find out if the speci-fication holds in a comprehensive search of the state space represented by the systemstate machine. Instead of a mere binary output indicating whether a specification

28
was satisfied or not, majority of model checkers also pinpoint the source of a problemwhen the specification is unsatisfied. The prevailing method for this is the use of coun-terexample traces, which precisely explain why the verification reported a failure. [59]
Figure 8: A model checker with counterexamples [59]
The core of model checking process can be divided into three phases [41]:
• Modeling phase: The system is described with models which should un-equivocally contain the possible system behaviour. A model is commonlyimplemented using finite state automata, where a single state can containinformation on the present properties of the system while transitions describethe system evolution between states. Also the properties of a system needto be depicted in an accurate way in order to model it comprehensively. Acommon approach to this is the use of specification languages that can focuson particular form of logic to encode the properties in an appropriate manner.One example of such a focus is temporal logic that is interested in systembehaviour over time. Among the numerous of properties it can be used todefine, some of the most relevant ones are reachability - question whether thesystem can end up in an invalid state - and functional correctness to answer ifthe system is doing what it has been specified to do.
• Running phase: A model checker is first prepared for system verification byconsidering the setting it is applied to. After preparation the actual modelchecking is conducted.
• Analysis phase: When the running phase of model checking has been con-cluded, the highest level result analysis should indicate whether a propertywas validated in a given model. A reported failure may originate from varioussources. If the model has been constructed incorrectly, it won’t represent thesystem design and a modeling error occurs. If the model is built correctly,then the result suggests either a design error or a property error. A designerror requires modification of system design and its associated models. As themodified system affects all the model design, a reverification of every property
29
needs to be carried out. A property error, on the other hand, only invalidatesa single property and requires its redefinition - no property that was alreadychecked needs to be verified again.
In addition to the phases, verification organisation is required for all the remain-ing procedures supporting the organization and planning of the model checkingprocess.
Model checking has a number of characteristics supporting its validity in systemverification. Due to its brute-force nature, it does not suffer from uncertainty whenit comes to finding errors that is often the case in various forms of testing. Thepossibility for partial verification means that no immense effort is required for theimplementation of a model checker, since less extensive parts of a requirementsdocumentation can be used to check individual system properties. On the otherhand, this leads to the fact that the system may not be completely covered by thechecker. Model checking can also be a powerful tool in detecting possible designflaws. This reflects the truth that a model checker can ultimately verify a systemmodel, not the real system. As a consequence, any hardware- and software relatedflaws require different methods to be discovered. The correctness of model checkerresults are not completely reliable either, since a model checker is a software itself. [41]
From the software development point-of-view model checking offers flexibility bybeing separable from software production. E. Allen Emerson [59] argues the successof model checking by its support of concurrent verification that does not halt theprocess of software development. Rather, model checking can be seen and executedas an additional and alternative process that still has the potential to detect faultswithin acceptable time limits.

30
5 Comparison of debugging processesThe research in this thesis had two distinct goals. A higher-level view to the wholedebugging process was required to detect manual, repetitive and redundant proce-dures that could be simplified and automated. Moreover, different approaches tomodel the target system were considered in order to come up with means to detectanomalous behaviour.
As discussed in section 4.2.4, in communication systems design the advantage isthat different communication patterns are often strictly tied to specifications. Withthe specifications known, the system can be viewed as a white box, that is, thecommunication typically follows certain specification-based patterns which offerspossibilities to model the system with deterministic methods. For this reason finitestate machines were chosen as the modeling solution for the problem. The sectionsbelow introduce both the current and the proposed debug processes for Nokia 5GL1 software, and more thoroughly showcases how a number of common failures inL1/L2 can be addressed with the proposed solution.
5.1 Current debug process in Nokia 5G L1The debugging process usually starts when a bug report is filed to a fault managementtool. The report typically contains a problem description, steps that were executedto discover the problem, expected and actual results and an initial analysis from atester. Additionally, the report often contains trace and log files, of which one ofthe most important are the packet traces - also abbreviated as pcaps based on theirLibpcap File Format. Pcaps are obtained by capturing packets on a network interface,which essentially means that a software is used to monitor network traffic and savepacket information to a file for further inspection. This is commonly achieved withthe command line tool tcpdump, which can be run on most Unix-like systems. [61]
A pcap file consists of a global header followed by zero or more pairs of headers anddata for each captured packet. The global header contains general information andconfiguration regarding the capture itself, such as knowledge of the timezone andmaximum allowed packet size. Packet headers report the actual timestamp and sizeof the packet data. [62]
A software designated for network packet analysis is required in order to display thecontents of a pcap. A popular open source alternative for this is Wireshark, which iscapable of both capturing packet data and opening capture files from other software,displaying the nested protocol information contained within packets and for instancefiltering and exporting the packet data in several formats [63]. A key to analyzing apacket’s data is the concept of dissectors, which are needed to parse a segment ofthe whole packet. Wireshark by default includes a number of dissectors for commonprotocols, but in proprietary systems also custom protocols may be necessary. Oneof the available means for custom dissector definition is by making a plugin that is

31
registered to be used on top of the existing dissectors. The plugins are defined usingLua programming language. [64, 65]
Figure 9: Example pcap view in Wireshark
Currently the first step of debugging L1/L2 data typically involves getting the packettrace into a more human-readable form. One common way is to use a distributionof Wireshark with custom dissectors defined in Lua. A single packet is composedof nested, encapsulated protocols, and each dissector is tasked to parse a specificprotocol before passing the remaining data to the next dissectors. As as result, thevalues of the parameters carried within a packet can be inspected, albeit often in ahexadecimal format. [64, 65]
For some data, such as binary values, the dissected trace may already provide usefulinformation. A more in-depth inspection, however, usually requires the dissectionsto be exported in a more suitable format before a thorough analysis. Wiresharksupports exporting the trace in several formats such as Comma Separated Value(CSV) and JavaScript Object Notation (JSON). After exporting the data, there’s nounified method of examining it. One approach is to filter the data using commandline tools, but the interesting content may differ a lot depending on the problem case.
From users’ perspective the dissector plugin solution may be problematic, sincea single plugin is only applicable to a specific software version. Hence, in orderto reliably dissect every message within a protocol, users are required to maintainmultiple plugins to manage debugging of different software versions, which is common

32
since different versions are simultaneously tested and deployed.
Capture trafficdata into apcap file
Install correctbundle ofWireshark
and dissectorplugins
Find out thecorrect interface
version formessagedefinitions
Dissect thepacket data
and export it,e.g. as CSV
or JSON
Pre-process the
data e.g.using
command linetools
Report theissue in faultmanagementtool, includedetails onperformed
steps
Analyse thetrace
manually byobserving
data patterns
Figure 10: Current workflow for fault analysis
Typically the packet trace alone is not sufficient to solve a fault, and quite often itis only useful in narrowing down the possible sources of the problem. Usually theamount of various files included in a fault report is large, and in addition to pcaps,the report often contains system logs with information on different system processesas well as snapshots capturing the system state at a single point in time. The log filesare regularily used in combination with the packet traces, which is also not withoutits challenges. As the trace and a relevant logfile both represent time series, theyneed to be synchronized in order to get any comparable data. Analysis of systemlogs was not included in this thesis, but future support for additional log analysiswas taken into account when developing the new debugging framework.
5.2 Proposed debugging solutionThe main focus for the improved debugging solution is to provide a set of softwaretools aiming to speed up especially the first steps in the debugging process. Theproposal is built from multiple software components which together form a softwarestack called Machi. The purpose of Machi stack is to combine the separate com-ponents that, however, are not tightly coupled. This is to say that each backendsoftware is usable on their own, but ultimately the stack unites them into a single,effective product. The included Machi software components can be seen in Figure11.
Projects with some overlapping ideas to Machi exist. The most relevant one, Cloud-Shark [66], offers a browser-based capture file uploading, analysis and sharing platformto enhance the simplicity and efficiency of the debugging workflow. Despite havingthese desirable charasteristics, CloudShark is not sufficient for Nokia 5G L1 use fora number of reasons. First, it’s limited to capture file analysis. Although packetcapture inspection is a prominent idea also in Machi stack, it was designed with theidea that additional sources of information will be needed in the future. Second,enlarging external software to support proprietary protocols could prove difficult.

33
Messages between L1 and L2 use an internally defined Base Station Intranet Protocol(BIP) protocol that needs to be specifically addressed in a dissector software. Third,having complete control on sensitive data can be a decisive factor to not use anycloud-based solutions. In conclusion, a more tailored software was necessary to fulfillthese different needs successfully.
The following sections explain each part of the stack individually and describe theenvisioned debugging workflow with the use of the stack.
Machi-shark
Packet datadissection
PCAPMachi-web
Web UI andbackend
processing
Machi-ELK - Elastic Stack container
KibanaDissected data
visualization
Elasticsearch
Data indexing
Logstash
Data collection
PCAP
Machi-checker
Model checkingModel checker report
JSON, CSV
Figure 11: Machi software components
5.2.1 Machi-Shark: Packet data dissection
Machi-Shark combines the typical use case of Wireshark by taking a pcap input,dissecting it and producing either a JSON or CSV output that can be passed todifferent backend components for analysis. In order to start the dissection, also theinterface version for message definitions needs to be provided to the software. Theversion is tied to a specific release of the L1 software, and since it is not known by thepcap file, the version must be explicitly provided by a user. Currently, as the softwareis only interested in real-time (RT) signaling between L1 and L2, it is solely used toprocess messages with BIP protocol which is used for all the RT messages of L1 and L2.
Besides flexibility, the different output file formats can be used depending on thelevel of detail required from the packet dissection. The JSON format is always usedfor full dissection - Machi-Shark iterates the original pcap file once, collecting everyencountered message parameter into a flattened data structure. The CSV alternativeuses a selected subset of relevant parameters from the L1/L2 message definitions. Forthis purpose, Machi-Shark defines templates for the parameters that are dissectedfrom the packet data. The input packet trace is run against the chosen template,and a corresponding CSV entry is created for each packet conforming the supported

34
BIP protocol. In order to parse the produced CSV in other software, the outputCSV also includes header information containing each of the template parameters.Pcap data is highly nested, which is why both of the alternatives flatten it for morelight-weight processing of the data in the later phases of the analysis.
5.2.2 Machi-Checker: Model checking
Machi-Checker applies principles of model checking to detect abnormalities in mes-sage sequences within captured packet traces. It is based on deterministic finite statemachines that are used to represent constructs called models. In Machi-Checker,a model is used to describe the relationship of different messages constrained bytheir order or the amount of occurrences within a time constraint. The structureof a model is based on either a Moore or a Mealy machine, but instead of simplyproducing output strings based on its input, a state machine based on a Machimodel attaches output functions to its state transitions. Fundamentally, the out-put functions act as a dynamic way to determine the next machine state. Morespecifically, they can perform checks on the information encapsulated in a machine,which can for instance mean checking the number of input messages the machinehas received and using that information to deduce the following state for that machine.
Due to the white-box nature of the observed system, a model can often be strictlydefined against specifications. Essentially, this means there exists certain predefinedpatterns for the messages that can be formulated into models:
• Periodic messages: Messages that are sent with constant intervals
• Synchronous requests and responses: Sequences where a request receives eithera single or multiple responses always in the same order
• Asynchronous request and responses: Requests that always incur the same setof subsequent messages, but their order might change
The design of Machi models is based on 5G NR frame structure. As explained before,data transmission in time domain is divided into frames that further divide into slotsand symbols. The periodicity for a single type of message is at most once per slot forone processed spatial stream, which is also used to set limits for a single automatonspawned from a model. In many cases a message exchange over the same channelcan be used as a limit for a single model contents, as long as all the messages in thatexchange occur within one slot. The granularity of the automata is therefore quitehigh, since a separate model is used for each combination of frame, slot and eithera message or a set of messages within a slot. Reflecting on the different messagepatterns above, a default automaton based on a model has the purpose of trackingmessages or request-response sequences that have to occur during the same frameand slot. One major advantage of this separation is its capability of distinguishingasynchronous transmission patterns, that is, sequences that interleave in time due to

35
the distributed system characteristics.
The frame information for each packet is represented by a system frame number(SFN), which is a counter-based value used in synchronizing the timing of datatransmission. A basic model, which is time-constrained to a single slot, combinesthe time information to message type to use the following naming scheme:
(MODELTYPE)_(MODELNAME)_(ROUND)_(SFN)_(SLOT)
SFN alone is not necessarily enough to distinquish between models, since it is repre-sented by a 10-bit value. It is thus limited to the integer value of 1023 after whichit reverts back to 0. Therefore, an additional variable, round, is needed to countthe number of completed SFN cycles. A predefined model type and a user-providedmodel name are attached to the beginning of the name.
As explained in section 4.4, model checkers usually consist of three components:Specification language, state machine encoding and a verification procedure. Machi-Checker defines a graph-based Domain Specific Language (DSL) which is used inmodel implementations. Every model has at least a name and a transition table,which describes every possible state and transition accompanied with inputs andpossible output functions. When the model checker is run, all the selected modelsare first compiled into executable automata, which can be spawned in runtime.
const model = {
name: ’basic’,
transitions: [’s0/UlData_PuschReceiveReq -> s1’,’s1/UlData_PuschReceiveRespLo -> s2’,’s2/UlData_PuschReceiveRespHarqU -> s3’,’s3/UlData_PuschReceiveRespPs -> s4’,
]}
Listing 1: A JSON-formatted Machi model defined in JavaScript
A single transition always contains the current state with its associated input, whichis always the expected message type for the current state. Depending on the modelingchoice between a Moore and a Mealy machine, the model may contain a customoutput function used to determine the next status for a machine. For a Mooremachine, the function is constructed automatically - it takes a machine as an input,checks if the new state is included in the final states of the machine and eitherupdates the machine status to finished or keeps it as running. For Mealy machines,the output functions are included in the model definitions. All the input and outputstates and functions are added to the spawnable automata when they are compiled.
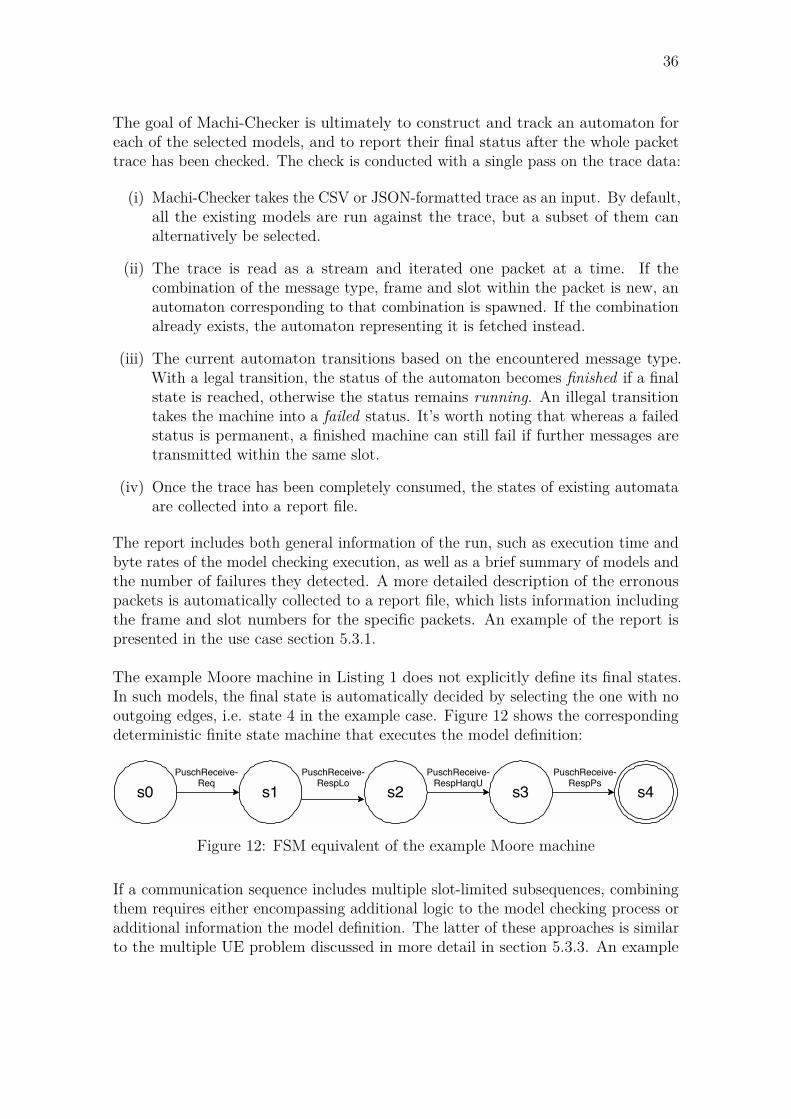
36
The goal of Machi-Checker is ultimately to construct and track an automaton foreach of the selected models, and to report their final status after the whole packettrace has been checked. The check is conducted with a single pass on the trace data:
(i) Machi-Checker takes the CSV or JSON-formatted trace as an input. By default,all the existing models are run against the trace, but a subset of them canalternatively be selected.
(ii) The trace is read as a stream and iterated one packet at a time. If thecombination of the message type, frame and slot within the packet is new, anautomaton corresponding to that combination is spawned. If the combinationalready exists, the automaton representing it is fetched instead.
(iii) The current automaton transitions based on the encountered message type.With a legal transition, the status of the automaton becomes finished if a finalstate is reached, otherwise the status remains running. An illegal transitiontakes the machine into a failed status. It’s worth noting that whereas a failedstatus is permanent, a finished machine can still fail if further messages aretransmitted within the same slot.
(iv) Once the trace has been completely consumed, the states of existing automataare collected into a report file.
The report includes both general information of the run, such as execution time andbyte rates of the model checking execution, as well as a brief summary of models andthe number of failures they detected. A more detailed description of the erronouspackets is automatically collected to a report file, which lists information includingthe frame and slot numbers for the specific packets. An example of the report ispresented in the use case section 5.3.1.
The example Moore machine in Listing 1 does not explicitly define its final states.In such models, the final state is automatically decided by selecting the one with nooutgoing edges, i.e. state 4 in the example case. Figure 12 shows the correspondingdeterministic finite state machine that executes the model definition:
s0 s1 s2 s3 s4PuschReceive-
ReqPuschReceive-
RespLoPuschReceive-RespHarqU
PuschReceive-RespPs
Figure 12: FSM equivalent of the example Moore machine
If a communication sequence includes multiple slot-limited subsequences, combiningthem requires either encompassing additional logic to the model checking process oradditional information the model definition. The latter of these approaches is similarto the multiple UE problem discussed in more detail in section 5.3.3. An example

37
state machine of combined subsequences can be seen in Figure 13, where L1-initiatedindication message is tied to a series of subsequent requests that can be sent in anyorder.
Req1 Ind1
Req1
slot m slot n > m
Req2
Req4
Req3
Req3
Req2 Req4
Req4
Req3
Req2
Req4
Req2
Req3
Req1 = PrachReceiveReqInd1 = PrachReceiveIndReq2 = PdcchSendReqReq3 = PdschSendReqReq4 = PdschPayloadTbSendReq
Figure 13: FSM for combined slot-limited communication subsequences
A model representing a Mealy machine could define different output functions fordifferent combinations of states and inputs, but in simple cases does not need to.The model in Listing 2 specifies a limit of two messages per slot.
const model = {
name: ’basic’,
transitions: [’s0/DlData_PatternConfigReq -> s0/check’
],
check(machine) {return (machine.trace.length < 2)
? machine.status: machine.utils.status.finished;
}}
Listing 2: An example Machi model with message count tracking
Every instance of received PatternConfigReq messages triggers a function that isused to keep track of the message count and simultaneously to update the machine

38
status based on that count. The corresponding state machine consists of only onestate with a loop:
DlData_PatternConfigReq/check
s0
Figure 14: Mealy machine with an output function
With the Mealy machine model implementation it is important to notice that Machi-Checker passes encoded information of the machine to the output functions. Thestate machine itself has no accepting or failing states, but the status associated tothat machine can get different values when the output function is executed. In theexample case the set of inputs is limited to a single message type, which means thatrather than producing output based on current machine state and different inputs,the state machine itself always behaves the same way.
5.2.3 Machi-ELK: Elastic stack integration
Both the packet dissector and the model checker were introduced to address relativelydomain-specific problems. On the other hand, the debugging process as a wholealso includes general tasks such as indexing and storing data. For this purpose athird-party solution, Elastic Stack, was included in the Machi project. To be precise,Machi-ELK includes the original combination of three open source projects, whichare together called ELK Stack: Elasticsearch, Logstash and Kibana. Newer versionsof the Elastic Stack include also a platform called Beats to be used in data gatheringand centralization [67, 68], but it was omitted from Machi.
Elasticsearch is a search and analytics engine used to index user data as documents.A document is a JSON-formatted unit of information that consists of the propertiesfor specific kind of data. A set of Elasticsearch documents form an index that enablesinspection of the documents for instance by filtering and searching. An index is com-parable to a relational database, since essentially it defines a mapping between datatypes and document properties. Indices are the cornerstone for most of the operationsperfomed on the data - Elasticsearch provides multiple APIs that are used in queryingand manipulating collections of documents against one or more known indices. [69, 70]
Machi-ELK directly obtains the data to be indexed from the packet dissector. Eachdissected message, i.e. each row in the dissector output file, is represented as adocument, and every document contains all the message parameters with their data

39
types mapped to ones suitable for browsing and visualization.
Logstash is a software used in combining log data with different formats and fromdifferent sources. Machi-ELK incorporates logstash to support more automaticsystem log inclusion in the future but does not use it in the current implementation.
Kibana is an open source interface to the data maintained by Elasticsearch. Itprovides means to browse, query and filter the indexed Elasticsearch documents,visualize the data in various ways and provide more conclusive dashboards of multiplevisualizations.
5.2.4 Machi-Web: Service combining backend components with a web-based user interface
With the inclusion of several backend software components the complexity of de-bugging grows. To avoid ending up with a separated set of tools only supportingcommand line interfaces, each of the developed tools are combined in a web-basedservice consisting of user interface (UI) with a server-side application program inter-face (API) to handle user actions.
Most of the server-side functionality in Machi is managed by Machi-Web. It encapsu-lates both Machi-Checker and Machi-Shark as executables and provides an API forall of the frontend user functionalities. The functionalities include processing requestsfor pcap file uploading, getting the progress status for each process visible in the UIas well as handling download requests for uploaded files and generated analysis reports.
Each pcap upload triggers a unique ID generation in Machi-Web. The ID is attachedto every file that is generated from the original pcap. It is also used in routingusers to a web page containing all the upload job information. The automated stepsfor the backend processing of an uploaded file are quite consistent, and the generalpattern is that a file is taken as an input, the file is processed, a data or report fileis produced and access to the file is provided to the user in the web UI. The mostsignificant difference is between Elasticsearch and the other processes. When thedissected packet data is indexed and dumped to Elasticsearch, it is processed directlyby Machi-Web, and a link to the resulting Kibana visualization of the data is givento the user. For both Machi-Shark and Machi-Checker, a separate child process iscalled to handle each action individually, and the user is provided a download linkto a file, which for Machi-Shark is the dissected file and for Machi the report of suc-cessful and failed state machines. Also the uploaded pcap file is available for download.
One of the dominant ideas in the project is that as soon as an uploaded packet tracefile has been dissected, the output file should be usable in all of the subsequentprocesses. Practically this means that as soon as the pcap is uploaded, Machi-Sharkis the only process that is executed immediately, but after it finishes all the remain-ing tasks can be triggered simultaneously and processed in parallel. Additionally,

40
Machi-Web reports the progress of each of the backend processes whenever requestedby the frontend application.
The frontend functionality of Machi-Stack is built as a React application. It providesa user interface that utilizes a single container for all the different processing toolsencapsulated in the backend Machi-Web service. The main purpose of the frontend isto provide a simple and shareable view to a single debugging case with all its relevantinformation. When starting a debug process, users will initially interact with anupload web page. The upload page incorporates the container, also called a card,that reports the current processing status for each software in the stack. All thedownload- or redirecting links are also within the container, as soon as they becomeavailable after pcap uploading. The aforementioned unique identifier, formed foreach of the uploads, is also used to form a permanent URL for accessing a statuspage for that particular upload. The status page essentially has the same content asits upload equivalent, but it is static with information on all of the finished tasks.Ultimately, the status page is the final compilation of debug case information, thatcan be used to share the same information to all interested parties.
Figure 15: Machi-Web view of a finished upload job

41
Since the packet trace is directly fed to the web service, its corresponding inter-face version needs to be provided by the user. The version can be selected from adropdown menu, and is the only step required before the pcap file can be uploadedand the backend takes control of the whole debugging process. To monitor backendprogress, the frontend is constantly polling it for status of each of the processes.
From the model checker point of view, the original idea was to build a default setof models to be run for each of the uploaded pcap files. However, the set couldnot be very comprehensive as expert opinion would eventually be required to definenew models. Whereas Machi-Checker already provides a uniform way of adding newmodels, the process of uploading a model compared to the required user interactionin the web service would be rather manual. Users would need write access to aversion control tool, then implement the model definition, get it integrated by anadministrator of the relevant version control tool project and finally notify the webservice of the new model in some way. Due to this rigid alternative, Machi-Webfrontend also incorporates a means to add models. One or more models can beadded before uploading a pcap to the Web UI. The mandatory information for amodel, which are a name and a set of transitions, are given in a form and submitted.Machi-Web generates a model file based on the given information and uploads it tothe model checker. Furthermore, the user is given the option of conducting modelchecking only with the uploaded models or combined with the default model set fora more extensive check.
5.2.5 Machi-Stack: ELK-Stack combined with Machi
Individually, the proposed backend tools are used to address two challenges - toreduce overhead by minimizing manual, repetitive work and to aid in the initialanalysis of a fault. One of the further issues in the current fault debugging processis that if developers need to investigate more complex cases, the necessity of usingmultiple debugging tools grows. There exists no common set of software that isused, which is why the debug workflow varies a lot between developers. To get thedebugging process started, developers also need to install at least Wireshark locally,along with its up-to-date dissector plugins.
One of the goals for the machi project is to combine different backend componentsinto a single framework, ultimately aiming to unify both the way of working onthe fault analysis and the manner of how information of a single fault report andits analysis can be shared. For this purpose, a web framework called Machi-Stackwas included in the project. Machi-Stack combines all of the described softwarecomponents, that is, Machi products with the supporing structure from ELK stack.
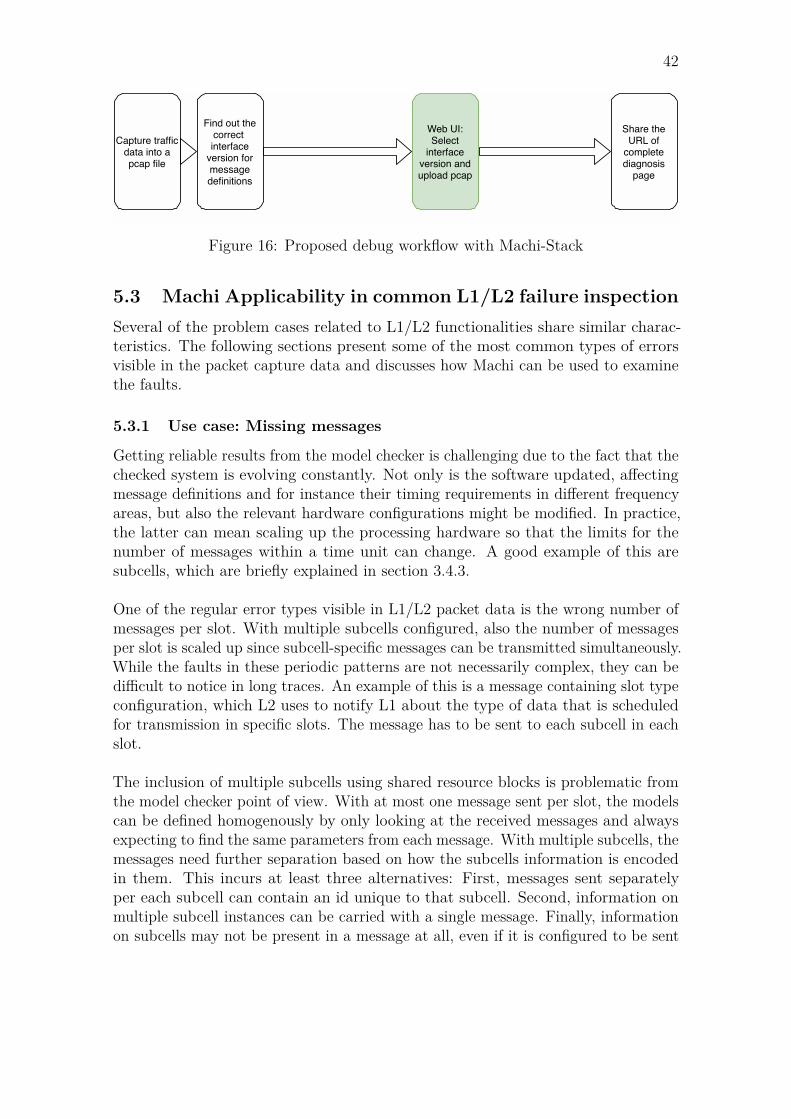
42
Capture trafficdata into apcap file
Find out thecorrect interface
version formessagedefinitions
Share theURL of
completediagnosis
page
Web UI:Select
interfaceversion andupload pcap
Figure 16: Proposed debug workflow with Machi-Stack
5.3 Machi Applicability in common L1/L2 failure inspectionSeveral of the problem cases related to L1/L2 functionalities share similar charac-teristics. The following sections present some of the most common types of errorsvisible in the packet capture data and discusses how Machi can be used to examinethe faults.
5.3.1 Use case: Missing messages
Getting reliable results from the model checker is challenging due to the fact that thechecked system is evolving constantly. Not only is the software updated, affectingmessage definitions and for instance their timing requirements in different frequencyareas, but also the relevant hardware configurations might be modified. In practice,the latter can mean scaling up the processing hardware so that the limits for thenumber of messages within a time unit can change. A good example of this aresubcells, which are briefly explained in section 3.4.3.
One of the regular error types visible in L1/L2 packet data is the wrong number ofmessages per slot. With multiple subcells configured, also the number of messagesper slot is scaled up since subcell-specific messages can be transmitted simultaneously.While the faults in these periodic patterns are not necessarily complex, they can bedifficult to notice in long traces. An example of this is a message containing slot typeconfiguration, which L2 uses to notify L1 about the type of data that is scheduledfor transmission in specific slots. The message has to be sent to each subcell in eachslot.
The inclusion of multiple subcells using shared resource blocks is problematic fromthe model checker point of view. With at most one message sent per slot, the modelscan be defined homogenously by only looking at the received messages and alwaysexpecting to find the same parameters from each message. With multiple subcells, themessages need further separation based on how the subcells information is encodedin them. This incurs at least three alternatives: First, messages sent separatelyper each subcell can contain an id unique to that subcell. Second, information onmultiple subcell instances can be carried with a single message. Finally, informationon subcells may not be present in a message at all, even if it is configured to be sent

43
every slot for multiple subcells.
Regardless of the subcell configuration, the original Machi-Checker slot-level modelgranularity works as long as the relevant models are scaled appropriately. The modelcan be modified by either adding new transitions to the existing model implementinga Moore machine, or alternatively by converting it into a Mealy machine with averification of the number of detected messages. As the number of subcells grows, aMealy machine might be the more sensible option since the required modification tothe original model is less extensive. A simple example of a scaled-up model can beseen in Listings 3, 4 and 5.

44
const model = {
name: ’basic’,
transitions: [’s0/DlData_SlotTypeReq -> s1’
]}
Listing 3: Machi model for one subcell configuration, Moore machine implementation
const model = {
name: ’basic’,
transitions: [’s0/DlData_SlotTypeReq -> s1’,’s1/DlData_SlotTypeReq -> s2’,’s2/DlData_SlotTypeReq -> s3’,’s3/DlData_SlotTypeReq -> s4’,’s4/DlData_SlotTypeReq -> s5’,’s5/DlData_SlotTypeReq -> s6’,’s6/DlData_SlotTypeReq -> s7’,’s7/DlData_SlotTypeReq -> s8’
]}
Listing 4: Machi model for eight subcell configuration, Moore machine implementation
const model = {
name: ’basic’,
transitions: [’s0/DlData_SlotTypeReq -> s0/check’
],
check(machine) {return (machine.trace.length < 8)
? machine.status: machine.utils.status.finished;
}}
Listing 5: Machi model for eight subcell configuration, Mealy machine implementation
As soon as failures in the constructed machines are encountered, Machi-Checkerstarts building a detailed report on failure locations in the input data. The final
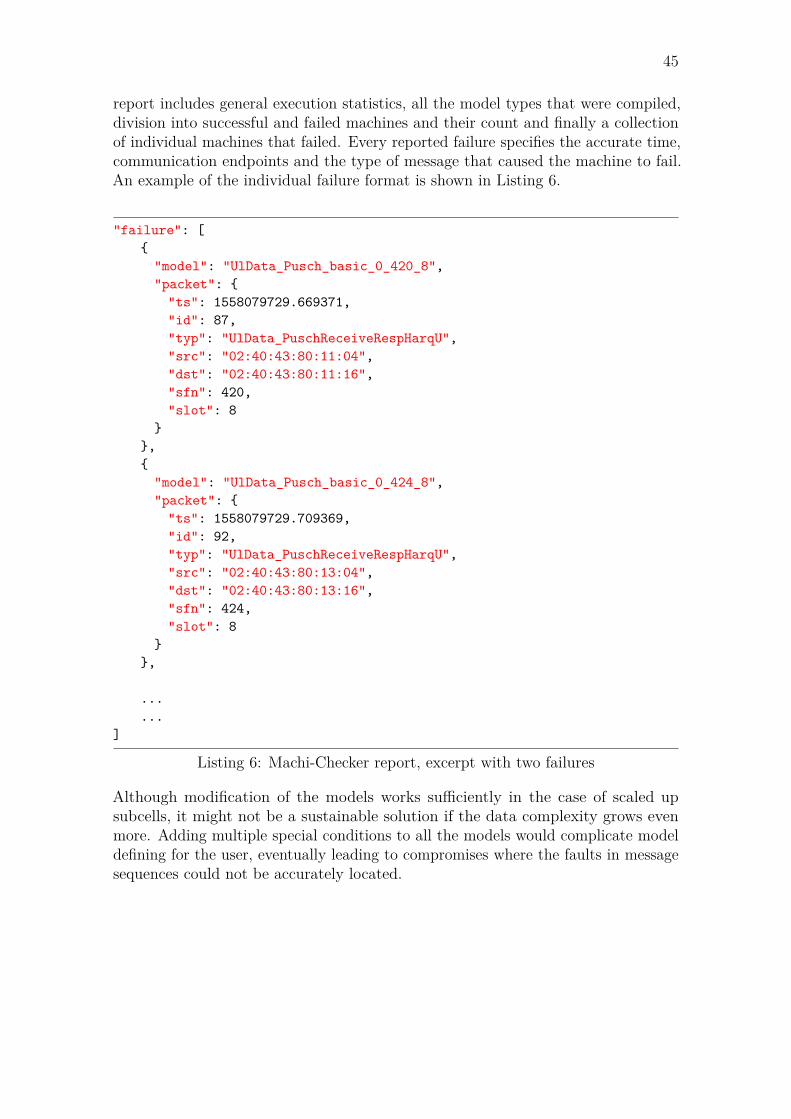
45
report includes general execution statistics, all the model types that were compiled,division into successful and failed machines and their count and finally a collectionof individual machines that failed. Every reported failure specifies the accurate time,communication endpoints and the type of message that caused the machine to fail.An example of the individual failure format is shown in Listing 6.
"failure": [{
"model": "UlData_Pusch_basic_0_420_8","packet": {
"ts": 1558079729.669371,"id": 87,"typ": "UlData_PuschReceiveRespHarqU","src": "02:40:43:80:11:04","dst": "02:40:43:80:11:16","sfn": 420,"slot": 8
}},{
"model": "UlData_Pusch_basic_0_424_8","packet": {
"ts": 1558079729.709369,"id": 92,"typ": "UlData_PuschReceiveRespHarqU","src": "02:40:43:80:13:04","dst": "02:40:43:80:13:16","sfn": 424,"slot": 8
}},
...
...]
Listing 6: Machi-Checker report, excerpt with two failures
Although modification of the models works sufficiently in the case of scaled upsubcells, it might not be a sustainable solution if the data complexity grows evenmore. Adding multiple special conditions to all the models would complicate modeldefining for the user, eventually leading to compromises where the faults in messagesequences could not be accurately located.

46
5.3.2 Use case: CRC failure for a specific message format
As wireless communication is always vulnerable to noise and interference, signaltransmission in wireless communication systems practically always incorporates someform of redundancy. Familiar from previous generations, 5G also utilises HARQcombining error detecting and error correcting coding [23]. As mentioned in section3.2.5, data from L2 towards L1 is transmitted in Transport Blocks. To assure theintegrity of transmitted data was preserved, the data is appended with a redundantset of bits. If the integrity was not preserved, the receiver in L1 can use HARQ as atrigger to request retransmission of the data. [23]
The size for a single TB is limited, and every TB exceeding this limit is dividedinto evenly sized codeblocks, each attached with their own CRC value. In the caseof a transmission failure, having each of the codeblocks addressed by the HARQprocedure would be too cumbersome. Therefore, the codeblocks are organized intocodeblock groups (CBGs), and if per-CBG configuration for retransmissions is used,only the groups containing errors need to be retransmitted if failures were detected.Aside from the error detection mechanism, HARQ also includes error correctingin the form of soft combining. With soft combining, the erronously received datais buffered by the receiver and after retransmission combined with the new data.Since even corrupted transmissions often contain meaningful data, a small numberof retransmissions may suffice to construct the original data instead of requiring asingle transmission to succeed completely. [23]
In a deployed 5G system the CRC failures could be explained by high noise orinterference levels. In controlled lab environments, however, such failures shouldextremely rarely occur, and more often a CRC failure can indicate problems in thetransmitting hardware or its related software. In addition to this, a mechanismcalled Discontinuous Transmission (DTX) is used by UEs to prohibit data transmis-sion on a control channel when there is no payload to be sent [28]. Searching forthe CRC and DTX combinations is a typical task when looking at pcap data, forinstance when searching for DTX failures when data transmission has been scheduled.
Compared to Wireshark, the combination of Kibana and Elasticsearch is especiallyefficient when it comes to more detailed queries and data filtering. One examplequery based on the aforementioned CRC/DTX inspection could be as follows: findall PUCCH messages with format 2 and DTX 1. With Wireshark, the filter can beconstructed in a few ways but the result is quite long. One way to do this is byfinding an example of every message type with the searched DTX or pucchFormatparameter and adding them to the filter. The alternative is to just construct thefilter query directly using domain specific query language if the data structure isknown. Elasticsearch with its Kibana UI supports the same methods, but the filter ismore compact and can be built more interactively by just clicking relevant parametervalues to filter them in or out. The example queries for Wireshark and Elasticsearchare in Listings 7 and 8, respectively.

47
(UlData_PucchReceiveRespPs.pucchResources_item_15.dtx == 0x01 ||UlData_PucchReceiveRespHarqD.pucchResources_item_15.dtx == 0x01 ) &&
(UlData_PucchReceiveResp.pucchResources_item_15.pucchFormat == 0x02 ||UlData_PucchReceiveRespHarqD.pucchResources_item_15.pucchFormat == 0x02)
Listing 7: Wireshark query for PUCCH messages with format 2 and DTX 1
packet_name:*pucch* ANDpucchResources_0.dtx:1 ANDpucchResources_0.pucchFormat:2
Listing 8: Elasticsearch query for PUCCH messages with format 2 and DTX 1
Table 3 compares the formed queries and their execution times in Wireshark andElasticsearch. Especially for larger pcap files, Wireshark takes an excessively longtime to filter data with more complicated queries, whereas with Elasticsearch theperformance does not significantly decrease. It’s good to note the compared softwareare run on different computers, but the difference in execution times is rather largeregardless of the running system specifications. In this example, Wireshark was runon a system with 1.90 GHz Intel Core i7-8650U quad-core processor and 32 GB RAM,whereas Machi along with Elasticsearch on 2.4 GHz Intel Xeon E5-2680 v4 quad-coreprocessor and 12 GB RAM. Memory was not an issue to either of the alternatives,since there was no increased disk usage noticed during the filtering processes.
Table 3: Filtering queries and execution times for dissected pcaps
Query language PCAP Size (MB) Packets Time (s)
Wireshark display filter language7,48 46832 ∼1385,8 525227 ∼162214 932524 ∼244
Elasticsearch Query DSL7,48 46832 ∼185,8 525227 ∼1214 932524 ∼1
5.3.3 Use case: Multiple UE inspection
For instance the CRC failure inspection might get even more complicated with multi-ple UEs simultaneously communicating with a base station. The message sequencesfor different UEs may overlap in time, which might make manual inspection of thetrace more tedious. For individual UEs the slot-limited Machi-Checker models aresufficient to capture each communication sequence between L1 and L2. The patterndetection with the basic model granularity can, however, fail if the sequences ofmultiple UEs interleave in time.

48
Additional required information such as a UE identifier does not break the idea ofmodel definitions, but rather emphasizes its flexibility. The UE identifier, which is inmore detail explained in the next section, differs from the existing model parameterssince it’s not present in all the messages. From the model checker perspective this doesnot matter, since the identifier can be used as an additional part in the model namingscheme if detected, and represented by a constant value in case it is not present. Theadapted model naming scheme would be following, with RNTI describing the UEidentifier:
(MODELTYPE)_(MODELNAME)_(ROUND)_(SFN)_(SLOT)_(RNTI)
The detection of messages including UE identifiers would construct separable modelnames, where a different identifier results into building separate models even iftime-related parameters SFN and slot would be identical:
UlDataPusch_basic_1_23_3_49299
Without the identifier, the original model granularity would be used, and the samemessage type, SFN, SFN round counter and slot result into using the same automatonspawned from the model:
UlDataSlotTypeReq_basic_0_10_1_undefined
Even though the model checker is able to handle multiple UEs with minimal recon-figuration, the dissector may have more trouble in parsing the relevant informationout of the input pcap.
5.3.4 Use case: UE attach failure
A number of the most common fault analysis cases are related to Contention BasedRandom Access, which is a standard procedure for a UE to attach into the mobilenetwork. The core procedure follows an interchange of four messages, typicallyreferred as Msg1, Msg2, Msg3 and Msg4, between the UE and a gNB. The mostrelevant parts of the random access procedure are illustrated in Figure 17.
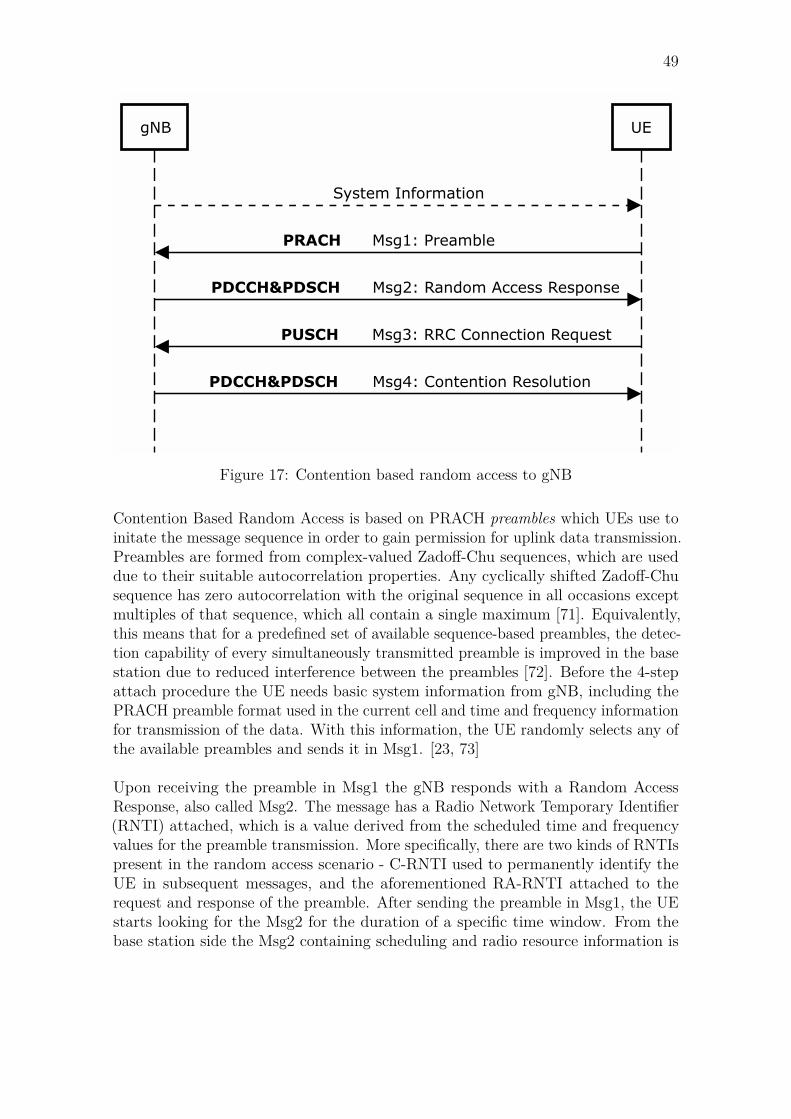
49
gNB UE
System Information
PRACH Msg1: Preamble
PDCCH&PDSCH Msg2: Random Access Response
PUSCH Msg3: RRC Connection Request
PDCCH&PDSCH Msg4: Contention Resolution
Figure 17: Contention based random access to gNB
Contention Based Random Access is based on PRACH preambles which UEs use toinitate the message sequence in order to gain permission for uplink data transmission.Preambles are formed from complex-valued Zadoff-Chu sequences, which are useddue to their suitable autocorrelation properties. Any cyclically shifted Zadoff-Chusequence has zero autocorrelation with the original sequence in all occasions exceptmultiples of that sequence, which all contain a single maximum [71]. Equivalently,this means that for a predefined set of available sequence-based preambles, the detec-tion capability of every simultaneously transmitted preamble is improved in the basestation due to reduced interference between the preambles [72]. Before the 4-stepattach procedure the UE needs basic system information from gNB, including thePRACH preamble format used in the current cell and time and frequency informationfor transmission of the data. With this information, the UE randomly selects any ofthe available preambles and sends it in Msg1. [23, 73]
Upon receiving the preamble in Msg1 the gNB responds with a Random AccessResponse, also called Msg2. The message has a Radio Network Temporary Identifier(RNTI) attached, which is a value derived from the scheduled time and frequencyvalues for the preamble transmission. More specifically, there are two kinds of RNTIspresent in the random access scenario - C-RNTI used to permanently identify theUE in subsequent messages, and the aforementioned RA-RNTI attached to therequest and response of the preamble. After sending the preamble in Msg1, the UEstarts looking for the Msg2 for the duration of a specific time window. From thebase station side the Msg2 containing scheduling and radio resource information is

50
sent on PDSCH, and its associated control signal containing the derived RA-RNTIis sent on PDCCH. If the DCI within a detected PDCCH signal contains an RA-RNTI the UE is able to decode, also the corresponding PDSCH signal is decoded. [23]
Finally, it is possible that more than one UE attemps random access with the samepreamble, which means that a randomly selected preamble does not guarantee uniqueidentification of the UEs. Therefore, the procedure contains a contention resolutionphase to allow only a single UE to transmit with the allocated resources. After receiv-ing and successfully decoding Msg2, UEs send an RRC connection request (Msg3)on PUSCH. The request contains an identifier picked to uniquely represent thatUE, which consequently means that any further RRC connection request messagesshould be discarded. Step-by-step this means that all the UEs transmitting samePRACH preamble are assigned the same C-RNTI, but in the eventual Msg4 sent as aresponse to the RRC connection request only one UE can receive the matching uniqueidentifier originating from the received Msg3. The whole communication patterncontains more messages, but they are not relevant from L1 perspective. [23, 73]
One of the issues with more complex message sequences is that the initial designfor Machi model checker is limited in time to the level of one slot in 5G NR framestructure. A concrete example of this was encountered in a problem case concerningghost preambles, which refer to noise that is incorrectly identified as preambles in thebase station PRACH receiver. As the actual physical problem is difficult to alleviate,the more relevant question is how to effectively detect the real preambles among thepossibly large number of fake ones. All the four phases of Contention Based RandomAccess that were described above are relevant for L1/L2 interface, but a time-basedconstraint for the whole sequence is much more difficult to construct. Anothermatter with the preambles is that their relevance is somewhat deductable based ontheir measured signal energy. However, there exists no simple means to define anormal level for the energy value, which makes an automated check more complex.A quantity-based classification into real and ghost preambles is not straighforwardeither, since it cannot easily be deduced which of the alternatives appears more often.
Most hands-on approach with Machi is to attempt visualization of the data by defin-ing a suitable threshold for the signal energy level. The noise-generated preamblestypically contain roughly constant values for signal energy, whereas the actual pream-bles can contain both extremely low and high values. By following those extremafrom the data visualization to the corresponding document, e.g. using the packetindex, the following message sequence can be used to determine whether the signaldetected as a preamble led to proceeding in the random access procedure. Figure 18shows an example of a peak in the detected signal energy. The timestamp attachedto the value can be used as a filter to find the corresponding document containingpacket with the detected peak value.

51
Figure 18: Reported signal peaks in PRACH messages
Another solution without relying on the visualization is to detect missing responses ina PUSCH message sequence with the model checker. If the random access procedurewas interrupted, One indication of that is a failure in the CRC described in section5.3.2, which should occur if the detected preamble didn’t contain sensible data.Internally, L1/L2 implementation is divided into multiple processes communicatingwith each other, and one of the PUSCH messages between these processes is droppedin case of a CRC failure. The report produced by Machi-Checker can effectivelypinpoint the locations of these missing messages, but it doesn’t directly report thelocation of a real preamble since there should be no failure in state machine of asuccessful message sequence.

52
6 EvaluationThe first version of Machi-Stack was an attempt to both simplify the debuggingworkflow from the user’s perspective and to explore the possibilities of automatedanomaly detection for packet captures. At the time this is written, the stack hasbeen used and given feedback from individual developers in Nokia 5G L1 for acouple of months. Regardless of the tools used, the time used on debugging isalways subjective. An unbiased, quantative estimate of time saved with Machi wouldrequire comprehensive effort for instance in the form of interviews, which due to timeconstraints was not possible to conduct.
The proposed workflow reduces the number of steps in the debugging process sig-nificantly. If the fault analysis limits to L1/L2 real-time messages, the installationof a Wireshark distribution can be avoided completely. Even more concrete benefitis that users won’t need to install new dissector plugins every time the messagedefinitions are updated. Instead, a new interface version is added to the Machisoftware stack only once before it’s permanently available in both the offline andonline version of the tool. Furthermore, dissecting and converting the dissecteddata into a suitable format is completely automized, and all the required pcap fileprocessing is self-contained within the stack.
Since most of the software components included in Machi-Stack are responsible fortasks that are only executed once, performance was never considered a priority inthe software design. For large pcap files the dissection process with Machi may takea longer time compared to Wireshark, but on the other hand does not need to berepeated as the results can easily be shared. Performance has a higher importancewhen the process enters its iterative phase, which is when the user has to inspectpacket data contents. Measurements in section 5.3.2 show that Machi-containedElasticsearch performs notably better than Wireshark in packet data filtering, whichis a repetitive task in every fault investigation.
Perhaps the most remarkable change is in the way the data is handled after it’savailable for inspection. Apart from being relatively slow, filtering with Wiresharkhas also the issue of providing access only to the remaining portion of the data whenthe filtered dataset is shared. The combination of Elasticsearch and Kibana offersimple ways of sharing the filtered data while persisting control over it - any filters canbe removed to display the original dataset again instead of the need for multiple files.Simple including or excluding filters based on parameter values can be performedquickly by selecting them directly in the document list on the main Kibana page.The supported query language provides means to display packets with certain pa-rameter values or value ranges and for instance packets filtered by regular expressions.
The idea of containing all the necessary tools for initial fault investigation is fairlysuccessfully fulfilled in Machi-Stack. Previously, coming up with data visualizationto support anomaly detection has required external software. With Kibana, browsing

53
and visualizing data can be performed jointly. As an example, visualization can beutilized to confine a dataset and directly be used as a filter, and on the other handfiltered data can be used to create more accurate visualizations.
The Machi model checker performance is arguably the most difficult one to evaluate.Generally, it manages to prove its concept very well, and is capable of detectingmessage pattern discrepancies from large packet captures with a minimal overhead.The interface for defining new models is also quite simple, allowing users with expertknowledge to define their own patterns to be detected from the data. One recurringobstacle during the model checker development was the changing requirements forits scope. Additional information to modify the model granularity was expected, andwas also concretised with the need to separate different UE identifiers and subcells.A more difficult question, however, was if the model checker should be enlarged toexplicitly handle message parameters in addition to their sequences. Effectively, thiswould have meant a solution combining the original model checker and a query tothe packet contents. Eventually, it was decided that the original model checker ideawould be altered too much, and the automated packet content inspection was left tobe addressed in the future.
6.1 Discussion and future workA fully automated solution for debugging distributed and constantly evolving systemsis difficult. Even with a lot of available data, the classification into anomalousand non-anomalous behaviour can depend on numerous non-trivial aspects suchas different system configurations for various product releases or simply the vastlydiffering problem cases. Guided by this insight, it was decided relatively early inthe project that a solution in-between the previous, rather manual workflow and afully automated process would be attempted. Telecommunication systems require arelatively large amount of expert knowledge to understand the real interest points inthe data, which is why the focus in this thesis was especially in streamlining everypossible step before the expert opinion is inevitably needed.
Although Machi-Stack architecture follows the idea of openness to allow additionalsoftware components to be included in the future, it may need an overhaul forinstance depending on the number of its users. The current service lacks any kindof user management, which could prove to be an issue if the number of users orthe need for longer-period data preservation increases. Both of these could alsosignify the requirement for more computing power, but the server-side resourcesshould be possible to be scaled up rather easily. Should the stack grow enough, itmight require even more consideration on matters such as if it would benefit from amicroservice-based architecture.
Even though the proposed solution attempts to offer a generic way of processing thedebug data, it is important to notice that it is quite domain-specific to the real-timemessages between L1 and L2. If the target for the debugging is enlarged to include

54
new protocols or different kinds of data such as system logs, the complexity of boththe dissector and the model checker is bound to increase. Another matter would bewhether it is even possible to include new protocols so that the existing model checkerwould not need a complete overhaul. However, the structure of Machi software stacksupports the addition of new software components quite effortlessly, which couldalso help in the separation of concerns between components that differ significantlyfrom each other. The most desirable alternative would be to integrate an existingtool such as a system log parser into the stack. This would slightly complicate theWeb-initated debugging at least by requiring more than one file and possibly someextra configuration before the file processing could start. If viable, though, thecombination of logs and packet captures could have potential for instance in timeseries comparison which still remains one of the major issues in the debug process asa whole.

55
7 ConclusionThis thesis analyzed the fault debugging process in Nokia 5G L1. A look at theexisting debugging workflow revealed a number of steps with high redundancy, repeti-tiviness and overall manual work which increases the time used on fault investigation.To enhance the process, two goals were pursued in this work. First, the differentdebugging steps were centralized into a single software stack in order to simplify therequired actions for those attending the debugging process. Second, the role of amodel checker in anomaly detection was examined to find out if visual browsing offaulty communication patterns could be supported by automated methods.
The implemented software stack was designed to support a number of core activ-ities typical in every debugging case. Having acquired a packet capture, the onlyknowledge required from a user would be the version of an interface used to definemessage format in that capture. Subsequent capture data dissection, indexing, up-loading for further investigation and also model checking was automated, and theirprogress status could be monitored on a single web page. In addition to the coreactivities, a typical debugging workflow would include data visualization and sharing.Elastic stack, and more precisely its two components Elasticsearch and Kibana, wereadded to the project to help processing packet captures effectively and to get datavisualization as part of the software stack with no need for external software. Bycentralizing all these activities, the number of steps in the initial debugging processof a fault was notably reduced.
The model checker was included in the software stack to further reduce manualinspection of packet captures. As the communication patterns in distributed systemscan be difficult for a human to follow, the goal for the model checker was to modelthese patterns and report if any discrepancies in message sequences were noticed. Thedominant idea was to come up with a simple means for users to define their own modeldefinitions, which would include expected message sequences and be automaticallyrun against input packet data. The model checker was able to recognize faults in themessage sequences effectively, but would run into trouble if the complexity of theinput data was too high. Examples of the complexity included constantly evolvingsystem configurations, which were scaled up so that the original slot-limited modelswere not accurate enough without modifications to either the models themselvesor the core of the software responsible for model granularity. The former of thesealternatives proved sufficient, but the models would likely grow too complicated ifthe packet data structure grew more.
Overall, the solution proposed in this thesis is able to streamline the initial phasesof debugging workflow. A fair evaluation of total time saved with the centralizedsoftware stack would require a lot of feedback from users, but based on the initialfeedback it has taken the debugging approach to a promising course. Since thesolution limits to inspecting packet captures, however, it is obviously not capableof completely solving problem cases, but instead intends to steer fault investigation
56
towards the correct direction. Future study of the subject should include automationof combined packet capture and system log investigation, which would provide amuch deeper look on the system state during failures.

57
References[1] Wireshark documentation. [Online]. Available: https://www.wireshark.org/
docs/. [Accessed 12 August 2019].
[2] 5G PPP Architecture Working Group. View on 5G Architecture. Technicalreport, 2017.
[3] L. Maccari, Merkourios Karaliopoulos, I. Koutsopoulos, Leandro Navarro, F. Fre-itag, and R. LoCigno. 5G and the Internet of Everyone: Motivation, Enablers,and Research Agenda. pages 429–433, Jun 2018.
[4] ITU-R. Minimum requirements related to technical performance for IMT-2020radio interface(s). Technical report, International Telecommunication Union,2017.
[5] ETSI. 3GPP TS 38.211 version 15.2.0 Release 15, 2018.
[6] ITU-R. IMT Vision – Framework and overall objectives of the future developmentof IMT for 2020 and beyond. Technical report, International TelecommunicationUnion, 2015.
[7] Y. Beyene. Algorithms, Protocols and Cloud-RAN Implementation Aspects of5G Networks. PhD thesis, Aalto University School of Electrical Engineering,2017.
[8] Hyoungju Ji, Sunho Park, Jeongho Yeo, Younsun Kim, Juho Lee, and ByonghyoShim. Introduction to Ultra Reliable and Low Latency Communications in 5G.Apr 2017.
[9] R. El Hattachi and J. Erfanian. NGMN 5G White Paper. Technical report,NGMN Alliance.
[10] Euro-5g. D2.6 Final report on programme progress and KPIs. Technical report,2017.
[11] ETSI. 3GPP TS 38.104 version 15.2.0 Release 15, 2018.
[12] Ji H. Ultra-Reliable and Low-Latency Communications in 5G Downlink:Physical Layer Aspects. IEEE Wireless Communications, 25:124–130, 2018.
[13] M. Bennis, M. Debbah, and H. V. Poor. Ultrareliable and Low-LatencyWireless Communication: Tail, Risk, and Scale. Proceedings of the IEEE,106(10):1834–1853, Oct 2018.
[14] P. Popovski, K. Trillingsgaard, O. Simeone, and G. Durisi. 5G Wireless NetworkSlicing for eMBB, URLLC, and mMTC: A Communication-Theoretic View,Apr 2018.

58
[15] C. Bockelmann, N. Pratas, H. Nikopour, K. Au, T. Svensson, C. Stefanovic,P. Popovski, and A. Dekorsy. Massive machine-type communications in 5g:physical and mac-layer solutions. IEEE Communications Magazine, 54(9):59–65,Sep 2016.
[16] V. Yazıcı, U. C. Kozat, and M. O. Sunay. A new control plane for 5gnetwork architecture with a case study on unified handoff, mobility, and routingmanagement. IEEE Communications Magazine, 52(11):76–85, Nov 2014.
[17] ETSI. 3GPP TR 21.905 version 4.5.0 Release 4, 2003.
[18] ITU-T. Transport Network Support of IMT-2020/5G. Technical report,International Telecommunication Union, 2018.
[19] R. MacKenzie. NGMN Overview on 5G RAN Functional Decomposition.Technical report, NGMN Alliance.
[20] ETSI. ETSI GS NFV 003 V1.3.1 - Network Functions Virtualization (NFV);Terminology for Main Concepts in NFV, 2013.
[21] P. Arnold, N. Bayer, J. Belschner, and G. Zimmermann. 5g radio access networkarchitecture based on flexible functional control / user plane splits. In 2017European Conference on Networks and Communications (EuCNC), pages 1–5,Jun 2017.
[22] B. Bertenyi, R. Burbidge, G. Masini, S. Sirotkin, and Y. Gao. NG Radio AccessNetwork (NG-RAN). Journal of ICT Standardization, 6:59–76, 2018.
[23] E. Dahlman, S. Parkvall, and J. Sköld. 5G NR: The Next Generation WirelessAccess Technology. Academic Press, 2018.
[24] M. Dye, R. McDonald, and A. Rufi. Network Fundamentals, CCNA ExplorationCompanion Guide. 2007.
[25] ETSI. 3GPP TS 38.322 version 15.3.0 Release 15, 2018.
[26] R. Freeman. Telecommunication System Engineering. John Wiley & Sons,Incorporated, 2015.
[27] ETSI. 3GPP TS 38.321 version 15.3.0 Release 15, 2018.
[28] E. Dahlman, S. Parkvall, and J. Sköld. 4G LTE/LTE-Advanced for mobilebroadband. Elsevier/Academic Press, 2011.
[29] Concepts of Orthogonal Frequency Division Multiplexing (OFDM) and802.11 WLAN. [Online]. Available http://rfmw.em.keysight.com/wireless/helpfiles/89600b/webhelp/subsystems/wlan-ofdm/Content/ofdm_basicprinciplesoverview.htm. [Accessed: 15 Jul 2019].

59
[30] 5G Waveform: CP-OFDM & DFT-SOFDM. [Online]. Avail-able https://www.electronics-notes.com/articles/connectivity/5g-mobile-wireless-cellular/waveform-optimised-ofdm.php. [Accessed:16 Sep 2019].
[31] S. Lien et al. 5G New Radio: Waveform, Frame Structure, Multiple Access,and Initial Access. IEEE Communications Magazine, 55(6):64–71, Jun 2017.
[32] GSM Association. 5G Spectrum. [Online]. Available: https://www.gsma.com/spectrum/wp-content/uploads/2018/11/5G-Spectrum-Positions.pdf,2018.
[33] X. Lin et al. 5G New Radio: Unveiling the Essentials of the Next GenerationWireless Access Technology. CoRR, abs/1806.06898, 2018.
[34] S. Sesia, I. Toufik, and M. Baker. LTE - The UMTS Long Term Evolution.John Wiley & Sons, Incorporated, 2009.
[35] What is 5G NR SS Block | SS Burst vs SS Block. [Online]. Available http://www.rfwireless-world.com/5G/5G-NR-SS-Block.html. [Accessed: 3 April2019].
[36] SS/PBCH (5G NR). [Online]. Available http://rfmw.em.keysight.com/wireless/helpfiles/89600B/WebHelp/Subsystems/newradio/Content/newradio_dlg_config_ss_pbch.htm. [Accessed: 15 Jul 2019].
[37] L. Kundu, G. Xiong, and J. Cho. Physical Uplink Control Channel Design for5G New Radio. In 2018 IEEE 5G World Forum (5GWF), pages 233–238, Jul2018.
[38] S. Parkvall, E. Dahlman, A. Furuskar, and M. Frenne. NR: The New 5G RadioAccess Technology. IEEE Communications Standards Magazine, 1(4):24–30,Dec 2017.
[39] Q. Li et al. MIMO techniques in WiMAX and LTE: a feature overview. IEEECommunications Magazine, 48(5):86–92, May 2010.
[40] F. W. Vook, A. Ghosh, and T. A. Thomas. MIMO and beamforming solutionsfor 5G technology. In 2014 IEEE MTT-S International Microwave Symposium(IMS2014), pages 1–4, Jun 2014.
[41] C. Baier and J.-P. Katoen. Principles of Model Checking. MIT Press, 2008.
[42] V. Chandola A. Banerjee and V. Kumar. Anomaly Detection: A Survey. ACMComput. Surv., 41(3):15:1–15:58, July 2009.
[43] M. Toledano, I. Cohen, Y. Ben-Simhon, and I. Tadeski. Real-time anomalydetection system for time series at scale. In Proceedings of the KDD 2017:Workshop on Anomaly Detection in Finance, volume 71 of Proceedings of MachineLearning Research, pages 56–65. PMLR, Aug 2018.

60
[44] N. Laptev, S. Amizadeh, and I. Flint. Generic and Scalable Framework forAutomated Time-series Anomaly Detection. In Proceedings of the 21th ACMSIGKDD International Conference on Knowledge Discovery and Data Mining,KDD ’15, pages 1939–1947, New York, NY, USA, 2015. ACM.
[45] K. Rai, M. Devi, and A. Guleria. Packet-based Anomaly Detection usingn-gram Approach. International Journal of Computer Sciences and Engineering,Volume-6, 06 2018.
[46] P. Barford and D. Plonka. Characteristics of Network Traffic Flow Anomalies.Proceedings of the ACM SIGCOMM Internet Measurement Workshop, Aug 2001.
[47] H. A. Nguyen and D. Choi. Network Anomaly Detection: Flow-based orPacket-based Approach? CoRR, abs/1007.1266, 2010.
[48] Y. Kou, C.-T. Lu, S. Sirwongwattana, and Y.-P. Huang. Survey of frauddetection techniques. In IEEE International Conference on Networking, Sensingand Control, 2004, volume 2, pages 749–754 Vol.2, Mar 2004.
[49] A. Boukerche, K. R. L. Jucá, J. B. Sobral, and M. S. M. A. Notare. An artificialimmune based intrusion detection model for computer and telecommunicationsystems. Parallel Computing, 30(5):629 – 646, 2004.
[50] S. Subudhi and S. Panigrahi. Quarter-Sphere Support Vector Machine for FraudDetection in Mobile Telecommunication Networks. Procedia Computer Science,48:353 – 359, 2015. International Conference on Computer, Communicationand Convergence (ICCC 2015).
[51] W.-K. Wong, A. Moore, G. Cooper, and M. Wagner. Rule-based AnomalyPattern Detection for Detecting Disease Outbreaks. In Eighteenth NationalConference on Artificial Intelligence, pages 217–223, Menlo Park, CA, USA,2002. American Association for Artificial Intelligence.
[52] N. Duffield, P. Haffner, B. Krishnamurthy, and H. Ringberg. Rule-BasedAnomaly Detection on IP Flows. pages 424 – 432, May 2009.
[53] C. C. Noble and D. J. Cook. Graph-based Anomaly Detection. In Proceedingsof the Ninth ACM SIGKDD International Conference on Knowledge Discoveryand Data Mining, KDD ’03, pages 631–636, New York, NY, USA, 2003. ACM.
[54] W. Eberle and L. Holder. Discovering Structural Anomalies in Graph-BasedData. In Seventh IEEE International Conference on Data Mining Workshops(ICDMW 2007), pages 393–398, Oct 2007.
[55] A. Kind, M. P. Stoecklin, and X. Dimitropoulos. Histogram-based trafficanomaly detection. IEEE Transactions on Network and Service Management,6(2):110–121, Jun 2009.

61
[56] J. E. Hopcroft, R. Motwani, and J. D. Ullman. Introduction to AutomataTheory, Languages, and Computation (3rd Edition). Addison-Wesley LongmanPublishing Co., Inc., 2006.
[57] Moore andMealy Machines. [Online]. Available https://www.tutorialspoint.com/automata_theory/moore_and_mealy_machines.htm. [Accessed: 27 Sep2019].
[58] F. Vaandrager. Model Learning. Commun. ACM, 60(2):86–95, January 2017.
[59] E. M. Clarke, E. A. Emerson, and J. Sifakis. Model Checking: AlgorithmicVerification and Debugging. Commun. ACM, 52(11):74–84, Nov 2009.
[60] D. R. Wallace and R. U. Fujii. Software verification and validation: an overview.IEEE Software, 6(3):10–17, May 1989.
[61] Manpage of TCPDUMP, April 2019.
[62] Libpcap file format. [Online]. Available: https://wiki.wireshark.org/Development/LibpcapFileFormat. [Accessed 3 April 2019].
[63] Wireshark Chapter 1. Introduction. [Online]. Available: https://www.wireshark.org/docs/wsug_html_chunked/ChapterIntroduction.html#ChIntroWhatIs. [Accessed 3 July 2019].
[64] Lua/Dissectors. [Online]. Available: https://wiki.wireshark.org/Lua/Dissectors. [Accessed 3 April 2019].
[65] Wireshark Developer’s Guide, Chapter 9. Introduction. [On-line]. Available: https://www.wireshark.org/docs/wsdg_html_chunked/ChapterDissection.html. [Accessed 3 July 2019].
[66] CloudShark User Guide. [Online]. Available https://support.cloudshark.io/user-guide/. [Accessed: 30 Aug 2019].
[67] What is the Elk Stack? [Online]. Available: https://www.elastic.co/elk-stack. [Accessed 7 May 2019].
[68] Beats Platform Reference: Overview. [Online]. Available: https://www.elastic.co/guide/en/beats/libbeat/current/beats-reference.html.[Accessed 7 May 2019].
[69] Elasticsearch Reference: Basic Concepts. [Online]. Available:https://www.elastic.co/guide/en/elasticsearch/reference/current/getting-started-concepts.html. [Accessed 7 May 2019].
[70] Z. Tong. What is an Elasticsearch Index?, 2013. [Online]. Available: https://www.elastic.co/blog/what-is-an-elasticsearch-index. [Accessed 7 May2019].

62
[71] R. Frank, S. Zadoff, and R. Heimiller. Phase shift pulse codes with good periodiccorrelation properties (Corresp.). IRE Transactions on Information Theory,8(6):381–382, October 1962.
[72] PRACH Preamble Detection and Timing Advance Estima-tion for multi-UE in 3GPP LTE. [Online]. Availablehttps://www.mymowireless.com/wp-content/uploads/2017/02/White-Paper-PRACH-Preamble-Detection-and-Timing-Advance-Estimation-for-....pdf. [Accessed: 9 Aug 2019].
[73] 5G/NR - Initial Access/RACH. [Online]. Available: https://www.sharetechnote.com/html/5G/5G_RACH.html. [Accessed 10 July 2019].