Embed Size (px)
Citation preview
Loughborough UniversityInstitutional Repository
Improving the safety andmobility of vulnerable road
users through ITSapplications [VRUITS] D2.3Implementation Scenarios
This item was submitted to Loughborough University's Institutional Repositoryby the/an author.
Citation: MELENDEZ, A.B.G. ...et al., 2016. Improving the safety and mo-bility of vulnerable road users through ITS applications [VRUITS] D2.3 Imple-mentation Scenarios. VRUITS, 125pp.
Additional Information:
• This is an official report.
Metadata Record: https://dspace.lboro.ac.uk/2134/24070
Version: Published
Publisher: European Commission/VRUITS c© VTT
Rights: This work is made available according to the conditions of the Cre-ative Commons Attribution-NonCommercial-NoDerivatives 4.0 International(CC BY-NC-ND 4.0) licence. Full details of this licence are available at:https://creativecommons.org/licenses/by-nc-nd/4.0/
Please cite the published version.

This project has received funding from the European Union’s Seventh
Framework Programme for research, technological development and
demonstration under grant agreement no 321586
Grant agreement n° 321586
D2.3
Implementation Scenarios
Authors:
Alejandra Beatriz García Meléndez
Óscar Martín Pérez
CIDAUT Foundation
Andrew Morris
Graham Hancox
Loughborough University
Daniel Bell
FACTUM Chaloupka & Risser OHG
Dick Mans
ECORYS
Martijn van Noort
TNO

http://www.vruits.eu
© Copyright 2014 VTT
The copyright of this document is reserved on behalf of the VRUITS consortium by VTT.
The contents may not be disclosed without prior written consent of VTT
Deliverable information
Project no 321586
Project acronym vruits
Project title Improving the safety and mobility of vulnerable road users through ITS
applications
WP 2 VRU user needs, ITS prioritization and methodology
Task 2.5 Scenarios development
Deliverable D.2.3 Implementation scenarios
Status F: final
Version number 1.0
Lead Contractor CIDAUT
Dissemination level Public
Due date 30.06.2014
Date of preparation 29.10.2014
Project start and duration 1.4.2013–31.3.2016, 36 months
Project coordinator
Name Johan Scholliers
Organization VTT Technical Research Centre of Finland
email [email protected]
tel. +358 40 537 0204
fax +358 20 722 3365
Postal address:
P.O. Box 1300
FIN-33101 Tampere
Finland
Partners
III
Version history
Version Date Author Description
0.1 2014-14-01 Alejandra B. García Meléndez TOC
0.2 2014-22-04 Alejandra B. García Meléndez TOC updated based on feedback from
Ioannis Giannelos
0.3 2014-29-05 Alejandra B. García Meléndez Added Introduction, scope and objec-
tive of the deliverable, and first detail-
ing of Stakeholder consultation and
market assessment
0.4 2014-11-06 Daniel Bell First detailing of Mobility and comfort
data
0.5 2014-21-07 Andrew Morris
Graham Hancox
Safety trends
0.6 2014-24-07 Martijn van Noort First detailing of Road map for ITS
deployment
0.7 2014-25-07 Daniel Bell Update on Mobility and comfort data
0.8 2014-06-08 Daniel Bell Mobility and comfort forecast
0.9 2014-09-22 Dick Mans First detailing of Potential Business
models
0.11 2014-09-23 Óscar Martín, Alejandra Beat-
riz García Meléndez
Stakeholder consultation and market
assessment results
0.12 2014-10-09 Daniel Bell Update on mobility and comfort fore-
cast
0.13 2014-10-10 Óscar Martín, Alejandra Beat-
riz García Meléndez
Update on Stakeholder consultation
and market assessment results. Ap-
pendices added

D2.3
Implementation Scenarios
iv
Table of Contents
Table of Contents ..................................................................................................................................iv
List of abbreviations .............................................................................................................................vi
EXECUTIVE SUMMARY ........................................................................................................................vii
1. INTRODUCTION .............................................................................................................................. 1
1.1 VRUITS project ....................................................................................................................... 1 1.2 Scope and objective of the deliverable ................................................................................... 1
2. SAFETY TRENDS ............................................................................................................................ 3
2.1 Data needs ............................................................................................................................. 3 2.2 Compilation of accident data .................................................................................................. 3 2.3 Road safety trends and forecasts 2002 to 2030 .................................................................... 4
2.3.1 Results ....................................................................................................................... 4
3. MOBILITY AND COMFORT TRENDS ...........................................................................................10
3.1 Data needs ...........................................................................................................................10 3.2 Compilation of mobility and comfort data .............................................................................11
3.2.1 Mobility data .............................................................................................................13 3.2.2 Comfort data ............................................................................................................20
3.3 Mobility and comfort forecast................................................................................................24
3.3.1 Mobility forecast .......................................................................................................25 3.3.2 Comfort forecast ......................................................................................................29
4. MARKET ANALYSIS .....................................................................................................................32
4.1 Introduction ...........................................................................................................................32 4.2 Estimation on penetration rates: stakeholder consultation and market assessment ...........32
4.2.1 Procedure ................................................................................................................32 4.2.2 Results of the questionnaires ..................................................................................34 4.2.3 Second Interest Group Workshop ...........................................................................40 4.2.4 Combination of the questionnaire and IGW scenarios ............................................40 4.2.5 Translation of penetration rates to absolute numbers .............................................41
4.3 Potential business models ....................................................................................................43
4.3.1 What are business models ......................................................................................43 4.3.2 Business Model for Cooperative ITS .......................................................................44 4.3.3 Business Model In-vehicle ITS technology ..............................................................47 4.3.4 Business Model Public ITS ......................................................................................49 4.3.5 Business Model Cyclists Applications .....................................................................50
4.4 Road map for ITS deployment .............................................................................................52

D2.3
Implementation Scenarios
v
5. DISCUSSION AND CONCLUSION ...............................................................................................57
REFERENCES .......................................................................................................................................58
APPENDICES
Appendix A. Questionnaires on penetration rates ..........................................................................60 Appendix B. Vehicle park Europe-28 ..............................................................................................88 Appendix C. Mobility data – overview of available mobility survey data of selected European
countries ...............................................................................................................................96 Appendix D. Comfort data – based on mobility and safety data ..................................................110

D2.3
Implementation Scenarios
vi
List of abbreviations
AEB Autonomous Emergency Braking
B2V Bicycle-to-car communication
BRM Cyclist digital bicycle rear-view mirror and rear obstacle detection
BSD Blind Spot Detection
CAL Crossing Adaptive Lighting
CBA Cost-benefit analysis
FOD Forward obstacle detection for cyclists
GWC Green Wave for Cyclists
IGW2 Second Interest Group Workshop
INS Intersection Safety
IPTS Intelligent pedestrian traffic signal
ISA Intelligent speed adaptation
ITS Intelligent Transport System
IVB Information on Vacancy on Bicycle racks
NAV Trip planning & navigation for VRU’s
NVW Night vision and warning
PDS+EBR Pedestrian Detection System + Emergency Braking
PPAA Public Administration
PTW Powered Two-Wheeler
PTW2V PTW oncoming vehicle information system
RTPI Real time information system for public transport
USS Urban sensing system
VBS VRU beacon system.
VRU Vulnerable road user. The categories considered in this deliverable are pedestrians, bicyclists and
PTWs

D2.3
Implementation Scenarios
vii
EXECUTIVE SUMMARY
ITS Applications have in recent years assisted in reducing the number of fatalities in Europe. Howev-
er, Vulnerable Road Users (VRUs) have not benefited as much as car users. The EU-sponsored
VRUITS project assesses the safety and mobility impacts of ITS applications for VRUs, assesses the
impacts of current and upcoming ITS applications on the safety and mobility of VRUs, identifies how
the usability and efficiency of ITS applications can be improved, and recommends which actions have
to be taken at a policy level to accelerate deployment of such ITS.
This report describes general scenarios for the years 2020 and 2030 providing developments focused
on road safety trends over time at the EU-level, as well as mobility and comfort trends of VRUs. Be-
sides a thorough market analysis has been performed on existing ITS as well as relevant trends and
market penetrations, for the applications, identified in VRUITS D2.1. Information has been collected
about the likelihood of applying these systems in future years, through questionnaires sent to public
administrations in charge of road infrastructure and manufacturers of ITS systems.
Safety trends
The CARE database has been analysed to predict the likely changes in road casualties during future
years. This prediction has been conducted making the assumption that there will be no effect of the
introduction of ITS systems.
The analysis of historical data from 2002 to 2012 shows that there is a significant decline in the num-
bers of accidents overall, with car occupant casualties showing a modest decrease. However, the de-
cline in accident numbers for the VRU´s is much less pronounced with bicycle and pedestrian casual-
ties remaining relatively constant.
Concerning the trends in fatalities and serious injuries for the same period, the decline for the VRU
groups are again much less pronounced than passenger cars. The trend for slightly injured casualties
is similar, although bicycle and pedestrian casualties appear to have increased slightly during the pe-
riod.
Based on this historical data a regression analysis has been made in order to predict the likely num-
bers of casualties for the year 2030.
Assuming that the current trends in road casualty numbers remain the same until 2030 car occupant
fatalities will decrease dramatically. However the predicted decrease for the VRU groups is not so
dramatic.
Mobility and comfort trends
Available data on the mobility and the comfort of vulnerable road users has been collected. In addition
potential trends in these regards have been identified based on current studies with focus on future
issues and needed measures and developments in different areas such as infrastructure, technology,
society, etc.
This chapter outlines definitions of mobility and comfort, and provides insight into the availability of
empiric date to measure these concepts. In addition a forecast and potential trends are discussed
based on found data and studies directly focussing on the issue of future VRU mobility.
Specifically mobility data detailing modal choice, trip lengths and duration of trips has been provided
for OECD countries. General trends in land use, spatial planning and policy objectives on both nation-
al and European levels hint at potential developments in the area of vulnerable road user mobility.
Overall general expectations are strongly focussing on the urban areas in Europe where technological
innovations in conjunction with spatial planning and improved public transport options help to develop
more car-free mobility profile for a broader range of road user groups. This in turn is expected to
change the modal split in the urban centres sustainable towards walking, cycling and also PTWs.

D2.3
Implementation Scenarios
viii
Concerning comfort the available studies have mainly focused on pedestrian comfort. For these the
assessed factors have included pollution, noise, weather protection, accessible activities, seating op-
portunities, illumination, toilet, pavement surface.
The development of specifically adapted infrastructure is expected to have the most influence on the
general usability and comfort for vulnerable road users in coming years. In general comfort of vulnera-
ble road users is expected to be strongly dependent on the space available especially for pedestrians
and bicyclists. In this regard there is still a high level of space shared between pedestrians and bicy-
clists and motorised traffic including public transport vehicles which in turn leads to higher demands
for safely and comfortably travelling in high density areas. Up until the year 2030 there is a trend to-
wards a more pedestrian friendly environment by providing more space dedicated to this road user
group.
Market analysis of ITS
The likelihood of applying the selected systems in 2020 and 2030 is analysed and the most appropri-
ate business model structures to increase the commercialization of these ITS are identified. Deploy-
ment issues of ITS for VRUs are discussed based on the analysis conducted.
Estimation of penetration rates: stakeholder consultation and market assessment
This subchapter aims at conducting a market analysis on the applications selected in the project. For
this purpose on the one hand information concerning the likelihood of applying these systems in 2020
and 2030 has been collected through questionnaires sent to PPAA in charge of road infrastructure and
manufacturers of ITS.
In addition, participants to the VRUITS Second Interest Group Workshop on 16.6.2014 in Helsinki,
were asked about the ease of deployment as well as time to market of these systems.
A description of the intended implementation rate for 2030 has been conducted merging the data
gathered through questionnaires, and through the IGW2. The following table shows the estimated
penetration rates, for the systems, which were selected at the Second Interest Group Workshop.
Table 1 Scenarios, obtained from combining questionnaire results with feedback from IGW2.
System Infrastructure penetration rate Users´ penetration rate
B2V 10% of bicycles; 40% of vehicles equipped with C-ITS
equipment supporting B2V functionality
BSD 44% of vehicles equipped
CAL 18% of major pedestrian crossings in
urban areas
GWC 1% of major intersections in urban
areas
10% of bicycles equipped
INS 5% of signalised intersections in urban
areas
40% of vehicles equipped with C-ITS equipment supporting
INS functionality
IPTS 32% of signalised intersections in ur-
ban areas
IVB 25% of bicycles equipped
PDS+EBR 36% of vehicles equipped
PTW2V 28% of PTWs equipped; 40% of vehicles equipped with C-
ITS equipment supporting PTW2V functionality
VBS 1% of major pedestrian crossings in
major cities
5% of pedestrians, 15% of cyclists;40% of PTWs equipped ;
40% of vehicles equipped (with C-ITS supporting equipment)

D2.3
Implementation Scenarios
ix
The obtained figures will be used for the quantitative impact assessment in WP3. In addition, the fig-
ures will be validated through a web questionnaire in November 2014.
Potential business models
This section aims to identify and suggest the most relevant and suitable business model structures to
increase the commercialization of the most promising and close-to-market ITS systems that are priori-
tized and assessed by VRUITS. Business models for four types ITS are discussed: Cooperative ITS,
In-vehicle ITS, Cyclists ITS and Public ITS.
Concerning cooperative ITS (INS, VBS, B2V, PTW2V), there is still a lack of knowledge on how coop-
erative ITS can be commercialized. For the development of a cooperative ITS, investments from mul-
tiple actors are needed. In some cases this involves vehicle manufacturers and infrastructure provid-
ers, in other cases it involves vehicle manufacturers and VRU device manufacturers. Smartphones are
also a good alternative to in-vehicle technology, given that they have a high market penetration which
enables a fast deployment of the technology. This is especially relevant for cooperative ITS, where a
critical mass of vehicles equipped with technology is necessary to create a viable business model.
However, current smartphones have difficulties to fulfil the low latency and accuracy requirements of
safety applications.
Although VRUs are the main beneficiaries of the two in-vehicle ITS technology considered in this de-
liverable (BSD and PDS+EBR) it is up to vehicle users to decide whether to purchase vehicles
equipped with these technologies. The development of these in-vehicle ITS will most probably be
funded by the customers of vehicle manufactures that pay for the technologies. As both ITS will have
positive effects on traffic safety and comfort for multiple traffic participants, it is likely that public organ-
izations and insurance companies are willing to compensate the vehicle users. In-vehicle ITS technol-
ogy will increase the EuroNCAP score and may thereby increase the attractiveness and commercial
value of the vehicle. EuroNCAP addresses currently AEB (Automatic Emergency Braking) and BSD
for collision between vehicles, and plans to include pedestrian testing for AEB in 2016. Using the safe-
ty concept as a selling point is also applicable to business models for cooperative ITS systems which
require specific in-vehicle technology.
The deployment of the infrastructure related ITS, IPTS and CAL will most probably rely on public fund-
ing. The European Union and the national and local governments are the primary source of funding for
ITS infrastructure technology. Thus, policy makers like to have a clear description of the benefits of
new technology and are interested in the outcomes it will generate and what it will cost compared to
other ways of achieving the same.
2 of the 10 selected ITS, IVB and GWC are focused on cyclists and involve the deployment of an ap-
plication on a device attached to the bicycle, either a smartphone or a dedicated device. The subscrip-
tion model and the advertisement model might be used in these cases. The time savings achieved by
both systems may be a strong selling point. And the bicycle theft problem opens a market for solutions
such as IVB.
Road map for ITS deployment
This section remarks specific challenges for ITS for VRUs, including: Willingness to pay, Stakeholders,
User acceptance, impacts and benefits, Differences between countries, Differences between user
groups. All in all a private lead is only possible for low cost solutions based on existing devices like
smartphones, or possible for fixed installations in PTWs. In addition, the technical feasibility of solu-
tions is challenging, especially for pedestrians and cyclists. Any significant investments for the benefit
of VRUs will require government involvement, either financial or regulatory, or both.


D2.3
Implementation Scenarios
1
1. INTRODUCTION
1.1 VRUITS project
In recent years both technological developments and research activities in the fields of Intelligent
Transport Systems (ITS) have primarily focussed on motorised transport to improve safety and eco-
logical (environmental) impacts by advancing equipment of vehicles and infrastructure. The uptake of
ITS applications has assisted in the decrease of road traffic fatalities, particularly amongst passenger
car occupants. However, Vulnerable Road Users (VRUs), such as pedestrians, cyclists, motorcyclists
and moped riders have not enjoyed the same decrease in fatalities. Together, they account for 68% of
the fatalities in urban areas (CARE, 2009). Motorcyclists account for 16% of fatalities, which is much
higher than their contribution to traffic (CARE 2009). While some projects have considered VRUs from
a safety viewpoint, they often aimed at avoiding or mitigating accidents with VRUs by equipping the
vehicle and infrastructure. In the vehicle – infrastructure – human approach of ITS research, VRUs
and their needs are not an active part of the “human” element in the ITS approach.
What is needed? The VRU must become an active, integrated element in the ITS, addressing safety,
mobility and travel comfort needs of VRUs. The EU-funded VRUITS project, which started on
1.4.2013, aims at actively integrating the “human” element in the ITS approach by focussing on needs
of all relevant stakeholder groups into the development and adaptation process of innovative ITS so-
lutions aimed at improving traffic safety as well as the general mobility of vulnerable road users. The
VRUITS project, which is sponsored by the European Commission DG MOVE, places the VRU road
user in the centre, assesses the impact of current and upcoming ITS applications on the safety and
mobility of VRUs, identifies how the usability and efficiency of ITS applications can be improved, and
recommends which actions have to be taken at a policy level to improve ITS safety and mobility. By
applying a multi-disciplinary approach the VRUITS project aims at developing tools to evaluate, field-
test and subsequently improve ITS for vulnerable road users.
The first objective of the VRUITS project is to assess societal impacts of selected ITS applications,
and to provide recommendations for policy and industry regarding ITS in order to improve the safety
and mobility of VRUs. Both ex-ante and ex-post assessment of the applications will be performed in
order to come to a consolidated set of recommendations.
The second objective is to provide evidence-based recommended practices on how VRUs can be in-
tegrated in Intelligent Transport Systems and on how HMI designs can be adapted to meet the needs
of VRUs, and test these recommendations in field trials. Starting from usability study of current ITS
applications, guidelines will be provided on the improvement of the HMI for specific user groups, such
as elderly drivers. A key concept is also the integration of VRUs in cooperative traffic systems, either
through one-way (tags) or two-way communication. The performance and usability of different con-
cepts for the communication between road users in safety critical situations will be assessed. Field
trials for a select number of applications will take place in the Netherlands (Helmond), with an empha-
sis on cyclists and PTW riders, and Spain (Valladolid), with an emphasis on pedestrians.
1.2 Scope and objective of the deliverable
This report describes general scenarios for the years 2020 and 2030 providing developments focused
on road safety trends over time at the EU-level, as well as mobility and comfort trends of VRUs. The
main purpose is to provide input to VRUITS WP3 for the quantitative impact assessment.
Besides a thorough market analysis has been performed on existing ITS as well as relevant trends
and market penetrations, for the applications selected in task 2.3. Information has been collected
about the likelihood of applying these systems in future years, through questionnaires sent to public
administrations in charge of road infrastructure and manufacturers of ITS systems.

D2.3
Implementation Scenarios
2
Building on the trends and penetration rates obtained, the different business models that are applied
for the exploitation of ITS have been identified and an analysis of the implications linked to applying
each of the different modalities has been made.
Once this analysis has been done, a road map for deployment of the ITS applications selected has
been detailed. This consists of a set of actions in time to promote the use of the ITS and to overcome
the barriers as identified in the questionnaires, starting from a presentation of identified EU and na-
tional ITS action/implementation plans.

D2.3
Implementation Scenarios
3
2. SAFETY TRENDS
During the VRUITS project, an analysis has been made regarding available data relating to accidents
involving vulnerable road users. As has been outlined previously, there are generally two types of ac-
cident data available with Europe:
In-depth accident data provide very detailed information about specific accidents and can generally be
used to provide information on accident and injury, engineering feedback and standards development
given the very details nature and level of the data that is collected through in-depth crash investiga-
tions. However, this type of data is usually dis-advantaged by the fact that the numbers of cases in in-
depth databases are usually small and statistical representative-ness is sometimes open to question.
Macroscopic data provide cursory information about accidents and are usually based on police inves-
tigations of crashes on the roads in which an injury has occurred. The main advantage of this type of
data is that it is usually representative of the country in which it was collected but the main disad-
vantage is that the level of detail is significantly lower than that that provided in in-depth databases.
Therefore there are advantages and disadvantages of both types of database.
The safety-trends described in this section are based on historical data in terms of what has happened
over the past ten years or so. The data has been modelled using the assumption that current trends in
road casualties will continue. In other words, the rate of decrease will remain more-or-less constant in
the years ahead. The data needs are described as follows;
2.1 Data needs
For the VRUITS data analysis, in order to examine likely future trends in Safety, it has been necessary
to use macroscopic data as the numbers of accident ‘cases’ in this type of data is larger and therefore
the results are generally considered to be more robust. Therefore the EU-CARE data has been used
as it is the database which is thought to be most representative of the EU accident situation.
CARE is a Community database on road accidents resulting in death or injury (no statistics on
damage-only accidents are kept). The major difference between CARE and most other existing
international databases is the high level of disaggregation, i.e. CARE is based on detailed data of
individual accidents as collected by the Member States. This structure allows for maximum flexibility
and potential with regard to analysing the information contained in the system and opens up a whole
set of new possibilities in the field of accident analysis.
EU Member State datasets are integrated into the CARE database in their original national structure
and definitions, with confidential data blanked out. However, transformation rules are implemented in
the CARE database in order to increase data compatibility and thus enhance the functioning of the
system.
2.2 Compilation of accident data
The CARE database has been analysed to predict the likely changes in road casualties during future
years. However, assumptions have been made when making these predictions. The main assumption
is that there will be no effect of the introduction of ITS systems. In other words, the trends in road
casualties will continue as the effects of new ITS systems cannot be calculated given that (a) their
effects remain unproven; and (b) the details with regard to uptake, market penetration and user
acceptance are still far from clear.
D2.3
Implementation Scenarios
4
2.3 Road safety trends and forecasts 2002 to 2030
2.3.1 Results
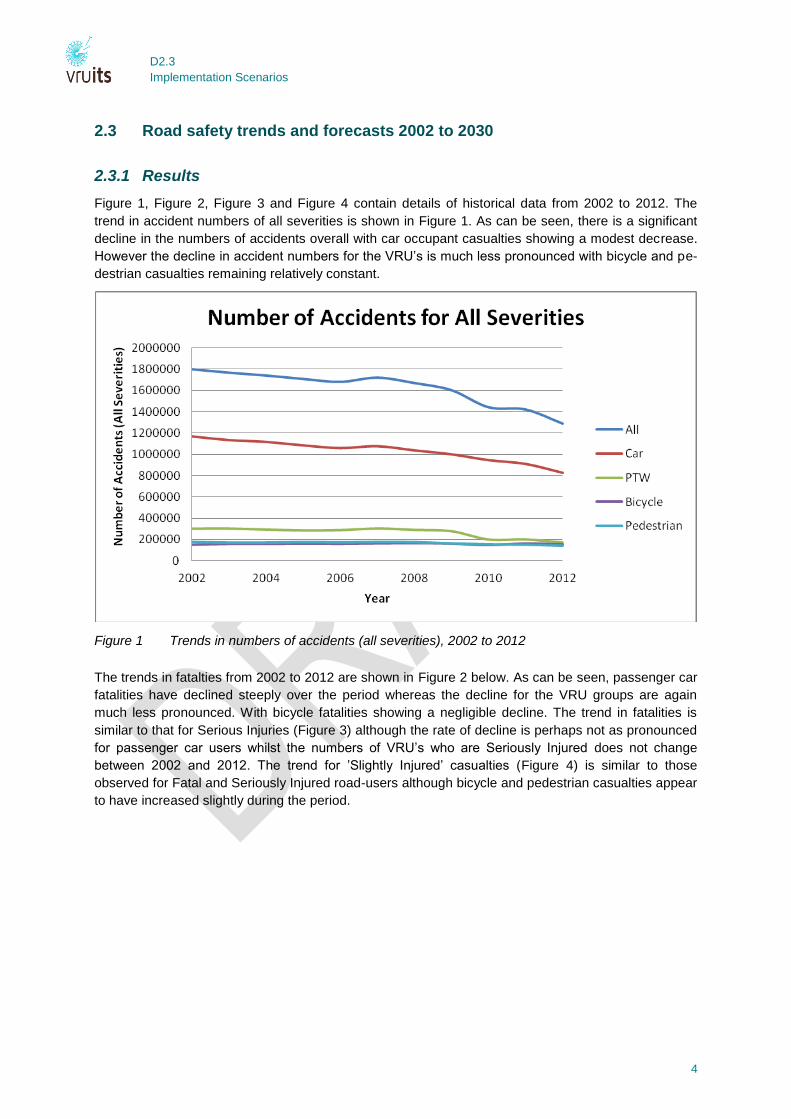
Figure 1, Figure 2, Figure 3 and Figure 4 contain details of historical data from 2002 to 2012. The
trend in accident numbers of all severities is shown in Figure 1. As can be seen, there is a significant
decline in the numbers of accidents overall with car occupant casualties showing a modest decrease.
However the decline in accident numbers for the VRU’s is much less pronounced with bicycle and pe-
destrian casualties remaining relatively constant.
Figure 1 Trends in numbers of accidents (all severities), 2002 to 2012
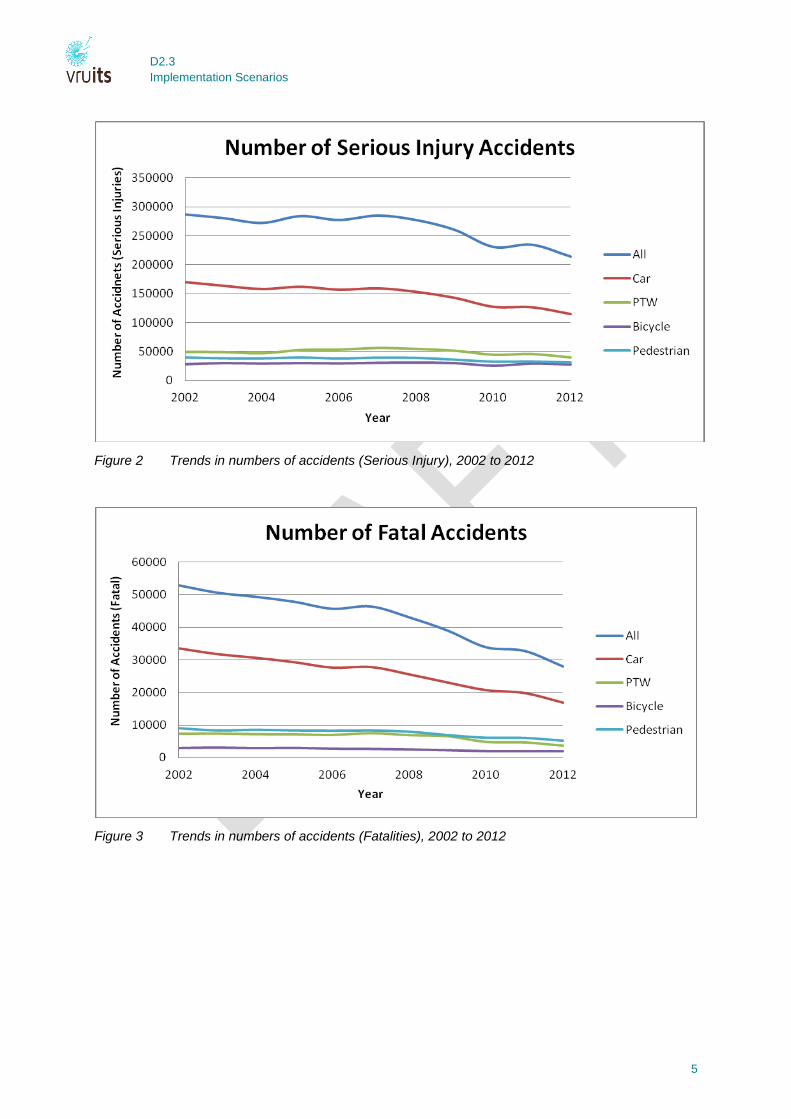
The trends in fatalties from 2002 to 2012 are shown in Figure 2 below. As can be seen, passenger car
fatalities have declined steeply over the period whereas the decline for the VRU groups are again
much less pronounced. With bicycle fatalities showing a negligible decline. The trend in fatalities is
similar to that for Serious Injuries (Figure 3) although the rate of decline is perhaps not as pronounced
for passenger car users whilst the numbers of VRU’s who are Seriously Injured does not change
between 2002 and 2012. The trend for ’Slightly Injured’ casualties (Figure 4) is similar to those
observed for Fatal and Seriously Injured road-users although bicycle and pedestrian casualties appear
to have increased slightly during the period.
D2.3
Implementation Scenarios
5
Figure 2 Trends in numbers of accidents (Serious Injury), 2002 to 2012
Figure 3 Trends in numbers of accidents (Fatalities), 2002 to 2012
D2.3
Implementation Scenarios
6
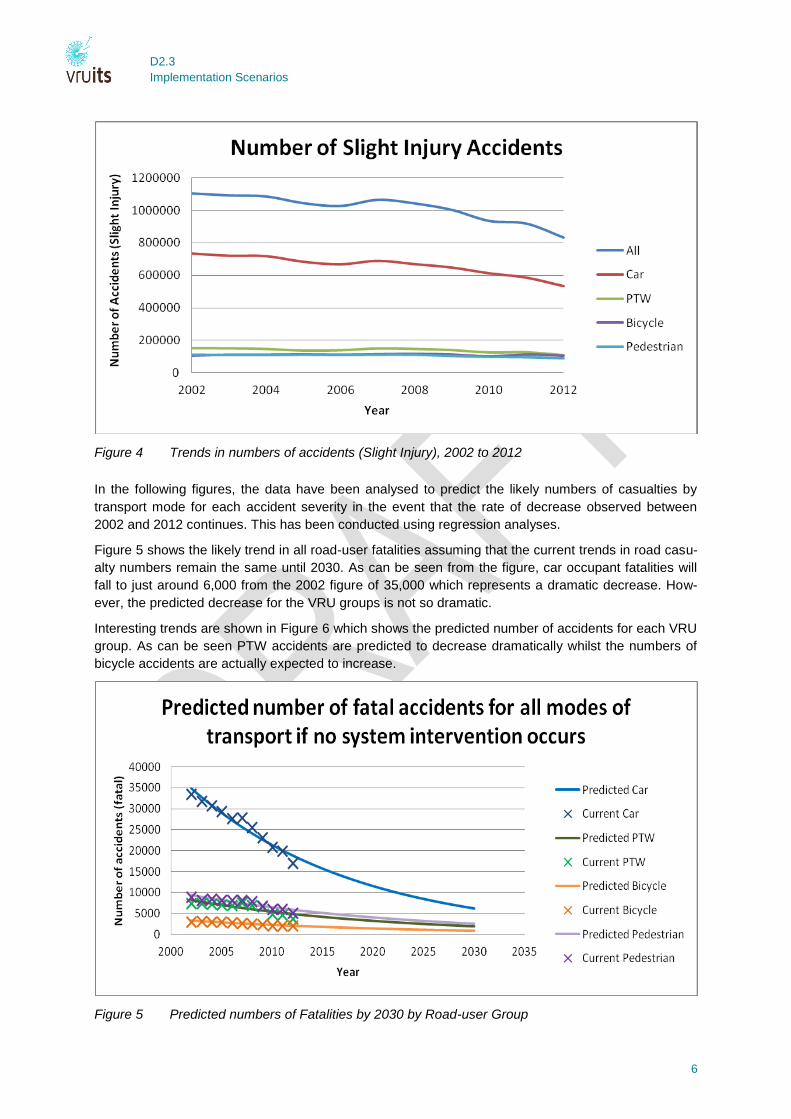
Figure 4 Trends in numbers of accidents (Slight Injury), 2002 to 2012
In the following figures, the data have been analysed to predict the likely numbers of casualties by
transport mode for each accident severity in the event that the rate of decrease observed between
2002 and 2012 continues. This has been conducted using regression analyses.
Figure 5 shows the likely trend in all road-user fatalities assuming that the current trends in road casu-
alty numbers remain the same until 2030. As can be seen from the figure, car occupant fatalities will
fall to just around 6,000 from the 2002 figure of 35,000 which represents a dramatic decrease. How-
ever, the predicted decrease for the VRU groups is not so dramatic.
Interesting trends are shown in Figure 6 which shows the predicted number of accidents for each VRU
group. As can be seen PTW accidents are predicted to decrease dramatically whilst the numbers of
bicycle accidents are actually expected to increase.
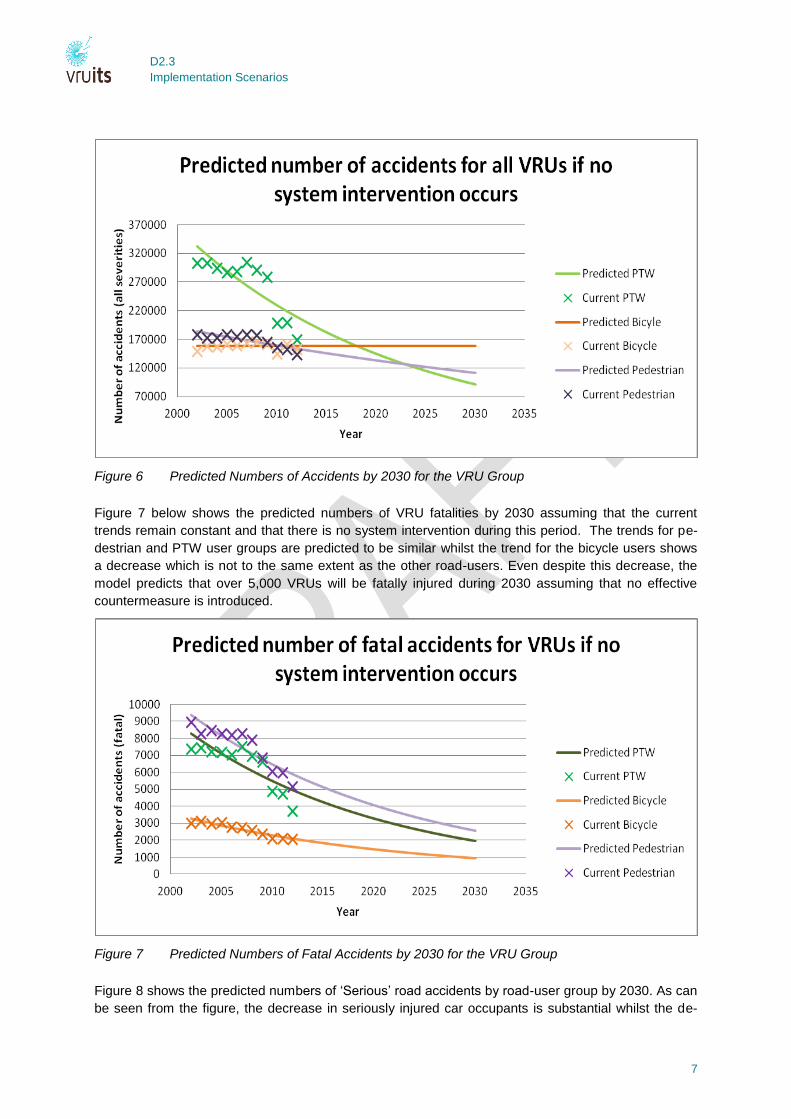
Figure 5 Predicted numbers of Fatalities by 2030 by Road-user Group
D2.3
Implementation Scenarios
7
Figure 6 Predicted Numbers of Accidents by 2030 for the VRU Group
Figure 7 below shows the predicted numbers of VRU fatalities by 2030 assuming that the current
trends remain constant and that there is no system intervention during this period. The trends for pe-
destrian and PTW user groups are predicted to be similar whilst the trend for the bicycle users shows
a decrease which is not to the same extent as the other road-users. Even despite this decrease, the
model predicts that over 5,000 VRUs will be fatally injured during 2030 assuming that no effective
countermeasure is introduced.
Figure 7 Predicted Numbers of Fatal Accidents by 2030 for the VRU Group
Figure 8 shows the predicted numbers of ‘Serious’ road accidents by road-user group by 2030. As can
be seen from the figure, the decrease in seriously injured car occupants is substantial whilst the de-

D2.3
Implementation Scenarios
8
crease in VRU accidents is much less pronounced. The data for the VRU group have been analysed
separately (Figure 9) and it can be seen that numbers of ‘Serious’ bicycle accident casualties are ex-
pected to surpass pedestrian accidents by 2030.
Figure 8 Predicted Numbers of Serious Road Accidents by 2030
Figure 9 Predicted Numbers of ‘Serious’ Road Accidents by 2030 for the VRU Group
Finally the trends for ‘Slight’ accidents are shown in Figure 10 and Figure 11. Again, the trends in pre-
dicted car occupant ‘Slight’ casualties suggest a raid downward decrease in numbers with VRU casu-
alties expected to decrease much less dramatically. When VRU casualties are analysed separately
(Figure 11), it can be seen that bicyclists are expected to be the most frequently injured VRU at the
‘Slight’ injury level by the year 2017.

D2.3
Implementation Scenarios
9
Figure 10 Predicted Numbers of ‘Slight’ Road Accidents by 2030
Figure 11 Predicted Numbers of ‘Slight’ Road Accidents by 2030 for the VRU Group
D2.3
Implementation Scenarios
10
3. MOBILITY AND COMFORT TRENDS
Based on the available findings produced in course of the VRUITS project and a literature search,
available data on the mobility and the comfort of vulnerable road users was collected. In addition po-
tential trends in these regards were identified based on current studies with focus on future issues and
needed measures and developments in different areas such as infrastructure, technology, society, etc.
The goal of producing an overview on available empiric data on the characteristics of behaviour and
the comfort aspects of vulnerable road user mobility was to establish present and future scenarios
where ITS solutions can support VRUs. Both aspects, general mobility behaviour and comfort aspects,
need to be taken into account as relevant factors besides safety when discussing actual technology
potential of ITS.
The following chapter outlines definitions of mobility and comfort, as identified in VRUITS deliverable
D2.2, and provides insight into the availability of empiric date to measure these concepts. In addition a
forecast and potential trends are discussed based on found data and studies directly focussing on the
issue of future VRU mobility.
Overall actual definitions and used concepts and the corresponding data collected in view of the mo-
bility and comfort studies found in course of the literature search process vary quite strongly. While
some of the national travel surveys are providing recent data there are European countries which have
no up-to-date assessments available only providing limited insight into the actual mobility behaviour of
VRUs. While relevance to the current mobility behaviour of VRUs is one major issue, comparability is
another problem usually encountered when discussing mobility data. These limitations are even more
pronounced when discussing data on the comfort of vulnerable road users. Especially the definition of
the concept of VRU comfort has already been identified as one of the main limiting factors when look-
ing for available empirical data.
Trends in the mobility of the different vulnerable road user groups are strongly related to regional dif-
ferences, with weather and seasonal changes being especially relevant for VRUs, car dependency
and available modal choices. In addition actual and perceived safety are expected to play an important
role, especially in view of the effects of demographic change on travel patterns. Looking at comfort
developments the interplay between safety, mobility and comfort and the influencing factors outlined in
previous VRUITS reports (D2.1, D2.2) become apparent. Future developments will strongly be de-
pendent on individual perceptions of safety, uncertainty connected with travel and stress and
measures introduced on macro and micro levels to address them.
As already stated in the second deliverable of the VRUITS project, recent data focussing on the actual
mobility of vulnerable road users that not only characterizes VRU mobility on a national level but al-
lows for country comparisons between European countries is scarce. Looking at the availability of em-
piric data on the comfort of different vulnerable road user groups the situation is even more problemat-
ic. In this regard only a handful of projects are directly focussing on the comfort issue by assessing all
relevant dimensions of the issue, although mostly only addressing one or two of the vulnerable road
user groups.
3.1 Data needs
To be able to identify actual data needs in regards to mobility and comfort actual mobility and comfort
concepts need to be discussed, which not only take all relevant dimensions into account but also out-
line the variables needed for a comprehensive assessment.
In course of the development of the ITS assessment methodology the following definitions proved to
be most applicable in view of general VRU mobility and comfort and are therefore most relevant for
the scenario development:

D2.3
Implementation Scenarios
11
Vulnerable road user mobility as used in course of task within the VRUITS project is defined as:
“(…) any form of outside (meaning out of house) movement based on the identified soft
transport modes: walking, cycling or motorcycling. These forms of movement are defined by
trips from a starting point to a destination in order to conduct an out of house activity.”
(VRUITS D2.2).
The definition used to explicate vulnerable road user comfort in travel is based on Slater (1985) as:
“(...) a pleasant state of physiological, psychological, and physical harmony between a human
being and the environment” (Slater, 1985: p. 4).
This definition is especially relevant in view of the assessment of ITS technologies as it is relating to
the individual experiences, attitudes and requirements to not only travel in safe but also a pleasant
way.
The data presented here is based on the above concepts as they have also been a core element of
the development process of the VRUITS assessment methodology to be applied in course of the
qualitative and the quantitative assessment processes.
3.2 Compilation of mobility and comfort data
As is apparent from the above definition of mobility used in the context of VRUITS, the data needed to
discuss the general mobility of vulnerable road users is strongly relying on variables of exposure. A
comprehensive list of mobility related variables which are defining the concept of mobility used in this
context are the following (Sammer et al 2011):
Region (urban, rural, etc.)
Number of trips per person
Mode of transport
o Main mode of transport (for a specific trip [purpose])
o Modal-Split (of all used modes on a trip),
Source trip purpose (goal of the previous trip).
Trip duration
Route choice
Travel distance
Travel length
Travel speed
Time spent on travelling, duration
Number of journeys
Departure time/arrival time
The actual compilation of data considered in course of the assessment process are as follows and
cover a broad range of travel behaviour variables, starting out with the actual modal choice, route
choice behaviour and exposure data.
Mode of transport
Route choice

D2.3
Implementation Scenarios
12
Travel distance
Travel length
Travel speed
Time spent on travelling, duration
Number of journeys
Departure time/arrival time
Based on these indicators actual mobility behaviour of the different vulnerable road user groups con-
sidered (bicycles, pedestrians. motorcyclists) can be characterized and potential impacts of ITS solu-
tions need to be measured based on these variables.
To assess the current mobility behaviour of vulnerable road users, mobility data is strongly focussing
on exposure. Comfort data is mainly assessing psychological factors of mobility which are strongly
related to the individual perceptions of vulnerable road users. These aspects are usually identified and
discussed in conjunction with external conditions including available infrastructure and environmental
conditions. These aspects are again very strongly dependent on regional and seasonal differences.
Scarcely available literature on empiric comfort data of different vulnerable road user groups is focus-
sing on a variety of different indicators which are not only relating internal and external conditions, but
are also discussing “physiological, physical, social and psychological reactions” (Ovstedal & Ryeng,
2002: p. 2). These assessments are very heavily relying on psychological indicators that relate to indi-
vidual perceptions of the environmental, infrastructural and situational conditions which directly affect
road user comfort. While the different dimensions that need to be taken into account when discussing
comfort of vulnerable road users comprehensively are taking assessments of the built environment
and factors such as attractiveness into account (Ovstedal & Ryeng, 2002), the indicators used in
course of the scenario development are limited to strictly mobility relevant comfort factors. In order to
be able to assess ITS impacts on vulnerable road user mobility the following four indicators were iden-
tified for assessment:
Workload related to travel
Stress related to travel
Uncertainty related to travel
Feeling of safety in relation to traffic
As these indicators cover a variety of different concepts hardly available in one scientific study repre-
sentative of at least one European country, there is hardly any empiric data that can be used for coun-
try comparisons.
The measurement of these indicators of comfort varies from available study to study, with only in
some cases specific definition of each of these concepts, which can be problematic as i.e. stress and
uncertainty can be directly related and influencing each other. As these aspects are measured based
on survey methodologies the already above mentioned study of Ovstedal and Ryeng (2002) used the
following rating system for assessing individual safety perceptions on a specific pedestrian trip:
Figure 12 Rating of trip specific pedestrian safety perception (Ovstedal & Ryeng 2002, p. 88)
All of the above presented indicators to assess mobility and comfort are discussed in view of the dif-
ferent vulnerable road user groups (pedestrians, bicyclists, motorcyclists) as well as motorized traffic
D2.3
Implementation Scenarios
13
(car drivers and truck drivers) as certain systems are directly or indirectly affecting car or truck drivers.
In addition to the actual transport mode scenarios affected user groups are differentiated by age group
and special mobility needs (including children, elderly, and people limited mobility).
To be able to assess ITS effects regarding mobility and comfort, actual circumstances of system use
such as weather and lighting conditions as well as situations and locations in traffic where ITS sys-
tems are used (i.e.: intersections, links, general traffic network).
3.2.1 Mobility data
Looking at studies which already assessed data available on the mobility of vulnerable road users in
Europe show how concepts of mobility (i.e.: definition of vehicle types, etc.) vary as well as the years
mobility data have been collected. Only few countries in Europe conduct repeating travel surveys with
fixed periods, which provide insight in changes in mobility patterns and allow for comparing trends of
different road user groups.
Available literature providing insight into studies collecting mobility data is limited. Nevertheless in
1998 the OECD and the Scientific Expert Group on the Safety of Vulnerable Road Users (RS7) con-
ducted a comprehensive study outlining vulnerable road user mobility not only discussing available
data in European countries but also in Australia, New Zealand and Japan.
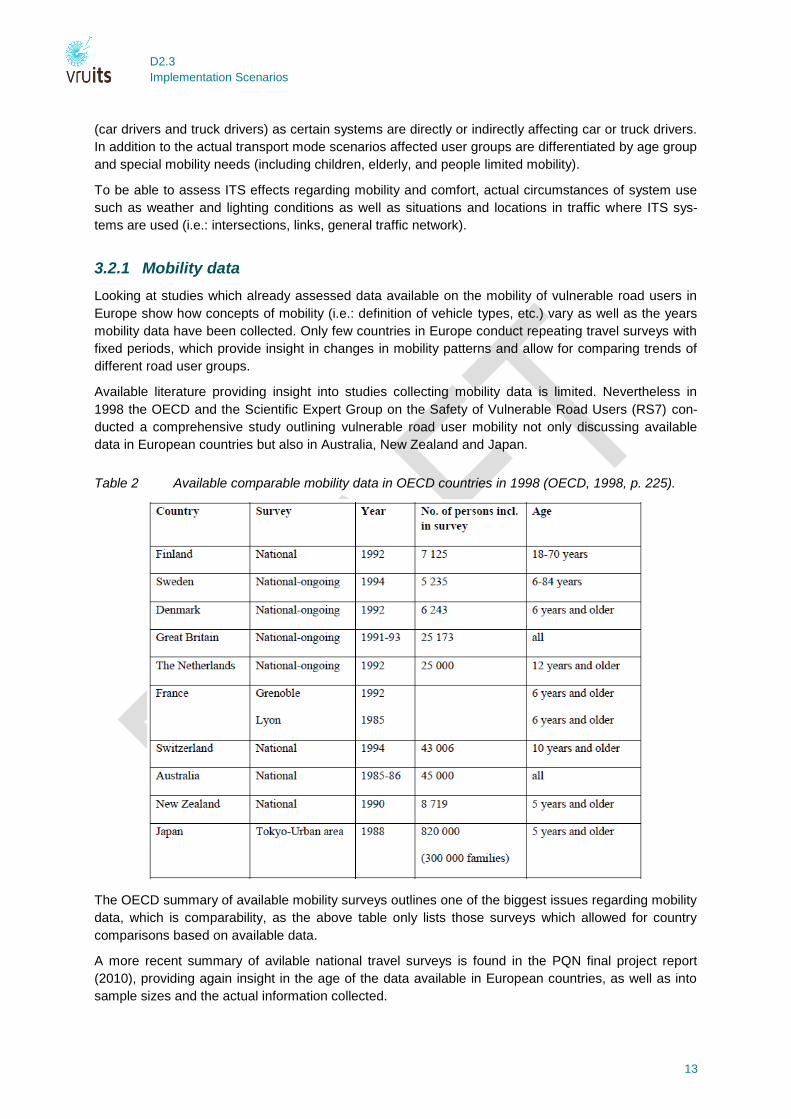
Table 2 Available comparable mobility data in OECD countries in 1998 (OECD, 1998, p. 225).
The OECD summary of available mobility surveys outlines one of the biggest issues regarding mobility
data, which is comparability, as the above table only lists those surveys which allowed for country
comparisons based on available data.
A more recent summary of avilable national travel surveys is found in the PQN final project report
(2010), providing again insight in the age of the data available in European countries, as well as into
sample sizes and the actual information collected.

D2.3
Implementation Scenarios
14
Table 3 National travel surveys available 2010 (Monterde i Bort et al. 2010, p. 45)
D2.3
Implementation Scenarios
15
As can be seen above exposure data collected varies heavily starting with the period the data is col-
lected as well as the actual trip characteristics which are considered. In addition considered age
groups and sample sizes vary, as can be expected. Nevertheless the data provided by the different
national travel surveys allows for country comparisons based on modal choice and trip lengths.
Nevertheless there have been a number of studies working with available OECD mobility data, detail-
ing modal choice, trip lengths and duration of trips. While there are studies going in-depth for a single
mode when analysing mobility data, there is a lack of research on actual country and mode compari-
sons providing comprehensive insight in country specific differences, which would be especially inter-
esting in regards to VRU mobility.
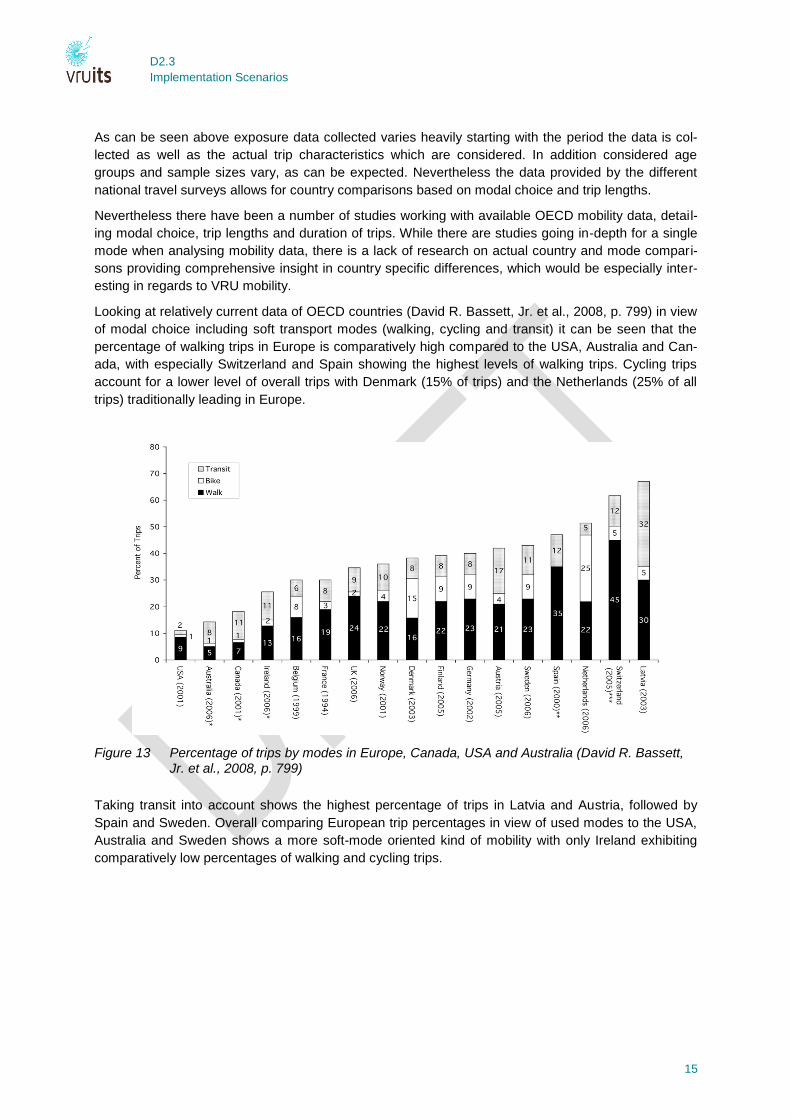
Looking at relatively current data of OECD countries (David R. Bassett, Jr. et al., 2008, p. 799) in view
of modal choice including soft transport modes (walking, cycling and transit) it can be seen that the
percentage of walking trips in Europe is comparatively high compared to the USA, Australia and Can-
ada, with especially Switzerland and Spain showing the highest levels of walking trips. Cycling trips
account for a lower level of overall trips with Denmark (15% of trips) and the Netherlands (25% of all
trips) traditionally leading in Europe.
Figure 13 Percentage of trips by modes in Europe, Canada, USA and Australia (David R. Bassett, Jr. et al., 2008, p. 799)
Taking transit into account shows the highest percentage of trips in Latvia and Austria, followed by
Spain and Sweden. Overall comparing European trip percentages in view of used modes to the USA,
Australia and Sweden shows a more soft-mode oriented kind of mobility with only Ireland exhibiting
comparatively low percentages of walking and cycling trips.

D2.3
Implementation Scenarios
16
Table 4 Modal Split by age groups in the Netherlands (SafetyNet, 2009, p. 8)
Taking also motorcycling in conjunction with age groups into account, which is strongly related to age
limitations, it can be seen that there are significant regional differences. While both mopeds and mo-
torcycling is effectively only relevant in the age groups between 12 and 24 years of age in the Nether-
lands. As the numbers of trips travelled on motorcycles is generally low, with decreasing numbers in
the recorded years, the different powered two-wheeler classes are mostly combined to one group. The
differences between different PTW classes are especially obvious between the northern European
countries and the southern parts of Europe, with comparatively more mopeds registered in southern
Europe.
Figure 14 Road passenger transport in the EU25 (EU transport in figures. 2012)
Overall powered two-wheelers account for only 2-3% of the modal split in Europe (EU transport in fig-
ures. 2012, p. 47).
Taking trip lengths and times spent in travel into account yields differences between urban and rural
areas as is to be expected, especially in context of the soft transport modes.
Walking trips account for the highest percentages in urban areas and for shorter trips, usually below 3
km, with cycling trips of up to 4km in the more densely populated areas in Europe (Berge and Peddie.
2001, pp. 5). OECD data shows that cycling trip distances generally vary between European countries
and vary between around 2 km and up to 4km in Finland (OECD 1998).

D2.3
Implementation Scenarios
17
Figure 15 Average trip length for cycling (kilometres) (OECD. 1998, p. 50).
Walking trip distances vary as well with shorter trips in the UK (around under 1km) and up to 3km in
Finland (OECD 1998).
Figure 16 Average trip length for cycling (kilometres) (OECD. 1998, p. 50).
More recent data from 2006 confirm these findings (OECD 2006), with walking trips still ranging be-
tween 2 and just under 2km, with Sweden and Finland exhibiting the longest walking trips in urban
areas and Austria and Switzerland the shortest in comparison.
While data on modal choice and trip length is readily available, there is a bit of a lack of current infor-
mation on walking and cycling speeds as well as on the actual duration of these trips.
The figure below provides insight in country comparisons (Europe, New Zealand, USA) in regards to
average duration of walking trips in the countries where data was available. As can be seen there are
actual differences between countries with the Scandinavian countries and Germany having the longest
walking times, which also correlate with actual walking distances (Guro and Peddie. 2001). Guro and
Peddie who analysed these data concluded the following in regard to walking speeds and distances:
“Comparing the distances with these durations of pedestrian trips shows that people in the
OECD-countries walk at a speed of between 56 and 77 meters per minute. If these figures are

D2.3
Implementation Scenarios
18
reliable, it is interesting to note that the people walking in Austria and Switzerland, where they
have the highest share of walking and the shortest trips, have the lowest average walking
speed of all (56 m/min).” (Guro and Peddie. 2001, p. 11)
Figure 17 Average duration of a pedestrian trip in minutes (Guro and Peddie. 2001, p. 11)
As especially walking is often used in course of multi-modal trips, kilometres per number of journey
and per person also need to take the usage of other modes into account. The PQN project (PQN,
2010) outlined these aspects as a correct assessment of actual walking trips needs to also consider
an underrepresentation on walking trips in view of other used modes (see table below).
Table 5 Walking and estimated figures for multimodal walking in the Netherlands in 2007 (PQN 2010)
Based on such estimates distances covered when using metro, bus, or train connections can be taken
into account to more comprehensively represent actual walking behaviour.
Christensen and Vázquez (2013) provide a comprehensive overview over 12 European countries and
exposure data for different travel modes, harmonized for comparison. Generally these results based
on national travel surveys show again national differences in regards to vulnerable road user mobility.

D2.3
Implementation Scenarios
19
Figure 18 Distance, time use, and number of trips per traveller per day, distributed at modes (Chris-tensen and Vázquez. 2013, p. 7)
As can be observed based on the above figures travel times and trip distances are correlated, with
longer trips equating to shorter times in travel due to the use of motorised transport modes. Especially
Spain exhibits a high level of walking trips, both in regards to walking distances as well as time spent
in travel.
In addition VRU mobility is strongly dependent, among others, on trip purpose, walking and cycling in
conjunction with other modes (i.e.: public transport, or passenger car), urbanization level, gender and
age. Looking at mobility survey data from Germany (MID 2008) and Finland (National Travel Survey
2010-2011) in view of trip purposes provides vital insight into differences regarding both mobility be-
haviour and data collection (see figures below).

D2.3
Implementation Scenarios
20
Trip purpose
Work
15%
Education
4%
Business
7%
Shopping
39%
Free time
35%
Trip purpose
Work
18%
School, studies
7%
Business
4%
Shopping, personal
business
34%
Visits
11%
Summer cottage
1%
Other leisure
25%
Figure 19/20 Trip purpose by mode – Germany/Finland (own illustration)
Actual trip purposes are vary only slightly looking at the figures above for Germany and Finland, nev-
ertheless mobility data is limited, without providing insight into actual modes used for given trip pur-
poses. While conclusions cannot be drawn in regards to different modes data from the Finnish Nation-
al Travel survey provides insight into trip purposes by actual modes. In addition limitations of available
data found in course of the mobility survey collection process are especially problematic in view of
modal split in regards to non-motorized transport. A number of surveys do not distinguish between
pedestrians, cyclists and other forms of human powered transport making comparisons focussing
solely on VRU impossible. Moreover not all data is presenting mobility behaviour in view of gender or
age groups, only providing information on a general country level.
While the data presented in Appendix C. provides an overview over European regions and even al-
lows for comparisons on country levels, the limitations encountered in the data search process are
apparent. While accident data on a macro level is readily available on a European level, such basis for
assessments does not exist for mobility behaviour data. There are research projects such as the
COST project SHANTI (http://shanti.inrets.fr/index.php), which is specifically focussing on data acces-
sibility and cross country linkage of mobility and travel data, there is not yet any database available
yet.
3.2.2 Comfort data
As outlined above actual comfort data is hard to come by on a European level, especially studies
where all dimensions of comfort are addressed are scarce. Generally data on comfort, when available,
is very specific to the assessed road user group, with a strong focus on regional aspects relating to the
usability and quality of a certain vulnerable road user environment.
Generally the following aspects need to be considered when assessing comfort, which cover the indi-
vidual experiences in traffic in view of:
Workload related to travel
Stress related to travel
Uncertainty related to travel
Feeling of safety in relation to traffic
D2.3
Implementation Scenarios
21
As can be seen collected data is usually based on surveys to collect subjective assessment identifying
issues in traffic and the built environment. In addition differentiations between different user groups
depending on their specific mobility and comfort needs need to be applied in course of a comfort as-
sessment. In this regard older and younger road users have very different abilities when it comes to
task competences in traffic leading to a difference in experienced workload and stress.
As outlined in the aforementioned PROMPT study specific aspects that are relevant for assessing pe-
destrian comfort can be as follows (Ovstedal and Ryeng. 2002, p.3):
Lack of places to rest, lack of convivial places: no place for recreation when pedestrians are
tired, ways seem longer because of unattractiveness
Bad air quality, bad smells (gas emissions or other disturbing smells); high
noise level: distraction, bad for the health
Socially insecure places: fear, avoidance of certain places
Lack of public toilets: reason for staying at home; restriction of mobility
Lack of protections against weathering: becoming wet, dirty
Badly illuminated sidewalks: fear, danger of falling; detect hindrances in time
Lack of signs, information points, guiding systems for visually impaired people: to find the right
way, to move safely
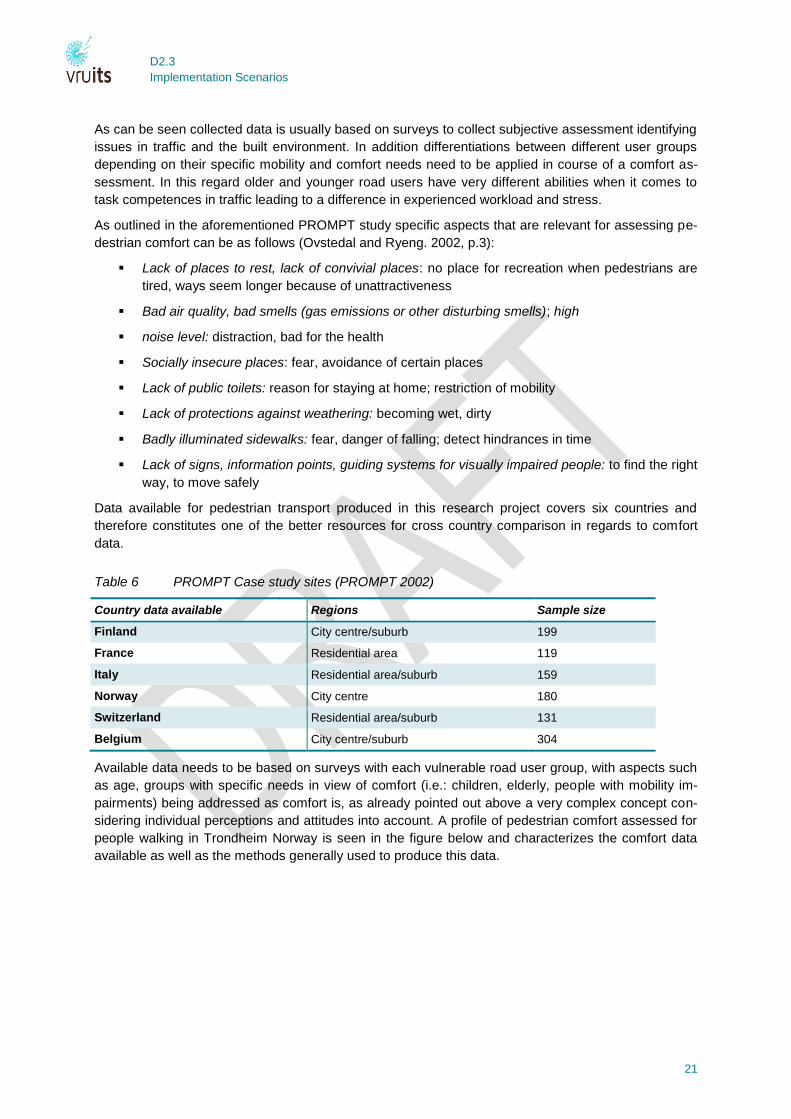
Data available for pedestrian transport produced in this research project covers six countries and
therefore constitutes one of the better resources for cross country comparison in regards to comfort
data.
Table 6 PROMPT Case study sites (PROMPT 2002)
Country data available Regions Sample size
Finland City centre/suburb 199
France Residential area 119
Italy Residential area/suburb 159
Norway City centre 180
Switzerland Residential area/suburb 131
Belgium City centre/suburb 304
Available data needs to be based on surveys with each vulnerable road user group, with aspects such
as age, groups with specific needs in view of comfort (i.e.: children, elderly, people with mobility im-
pairments) being addressed as comfort is, as already pointed out above a very complex concept con-
sidering individual perceptions and attitudes into account. A profile of pedestrian comfort assessed for
people walking in Trondheim Norway is seen in the figure below and characterizes the comfort data
available as well as the methods generally used to produce this data.

D2.3
Implementation Scenarios
22
Figure 21 PROMPT study results from Trondheim (PROMPT 2002)
As methods to collect comfort related data vary greatly, comfort assessments are mostly focussing on
very specific locations or situations in traffic where regional differences and certain characteristics of
the assessment sites play an integral role. The figure below based on Sarkar assessment of pedestri-
an quality conditions in urban walkways and activity centres (2002) highlights the data limitations as
data available is also strongly dependent on the timeframe, as for instance weather conditions, noise
levels and pollutions levels are changing and do not represent constant variables.
Figure 22 Comfort assessments on Chestnut Street between 15th and 18th Street.
The above figure represents the results from a comfort assessment of the walking facilities on Chest-
nut street on a given section, with assessed factors covering pollution, noise, weather protection and
accessible activities and seating opportunities. Thus conclusions can only be drawn on a regionally
very limited level with no data available for generalization or even for country comparisons.

D2.3
Implementation Scenarios
23
While data on workload and stress of vulnerable road users is scarce, the concept of subjective safety
assessments is nothing new with a number of studies available outlining the current situations in some
European countries. Nevertheless to be able to provide a quantitative level of comfort of different VRU
groups, only accessible data on a comparative level can be used.
While the PROMPT study, as one of the only currently available in regards to VRU comfort, is only
focussing on pedestrian comfort, without taking PTWs and bicyclists into account it is highly problem-
atic to conclude on a general level. One opportunity to overcome these issues could be to rely on
safety data of VRUs as one indicator for general comfort. To approach comfort assessment on a
quantitative level a combination of both available safety data and the collected accessible mobility da-
ta were ranked on an experimental basis to provide a view on comfort, based on quantitative data.
While this approach disregards the above mentioned comprehensive discussion of comfort based on
subjective assessments, it relies on trips per person (based on accessible mobility surveys) and se-
verely injured and killed persons (based on European CARE data).
Based on available studies on modal choice and subjective assessments, which have shown that
modal choice is strongly dependent on behavioural indicator variables such as comfort (Johansson et
al 2005), it can be expected that the number of trips per mode is dependent on the actual comfort dur-
ing travel. While there are other indicators for mobility behaviour such as trip length and duration of
trips, these are strongly dependent on regional and geographical differences. By using actual number
of trips per country where data is available, a better estimation of the relevance of this mode is possi-
ble. For the sake of estimating the comfort of VRUs quantitatively, a higher number of trips is expected
to represent a higher level of comfort for a given mode.
To also consider the safety aspect in establishing comfort levels for a sample of European countries,
accident data available for the target year 2008 were used based on CARE data. There are studies
suggesting that safety perceptions and the actual safety of a traffic system, influence mode choice and
route choice (Noland, 1994; Parkina et al. 2006). While there is sample research on the differences
between objective and subjective safety, with objective safety being represented by actual accidents
and subjective safety being individual assessments of traffic safety, this approach is based on the as-
sumption that objective traffic safety represents a general level of safety which in turn affects subjec-
tive safety.
To establish a comfort level per mode and country number of trips and numbers of injured and fatali-
ties from Germany, the United Kingdom, Estonia and the Netherlands served as basis. As needed
mobility data and accident data was only available for these four countries for 2008, this sample was
chosen as basis for comparison.
The actual comfort level as ranking is based on the statistical number or trips per mode until an acci-
dent happens in a given country. The higher the number of trips until an accident occurs the higher the
level of comfort. The lower the final comfort score the lower the score the lower the comfort level per
mode per country. The scoring-points were structured based on quartiles.
In the following table comfort for pedestrians, cyclists and PTWs is ranked by country, based on num-
ber of trips and accident data (for an overview of data used for ranking see Appendix D.
Table 7 Comfort ranking for pedestrians, cyclists, PTWs by country
Pedestrian Cyclists PTWs
UK 1 UK 1 DE 1
EE 3 DE 3 NL 3
DE 4 EE 4 UK 4
NL 5 NL 5 EE 5

D2.3
Implementation Scenarios
24
Based on this concept of comfort, which is strictly based on mobility and safety data, pedestrian and
cycling comfort ranks the highest in the Netherlands, and the lowest in the UK. Comfort for PTWs
ranks the lowest in Germany and the highest in Estonia. Based on the data used for establishing the
comfort rating, pedestrians and cyclists in the Netherlands are performing more trips until an accident
happens in comparison to the other countries, while in the Estonia and the United Kingdom PTWs are
travelling more until an incident occurs.
The following figure shows an overall comfort ranking for all three modes, for the Netherlands, Esto-
nia, Germany and the United Kingdom.
COMFORT RANKING
13
12
8
6
0
3
6
9
12
15
Netherlands Estonia Germany United Kingdom
Figure 23 General VRU comfort ranking by country
As can be seen in the cumulative VRU comfort ranking, the Netherlands rank the highest with a score
of 13 (of maximum 15) points and the United Kingdom scores the lowest with 6 points.
While the above presented model for ranking comfort for different modes in different countries, based
on scoring of performed trips and accidents, allows for country comparisons, it lacks all subjective as-
sessments of the comfort models discussed within VRUITS. In addition aspects such as environmen-
tal and infrastructural factors or individual requirements in view of satisfactory travelling are not con-
sidered due to the lack of comparable data. Ideally a quantitative assessment of comfort would take
these variables into account leading a more complex model of comfort allowing for a more effective
assessment than the proposed rather rudimentary approach.
However as comfort is mostly regarded as an aspect of either safety, or mobility, this approach incor-
porates both objective variables into a ranking that allows for a comparisons between countries (where
the needed data are available for a given time period).
3.3 Mobility and comfort forecast
Especially in view of general mobility forecasts data is available for all road user groups. Main focus of
trend analyses presented in different studies is generally focussing on modal spilt with potential for
sustainable mobility behaviour and corresponding reductions in CO2. While safety trends for different
road user groups are readily available for Europe, general mobility trends detailing expected changes
in walking distances, times spent in traffic, etc. are fairly limited. Nevertheless general trends in land
use, spatial planning and policy objectives on both national and European levels hint at potential de-
velopments in the area of vulnerable road user mobility.

D2.3
Implementation Scenarios
25
Generally a number of mega trends are to be distinguished which are expected to influence mobility
patterns in general in the coming years up until 2030.
A more multi-modal and intermodal mobility will change modal splits where soft transport
modes are a viable alternative. General mobility behaviour will increasingly entail the use of
different transport modes. Trips are expected to be more intermodal encompassing a variety
of modes until a destination is reached.
Overall reduced car use, due to higher fuel costs and advancements in spatial planning. In
addition the numbers of cars especially in urban areas are expected to be decreasing due to
the fact that there is a trend towards sharing transport options instead of owning a car oneself.
The increased relevance of e-mobility for both short trips and freight and commuter traffic will
also impact the modal choice for short trip mobility towards soft modes especially in urban
contexts.
Overall general expectations are strongly focussing on the urban areas in Europe where technological
innovations in conjunction with spatial planning and improved public transport options help to develop
more car-free mobility profile for a broader range or road user groups. This in turn is expected to
change the modal split in the urban centres sustainably towards walking, cycling and also PTWs.
3.3.1 Mobility forecast
Available mobility trend analyses are expecting an increase in general mobility of all road user groups
with passenger transport rising consistently in the next 15 years (DG TREN 2009). Besides long dis-
tance travel, including air traffic, passenger car and PTW transport together will also in future scenari-
os be of significant importance in view of overall transport in Europe.
Figure 24 Projection of the passenger transport volume in EU-25 (DG TREN 2009)
When taking changes in modal change including different vulnerable road user groups into account
available data is not as readily available. Expected modal share in France for instance is expected to
change in favour of soft modes including public transportation. Especially for people without access to
cars public transport and motorcycles are expected to be the most important substitutes. Nevertheless

D2.3
Implementation Scenarios
26
also in households with at least one car public transport will still be one of the more important modes,
followed by walking.
Figure 25 Modal shares in France in 2010 and 2020 according to three cases of motorization (Chevalier and Lantz 2013)
As mobility in general is strongly dependent on policy measures introduced to influence economic,
ecologic and social improvements over longer periods of time, these changes will strongly impact how
mobility conditions for vulnerable road users will be shaped. Following the European status report on
road safety (2009) most relevant measures to actually support modal change towards soft transport
modes are focussing on infrastructural aspects (bicycle lanes, footpaths) and generally traffic calming
measures (see figure below).
Figure 26 Policies to promote walking and cycling (European Status Report on Road safety 2009)
As these policies are also strongly influencing factors in regards to the experienced comfort by pedes-
trians and bicyclists, especially in view of subjective safety as well as workload and stress, sustainable
D2.3
Implementation Scenarios
27
improvements are correspondingly to be expected. Thus spatial and urban planning activities focus-
sing on both new developments and adaptations in the built traffic systems will be highly influential
factors for the long-term development of vulnerable road user mobility.
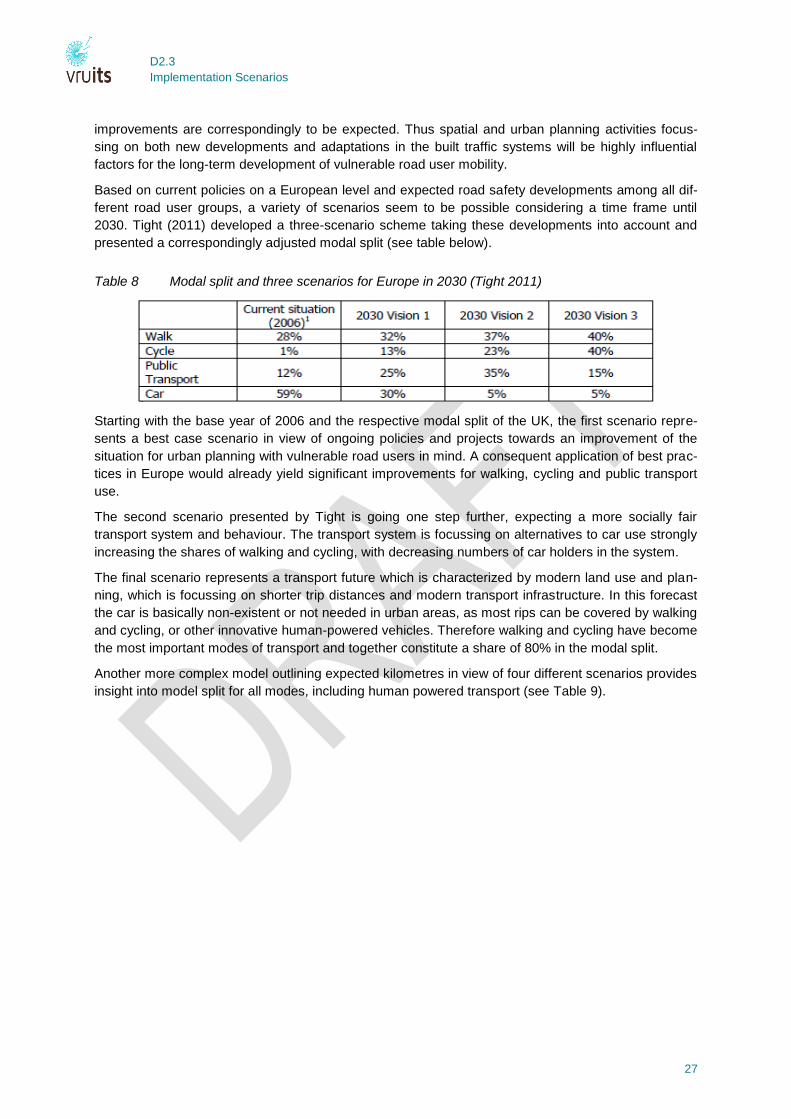
Based on current policies on a European level and expected road safety developments among all dif-
ferent road user groups, a variety of scenarios seem to be possible considering a time frame until
2030. Tight (2011) developed a three-scenario scheme taking these developments into account and
presented a correspondingly adjusted modal split (see table below).
Table 8 Modal split and three scenarios for Europe in 2030 (Tight 2011)
Starting with the base year of 2006 and the respective modal split of the UK, the first scenario repre-
sents a best case scenario in view of ongoing policies and projects towards an improvement of the
situation for urban planning with vulnerable road users in mind. A consequent application of best prac-
tices in Europe would already yield significant improvements for walking, cycling and public transport
use.
The second scenario presented by Tight is going one step further, expecting a more socially fair
transport system and behaviour. The transport system is focussing on alternatives to car use strongly
increasing the shares of walking and cycling, with decreasing numbers of car holders in the system.
The final scenario represents a transport future which is characterized by modern land use and plan-
ning, which is focussing on shorter trip distances and modern transport infrastructure. In this forecast
the car is basically non-existent or not needed in urban areas, as most rips can be covered by walking
and cycling, or other innovative human-powered vehicles. Therefore walking and cycling have become
the most important modes of transport and together constitute a share of 80% in the modal split.
Another more complex model outlining expected kilometres in view of four different scenarios provides
insight into model split for all modes, including human powered transport (see Table 9).

D2.3
Implementation Scenarios
28
Table 9 Forecast of passenger kilometers (Graham 2005: 30)
Mode of transport 1995 Unrestricted growth
Sustainable growth
Business as usual
Sustainable bal-ance
Car 3005 7486 5146 6089 3405
Percentage 69% 72% 64% 72% 59%
Bus 289 371 342 274 298
Percentage 7% 4% 4% 4% 5%
Human-powered 171 235 255 374 390
Percentage 4% 2% 3% 4% 7%
Powered two wheeler 71 145 344 102 290
Percentage 2% 1% 4% 1% 5%
Rail 480 917 1073 788 763
Percentage 11% 10% 13% 9% 13%
Air 314 1310 952 871 615
Percentage 7% 12% 11% 10% 10%
Total 4330 10464 8111 8499 5761
This model is based on economic factors influencing European freight and passenger transport up
until 2030. This model seems to provide a good basis for the assessment of technological impact as
the four proposed scenarios (see figure below) already integrate technological and infrastructural in-
novations focussing on actual road user behaviour unto account. The sustainable scenarios for in-
stance are already implying a decrease in car use due to new forms of micro transport especially in
urban areas (Graham 2005: 29). On the other hand the unrestricted model and the sustainable growth
models take a rapid increases in deployed ITS as well as urban transport into account.
Figure 27 Models for mobility forecasting (Graham 2005: 29)
Although this model does not differentiate between pedestrian and cycling (kilometres) it is one of the
most comprehensive approaches to discuss actual expected passenger kilometres up to 2030. As can
be seen in the figure below, modal split is expected to increase car traffic in the unrestricted and busi-
ness as usual models. As can be expected based on the definition of the models in view of actual sus-
tainability, motorised traffic is expected to be the highest in these scenarios. Soft transport modes on

D2.3
Implementation Scenarios
29
the other hand, including walking, cycling and PTWs are expected to be the highest when European
economies develop more sustainably.
Modal Split Forecast
0%
10%
20%
30%
40%
50%
60%
70%
80%
1995 Unrestricted growth Sustainable growth Business as usual Sustainable balance
Car
Bus
Human-powered
Powered two wheeler
Rail
Air
Figure 28 Modal Split forecast for 2030 (Graham 2005, own illustration)
In all four scenarios general mobility is expected to increase significantly in the next 15 years. Depend-
ing on the given scenario, VRUs (pedestrians, bicyclists and PTWs) are still expected to be on a low
level compared to the main mode of transport, which remains the car. Nevertheless in case of an ideal
sustainable development (scenario 4) pedestrian and cycling trips are expected to make up 7% of
travelled kilometres in Europe.
While these data provide insight into general modal split and also take vulnerable road user mobility
into account, they only provide insight into modal split and travelled kilometres while not differentiating
between pedestrians and cyclists.
3.3.2 Comfort forecast
Forecasting travel conditions relating to actual comfort of vulnerable road users in traffic proves to be
difficult. Nevertheless estimations can be based on developments in the built environment targeting
aspects which have an influence on the perceived safety, the workload regarding the mobility task and
the potential for unclear and uncertain situations.
While there are no studies available focussing on pedestrian, cycling and PTW comfort specifically
preventing the presentation of direct trends in this regard, developments, policies and specific
measures expected to influence VRU comfort are shortly outlined and presented. As most of the
available measures aiming at level of service are developed and applied on national, or more often
regional levels, rather than on EU levels, a selection of most promising solutions which all also include
expected effects based on empiric evidence are discussed.
The PROMISING (SWOV 2001) project outlines the ten most promising measures for increasing gen-
eral mobility for the different vulnerable road user groups, which also relate to the above stated sub-
categories of comfort. A selection focussing on VRUs is found below:
A separate network of direct routes for pedestrians and a separate network of direct routes for
cyclists.
A categorisation of roads to separate flow traffic from distribution traffic and access traffic.
Area-wide speed reduction apart from roads with a flow function for motorised traffic.
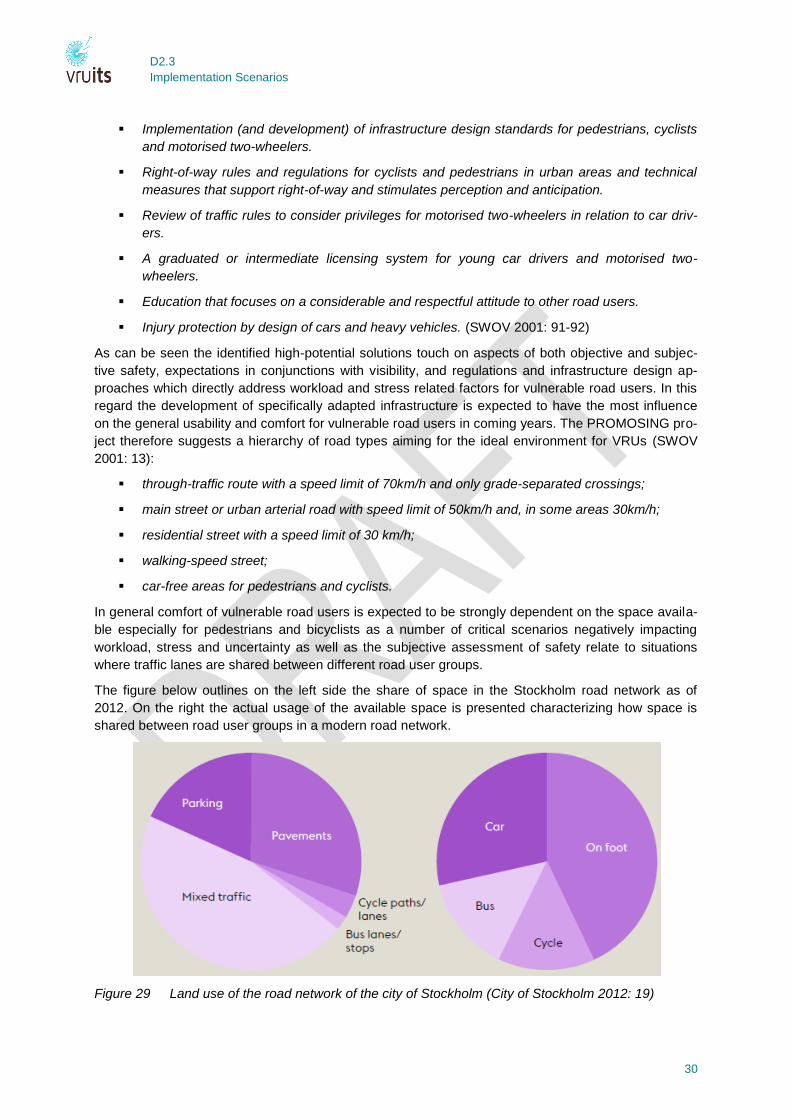
D2.3
Implementation Scenarios
30
Implementation (and development) of infrastructure design standards for pedestrians, cyclists
and motorised two-wheelers.
Right-of-way rules and regulations for cyclists and pedestrians in urban areas and technical
measures that support right-of-way and stimulates perception and anticipation.
Review of traffic rules to consider privileges for motorised two-wheelers in relation to car driv-
ers.
A graduated or intermediate licensing system for young car drivers and motorised two-
wheelers.
Education that focuses on a considerable and respectful attitude to other road users.
Injury protection by design of cars and heavy vehicles. (SWOV 2001: 91-92)
As can be seen the identified high-potential solutions touch on aspects of both objective and subjec-
tive safety, expectations in conjunctions with visibility, and regulations and infrastructure design ap-
proaches which directly address workload and stress related factors for vulnerable road users. In this
regard the development of specifically adapted infrastructure is expected to have the most influence
on the general usability and comfort for vulnerable road users in coming years. The PROMOSING pro-
ject therefore suggests a hierarchy of road types aiming for the ideal environment for VRUs (SWOV
2001: 13):
through-traffic route with a speed limit of 70km/h and only grade-separated crossings;
main street or urban arterial road with speed limit of 50km/h and, in some areas 30km/h;
residential street with a speed limit of 30 km/h;
walking-speed street;
car-free areas for pedestrians and cyclists.
In general comfort of vulnerable road users is expected to be strongly dependent on the space availa-
ble especially for pedestrians and bicyclists as a number of critical scenarios negatively impacting
workload, stress and uncertainty as well as the subjective assessment of safety relate to situations
where traffic lanes are shared between different road user groups.
The figure below outlines on the left side the share of space in the Stockholm road network as of
2012. On the right the actual usage of the available space is presented characterizing how space is
shared between road user groups in a modern road network.
Figure 29 Land use of the road network of the city of Stockholm (City of Stockholm 2012: 19)
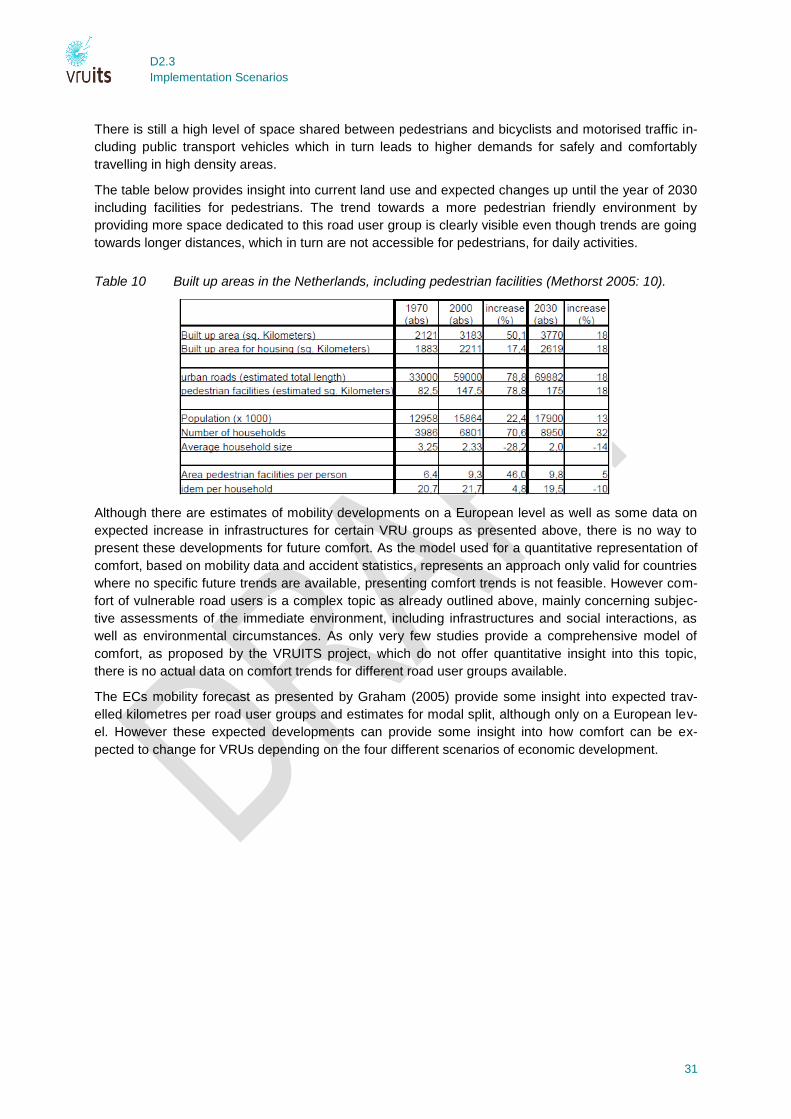
D2.3
Implementation Scenarios
31
There is still a high level of space shared between pedestrians and bicyclists and motorised traffic in-
cluding public transport vehicles which in turn leads to higher demands for safely and comfortably
travelling in high density areas.
The table below provides insight into current land use and expected changes up until the year of 2030
including facilities for pedestrians. The trend towards a more pedestrian friendly environment by
providing more space dedicated to this road user group is clearly visible even though trends are going
towards longer distances, which in turn are not accessible for pedestrians, for daily activities.
Table 10 Built up areas in the Netherlands, including pedestrian facilities (Methorst 2005: 10).
Although there are estimates of mobility developments on a European level as well as some data on
expected increase in infrastructures for certain VRU groups as presented above, there is no way to
present these developments for future comfort. As the model used for a quantitative representation of
comfort, based on mobility data and accident statistics, represents an approach only valid for countries
where no specific future trends are available, presenting comfort trends is not feasible. However com-
fort of vulnerable road users is a complex topic as already outlined above, mainly concerning subjec-
tive assessments of the immediate environment, including infrastructures and social interactions, as
well as environmental circumstances. As only very few studies provide a comprehensive model of
comfort, as proposed by the VRUITS project, which do not offer quantitative insight into this topic,
there is no actual data on comfort trends for different road user groups available.
The ECs mobility forecast as presented by Graham (2005) provide some insight into expected trav-
elled kilometres per road user groups and estimates for modal split, although only on a European lev-
el. However these expected developments can provide some insight into how comfort can be ex-
pected to change for VRUs depending on the four different scenarios of economic development.

D2.3
Implementation Scenarios
32
4. MARKET ANALYSIS
4.1 Introduction
The likelihood of applying the selected systems in 2020 and 2030 is analysed and the most appropri-
ate business model structures to increase the commercialization of these ITS are identified. Deploy-
ment issues of ITS for VRUs are discussed based on the analysis conducted.
4.2 Estimation on penetration rates: stakeholder consultation and market
assessment
This subtask aims at conducting a market analysis on the applications selected in task .2.3. For this
purpose information concerning the likelihood of applying these systems in 2020 and 2030 has been
collected through questionnaires sent to PPAA in charge of road infrastructure and manufacturers of
ITS.
4.2.1 Procedure
Design and distribution of questionnaires
In order to get information about the penetration rates, two types of questionnaires were developed,
one targeted to authorities, and the other one targeted to manufacturers of ITS (Appendix 1). Both of
them contained a brief description of the system and a small picture in order to make the question-
naire as friendly as possible. Each of us will be explained separately:
Manufacturers
Questionnaires designed for manufacturers contained questions on all relevant information for each
ITS considered. Aspects included are:
1. Estimation on how many users will have the system by 2020 and 2030, both in absolute numbers
and in percentage, and taking into account vehicles with OEM systems as well vehicles with retro-
fit/nomadic systems.
The kind of user depends on the system it is being considered: it can be pedestrians, cyclists, PTW´s,
passenger cars, goods vehicles, buses, or different combinations of these.
2. Main obstacles that must be overcome to achieve the deployment of the ITS
3. Success factors: what are the reasons why they think the ITS will be successfully introduced in their
country
4. Any additional comments regarding their institution´s deployment of the ITS.
Public Administrations
Questionnaires designed for PPAA contained questions on all relevant information for each ITS con-
sidered. Aspects included are:
1. Plans to invest in the system in the future
2. Consideration of investing in the system in the future
3. Consideration of co-financing or facilitating private investments in the system

D2.3
Implementation Scenarios
33
4. Estimation on how many systems there will be installed in their city by 2020 and 2030, both in abso-
lute numbers and in percentage.
5. How useful they think is the implementation of that service, and reasons for it
6. Main obstacles that must be overcome to achieve the deployment of the ITS
7. Success factors: what are the reasons why they think the ITS will be successfully introduced in their
country
8. Any additional comments regarding their institution´s deployment of the ITS.
Once the questionnaires had been designed, they were circulated around the partners involved in or-
der to make sure that all the information required for the subsequent CBA was compiled. After discus-
sion and several drafts, the final questionnaires were defined.
These were distributed to get the input from experts which are close to decision making on their view
on the implementation of the applications. The questionnaires were distributed through the VRUITS
contact list, Apart from distributing the questionnaires to the VRUITS project contacts, they were also
sent through the iMobility Forum VRU working group, ERTICO and the POLIS networks.
Response to the questionnaires
Unfortunately the response was smaller than expected. At the Second Interest Group Workshop, the
original questionnaires, which demanded estimates for the 23 systems selected for qualitative as-
sessment of D2.1, was reduced to the applications selected for quantitative assessment.
Only 8 questionnaires were received, 4 from the authorities and 4 from the manufacturers. Due to the
low responses the results have to be taken cautiously otherwise any conclusion could mislead to an
erroneous judgement.
Answers have been obtained from the following countries:
Authorities: Germany, Spain, Netherlands
Manufacturers: Germany, Austria, Finland, Nordic countries
Second Interest Group Workshop
The second Interest Group Workshop (IGW2) of the VRUITS project was held in Helsinki on
16.6.2014. The main purpose of the Second Interest Group workshop was to present the results of the
safety and mobility assessment and to select the applications for the second phase of the safety and
mobility assessment (Kruijf et. al., 2014). Table 11 shows the systems selected for quantitative as-
sessment at the Second Interest Group Workshop.

D2.3
Implementation Scenarios
34
Table 11 ITS Systems selected for quantitative assessment in IGW2
B2V Bicycle-to-car communication
BSD Blind Spot Detection
CAL Crossing Adaptive Lighting
GWC Green Wave for Cyclists
INS Intersection Safety
IPTS Intelligent pedestrian traffic signal
IVB Information on Vacancy on Bicycle racks
PDS+EBR Pedestrian Detection System + Emergency Braking
PTW2V PTW oncoming vehicle information system
VBS VRU beacon system.
During the assessment process, the participants were requested to rate the applications both for their
impact on safety, mobility prioritise the applications, as well as on the easy on deployment and the
time to market.
Ease of deployment was scored from a minimum of 1 to a maximum of 5:
5 = very easy
4 = easy
3 = not easy, not hard
2 = hard
1 = very hard
Time to market was also scored on a scale from 1 to 5:
5 = on the market now
4 = on the market within 2 years
3 = on the market in 2020
2 = on the market in 2025
1 = on the market 2030+
The feedback received during IGW2 for the systems selected for quantitative assessment, is shown in Table 16 Results of the Second Interest Group Workshop: average of the results for the deployment related questions.
The results are integrated with the results of the questionnaire, as is described in Section 4.2.5.
4.2.2 Results of the questionnaires
Bicycle to car communication
The manufacturers perceive this system as more useful for bicycles than for cars. Only two manufac-
turers see it as useful for cars, considering that 50% of the new cars could have this system by 2030
and it could be installed in a maximum of 30% of the actual fleet. On the other hand, all respondents
consider it valid for bicycles, giving a range of market penetration between 10% and 30% by 2030.
The cost, data privacy, and technical complexities are the main obstacles. In addition, implementation
will take time because many people will think they do not need it.
D2.3
Implementation Scenarios
35
Implementation is seen as hard (2,15) by experts at the 2º IGW, but they consider that the system will
be on the market in 2020.
Blind Spot Detection
The manufacturers consider this system very useful because they estimate that it could be installed in
up to 100% of the passenger cars and goods vehicles by 2030. They state that manufacturers will
provide it if it is mandatory. The main obstacle could be that it is too expensive for goods vehicle own-
ers. The key factor will be if it is included as a regulation. Concerning technical obstacles they mention
reliable detection of VRUs all around the vehicle. They say that backover systems are being required
in U.S. and wonder about possible regulation in Europe if systems allow to reliably detect cyclists in
blind spots.
Implementation is seen as not easy, not hard by participants at the 2º IGW, and they give a score of 4.
46 for time to market
Crossing Adaptive Lighting (CAL)
The authorities do not show much interest in this system. They estimate that this system could be in-
stalled in maximum 10% of the intersections in their countries by 2030. As positive features they high-
light that it sounds simple, save electric costs, and increase the safety of pedestrians and cyclists.
However the main obstacle is that they perceive this system as not very cost-effective.
Experts at the IGW2 saw this system quite near the market though, giving it a score of 4.40. A lower
score was given to ease of deployment (3.40), meaning that they perceive it not easy not hard.
Green Wave for cyclists (GWC)
The administrations do not show much interest in this system. They consider that the system is useful
but very difficult to be implemented. It is useful because it reduces risks of accidents through lack of
hindrance at congested traffic signals. But it will have many obstacles to be implemented: political be-
cause it assumes a predominance of cyclists over motorized, and technical because the speed advice
cannot be adapted to different users and age groups (elderly cyclists) or distinguish between pedestri-
ans and cyclists.
The respondents do not perceive this system as very useful. The estimated range is 0-5% in 2020 and
0-30% in 2030. The main obstacles found are: difficult technical integration and coordination with other
traffic systems, possible conflict of interest with other road users, benefit versus cost will not seem jus-
tified except in some urban areas.
They point out that if this system is developed as mobile phone module or app then it could be more
effective.
The score of 3.69, given by participants at the IGW2, means that GWC will be on the market in 2
years, and its implementation is seen as not easy, not hard.
Information on vacancy on bicycle racks (IVB)
All of the authorities consider this system useful. They think that up to 50% of the cyclists in the city
and in the country will have the system by 2030. They perceive that this system offers an opportunity
of enhancing cycle mobility, but it will be limited to certain purposes of cycle use (shopping, tourists…).
The vision of the penetration rate for this system by the manufacturers is very different from the au-
thorities. They consider that only between 10% and 20% of the bicycles will have it by 2030. One of
the obstacles that they mention is that the bicycle racks are expensive in maintenance. Also, bicycle

D2.3
Implementation Scenarios
36
parking can be easily done without any high tech facility so the system should be combined with se-
cured parking of bicycles.
A score of 3.85 was given to this system at the IGW2. Thus they think that it will be on the market in
more or less 2 years. The implementation is seen as not easy, not hard.
Intelligent Pedestrian Traffic Signal (IPTS)
The responses of the administrations concerning this system vary significantly. From one administra-
tion that considers that the Intelligent Pedestrian Traffic Signal would be installed in 70% of the na-
tional intersections by 2020 and 80% of them by 2030 to other which does not see it useful. Authorities
reflect that somehow this system is useful, especially the optimization of times and the prioritization of
pedestrians over other road users as useful. They mention as success factors the easy implementa-
tion, potential cost reduction, and the fact that the pedestrian's interaction is not required.
Participants at IGW2 gave a score of 3.90 out of 5 on time to market for this system (Table 16), what
means that they think the system will be on the market more or less within 2 years. In addition, they
gave a poor score (2.70) on ease of deployment; thus they consider the deployment of IPTS hard.
Intersection Safety (INS)
Only two administrations consider that this system will be implemented in their country, in 2% and
10% of the intersections respectively in 2030. They see the system as a very technically complicated
one (broad equipment and very different types of intersections to be covered). It is also financially
complicated because it seems expensive. The system could be effective if the data is very accurate.
On the other hand, it could lead to a misuse of private data.
The answers from the manufacturers on the questionnaire are very diverse. The ranges of market
penetration go from 10%-80% for passenger cars in 2030, and 10%-100% for goods vehicles and
buses in 2030. For 75% of the respondents. the main obstacles are the cost of infrastructure and the
cost of the in-vehicle equipment. Thus. one of the respondents states that only if mandated will it get
high penetration.
Time to market for this system scored 3.00 at the IGW2, so in their opinion the system will be on the
market in 2020. Concerning ease of deployment, it is scored 2.40, so participants think that the de-
ployment of INS is hard. Therefore this opinion seems to support somehow the estimation of 2-10%
penetration rate in 2030 given by authorities.
Pedestrian Detection System + Emergency Braking
This system is perceived as very useful. The figures given by the respondents estimate a market pen-
etration of up to 50% passenger cars and goods vehicles by 2030 and 70% buses and coaches by
2030. The main obstacle observed is the detection of pedestrians in any weather condition. Concern-
ing economic obstacles, they mention that goods vehicle companies will not spend money on it.
The inclusion of pedestrian AEB systems into EURO NCAP rating system is seen as a success factor
for the penetration of this system.
Some questions raised by the respondents are:
- How to ensure that these systems are deployed in a harmonised way all over Europe.
- Have an eye on privacy issues. If at all necessary, the devices should be identified via the ve-
hicle-id. Pedestrian devices should not require personal identification at all. So every house-
hold member can use the same device.

D2.3
Implementation Scenarios
37
- Do these devices record every drive? Will there be an issue with evidence when accidents
happen?
The implementation of PDS+EBR is not seen as hard by participants at the 2º IGW, and they give a
score of 4.70 for time to market
PTW oncoming vehicle information system
The answers from the different manufacturers are very different. They think this system is more useful
for PTWs (15%-80% PTWs market penetration by 2030) than for passenger cars (10%-50% Passen-
ger cars market penetration by 2030).
The main perceived obstacles are: power consumption of the device, performance in poor weather
conditions, acceptance of the device by riders, the fact that drivers do not see PTW's as VRU, or the
cost of the device.
Implementation is seen as hard by the experts attending the 2º IGW, and they see the system in the
market within 5 years.
VRU Beacon System (VBS)
Only one administration shows interest in VRU Beacon system. This authority considers that this sys-
tem will be implemented in less than 1% of the pedestrian crossings in the upcoming years, both at
city as well as country level. There are many variables and possibilities that the information provided
to the driver may not be useful or correct in the 100% of the cases which means that the accuracy of
the data will be critical for this system to work. But they argue that if it succeeds it is the most accurate
way of communication between driver and VRU.
There is much variation on the answers from the manufacturers concerning this system. For new pas-
senger cars the market penetration range goes from 1%-5% in 2020 and 15%-80% in 2030, whereas
the retro fitment of passenger cars goes from 0%-5% in 2020 and from 10%-20% in 2030. The estima-
tion for pedestrians simple tags ranges from 0% to 30%, whereas if is used as cooperative system the
ranges go from 0% to 20% in 2030. For cyclists the estimation is higher: from 0% to 75% in the case
of simple tags, and from 0% to 50% if the system is cooperative. For PTWs the market penetration
estimated for this system varies from 2%-30% PTWs in 2020 and from 20%-90% PTWs 2030.
The participants at the IGW2, gave this system a score of 2.93 when evaluating time to market, so
according to their opinion the system will be on the market in 2020. However they think that the de-
ployment is hard.
The responses received from the authorities are shown in Table 12 and Table 13, from the manufac-
turers in Table 14 and Table 15.
Table 12 Main obstacles per system perceived by authorities
System Main Obstacles
Intelligent Pedestrian Traffic Signal Misuse of system by pedestrians
Intersection Safety Complicated system. Possible misuse of private data
Crossing Adaptive Lighting Not very cost-effective
VRU Beacon System Accuracy of the data
Information on vacancy on bicycle racks Bike parking is not considered as a problem by the bike user.
Green Wave for cyclists Very difficult to be implemented
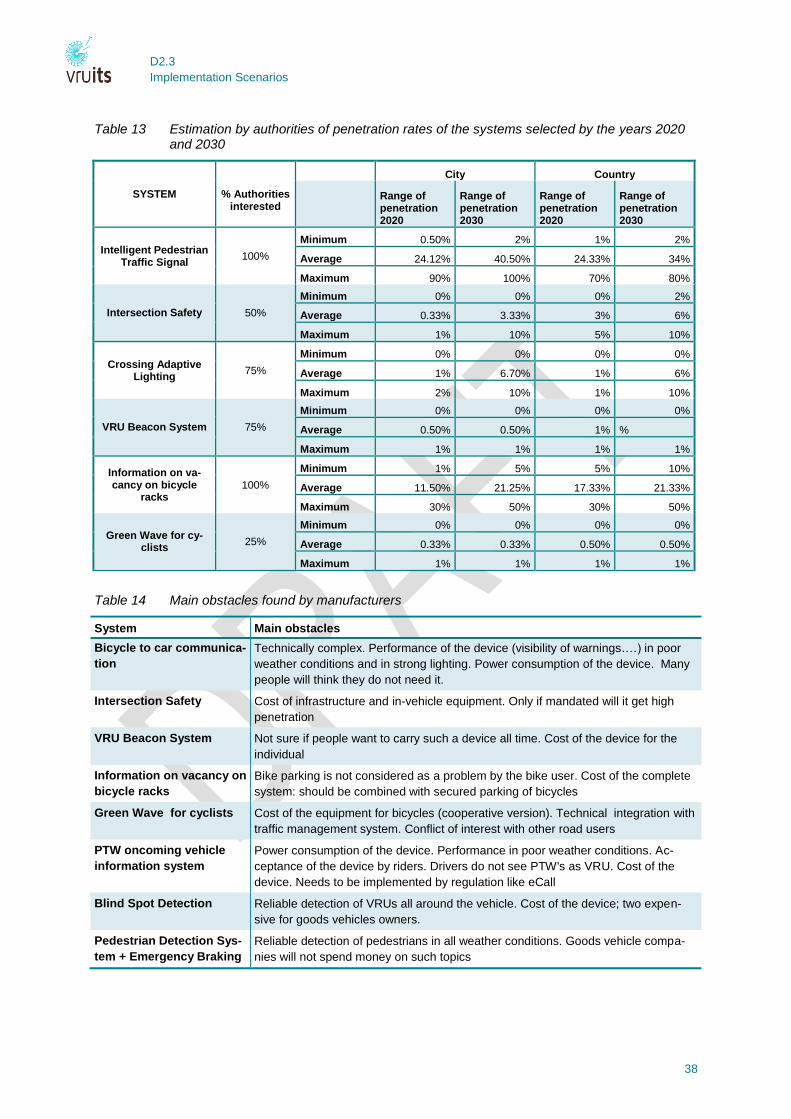
D2.3
Implementation Scenarios
38
Table 13 Estimation by authorities of penetration rates of the systems selected by the years 2020 and 2030
SYSTEM
% Authorities interested
City Country
Range of penetration 2020
Range of penetration 2030
Range of penetration 2020
Range of penetration 2030
Intelligent Pedestrian Traffic Signal
100%
Minimum 0.50% 2% 1% 2%
Average 24.12% 40.50% 24.33% 34%
Maximum 90% 100% 70% 80%
Intersection Safety 50%
Minimum 0% 0% 0% 2%
Average 0.33% 3.33% 3% 6%
Maximum 1% 10% 5% 10%
Crossing Adaptive Lighting
75%
Minimum 0% 0% 0% 0%
Average 1% 6.70% 1% 6%
Maximum 2% 10% 1% 10%
VRU Beacon System 75%
Minimum 0% 0% 0% 0%
Average 0.50% 0.50% 1% %
Maximum 1% 1% 1% 1%
Information on va-cancy on bicycle
racks 100%
Minimum 1% 5% 5% 10%
Average 11.50% 21.25% 17.33% 21.33%
Maximum 30% 50% 30% 50%
Green Wave for cy-clists
25%
Minimum 0% 0% 0% 0%
Average 0.33% 0.33% 0.50% 0.50%
Maximum 1% 1% 1% 1%
Table 14 Main obstacles found by manufacturers
System Main obstacles
Bicycle to car communica-
tion
Technically complex. Performance of the device (visibility of warnings.…) in poor
weather conditions and in strong lighting. Power consumption of the device. Many
people will think they do not need it.
Intersection Safety Cost of infrastructure and in-vehicle equipment. Only if mandated will it get high
penetration
VRU Beacon System Not sure if people want to carry such a device all time. Cost of the device for the
individual
Information on vacancy on
bicycle racks
Bike parking is not considered as a problem by the bike user. Cost of the complete
system: should be combined with secured parking of bicycles
Green Wave for cyclists Cost of the equipment for bicycles (cooperative version). Technical integration with
traffic management system. Conflict of interest with other road users
PTW oncoming vehicle
information system
Power consumption of the device. Performance in poor weather conditions. Ac-
ceptance of the device by riders. Drivers do not see PTW's as VRU. Cost of the
device. Needs to be implemented by regulation like eCall
Blind Spot Detection Reliable detection of VRUs all around the vehicle. Cost of the device; two expen-
sive for goods vehicles owners.
Pedestrian Detection Sys-
tem + Emergency Braking
Reliable detection of pedestrians in all weather conditions. Goods vehicle compa-
nies will not spend money on such topics
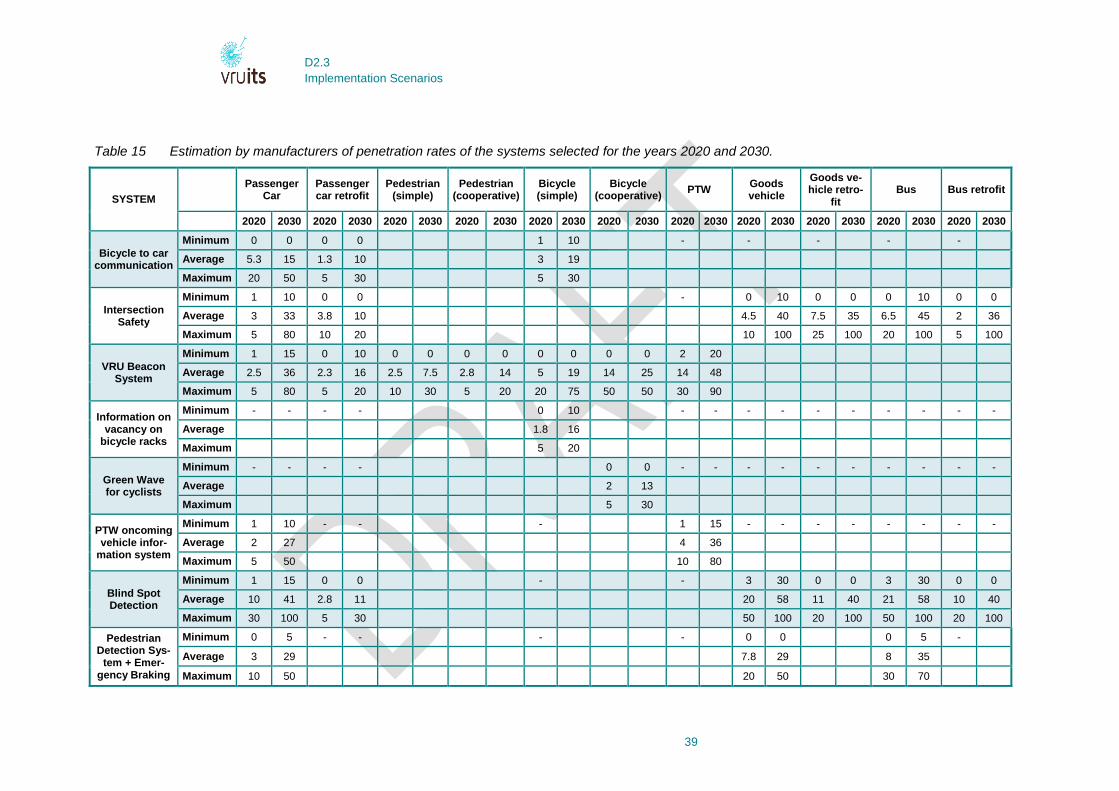
D2.3
Implementation Scenarios
39
Table 15 Estimation by manufacturers of penetration rates of the systems selected for the years 2020 and 2030.
SYSTEM
Passenger Car
Passenger car retrofit
Pedestrian (simple)
Pedestrian (cooperative)
Bicycle (simple)
Bicycle (cooperative)
PTW Goods vehicle
Goods ve-hicle retro-
fit Bus Bus retrofit
2020 2030 2020 2030 2020 2030 2020 2030 2020 2030 2020 2030 2020 2030 2020 2030 2020 2030 2020 2030 2020 2030
Bicycle to car communication
Minimum 0 0 0 0 1 10 - - - - -
Average 5.3 15 1.3 10 3 19
Maximum 20 50 5 30 5 30
Intersection Safety
Minimum 1 10 0 0 - 0 10 0 0 0 10 0 0
Average 3 33 3.8 10 4.5 40 7.5 35 6.5 45 2 36
Maximum 5 80 10 20 10 100 25 100 20 100 5 100
VRU Beacon System
Minimum 1 15 0 10 0 0 0 0 0 0 0 0 2 20
Average 2.5 36 2.3 16 2.5 7.5 2.8 14 5 19 14 25 14 48
Maximum 5 80 5 20 10 30 5 20 20 75 50 50 30 90
Information on vacancy on
bicycle racks
Minimum - - - - 0 10 - - - - - - - - - -
Average 1.8 16
Maximum 5 20
Green Wave for cyclists
Minimum - - - - 0 0 - - - - - - - - - -
Average 2 13
Maximum 5 30
PTW oncoming vehicle infor-
mation system
Minimum 1 10 - - - 1 15 - - - - - - - -
Average 2 27 4 36
Maximum 5 50 10 80
Blind Spot Detection
Minimum 1 15 0 0 - - 3 30 0 0 3 30 0 0
Average 10 41 2.8 11 20 58 11 40 21 58 10 40
Maximum 30 100 5 30 50 100 20 100 50 100 20 100
Pedestrian Detection Sys-
tem + Emer-gency Braking
Minimum 0 5 - - - - 0 0 0 5 -
Average 3 29 7.8 29 8 35
Maximum 10 50 20 50 30 70

D2.3
Implementation Scenarios
40
4.2.3 Second Interest Group Workshop
During the assessment process of the qualitative assessment of the ITS systems on the IGW2 in Hel-
sinki, the participants were requested to rate also the ease of deployment and the time to market of
the systems.
Table 16 shows the average quantitative results for these deployment aspects, for the ITS applications
which were selected for quantitative assessment.
Table 16 Results of the Second Interest Group Workshop: average of the results for the deploy-ment related questions.
System Ease of deployment Time to Market
Bicycle to Car communication 2.15 3.00
Blind Spot Detection 3.31 4.46
Crossing Adaptive Lighting 3.40 4.40
Green Wave for Cyclistso 2.69 3.69
Intersection Safety 2.40 3.00
Intelligent Pedestrian Traffic Signal 2.70 3.90
Information on vacancy of bicycle rack 3.31 3.85
Pedestrian Detection System/ Emergency Braking 3.50 4.70
PTW oncoming vehicle information system 2.64 3.50
VRU Beacon system 2.40 2.93
4.2.4 Combination of the questionnaire and IGW scenarios
The scenarios have been developed based on the input of the questionnaires and the input at the
second Interest Group Workshop. The questionnaire attempted to get all the information required for
the impact assessment, resulting in a task, which was too challenging for many candidate respondees.
In order to get feedback on the scenarios developed, a simpler questionnaire would be needed. For
this questionnaire, the number of questions will be limited to 1-2 per system. As most important num-
ber the penetration rate at 2030 is selected.
A description of the intended implementation rate for 2030 has been conducted (Table 17) merging
the data gathered through questionnaires, and through the IGW2.
For both questions answered at the IGW (year to market and ease of implementation) a parabolic
conversion has been used to convert the year of market introduction and the possible penetration rate.
It was assumed that very easy would mean 100% penetration, very hard 1% penetration, and hard
10% (the other are then about 30% for not hard-not easy and 60% for easy).
An average of the values of the questionnaire and the IGW feedback was then calculated for the
penetration rate of 2030. This value was possibly adapted taking the remarks on the questionnaires
and the feedback in the IGW into account. In addition, the consistency of the penetration rates for
function using identical equipment was checked, more specifically the penetration rates of C-ITS
equipment in vehicles (INS, VBS, PTW2V, B2V), for cyclists (VBS, GWC, B2V), for PTWs (VBS,
PTW2V). Penetration rates for bidirectional equipment (B2V, GWC, PTW2V) should be lower than for
unidirectional equipment (VBS).
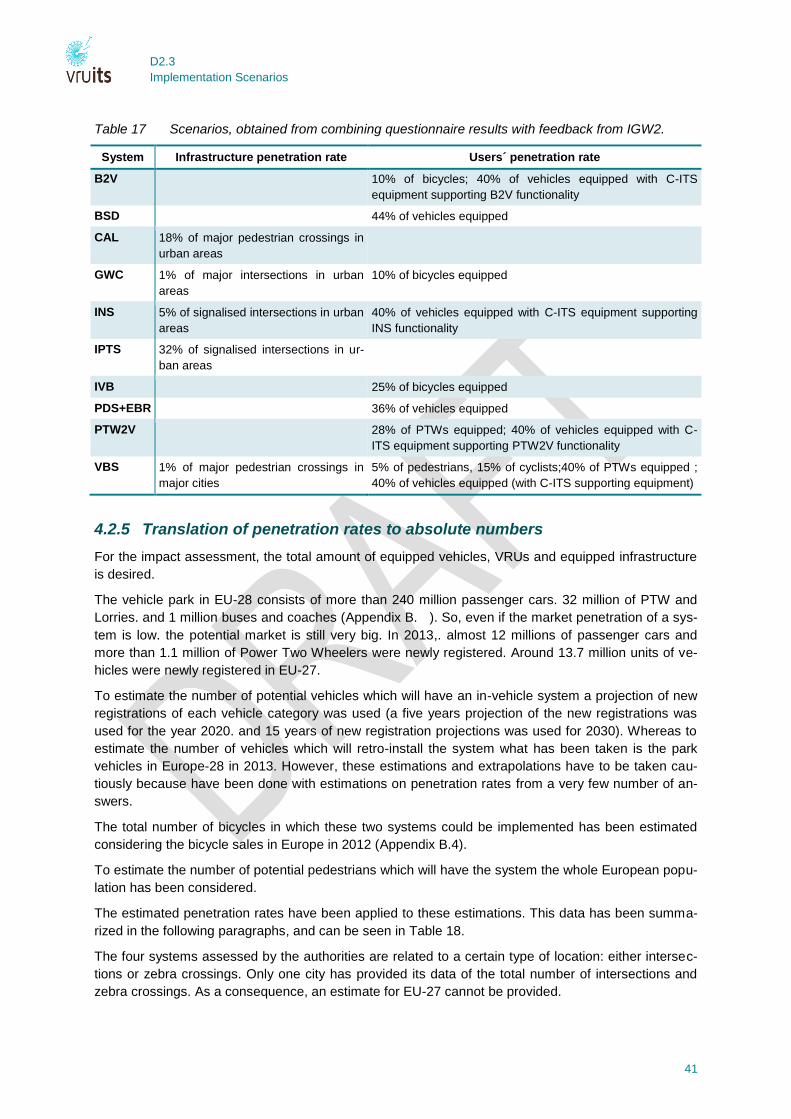
D2.3
Implementation Scenarios
41
Table 17 Scenarios, obtained from combining questionnaire results with feedback from IGW2.
System Infrastructure penetration rate Users´ penetration rate
B2V 10% of bicycles; 40% of vehicles equipped with C-ITS
equipment supporting B2V functionality
BSD 44% of vehicles equipped
CAL 18% of major pedestrian crossings in
urban areas
GWC 1% of major intersections in urban
areas
10% of bicycles equipped
INS 5% of signalised intersections in urban
areas
40% of vehicles equipped with C-ITS equipment supporting
INS functionality
IPTS 32% of signalised intersections in ur-
ban areas
IVB 25% of bicycles equipped
PDS+EBR 36% of vehicles equipped
PTW2V 28% of PTWs equipped; 40% of vehicles equipped with C-
ITS equipment supporting PTW2V functionality
VBS 1% of major pedestrian crossings in
major cities
5% of pedestrians, 15% of cyclists;40% of PTWs equipped ;
40% of vehicles equipped (with C-ITS supporting equipment)
4.2.5 Translation of penetration rates to absolute numbers
For the impact assessment, the total amount of equipped vehicles, VRUs and equipped infrastructure
is desired.
The vehicle park in EU-28 consists of more than 240 million passenger cars. 32 million of PTW and
Lorries. and 1 million buses and coaches (Appendix B. ). So, even if the market penetration of a sys-
tem is low. the potential market is still very big. In 2013,. almost 12 millions of passenger cars and
more than 1.1 million of Power Two Wheelers were newly registered. Around 13.7 million units of ve-
hicles were newly registered in EU-27.
To estimate the number of potential vehicles which will have an in-vehicle system a projection of new
registrations of each vehicle category was used (a five years projection of the new registrations was
used for the year 2020. and 15 years of new registration projections was used for 2030). Whereas to
estimate the number of vehicles which will retro-install the system what has been taken is the park
vehicles in Europe-28 in 2013. However, these estimations and extrapolations have to be taken cau-
tiously because have been done with estimations on penetration rates from a very few number of an-
swers.
The total number of bicycles in which these two systems could be implemented has been estimated
considering the bicycle sales in Europe in 2012 (Appendix B.4).
To estimate the number of potential pedestrians which will have the system the whole European popu-
lation has been considered.
The estimated penetration rates have been applied to these estimations. This data has been summa-
rized in the following paragraphs, and can be seen in Table 18.
The four systems assessed by the authorities are related to a certain type of location: either intersec-
tions or zebra crossings. Only one city has provided its data of the total number of intersections and
zebra crossings. As a consequence, an estimate for EU-27 cannot be provided.

D2.3
Implementation Scenarios
42
Table 18 Estimation by amount of equipped vehicles (in Millions of units) and VRUs for the ITS systems selected in 2020 and 2030 in EU-27.
SYSTEM
Passenger Car
Passenger car retrofit
Pedestrian (simple)
Pedestrian (cooperative)
Bicycle (sim-ple)
Bicycle (co-operative)
PTW Goods vehicle Goods vehicle
retrofit Bus Bus retrofit
% Amount % Amount % Amount % Amount % Amount % Amount % Amount % Amount % Amount % Amount % Amount
Bicycle to car communication
2020 2 1,292 1,3 3,144 3 2,951
2030 20 38,752 5 12,091 10 29,510
Intersection Safety
2020 3 1,938 3,8 9,189 4,5 0,378 7,5 2,415 6,5 0,012 2 0,018
2030 40 77,505 10 24,182 40 3,357 25 8,050 40 0,217 5 0,045
VRU Beacon System
2020 2,5 1,615 2,3 5,562 1 5,066 1 5,066 5 4,918 1 0,984 5 0,323
2030 40 77,505 5 12,091 5 25,331 5 25,331 20 59,019 15 44,264 40 7,763
Information on vacancy on
bicycle racks
2020 1,8 1,771
2030 25 73,774
Green Wave for cyclists
2020 2 1,967
2030 - 15 44,264 - - - -
PTW oncoming vehicle infor-
mation system
2020 2 1,292 4 0,259
2030 40 77,505 28 5,434
Blind Spot Detection
2020 10 6,459 2,8 6,771 20 1,678 11 3,542 21 0,038 10 0,090
2030 44 85,255 5 12,091 50 4,196 20 6,440 50 0,271 20 0,179
Pedestrian Detection Sys-
tem + Emer-gency Braking
2020 3 1,938 7,8 0,655 8 0,014
2030 36 69,754 36 3,021 36 0,195
Total Amount in EU-27
2020 100 64,587 241,825 506,624 506,624 98,365 98,365 6,469 8,392 32,200 0,181 0,896
2030 100 193,762 241,825 506,624 506,624 295,095 295,095 19,407 8,392 32,200 0,542 0,896

43
4.3 Potential business models
4.3.1 What are business models
A business model for ITS describes the way business/government expects to recover costs of imple-
menting ITS technology when providing services for a longer period of time. It describes the prod-
ucts/services that will be provided, the funding, the relationship between different stakeholders and the
mechanism by which business opportunities will be exploited.
Although ITS is associated with modern technologies the business models used originate from the first
generation innovation models; technology push models. In this model innovation in technology is lead-
ing in research and development. Although there have been advancements in engineering and manu-
facturing. the marketing and commercialization of the technology is lacking. According to Giannoutakis
Li (2012) the marketing/commercialization is the most crucial aspect of capitalizing on the technologi-
cal innovation at the firm level. This section aims to identify and suggest the most relevant and suita-
ble business model structures to increase the commercialization of the most promising and close-to-
market ITS systems that are prioritized and assessed by VRUITS. Business models for four types ITS
are discussed: Cooperative ITS, In-vehicle ITS, Cyclists ITS and Public ITS.
The 2DECIDE project defines the following reference business models for ITS (Kulmala, 2012):
1. Subscription Model (paid service through periodic fees) Revenue is raised through
periodic (weekly, monthly and annual) fees. This is a popular model for supplying access
to a service that is frequently used. The advantage for the service provider is that revenue
is raised in advance and thus providing more certainty of regular income. The advantage
for the user is that costs of using the service are known in advance and access is unlim-
ited within the subscription limit.
2. Usage Model (paid service – pay per use) Revenue is raised through actual usage of a
service (pay-per-use). Usage may be measured in time, per bytes, per area or per ses-
sion. Thus, if you don’t use the service - you don’t pay for it. The provider earns money by
applying a mark-up to the actual cost of each item or service.
3. Free Model (free service – offered by authorities / socio-economic benefits generat-
ed) There is no direct revenue raised through this model, although there will be indirect
benefits. Public sector organisations often employ this model. The immediate benefits are
intangible, e.g. a betterinformed citizen or better policy effectiveness, or the benefits may
be financial in the long term, e.g. less congestion, emissions, accidents etc.
4. Advertising Model (free service – revenue generated via for instance advertisement)
This business model creates a community of users bound together by a common purpose
or viewpoint. Revenue can be based on the sale of other services. Facebook, Twitter and
other social networking websites use the community model to create revenues from ban-
ner advertisements and sales of branded merchandise.
5. Enticement Model (free service – revenue generated via additional services) Here,
part of the service is provided free of charge as a lure to entice the user. Revenue is
raised from the sale of other products and services. This is often used for information and
web-based services. No direct or immediate services are thus created, unless combined
with another model.

44
4.3.2 Business Model for Cooperative ITS
4 of the 10 ITS selected for this study can be labelled as cooperative ITS. Cooperative ITS refers to a
system in which two or more of: people, vehicles, nomadic devices and infrastructure are connected
and cooperate by sharing information (Nilsson et al. 2012).
Cooperative ITS services are still in the development phase and are not widely used. The focus in
studies on cooperative ITS is on standardization of the communication between people, vehicles, no-
madic devices and infrastructure and on other technical issues. There is still a lack of knowledge on
how cooperative ITS can be commercialized.
Products/services
The four cooperative ITS will be shortly described in the upcoming part. Topics that will be discussed
are the technical characteristics, main beneficiaries and current state of affairs.
Intersection Safety (INS)
INS uses C-ITS technology to inform drivers and, optionally, VRUs approaching an intersection about
the state of the activities at the intersection. In-vehicle and infrastructure based C-ITS technologies
enable communication between vehicles and roadside units. The system can provide left- and right-
turning assistance for vehicle users. The Road Side Unit can detect VRUs and communicate this to
vehicles that are turning right or left into the path of a VRU. The driver will be warned or, optionally, the
vehicle will automatically brake in case of a dangerous situation. VRUs can be informed of a danger-
ous situation by flashing lights or sound signals. Besides turning assistance, the system can also iden-
tify situations in which a vehicle drives perpendicular to the path of a VRU. An INS is a rather complex
system that is still under development. Participants of the Second Interest Group Workshop indicated
that if the system becomes operational the potential safety benefits are significant.
VRU Beacon System (VBS)
A VBS makes use of a tag or a device held by a VRU that can be detected by a device in vehicles or
in the infrastructure. The system calculates the trajectories of the VRU in relation with the trajectories
of the vehicle. In case of a chance of collision the driver will be warned.
Either a specific device or a smartphone with an application can be used by the VRU to transmit C-
ITS( cooperative traffic compliant) messages. In particular at night and during adverse weather condi-
tions cyclists and pedestrians make up for most of the traffic accidents. The VBS has the potential to
significantly decrease the number of accidents with VRU by increasing their visibility.
Bicycle to car communication (B2V)
B2V informs vehicle driver about the presence and potential collisions with bicycles. Cyclists are in-
formed on their mobile phone about oncoming vehicles and potential collisions. The vehicle and bi-
cycle needs a C-ITS unit to send and receive messages with bicyclists. The C-ITS unit is also used for
the VBS.
PTW oncoming vehicle information system (PTW2V)
This system addresses the problem of visibility and awareness of motorcycles by enabling communi-
cation between vehicles and PTWs. Vehicle drivers and MC are informed about each other’s location.
Vehicles and PTWs can communicate using a standard C-ITS device which is also used for VBS and
B2V.

45
Funding
For the development of a cooperative ITS, investments from and collaboration from multiple actors are
needed, from both in-vehicle manufacturers, infrastructure providers and third parties, providing devic-
es and applications for VRUs. The European mandate M/453 urged the standardisation organisations
ETSI and CEN to developed the minimum set of standards determining the interoperability of C-ITS. In
order to overcome the lack of coordination between the different actors and to develop a joint strategy
for deployment, the Amsterdam Group, a cooperation between both automotive sector companies and
road operators/authorities, was set up. (Amsterdam Group, 2013).
C-ITS are based on devices in vehicles which communicate using standardised protocols and mes-
sage sets. The C-ITS devices can be either installed in the vehicles (either pre-installed or retrofitted),
or be nomadic. For the VRU device, the device can either be a dedicated device with all functionali-
ties, be an add-on device to a smartphone, or be implemented as a smartphone app.
For the in-vehicle devices and the dedicated devices, the cost of the service is included in the price of
the device.
For the smartphone app, the Subscription Model and Free Model can be viable business models. De-
velopers can create applications based on this technology which enables communication between
VRUs, infrastructure and Vehicle drivers. Following the Subscription Model people will be able to use
the application based on a fixed periodical fee. As the potential application will have socio-economic
benefits, public organizations may be willing to finance the development and make it free of charge
(Free Model).
Business opportunities
Cooperative ITS technology
The amount of vehicles that are equipped with cooperative ITS technology is currently very low. ITS-
G5 equipment will be installed in cars as standard equipment from 2015 onwards. IEEE 802.11p
chips, which can be embedded into phones, are expected to be introduced in the market in 2014. The
following figure shows the expected worldwide OEM V2V attach rate, as predicted by IHS (2014) and
Frost (2014).
Figure 30 Worldwide OEM V2V attach rate
Figure 31 shows the historical road map for IEEE 802.11p equipment (NXP. 2014).
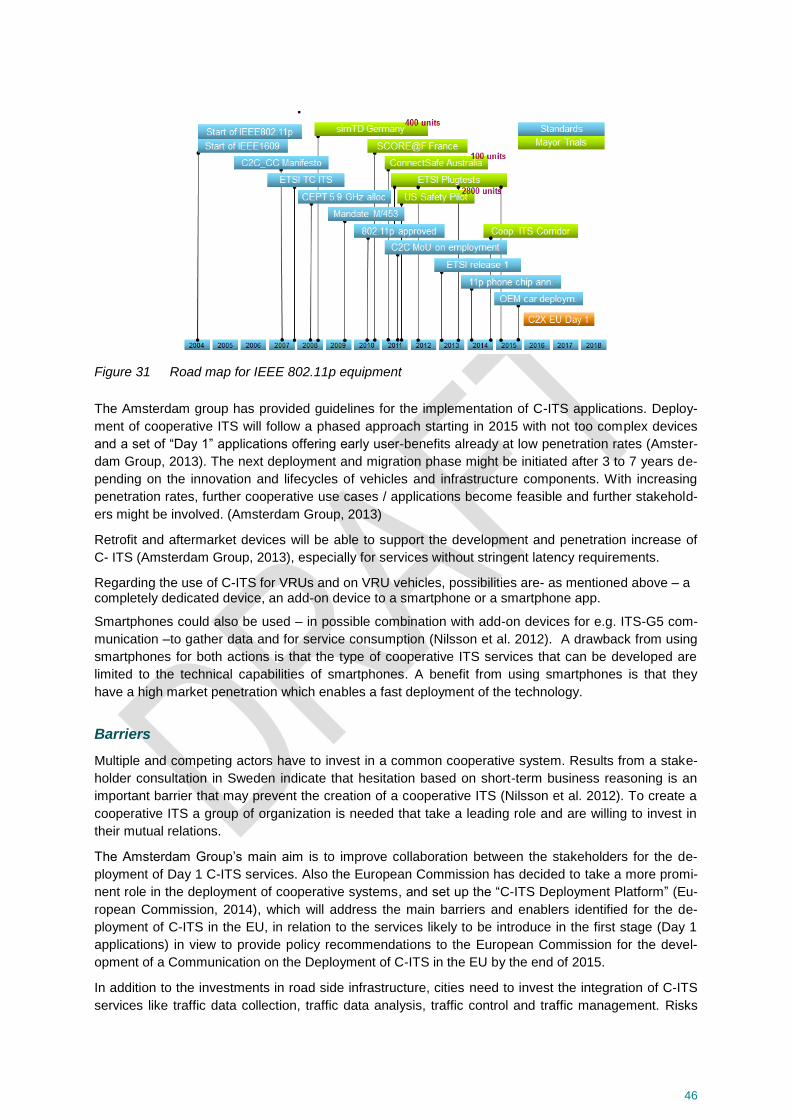
46
Figure 31 Road map for IEEE 802.11p equipment
The Amsterdam group has provided guidelines for the implementation of C-ITS applications. Deploy-
ment of cooperative ITS will follow a phased approach starting in 2015 with not too complex devices
and a set of “Day 1” applications offering early user-benefits already at low penetration rates (Amster-
dam Group, 2013). The next deployment and migration phase might be initiated after 3 to 7 years de-
pending on the innovation and lifecycles of vehicles and infrastructure components. With increasing
penetration rates, further cooperative use cases / applications become feasible and further stakehold-
ers might be involved. (Amsterdam Group, 2013)
Retrofit and aftermarket devices will be able to support the development and penetration increase of
C- ITS (Amsterdam Group, 2013), especially for services without stringent latency requirements.
Regarding the use of C-ITS for VRUs and on VRU vehicles, possibilities are- as mentioned above – a completely dedicated device, an add-on device to a smartphone or a smartphone app.
Smartphones could also be used – in possible combination with add-on devices for e.g. ITS-G5 com-
munication –to gather data and for service consumption (Nilsson et al. 2012). A drawback from using
smartphones for both actions is that the type of cooperative ITS services that can be developed are
limited to the technical capabilities of smartphones. A benefit from using smartphones is that they
have a high market penetration which enables a fast deployment of the technology.
Barriers
Multiple and competing actors have to invest in a common cooperative system. Results from a stake-
holder consultation in Sweden indicate that hesitation based on short-term business reasoning is an
important barrier that may prevent the creation of a cooperative ITS (Nilsson et al. 2012). To create a
cooperative ITS a group of organization is needed that take a leading role and are willing to invest in
their mutual relations.
The Amsterdam Group’s main aim is to improve collaboration between the stakeholders for the de-
ployment of Day 1 C-ITS services. Also the European Commission has decided to take a more promi-
nent role in the deployment of cooperative systems, and set up the “C-ITS Deployment Platform” (Eu-
ropean Commission, 2014), which will address the main barriers and enablers identified for the de-
ployment of C-ITS in the EU, in relation to the services likely to be introduce in the first stage (Day 1
applications) in view to provide policy recommendations to the European Commission for the devel-
opment of a Communication on the Deployment of C-ITS in the EU by the end of 2015.
In addition to the investments in road side infrastructure, cities need to invest the integration of C-ITS
services like traffic data collection, traffic data analysis, traffic control and traffic management. Risks

47
for achieving the intended benefits may arise from uncoordinated development and standardisation,
but also from proprietary deployment of cooperative ITS hard- and software for vehicles and coopera-
tive infrastructure. Other risks might arise from insufficient public budgets on national, county and city
level for financing investments, maintenance and continuous operation of C-ITS as well as research
and development activities for enhancement of new services (Proskawetz, 2013)
The services addressed in this report require also the involvement of parties, who develop devices
and applications for VRUs.
A report by the Environmental Protection Agency (2010) indicates that it takes between 15 to 20 years
before vehicle technology reaches maximum market penetration. A critical mass of people making use
of cooperative ITS is needed to create a viable business model. People who decide to buy a new ve-
hicle with cooperative ITS technology will not directly experience the benefits but will face the addi-
tional costs. The lag between the technical possibilities and realization is an important barrier that pre-
vents the deployment of communication systems between cars, PTW, bicycles and pedestrians which
are part of ITS analysed in this study. For vehicle manufacturers the production processes of new
technology are costly and soon become obsolete due to technological innovation. With a lag of 15 to
20 years before the technology reaches maximum market penetration this is a serious barrier for
manufacturers to invest in cooperative ITS technology
4.3.3 Business Model In-vehicle ITS technology
ITS like ‘’Blind Spot Detection’’ and ‘’Pedestrian Detection System’’ which are part of the 10 ITS which
are evaluated in this study are in-vehicle technologies that decrease the change of vehicle collision
with PTW, bicycles and pedestrians. VRUs benefit significantly from both technologies. Although
VRUs are the main beneficiaries of both technologies it is up to vehicle users to decide whether to
purchase vehicles equipped with in-vehicle ITS technology.
Products/services
The two in-vehicle ITS will be shortly described in the upcoming part. Topics that will be discussed are
the technical characteristics. main beneficiaries and current state of affairs.
Blind Spot Detection (BSD)
A BSD system uses vehicle sensor technology to detect pedestrians, bicyclists and PTW riders in
blind spots around the vehicle. After the detection of VRUs or other objects in the blind spot of the ve-
hicle the system provides a warning to the driver. The system is in particular interesting for large vehi-
cles like trucks and buses. The main beneficiaries of the system are cyclists and PTW riders.
Pedestrian Detection System (PDS) + Emergency Braking.
This in-vehicle system continuously scans for VRUs in its surrounding to detect a possible collision.
The system uses cameras, radar and infrared sensors to detect living objects in the car’s path of trav-
el. When the system detects a possible collision it will warn the driver of the vehicle through either
sound, visual signals or vibration of the steering wheel. The system works at all speed levels but is
most effective at lower speeds. Besides warning, the system can in case a driver fails to respond in
time, intervene through braking. At low speeds the system is intended to prevent a collision, at higher
speeds the system should reduce the impact of the crash.
As such, PDS+EBR (also called Pedestrian Collision Mitigation Systems) is a second generation of
Automatic Emergency Braking, and basicly uses the same sensors. Pedestrians and cyclists are much
more difficult to detect and identify than vehicles, since they have a much smaller footprint. PDS are
already available as additional options in certain vehicles. Car manufacturers like Volvo, Daimler, Audi

48
and BMW are using PDS systems (some with emergency braking) for a couple of years now. Besides
pedestrians the latest systems are able to detect cyclists as well. The first cyclists´ detection system
was introduced in 2013 by Volvo.
The earlier described VRU beacon system can enhance the effectiveness of the PDS+EBR as these
systems currently cannot detect road users outside the sight of the vehicle sensors. When the market
penetration of PDS+EBR will increase this may help to increase the demand of VBS.
Funding
The development of in-vehicle ITS will most probably be funded by the customers of vehicle manufac-
tures that pay for the technologies. As both ITS will have positive effects on traffic safety and comfort
for multiple traffic participants, it is likely that public organizations and insurance companies are willing
compensate the vehicle users. This will be further examined in the next paragraph. The reference
business models described do not relate to this type of ITS.
Insurance incentives
Vehicle users will prefer better road safety to prevent injuries to themselves and damage to others on
the road. Although they value higher road safety, they may be reluctant to pay for the new technolo-
gies. Vehicle users need to bear the costs for the technologies whereas especially VRU benefit from
better road safety. To create demand for these new technologies among vehicle users, financial incen-
tives can be an interesting method.
The costs of road crashes for vehicle users are limited to direct costs and compensation. These costs
can include compensation for families for loss of income and, in the case of serious injury, costs of
rehabilitation and care. Vehicle users pay for these costs via mandatory insurance premiums or
through social insurance schemes.
Insurance companies have to a certain degree the possibility to differentiate their premiums. Dis-
counts on insurance premiums based on driving history are common. The fewer accidents caused in
previous years the lower the premium. Providing discounts for vehicle users who have a car with ’Blind
Spot Detection’’ and/or ‘’Pedestrian Detection System’’ can be a way to compensate for the additional
costs associated with these technologies. When these technologies will cause a significant decrease
in traffic accidents, insurance companies may be willing to introduce discounts.
ITS can be a basis for further differentiation of insurance premiums. The information generated by the
systems can be used by insurance companies to provide incentives based on current driving behav-
iour (Pay How You Drive). There are different examples of insurance companies that already make
use of current driving behaviour to differentiate their insurance premiums (Tooth, 2012).
The deductions based on actual driving behaviour may become part of a business model for the de-
velopment of ITS. However regulation in certain EU member states may limit the possibilities for cost
reflective pricing of individual risks. When insurance premium deductions are used to increase invest-
ments in vehicle technology for ITS, regulations need to be adapted to increase possibilities for cost
reflective pricing of individual risks.
Public incentives
Like the incentives that can be provided by insurance companies, the government may also offer in-
centives for investments in technologies that increase road safety. A benefit of insurers in relation to
the government is that they have to compete and will therefore innovate to find the best way to influ-
ence the decisions of vehicle users. In case of behaviour depended incentives privacy concerns may
prevent government from collecting the information.

49
Business opportunities
Safety as a selling point
Safety has become a factor which enables vehicle manufactures to differentiate themselves from
competitors. Different studies show that people value road safety. A study by Andersson (2005) shows
that people value preventing a fatality to 1,2 million euros. Besides a general willingness to prevent
road accidents, vehicle users face legal liability in case of a collision with VRUs.
In most EU member states the law will find a vehicle driver culpable after accidents between vehicles
and VRUs. In the Netherlands and Germany even strict liability rules apply. This means that anyone
who uses a vehicle that might become a dangerous object in a collision will be liable for any damage
that arises from the use of the vehicle (lcc, 2009). Vehicle users that are aware of their legal liability
will be interested in technologies that reduce the change of accidents with VRUs. The legal liability of
vehicle users and the general willingness to reduce road accidents can create incentives for vehicle
manufactures to develop safer cars and invest in technologies like ’Blind Spot Detection’’ and/or a
‘’Pedestrian Detection System’’.
A way to indicate the safety of vehicles is by using a safety score. The safety score of vehicles is be-
coming more important for vehicle owners. One important safety score is developed by the European
New Car Assessment Programme (EuroNCAP). This is a programme for testing and rating the safety
performance of new vehicles. It is an independent programme and has no commercial interest in the
vehicle manufacturers. Vehicle users are aware of the programme and the EuroNCAP score is used in
the competition between vehicle manufacters (Elvik, 2010). In-vehicle ITS technology will increase the
EuroNCAP score and may thereby increase the attractiveness and commercial value of the vehicle.
EuroNCAP addresses currently AEB (Automatic Emergency Braking) and BSD for collision between
vehicles, and plans to include pedestrian testing for AEB in 2016 (EuroNCAP, 2014). Using the safety
concept as a selling point is also applicable to business models for cooperative ITS systems which
require specific in-vehicle technology.
Barriers
The in-vehicle and cooperative ITS will increase the cost of the vehicles. As a consequence vehicle
drivers may not be willing to purchase the additional technologies as long as they are not mandatory.
The amount of information that will be shown on the HMI of PTW drivers and VRUs is also likely to
increase, and if the systems cause too much false or nuisance warnings, driver may also prefer to
switch off the applications.
The different systems also have unintended events. The VRUITS safety assessment addresses the
unintended effects and their impact on safety and mobility. Negative unintended effects, like more
risky behaviour, may cause insurance companies and public organisations to be reluctant to invest or
provide incentives. Understanding the possible adaptations in driving behaviour is crucial to convince
insurance companies and public organisations to invest.
4.3.4 Business Model Public ITS
The development of 2 of the 10 selected ITS, ‘’Intelligent Pedestrian Traffic Signal’’ and ‘’Crossing
Adaptive Lightning’’ will most probably rely on public funding. The European Union and the national
and local governments are the primary source of funding for ITS infrastructure technology.
Products/services
The two ITS that will most probably rely on public funding will be shortly described. Topics that will be
discussed are the technical characteristics. main beneficiaries and current state of affairs.

50
Crossing Adaptive Lighting (CAL)
CAL is a system installed at zebra crossings that lights the zebra crossing when pedestrians or cy-
clists use it. Via an automated device the pedestrian or cyclist is detected and the lights are activated
or brightened. The system increases road safety by raising the visibility of pedestrians/cyclist to vehi-
cle users. A study by Hakkert et al. (2002) showed the impact of the system. The rate of vehicles giv-
ing way to pedestrians doubled. a reduction in the share of pedestrians crossing outside the crosswalk
area up to 10% and a significant reduction in vehicle-pedestrian conflicts to a rate of <1%. The sys-
tem is not of interest for zebra crossings that are constantly used by pedestrians/cyclist. This will result
in lights that are constantly flashing lowering the effectivity.
Intelligent Pedestrian Traffic Signal (IPTS)
IPTS is a traffic signal control system that uses sensors such as an infra-red camera to determine the
presence of pedestrians and adjusts the traffic signals accordingly. The system will lower accidents
between vehicles and pedestrians at signalized intersections where there is a zebra crossing.
Funding
From the reference business models, the Free Model is the most suitable model for the two Public ITS
earlier described. The Free Model is a model often employed by public organizations. In this model a
free service is provided where no direct revenue will be raised for the development of the ITS. The
growing austerity at both the national and local level in member states of the EU set barriers to wide-
spread use of the Free Model for the funding of ITS.
Business opportunities
The benefits of ITS should be communicated to the public and decision-makers to raise support for
solutions that that improve travel safety, comfort and efficiency. The public can be of vital importance
to motivate the decision-makers at the governmental level to finance ITS related equipment. Good
communications to decision-makers would be aided by cost-benefit analyses comparing the new
technology with current practices.
An article by Deakin, Fric and Skabardonis (2009) states that elected official and agency leaders who
take decisions whether to invest in new technology, complain about the jargon that technology devel-
opers often use. Policy makers like to have a clear description of the benefits of new technology and
are interested in the outcomes it will generate and what it will cost compared to other ways of achiev-
ing the same.
Barriers
In the IPTS system pedestrians have priority over vehicle users. When pedestrians decide to cross an
intersection the traffic signals will be adjusted. ITS systems may also have negative unintended ef-
fects, which may possibly involve an increase of pedestrians crossing during the red phase, and an
increase of the waiting time for vehicles, and hence possibly increase road congestion in cities. Public
organizations may be reluctant to invest in ITS systems which have a negative impact on vehicle us-
ers.
4.3.5 Business Model Cyclists Applications
2 of the 10 selected ITS, “Information on Vacancy on Bicycle racks” and ‘Green Wave for cyclists’’ are fo-
cused on cyclists and involve the development of a smartphone application.

51
Products/services
The two ITS will be shortly described. Topics that will be discussed are the technical characteristics,
main beneficiaries and current state of affairs.
Information on Vacancy on Bicycle racks (IVB)
The system provides information via a free phone app on the number and closest available bicycle
racks. The bicycle racks may be equipped with an integrated locking system for the bike. Currently
there are applications available (for example in Seattle) that allow users to locate a nearby bicycle
rack. However there are currently no systems that are using bicycle racks with an integrated locking
system and which are able to indicate whether the bicycle racks are vacant.
Green Wave for cyclists (GWC)
A personal device (a smart-phone or a bicycle computer) provides a speed advice to cyclists. If they
follow the advice they are guaranteed a green light at the next controlled intersection. The personal
device needs to determine the location of the cyclist to provide the speed advice. The system is easi-
est to implement in case of a fixed time traffic light controller. There are possibilities supporting adap-
tive time traffic light controllers as well.
Funding
To develop a “Green Wave for cyclists” system, infrastructure providers need to publish the data of the
fixed time traffic light controllers. Based on this data, developers can create an application for either a
smartphone or bicycle computer that provides cyclists with speed advice that will grant them a green
wave at the next intersection. Different reference business models can be of interest for the develop-
ment of the application.
Using the subscription model, cyclists pay a periodic fee to the application developers, which enable
them to make use of the system. The periodic fee can decrease as more cyclists make use of the ap-
plication. This as the marginal costs of additional users will be almost nil. An alternative to the sub-
scription model is the advertisement model, where the application comes free of charge. As the group
that makes use of the application is delimited they can be valuable for companies that have cyclists as
their customer base. The advertisements that will reach the delimited group will finance the develop-
ment of the application.
To finance the bicycle racks system different business models can be used. Systems that show re-
semblance to the bicycle racks system with locking system are the bike rental services like Velib (Par-
is) and Citi Bike (New York). These services party use a Usage Model and an Advertisement Model.
To make use of the bicycles people pay a fee based on time. The advertisement income is generated
by showing ads on bicycles and by companies that link their name to the program.
In a similar fashion to the bike rental programs but with privately owned bicycles, cyclists will pay to
securely park their bicycles in bicycle racks with an integrated locking system. To generate advertise-
ment money companies can link their name to the service. The user fees and advertisement money
will be used to install bicycle racks with an integrated locking system and to develop a free application
that informs people on the number and closest available vacant bicycle racks. A subscription model
can provide cyclists with unlimited use of the bicycle racks for a fixed periodic fee.
Business opportunities
To make travelling by bike an alternative to other travel options the relative amount of travel time is an
important factor. Both ITS applications help to reduce the relative travel time. The bicycle racks appli-
52
cation reduces the time needed to find a vacant parking spot for your bike. The application will show
the best options and by using navigation the vacant parking spot is easy to find. The Green Wave ap-
plication will reduce travel time by bike because waiting times at intersections will be lower. A study by
Börjesson and Eliasson (2012) showed that cyclists’ value of travel time savings turns out to be high
considerably higher than the value of time saving on alternative modes. The time savings achieved by
both systems may therefore be a strong selling point.
Bike theft is a big problem in most cities. Bicycle theft is a crime that is largely unchallenged by the
police and is frequently not reported (Sidebottom Thorpe 2009). Cyclists are more than four times as
likely to be victims of vehicle theft than are car owners (van Dijk, 2007). The bicycle theft problem
opens a market for solutions that reduce the chance bikes get stolen. The bicycle racks system is
such a solution as it makes people aware of the presence of safe parking spots and provides a safe
way to store their bike.
Most city councils have the ambition to increase the use of bicycles in their city. Bicycle theft is the
highest per bicycle owner in cities where bicycles are a popular way of transport (van Dijk, 2007). The
chance your bike gets stolen increases the more popular is cycling in the city you are living. Therefore.
city councils that aim to increase the share of bicycle travel in their cities need to address the problem
of bicycle theft to make their ambition become reality. The bicycle racks system may be an interesting
solution for city councils to cope with the problem of bicycle theft in their cities.
Barriers
A study in Montreal, Canada showed that only 37 percent of the cyclists are willing to pay for better
parking (Van Lierop et al., ). Two in five people that were not willing to pay for parking cited cost, while
one in five did not want to pay on principle. Only 30 percent were willing to pay a dollar for parking.
This reluctance to pay for bicycle parking may be a significant barrier for the development.
4.4 Road map for ITS deployment
This section discusses deployment aspects of ITS in general, and ITS for VRU in particular. It will start
with a general discussion on deployment. This is largely based on the results of the SAFESPOT pro-
ject, which performed an in-depth analysis of deployment issues for cooperative safety-oriented ITS
for cars, and is therefore one of the lead examples of a recent deployment analysis. It then discusses
deployment issues of ITS for VRU based on an analysis of the questionnaire results.
Deployment
Deployment makes the difference between a potential impact of an ITS and a realized impact. History
shows that this involves more than a technical realization of the system. For example, ACC has exist-
ed since the 1980’s but has only recently started to be deployed in more than a minimal number of
cars. Thus, more actions are required to realize the potential of an ITS. The SAFESPOT project (TNO
et al., 2010) identifies the following issues that can play a role in deploying (cooperative) ITS:
organisational architecture and in particular roles and responsibilities;
risks and legal aspects;
impacts and cost-benefit assessment; and
business models and market assessment.
Still following SAFESPOT, a deployment analysis starts from the present situation, describing the cur-
rently available ITS and underlying technology, the current organizational setting and the current
trends towards the deployment of ITS systems. Deployment scenarios are selected by identifying im-

53
portant “scenario dimensions”, that is, the main choices that one wants to vary and investigate. These
could be concerned with various aspects, such as
Technical realization, e.g. personal devices versus road-side units.
Leading stakeholder(s), e.g. public or private.
Functional scope of the system, e.g. informing or intervening, information supply to authorities
or to the general public, real-time or historic.
Legal framework, e.g. mandatory or voluntary.
SAFESPOT has analysed the three choices private lead – public lead, V2V communication – V2I
communication and generic platform – dedicated platform. From this the following scenarios have
been selected:
1. Technology pushed ITS revolution: private lead, V2V communication, generic platform. This
scenario deploys a wide range of applications without government funding. Financing will
come from the end-user.
2. Safety as a public good: public lead, V2I communication, dedicated platform. This scenario
deploys a more restricted range of applications and roadside infrastructure, funded or subsi-
dized by the government. The deployment is expected to be retarded compared to the first
scenario.
3. Extended traffic management: public lead, V2I communication, generic platform. This scenario
deploys nomadic devices and roadside infrastructure, funded or subsidized by the govern-
ment. The deployment is expected to be similar to the first scenario.
For each scenario, deployment challenges are described for five broad categories:
a. How to reach critical mass so that a favourable business case and societal benefit-
cost ratio can be obtained.
b. How to develop a step by step deployment path, and thereby avoid large steps that
come with high investment and high risk.
c. How to realise a European market.
d. Which business case to adopt for the stakeholders.
e. How to realized cooperation between stakeholders.
The deployment analysis continues to identify and describe deployment scenarios in terms of seven
variables, namely:
1. The ITS applications for which the scenario is developed. Here one describes the application
or applications that are considered in the scenario. Multiple applications can be considered if
they will influence each other, for example if they run on the same platform.
2. The technology and system configuration. This variable lists important considerations in the
choice of technology. Such choices could be e.g. long-range versus short-range communica-
tion, or dedicated devices versus generic PDA’s. Considerations typically have to with quality
requirements (like accuracy, reliability, timeliness), performance requirements (like processing
power) or data access requirements.
3. The expected market penetration. This is often very difficult to estimate. A much used ap-
proach is to first estimate an average market penetration curve as a function of time, and then
shift it to get more optimistic and pessimistic scenarios. In this way, rather than trying to pre-
dict the market penetration one tries to assess the sensitivity of the deployment scenario. The
market penetration will depend heavily on the technology that is used, on user acceptance, on

54
government policy and on the legal framework. Market penetration can be translated into traf-
fic penetration (which fraction of kilometres is travelled with the ITS) with models similar to the
ones used in eIMPACT (Wilmink et al.,. 2008).
4. The business model. A business model describes how money, services and products flow be-
tween different stakeholders. Deployment of an ITS will only take off if all stakeholders benefit.
Benefits are often financial (and for industry stakeholders this is usually the main driver) but in
particular for governments social benefits may also play a role. Financial benefits can be indi-
rect: competitive edge, reputation, market share, valuable information, etc.
5. The organisational architecture. This describes the roles that stakeholders can play
(SAFESPOT identified 13 roles) and the interactions or exchanges between these roles. Roles
are for example Public authority, Service provider, several types of Suppliers, and Certificating
bodies. Exchanges can be about Data, Services, Products, Licenses and Rules. Roles are an
invariant of a deployment scenario, but the stakeholders performing them may change.
6. The societal costs and benefits. This assesses the costs and benefits of the application on so-
cietal level, including non-monetary costs and benefits such as changes in traffic safety, traffic
efficiency and environment, but not distributing costs and benefits over stakeholders. In princi-
ple, costs and benefits on other societal issues (e.g. employment, health) can also be taken
into account. This analysis determines whether the total societal benefits of an application in a
certain deployment scenario outweigh the costs, and hence whether a beneficial introduction
is possible in principle. It does not mean necessarily that all stakeholders will benefit, but may
provide some hints on potential benefits, key influencing factors, and promising business
models.
7. The legal framework. This does not only concern laws (the public legal framework), but also
private and mixed public-private legal frameworks like contracts, self-regulation and standardi-
sation. SAFESPOT also includes financial aspects like taxation and incentives in this frame-
work. A legal framework may provide a basis on which applications can be deployed, for ex-
ample by standardisation, regulating risks (e.g. liability) or establishing organizational struc-
tures. It may also force deployment via legal requirements, and it may change the deployment
environment, e.g. by adapting traffic laws.
A deployment road map describes a deployment scenario and the activities that are to be performed
by the various roles. It may also provide a time path or order for these activities. Activities can for ex-
ample be to develop standards or business models, to provide incentives, adapt the legal framework,
offer services or technical components, increase awareness, etc.
While the SAFESPOT methodology was developed for cooperative systems aiming at car drivers as
end users, it is also applicable to (cooperative or stand-alone) ITS that aim to be beneficial for VRU.
The SAFESPOT deployment scenarios and road map are too specific to be used one on one. Some
important differences between SAFEPOT and VRUITS are that
The SAFESPOT applications are all cooperative with an in-car component. VRUITS considers
both cooperative and stand-alone applications, and the cooperative ones do not have to have
an in-car component.
The SAFESPOT applications target car drivers as beneficiaries. In VRUITS car drivers may be
users of the applications, but the beneficiaries are pedestrians, cyclists or PTW riders.
The SAFESPOT applications are all aiming to improve safety. In VRUITS, the applications
may address safety, mobility and/or comfort.

55
Deployment of ITS for VRU
The main source of information on deployment scenarios and road maps for the ITS selected for
VRUITS are the answers to the questionnaires of section 4.2. Although only a small number of ques-
tionnaires were filled in, some tentative conclusions can be drawn from them as well as from the ex-
pertise of VRUITS experts:
Barriers that are mentioned are: costs, data security, technical complexity, lack of political in-
terest, lack of end user interest, lack of end user acceptability.
Legal mandate is mentioned as a driver.
A full deployment analysis of all VRUITS systems is not feasible within the limits of time and budget of
this task. But some remarks can be made on specific challenges for ITS for VRU’s, by comparing the
situation for VRU’s to the SAFESPOT analysis:
Willingness to pay: Car owners are used to spend a significant sum of money on new vehicles
and on maintenance, fuel, insurance etc. This makes it possible to include ITS systems as
add-on package with a new vehicle or (in a later stage) even in basic variants, and indeed this
is happening. However, this is usually limited to systems that actually benefit the car owners
themselves. It is much harder to convince them to pay for systems that benefit other road us-
ers (usually this concerns safety systems).
Pedestrians and cyclists are not used to spending much on their travel, and therefore are not
expected to spend significantly on ITS systems. This means that it will be difficult to create a
positive business case if it relies on large end user payments for systems aiming at cyclists
and pedestrians. This suggests that one should either aim for low cost solutions, for example
using existing devices like smart phones or low cost devices like tags, or devices need to be
subsidized by the government, or devices need to be made mandatory. This issue may be
less pronounced for PTW riders: there the C-ITS system can be implemented fixed in the
PTW.
Stakeholders: especially for pedestrians and to some extent also for cyclists, there are few
obvious stakeholders from the industry side. This means in particular that there are no obvious
parties that will invest heavily in ITS aiming at these VRUs. Regarding devices for VRUs, initi-
atives of the public sector may be needed to stimulate development of these devices. This
leads to the same conclusions on low cost solutions or government involvement as in the pre-
vious remark
User acceptance: For motorcyclists, freedom of action is an important aspect of their riding
experience. Applications that inhibit or seem to inhibit their freedom will meet low acceptance
rates. This is true in particular for any system that intervenes in the riding task, such as ISA
(Intelligent Speed Adaptation).
Other end user limitations: other important inhibitors to the deployment of ITS aiming at pe-
destrians and cyclists are power consumption, weight, size and (especially for on-bicycle de-
vices) risk of theft. These issues are less relevant for PTW riders.
Impacts and benefits: For many VRU-oriented devices it is not yet clear what their societal and
individual benefits will be. While the past years have seen significant research into the im-
pacts, benefits and costs of ITS aiming at car and truck drivers (ranging from desk research to
field operational tests, with EU projects like TRACE, PreVENT, eIMPACT, EuroFOT, Tele-
FOT, interactIVe, SAFESPOT, CVIS, Drive C2X and many others, and furthermore many na-
tional or local studies), there has been little research on the same topics for VRU oriented de-
vices. Much of the research that has been done is very local in nature and hard to generalize
to the EU level. This means that it is difficult to determine the technical feasibility, effective-
ness and societal benefits of devices. This is for example true for innovative concepts or sys-

56
tems like BRM (Cyclist digital bicycle rear-view mirror and rear obstacle detection), FOD (For-
ward obstacle detection for cyclists) and GWC (Green Wave for Cyclists). This suggests that
higher research effort on impacts will be needed as input for a proper deployment analysis.
Differences between countries: The take-up of ITS may be different in different European
countries and regions due to differences in travel culture, transport system, weather and cli-
mate, views on the role of governments, etc. For example, mandatory use of systems like ISA
or BSD (blind spot detection) may be more acceptable in some countries than in others. ITS
systems that warn for adverse weather conditions may be more useful in the north than in the
south. Countries or regions with significant numbers of cyclists may be more interested in bi-
cycle oriented systems. Advanced safety oriented ITS may be of more interest for those coun-
tries that have already applied more traditional safety measures like infrastructure improve-
ments. Some systems may be more appropriate for rural areas while others will aim for dense-
ly populated ones. While such differences also exist to some extent for car traffic, it seems
likely that for VRU’s they are more pronounced because VRU travel is usually more local, less
regulated, and more easily influenced by external circumstances like weather.
Differences between user groups: Road users have different abilities, aims and limitations,
depending on for example age and health. While this is also true for car drivers, it is a much
more pronounced issue for VRU’s. Some reasons for that are:
o Certain road users only appear as VRUs. This holds for example for children who are
not accompanied by an adult and hence have to travel by foot, bicycle, public
transport or possibly moped. It also holds for people with certain disabilities or physi-
cal limitations. This means on the one hand that one can expect a greater variation in
behaviour, and on the other hand that for certain people, travelling as VRU may be
their only choice of travelling – meaning that for social reasons extra care should be
taken that this choice remains available to them.
o Physical ability has a much larger influence on VRU travel than on car travel. There
are huge differences between (healthy) elderly pedestrians and middle-aged pedestri-
ans when it comes to walking speed, distances that can be walked, ability to deal with
obstacles, etc. There are similar issues for cyclists. Such differences may also appear
because of health impairments.
All in all this suggests that a private lead is only possible for low cost solutions based on existing de-
vices like smartphones, or possible for fixed installation in PTW’s. Any significant investments for the
benefit of pedestrians and cyclists will require government involvement, either financial or regulatory,
or both. For pedestrians and cyclists there may be further challenges regarding the technical feasibility
of solutions. Other challenges have to do with differences between countries and user groups.

57
5. DISCUSSION AND CONCLUSION
Concerning mobility and comfort forecasts, up until the year 2030 there is a trend towards a more pe-
destrian friendly environment by providing more space dedicated to this road user group. Technologi-
cal innovations in conjunction with spatial planning and improved public transport options in the urban
areas in Europe help to develop more car-free mobility profile for a broader range or road user groups.
This in turn is expected to change the modal split in the urban centres sustainably towards walking,
cycling and also PTWs.
With regard to safety trends, assuming that the current trends in road casualty numbers remain the
same until 2030 car occupant fatalities will decrease dramatically. However the predicted decrease for
the VRU groups is not so dramatic.
ITS applications are key to make transportation of VRUs safer and more comfortable. However, there
seems to be a gap between the ITS community and final users.
A study carried out by the European Commission reveals that a high rate of people is aware of some
ITS applications, but their willingness to buy a vehicle with these systems is highly dependable on the
final price (Kievit, 2008). In addition, pedestrians and cyclists are not used to spend much on their
travel, and therefore are not expected to spend significantly on ITS systems. In this sense existing de-
vices like smartphones might be good solution.
Smartphones are also a good alternative to in-vehicle technology, given that they have a high market
penetration which enables a fast deployment of the technology. This is especially relevant for coopera-
tive ITS, where a critical mass of vehicles equipped with technology is necessary to create a viable
business model. According to the Amsterdam Group (2013) retrofit and after-market equipment will be
able to support the development and penetration increase of cooperative ITS. However, smartphones
have difficulties to fulfil the low latency and accuracy requirements of safety applications.
The deployment of cooperative ITS needs a multi-stakeholder cooperation, and requires collaboration
among the cooperating organizations. For a cooperative ITS that requires a combination of in-vehicle
and infrastructure technology collaboration between the vehicle manufacturing industry and the infra-
structure providers will be required. Authorities are key players in cooperative systems deployment
(Amsterdam Group, 2013). The European Union and the national and local governments are the pri-
mary source of funding for ITS infrastructure technology. But an important principle guiding deploy-
ment is cost effectiveness. The cost-benefit relation of ITS systems has to be sufficient for authorities.
This is a key aspect for the deployment of ITS, and the thing is that the real benefits of cooperative
systems for local authorities have still to be proven.
A good starting point on a road map towards ITS for VRU is to investigate the potential impacts and
benefits of such systems. This project takes a first step in that direction. Further steps could be for
governments to organize and fund field trials to gain practical experience and raise awareness, to
harmonize the development in different countries where feasible and learn from each other’s exper i-
ences. As argued above, the role of governments in this development is significant and they may have
to take the lead in many cases.
58
REFERENCES
ACEM (2013). The Motorcycle Industry in Europe, Statistical overview registrations, deliveries and
circulating park. Webdocument:
http://www.academia.edu/6222181/ACEM_the_Motorcycle_industry_in_Europe_2013_Statistical_over
view_provisional_figures_Registrations_and_deliveries_Circulating_park_Production_Top_10_models
_Contents (download: 21.08.2014).
Amsterdam Group (2013). Roadmap between automotive industry and infrastructure organisations on
initial deployment of Cooperative ITS in Europe.
Börjesson, M., & Eliasson, J. (2012). The value of time and external benefits in bicycle appraisal.
Transportation research part A: policy and practice, 46(4), 673-683.
Deakin, E., Frick, K. T., & Skabardonis, A. (2009). Intelligent transport systems: linking technology and
transport policy to help steer the future. Access (34).
EPA, Office of Transportation and Air Quality, U.S. (2010) Compliance and Innovative Strategies Divi-
sion and Transportation and Climate Division. Light-Duty Automotive Technology, Carbon Dioxide
Emissions, and Fuel Economy Trends: 1975 Through 2010. EPA-420-R-10-023.
eIMPACT Consortium (2008). Impact assessment of Intelligent Vehicle Safety Systems.
European Commission (2014) C-ITS Deployment Platform: The Context,
http://ec.europa.eu/transport/themes/its/news/doc/c-its-platform-deployment/introduction.pdf (down-
load 31.10.2014)
Colibi & Coliped (2013). European bicycle market 2013 edition, Industry & Market Profile (2012 statis-
tics). Webdocument:
http://issuu.com/coliped/docs/european_bicycle_market___industry_/21?e=1475043/5326982 (down-
load: 09.09.2014)
European Automobile Manufacturers Association. Statistics. Webdocument:
http://www.acea.be/statistics (download: 20.08.2014).
EuroNCAP (2014) Euro NCAP´s Road Map 2020 – The next steps for Vulnerable Road User AEB as-
sessment, ASPECCS Final Workshop, 1.7.2014
Frost & Sullivan (2014), Strategic Analysis of the European Market for V2V and V2I Communication
Systems, via http://www.fiercemobileit.com/press-releases/daimler-and-volvo-take-lead-
implementation-v2v-communication-systems-europe
Giannoutakis, K. N., & Li, F. (2012). Making a Business Case for Intelligent Transport Systems: A Ho-
listic Business Model Framework. Transport Reviews,32(6), 781-804.
Graham, H.M. (2005). Transport in Europe: where are we going?. Foresight, 7(6), 24 – 38.
Hakkert, A. S., Gitelman, V., & Ben-Shabat, E. (2002). An evaluation of crosswalk warning systems:
effects on pedestrian and vehicle behaviour. Transportation Research Part F: Traffic Psychology and
Behaviour, 5(4), 275-292.
IHS Automotive (2014), V2X Technology’s Arrival Key to Accident Reduction,
http://www.ihs.com/info/all/a/v2x-technology.aspx
Kievit, M., Malone K., Zwijnenberg H. and Van Arem B. (2008). Benchmarking promotion and deploy-
ment activities regarding intelligent vehicle safety systems in the EU. Transportation Research Board
Annual Meeting; January 2008; Washington, USA.

59
Kulmala R. et al. (2012), Evaluation Plan, Knowledge Base and Inference Engine, D3.1, 2DECIDE
project
London Cycling Campaign (2009). Law change could offer greater protection to cyclists and pedestri-
ans. Webdocument: http://lcc.org.uk/articles/law-change-could-offer-greater-protection-to-cyclists-and-
pedestrians (download: 31.08.2011).
Nilsson, M., Williander, M., & Englund, C. (2012). Commercialisation of Intelligent Transportation Sys-
tems: The Case of Cooperative Systems. Procedia Social and Behavioral Sciences, 48, 722-732.
Noland, R. B. (1994). Perceived risk and modal choice: Risk compensation in transportation systems.
Accident Analysis and Prevention, 27(4), 503-521.
NXP, 2013, NXP and Cohda unveil new V2X device for connected vehicles, NXP Press Release,
8.7.2013, http://www.nxp.com/news/press-releases/2013/07/nxp-and-cohda-unveil-new-v2x-device-
for-connected-vehicles.html
Ogilvie, D., Egan, M., Hamilton, V., & Petticrew, M. (2004). Promoting Walking And Cycling As An Al-
ternative To Using Cars: Systematic Review. British Medical Journal, 329(7469), 763-766.
Parkina, J., Wardman, M., & Page, M. (2006). Models of perceived cycling risk and route acceptability.
Accident Analysis and Prevention 39, 364–371.
Proskawetz K.O., Klug, S., Beckert, B. (2013), Smart Cities and Communities – Key to Innovation In-
tegrated Solutions, Cooperative Intelligent Transport Systems and Services (C-ITS)
Sidebottom, A., A. Thorpe, et al. (2009). Using targeted publicity toreduce opportunities for bicycle
theft: A demonstration and replication. European Journal of Criminology 6(3), 267-286.
TNO et al. (2010). The SAFESPOT deployment programme, D6.7.1 of SAFESPOT SP6 – BLADE–
Business models, Legal Aspects, and Deployment..
Tooth, R. (2012). An insurance based approach to safer road use. In ACRS 2012 National Confer-
ence.
United Nations Economic Commission for Europe. Statistical dababase; quick statistics for key indica-
tors. Webdocument: http://www.unece.org/data (download: 22.08.2014).
Van Dijk, J., van Kesteren, J. etal (2007). Criminal victimisation in international perspective: Key find-
ings from 2004-2005 ICVS and EUICS. The Hague, Boom Juridische Uitgevers.
van Lierop, D., Grimsrud, M., and El-Geneidy, A. (accepted), Breaking into Bicycle Theft: Insights from
Montreal, Canada. International Journal of Sustainable Transportation.
Vredin Johansson, M.; Heldt, T.; Johansson, P. (2005). Latent variables in a travel mode choice mod-
el: Attitudinal and behavioural indicator variables. Working paper 2005: 5. Uppsala University. De-
partment of Economics. February 2005.
Wilmink et al (2008). Impact assessment of Intelligent Vehicle Safety Systems. D4 of eIMPACT pro-
ject.
ITS MARKET RESEARCH
60
Appendix A. Questionnaires on penetration rates
A.1 Questionnaire for authorities
ITS Market Research Questionnaire for authorities
Dear participant,
This survey shows a set of services in order to determine their feasibility, time frame for implementation, and the main
obstacles that must be overcome to achieve the deployment of ITS in European cities.
Your participation is very important to ensuring a complete and accurate tracking of ITS deployment in Europe.
Thank you for your assistance with this survey effort. Your cooperation is greatly appreciated.

ITS MARKET RESEARCH
61
Background Information
Job role/function: _________________________________
Institution: _______________________________________
City: ____________________________________________
Country: _________________________________________

ITS MARKET RESEARCH
62
ITS Survey
Please, answer the items below by selecting for each item the option that best reflects your opinion.
1. Intelligent Pedestrian Traffic Signal
IPTS is a traffic signal control system that uses sensors such as an infra-red camera to de-
termine the presence of pedestrians and adjusts the traffic signals accordingly. Scenarios
this system addresses are cyclist and pedestrian accidents at signalized intersections where
there is a zebra crossing.
VRUs are provided with enough time to cross the road (in traffic signals longer green time).
a. Does your Administration have any plans to invest in this
system in the future?
Yes No
(If the answer is Yes please go to question d)
b. Would your authority consider investing in this system in
the future?
Yes No
(If the answer is Yes please go to question d)
c. Would your authority consider co-financing or facilitating
private investments in this system (by providing space for
roadside infrastructure) in the future?
Yes No
d. How many of these systems do you estimate there will be
installed in your city by 2020? (absolute nº of systems and
percentage to the total nº of pedestrian crossings in the city)
Nº of systems
________
Percentage
______
e. How many of these systems do you estimate there will be
installed in your city by 2030?
Nº of systems
________
Percentage
________
f. How many of these systems do you estimate there will be in
your country by 2020?
Nº of systems
________
Percentage
________
g. How many of these systems do you estimate there will be
in your country by 2030?
Nº of systems
________
Percentage
________
h. How useful do you think is the implementation of this ser-
vice?
Why?
__________________________________________________
__________________________________________________
__________________________________________________
__________________________________________________
1 2 3 4 5 1. Not at all useful – 2. Not very useful - 3.Somewhat useful –
4. Quite useful - 5. very useful

ITS MARKET RESEARCH
63
i. Main obstacles: please select the main obstacles that must be overcome to achieve the deployment of this
ITS and provide a comment what the obstacle is
[] Technical _________________________________
[] Legal _____________________________________
[] Political___________________________________
[] Social ____________________________________
[] Economic _________________________________
[] Other (specify)_____________________________
j. Success factors: please comment what are the reasons why you think this ITS will be successfully introduced
in your country
k. Please use the space below to provide any additional comments regarding your institution´s deployment of
this ITS.

ITS MARKET RESEARCH
64
2. Intersection Safety
Intersection Safety assists the driver and VRU in avoiding common mistakes which
may lead to typical intersection accidents. It covers these functions: left and right
turn assistance and vehicles arriving perpendicular to VRUs at intersections.
For left- and right-turning assistance, RSU detects the VRU, communicates this to
the vehicle which is turning right or left into the path of the VRU. The vehicle driver
is informed; gets a warning or the vehicle begins to brake, depending on the urgen-
cy of the situation. The roadside infrastructure also informs the VRU of a dangerous
situation by eg flashing lights, and / or making a sound.
The second function identifies a dangerous situation in which the vehicle drives
perpendicular to the path of the VRU. The RSU detects the VRU crossing the inter-
section. The RSU informs the vehicle about the presence of the VRU. The RSU also
informs the VRU (via flashing lights/ sound) about the presence of the on-coming
vehicle.
a. Does your Administration have any plans to invest in this sys-
tem in the future?
Yes No
(If the answer is Yes please go to question d)
b. Would your authority consider investing in this system in the
future?
Yes No
(If the answer is Yes please go to question d)
c. Would your authority consider co-financing or facilitating
private investments in this system (by providing space for road-
side infrastructure) in the future?
Yes No
d. How many of these systems do you estimate there will be
installed in your city by 2020? (absolute nº of systems and per-
centage to the total nº of intersections in the city)
Nº of systems
________
Percentage
________
e. How many of these systems do you estimate there will be
installed in your city by 2030?
Nº of systems
________
Percentage
________
f. How many of these systems do you estimate there will be in
your country by 2020? (absolute nº of systems and percentage
to the total nº of pedestrian crossings in the country)
Nº of systems
________
Percentage
________
g. How many of these systems do you estimate there will be in
your country by 2030?
Nº of systems
________
Percentage
________

ITS MARKET RESEARCH
65
h. How useful do you think is the implementation of this ser-
vice?
Why?
____________________________________________________
____________________________________________________
____________________________________________________
____________________________________________________
1 2 3 4 5 1. Not at all useful – 2. Not very useful - 3.Somewhat useful –
4. Quite useful - 5. very useful
i. Main obstacles: please select the main obstacles that must be overcome to achieve the deployment of this ITS
and provide a comment what the obstacle is
[] Technical _________________________________
[] Legal _____________________________________
[] Political___________________________________
[] Social
____________________________________
[] Economic
_________________________________
[] Other (speci-
fy)_____________________________
j. Success factors: please comment what are the reasons why you think this ITS will be successfully introduced in
your country
k. Please use the space below to provide any additional comments regarding your institution´s deployment of
this ITS.

ITS MARKET RESEARCH
66
3. Crossing Adaptive Lighting
Crossing Adaptive Lighting mounted at zebra crossings lights the zebra crossing when pe-
destrians and cyclists use it. When the pedestrian/cyclist activates the system, by through
detection from an automated device, the lights are activated / brightened to light the
crossing. The system increases the safety of zebra crossing users by increasing their visibil-
ity to drivers (reducing the chance that the pedestrian/cyclist is not or late observed by the
driver) and by making the crossing action safer for the pedestrians/cyclists due to the im-
proved lighting.
a. Does your Administration have any plans to invest in this
system in the future?
Yes No
(If the answer is Yes please go to question d)
b. Would your authority consider investing in this system in
the future?
Yes No
(If the answer is Yes please go to question d)
c. Would your authority consider co-financing or facilitating
private investments in this system (by providing space for
roadside infrastructure) in the future?
Yes No
d. How many of these systems do you estimate there will be
installed in your city by 2020? (absolute nº of systems and
percentage to the total nº of pedestrian crossings in the city)
Nº of systems
______
Percentage
______
e. How many of these systems do you estimate there will be
installed in your city by 2030?
Nº of systems
________
Percentage
________
f. How many of these systems do you estimate there will be in
your country by 2020?
Nº of systems
________
Percentage
________
g. How many of these systems do you estimate there will be
in your country by 2030?
Nº of systems
________
Percentage
________
h. How useful do you think is the implementation of this ser-
vice?
Why?
__________________________________________________
________________________________________________
1 2 3 4 5 1. Not at all useful – 2. Not very useful - 3.Somewhat useful –
4. Quite useful - 5. very useful

ITS MARKET RESEARCH
67
i. Main obstacles: please select the main obstacles that must be overcome to achieve the deployment of this
ITS and provide a comment what the obstacle is
[] Technical _________________________________
[] Legal _____________________________________
[] Political___________________________________
[] Social ____________________________________
[] Economic _________________________________
[] Other (specify)_____________________________
j. Success factors: please comment what are the reasons why you think this ITS will be successfully introduced
in your country
k. Please use the space below to provide any additional comments regarding your institution´s deployment of
this ITS.

ITS MARKET RESEARCH
68
4. VRU Beacon System
The VRU has a tag or device that sends out a signal that can be detected by a device in-
stalled in vehicles or infrastructure. This system calculates the trajectories of the detected
VRU, in relation with the vehicle trajectory and assesses the possibility of a collision. The
driver is then warned about the possible collision. Practical example: this system is current-
ly used in warehouses to prevent accidents between forklifts and pedestrians. The VRU has
a device transmitting C-ITS (cooperative traffic compliant) messages, which could be a
device fixedly installed on the VRU device or a smart-phone with a specific app. The receiv-
ing equipment and the collision assessment are installed in either vehicles or roadside in-
frastructure. The vehicle only warns the driver, no intervention.
a. Does your Administration have any plans to invest in this
system in the future?
Yes No
(If the answer is Yes please go to question d)
b. Would your authority consider investing in this system in
the future?
Yes No
(If the answer is Yes please go to question d)
c. Would your authority consider co-financing or facilitating
private investments in this system (by providing space for
roadside infrastructure) in the future?
Yes No
d. How many of these systems do you estimate there will
be installed in your city by 2020? (absolute nº of systems
and percentage to the total nº of pedestrian crossings in the
city)
Nº of systems
________
Percentage
________
e. How many of these systems do you estimate there will
be installed in your city by 2030?
Nº of systems
_______
Percentage
________
f. How many of these systems do you estimate there will be
in your country in 2020? (absolute nº of systems and per-
centage to the total nº of pedestrian crossings in the coun-
try)
Nº of systems
_______
Percentage
________
g. How many of these systems do you estimate there will be
in your country in 2030?
Nº of systems
________
Percentage
________

ITS MARKET RESEARCH
69
h. How useful do you think is the implementation of this
service?
Why?
_________________________________________________
_________________________________________________
_________________________________________________
_________________________________________________
1 2 3 4 5 1. Not at all useful – 2. Not very useful - 3.Somewhat useful – 4.
Quite useful - 5. very useful
i. Main obstacles: please select the main obstacles that must be overcome to achieve the deployment of this
ITS and provide a comment what the obstacle is
[] Technical _________________________________
[] Legal _____________________________________
[] Political___________________________________
[] Social ____________________________________
[] Economic _________________________________
[] Other (specify)_____________________________
j. Success factors: please comment what are the reasons why you think this ITS will be successfully introduced
in your country
k. Please use the space below to provide any additional comments regarding your institution´s deployment of
this ITS.

ITS MARKET RESEARCH
70
5. Information on vacancy on bicycle racks
The system provides information on the number of and closest
available parking spaces for bicycles.
Systems are today available (see e.g. Seattle, US) that are based
on a free phone app that allows users to quickly locate a nearby
city-installed bike rack. It’s described as fast, responsive and easy
to use (figure).
Next step is to inform the bicyclists if there is any free parking at
the specific location.
Suitable to be placed at for example: stations for public transport,
parking garages, work places, apartment buildings, shopping cen-
tres and hotels. In this study the focus is on a system integrated
with a locking system for the bike.
a. Does your Administration have any plans to invest in this
system in the future?
Yes No
(If the answer is Yes please go to question d)
b. Would your authority consider investing in this system in
the future?
Yes No
(If the answer is Yes please go to question d)
c. Would your authority consider co-financing or facilitating
private investments in this system in the future?
Yes No
d. How many cyclists do you estimate will have this system
in your city by 2020? (absolute nº of systems and percent-
age to the total nº of cyclists in the city)
Nº of systems
_________
Percentage
_________
e. How many cyclists do you estimate will have this system
in your city by 2030?
Nº of systems
__________
Percentage
________
f. How many cyclists do you estimate will have this system
in your country by 2020?
Nº of systems
__________
Percentage
_________
g. How many cyclists do you estimate will have this system
in your country by 2030?
Nº of systems
_________
Percentage
________

ITS MARKET RESEARCH
71
h. How useful do you think is the implementation of this
service?
Why?
_________________________________________________
_________________________________________________
_________________________________________________
_________________________________________________
1 2 3 4 5 1. Not at all useful – 2. Not very useful - 3.Somewhat useful – 4.
Quite useful - 5. very useful
i. Main obstacles: please select the main obstacles that must be overcome to achieve the deployment of this
ITS and provide a comment what the obstacle is
[] Technical _________________________________
[] Legal _____________________________________
[] Political___________________________________
[] Social ____________________________________
[] Economic _________________________________
[] Other (specify)_____________________________
j. Success factors: please comment what are the reasons why you think this ITS will be successfully introduced
in your country
k. Please use the space below to provide any additional comments regarding your institution´s deployment of
this ITS.
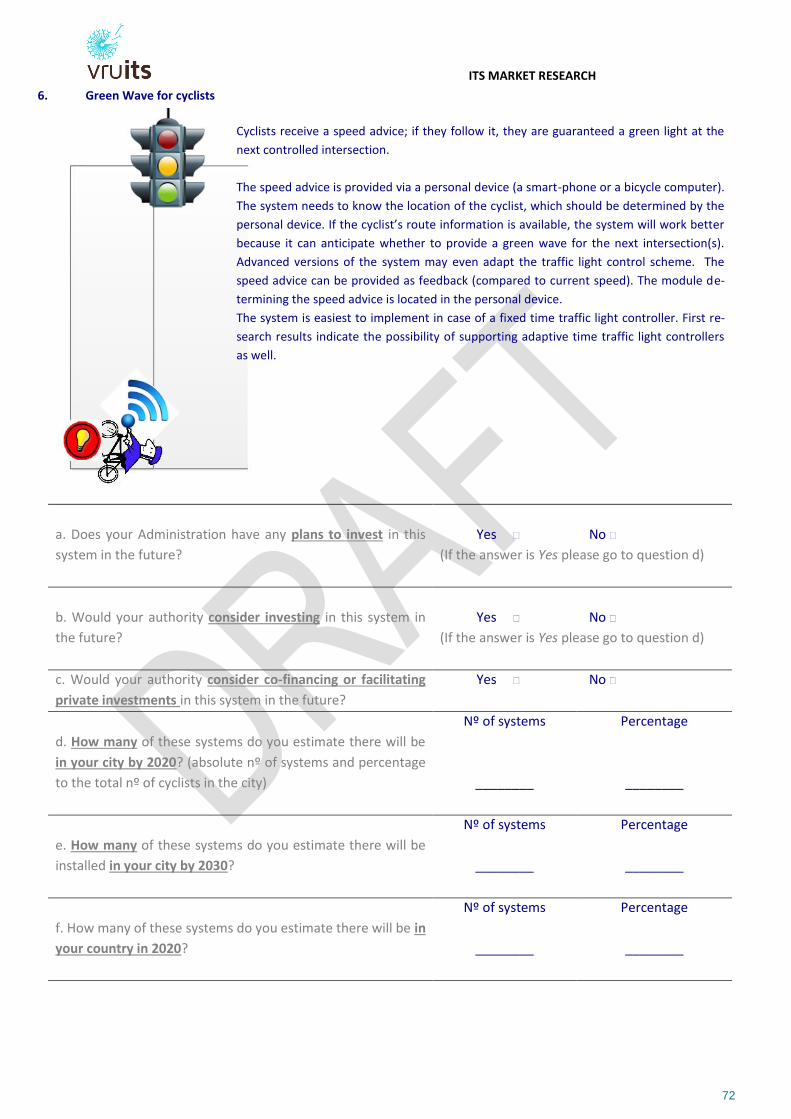
ITS MARKET RESEARCH
72
6. Green Wave for cyclists
Cyclists receive a speed advice; if they follow it, they are guaranteed a green light at the
next controlled intersection.
The speed advice is provided via a personal device (a smart-phone or a bicycle computer).
The system needs to know the location of the cyclist, which should be determined by the
personal device. If the cyclist’s route information is available, the system will work better
because it can anticipate whether to provide a green wave for the next intersection(s).
Advanced versions of the system may even adapt the traffic light control scheme. The
speed advice can be provided as feedback (compared to current speed). The module de-
termining the speed advice is located in the personal device.
The system is easiest to implement in case of a fixed time traffic light controller. First re-
search results indicate the possibility of supporting adaptive time traffic light controllers
as well.
a. Does your Administration have any plans to invest in this
system in the future?
Yes No
(If the answer is Yes please go to question d)
b. Would your authority consider investing in this system in
the future?
Yes No
(If the answer is Yes please go to question d)
c. Would your authority consider co-financing or facilitating
private investments in this system in the future?
Yes No
d. How many of these systems do you estimate there will be
in your city by 2020? (absolute nº of systems and percentage
to the total nº of cyclists in the city)
Nº of systems
________
Percentage
________
e. How many of these systems do you estimate there will be
installed in your city by 2030?
Nº of systems
________
Percentage
________
f. How many of these systems do you estimate there will be in
your country in 2020?
Nº of systems
________
Percentage
________

ITS MARKET RESEARCH
73
g. How many of these systems do you estimate there will be
in your country in 2030?
Nº of systems
________
Percentage
________
h. How useful do you think is the implementation of this ser-
vice?
Why?
__________________________________________________
__________________________________________________
__________________________________________________
__________________________________________________
1 2 3 4 5 1. Not at all useful – 2. Not very useful - 3.Somewhat useful – 4.
Quite useful - 5. very useful
i. Main obstacles: please select the main obstacles that must be overcome to achieve the deployment of this ITS
and provide a comment what the obstacle is
[] Technical _______________________________
[] Legal ___________________________________
[] Political_________________________________
[] Social ____________________________________
[] Economic _________________________________
[] Other (specify)_____________________________
j. Success factors: please comment what are the reasons why you think this ITS will be successfully introduced in
your country
k. Please use the space below to provide any additional comments regarding your institution´s deployment of
this ITS.
THANK YOU VERY MUCH FOR PARTICIPATING
ITS MARKET RESEARCH
74
A.2 Questionnaire for manufacturers
ITS Market Research Questionnaire for manufacturers
Dear participant,
This survey is designed to obtain data measuring the level of Intelligent Transportation System (ITS) deployment in Eu-
rope. The results of this survey will be used by the VRUITS project to establish the extent of ITS deployment in the follow-
ing years. More information about VRUITS can be found on our website: http://www.vruits.eu/
This survey shows a set of services in order to determine their feasibility, time frame for implementation, and the main
obstacles that must be overcome to achieve the deployment of ITS in European cities.
Your participation is very important to ensuring a complete and accurate tracking of ITS deployment in Europe.
Thank you for your assistance with this survey effort. Your cooperation is greatly appreciated.

ITS MARKET RESEARCH
75
Background Information
Job role/function: _________________________________
Company: _______________________________________
City: ____________________________________________
Country: ________________________________________

ITS MARKET RESEARCH
76
ITS Survey
Please, answer the items below by selecting for each item the option that best reflects your opinion.
1. VRU Beacon System
The VRU has a tag or device that sends out a signal that can be detected by a device installed in vehicles or infrastructure. This system
calculates the trajectories of the detected VRU, in relation with the vehicle trajectory and assesses the possibility of a collision.
The VRU has a device, which is able to transmit C-ITS (cooperative traffic) compliant messages. and the vehicle has a standard C-ITS
unit, which is able to receive the messages sent by VRUs. The receiving equipment and the collision assessment are installed in either
vehicles or roadside infrastructure. The vehicle only warns the driver, no intervention.
Vehicles with OEM systems Vehicles with retrofit / nomadic systems
a. How many passenger cars do you estimate will be equipped with
this system in your country by 2020? (absolute nº of systems and
percentage to the total nº of passenger cars)
Nº of systems
__________
Percentage
__________
Nº of systems
___________
Percentage
__________
Vehicles with OEM systems Vehicles with retrofit / nomadic systems
b. How many passenger cars do you estimate will be equipped with
this system in your country by 2030?
Nº of systems
____________
Percentage
___________
Nº of systems
____________
Percentage
___________
Pedestrians with Cooperative devices
c. How many pedestrians do you estimate will have this system in
your country by 2020? (absolute nº of pedestrians and percentage to
the total nº of pedestrians in the city)
Nº of systems
____________
Percentage
__________
Pedestrians with Cooperative devices

ITS MARKET RESEARCH
77
d. How many pedestrians do you estimate will have this system in
your country by 2030?
Nº of systems
___________
Percentage
___________
Bicycles with Cooperative devices
e. How many cyclists do you estimate will have this system in your
country by 2020?
Nº of systems
____________
Percentage
____________
f. How many cyclists do you estimate will have this system in your
country by 2030?
Nº of systems
____________
Percentage
____________
PTW´s (with Cooperative devices)
g. How many PTW´s do you estimate will have this system in your
country by 2020?
Nº of systems
____________
Percentage
____________
h. How many PTW´s do you estimate will have this system in your
country by 2030?
Nº of systems
____________
Percentage
____________
i. Main obstacles: please select the main obstacles that must be overcome to achieve the deployment of this ITS and provide a comment what the obstacle is
[] Technical __________________________________________________
[] Legal ______________________________________________________
[] Political ____________________________________________________
[] Social _____________________________________________________
[] Economic __________________________________________________
[] Other (specify) ______________________________________________
j. Success factors: please comment what are the reasons why you think this ITS will be successfully introduced in your country
k. Please use the space below to provide any additional comments regarding the deployment of this ITS in your country

ITS MARKET RESEARCH
78
2. Bicycle to car communication
Inform and warn cyclists of potential collisions with vehicles, and inform
the vehicle driver about cyclists on the road, in the vicinity of the vehi-
cle. Cyclists can receive information about oncoming vehicles and can be
warned about the risk of collisions, on their mobile device (smart-
phone).
The vehicle needs to be equipped with a standard C-ITS unit to send and
receive messages with bicyclists (i.e. the same equipment as for the VRU
beacon system)
Cyclists
a. How many cyclists do you estimate will have this system in
your country by 2020?
Nº of systems
________
Percentage
________
Cyclists
b. How many cyclists do you estimate will have this system in
your country by 2030?
Nº of systems
____________
Percentage
____________
c. Main obstacles: please select the main obstacles that must be overcome to achieve the deployment of this ITS
and provide a comment what the obstacle is
[] Technical __________________________________
[] Legal ___________________________________________
[] Political ________________________________________________
[] Social _____________________________________________________
[] Economic __________________________________________________
[] Other (specify) ______________________________________________
d. Success factors: please comment what are the reasons why you think this ITS will be successfully introduced in
your country
e. Please use the space below to provide any additional comments regarding the deployment of this ITS in your
country

ITS MARKET RESEARCH
79
3. PTW oncoming vehicle information system
The aim with Honda Advanced Safety Vehicle (ASV) is to help address
lapses of attention in ways that single-vehicle systems cannot. It is the
problem of visibility and awareness of motorcycles on the road that is
addressed, both from MC-driver-perspective and vehicle driver-
perspective. The following examples on how the system helps the
drivers are based on situations in Japan, i.e. left hand side traffic:
The drivers are focusing on traffic from one direction when travelling
through an intersection, and misses traffic/MC from different direc-
tions. The driver (both car driver and MC-driver) is informed about the
other vehicle, based on communication between the vehicles/MC.
Hence, both the car drivers and MC-drivers can slow down or change
their driving/steering to avoid the collision.
The vehicle is equipped with a standard C-ITS device.
a. How many PTW´s do you estimate will have this system in
your country by 2020? (absolute nº of PTW´s and percentage to
the total nº of PTW´s)
Number of PTW´s
_______
Percentage
________
b. How many PTW´s do you estimate will have this system in
your country by 2030?
Number of PTW´s
________
Percentage
________
c. How many passenger cars do you estimate will have this sys-
tem in your country by 2020?
Number of cars
________
Percentage
________
d. How many passenger cars do you estimate will have this sys-
tem in your country by 2030?
Number of cars
________
Percentage
________
e. Main obstacles: please select the main obstacles that must be overcome to achieve the deployment of this
ITS and provide a comment what the obstacle is
[] Technical ___________________________________
[] Legal _______________________________________
[] Political _____________________________________
[] Social ___________________________________
[] Economic ________________________________
[] Other (specify) ____________________________
f. Success factors: please comment what are the reasons why you think this ITS will be successfully introduced
in your country
g. Please use the space below to provide any additional comments regarding the deployment of this ITS in
your country

ITS MARKET RESEARCH
80
4. Information on vacancy on bicycle racks
The system provides information on the number of and closest available parking
spaces for bicycles.
Systems are today available (see e.g. Seattle, US) that are based on a free phone
app that allows users to quickly locate a nearby city-installed bike rack. It’s de-
scribed as fast, responsive and easy to use (figure).
Next step is to inform the bicyclists if there is any free parking at the specific loca-
tion.
Suitable to be placed at for example: stations for public transport, parking garages,
work places, apartment buildings, shopping centres and hotels. In this study the
focus is on a system integrated with a locking system for the bike.
a. How many cyclists do you estimate will have this system in
your country by 2020?
Nº of cyclists
___________
Percentage
____________
b. How many cyclists do you estimate will have this system in
your country by 2030?
Nº of cyclists
___________
Percentage
____________
c. Main obstacles: please select the main obstacles that must be overcome to achieve the deployment of this ITS
and provide a comment what the obstacle is
[] Technical _______________________________________
[] Legal __________________________________________
[] Political ________________________________________
[] Social ________________________________
[] Economic _____________________________
[] Other (specify) _________________________
d. Success factors: please comment what are the reasons why you think this ITS will be successfully introduced
in your country
e. Please use the space below to provide any additional comments regarding the deployment of this ITS in your
country
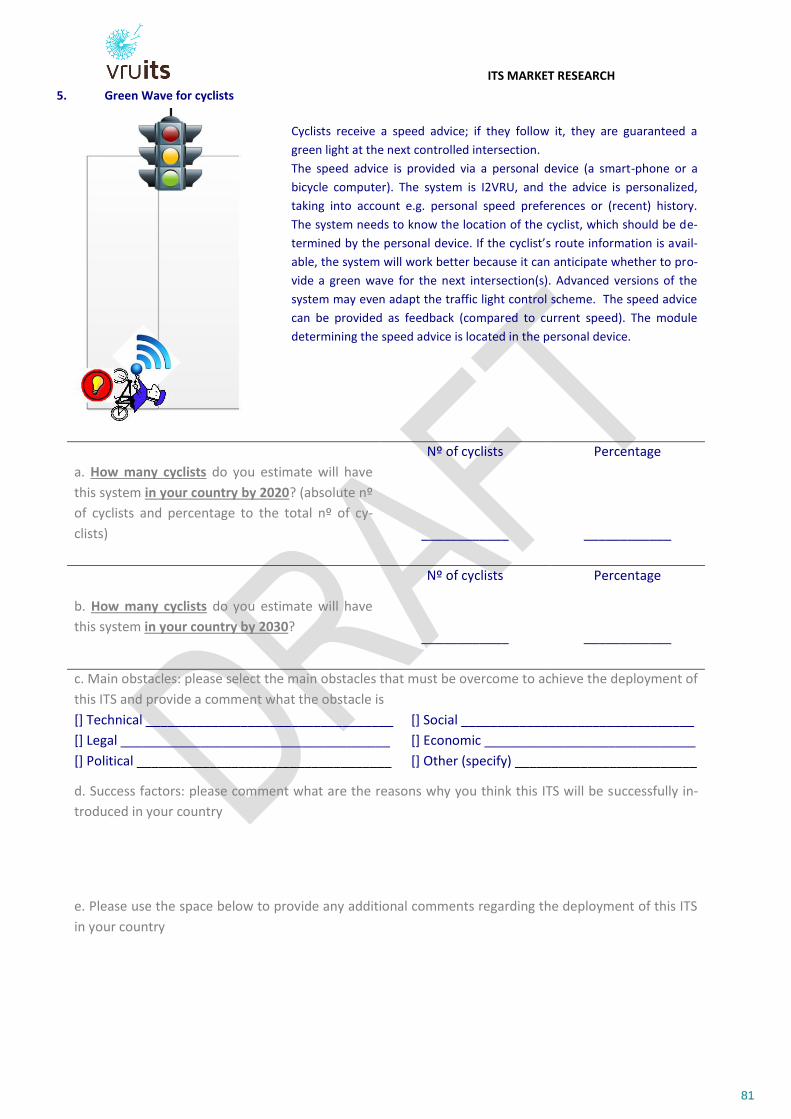
ITS MARKET RESEARCH
81
5. Green Wave for cyclists
Cyclists receive a speed advice; if they follow it, they are guaranteed a
green light at the next controlled intersection.
The speed advice is provided via a personal device (a smart-phone or a
bicycle computer). The system is I2VRU, and the advice is personalized,
taking into account e.g. personal speed preferences or (recent) history.
The system needs to know the location of the cyclist, which should be de-
termined by the personal device. If the cyclist’s route information is avail-
able, the system will work better because it can anticipate whether to pro-
vide a green wave for the next intersection(s). Advanced versions of the
system may even adapt the traffic light control scheme. The speed advice
can be provided as feedback (compared to current speed). The module
determining the speed advice is located in the personal device.
a. How many cyclists do you estimate will have
this system in your country by 2020? (absolute nº
of cyclists and percentage to the total nº of cy-
clists)
Nº of cyclists
____________
Percentage
____________
b. How many cyclists do you estimate will have
this system in your country by 2030?
Nº of cyclists
____________
Percentage
____________
c. Main obstacles: please select the main obstacles that must be overcome to achieve the deployment of
this ITS and provide a comment what the obstacle is
[] Technical __________________________________
[] Legal _____________________________________
[] Political ___________________________________
[] Social ________________________________
[] Economic _____________________________
[] Other (specify) _________________________
d. Success factors: please comment what are the reasons why you think this ITS will be successfully in-
troduced in your country
e. Please use the space below to provide any additional comments regarding the deployment of this ITS
in your country

ITS MARKET RESEARCH
82
6. Intersection Safety
Intersection Safety assists the driver and VRU in avoiding common mistakes which may lead to typical intersection accidents. It
covers these functions: left and right turn assistance and vehicles arriving perpendicular to VRUs at intersections.
For Left- and right-turning assistance, RSU detects the VRU, communicates this to the vehicle which is turning right or left into
the path of the VRU. The vehicle driver is informed; gets a warning or the vehicle begins to brake, depending on the urgency of
the situation. The roadside infrastructure also informs the VRU of a dangerous situation by e.g. flashing lights. And / or making
a sound.
The second function identifies a dangerous situation in which the vehicle drives perpendicular to the path of the VRU. The RSU
detects the VRU crossing the intersection. The RSU informs the vehicle about the presence of the VRU. The RSU also informs
the VRU (via flashing lights/ sound) about the presence of the on-coming vehicle.
Vehicles with OEM systems Vehicles with retrofit / nomadic systems
a. How many passenger cars do you estimate will be equipped
with this system in your country by 2020? (absolute nº of sys-
tems and percentage to the total nº of cars)
Nº of systems
____________
Percentage
____________
Nº of systems
____________
Percentage
____________
Vehicles with OEM systems Vehicles with retrofit / nomadic systems
b. How many passenger cars do you estimate will be equipped
with this system in your country by 2030?
Nº of systems
____________
Percentage
____________
Nº of systems
____________
Percentage
____________
Vehicles with OEM systems Vehicles with retrofit / nomadic systems
c. How many goods vehicles do you estimate will be equipped
with this system in your country by 2020?
Nº of systems
____________
Percentage
____________
Nº of systems
____________
Percentage
____________

ITS MARKET RESEARCH
83
Vehicles with OEM systems Vehicles with retrofit / nomadic systems
d. How many goods vehicles do you estimate will be equipped
with this system in your country by 2030?
Nº of systems
____________
Percentage
____________
Nº of systems
____________
Percentage
____________
Vehicles with OEM systems Vehicles with retrofit / nomadic systems
e. How many buses do you estimate will be equipped with this
system in your country by 2020?
Nº of systems
____________
Percentage
____________
Nº of systems
____________
Percentage
____________
Vehicles with OEM systems Vehicles with retrofit / nomadic systems
f. How many buses do you estimate will be equipped with this
system in your country by 2030?
Nº of systems
____________
Percentage
____________
Nº of systems
____________
Percentage
____________
i. Main obstacles: please select the main obstacles that must be overcome to achieve the deployment of this ITS and provide a comment what the obstacle is
[] Technical __________________________________________________
[] Legal ______________________________________________________
[] Political ____________________________________________________
[] Social ___________________________________________________________
[] Economic ________________________________________________________
[] Other (specify) ____________________________________________________
j. Success factors: please comment what are the reasons why you think this ITS will be successfully introduced in your country
k. Please use the space below to provide any additional comments regarding the deployment of this ITS in your country

ITS MARKET RESEARCH
84
7. Blind Spot Detection
Blind Spot Detection (BSD) system uses vehicle sensor technology to detect pedestrians, bicyclists and PTWs in blind spots round the vehicle
based on vehicle sensors (mainly addressing the side areas, optionally front and rear). After the detection of VRUs or other objects in the blind
spot of the vehicle the system provides a warning to the driver.
Vehicles with OEM systems Vehicles with retrofit / nomadic systems
a. How many passenger cars do you estimate will be equipped
with this system in your country by 2020? (absolute nº of sys-
tems and percentage to the total nº of cars)
Nº of systems
____________
Percentage
____________
Nº of systems
____________
Percentage
____________
Vehicles with OEM systems Vehicles with retrofit / nomadic systems
b. How many passenger cars do you estimate will be equipped
with this system in your country by 2030?
Nº of systems
____________
Percentage
____________
Nº of systems
____________
Percentage
____________
Vehicles with OEM systems Vehicles with retrofit / nomadic systems
c. How many goods vehicles do you estimate will be equipped
with this system in your country by 2020?
Nº of systems
____________
Percentage
____________
Nº of systems
____________
Percentage
____________
Vehicles with OEM systems Vehicles with retrofit / nomadic systems
d. How many goods vehicles do you estimate will be equipped
with this system in your country by 2030?
Nº of systems
____________
Percentage
____________
Nº of systems
____________
Percentage
____________

ITS MARKET RESEARCH
85
Vehicles with OEM systems
Vehicles with retrofit / nomadic systems
e. How many buses do you estimate will be equipped with this
system in your country by 2020?
Nº of systems
____________
Percentage
____________
Nº of systems
____________
Percentage
____________
Vehicles with OEM systems Vehicles with retrofit / nomadic systems
f. How many buses do you estimate will be equipped with this
system in your country by 2030?
Nº of systems
____________
Percentage
____________
Nº of systems
____________
Percentage
____________
g. Main obstacles: please select the main obstacles that must be overcome to achieve the deployment of this ITS and provide a comment what the obstacle is
[] Technical __________________________________________________
[] Legal ______________________________________________________
[] Political ____________________________________________________
[] Social ___________________________________________________________
[] Economic ________________________________________________________
[] Other (specify) ____________________________________________________
h. Success factors: please comment what are the reasons why you think this ITS will be successfully introduced in your country
i. Please use the space below to provide any additional comments regarding the deployment of this ITS in your country

86
8. Pedestrian Detection System + Emergency Braking
The vehicle has a built-in system that continuously scans for VRUs that
the vehicle might be in collision course with. If a crash is likely, the
system will warn the driver, for instance through sound, visual signals
or vibration of the steering wheel (there is also a variation of the sys-
tem that tightens the drivers’ seat belt, both as a warning and as a
safety feature). This system is working regardless the speed, but max-
imises its impact for lower speeds.
If the driver fails to respond in time, through steering away or through
braking, the system can intervene through braking. At low speeds this
variation system is intended to prevent a collision, at higher speeds
the system should reduce the impact of the crash.
a. How many passenger cars do you estimate will be equipped with
this system in your country by 2020? (absolute nº of systems and per-
centage to the total nº of passenger cars)
Nº of systems
____________
Percentage
____________
b. How many passenger cars do you estimate will be equipped with
this system in your country by 2030?
Nº of systems
____________
Percentage
____________
c. How many goods vehicles do you estimate will be equipped with
this system in your country by 2020?
Nº of systems
____________
Percentage
____________
d. How many goods vehicles do you estimate will be equipped with
this system in your country by 2030?
Nº of systems
____________
Percentage
____________
e. How many buses do you estimate will be equipped with this system
in your country by 2020?
Nº of systems
____________
Percentage
____________

87
f. How many buses do you estimate will be equipped with this system
in your country by 2030?
Nº of systems
____________
Percentage
____________
i. Main obstacles: please select the main obstacles that must be overcome to achieve the deployment of
this ITS and provide a comment what the obstacle is
[] Technical _______________________________________
[] Legal __________________________________________
[] Political ________________________________________
[] Social ______________________________
[] Economic ___________________________
[] Other (specify) ______________________
j. Success factors: please comment what are the reasons why you think this ITS will be successfully intro-
duced in your country
k. Please use the space below to provide any additional comments regarding the deployment of this ITS in
your country
THANK YOU VERY MUCH FOR PARTICIPATING

D2.3
Implementation Scenarios
Appendix B.
Vehicle park Europe-28
88
Appendix B. Vehicle park Europe-28
B.1 Vehicle Park

D2.3
Implementation Scenarios
Appendix B.
Vehicle park Europe-28
89
B.2 New registrations
B.2.1 Passenger cars new registration in Europe 2013

D2.3
Implementation Scenarios
Appendix B.
Vehicle park Europe-28
90
B.2.2 Light Commercial (up to 3.5t) Vehicles new registration in Europe 2013

D2.3
Implementation Scenarios
Appendix B.
Vehicle park Europe-28
91
B.2.3 Heavy Commercial Vehicles (over 3.5t) new registration in Europe 2013

D2.3
Implementation Scenarios
Appendix B.
Vehicle park Europe-28
92
B.2.4 Light Buses and Coaches (up to 3.5t) new registration in Europe 2013

D2.3
Implementation Scenarios
Appendix B.
Vehicle park Europe-28
93
B.2.5 Heavy Buses and Coaches (over 3.5t) new registration in Europe 2013
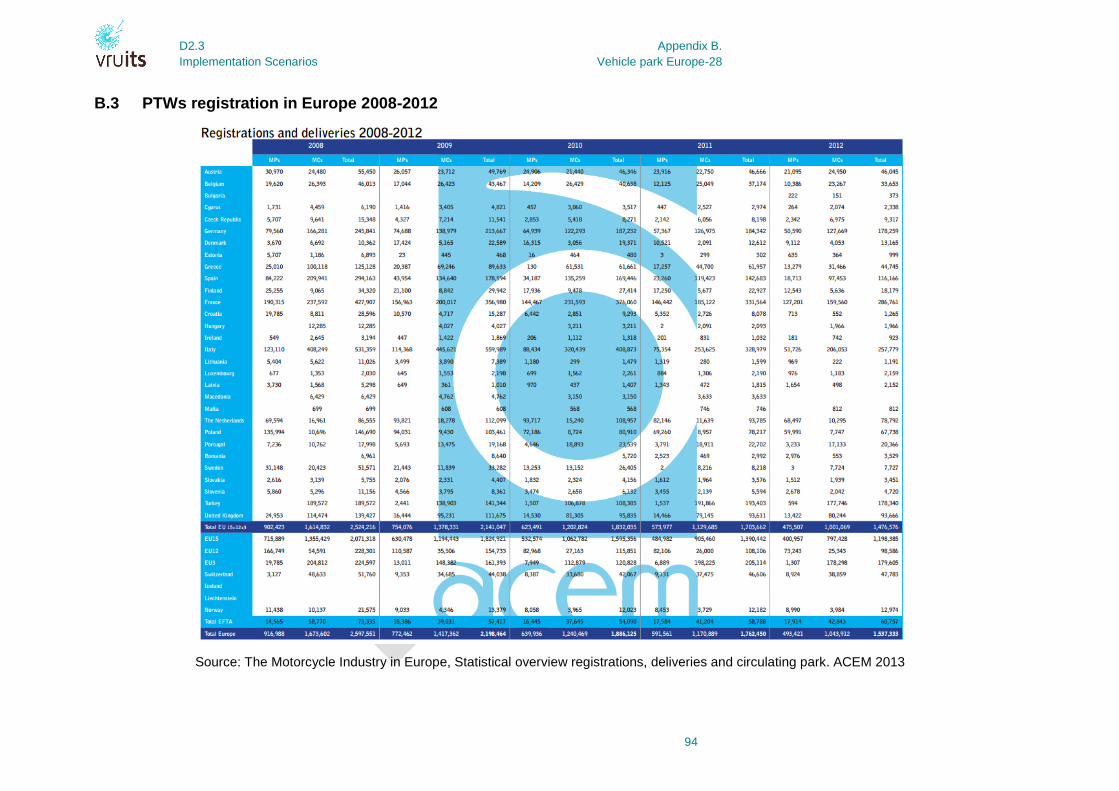
D2.3
Implementation Scenarios
Appendix B.
Vehicle park Europe-28
94
B.3 PTWs registration in Europe 2008-2012
Source: The Motorcycle Industry in Europe, Statistical overview registrations, deliveries and circulating park. ACEM 2013

D2.3
Implementation Scenarios
Appendix B.
Vehicle park Europe-28
95
B.4 Bicycle sales in Europe 2012
Source: EUROPEAN BICYCLE MARKET 2013 edition, Industry & Market Profile 2012 statistics, Colibi
& Coliped.

D2.3
Implementation Scenarios
Appendix C.
Mobility data – overview of available mobility survey data of
selected European countries
96
Appendix C. Mobility data – overview of available mobility survey data of selected European
countries
Country Name of survey (year) Source (web adress)
Germany MID-Mobilität in Deutsch-
land (2008)
Federal Ministry of Transport, Building and Urban Affairs
(http://www.mobilitaet-in-deutschland.de/pdf/MiD2008_Abschlussbericht_I.pdf)
Switzerland Mikrozensus (2005) Federal Office for Spatial Development ARE
(http://www.are.admin.ch/dokumentation/publikationen/00024/00419/index.html?lang=de&download=NHzLpZeg7t,lnp6I0NTU042l2
Z6ln1acy4Zn4Z2qZpnO2Yuq2Z6gpJCDfH5,fmym162epYbg2c_JjKbNoKSn6A--)
Finland National Travel Survey
(2010-2011)
Finish Transport Agency (http://portal.liikennevirasto.fi/portal/page/portal/C2F9146F42766086E040B40A1A01194A)
Sweden National Travel Survey
(2012-2013)
Transport Analysis – Official Statistics of Sweden
(http://www.trafa.se/PageDocuments/RVU_Sverige_2013.pdf)
Estonia No survey European Comission - Eurostat
(http://appsso.eurostat.ec.europa.eu/nui/show.do?dataset=tran_hv_psmod&lang=en)
Lithuania No survey European Comission - Eurostat
(http://appsso.eurostat.ec.europa.eu/nui/show.do?dataset=tran_hv_psmod&lang=en)
Latvia No survey European Comission - Eurostat
(http://appsso.eurostat.ec.europa.eu/nui/show.do?dataset=tran_hv_psmod&lang=en)
England/UK National Travel Survey
(2012)
Department for Transport
(https://www.gov.uk/government/statistics/national-travel-survey-2012)
Malta NHTSA (2010) Transport Malta
(http://www.transport.gov.mt/admin/uploads/media-library/files/NHTS2010%20Report.pdf_20120502091559.pdf)
Spain MOVILIA (2006-2007) Minesterio de Fomento
(http://www.fomento.gob.es/NR/rdonlyres/2D1D40A2-3417-4C74-AF3F-D22D3A161F96/110679/Movilia20062007.pdf)
Northern Ireland Travel Survey (2011-
2013)
Department for Regional Development
(http://www.drdni.gov.uk/tsni_headline_report_2011-2013.pdf)
The Netherlands Mobiliteitsonderzoek
(2007)
Modal split data from: Ministerie van Verkeer en Waterstaat
(http://www.fietsberaad.nl/library/repository/bestanden/CyclingintheNetherlands2009.pdf)

D2.3
Implementation Scenarios
Appendix C.
Mobility data – overview of available mobility survey data of
selected European countries
97
Germany
Modal split (base: trips)
Pedestrian 23%
Cyclist 10%
Motorized private transport (driver) 47%
Motorized private transport (passenger) 12%
Public transport 9%
Average length paths (km) (total: 11,5 km)
Pedestrian 1.4
Cyclist 3.2
Motorized private transport (driver) 14.7
Motorized private transport (passenger) 18.3
Public transport 12.3
Average path time (min) (total: 24 min)
Pedestrian 23
Cyclist 19
Motorized private transport (driver) 21
Motorized private transport (passenger) 25
Public transport 41
Trip purpose
Work 15%
Education 4%
Business 7%
Shopping 38%
Free time 35%

D2.3
Implementation Scenarios
Appendix C.
Mobility data – overview of available mobility survey data of
selected European countries
98
Modal spilt by age
Age Cyclist Pedestrian Motorized pri-vate transport (driver)
Motorized pri-vate transport (passenger)
Public transport
To 17 years 14% 29% 1% 41% 14%
18-29 years 8% 20% 47% 12% 13%
30-39 years 9% 21% 56% 8% 6%
40-49 years 9% 18% 59% 8% 5%
50-59 years 9% 20% 55% 10% 6%
60-64 years 11% 26% 47% 11% 5%
65-74 years 10% 32% 39% 12% 6%
Over 74 years 7% 38% 31% 12% 11%
Mobility parameters by age and gender
Age Number of trips per day Total travel time (min) Daily travel length (km)
male female male female male female
0-10 years 3 3 65 62 24 24
11-13 years 3 3 73 69 28 23
14-17 years 2.9 3.2 76 85 27 33
18-29 years 3.7 3.5 86 87 51 47
30-39 years 3.8 3.9 85 81 65 39
40-49 years 3.9 3.9 88 82 62 40
50-59 years 3.7 3.4 85 78 57 32
60-64 years 3.7 3.3 85 80 37 33
65-74 years 3.5 3 87 75 33 23
Older than 75 years 2.7 2 69 50 20 12
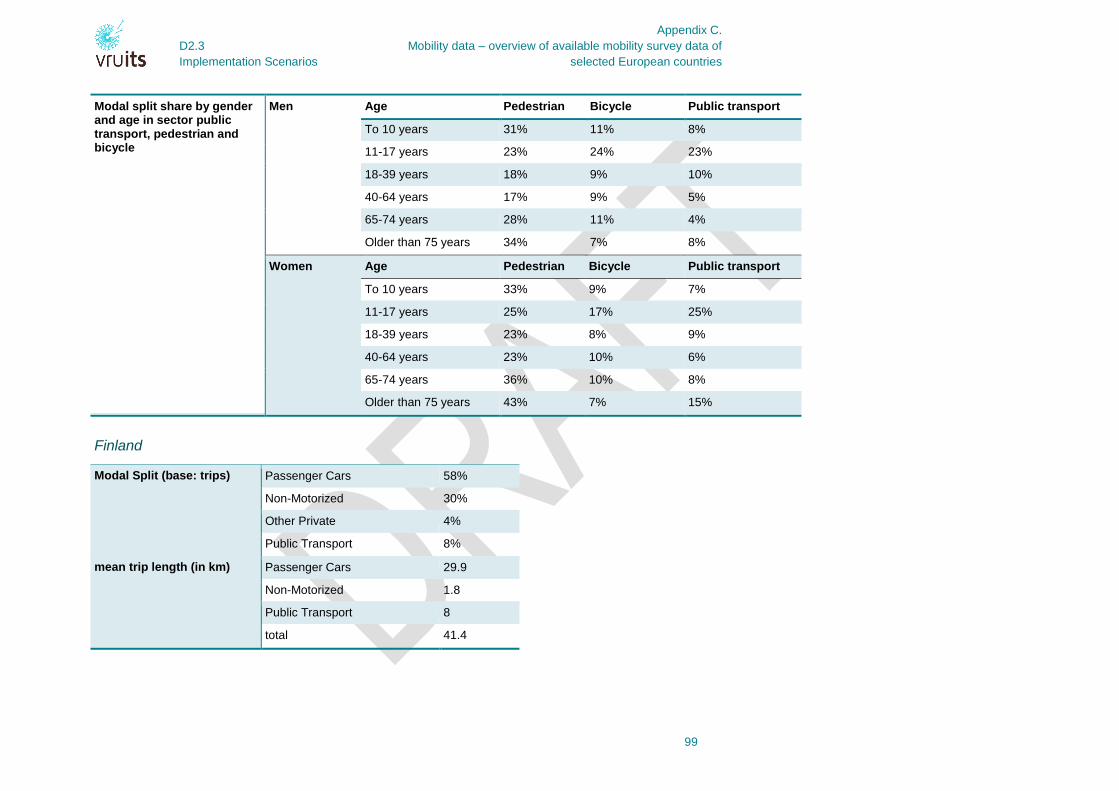
D2.3
Implementation Scenarios
Appendix C.
Mobility data – overview of available mobility survey data of
selected European countries
99
Modal split share by gender and age in sector public transport, pedestrian and bicycle
Men
Age Pedestrian Bicycle Public transport
To 10 years 31% 11% 8%
11-17 years 23% 24% 23%
18-39 years 18% 9% 10%
40-64 years 17% 9% 5%
65-74 years 28% 11% 4%
Older than 75 years 34% 7% 8%
Women
Age Pedestrian Bicycle Public transport
To 10 years 33% 9% 7%
11-17 years 25% 17% 25%
18-39 years 23% 8% 9%
40-64 years 23% 10% 6%
65-74 years 36% 10% 8%
Older than 75 years 43% 7% 15%
Finland
Modal Split (base: trips)
Passenger Cars 58%
Non-Motorized 30%
Other Private 4%
Public Transport 8%
mean trip length (in km)
Passenger Cars 29.9
Non-Motorized 1.8
Public Transport 8
total 41.4
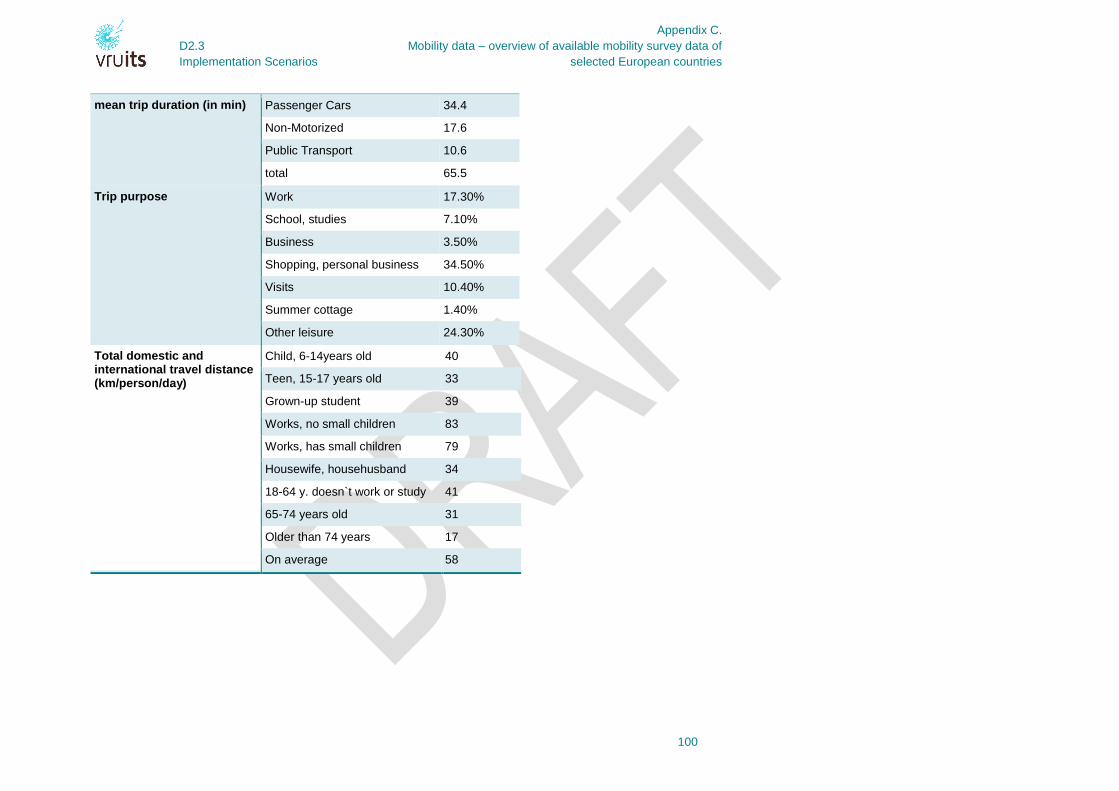
D2.3
Implementation Scenarios
Appendix C.
Mobility data – overview of available mobility survey data of
selected European countries
100
mean trip duration (in min)
Passenger Cars 34.4
Non-Motorized 17.6
Public Transport 10.6
total 65.5
Trip purpose
Work 17.30%
School, studies 7.10%
Business 3.50%
Shopping, personal business 34.50%
Visits 10.40%
Summer cottage 1.40%
Other leisure 24.30%
Total domestic and international travel distance (km/person/day)
Child, 6-14years old 40
Teen, 15-17 years old 33
Grown-up student 39
Works, no small children 83
Works, has small children 79
Housewife, househusband 34
18-64 y. doesn`t work or study 41
65-74 years old 31
Older than 74 years 17
On average 58

D2.3
Implementation Scenarios
Appendix C.
Mobility data – overview of available mobility survey data of
selected European countries
101
Sweden
Modal split (base: trips)
Foot,Bicycle 31.30%
Car 52.50%
Public Transport 12.30%
Other Mode of Travel 2.30%
No Information 1.60%
Total time travelled (min)
Foot,Bicycle 31
Car 44
Public Transport 63
Other Mode of Travel 106
Total distance travelled (km)
Foot,Bicycle 2.9
Public Transport 36
Other Mode of Travel 306
Trip purpose
By foot, bicycle Car Public transport
Other mode of travel
Information not available
All
Business, work and study-related
574 579 1 134 047 425 537 43 222 39 312 2 216 696
Service and shopping 163 892 389 318 37 898 6 178 5 217 602 502
Leisure 630 518 658 318 75 342 40 446 22 044 1 427 047
Other purpose 51 704 198 808 17 276 12 417 9 190 289 395
Information not available 0 990 335 295 0 1 620
All 1 420 691 2 381 861 556 387 102 557 75 763 4 537 258

D2.3
Implementation Scenarios
Appendix C.
Mobility data – overview of available mobility survey data of
selected European countries
102
Number of journeys per per-son and day by gender, age and main purpose
Male Business, work and study-related
Service and shopping
Leisure Other purpose Information not available
All
Age
6-14 years 0.9 0.06 0.5 0.07 0 1.53
15-24 years 0.91 0.1 0.43 0.11 0 1.56
25-34 years 0.84 0.16 0.44 0.1 0 1.57
35-44 years 0.95 0.16 0.41 0.07 0 1.63
45-54 years 0.94 0.21 0.48 0.07 0 1.72
55-64 years 0.75 0.21 0.45 0.09 0 1.52
65-74 years 0.13 0.32 0.65 0.18 0 1.28
0.03 0.28 0.51 0.14 0 0.96
All 0.74 0.18 0.48 0.1 0 1.52
Female Business, work and study-related
Service and shopping
Leisure Other purpose Information not available
All
Age
6-14 years 0.96 0.11 0.48 0.1 0 1.66
15-24 years 0.88 0.12 0.46 0.13 0 1.6
25-34 years 0.77 0.21 0.55 0.07 0 1.6
35-44 years 0.92 0.25 0.52 0.1 0 1.79
45-54 years 0.95 0.19 0.58 0.07 0 1.8
55-64 years 0.75 0.24 0.51 0.07 0 1.58
65-74 years 0.06 0.29 0.6 0.09 0 1.04
75-84 years 0 0.25 0.4 0.08 0 0.73
All 0.71 0.21 0.52 0.09 0 1.54
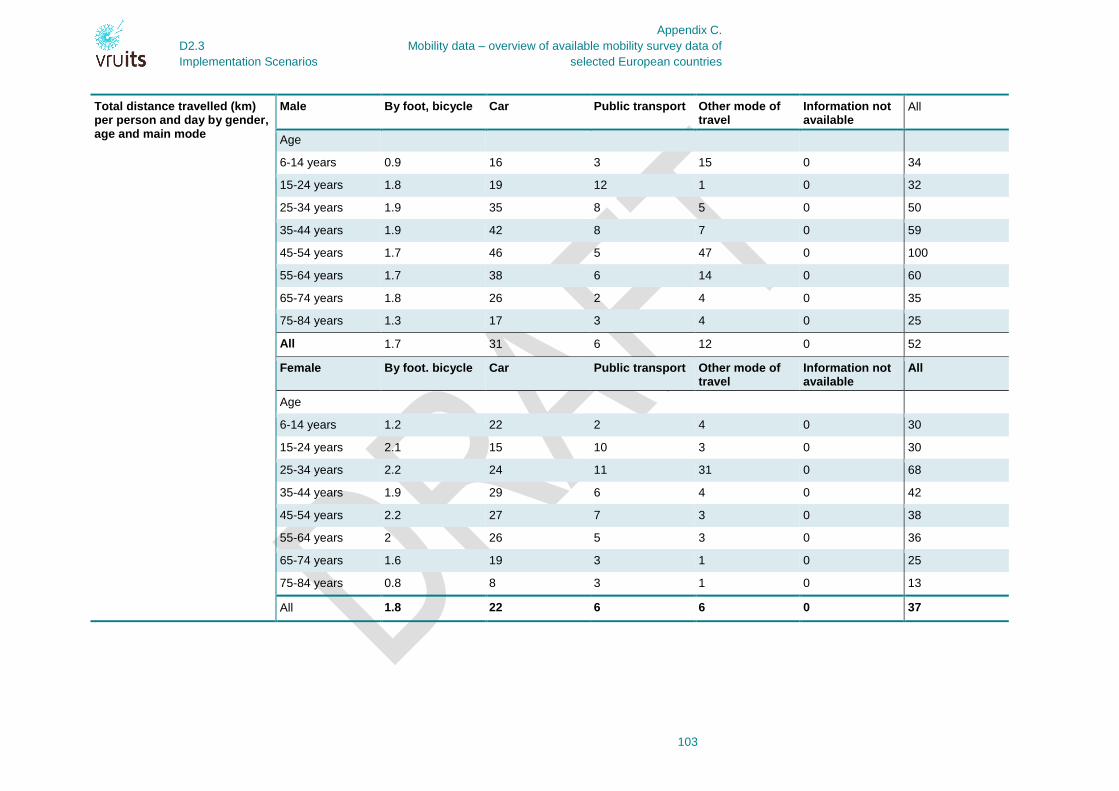
D2.3
Implementation Scenarios
Appendix C.
Mobility data – overview of available mobility survey data of
selected European countries
103
Total distance travelled (km) per person and day by gender, age and main mode
Male By foot, bicycle Car Public transport Other mode of travel
Information not available
All
Age
6-14 years 0.9 16 3 15 0 34
15-24 years 1.8 19 12 1 0 32
25-34 years 1.9 35 8 5 0 50
35-44 years 1.9 42 8 7 0 59
45-54 years 1.7 46 5 47 0 100
55-64 years 1.7 38 6 14 0 60
65-74 years 1.8 26 2 4 0 35
75-84 years 1.3 17 3 4 0 25
All 1.7 31 6 12 0 52
Female By foot. bicycle Car Public transport Other mode of travel
Information not available
All
Age
6-14 years 1.2 22 2 4 0 30
15-24 years 2.1 15 10 3 0 30
25-34 years 2.2 24 11 31 0 68
35-44 years 1.9 29 6 4 0 42
45-54 years 2.2 27 7 3 0 38
55-64 years 2 26 5 3 0 36
65-74 years 1.6 19 3 1 0 25
75-84 years 0.8 8 3 1 0 13
All 1.8 22 6 6 0 37

D2.3
Implementation Scenarios
Appendix C.
Mobility data – overview of available mobility survey data of
selected European countries
104
Switzerland
Modal split (base: trips)
Private transport 37.10%
Public transport 11.50%
Pedestrian and bicycle 50.20%
Other 1.20%
Distance travelled per person and day (km)
Private transport 26.2
Public transport 7.9
Pedestrian and bicycle 2.8
Other 1.2
Duration for travel (min)
Private transport 40.7
Public transport 11.1
Pedestrian and bicycle 44.4
Other 3.8
Mobility parameters per person and day
Average daily dis-tance
Average daily travel time
Average daily trips
Age
6-17 years 22.5 79.9 3.4
18-25 years 53 101.9 3.5
26-65 years 42.4 93 3.4
older than 66 years 21.2 70.1 2.4
male 43.9 96.1 3.4
female 31 81.1 3.2
Average 37.3 88.4 3.3

D2.3
Implementation Scenarios
Appendix C.
Mobility data – overview of available mobility survey data of
selected European countries
105
Trip purpose
Work 23.40%
Education 4.00%
Shopping 11.40%
Leisure 44.70%
Service and accompaniment 1.40%
Business 8.60%
Other 6.60%
UK
Modal split (base: trips)
Car (passenger) 22%
Walk 22%
Bus 6%
Rail 3%
Bicycle 2%
Other 2%
Trip purpose
Shopping 20%
Education 12%
Business 3%
Commuting 15%
Other leisure 15%
Visiting friends 15%
Other escort and personal business 19%

D2.3
Implementation Scenarios
Appendix C.
Mobility data – overview of available mobility survey data of
selected European countries
106
Average number of trips by age and main mode (trips per person per year)
Walk Bicycle Car (driver) Car (pas-senger)
Other private transport
Local and non-local buses
Rail Taxi/minicab Other public transport
Age
0-16 years 269 11 0 461 16 67 10 7 2
17-20 years 207 20 151 186 11 142 40 21 6
21-29 years 203 22 358 147 7 70 64 13 4
30-39 years 225 19 543 135 5 45 55 10 5
40-49 years 185 19 632 115 9 49 32 8 3
50-59 years 168 12 587 140 10 42 27 10 2
60-69 years 180 10 513 166 9 60 17 8 2
Older than 70 years
139 5 309 161 8 85 7 10 2

D2.3
Implementation Scenarios
Appendix C.
Mobility data – overview of available mobility survey data of
selected European countries
107
Average number of trips by age and main mode (trips per person per year) distin-guished by gen-der
Male Walk Bicycle Car (driver) Car (passen-ger)
Other private transport
Local and non-local buses
Rail Taxi/minicab Other public transport
Age
0-16 years 256 15 0 449 19 64 10 7 2
17-20 years 196 37 152 164 11 117 30 14 7
21-29 years 169 28 355 116 14 57 71 11 7
30-39 years 176 30 525 98 8 38 67 12 5
40-49 years 168 31 618 61 13 31 40 6 2
50-59 years 156 18 661 66 15 33 31 10 1
60-69 years 190 15 650 69 8 50 18 8 2
Older than 70 years
153 9 491 78 10 74 8 6 2
Female Walk Bicycle Car (driver) Car (passen-ger)
Other private transport
Local and non-local buses
Rail Taxi/minicab Other public transport
Age
0-16 years 282 6 0 474 13 69 9 8 1
17-20 years 219 3 149 208 11 168 51 29 4
21-29 years 237 15 362 178 1 84 57 14 2
30-39 years 272 9 561 172 2 52 43 9 4
40-49 years 201 8 646 166 6 67 23 10 4
50-59 years 180 6 514 213 4 50 23 10 3
60-69 years 171 5 383 258 9 69 16 9 1
Older than 70 years
129 3 166 226 7 93 6 13 2

D2.3
Implementation Scenarios
Appendix C.
Mobility data – overview of available mobility survey data of
selected European countries
108
The Netherlands
Modal split (base: trips)
Car 48%
Train 2%
Bus/Metro/Tram 3%
Walking 19%
Bicycle 26%
Trip purpose
Bicycle Pedestrian Car Other Total
Excursion 16% 59% 11% 6% 11%
Leisure and social 31% 14% 50% 6% 12%
Visit and overnight 21% 14% 60% 5% 14%
Education 50% 18% 18% 14% 9%
Shopping 28% 18% 49% 5% 20%
Service and personal care 18% 18% 55% 9% 4%
Busines 11% 3% 79% 7% 3%
Work 25% 4% 62% 10% 17%

D2.3
Implementation Scenarios
Appendix C.
Mobility data – overview of available mobility survey data of
selected European countries
109
Malta
Modal Split (base: trips)
Car Driver 59.40%
Car Passenger 15.20%
Bus 11.30%
Minibus/Coach 3.70%
Motorbike 1.10%
On Foot 7.60%
Other 1.70%
Time taken for trip in min
Car 19.3
Bus 33.5
Trip purpose (bus)
Visit someone 10.70%
Work place 16.50%
Work purposes 3.10%
Medical 6.20%
Private 13.90%
Shop 19.10%
Education 19.60%
Accompany child 0.60%
Other 10.30%

D2.3
Implementation Scenarios
Appendix D.
Comfort data – based on mobility and safety data
110
Appendix D. Comfort data – based on mobility and safety data
Comfort of cyclist based on mobility and safety data
Netherlands year
injured cyclists 2008 7 399 all injured person
killed cyclists 2008 145 7544
inhabitants 2008 16 500 000
injured cyclists per inhabitant 2008 0.000448424
killed cyclists per inhabitant 2008 8.78788E-06
modal share 2007 26%
average trips per day 2006 3.1
days a year 2006 365
trips per person per year with bike 2006-2008 294.19
total trips per year with bike in NL 2006-2008 4 854 135 000 average trips till a person will be injured or killed
average trips till an accident with injured P
2006-2008 656 053
average trips till an accident with killed P 2006-2008 33 476 793 643 443
Germany year
injured cyclists 2008 78 967 all injured person
killed cyclists 2008 456 79423
inhabitants 2008 82 002 000
injured cyclists per inhabitant 2008 0.000962989
killed cyclists per inhabitant 2008 5.56084E-06
modal share 2008 10%
average trips per day 2008 3.5
days a year 2008 366
trips per person per year with bike 2008 128.1
total trips per year with bike in DE 2008 10 504 456 200 average trips till a person will be injured or killed
average trips till an accident with injured P 2008 133 023
average trips till an accident with killed P 2008 23 036 088 132 260

D2.3
Implementation Scenarios
Appendix D.
Comfort data – based on mobility and safety data
111
United Kingdom year
injured cyclists 2008 16 389 all injured person
killed cyclists 2008 117 16 506
inhabitants 2008 62 000 000
injured cyclists per inhabitant 2008 0.000264339
killed cyclists per inhabitant 2008 1.8871E-06
modal share 2008 2%
average trips per day 2008 2.71
days a year 2008 366
trips per person per year with bike 2008 19.8372
total trips per year with bike in UK 2008 1 229 906 400 average trips till a person will be injured or killed
average trips till an accident with injured P
2008 75 045
average trips till an accident with killed P 2008 10 512 021 74 513
Estonia year
injured cyclists 2008 139 all injured person
killed cyclists 2008 9 148
inhabitants 2008 1 340 000
injured cyclists per inhabitant 2008 0.000103731
killed cyclists per inhabitant 2008 6.71642E-06
modal share 2012 4%
average trips per day ??? 3
days a year ??? 365
trips per person per year with bike 2008-2012 42.705
total trips per year with bike in EE 2008-2012 57 224 700 average trips till a person will be injured or killed
average trips till an accident with injured P
2008-2012 411 688
average trips till an accident with killed P 2008-2012 6 358 300 386 653

D2.3
Implementation Scenarios
Appendix D.
Comfort data – based on mobility and safety data
112
Comfort of pedestrians based on mobility and safety data
Netherlands year
injured pedestrian 2008 1 499 all injured person
killed pedestrian 2008 56 1555
inhabitants 2008 16 500 000
injured pedestrian per inhabitant 2008 9.08485E-05
killed pedestrian per inhabitant 2008 3.39394E-06
modal share 2007 19%
average trips per day 2006 3.1
days a year 2006 365
pedestrian trips per person per year 2006-2008 214.985
total pedestrian trips per year in NL 2006-2008 3 547 252 500 average trips till a person will be injured or killed
average trips till an accident with injured P 2006-2008 2 366 413
average trips till an accident with killed P 2006-2008 63 343 795 2 281 191
Germany year
injured pedestrian 2008 32 770 all injured person
killed pedestrian 2008 653 33423
inhabitants 2008 82 002 000
injured pedestrian per inhabitant 2008 0.000399624
killed pedestrian per inhabitant 2008 7.96322E-06
modal share 2008 23%
average trips per day 2008 3.5
days a year 2008 366
pedestrian trips per person per year 2008 294.63
total pedstrian trips per year in DE 2008 24 160 249 260 average trips till a person will be injured or killed
average trips till an accident with injured P
2008 737 267
average trips till an accident with killed P 2008 36 998 850 722 863
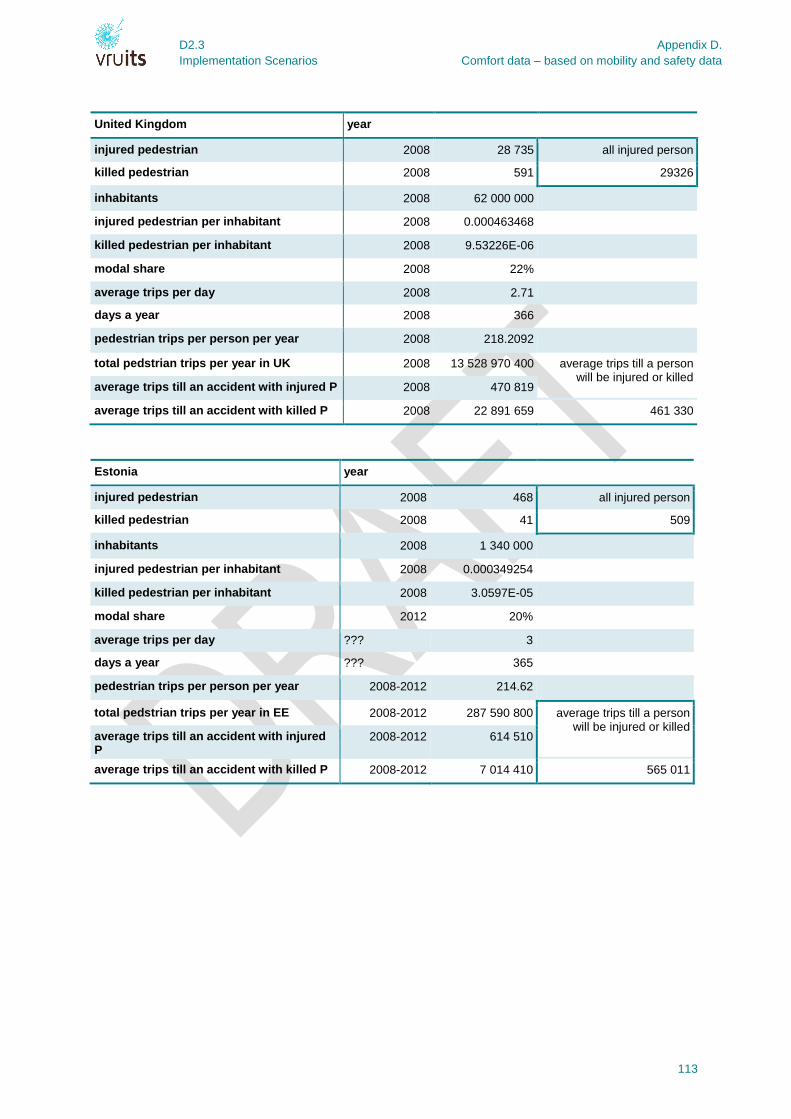
D2.3
Implementation Scenarios
Appendix D.
Comfort data – based on mobility and safety data
113
United Kingdom year
injured pedestrian 2008 28 735 all injured person
killed pedestrian 2008 591 29326
inhabitants 2008 62 000 000
injured pedestrian per inhabitant 2008 0.000463468
killed pedestrian per inhabitant 2008 9.53226E-06
modal share 2008 22%
average trips per day 2008 2.71
days a year 2008 366
pedestrian trips per person per year 2008 218.2092
total pedstrian trips per year in UK 2008 13 528 970 400 average trips till a person will be injured or killed
average trips till an accident with injured P 2008 470 819
average trips till an accident with killed P 2008 22 891 659 461 330
Estonia year
injured pedestrian 2008 468 all injured person
killed pedestrian 2008 41 509
inhabitants 2008 1 340 000
injured pedestrian per inhabitant 2008 0.000349254
killed pedestrian per inhabitant 2008 3.0597E-05
modal share 2012 20%
average trips per day ??? 3
days a year ??? 365
pedestrian trips per person per year 2008-2012 214.62
total pedstrian trips per year in EE 2008-2012 287 590 800 average trips till a person will be injured or killed
average trips till an accident with injured P
2008-2012 614 510
average trips till an accident with killed P 2008-2012 7 014 410 565 011
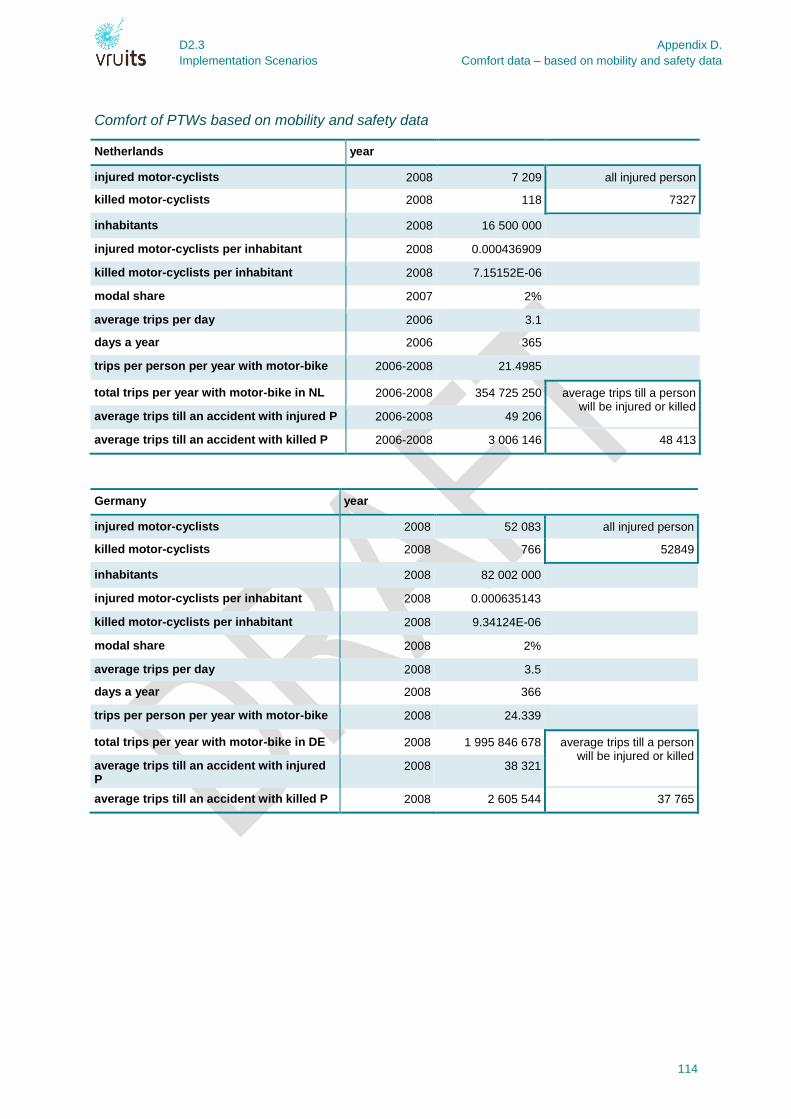
D2.3
Implementation Scenarios
Appendix D.
Comfort data – based on mobility and safety data
114
Comfort of PTWs based on mobility and safety data
Netherlands year
injured motor-cyclists 2008 7 209 all injured person
killed motor-cyclists 2008 118 7327
inhabitants 2008 16 500 000
injured motor-cyclists per inhabitant 2008 0.000436909
killed motor-cyclists per inhabitant 2008 7.15152E-06
modal share 2007 2%
average trips per day 2006 3.1
days a year 2006 365
trips per person per year with motor-bike 2006-2008 21.4985
total trips per year with motor-bike in NL 2006-2008 354 725 250 average trips till a person will be injured or killed
average trips till an accident with injured P 2006-2008 49 206
average trips till an accident with killed P 2006-2008 3 006 146 48 413
Germany year
injured motor-cyclists 2008 52 083 all injured person
killed motor-cyclists 2008 766 52849
inhabitants 2008 82 002 000
injured motor-cyclists per inhabitant 2008 0.000635143
killed motor-cyclists per inhabitant 2008 9.34124E-06
modal share 2008 2%
average trips per day 2008 3.5
days a year 2008 366
trips per person per year with motor-bike 2008 24.339
total trips per year with motor-bike in DE 2008 1 995 846 678 average trips till a person will be injured or killed
average trips till an accident with injured P
2008 38 321
average trips till an accident with killed P 2008 2 605 544 37 765

D2.3
Implementation Scenarios
Appendix D.
Comfort data – based on mobility and safety data
115
United Kingdom year
injured motor-cyclists 2008 21 522 all injured person
killed motor-cyclists 2008 509 22031
inhabitants 2008 62 000 000
injured motor-cyclists per inhabitant 2008 0.000347129
killed motor-cyclists per inhabitant 2008 8.20968E-06
modal share 2008 2%
average trips per day 2008 2.71
days a year 2008 366
trips per person per year with motor-bike 2008 18.84534
total trips per year with motor-bike in UK 2008 1 168 411 080 average trips till a person will be injured or killed
average trips till an accident with injured P 2008 54 289
average trips till an accident with killed P 2008 2 295 503 53 035
Estonia year
injured motor-cyclists 2008 224 all injured person
killed motor-cyclists 2008 7 231
inhabitants 2008 1 340 000
injured motor-cyclists per inhabitant 2008 0.000167164
killed motor-cyclists per inhabitant 2008 5.22388E-06
modal share 2012 2%
average trips per day ??? 3
days a year ??? 365
trips per person per year with motor-bike 2008-2012 20.805
total trips per year with motor-bike in EE 2008-2012 27 878 700 average trips till a person will be injured or killed
average trips till an accident with injured P
2008-2012 124 458
average trips till an accident with killed P 2008-2012 3 982 671 120 687