Embed Size (px)
Citation preview

PEER-REVIEWED ARTICLE bioresources.com
Tang et al. (2015). “Coal/cotton stalk pyrolysis,” BioResources 10(4), 7667-7680. 7667
Improving the Yield and Quality of Tar during Co-pyrolysis of Coal and Cotton Stalk
Chuyang Tang,a, b Dexiang Zhang,a, * and Xilan Lu a
Co-pyrolysis of Shenmu coal (SM) and cotton stalk (CS) at different blend ratios were carried out in a tubular furnace. The pyrolysis temperature was up to 600 °C at 5 °C/min and kept for 15 min. The results indicated that there was an interactive effect between SM and CS, which increased the tar yield. Moreover, the content of light components in co-pyrolysis tar from all CS/SM blend ratios was higher than that in the tar derived from SM pyrolysis. This interaction not only increased tar yields but also upgraded the quality of tar in the co-pyrolysis process. Compared with the co-pyrolysis of de-ashed CS and SM, the inherent minerals of CS had great effects on the co-pyrolysis tar yield. The analysis results of n-hexane soluble extracted from co-pyrolysis tar by gas chromatography/mass spectrometry indicated that the organic matters of CS had a significant effect on the alkene formation of tar during co-pyrolysis. The maximal tar yield was 13.73 wt% (daf) and the yield of n-hexane soluble reached 11.13 wt% (daf) under optimum conditions.
Keywords: Tar; Cotton stalk; Coal; Co-pyrolysis; Alkanes formation
Contact information: a: School of Resource and Environmental Engineering, East China University of
Science and Technology, Key Laboratory of Coal Gasification and Energy Chemical Engineering of
Ministry of Education, 130#, Meilong Road, Shanghai 200237, PR China; b: School of Architecture and
Construction, University of Science and Technology LiaoNing, 185#, Qianshan Road, Liaoning Province
114051, PR China; *Corresponding author: [email protected]
INTRODUCTION
As cotton-producing areas, the central and western regions of China have a large
supply of biomass resources. The coal resources of the region are abundant; at present, coal
is the main feedstock used for power generation in China. Cotton stalk agricultural residues
are traditionally burned to directly generate energy. The direct combustion of coal and
cotton stalk is inefficient and causes many health problems for human beings and
significant damage to other creatures (Kolari et al. 2012). Thus, the co-utilization of coal
and local biomass resources is beneficial to lower fossil fuel costs, CO2 emissions, and
transportation costs. Co-pyrolysis is a feasible methods to produce liquid fuels and high
added-value chemicals.
Biomass and coal have different structures and constituents. These differences in
properties lead to individual reactivity and thermal characteristics during co-pyrolysis. The
pyrolysis of coal starts with thermal cleavage of covalent bonds to generate volatile radical
fragments (He et al. 2014). Biomass has a much higher pyrolysis rate and its pyrolysis
mostly occur within a narrow temperature range of 200 to 375 °C (Vassilev et al. 2010;
Cheng et al. 2014). Due to the high hydrogen and carbon molar ratio, biomass may provide
free radicals to stabilize the large radical fragments that result from the cleavage of coal
during co-pyrolysis (Soncini et al. 2013).
PEER-REVIEWED ARTICLE bioresources.com
Tang et al. (2015). “Coal/cotton stalk pyrolysis,” BioResources 10(4), 7667-7680. 7668
Some studies have investigated the transfer of biomass volatiles to the coal structure
resulting in improving the decomposition of coal (Sonobe et al. 2008; Krerkkaiwan et al.
2013). Li et al. (2013) reported that biomass promoted secondary reactions of co-pyrolysis.
Yang et al. (2014) found that the addition of biomass decreased the tar yield and influenced
tar composition during co-pyrolysis. However, there still has been controversy about the
synergy effect (Weiland et al. 2012; Kirtania and Bhattacharya 2013). Besides, some
studies showed that minerals had positive effects in the thermal decomposition of biomass
and coal. Wei et al. (2011) indicated that biomass with high holocellulose and ash content
produced more hydrogen during pyrolysis. Alkali composition was also associated with a
decrease the initial reaction temperature and an improvement in the thermal decomposition
of biomass (Shimada et al. 2008). Some studies documented that alkali metals such as
K2CO3, CaO, and Al2O3 showed positive effects on the reactivity and kinetic characteristics
of coal pyrolysis (Liu et al. 2004; Abbasi-Atibeh and Yozgatligil 2014). Mourant et al.
(2011) indicated that the removal of alkaline earth metallic species decreased the light
organic compounds of bio-oil on biomass pyrolysis. Most of the previous studies focused
on the causes of synergy effects. These works provide lots of worthy references for the
research of co-pyrolysis. Nevertheless, the literature about the effect factors of tar yield
and quality are still rare.
In the present work, pyrolysis tests of Shenmu coal (SM), cotton stalk (CS), and
their blend were carried out in a tubular furnace. Tar quality was determined by the content
of n-hexane soluble in the tar. The co-pyrolysis of de-ashed cotton stalk (DACS)/SM and
K2CO3/SM were used to investigate the different effects of organic matters and minerals
in CS on the tar yields. The components of n-hexane soluble were further measured and
compared the quality of tar derived from SM, CS/SM, and DACS/SM.
EXPERIMENTAL
Materials The Shenmu coal (SM) sample was low grade, low ash, and high volatile
bituminous coal from Shanxi province China. Cotton stalk (CS) was obtained from local
farms. The air-dried samples were milled and sieved to obtain fractions of particle size less
than 180 μm in diameter for both SM and CS. The samples were dried at 105 °C for 2 h
and then stored in a desiccator. CS/SM blends were prepared by physical mixing at biomass
and coal weight ratios of 5/100, 10/100, 15/100, 20/100, 25/100, 30/100, and 50/100,
respectively. Ultimate analysis was determined by a Macro Cube (Elementar, Germany).
The properties of SM and CS were presented in Table 1. The relative error obtained by
reproducing three times the same experiment, equal ±2%.
Methods De-ashing treatment
Briefly, the de-ashing treatments of CS consist of acid washing. The samples of CS
were occasionally stirred and soaked with 15 wt% HCl solution and 15 wt% HF solution
at 70 °C for 24 h in sequence. Then, the resulting solid was filtered and washed with
distilled water until the filtrate was neutral (Das et al. 2004). Finally, the solid matter was
air dried and then stored in a desiccator. Ashing temperature of the de-ashing CS (DACS)
was set at 575 °C according to ASTM E1755. The ash percentage of DACS was reduced
to as low as 0.39 wt%. Table 1 lists the proximate and ultimate analyses of DACS.

PEER-REVIEWED ARTICLE bioresources.com
Tang et al. (2015). “Coal/cotton stalk pyrolysis,” BioResources 10(4), 7667-7680. 7669
Table 1. Proximate and Ultimate Analyses of the Samples Sample SM CS DACS
Proximate analysis (wt.%)
Moisture (ada) 3.78 2.31 4.97
Ash (da) 8.63 4.13 0.39
Volatile Matter (dafa) 37.97 78.88 38.37
Fixed Carbon (daf) 62.03 21.12 61.63
Ultimate analysis (wt%, daf)
Carbon, C 84.24 48.11 60.82
Hydrogen, H 5.49 6.02 4.23
Nitrogen, N 1.08 0.98 0.43
Sulfur, S 0.32 0.19 0.19
Oxygen, O (diffb) 8.88 44.70 34.34 a ad= air dried basis, d= dry basis, daf= dry and ash free basis b Calculated by difference
Apparatus and methods
The co-pyrolysis was performed in a tubular furnace (Nasren GDL-B-II, China),
and its schematic diagram is shown in Fig. 1. The tubular furnace was made of cast copper.
Five 1 kW electric heaters were installed inside the furnace to heat the quartz tubular
reactor to the desired temperature. The thermocouple was close to the reactor in order to
measure the heating temperature accurately. For every experimental run, about 10 g of the
sample was fed into the tubular reactor. Thereafter the reactor was pushed into the furnace
and heated to 600 °C at a rate of 5 °C/min and then kept for 15 min. The condenser was
immersed in an ice-water bath to keep the expected cooling conditions near 0 °C. The
volatiles released from the sample were cooled in a condenser in series to collect the
condensable components.
Fig. 1. Schematic diagram of the pyrolysis apparatus. 1. Heating control; 2. Temperature regulation; 3. Bolt electric heaters; 4. Thermocouple; 5. Samples; 6. Tubular reactor; 7. Asbestos wool; 8. Plain bend; 9. Gas bag; 10. Condenser; 11. Ice bath
EXIT
USB
9
1
4
2
5 6 7
3
8
1011

PEER-REVIEWED ARTICLE bioresources.com
Tang et al. (2015). “Coal/cotton stalk pyrolysis,” BioResources 10(4), 7667-7680. 7670
The liquid products in the reactor, condenser, and pipeline were recovered by
washing with acetone (AR grade) as a solvent into a round-bottom flask. The liquid (tar
and water) yield of pyrolysis was determined by the mass difference of the condenser,
reactor, and pipeline before and after washing. The char yield was determined by weighing
the amount of the solid residues in the reactor after the liquid product was washed. A rotary
evaporator was used to remove the acetone from the obtained washing liquid. The
appropriate amount of n-hexane was then added into the round bottom flask to extract light
components (n-hexane soluble) from the residue consisting of tar and water according to a
standard method (ASTM D91-02 2012). Finally, the water was separated from n-hexane
insoluble by reduced pressure evaporation. Meanwhile, a parallel experiment of co-
pyrolysis was carried out and the water was washed subsequently by toluene (AR grade)
from the condenser, reactor, and pipeline.
The total water yield was measured by toluene entrainment method (ASTM D4006-
11 2012). The pyrolytic water yield was determined by the total water yield and proximate
analyses of SM and CS. The tar yield was the difference value of the liquid yield and the
water yield. The n-hexane soluble yield was equal to the tar yield minus the n-hexane
insoluble yield in tar. The statistical analyses of the data obtained by co-pyrolysis showed
that the maximum relative error of tar yield and char yield were ±2.4% and ±2.2%,
respectively.
Analytical instruments and procedure
A thermogravimetric analyser of TG-DTA/DSC (Setaram, France) was used to
investigate the pyrolysis characteristics of SM and CS. During the heating process, the
samples were heated up to 1000 °C at 5 °C/min. High-purity nitrogen was used as the purge
gas and the flow rate was kept constant at 60 mL/min. The results are shown in Fig. 2. The
mineral composition of CS ash was analyzed by X-Ray Fluorescence (Shimadzu XRF-
1800, Japan). The CS ash was obtained from the CS ashing according to ASTM E1755.
The XRF results of CS ash are listed in Table 2. The compounds in the n-hexane soluble
extracted from the pyrolysis tar were characterized by GC-MS (Agilent 5975C, USA).
High-purity helium was chosen as the carrier gas. The content of each compound in the n-
hexane soluble was calculated as the relative peak area against the total peak area,
excluding that of solvent, in the total ion chromatogram of GC-MS. The yield of each
compound was defined as the mass percentages of the product against the mass of the dry
and ash free test sample.
Table 2. XRF Results of CS Ash (Wt.%)
Sample K2O CaO MgO SiO2 P2O5 Na2O Al2O3 Fe2O3
Ash of CS 28.36 21.04 10.63 10.20 8.64 4.86 2.36 1.81
RESULTS AND DISCUSSION TG Analyses of SM and CS
The TGA and DTG curves of SM and CS are shown in Fig. 2. The initial thermal
decomposition (T1) of SM was at about 380 °C, and the maximal pyrolysis rate was found
to be 0.0567 mg/min at 437 °C. A major loss of weight, i.e., the main devolatilization,
occurred between 380 °C and 510 °C. The devolatilization of SM was essentially

PEER-REVIEWED ARTICLE bioresources.com
Tang et al. (2015). “Coal/cotton stalk pyrolysis,” BioResources 10(4), 7667-7680. 7671
completed by about 550 °C. The T1 of CS started at approximately 260 °C. The maximal
pyrolysis rate of CS (0.2162 mg/min) occurred at 310 °C. The weight loss of CS was
mainly seen within the temperature range of 260 to 340 °C. After 450 °C, the weight loss
rate of CS eventually became constant. It was observed that the maximal pyrolysis rate of
CS was higher than that of SM. Compared with SM, the decomposition of CS mainly
occurred in a range of 200 to 400 °C because the cellulose and lignin of CS, which are
linked together with relatively weak ether bones, will be broken at lower temperatures
(Zhang et al. 2012, 2013).
Fig. 2. TGA and DTG curves of SM and CS (heating rate 5 °C/min)
Pyrolytic Characteristics of SM, CS, and DACS The distribution of pyrolysis products for SM, CS, and DACS in the tubular furnace
are listed in Table 3. CS pyrolysis had the maximal tar yield, water yield, and n-hexane
soluble yield of 19.46 wt% (daf), 26.84 wt% (daf), and 10.74 wt% (daf), respectively. CS
pyrolysis produced more tar and n-hexane soluble than SM pyrolysis. The water yield of
SM pyrolysis was 6.10 wt% (daf). The water yield of CS pyrolysis was much higher than
that of SM pyrolysis due to the higher oxygen content of CS. The char yield of CS pyrolysis
was lower than that of SM pyrolysis corresponding to the proximate results of CS and SM.
Table 3. Product Distribution for Pyrolysis of SM, CS and DACS (Wt.%, Daf)
Samples Tar Water Char n-hexane soluble
SM 11.78 6.10 73.92 8.18
CS 19.46 26.84 29.21 10.74
DACS 9.59 11.66 53.63 8.74
PEER-REVIEWED ARTICLE bioresources.com
Tang et al. (2015). “Coal/cotton stalk pyrolysis,” BioResources 10(4), 7667-7680. 7672
As shown in Table 3, the tar and n-hexane soluble yield of DACS pyrolysis were
9.59 wt% (daf) and 8.74 wt% (daf), which were obviously lower than those of CS pyrolysis
because of the de-ashed treatment. The water yield of DACS pyrolysis was 11.66 wt%
(daf), lower than that of SM pyrolysis. Compared with the CS pyrolysis products, DACS
pyrolysis produced less water and more char. The results showed that the inherent minerals
in CS evidently promoted CS decomposition to increase the yields of tar and n-hexane
soluble during CS pyrolysis.
Co-pyrolytic Characteristics To determine the interactive effects that occurred in co-pyrolysis of CS and SM,
the experimental values were compared with calculated ones from the additive model. The
additive model assumed that there were no interactions between the two samples during
co-processing so that the calculated values were sum of the values of individual samples
proportional to their blending weight ratio as (Eq. 1),
Xcal = r1X1 + r2X2 (1)
where Xcal was the calculated value from the additive model, Xi was the measured
experimental value of sample i separately, and ri was the blending ratio of sample i.
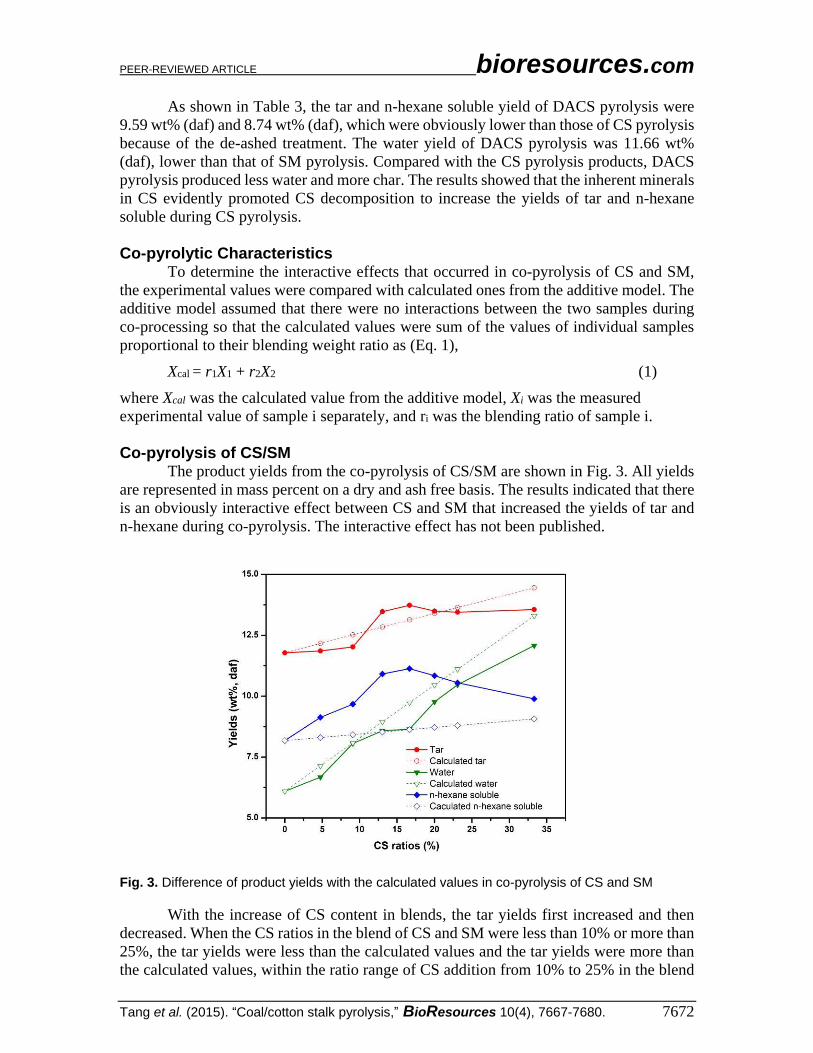
Co-pyrolysis of CS/SM The product yields from the co-pyrolysis of CS/SM are shown in Fig. 3. All yields
are represented in mass percent on a dry and ash free basis. The results indicated that there
is an obviously interactive effect between CS and SM that increased the yields of tar and
n-hexane during co-pyrolysis. The interactive effect has not been published.
Fig. 3. Difference of product yields with the calculated values in co-pyrolysis of CS and SM
With the increase of CS content in blends, the tar yields first increased and then
decreased. When the CS ratios in the blend of CS and SM were less than 10% or more than
25%, the tar yields were less than the calculated values and the tar yields were more than
the calculated values, within the ratio range of CS addition from 10% to 25% in the blend
PEER-REVIEWED ARTICLE bioresources.com
Tang et al. (2015). “Coal/cotton stalk pyrolysis,” BioResources 10(4), 7667-7680. 7673
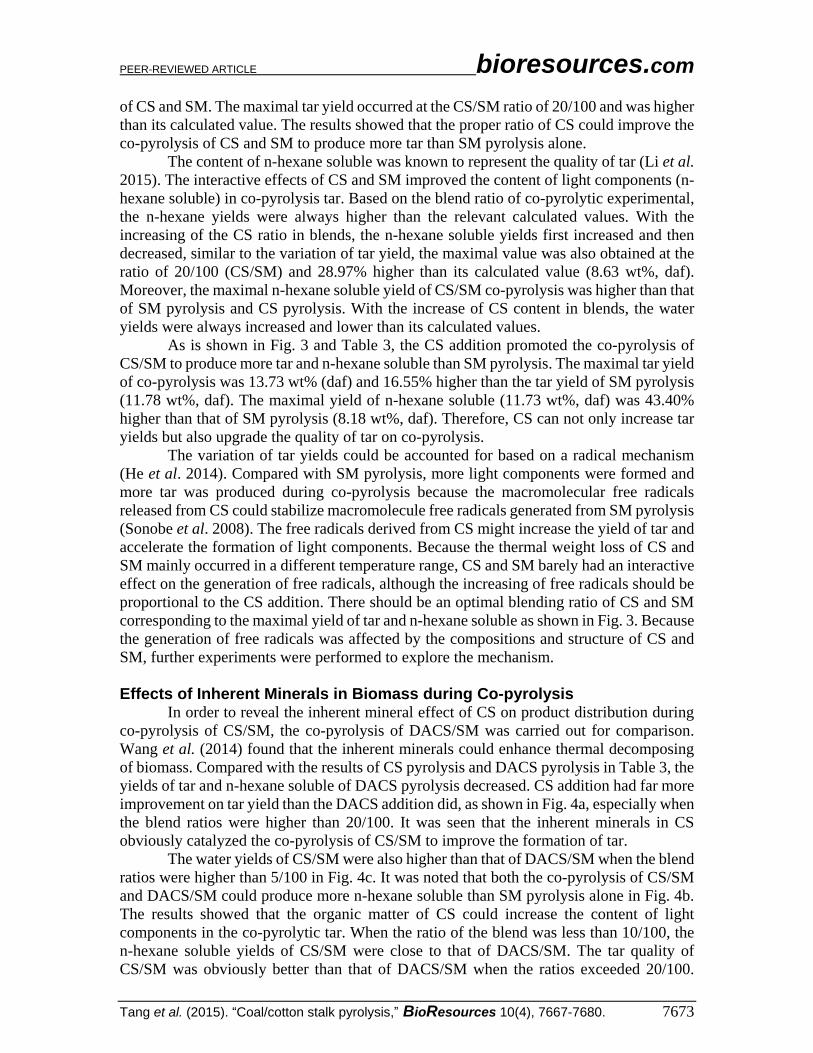
of CS and SM. The maximal tar yield occurred at the CS/SM ratio of 20/100 and was higher
than its calculated value. The results showed that the proper ratio of CS could improve the
co-pyrolysis of CS and SM to produce more tar than SM pyrolysis alone.
The content of n-hexane soluble was known to represent the quality of tar (Li et al.
2015). The interactive effects of CS and SM improved the content of light components (n-
hexane soluble) in co-pyrolysis tar. Based on the blend ratio of co-pyrolytic experimental,
the n-hexane yields were always higher than the relevant calculated values. With the
increasing of the CS ratio in blends, the n-hexane soluble yields first increased and then
decreased, similar to the variation of tar yield, the maximal value was also obtained at the
ratio of 20/100 (CS/SM) and 28.97% higher than its calculated value (8.63 wt%, daf).
Moreover, the maximal n-hexane soluble yield of CS/SM co-pyrolysis was higher than that
of SM pyrolysis and CS pyrolysis. With the increase of CS content in blends, the water
yields were always increased and lower than its calculated values.
As is shown in Fig. 3 and Table 3, the CS addition promoted the co-pyrolysis of
CS/SM to produce more tar and n-hexane soluble than SM pyrolysis. The maximal tar yield
of co-pyrolysis was 13.73 wt% (daf) and 16.55% higher than the tar yield of SM pyrolysis
(11.78 wt%, daf). The maximal yield of n-hexane soluble (11.73 wt%, daf) was 43.40%
higher than that of SM pyrolysis (8.18 wt%, daf). Therefore, CS can not only increase tar
yields but also upgrade the quality of tar on co-pyrolysis.
The variation of tar yields could be accounted for based on a radical mechanism
(He et al. 2014). Compared with SM pyrolysis, more light components were formed and
more tar was produced during co-pyrolysis because the macromolecular free radicals
released from CS could stabilize macromolecule free radicals generated from SM pyrolysis
(Sonobe et al. 2008). The free radicals derived from CS might increase the yield of tar and
accelerate the formation of light components. Because the thermal weight loss of CS and
SM mainly occurred in a different temperature range, CS and SM barely had an interactive
effect on the generation of free radicals, although the increasing of free radicals should be
proportional to the CS addition. There should be an optimal blending ratio of CS and SM
corresponding to the maximal yield of tar and n-hexane soluble as shown in Fig. 3. Because
the generation of free radicals was affected by the compositions and structure of CS and
SM, further experiments were performed to explore the mechanism.
Effects of Inherent Minerals in Biomass during Co-pyrolysis In order to reveal the inherent mineral effect of CS on product distribution during
co-pyrolysis of CS/SM, the co-pyrolysis of DACS/SM was carried out for comparison.
Wang et al. (2014) found that the inherent minerals could enhance thermal decomposing
of biomass. Compared with the results of CS pyrolysis and DACS pyrolysis in Table 3, the
yields of tar and n-hexane soluble of DACS pyrolysis decreased. CS addition had far more
improvement on tar yield than the DACS addition did, as shown in Fig. 4a, especially when
the blend ratios were higher than 20/100. It was seen that the inherent minerals in CS
obviously catalyzed the co-pyrolysis of CS/SM to improve the formation of tar.
The water yields of CS/SM were also higher than that of DACS/SM when the blend
ratios were higher than 5/100 in Fig. 4c. It was noted that both the co-pyrolysis of CS/SM
and DACS/SM could produce more n-hexane soluble than SM pyrolysis alone in Fig. 4b.
The results showed that the organic matter of CS could increase the content of light
components in the co-pyrolytic tar. When the ratio of the blend was less than 10/100, the
n-hexane soluble yields of CS/SM were close to that of DACS/SM. The tar quality of
CS/SM was obviously better than that of DACS/SM when the ratios exceeded 20/100.

PEER-REVIEWED ARTICLE bioresources.com
Tang et al. (2015). “Coal/cotton stalk pyrolysis,” BioResources 10(4), 7667-7680. 7674
Compared with the variation of char yields in Fig. 4d, the pyrolytic rate of CS/SM was
higher than that of DACS/SM. Based on the results, the inherent mineral in CS improved
the thermal decomposition of the blend of CS and SM during co-pyrolysis. When the
additive ratio of the blend was lower than 10/100, the n-hexane soluble yield of CS/SM co-
pyrolysis was less than that of DACS/SM co-pyrolysis. When the additive ratio was higher
than 10/100, the CS addition obviously increased the yield and upgraded the quality of tar.
Fig. 4. Production distribution from co-pyrolysis of CS/SM, DACS/SM and K2CO3/SM (a: tar yields, b: n-hexane soluble yields, c: water yields, d: char yields)
Effects of Additional Minerals on SM Pyrolysis The addition of alkali is well known to catalyze coal pyrolysis. The minerals
inherently present in CS might have an effect not only on CS, but also on SM during co-
pyrolysis. As shown in Table 2, the main minerals of cotton stalk are potassium and
calcium. The calcium of CS exists in the cytoderm and the potassium in ionic form
dissolves in the plant juice which flows in vessel. Because the particle size both of SM and
CS was less than 180 μm, the sylvite in CS could touch directly with SM particles in the
blending but calcium in the cytoderm could be released from CS particles during pyrolysis.
Therefore, the pyrolysis of K2CO3/SM was performed to investigate the catalytic effects of
K2CO3 on SM pyrolysis. Volatilization of the inorganic components in biomass is known
to be strongly dependent on the pyrolysis temperature (Keown et al. 2008; Liao et al. 2015).
K2CO3 was sieved to obtain fractions of particle size less than 180 μm. Since a little of the
PEER-REVIEWED ARTICLE bioresources.com
Tang et al. (2015). “Coal/cotton stalk pyrolysis,” BioResources 10(4), 7667-7680. 7675
inorganic components were released with temperature lower than 600 °C during pyrolysis
(Du et al. 2014), the blend ratios of K2CO3/SM were 0.034/100, 0.067/100, 0.135/100,
0.202/100, and 0.337/100, which was determined by the results of XRF (listed in Table 2)
and matched with the blend ratios of CS in co-pyrolysis of CS/SM.
With the increasing of K2CO3 addition, the tar yield of K2CO3/SM pyrolysis was
decreased and the n-hexane soluble yield was also decreased but close to that of SM
pyrolysis in comparison with SM pyrolysis. Figure 4a shows that the yields of tar derived
from pyrolysis of K2CO3/SM were lower than the yields of CS/SM and higher than the
yields of DACS/SM. As shown in Fig. 4b, the n-hexane soluble yields of K2CO3/SM
pyrolysis were always lower than that of co-pyrolysis CS/SM and DACS/SM, and yet the
variation of char yields was quite the contrary. Though K2CO3 has been documented to
catalyze the pyrolysis of coal (Patwardhan et al. 2010), the K2CO3 addition had less effect
on the decomposition of SM, possibly due to the low pyrolysis temperature and little
additive amount as shown in Fig. 4d. With the results of Fig. 4a and Fig. 4c, K2CO3 addition
could increase the water and decrease the tar yield on SM pyrolysis.
In a word, the inherent minerals of CS could catalyze co-pyrolysis of CS/SM to
improve the tar yield and quality. Moreover, the inherent minerals of CS had more
influence on the product distribution than the additional minerals during the co-pyrolysis
process. The catalytic effect of inherent minerals in CS could be due to its dispersibility
and the occurrence form during co-pyrolysis of CS and SM.
n-Hexane Soluble Characterization from Pyrolysis Tar The light components were extracted from tar by n-hexane. The characteristics of
tar quality could be understood by analyses of n-hexane soluble components. The n-hexane
solubles obtained by the pyrolysis of SM, CS, CS/SM, and DACS/SM at 20/100 ratio were
detected by GC–MS. Table 4 shows the main compounds identified in the n-hexane soluble
fraction according to the peak intensities and areas. Significant interaction effects were
found when comparing species of the n-hexane soluble components of co-pyrolysis tar and
SM pyrolysis tar with those of CS pyrolysis tar. Those main components of the n-hexane
soluble derived from the tar of CS pyrolysis, such as cyclopentane and methyl-,
cyclohexane, were not detected in the n-hexane soluble fraction derived from co-pyrolysis
of CS/SM and DACS/SM. It is known that cyclohexane and its derivatives are produced
by the cellulose pyrolysis (Mohan et al. 2006). This showed that the free radicals generated
from CS pyrolysis combined with those from SM pyrolysis during co-pyrolysis of CS/SM.
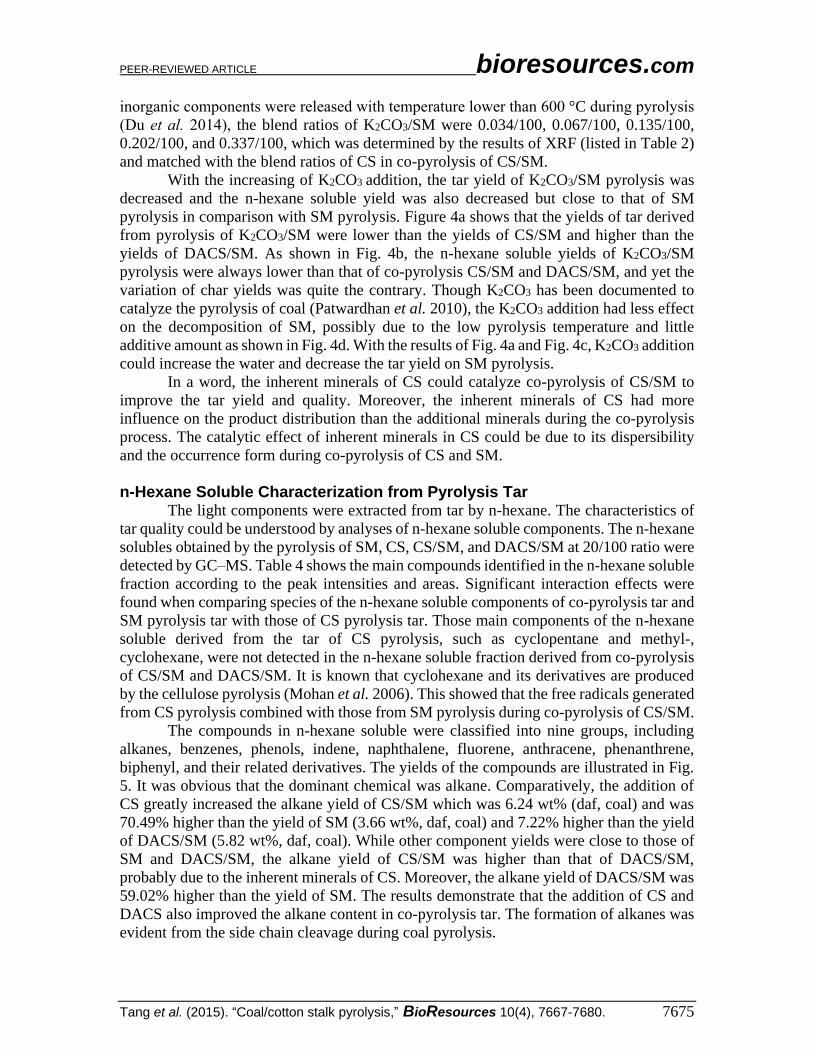
The compounds in n-hexane soluble were classified into nine groups, including
alkanes, benzenes, phenols, indene, naphthalene, fluorene, anthracene, phenanthrene,
biphenyl, and their related derivatives. The yields of the compounds are illustrated in Fig.
5. It was obvious that the dominant chemical was alkane. Comparatively, the addition of
CS greatly increased the alkane yield of CS/SM which was 6.24 wt% (daf, coal) and was
70.49% higher than the yield of SM (3.66 wt%, daf, coal) and 7.22% higher than the yield
of DACS/SM (5.82 wt%, daf, coal). While other component yields were close to those of
SM and DACS/SM, the alkane yield of CS/SM was higher than that of DACS/SM,
probably due to the inherent minerals of CS. Moreover, the alkane yield of DACS/SM was
59.02% higher than the yield of SM. The results demonstrate that the addition of CS and
DACS also improved the alkane content in co-pyrolysis tar. The formation of alkanes was
evident from the side chain cleavage during coal pyrolysis.

PEER-REVIEWED ARTICLE bioresources.com
Tang et al. (2015). “Coal/cotton stalk pyrolysis,” BioResources 10(4), 7667-7680. 7676
Table 4. Main Components of n-Hexane Soluble
Peak no. Compounds Relative area (%)
SM CS/SMa DACS/SMa CS
1 Nonane 1.66 1.16 0.76 -
2 Phenol, 3-methyl- 1.77 1.01 0.71 -
3 Phenol, 2-methyl- 2.75 1.93 1.39 0.70
4 Phenol, 2,4-dimethyl- 1.91 1.48 1.95 0.25
5 Phenol, 2-ethyl- 0.33 1.27 1.07 0.19
6 Dodecane 1.22 1.09 0.90 0.22
7 Naphthalene, 1-methyl- 0.98 0.91 0.82 -
8 Tetradecane 1.25 1.29 1.15 -
10 Pentadecane 1.57 1.73 1.50 -
11 Phenol, 2,4-bis(1,1-dimethylethyl) 0.86 1.02 1.71 -
12 1-Naphthalenol 0.26 1.11 0.31 -
13 3,5-Dimethyl-4-(2-furyl)pyridine - - 1.91 -
14 Naphthalene, 1,2,3,4-tetrahydro-5, 6,7,8-tetramethyl-
0.94 - - -
15 Hexadecane 1.29 1.68 1.70 -
16 Dibenzofuran, 4-methyl- 1.03 0.83 0.46 -
17 Heptadecane 1.18 1.41 1.43 -
20 Octadecane 1.18 1.27 1.24 -
21 Nonadecane 1.44 - - -
22 Hentriacontane 0.51 0.28 1.18 -
23 Eicosane 2.35 2.82 2.94 0.15
24 Heneicosane 2.22 2.83 2.96 0.19
25 Naphthalene, 7-butyl-1-hexyl- 0.99 1.15 1.11 -
26 Docosane - 2.06 1.97 -
27 Phenanthrene, 1-methyl-7-(1-methyl ethyl)- 2.86 2.87 2.17 -
28 Nonadecane 1.82 - - -
29 Tricosane - 1.90 1.87 -
30 9-Octadecenamide, (Z)- 2.01 1.99 1.91 -
31 Tetracosane 1.61 1.66 1.67 -
32 Pentacosane 1.49 1.75 1.44 0.26
33 Silicic acid, diethyl bis(trimethy lsilyl) ester 1.51 0.50 0.48 -
34 Pentane, 2,2-dimethyl- - - - 1.36
35 Cyclopentane, methyl- - - - 45.63
36 Cyclohexane - - - 26.76
37 Propanoic acid, 2-methyl-, anhydri - - - 1.68
38 Phenol, 2-methoxy- - - - 1.42 a blend ratio is 20/100 – not detected

PEER-REVIEWED ARTICLE bioresources.com
Tang et al. (2015). “Coal/cotton stalk pyrolysis,” BioResources 10(4), 7667-7680. 7677
Because the alkanes in the n-hexane soluble fraction derived from tar were mostly
chain-hydrocarbon, and the main light components of bio-oil such as cyclopentane, methyl,
and cyclohexane were not detected, the side chain cleavage from SM could combine with
the free radicals derived from CS pyrolysis to form more alkanes than SM pyrolysis during
the co-pyrolysis. Therefore, the formation of alkanes was influenced remarkably by the
free radicals from decomposition of organic matter in CS.
Fig. 5. Yields of major chemicals in n-hexane soluble for pyrolysis of SM, CS/SM, and DACS/SM at the ratio of 20/100
CONCLUSIONS
1. Co-pyrolysis of CS and SM was performed in a tubular furnace. An interactive effect
promoted the yields of tar and the light component in pyrolytic tar during the co-
pyrolysis. The yields of pyrolysis water and char from co-pyrolysis were less than the
calculated values. The tar yields were higher than the calculated values within the range
of CS ratio from 10% to 25% and the n-hexane soluble yields were always higher than
relevant calculated values in the range of experimental proportion.
2. The results of DACS/SM co-pyrolysis indicated that the organic matter of CS increased
the content of light components in the co-pyrolytic tar. Compared with the co-pyrolysis
of DACS/SM, the inherent minerals of CS had catalytic effects on the co-pyrolysis of
CS/SM and increased the yields of tar and n-hexane soluble in the co-pyrolysis of
CS/SM. The comparative test results of K2CO3 and SM showed that the additional
minerals had relatively less catalytic effects than the inherent minerals of CS during
co-pyrolysis. The significant catalytic effects of inherent minerals in CS could have
been due to its dispersibility and the form of occurrence in biomass. The maximal tar
yield of CS/SM co-pyrolysis was 13.73 wt% (daf) and about 2 points higher that of SM
pyrolysis (11.78wt%, daf). The n-hexane soluble yield of CS/SM co-pyrolysis was
11.13 wt% (daf) and higher than the both of SM pyrolysis and CS pyrolysis alone.

PEER-REVIEWED ARTICLE bioresources.com
Tang et al. (2015). “Coal/cotton stalk pyrolysis,” BioResources 10(4), 7667-7680. 7678
3. The alkane yield of CS/SM co-pyrolysis tar was obviously higher than that of SM
pyrolysis. The maximal yield of alkanes in the tar was 6.24 wt% (daf) in co-pyrolysis
of CS/SM and 70.49% higher than that of SM pyrolysis alone. The results indicated
that the CS addition can accelerate the formation of alkanes in tar during CS/SM co-
pyrolysis.
ACKNOWLEDGEMENTS
This work was supported by the National Basic Research Program of China (973
program, 2011CB201304).
REFERENCES CITED
Abbasi-Atibeh, E., and Yozgatligil, A. (2014). “A study on the effects of catalysts on
pyrolysis and combustion characteristics of Turkish lignite in oxy-fuel conditions,”
Fuel 115, 841-849. DOI: 10.1016/j.fuel.2013.01.073
ASTM D 4006-11. (2012). “Standard test method for water in crude oil by distillation,”
Annual Book of Standards, section 5, Textiles, ASTM, West Conshohocken, PA.
ASTM D 91-02. (2012). “Standard test method for precipitation number of lubricating
oils,” Annual Book of Standards, section 5, Textiles, ASTM, West Conshohocken,
PA.
Cheng, H., Wu, S., and Liu, C. (2014). “Study on the mechanism of the pyrolysis of a
lignin monomeric model compound by in situ FTIR,” BioResources 9(3), 4441-4448.
DOI: 10.15376/biores.9.3.4441-4448
Das, P., Ganesh, A., and Wangikar, P. (2004). “Influence of pretreatment for deashing of
sugarcane bagasse on pyrolysis products,” Biomass. Bioenergy. 27(5), 445-457. DOI:
10.1016/j.biombioe.2004.04.002
Du, S., Yang, H., Qian, K., Wang, X., and Chen, H. (2014). “Fusion and transformation
properties of the inorganic components in biomass ash,” Fuel 117(30), 1281-1287.
DOI: 10.1016/j.fuel.2013.07.085
He, W., Liu, Q., Shi, L., Liu, Z., Ci, D., Lievens, C., and Guo, X. (2014). “Understanding
the stability of pyrolysis tars from biomass in a view point of free radicals,”
Bioresour. Technol. 156, 372-375. DOI: 10.1016/j.biortech.2014.01.063
He, W., Liu, Z., Liu, Q., Ci, D., Lievens, C., and Guo, X. (2014). “Behaviors of radical
fragments in tar generated from pyrolysis of 4 coals,” Fuel 134(15), 375-380. DOI:
10.1016/j.fuel.2014.05.064
Keown, D., Hayashi, J., and Li, C. (2008). “Effects of volatile-char interactions on the
volatilization of alkali and alkaline earth metallic species during the pyrolysis of
biomass,” Fuel 87(7), 1187-1194. DOI: 10.1016/j.fuel.2007.05.056
Kirtania, K., and Bhattacharya, S. (2013). “Pyrolysis kinetics and reactivity of algae-coal
blends,” Biomass. Bioenergy 55, 291–298. DOI: 10.1016/j.biombioe.2013.02.019
Kolari, P., Bäck, J., Taipale, R., Ruuskanen, T.M., Kajos, M.K., Rinne, J., Kulmala, M.,
and Hari, P. (2012). “Evaluation of accuracy in measurements of VOC emissions
with dynamic chamber system,” Atmos. Environ 62, 344-351. DOI:
10.1016/j.atmosenv.2012.08.054

PEER-REVIEWED ARTICLE bioresources.com
Tang et al. (2015). “Coal/cotton stalk pyrolysis,” BioResources 10(4), 7667-7680. 7679
Krerkkaiwan, S., Fushimi, C., Tsutsumi, A., and Kuchonthara, P. (2013). “Synergetic
effect during co-pyrolysis/gasification of biomass and sub-bituminous coal,” Fuel
Process. Technol. 115, 11-18. DOI: 10.1016/j.fuproc.2013.03.044
Li, S., Chen, X., Wang, L., Liu, A., and Yu, G. (2013). “Co-pyrolysis behaviors of saw
dust and Shenfu coal in drop tube furnace and fixed bed reactor,” Bioresour. Technol.
148, 24-29. DOI: 10.1016/j.biortech.2013.08.126
Li, X., Xue, Y., Feng, J., Yi, Q., Li, W., Guo, X., and Liu, K. (2015). “Co-pyrolysis of
lignite and Shendong coal direct liquefaction residue,” Fuel 144(15), 342-348. DOI:
10.1016/j.fuel.2014.12.049
Liao, Y., Cao, Y., Chen, T., and Ma, X. (2015). “Experiment and simulation study on
alkalis transfer characteristic during direct combustion utilization of bagasse,”
Bioresour. Technol. 194, 196-204. DOI: 10.1016/j.biortech.2015.06.121
Liu, Q., Hu, H., Zhou, Q., Zhu, S., and Chen, G. (2004). “Effect of inorganic matter on
reactivity and kinetics of coal pyrolysis,” Fuel 83(6), 713-718. DOI:
10.1016/j.fuel.2003.08.017
Mohan, D., Pittman, C.U., and Steele, P. H. (2006). “Pyrolysis of wood/biomass for bio-
oil: a critical review,” Energy. Fuels. 20(3), 848-889. DOI: 10.1021/ef0502397
Mourant, D., Wang, Z., He, M., Wang, X.S., Garcia-Perez, M., Ling, K., and Li, C.
(2011). “Mallee wood fast pyrolysis: Effects of alkali and alkaline earth metallic
species on the yield and composition of bio-oil,” Fuel 90(9), 2915-2922. DOI:
10.1016/j.fuel.2011.04.033
Vassilev, S. V., Baxter, D., Andersen, L. K., and Vassileva, C. G. (2010). “An overview
of the chemical composition of biomass,” Fuel 89(5), 913-933. DOI:
10.1016/j.fuel.2009.10.022
Patwardhan, P. R., Satrio, J. A., Brown, R. C., and Shanks, B. H. (2010). “Influence of
inorganic salts on the primary pyrolysis products of cellulose,” Bioresour. Technol.
101(12), 4646-4655. DOI: 10.1016/j.biortech.2010.01.112
Shimada, N., Kawamoto, H., and Saka, S. (2008). “Different action of alkali/alkaline
earth metal chlorides on cellulose pyrolysis,” J. Anal. Appl. Pyrolysis 81(1), 80-87.
DOI: 10.1016/j.jaap.2007.09.005
Soncini, R. M., Means, N. C., and Weiland, N. T. (2013). “Co-pyrolysis of low rank
coals and biomass: Product distributions,” Fuel 112, 74-82. DOI:
10.1016/j.fuel.2013.04.073
Sonobe, T., Worasuwannarak, N., and Pipatmanomai, S. (2008). “Synergies in co-
pyrolysis of Thai lignite and corncob,” Fuel Process. Technol. 89(12), 1371-1378.
DOI: 10.1016/j.fuproc.2008.06.006
Wang, B., Zhao, S., Huang, Y., and Zhang, J. (2014). “Effect of some natural minerals on
transformation behavior of sulfur during pyrolysis of coal and biomass,” J. Anal.
Appl. Pyrolysis. 105, 284-294. DOI: 10.1016/j.jaap.2013.11.015
Wei, L., Zhang, L., and Xu, S. (2011). “Effects of feedstock on co-pyrolysis of biomass
and coal in a free-fall reactor,” J. Fuel Chem. Technol. 39(10), 728-734. DOI:
10.1016/s1872-5813(11)60044-3
Weiland, N. T., Means, N. C., and Morreale, B. D. (2012). “Product distributions from
isothermal co-pyrolysis of coal and biomass,” Fuel 94, 563-570.
Yang, X., Yuan, C., Xu, J., and Zhang, W. (2014). “Co-pyrolysis of Chinese lignite and
biomass in a vacuum reactor,” Bioresour. Technol. 173, 1-5. DOI:
10.1016/j.biortech.2014.09.073

PEER-REVIEWED ARTICLE bioresources.com
Tang et al. (2015). “Coal/cotton stalk pyrolysis,” BioResources 10(4), 7667-7680. 7680
Zhang, M., Resende, F., and Moutsoglou, A. (2012). “Pyrolysis of lignin extracted from
prairie cordgrass, aspen, and kraft lignin by Py-GC/MS and TGA/FTIR,” J. Anal.
Appl. Pyrolysis 98, 65-71. DOI: 10.1016/j.jaap.2012.05.009
Zhang, X., Yang, W., and Dong, C. (2013). “Levoglucosan formation mechanisms during
cellulose pyrolysis,” J. Anal. Appl. Pyrolysis 104, 19-27. DOI:
10.1016/j.jaap.2013.09.015
Article submitted: June 22, 2015; Peer review completed: September 12, 2015; Revised
version received and accepted: September 20, 2015; Published: September 28, 2015.
DOI: 10.15376/biores.10.4.7667-7680