Embed Size (px)
Citation preview
LBNL-58577
Improving Ventilation and Saving Energy: Laboratory Study in a Modular Classroom Test Bed
Michael G. Apte, Ian S. Buchanan, David Faulkner, William J. Fisk,
Chi-Ming Lai*, Michael Spears, and Douglas P. Sullivan
August 27 2005 Indoor Environment Department Environmental Energy Technologies Division Lawrence Berkeley National Laboratory
*Department of Construction Technology Leader University Tainan City Taiwan This research was sponsored by the California Energy Commission through the Public Interest Energy Research program as the Lawrence Berkeley National Laboratory Classroom HVAC: Improving Ventilation and Saving Energy research project, CEC Contract Number 500-03-041. The study was additionally supported by the Assistant Secretary for Energy Efficiency and Renewable Energy, Building Technology Program of the U.S. Department of Energy under contract DE-AC02-05CH11231.
Classroom HVAC: Improving Ventilation and Saving Energy (IVSE) Laboratory Study
S i
Table of Contents Table of Contents............................................................................................................................. i
Glossary .......................................................................................................................................... ii
ABSTRACT.................................................................................................................................... 1
INTRODUCTION .......................................................................................................................... 1
LABORATORY STUDY OBJECTIVES .................................................................................. 3 METHODS ..................................................................................................................................... 4
HVAC systems and controls, installation, and commissioning.................................................. 4 HVAC systems and controls................................................................................................... 4 LBNL RC Test Bed ................................................................................................................ 5
Instrumentation ........................................................................................................................... 6 Measurements of air supply, return, and ventilation............................................................... 6 Modeling of HVAC energy efficiency ................................................................................... 7 HVAC testing schedule........................................................................................................... 9 HVAC operation modes and simulated occupancy ................................................................ 9 Acoustic noise experimental setup and testing ..................................................................... 10
RESULTS AND DISCUSSION................................................................................................... 10
HVAC Installation .................................................................................................................... 10 HVAC Control, Temperature and Humidity ............................................................................ 10
HVAC control ....................................................................................................................... 10 Measured Temperature and Humidity .................................................................................. 11
Indoor CO2 ................................................................................................................................ 12 Outdoor Air Supply Rate Measurement ................................................................................... 12 Energy Efficiency Comparisons ............................................................................................... 12 HVAC System Acoustic Noise Comparisons........................................................................... 13
Summary and conclusions ............................................................................................................ 14
Acknowledgements....................................................................................................................... 14
References..................................................................................................................................... 14
Tables............................................................................................................................................ 17
Figures........................................................................................................................................... 28
Classroom HVAC: Improving and Saving Energy (IVSE) Laboratory Study
ii
Glossary Specific terms and acronyms used throughout this report are defined as follows:
Acronym Definition* ASHRAE American Society of Heating, Refrigeration, and Air Conditioning Engineers CFM Cubic feet per minute, a measure of ventilation rate per occupant CO2 Carbon dioxide dB(A) A-weighted decibels, measurement of noise level DOE United States Department of Energy hr-1 Units for air exchange rate HPAC Heat pump air conditioner HVAC Heating, ventilation, and air conditioning system IEQ Indoor air and environmental quality IHPAC Improved heat pump air conditioner IVSE Classroom HVAC: Improving Ventilation and Saving Energy L Liters LBNL Lawrence Berkeley National Laboratory PHPS Performance of the Heat Pump System RC Relocatable, or portable or modular, classroom RH Relative humidity, measured as percentage RMS Root Mean Square SEER Seasonal energy efficiency rating
Classroom HVAC: Improving and Saving Energy (IVSE) Laboratory Study
1
ABSTRACT The primary goals of this research effort were to develop, evaluate, and demonstrate a practical HVAC system for classrooms that consistently provides classrooms with the quantity of ventilation in current minimum standards, while saving energy, and reducing HVAC-related noise levels. This research was motivated by several factors, including the public benefits of energy efficiency, evidence that many classrooms are under-ventilated, and public concerns about indoor environmental quality in classrooms. This project involved the installation and verification of the performance of an Improved Heat Pump Air Conditioning (IHPAC) system, and its comparison, a standard HVAC system having an efficiency of 10 SEER. The project included the verification of the physical characteristics suitable for direct replacement of existing 10 SEER systems, quantitative demonstration of improved energy efficiency, reduced acoustic noise levels, quantitative demonstration of improved ventilation control, and verification that the system would meet temperature control demands necessary for the thermal comfort of the occupants. Results showed that the IHPAC met these goals. The IHPAC was found to be a direct bolt-on replacement for the 10 SEER system. Calculated energy efficiency improvements based on many days of classroom cooling or heating showed that the IHPAC system is about 44% more efficient during cooling and 38% more efficient during heating than the 10 SEER system. Noise reduction was dramatic, with measured A-weighed sound level for fan only operation conditions of 34.3 dB(A), a reduction of 19 dB(A) compared to the 10 SEER system. Similarly, the IHPAC stage-1 and stage-2 compressor plus fan sound levels were 40.8 dB(A) and 42.7 dB(A), reductions of 14 and 13 dB(A), respectively. Thus, the IHPAC is 20 to 35 times quieter than the 10 SEER systems depending upon the operation mode. The IHPAC system met the ventilation requirements and was able to provide consistent outside air supply throughout the study. Indoor CO2 levels with simulated occupancy were maintained below 1000 ppm. Finally temperature settings were met and controlled accurately. The goals of the laboratory testing phase were met and this system is ready for further study in a field test of occupied classrooms. INTRODUCTION The primary goals of the “Improving Ventilation and Saving Energy” (IVSE) project were to develop, evaluate, and demonstrate a very practical HVAC system for relocatable classrooms (RCs) that consistently provides them with the quantity of ventilation in current minimum standards, while saving energy, and reducing HVAC-related noise levels. The ultimate goal is to provide the specification of this system to the public domain, and stimulate increased use of advanced classroom HVAC in the market through interaction with key school facility stakeholders. The need for an improved classroom ventilation system is based, in part, on the considerable evidence, summarized in Daisey et al. (1998, 2003), indicating that ventilation rates in classrooms often do not meet the current ASHRAE minimum rate of 15 CFM per occupant (ASHRAE, 2004). While relatively few measurements of actual classroom ventilation rates are available, concentrations of CO2 in classrooms often substantially exceeded 1000 ppm; implying ventilation rates less than 15 CFM per occupant, with several studies reporting peak concentrations exceeding 1500 ppm, and some concentrations exceeding 3000 ppm. In a recent survey of California portable classrooms (also called relocatable classrooms or RCs), CO2

Classroom HVAC: Improving and Saving Energy (IVSE) Laboratory Study
2
concentrations exceeded 1000 ppm in about 40% of classrooms and concentrations exceeded 2000 ppm in approximately 10% of classrooms (CARB-DHS 2003). In a survey of 400 classrooms in Washington state and Idaho (Shendell et al. 2004), CO2 concentrations measured at random times in 45% of classrooms exceeded 1000 ppm, thus, a considerably larger fraction of steady state or peak CO2 concentrations would have exceeded 1000 ppm. Further evidence of low classroom ventilation rates was obtained in a study in 14 California schools (Lagus Applied Technologies 1995). The measured mean minimum air exchange rate was 2.4 h-1, with a range of 1.2 to 2.9 h-1, while the air exchange rate corresponding to the current standard was estimated to be 3 h-1. Anecdotally, we are aware that ventilation rates in classrooms are often low because teachers frequently operate classroom HVAC systems in the mode where the supply fan shuts off except when heating or cooling is required. Thus, outside air is supplied mechanically only during periods of heating or cooling and the time average rate of supply is below standards. We also observe that teachers use this mode of HVAC system operation to avoid HVAC system-related noise. These anecdotal reports are supported by the findings from the recently completed survey of California RCs. Teachers in 60% of RCs reported that they sometimes turned off HVAC systems to reduce noise levels (CARB-CDHS 2003). Consequently, the available evidence indicates the importance of reducing HVAC noise in the development of improved classroom HVAC systems. Several statutes and standard address the provision of adequate ventilation in California classrooms. Continuous ventilation is required in California Classrooms under both state energy and occupational laws (CA Title 24 2001, CCR 1995) and is a required component of ASHRAE Standard 62.1 (ASHRAE 2004). The relocatable classroom (RC) HVAC industry has been incrementally addressing the classroom noise levels generated by the wall mount heat pump air conditioner (HPAC) that they produce. For example, in the late 1990s Bard Manufacturing Company developed a 12 SEER “Quiet Climate” model to meet specifications from the Los Angeles Unified School District (LAUSD, 1998). This unit was designed to operate at indoor sound levels ≤50 dB(A) measured at a point 3m (10’) from the return grille and 1.5m high. This model is the current state of the art, with a relatively small market penetration in California. Unfortunately, 50 dB(A) is not currently considered an adequate target for classroom sound levels. The Collaborative on High Performance Schools (CHPS) recommends unoccupied classroom levels to be at or below 45 dB(A) (CHPS 2002). Additionally, the Acoustical Society of America (ASA) provide a guideline for classrooms of 35 dB(A) (ASA 2002). A great deal of energy is used to condition ventilation air in high occupancy spaces such as classrooms. Mudarri et al. (1996) used an energy simulation model and estimated that increasing school building ventilation rates by 10 CFM, from 5 to 15 CFM per occupant, would increase annual HVAC energy use by 15%, 31%, and 32% in Miami, Washington, DC, and Seattle, respectively. From these predictions, we can estimate that the energy to provide 15 CFM per student of ventilation is approximately 22%, 45%, and 45% of total classroom HVAC energy in these three climates, respectively. This finding indicates the existence of a clear energy and

Classroom HVAC: Improving and Saving Energy (IVSE) Laboratory Study
3
financial penalty from increasing ventilation to meet existing standards if improved energy efficiency is not applied to offset the increased demand. A number of studies (e.g., Seppanen et al. 1999, Wargocki et al. 2002; Erdmann et al. 2002) have investigated the relationship of ventilation rates to health outcomes (sick building syndrome symptoms, respiratory illnesses), absence rates, and perceived air quality; however, most studies have been performed in office buildings. Some studies have used indoor CO2 concentrations as a surrogate for ventilation rate per occupant. A large majority of these studies have found a worsening of some health, absence, or perceived air quality outcomes at lower ventilation rates or higher CO2 concentrations. Detrimental effects have been particularly clear when ventilation rates are reduced below 20 CFM per occupant and several studies have found benefits of increasing ventilation rates above 20 CFM per occupant. These studies indicate that ventilation rates have important effects on the health of occupants. When we consider these factors together – the important effects of ventilation on people, the energy used for ventilation, and the evidence of ventilation deficiencies in classrooms, it is very clear that we need to develop and promote use of highly energy efficient systems for providing classroom ventilation. LABORATORY STUDY OBJECTIVES The objectives of this controlled laboratory study were to evaluate the energy, ventilation, and IEQ performance of the advanced HVAC system relative to a standard, widely used, 10 SEER HVAC system. With respect to this laboratory study the specific goals were as follows.
Quantitative Energy Consumption Goal/Expectation Demonstrate the reduced energy consumption of the advanced HVAC system in a laboratory setting. Goal –Quantitatively show in the laboratory that energy consumption reductions are at least 30% lower than the 10 SEER system or by inference a 10% improvement compared to the 12 SEER system.
Quantitative Noise Reduction Goal/Expectation The advanced HVAC system is designed to significantly cut classroom noise levels relative to the Low-Noise 12 SEER system, a major reduction relative to the baseline 10 SEER system. Goal – The acoustic specification for the 12 SEER HVAC is that it operate in an unoccupied room at <50 dB(A) at a distance of 10 feet from the air return, measured five feet above the floor. The advanced system will be conservatively expected to operate at <45 dB(A) at the same location in its noisiest operating condition.
Physical System Integration Goals/Expectations HVAC system meets general physical dimension and integration characteristics suitable for mounting on new and existing relocatable classrooms in California. This requirement is extremely important for market transfer.

Classroom HVAC: Improving and Saving Energy (IVSE) Laboratory Study
4
Goal – show dimensionally that advanced unit fits on and can be integrated into new and existing relocatable classrooms. Quantitative Ventilation System Improvement Goals/Expectations HVAC system provides sufficient outside air ventilation flow for up to 31 occupants (ASHRAE standard 62: 465 CFM), continuously Goal - show quantitatively that system meets 100% of ASHRAE 62 Standard outside air supply flow and can provide it continuously HVAC system controls provide signals to air handler to constantly and continuously ventilate during occupancy irrespective of thermal demand Goal - show that controls react upon occupancy to provide ventilation. Monitoring will verify that HVAC system ventilation activates upon occupancy demand. HVAC system maintains indoor CO2 levels below 1000 ppm Goal - show under simulated classroom occupancy (using CO2 gas cylinders) that CO2 levels can be maintained < 1000 ppm 100% of the time given simulated generation from 31 or fewer occupants HVAC system can provide thermal conditioning at air velocities and temperatures that meet ASHRAE 55 thermal comfort standards (ASHRAE, 2004). Goal – show that air velocities and supply temperatures lead to acceptable thermal comfort based upon ASHRAE 55. Note that acceptable relative humidity per ASHRAE 55 may not always be met depending upon ambient humidity conditions.
METHODS HVAC systems and controls, installation, and commissioning
HVAC systems and controls The 10 SEER unitary vertical wall-mount HPAC system is the most common and frequently installed HVAC system on RCs in California. Although lower efficiency wall-mount systems are to be found on numerous older RCs, those installed in the last ten years are likely to have a 10 SEER rating. As discussed above, at least one manufacturer has put a similar system on the market that achieves as 12 SEER rating in addition to some attempts to improve the acoustic design. The improved HPAC system (IHPAC) developed in this study maintains the same wall-mount configuration and installation form factor while attempting to address perceived design deficits in the areas of energy efficiency, acoustics, ventilation control, thermal control, and refrigerant types. Brief descriptions of the 10 SEER and IHPAC systems are as follows. 10 SEER. The 10 SEER system was designed to meet the then current California state residential energy efficiency standard of 9.7 SEER (CEC 1999). The 10 SEER system installed for this study is Bard Manufacturing Co. packaged unit operating of single-phase 240VAC power. It consists of a single stage reversible heat-pump compressor, with conventional evaporator coil in the supply air stream, and a condenser coil exposed to the outdoor air. The 10 SEER HVAC systems in use operate with standard HCFC refrigerant. The system utilizes two standard fan motors, one for the supply air fan and one for moving air across the condenser coil. The unit includes a classroom ventilator (CRV) with a motor-driven louver situated such that the
Classroom HVAC: Improving and Saving Energy (IVSE) Laboratory Study
5
supply air fan draws a set percentage of outside air into the RC and rejects an equal amount of return air from the system. The CRV receives a signal from the HVAC control to open when outdoor air is required, and shut when it is not. The 10 SEER control can range from a weekly programmable setback timer thermostat to a simple single program type mixed heating and air conditioning thermostat. An additional manual setting on the thermostat allows the teacher to turn on the fan independently if desired, allowing for continuous ventilation. A programmable setback timer was used in this study. The key point regarding this control system is that the CRV louver operation and supply air fan operation are tied to the thermostat setpoint. Thus, air recirculation and outside ventilation air are only provided to the classroom during off-setpoint (i.e., heating or cooling) periods. The 10 SEER HVAC systems were installed and operated using the existing standard that requires that the fan be operated continuously to supply outside air during occupied hours. IHPAC. LBNL worked with Bard Manufacturing Co. to develop a set of design goals to engineer an improved HPAC system based upon the project goals discussed above. The manufacturer then engineered, fabricated and tested a number of prototypes in their factory. A final functional prototype meeting the manufacturer’s design was then shipped to LBNL and installed for testing. The basic layout of the unit is very similar to the 10 SEER system with the following differences. The compressor is more energy efficient and operates in two-stages and uses an alternative to an HCFC refrigerant in anticipation of the 2010 HCFC refrigerant phase-out (USEPA, 2004). The supply air fan motor is an energy efficient electronically commutated type. The condenser and evaporator coils are re-configured to optimize energy efficiency within the constraints of the package size. The entire system was re-engineered to minimize acoustic noise and mechanical vibration. The IHPAC was installed with an automatic “smart controller”. This controller was developed for the IHPAC by Bard Manufacturing as part of this project. It was designed to relieve the responsibility of the teachers of the majority of HVAC operation tasks. Additionally, it decouples the ventilation and thermal aspects of control through the use of an internal infrared motion-detector-type occupancy sensor that triggers ventilation whenever occupants are detected. The control interface is limited to a simple temperature setting adjustment, using up-arrow and down-arrow buttons to provide a locked indoor temperature range (set by a technician in the field to ±4.0ºF (2.5ºC) in this study) in order to accommodate individual comfort differences. The occupancy sensor logic is set to wait 30 minutes after the last observed motion in the RC before setting back the temperature and shutting down the ventilation. It is also desensitized to very short (i.e., one-minute) detection of motion to avoid unneeded operation, but triggers HVAC operation as soon as a valid occupancy is detected. Finally, the system is designed to learn the classroom occupancy schedule over a moving two-week period, and then start anticipating occupancy by pre-conditioning the RC to the settings learned from the teacher’s temperature control use patterns. Pre-conditioning also includes a pre-occupancy ventilation purge of three air changes (roughly one hour) as required by California Title 24.
LBNL RC Test Bed A modular, RC, on loan from a major leasing firm, was installed and commissioned at LBNL. Interior and exterior photographic views of the installation and setup may be seen in Figures 1 and 2. The RC consisted of two modular halves, each 3.7m (12’) by 12m (40’), with a ceiling
Classroom HVAC: Improving and Saving Energy (IVSE) Laboratory Study
6
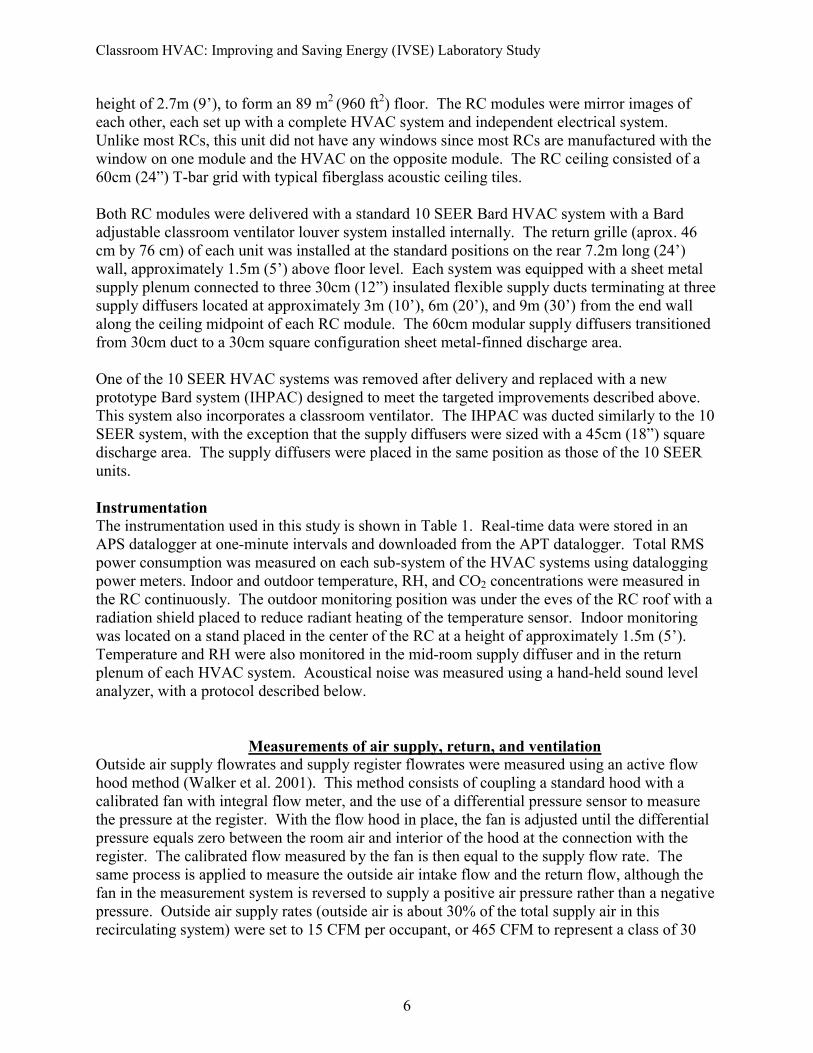
height of 2.7m (9’), to form an 89 m2 (960 ft2) floor. The RC modules were mirror images of
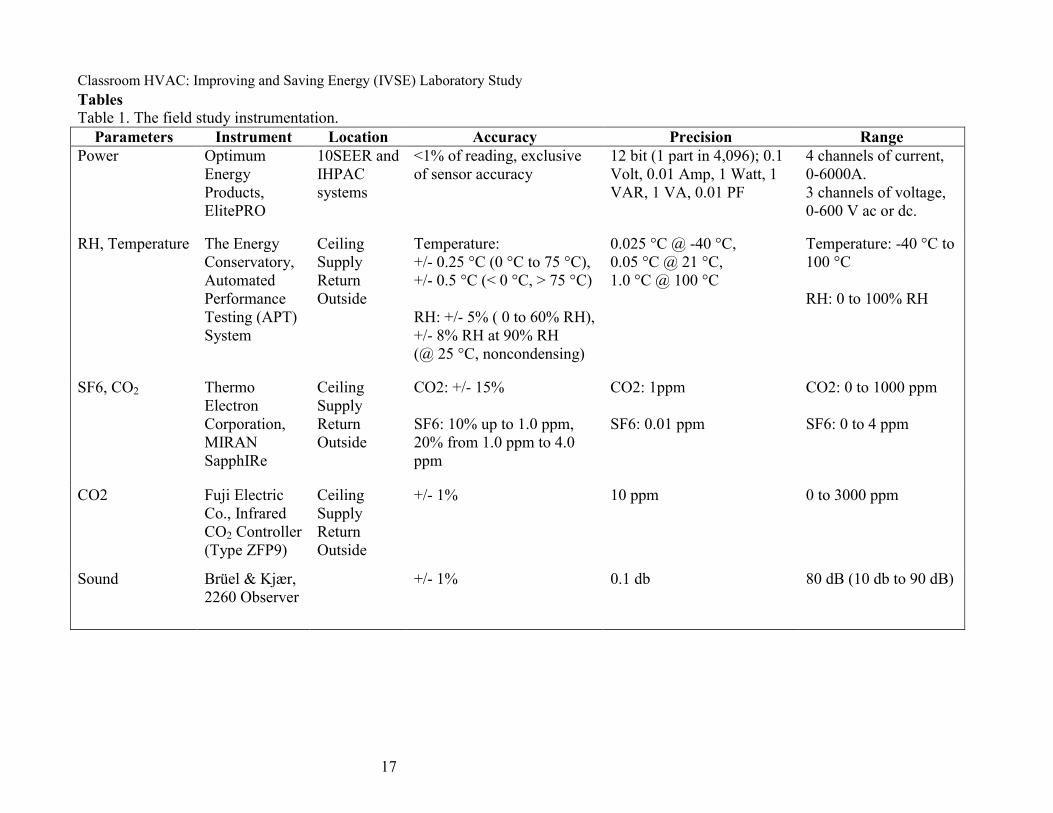
each other, each set up with a complete HVAC system and independent electrical system. Unlike most RCs, this unit did not have any windows since most RCs are manufactured with the window on one module and the HVAC on the opposite module. The RC ceiling consisted of a 60cm (24”) T-bar grid with typical fiberglass acoustic ceiling tiles. Both RC modules were delivered with a standard 10 SEER Bard HVAC system with a Bard adjustable classroom ventilator louver system installed internally. The return grille (aprox. 46 cm by 76 cm) of each unit was installed at the standard positions on the rear 7.2m long (24’) wall, approximately 1.5m (5’) above floor level. Each system was equipped with a sheet metal supply plenum connected to three 30cm (12”) insulated flexible supply ducts terminating at three supply diffusers located at approximately 3m (10’), 6m (20’), and 9m (30’) from the end wall along the ceiling midpoint of each RC module. The 60cm modular supply diffusers transitioned from 30cm duct to a 30cm square configuration sheet metal-finned discharge area. One of the 10 SEER HVAC systems was removed after delivery and replaced with a new prototype Bard system (IHPAC) designed to meet the targeted improvements described above. This system also incorporates a classroom ventilator. The IHPAC was ducted similarly to the 10 SEER system, with the exception that the supply diffusers were sized with a 45cm (18”) square discharge area. The supply diffusers were placed in the same position as those of the 10 SEER units. Instrumentation The instrumentation used in this study is shown in Table 1. Real-time data were stored in an APS datalogger at one-minute intervals and downloaded from the APT datalogger. Total RMS power consumption was measured on each sub-system of the HVAC systems using datalogging power meters. Indoor and outdoor temperature, RH, and CO2 concentrations were measured in the RC continuously. The outdoor monitoring position was under the eves of the RC roof with a radiation shield placed to reduce radiant heating of the temperature sensor. Indoor monitoring was located on a stand placed in the center of the RC at a height of approximately 1.5m (5’). Temperature and RH were also monitored in the mid-room supply diffuser and in the return plenum of each HVAC system. Acoustical noise was measured using a hand-held sound level analyzer, with a protocol described below.
Measurements of air supply, return, and ventilation Outside air supply flowrates and supply register flowrates were measured using an active flow hood method (Walker et al. 2001). This method consists of coupling a standard hood with a calibrated fan with integral flow meter, and the use of a differential pressure sensor to measure the pressure at the register. With the flow hood in place, the fan is adjusted until the differential pressure equals zero between the room air and interior of the hood at the connection with the register. The calibrated flow measured by the fan is then equal to the supply flow rate. The same process is applied to measure the outside air intake flow and the return flow, although the fan in the measurement system is reversed to supply a positive air pressure rather than a negative pressure. Outside air supply rates (outside air is about 30% of the total supply air in this recirculating system) were set to 15 CFM per occupant, or 465 CFM to represent a class of 30

Classroom HVAC: Improving and Saving Energy (IVSE) Laboratory Study
7
students and one teacher. The three supply registers were be balanced to split the total supply flow equally (about 500 CFM per register). Air exchange rates were measured using a steady-state method. Two tracers were measured: CO2 and SF6. When using CO2, the air exchange rate was calculated after subtracting the outdoor CO2 concentration, using the CO2 source injection rate. The steady state tracer method involves injection of SF6 into the classroom at a constant rate using a low-flow pump to supply the pure gas from a multi-layer gas bag and calculating the air exchange rate from the steady state tracer concentration. The SF6 concentrations were measured with a portable Miran Sapphire infrared gas analyzer (Thermo Electron Corp., Waltham MA) with an internal datalogger and CO2 was measuring using the sensors described in Table 1. With the steady state method, the air exchange rate was calculated using Equation 1. a = Stracer /[(Css-Cout) V] (1) Where, a = the classroom air exchange rate (h-1), Stracer = the tracer gas (CO2 or SF6) source rate (m3 h-1), Css = the measured steady-state concentration of the tracer in the RC, Cout = the measured average outdoor concentration of the tracer at the time of indoor steady-
state measurements, and V = the internal volume of the RC (m3). The outside air supply rate (m3 h-1) measured in this fashion is merely: Q = Va (2) The source injection rates of CO2 and SF6 were set to 0.147m3 h-1 (2450 ml min-1) and 7.5x10⁻⁴ m3 h-1 (12.5 ml min-1), respectively. Due to instrument failure during the March 2005 testing period no usable CO2 or SF6 data were collected.
Modeling of HVAC energy efficiency The mathematical model used in this study to compare the energy efficiency of the IHPAC to the standard 10 SEER HVAC system is as follows. A stream of air with flow rate Qr (m3/sec), at Tr (°C) dry-bulb temperature and φr (% RH), is returned and mixed with a stream of outdoor air with flow rate Qo (m3/sec) at To (°C) dry-bulb temperature and φo (% RH). The resulting mixture is then processed through the heat pump and supplied into the indoor. The supply air flow rate Qs (m3/sec), is at Ts (°C) dry-bulb temperature and φs (% RH). The total amount of cooling (indoor heat withdrawn) and heating (indoor heat addition), performed by the heat pump, can be calculated as shown in equation (3). The required properties (mi, hi) come from the measured Ti, φi, and Qi (i=o(outdoor), s(supply), r(room)) as shown in equations (4)~(9).

Classroom HVAC: Improving and Saving Energy (IVSE) Laboratory Study
8
Total performed cooling or heating = ∫mrhr - hsdt + ∫moho - hsdt (3) when Tr > To (heating) or Tr < To (cooling). Where t is the time variable
im = iQiν (kg sec-1), (4)
Qi = volumetric flow rate at the point i (m3 sec-1, measured property in this study), νi = specific volume of the moist air at point i (m3 kg-1),
iν =Ra iT
P1+1.6078 iw( ), (5)
Ra = universal gas constant 8.31441 KJ Kg-1 mol-1 K-1, Ti = absolute temperature at point i (°K, measured property in this study), P = total pressure (Pa), Wi = humidity ratio of the moist air at point i (Kg water vapor per Kg dry air),
iw = 0.62198 wiPP − wiP , (6)
wiP = partial pressure of the vapor at point i (Pa), PP wsiiwi φ= (7)
=φi relative humidity at point i, (dimensionless, measured property in this study) =Pwsi saturation pressure of water vapor at point i (Pa),
( )( )TCTCTCTCCTCP i133i12
2i11i109i8wsi ln/exp +++++= , and where (8)
2206.5800C8 −= , 3914993.1C9 = ,
04860239.0C10 −= , 10C 4
11 41764768.0 −•= , 10C 7
12 14452093.0 −•−= , 5459673.6C13 = , and where
( )twth iiii 805.12501 ++= , with (9) =hi the moist air enthalpy at point i ( KJ Kg-1 dry air), =ti dry-bulb temperature at point i (°C, measured property in this study).
The overall performance of an installed heat pump system can be described by a Performance of the Heat Pump System (PHPS). PHPS is defined as the total amount of cooling and heating divided by the total electricity consumption in operating a heat pump.
pumpheat by the consumedy electricit totalheating and cooling totalPHPS = (10)
PHPS measures how much cooling or heating is provided for each unit of electricity energy consumed. This metric incorporates the comprehensive results of the heat pump performance,

Classroom HVAC: Improving and Saving Energy (IVSE) Laboratory Study
9
thermal performance of the building envelope, indoor flow effectiveness, and the controllers’ performance.
HVAC testing schedule In order to test both the 10 SEER system and the IHPAC system in both heating and cooling modes it was necessary to conduct tests in both cooling and heating seasons. The study began with testing of the 10 SEER HVAC system in September 2004. Unfortunately, due to delays, delivery schedules, and weather, only a few days of cooling data were collected for the 10 SEER system prior to installation of the IHPAC. Again, only a few days of cooling data were collected on the IHPAC system prior to a change in weather. The IHPAC was operated on a continual basis from September 27 to November 24. Some days of mixed heating and cooling occurred. In March of 2005 more 10 SEER data were collected with both heating and cooling periods.
HVAC operation modes and simulated occupancy The 10 SEER system was operated in the recommended operation mode with the outside air ventilation fan on continuously and heat pump compressor operating on demand from the thermostat. The thermostat was scheduled to turn on in the morning at 8:00 AM and off at 3:30 PM. The IHPAC was operated using the Bard automatic controller described above. Thus, the outside air ventilation fan operated based on simulated occupancy as discussed below. In order to simulate student occupancy, timers were set up to control a number of functions on a pre-set schedule: sensible heat generation, carbon dioxide generation, and occupancy. The classroom had a standard desk layout using two rows of three 76cm (30”) by 2.4m (8’) tables centered in the middle of the classroom. Thirty 60W light bulbs, connected to a timer, were placed along the length of the tables to simulate the heat load of thirty students. A pipe with sections of porous tubing (1/2” drip irrigation tubing) was run along the table above the light bulbs, connected to a cylinder source of pure CO2 metered into a mixing chamber through a mass flow controller. On signal from the timer, the air pump mixed the CO2 with room air and pumped it through the porous tubing. The source rate of CO2 (2450 ml min-1) was selected to simulate respiration from 30 students. Due to instrument failure during the March 2005 testing period no usable CO2 data were collected. The IHPAC control system senses occupancy with an infrared occupancy sensor. To trigger the occupancy sensor at the desired times, a mirror mounted on a motor revolving at about 6 RPM was used to reflect light off of a heat lamp. The motor and lamp were actuated using a timer as well. The controller reliably sensed occupancy conditions when the infrared heat signal from this assembly was turned on. The timer schedule was set to Monday through Friday from 8:00h to 14:00h. A 45 minute lunch break at noon, and two fifteen minute recess breaks at 10:00 and 13:30h were included when occupancy was set to zero by turning off the timer switch. During these times the IHPAC occupancy sensor reported no occupancy, and the CO2 injection and light bulbs were turned off. The 10 SEER system was not turned off during these breaks, so its operation was dependent upon the thermal loads in the RC.

Classroom HVAC: Improving and Saving Energy (IVSE) Laboratory Study
10
Acoustic noise experimental setup and testing Acoustic noise levels in the RC were measured for both the 10 SEER and IHPAC units under a range of operational modes and conditions. In addition, the 10 SEER HVAC unit was operated and tested using two experimental sound abatement approaches: an on-site fabricated return wall sound plenum, and a Bard prototype sound curb. These are described more fully below. The sound measurement protocol consisted of measuring the acoustic spectra of sound pressure levels at distance of 3, 6, and 9 meters (10’, 20’, and 30’) from (and perpendicular to) the rear wall of the RC and at a distance of 3 meters at a angle of 45 degrees off of the rear wall, all at a height of 150 cm (5’). The sound pressure spectra were measured at these locations under the following conditions: all devices in the RC turned off, lights on only, the HVAC outdoor air fan on only, the HVAC fans and compressor on, and in the case of the IHPAC, the fans and compressor on in second stage mode. The measurements were conducted both with lights on, and with lights off. A full set of measurements were also collected at a height of 91 cm (3’), but the sound levels were very close to those at 150 cm, so these measurements were discontinued. The sound level measurements that are presented in this paper are from the lights-off conditions for the purpose of inter-comparison between the different systems and modes. Sound pressure spectra were measured with and without weighting. Noise Criteria (NC) values (ASHRAE, 2005) were calculated from un-weighted measured sound pressures. A-weighted sound pressures (dB(A))were recorded using the B&K sound level meter’s internal software. Measured dB(A) and NC levels are both presented in this paper as they are the two most commonly used metrics for assessing indoor noise level conditions in classrooms and other occupied indoor environments. RESULTS AND DISCUSSION HVAC Installation The IHPAC system was installed at the LBNL RC test bed in September 2004. To make room for the IHPAC, one of the two existing 10 SEER systems and the associated supply plenum was removed and stored for future replacement. The IHPAC and its supply plenum were installed on the existing wall with no alterations to the framing, siding, or interior wall. The replacement was an exact fit and the return register did not need to be moved or altered. No power wiring changes were required. New wiring for the smart control system was required, but was not an involved installation. HVAC Control, Temperature and Humidity
HVAC control The 10 SEER HVAC control worked as designed. During the daily-simulated occupancy periods with 10 SEER operation, the thermostat was set to manual fan in order to simulate the Title 24 requirement for continuous ventilation during occupancy. No problems in function were observed. The IHPAC system smart controller was somewhat problematic during the entire laboratory study. The basic functions worked as expected: Thermal control, occupancy sensing to control outdoor air supply, and the learned pre-occupancy ventilation purge worked without problems. However, during the heating season the smart controller was observed to switch to cycle heating on during the night when indoor temperatures were not below the setback temperature (55°F). This problem led to frequent heating of the RC during the nighttime. For

Classroom HVAC: Improving and Saving Energy (IVSE) Laboratory Study
11
this reason, the energy analyses below are provided for both school day and 24-hour time periods. Note that this problem was subsequently traced to the value of a time constant in the smart controller software and has been fully remedied, however this fix did not occur until the field study component of this project was under way.
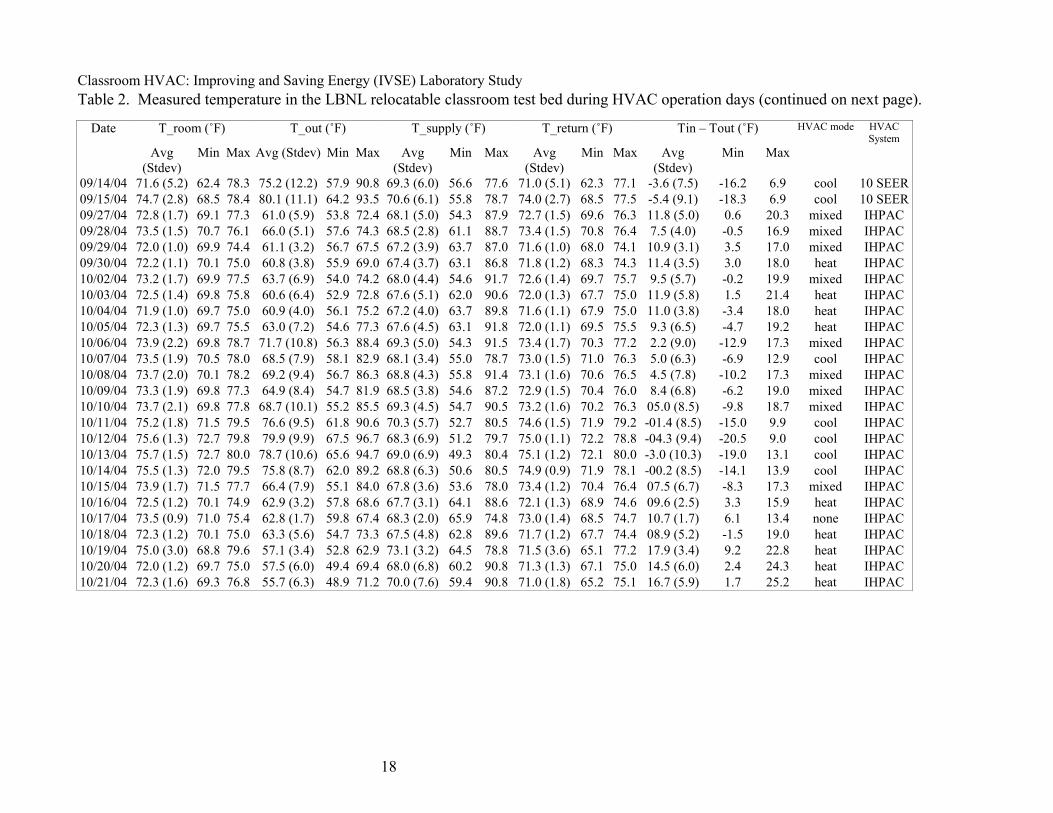
Measured Temperature and Humidity Table 2 presents measured temperature data for each study school day (08:00 to 15:00h periods) in the RC for both the 10 SEER and IHPAC HVAC systems. The tables also show whether the HVAC system was operating in cooling, heating, or mixed heating and cooling mode (i.e., heating in AM and cooling in PM). Measurement statistics include average, standard deviation, minimum and maximum values. Across both HVAC systems, the school day average indoor temperatures during cooling days ranged from 71.6 °F to 78.0°F with an average across the study of 75.4 °F. Similarly, for heating, the temperature range was 69.8°F to 75.0°F with an average across the study of 71.8°F. During days with mixed heating and cooling the temperature range was 70.3°F to 75.1°F with an average across the study of 73.1°F. Average school day outdoor temperatures ranged from 58.7°F to 80.1°F, 59.0°F to 65.5°F, and 55.9°F to 71.7°F for cooling, heating and mixed-mode conditioning, respectively. Averaged school day average indoor temperatures during 10 SEER and IHPAC cooling operation days were within 1.5 °F, and a Student’s t-test indicated that the temperature distributions were not statistically different (p<0.05). During heating mode test days, average school day indoor temperatures were within 0.5 °F but were statistically different (p>0.05). Further details may be seen or calculated from complete data in Table 2. Temperature control appeared to be adequate in both systems, with average temperatures falling close to the set points of 75°F for cooling and 72°F for heating. The differences seen between systems are likely to be due to slight differences in operation and calibration of thermostats. Certainly thermal comfort due to temperature alone would not be different between the two HVAC systems based on the data collected. Similarly, Table 3 presents measured RH data for each study school day in the RC for both the 10 SEER and IHPAC HVAC systems. Across both HVAC systems, the school day average indoor RH during cooling days ranged from 22.3% to 52.0% with an average across the study of 39%. Similarly, for heating, the RH range was 24.2% to 52% with an average across the study of 44.3%. During days with mixed heating and cooling the RH range was 35.1% to 52.1% with an average across the study of 46%. Average school day outdoor RH ranged from 21.8% to 89.9%, 34.4% to 95.5%, and 45.5% to 86.9% for cooling, heating and mixed-mode conditioning, respectively. Mean school day average RH during 10 SEER (42% RH) and IHPAC (30.5% RH) cooling operation days were different by almost 12% RH, and a Student’s t-test indicated that their RH distributions were statistically different (p>0.05). During heating mode test days, the average school day RH was much closer (10 SEER= 45.9%; IHPAC = 43.7%), within <3% RH but were still statistically different (p>0.05). Further details may be seen or calculated from complete data in Table 3. That the average indoor RH was so different between HVAC systems during cooling mode periods was due to a greater difference in outdoor RH during the different testing periods. The corresponding average school day outdoor RH was 55.2% and 38.4% for the 10 SEER and
Classroom HVAC: Improving and Saving Energy (IVSE) Laboratory Study
12
IHPAC, respectively. In contrast, the mean school day average outdoor RH levels were 73.7% and 75.4% during heating mode periods for the 10 SEER and IHPAC, respectively. As would be expected when using a vapor compression system, some water is removed from the conditioned air during cooling, reducing the absolute humidity in the supply air. The reader should bear in mind that during these tests only sensible load, and no latent load, was added during the “occupied” time periods. Thus a real comparison of thermal comfort that includes the humidity component is not addressed here. These comparisons will be available in the field component of this project. Indoor CO2 Table 4 summarizes school day statistics for Indoor CO2 measured at the center of the RC at a height of 1.5 m. With the exception of one day (10/19) the mean school day average CO2 concentration during IHPAC operation was 493±45 ppm and the minimum and maximum average concentrations were 390 and 560 ppm, respectively. The only 10 SEER measurements captured in this table are for 9/15/04, and the CO2 concentrations for that day are consistent with those from the IHPAC dates. On three days (10/18, 11/17, & 11/18) the outdoor air supply was turned off during part of the day leading to elevated CO2 concentrations. Outdoor Air Supply Rate Measurement Table 5 summarizes the outdoor, and HVAC supply and return CO2 concentrations for each study school day period where data were recorded, as well as calculated outside air flow rates calculated using Equation 2. These data are consistent with those in Table 4 in terms of concentration, and have been used primarily for calculation of outside air supply rates for verification of the IHPAC ventilation and for energy analyses. As discussed above, both the 10 SEER and IHPAC systems were adjusted to provide 480 CFM (32 occupants * 15 CFM occupant-1; 224 l sec-1 = 806 m3 h-1), based upon the California Title 24 and ASHRAE 62.1 ventilation standards. The average outside airflow rates (excluding the three dates discussed above) based on these measurements are 492±76 CFM (837±129 m3 h-1), very close to the rates set using a duct flow hood during installation. Table 7 provides a summary of measured indoor and outdoor SF6 tracer gas concentrations. As with the CO2 tracer, SF6 was used to measure ventilation rates. Calculated outdoor air supply rates (excluding the 10/18/04 measurements) for the study IHPAC study dates averaged 497±31 CFM (845±53 m3 h-1), on average within 1% of the rates measured using CO2 as a tracer. Energy Efficiency Comparisons Table 8 lists daily-calculated PHPS values for the 10 SEER and IHPAC systems calculated as discussed above using Equation 10. Table 9 summarizes these data, showing estimated system efficiencies for the 10 SEER and IHPAC units. Study days with zero or minimal conditioning loads were not included in these analyses. Data are presented both for conditioning loads over the school-day hours and for each 24-hour study day. Due to night-time heating conditions on many days the 24-hour conditioning energy loads and consumption were considerably greater than those for the school-day periods. The 10 SEER unit PHPS values were 2.4 and 3.3 for cooling and heating, respectively. The IHPAC system PHPS corresponding values were 4.3 and 5.2, respectively. The ratio of 10 SEER to IHPAC school day PHPS values were 0.56 for cooling and 0.63 for heating, and 0.59 overall. Using this approach the we find that the
Classroom HVAC: Improving and Saving Energy (IVSE) Laboratory Study
13
efficiency of the IHPAC is about 44% more efficient during cooling and 37% more efficient during heating than the 10 SEER system. The PHPS ratio calculated across all (heating and cooling) measurements should be interpreted with caution since it is comprised of a mix of heating and cooling data that is not weighted in any way. Since many more days of heating measurements are in the dataset the ratio is skewed towards the heating mode. Figure 3 is a plot of the amount of heat and cooling provided by the 10 SEER and IHPAC HVAC systems during school day periods calculated as described in Equation 3 above, plotted versus school day measured HVAC electricity consumption. Figure 4 plots a similar set of data for daily 24-hour monitoring periods. The least square regression fits of these data are tabulated in Table 10. The regression data show good-to-excellent fits. The regression line slopes are the best-fit relationship equivalent to PHPS. The ratio of 10 SEER system slopes to IHPAC slopes are compared to their analogous PHPS ratios in the table. Not surprisingly, they are very similar, differing by only a few percent. The 24 hour energy efficiency calculations are all presented in the tables and figures, but should be interpreted with some caution because the 10 SEER system was never operated during the nighttime while the IHPAC was regularly operated for nighttime heating due to a controller software bug. These data are provided for completeness. It should also be noted that the enthalpy calculation method used in this analysis accounts for the thermal conditions of the RC structure such that the nighttime conditioning of the space is accounted for in the daytime energy balance. HVAC System Acoustic Noise Comparisons Table 11 summarizes acoustic noise levels measured during operation of the 10 SEER and IHPAC HVAC systems, as well as the two additional acoustic experiments when the prototype sound wall and prototype sound curb were tested. Octave band sound pressure levels (dB) for the test conditions and measurement position are included. This discussion will focus on the position 3m (10’) from the HVAC return and 1.5m (5’) above the floor. This position is frequently used by the RC industry and school facilities stakeholders as a test reference point for comparison. The 3m x 45 degree, 6m, and 12m measurement locations listed have consistently lower sound levels in these tests as would be expected since they are at a greater distance from the HVAC system. The measured A-weighed sound level [NC value] for fan only operation conditions for the 10 SEER and IHPAC systems were 53.5 dB(A) [NC-45] and 34.3 dB(A) [NC-25], respectively. Similarly, during the operation of the 10 SEER system compressor plus fan, and the IHPAC stage-1 compressor plus fan, sound levels were 55.2 dB(A) [NC-55] and 40.8 dB(A) [NC-35], respectively. During stage-2 plus fan operation the IHPAC sound level increased to 42.7 dB(A) [NC-40]. Thus, the IHPAC system noise reduction was about 19 dB(A), 14 dB(A), and 13 dB(A) for fan, stage-1, and stage-2, respectively. In terms of sound intensity the IHPAC fan noise is about 35 times quieter than the 10 SEER fan. Likewise the IHPAC compressor first and second stages are about 22 times and 20 times quieter than the 10 SEER system compressor, respectively. The sound wall and sound curb systems substantially reduced the noise levels from the 10 SEER system, but not to the low noise levels of the IHPAC.

Classroom HVAC: Improving and Saving Energy (IVSE) Laboratory Study
14
Summary and conclusions The installation and verification of the performance of the Improved HPAC (IHPAC) system, and its comparison the standard 10 SEER HVAC system was fully successful and suggested that the new system meets the goals set out for this project. These goals included the verification of physical characteristics suitable for direct replacement of existing 10 SEER systems, quantitative demonstration of improved energy efficiency, reduced acoustic noise levels, quantitative demonstration of improved ventilation control, and that it meets temperature control demands necessary for the thermal comfort of the occupants. The results of this extensive testing showed that with the exception of one small, and subsequently corrected problem that the IHPAC met these goals. The IHPAC was found to be a direct bolt-on replacement for the 10 SEER system. Calculated energy efficiency improvements based on many days of testing showed that the IHPAC system is about 44% more efficient during cooling and 38% more efficient during heating than the 10 SEER system. Noise reduction was dramatic, with measured A-weighed sound level for fan only operation conditions of 34.3 dB(A), a reduction of 19 dB(A) compared to the 10 SEER system. Similarly, the IHPAC stage-1 and stage-2 compressor plus fan sound levels were 40.8 dB(A) and 42.7 dB(A), reductions of 14 and 13 dB(A), respectively. Thus, the IHPAC is 20 to 35 times quieter than the 10 SEER systems depending upon the operation mode. The IHPAC system met the ventilation requirements and was able to provide consistent outside air supply throughout the study. Indoor CO2 levels with simulated occupancy were maintained below 1000 ppm. Finally temperature settings were met and controlled accurately. As discussed above, the only problem to arise was that the IHPAC software was causing the system to heat during unoccupied nighttime periods. This problem was subsequently solved and remedied in the field study. The goals of the laboratory testing phase were met and this system is ready for further testing in a field study of occupied classrooms. Acknowledgements We would like to acknowledge Maury Tiernan of Geary Pacific Supply for his tireless technical support and sharing of RC HVAC expertise. We also thank Scott Alexander of Mobile Modular Management for arranging the loan of the RC test bed for the study. Thanks also to Richard Diamond and Peng Xu of LBNL for their reviews of this manuscript. This research was sponsored by the California Energy Commission through the Public Interest Energy Research program as the Lawrence Berkeley National Laboratory Classroom HVAC: Improving Ventilation and Saving Energy research project, CEC Contract Number 500-03-041. The study was additionally supported by the Assistant Secretary for Energy Efficiency and Renewable Energy, Building Technology Program of the U.S. Department of Energy under contract DE-AC02-05CH11231 References ASA 2002. “Acoustical Performance Criteria, Design Requirements, and Guidelines for Schools.” ANSI S12.60-2002. Acoustical Society of America. Melville, NY 11747
Classroom HVAC: Improving and Saving Energy (IVSE) Laboratory Study
15
ASHRAE, 2005. ASHRAE Handbook-Fundamentals, “Chapter 7: Sound and Vibration,” Atlanta: American Society of Heating, Refrigerating and Air-Conditioning Engineers, Inc., Atlanta ASHRAE, 2004. ANSI/ASHRAE 55-2004 ASHRAE standard, Thermal Environmental Conditions for Human Occupancy, Atlanta: American Society of Heating, Refrigerating and Air-Conditioning Engineers, Inc., Atlanta. ASHRAE. American Society of Heating, Refrigerating, and Air Conditioning Engineers (ASHRAE). 2004. ANSI/ASHRAE 62, Ventilation for acceptable indoor air quality. American Society of Heating, Refrigerating and Air-Conditioning Engineers, Inc., Atlanta. California Title 24, 2001. California Building Standards, Title 24-Energy Efficiency, part six. California Energy Commission, Sacramento, CA. CARB/CDHS. 2003. “Report to the California Legislature. Environmental Health Conditions in California’s Portable Classrooms.” California Air Resources Board and the California Department of Health Services. Sacramento CA. CCR 1995. California Code of Regulations, Occupational Safety and Health Codes for non-residential buildings, Title 8. CEC 1999. Energy Efficiency Standards for Residential and Non-Residential Buildings. P400-98-001. California Energy Commission, Sacramento, CA Collaborative for High Performance Schools (CHPS). 2002. “HVAC Best Practices Manual.” CHPS Inc. http://www.chps.net/manual/index.htm Daisey, J and Angel, WJ. A Survey and Critical Review of the Literature on Indoor Air Quality, Ventilation, and Health Symptoms in Schools. Berkeley, CA: Ernest Orlando Lawrence Berkeley National Laboratory, Environmental Energy Technologies Division, Indoor Environment Department, March 1998. LBNL-41517 Daisey, J.M., W.J. Angel, and M.G. Apte (2003). Indoor Air Quality, Ventilation and Health Symptoms in Schools: An Analysis of Existing Information. Indoor Air, 13(1):53-64 Erdmann, C.A., Steiner, K.C,, Apte, M.G., (2002) “Indoor carbon dioxide concentrations and SBS symptoms in office buildings revisited: Analyses of the 100 building BASE Study dataset”. Proceedings of Indoor Air 2002 Conference, Monterey, CA, Vol. 3, pp. 443-448. Indoor Air 2002, Santa Cruz, CA Lagus Applied Technologies. 1995. Air Change Rates in Non-Residential Buildings in California. Report P400-91-034BCN, Prepared for the California Energy Commission by Lagus Applied Technology, Inc., San Diego, California.

Classroom HVAC: Improving and Saving Energy (IVSE) Laboratory Study
16
LAUSD. 1998. “LAUSD Specifications for Air Conditioning Systems (Wall Mount Heat Pump). Specifications data 7/5/98.” Los Angeles Unified School District, Los Angeles CA. Mudarri, D, Hall JD, and Welling E. 1996. Energy cost and IAQ performance of ventilation systems and controls. Proceedings of IAQ’96 Paths to Better Building Environments, pp 151-160. ASHRAE, Atlanta, GA. Seppanen, O.A., Fisk, W.J., and Mendel, M.J. (1999) Association of ventilation rates and CO2 concentrations with health and other human responses in commercial and institutional buildings. Indoor Air 9: 226-252. Shendell DG, Pill R, Fisk WJ, Apte MG, Blake D, Faulkner D (2004) Associations between classroom CO2 concentrations and student attendance. Indoor Air, 14 (3) 333-41. USEPA. 2004. “40 CFR Part 82. Protection of Stratospheric Ozone: Allowance System for Controlling HCFC Production, Import and Export; Direct Final Rule and Proposed Rule.” Federal Register 69(116):34024-34033. Wargocki P et al. (2002) Ventilation and health in non-industrial indoor environments: report from a European multidisciplinary scientific consensus meeting (EUROVEN). Indoor Air 12: 113-128. Walker, I.S., Wray, C.P., Dicker off, D.J., and Sherman, M.H. 2001. Evaluation of flow hood measurements for residential register flows. LBNL-47382, Lawrence Berkeley National Laboratory, , Berkeley, CA 94720.
Classroom HVAC: Improving and Saving Energy (IVSE) Laboratory Study
17
Tables Table 1. The field study instrumentation.
Parameters Instrument Location Accuracy Precision Range Power Optimum
Energy Products, ElitePRO
10SEER and IHPAC systems
<1% of reading, exclusive of sensor accuracy
12 bit (1 part in 4,096); 0.1 Volt, 0.01 Amp, 1 Watt, 1 VAR, 1 VA, 0.01 PF
4 channels of current, 0-6000A. 3 channels of voltage, 0-600 V ac or dc.
RH, Temperature The Energy Conservatory, Automated Performance Testing (APT) System
Ceiling Supply Return Outside
Temperature: +/- 0.25 °C (0 °C to 75 °C), +/- 0.5 °C (< 0 °C, > 75 °C) RH: +/- 5% ( 0 to 60% RH), +/- 8% RH at 90% RH (@ 25 °C, noncondensing)
0.025 °C @ -40 °C, 0.05 °C @ 21 °C, 1.0 °C @ 100 °C
Temperature: -40 °C to 100 °C RH: 0 to 100% RH
SF6, CO2 Thermo Electron Corporation, MIRAN SapphIRe
Ceiling Supply Return Outside
CO2: +/- 15% SF6: 10% up to 1.0 ppm, 20% from 1.0 ppm to 4.0 ppm
CO2: 1ppm SF6: 0.01 ppm
CO2: 0 to 1000 ppm SF6: 0 to 4 ppm
CO2 Fuji Electric Co., Infrared CO2 Controller (Type ZFP9)
Ceiling Supply Return Outside
+/- 1% 10 ppm 0 to 3000 ppm
Sound Brüel & Kjær, 2260 Observer
+/- 1% 0.1 db 80 dB (10 db to 90 dB)
Classroom HVAC: Improving and Saving Energy (IVSE) Laboratory Study
18
Table 2. Measured temperature in the LBNL relocatable classroom test bed during HVAC operation days (continued on next page).
Date T_room (˚F) T_out (˚F) T_supply (˚F) T_return (˚F) Tin – Tout (˚F) HVAC mode HVAC System
Avg (Stdev)
Min Max Avg (Stdev) Min Max Avg (Stdev)
Min Max Avg (Stdev)
Min Max Avg (Stdev)
Min Max
09/14/04 71.6 (5.2) 62.4 78.3 75.2 (12.2) 57.9 90.8 69.3 (6.0) 56.6 77.6 71.0 (5.1) 62.3 77.1 -3.6 (7.5) -16.2 6.9 cool 10 SEER09/15/04 74.7 (2.8) 68.5 78.4 80.1 (11.1) 64.2 93.5 70.6 (6.1) 55.8 78.7 74.0 (2.7) 68.5 77.5 -5.4 (9.1) -18.3 6.9 cool 10 SEER09/27/04 72.8 (1.7) 69.1 77.3 61.0 (5.9) 53.8 72.4 68.1 (5.0) 54.3 87.9 72.7 (1.5) 69.6 76.3 11.8 (5.0) 0.6 20.3 mixed IHPAC 09/28/04 73.5 (1.5) 70.7 76.1 66.0 (5.1) 57.6 74.3 68.5 (2.8) 61.1 88.7 73.4 (1.5) 70.8 76.4 7.5 (4.0) -0.5 16.9 mixed IHPAC 09/29/04 72.0 (1.0) 69.9 74.4 61.1 (3.2) 56.7 67.5 67.2 (3.9) 63.7 87.0 71.6 (1.0) 68.0 74.1 10.9 (3.1) 3.5 17.0 mixed IHPAC 09/30/04 72.2 (1.1) 70.1 75.0 60.8 (3.8) 55.9 69.0 67.4 (3.7) 63.1 86.8 71.8 (1.2) 68.3 74.3 11.4 (3.5) 3.0 18.0 heat IHPAC 10/02/04 73.2 (1.7) 69.9 77.5 63.7 (6.9) 54.0 74.2 68.0 (4.4) 54.6 91.7 72.6 (1.4) 69.7 75.7 9.5 (5.7) -0.2 19.9 mixed IHPAC 10/03/04 72.5 (1.4) 69.8 75.8 60.6 (6.4) 52.9 72.8 67.6 (5.1) 62.0 90.6 72.0 (1.3) 67.7 75.0 11.9 (5.8) 1.5 21.4 heat IHPAC 10/04/04 71.9 (1.0) 69.7 75.0 60.9 (4.0) 56.1 75.2 67.2 (4.0) 63.7 89.8 71.6 (1.1) 67.9 75.0 11.0 (3.8) -3.4 18.0 heat IHPAC 10/05/04 72.3 (1.3) 69.7 75.5 63.0 (7.2) 54.6 77.3 67.6 (4.5) 63.1 91.8 72.0 (1.1) 69.5 75.5 9.3 (6.5) -4.7 19.2 heat IHPAC 10/06/04 73.9 (2.2) 69.8 78.7 71.7 (10.8) 56.3 88.4 69.3 (5.0) 54.3 91.5 73.4 (1.7) 70.3 77.2 2.2 (9.0) -12.9 17.3 mixed IHPAC 10/07/04 73.5 (1.9) 70.5 78.0 68.5 (7.9) 58.1 82.9 68.1 (3.4) 55.0 78.7 73.0 (1.5) 71.0 76.3 5.0 (6.3) -6.9 12.9 cool IHPAC 10/08/04 73.7 (2.0) 70.1 78.2 69.2 (9.4) 56.7 86.3 68.8 (4.3) 55.8 91.4 73.1 (1.6) 70.6 76.5 4.5 (7.8) -10.2 17.3 mixed IHPAC 10/09/04 73.3 (1.9) 69.8 77.3 64.9 (8.4) 54.7 81.9 68.5 (3.8) 54.6 87.2 72.9 (1.5) 70.4 76.0 8.4 (6.8) -6.2 19.0 mixed IHPAC 10/10/04 73.7 (2.1) 69.8 77.8 68.7 (10.1) 55.2 85.5 69.3 (4.5) 54.7 90.5 73.2 (1.6) 70.2 76.3 05.0 (8.5) -9.8 18.7 mixed IHPAC 10/11/04 75.2 (1.8) 71.5 79.5 76.6 (9.5) 61.8 90.6 70.3 (5.7) 52.7 80.5 74.6 (1.5) 71.9 79.2 -01.4 (8.5) -15.0 9.9 cool IHPAC 10/12/04 75.6 (1.3) 72.7 79.8 79.9 (9.9) 67.5 96.7 68.3 (6.9) 51.2 79.7 75.0 (1.1) 72.2 78.8 -04.3 (9.4) -20.5 9.0 cool IHPAC 10/13/04 75.7 (1.5) 72.7 80.0 78.7 (10.6) 65.6 94.7 69.0 (6.9) 49.3 80.4 75.1 (1.2) 72.1 80.0 -3.0 (10.3) -19.0 13.1 cool IHPAC 10/14/04 75.5 (1.3) 72.0 79.5 75.8 (8.7) 62.0 89.2 68.8 (6.3) 50.6 80.5 74.9 (0.9) 71.9 78.1 -00.2 (8.5) -14.1 13.9 cool IHPAC 10/15/04 73.9 (1.7) 71.5 77.7 66.4 (7.9) 55.1 84.0 67.8 (3.6) 53.6 78.0 73.4 (1.2) 70.4 76.4 07.5 (6.7) -8.3 17.3 mixed IHPAC 10/16/04 72.5 (1.2) 70.1 74.9 62.9 (3.2) 57.8 68.6 67.7 (3.1) 64.1 88.6 72.1 (1.3) 68.9 74.6 09.6 (2.5) 3.3 15.9 heat IHPAC 10/17/04 73.5 (0.9) 71.0 75.4 62.8 (1.7) 59.8 67.4 68.3 (2.0) 65.9 74.8 73.0 (1.4) 68.5 74.7 10.7 (1.7) 6.1 13.4 none IHPAC 10/18/04 72.3 (1.2) 70.1 75.0 63.3 (5.6) 54.7 73.3 67.5 (4.8) 62.8 89.6 71.7 (1.2) 67.7 74.4 08.9 (5.2) -1.5 19.0 heat IHPAC 10/19/04 75.0 (3.0) 68.8 79.6 57.1 (3.4) 52.8 62.9 73.1 (3.2) 64.5 78.8 71.5 (3.6) 65.1 77.2 17.9 (3.4) 9.2 22.8 heat IHPAC 10/20/04 72.0 (1.2) 69.7 75.0 57.5 (6.0) 49.4 69.4 68.0 (6.8) 60.2 90.8 71.3 (1.3) 67.1 75.0 14.5 (6.0) 2.4 24.3 heat IHPAC 10/21/04 72.3 (1.6) 69.3 76.8 55.7 (6.3) 48.9 71.2 70.0 (7.6) 59.4 90.8 71.0 (1.8) 65.2 75.1 16.7 (5.9) 1.7 25.2 heat IHPAC

Classroom HVAC: Improving and Saving Energy (IVSE) Laboratory Study
19
Table 2 (continued) Measured temperature in the LBNL relocatable classroom test bed during HVAC operation days.
Date T_room (˚F) T_out (˚F) T_supply (˚F) T_return (˚F) Tin – Tout (˚F) HVAC mode HVAC System
Avg (Stdev)
Min Max Avg (Stdev) Min Max Avg (Stdev)
Min Max Avg (Stdev)
Min Max Avg (Stdev)
Min Max
10/22/04 72.2 (1.1) 69.9 74.9 61.0 (4.5) 54.2 72.5 67.5 (5.0) 62.3 90.8 71.6 (1.1) 68.5 76.0 11.3 (4.3) 1.1 19.3 heat IHPAC 10/23/04 71.7 (1.1) 69.6 75.1 56.5 (1.0) 55.0 59.3 67.6 (5.8) 62.8 91.7 71.5 (1.1) 70.0 75.6 15.2 (1.5) 10.7 19.5 heat IHPAC 10/24/04 72.0 (1.1) 69.7 74.9 60.7 (4.5) 53.7 69.4 67.9 (5.2) 62.5 92.9 71.8 (1.0) 69.9 75.7 11.3 (4.7) 2.9 20.8 heat IHPAC 10/25/04 71.9 (1.2) 69.2 74.9 59.2 (5.6) 51.5 69.6 68.0 (6.5) 61.2 92.6 71.6 (1.1) 69.4 76.4 12.7 (5.6) 3.3 22.5 heat IHPAC 10/26/04 72.0 (1.3) 69.2 75.3 55.9 (5.5) 49.6 67.6 68.4 (7.6) 59.3 92.2 71.6 (1.3) 69.4 75.8 16.1 (5.8) 3.6 25.0 heat IHPAC 10/27/04 71.9 (1.4) 68.6 75.0 52.1 (4.2) 47.0 60.4 69.2 (8.3) 58.6 92.2 71.6 (1.3) 69.0 75.8 19.9 (4.5) 10.5 27.3 heat IHPAC 10/28/04 71.9 (1.3) 68.8 75.2 56.0 (4.7) 48.5 62.9 68.5 (7.4) 59.6 93.8 71.7 (1.3) 68.9 76.1 15.9 (4.9) 8.1 25.5 heat IHPAC 10/29/04 72.6 (2.9) 66.2 88.2 59.5 (4.6) 52.1 68.6 68.8 (9.2) 43.9 107.9 72.1 (3.1) 66.0 90.1 13.1 (4.8) 3.1 22.4 mixed IHPAC 10/30/04 69.9 (1.3) 67.2 73.6 56.7 (4.2) 50.1 65.2 65.9 (6.5) 60.6 93.1 69.7 (1.4) 67.4 75.9 13.2 (4.5) 4.2 22.8 heat IHPAC 10/31/04 70.3 (1.2) 67.7 74.4 58.0 (6.1) 50.2 68.9 66.8 (5.5) 59.8 90.9 70.1 (1.2) 67.7 74.2 12.3 (5.8) 3.1 23.3 heat IHPAC 11/01/04 71.1 (1.4) 67.9 74.0 60.4 (6.1) 51.5 72.6 67.7 (5.0) 60.6 91.6 70.7 (1.4) 67.5 74.3 51.2 (9.4) 33.4 69.6 heat IHPAC 11/02/04 71.4 (1.6) 68.2 74.9 60.9 (5.9) 51.1 70.9 66.8 (4.6) 48.3 89.1 70.8 (1.5) 68.3 73.5 51.0 (8.8) 33.1 68.7 mixed. IHPAC 11/03/04 69.8 (1.4) 65.7 74.0 54.2 (2.8) 48.6 59.9 65.0 (5.7) 58.0 89.6 69.5 (1.3) 66.2 74.7 60.3 (5.2) 47.4 71.5 heat IHPAC 11/04/04 70.0 (1.5) 66.9 74.4 52.4 (3.0) 46.7 57.0 66.4 (8.0) 57.4 90.4 69.0 (2.2) 62.1 74.1 63.6 (5.9) 52.5 77.9 heat IHPAC 11/05/04 70.1 (1.4) 67.0 73.8 56.6 (4.6) 48.3 64.1 66.2 (6.1) 59.7 91.4 69.7 (1.4) 66.2 74.7 56.2 (8.1) 44.0 75.9 heat IHPAC 11/06/04 70.3 (1.3) 67.2 74.1 55.9 (4.3) 48.6 65.1 66.1 (6.4) 59.5 93.0 69.6 (1.5) 66.8 75.8 57.8 (8.0) 39.2 76.6 mixed. IHPAC 11/07/04 70.2 (1.2) 67.4 73.9 56.0 (2.8) 50.9 61.2 65.4 (5.7) 60.2 92.1 69.5 (1.6) 65.2 75.9 57.4 (5.6) 45.3 72.6 heat IHPAC 03/01/05 71.9 (1.7) 67.1 74.1 59.9 (5.6) 50.1 67.7 67.8 (7.3) 59.9 90.9 72.0 (1.9) 66.9 74.5 12.0 (5.9) 2.2 22.0 heat 10 SEER03/02/05 71.0 (1.4) 67.3 72.7 57.8 (4.3) 51.3 65.2 67.8 (7.4) 60.6 92.0 72.0 (2.0) 66.8 74.2 13.2 (4.6) 3.5 19.4 heat 10 SEER03/03/05 71.9 (1.6) 66.2 74.5 59.3 (5.6) 47.9 69.8 68.2 (7.4) 57.7 90.7 72.1 (1.8) 66.3 74.5 12.7 (5.8) 0.0 24.5 heat 10 SEER03/04/05 71.9 (1.8) 67.1 74.6 54.3 (3.4) 50.5 62.4 67.9 (8.0) 60.4 91.4 72.1 (2.0) 66.9 74.7 17.6 (4.7) 6.2 23.2 heat 10 SEER03/05/05 72.2 (1.3) 68.8 74.2 61.6 (8.3) 48.3 73.3 67.9 (6.4) 58.6 90.0 72.3 (1.5) 69.0 74.3 10.6 (8.2) -1.4 23.8 heat 10 SEER03/06/05 72.9 (1.0) 69.9 75.3 64.7 (8.7) 51.4 76.3 68.7 (5.8) 60.8 91.1 73.0 (1.2) 70.0 75.8 08.2 (8.3) -3.5 21.5 heat 10 SEER03/07/05 72.6 (1.1) 70.1 75.0 63.5 (7.0) 51.9 73.6 68.1 (6.0) 61.4 92.4 72.7 (1.3) 70.0 75.0 3.9 (15.0) -32.4 34.4 heat 10 SEER03/08/05 72.5 (1.0) 66.2 74.4 65.3 (8.7) 52.0 76.9 70.0 (6.8) 58.9 92.3 72.4 (0.9) 66.2 74.1 4.0 (17.5) -23.3 37.4 heat 10 SEER03/09/05 75.1 (3.2) 67.0 80.4 67.2 (10.1) 52.6 80.7 71.8 (5.6) 57.5 90.2 74.7 (2.9) 67.0 79.4 2.6 (20.9) -29.9 30.0 mixed 10 SEER03/10/05 76.9 (2.6) 71.5 81.9 73.6 (10.2) 57.6 86.7 71.2 (6.1) 58.1 83.8 76.5 (2.5) 71.1 81.3 -25.9 (16.2) -49.5 8.1 Cool 10 SEER03/11/05 78.0 (2.2) 74.2 83.1 76.5 (10.4) 60.2 88.6 72.2 (7.0) 56.3 86.5 77.3 (2.1) 74.1 82.6 -32.3 (20.9) -62.0 8.9 Cool 10 SEER03/12/05 76.4 (1.4) 73.2 78.6 58.7 (2.1) 55.3 61.4 69.7 (5.3) 55.0 76.1 76.0 (1.3) 73.0 77.9 20.2 (7.8) 7.9 40.0 Cool 10 SEER03/13/05 76.5 (2.6) 70.2 79.4 63.7 (6.3) 54.5 73.2 70.6 (6.2) 54.8 82.7 75.9 (2.5) 70.0 79.0 -2.8 (18.6) -35.5 26.2 Cool 10 SEER

Classroom HVAC: Improving and Saving Energy (IVSE) Laboratory Study
20
Table 3. Measured relative humidities in the LBNL relocatable classroom test bed during HVAC operation days (continued on next page).
Date RH_room RH_out RHsupply HVAC mode Avg
(Stdev) Min Max Avg (Stdev) Min Max Avg (Stdev) Min Max
HVAC Type
09/14/04 51.0 (8.0) 39.5 64.4 49.6 (21.2) 25.1 82.4 59.1 (10.6) 40.1 79.7 cool 10 SEER09/15/04 42.6 (1.9) 39.0 46.9 38.7 (11.0) 24.0 54.4 53.9 (12.1) 38.9 88.2 cool 10 SEER09/27/04 49.0 (1.8) 44.1 53.0 79.6 (14.2) 54.9 97.7 63.1 (8.8) 34.7 98.2 mixed IHPAC 09/28/04 49.4 (3.6) 43.9 55.6 69.7 (15.6) 47.4 94.9 63.2 (6.5) 35.3 74.3 mixed IHPAC 09/29/04 49.5 (1.5) 46.5 53.1 79.2 (7.0) 64.7 88.8 63.7 (6.6) 38.3 69.3 mixed IHPAC 09/30/04 47.4 (1.5) 44.2 50.8 74.0 (11.8) 51.2 89.3 60.5 (5.9) 34.7 68.8 heat IHPAC 10/02/04 46.9 (1.7) 42.7 51.0 70.4 (18.0) 47.7 96.3 61.2 (7.5) 30.7 88.9 mixed IHPAC 10/03/04 48.0 (1.6) 45.0 52.0 80.4 (16.6) 53.6 99.6 62.3 (8.3) 31.7 71.2 heat IHPAC 10/04/04 51.3 (1.3) 48.1 54.8 83.6 (10.5) 53.4 95.6 66.3 (7.2) 33.3 73.5 heat IHPAC 10/05/04 51.0 (1.5) 47.8 54.8 80.2 (18.3) 49.4 100.5 65.5 (7.7) 34.0 74.5 heat IHPAC 10/06/04 48.3 (1.8) 44.0 52.6 59.8 (16.9) 35.8 83.1 62.2 (10.2) 30.6 99.3 mixed IHPAC 10/07/04 52.0 (3.3) 45.8 57.7 71.1 (20.7) 40.6 100.2 68.1 (7.0) 48.8 96.1 cool IHPAC 10/08/04 51.0 (2.1) 45.1 56.0 68.9 (19.2) 37.8 94.1 66.4 (8.5) 32.1 98.6 mixed IHPAC 10/09/04 43.2 (5.0) 37.0 53.5 63.2 (21.3) 33.6 94.9 54.3 (7.6) 34.2 70.3 mixed IHPAC 10/10/04 35.1 (1.9) 30.9 38.8 45.5 (13.4) 25.3 64.8 43.5 (5.7) 23.5 63.0 mixed IHPAC 10/11/04 22.3 (3.1) 19.3 30.8 21.8 (6.5) 13.3 34.3 26.6 (4.2) 19.9 40.4 cool IHPAC 10/12/04 29.9 (2.2) 25.7 34.3 27.9 (8.0) 16.9 42.5 41.6 (9.6) 26.3 76.7 cool IHPAC 10/13/04 29.8 (3.1) 23.7 37.4 28.8 (6.8) 17.7 41.1 40.8 (10.9) 27.8 79.6 cool IHPAC 10/14/04 39.3 (4.3) 29.6 47.0 42.7 (8.8) 29.6 63.6 55.4 (13.7) 35.4 100.9 cool IHPAC 10/15/04 46.7 (1.7) 43.0 51.1 70.3 (17.4) 37.6 94.9 63.3 (7.9) 46.6 94.7 mixed IHPAC 10/16/04 47.1 (1.4) 44.7 50.6 74.0 (6.3) 63.0 84.0 60.7 (5.0) 32.5 66.0 heat IHPAC 10/17/04 52.1 (2.9) 45.5 58.6 86.9 (5.8) 76.7 95.0 68.8 (7.3) 47.3 76.2 none IHPAC 10/18/04 48.0 (2.7) 42.8 54.1 74.5 (18.1) 47.6 98.2 61.5 (8.8) 34.9 74.1 heat IHPAC 10/19/04 44.1 (4.9) 37.5 56.4 95.5 (2.6) 87.8 99.6 51.5 (9.2) 41.8 78.2 heat IHPAC 10/20/04 43.8 (1.6) 40.9 47.5 79.4 (19.3) 43.7 99.9 55.1 (10.0) 30.0 69.8 heat IHPAC 10/21/04 38.1 (1.2) 35.5 41.3 73.0 (14.0) 43.0 86.5 45.5 (9.1) 25.2 60.1 heat IHPAC

Classroom HVAC: Improving and Saving Energy (IVSE) Laboratory Study
21
Table 3 (continued). Measured relative humidities in the LBNL relocatable classroom test bed during HVAC operation days
Date RH_room RH_out RHsupply HVAC mode Avg
(Stdev) Min Max Avg (Stdev) Min Max Avg (Stdev) Min Max
HVAC Type
10/22/04 45.9 (1.4) 42.6 49.3 74.0 (12.6) 48.4 91.6 59.4 (7.7) 29.8 69.1 heat IHPAC 10/23/04 49.8 (3.4) 42.6 58.4 90.9 (4.5) 82.0 97.7 63.6 (10.2) 31.5 77.9 heat IHPAC 10/24/04 48.1 (1.8) 44.3 52.7 78.1 (13.7) 55.4 98.1 60.6 (8.1) 31.8 72.4 heat IHPAC 10/25/04 44.2 (1.5) 41.1 48.1 73.7 (14.3) 48.3 94.9 55.1 (8.9) 27.1 66.2 heat IHPAC 10/26/04 41.5 (2.8) 36.6 49.4 78.1 (18.3) 46.8 101.8 50.5 (9.8) 27.9 69.1 heat IHPAC 10/27/04 36.6 (1.8) 33.6 42.3 77.2 (13.0) 54.8 95.6 43.5 (8.9) 24.7 59.7 heat IHPAC 10/28/04 41.6 (1.6) 38.2 45.4 78.8 (11.2) 63.5 97.5 51.3 (9.8) 24.4 63.9 heat IHPAC 10/29/04 41.7 (3.2) 28.0 46.6 70.3 (15.4) 46.3 91.7 52.4 (12.1) 16.2 102.4 mixed IHPAC 10/30/04 48.5 (2.7) 40.3 53.2 85.0 (10.1) 64.3 97.4 61.9 (11.1) 24.4 72.0 heat IHPAC 10/31/04 38.3 (7.0) 27.2 51.6 61.1 (24.8) 25.6 98.3 45.5 (11.6) 25.8 69.5 heat IHPAC 11/01/04 24.2 (1.1) 21.6 26.3 34.4 (5.8) 23.0 46.1 28.1 (3.2) 15.9 33.9 heat IHPAC 11/02/04 36.3 (3.7) 29.3 45.2 56.7 (5.3) 43.9 64.5 46.7 (8.5) 20.9 97.2 mixed IHPAC 11/03/04 40.3 (3.5) 35.3 50.0 71.7 (8.4) 56.8 91.6 51.0 (7.0) 26.2 62.3 heat IHPAC 11/04/04 40.1 (1.6) 36.0 44.4 79.0 (7.0) 67.3 94.0 50.0 (10.8) 25.1 65.3 heat IHPAC 11/05/04 39.6 (1.7) 36.0 42.7 67.6(10.6) 51.4 85.7 49.3 (7.8) 23.1 59.3 heat IHPAC 11/06/04 46.4 (3.2) 37.7 52.4 84.0 (9.6) 61.6 97.6 59.7 (11.1) 23.4 70.6 mixed IHPAC 11/07/04 46.0 (1.7) 41.5 50.5 80.1 (6.6) 66.6 92.5 59.1 (8.7) 27.1 66.8 heat IHPAC 03/01/05 41.6 (1.0) 38.4 43.9 66.5 (14.9) 45.4 90.1 50.7 (8.6) 25.1 62.6 heat 10 SEER03/02/05 43.7 (2.6) 39.8 49.1 74.1 (15.4) 51.8 99.6 51.8 (9.2) 27.6 68.0 heat 10 SEER03/03/05 41.8 (1.8) 38.5 47.4 68.8(12.8) 48.6 92.7 50.6 (9.3) 24.3 62.4 heat 10 SEER03/04/05 46.9 (2.7) 43.5 54.6 91.5 (8.6) 69.3 99.5 57.7 (11.7) 27.4 71.5 heat 10 SEER03/05/05 46.7 (2.8) 41.5 53.5 75.2 (18.1) 47.1 100.2 58.3 (10.1) 26.6 69.0 heat 10 SEER03/06/05 46.3 (2.4) 41.6 50.4 68.0 (19.4) 42.7 94.6 57.0 (9.6) 27.4 69.7 heat 10 SEER03/07/05 48.2 (2.6) 44.9 55.1 72.0 (15.0) 50.5 96.5 60.1 (9.6) 28.0 69.0 heat 10 SEER03/08/05 52.0 (3.4) 45.7 57.7 74.1 (17.2) 52.2 97.4 61.4 (11.1) 26.7 71.3 heat 10 SEER03/09/05 48.2 (1.1) 45.1 52.3 74.4 (20.8) 48.8 101.8 65.1 (19.0) 30.3 100.5 mixed 10 SEER03/10/05 41.0 (3.8) 36.5 49.1 45.3 (14.0) 28.6 70.9 54.1 (9.6) 36.3 76.2 Cool 10 SEER03/11/05 36.5 (4.7) 30.9 44.2 39.9 (18.0) 22.4 71.3 47.6 (11.0) 29.3 77.3 Cool 10 SEER03/12/05 42.9 (1.6) 38.7 46.3 89.9 (5.3) 82.0 97.8 67.1 (15.3) 43.4 95.1 Cool 10 SEER03/13/05 41.6 (2.7) 38.5 48.2 67.8 (16.4) 44.7 93.9 59.8 (13.4) 32.8 87.0 Cool 10 SEER

Classroom HVAC: Improving and Saving Energy (IVSE) Laboratory Study
22
Table 4. School day CO2 concentrations measured in the center of the RC.
Date CO2 Concentration (ppm) HVAC Mode HVAC Type Avg (Stdev) Min Max
9/15/05 499 (63) 390 579 cool 10 SEER 9/28/04 486 (71) 390 595 mixed IHPAC 9/27/04 527 (89) 390 727 mixed IHPAC 9/29/04 493 (73) 390 607 mixed IHPAC 9/30/04 481 (69) 377 578 heat IHPAC 10/2/04 483 (69) 378 586 mixed IHPAC 10/3/04 484 (66) 381 583 heat IHPAC 10/4/04 488 (69) 393 593 heat IHPAC 10/5/04 491 (67) 390 594 heat IHPAC 10/6/04 505 (76) 389 606 mixed IHPAC 10/7/04 490 (71) 380 595 cool IHPAC 10/8/04 493 (73) 393 609 mixed IHPAC 10/9/04 477 (67) 379 577 mixed IHPAC 10/10/04 480 (69) 378 577 mixed IHPAC 10/11/04 391 (19) 347 456 cool IHPAC 10/12/04 429 (35) 375 538 cool IHPAC 10/13/04 426 (26) 374 508 cool IHPAC 10/14/04 485 (64) 421 625 cool IHPAC 10/15/04 505 (62) 397 600 mixed IHPAC 10/16/04 478 (66) 382 572 heat IHPAC 10/17/04 478 (66) 381 566 none IHPAC 10/18/04 493 (67) 387 599 heat IHPAC 10/19/04 1060 (468) 393 2177 heat IHPAC 10/20/04 488 (61) 388 588 heat IHPAC 10/21/04 542 (99) 408 909 heat IHPAC 10/22/04 546 (75) 432 698 heat IHPAC 10/23/04 527 (66) 429 623 heat IHPAC 10/24/04 538 (69) 433 651 heat IHPAC 10/25/04 545 (78) 432 708 heat IHPAC 10/26/04 536 (69) 430 678 heat IHPAC 10/27/04 516 (68) 407 710 heat IHPAC 10/28/04 510 (64) 406 617 heat IHPAC 10/29/04 560 (94) 416 834 mixed IHPAC 10/30/04 500 (64) 402 600 heat IHPAC 10/31/04 471 (77) 386 617 heat IHPAC 11/1/04 424 (22) 368 484 heat IHPAC 11/2/04 454 (26) 419 524 mixed IHPAC 11/3/04 499 (65) 394 615 heat IHPAC 11/4/04 476 (62) 389 599 heat IHPAC 11/5/04 527 (73) 418 645 heat IHPAC 11/6/04 504 (70) 396 619 mixed IHPAC 11/7/04 497 (66) 395 584 heat IHPAC

Classroom HVAC: Improving and Saving Energy (IVSE) Laboratory Study
23
Table 5. Measured indoor and outdoor carbon dioxide (CO2) concentrations and outside air ventilation supply rates in the LBNL RC Test Bed. Ventilation rates were calculated from indoor-minus outdoor steady-state CO2 concentrations. The indoor CO2 source injection rate was approximately 2450 mL min-1. Note that on 10/19 and 11/17-18 the outside air damper was closed for part of the day.
Test Outside Supply Return OA Flow HVAC HVAC Date Avg (Stdev) Min Max Avg (Stdev) Min Max Avg (Stdev) Min Max m3 h-1 CFM Mode Type
9/15/04 406 (20) 372 455 464 (35) 394 525 521 (58) 394 629 881 519 cool 10 SEER10/16/04 378 (7) 364 408 463 (63) 370 539 418 (31) 364 459 968 570 heat IHPAC 10/17/04 377 (8) 364 392 461 (63) 370 539 417 (32) 364 459 1006 592 None IHPAC 10/18/04 383 (12) 364 408 477 (65) 377 572 429 (34) 370 477 937 552 heat IHPAC 10/19/04 411 (25) 377 469 1040 (457) 385 1924 1016 (485) 385 1977 NA NA heat IHPAC 10/20/04 391 (8) 377 408 477 (60) 377 560 432 (32) 377 477 924 544 heat IHPAC 10/21/04 407 (19) 377 459 511 (103) 377 853 481 (114) 377 950 550 324 heat IHPAC 10/22/04 394 (8) 377 416 487 (68) 377 583 438 (36) 377 497 826 486 heat IHPAC 10/23/04 387 (5) 377 399 469 (60) 377 550 427 (32) 377 477 941 554 heat IHPAC 10/24/04 398 (8) 377 416 483 (62) 385 560 438 (34) 385 487 976 575 heat IHPAC 10/25/04 390 (7) 377 399 494 (73) 385 695 440 (38) 377 517 633 373 heat IHPAC 10/26/04 387 (9) 370 408 480 (62) 385 572 432 (33) 385 497 830 488 heat IHPAC 10/27/04 386 (6) 377 399 485 (67) 377 657 433 (33) 385 517 579 341 heat IHPAC 10/28/04 394 (8) 375 413 494 (63) 390 581 447 (34) 390 495 851 501 heat IHPAC 10/30/04 403 (9) 383 422 492 (64) 390 569 444 (33) 390 495 990 583 heat IHPAC 10/31/04 389 (13) 375 430 454 (79) 375 581 423 (46) 375 505 882 519 heat IHPAC 11/1/04 388 (11) 375 413 410 (18) 383 448 401 (13) 375 430 NA NA heat IHPAC 11/2/04 420 (17) 397 457 437 (29) 405 629 429 (18) 405 475 NA NA mixed IHPAC 11/3/04 387 (4) 375 397 486 (64) 383 581 440 (34) 383 515 818 481 heat IHPAC 11/4/04 390 (6) 375 397 473 (67) 383 581 433 (34) 383 495 947 558 heat IHPAC 11/5/04 414 (17) 390 466 517 (73) 405 655 469 (44) 405 536 862 507 heat IHPAC 11/6/04 403 (12) 383 422 491 (69) 390 581 448 (39) 383 505 816 480 mixed IHPAC 11/7/04 399 (8) 383 413 485 (65) 390 569 442 (36) 383 495 871 513 heat IHPAC 11/8/04 399 (12) 383 430 494 (66) 390 593 446 (36) 397 515 892 525 heat IHPAC 11/9/04 388 (7) 375 397 476 (64) 383 558 430 (33) 383 475 917 540 heat IHPAC
11/10/04 391 (5) 375 405 497 (73) 390 629 441 (35) 390 495 705 415 heat IHPAC 11/11/04 389 (5) 375 397 510 (71) 383 604 452 (38) 383 547 659 388 heat IHPAC 11/12/04 398 (10) 383 422 510 (80) 397 655 452 (41) 390 525 842 496 heat IHPAC 11/13/04 397 (10) 383 413 484 (66) 390 581 441 (34) 390 495 938 552 heat IHPAC 11/14/04 404 (17) 383 438 494 (76) 390 593 450 (45) 383 525 903 531 heat IHPAC 11/15/04 422 (15) 390 448 526 (78) 397 629 476 (41) 397 536 700 412 heat IHPAC 11/16/04 443 (30) 390 485 548 (96) 397 666 499 (62) 390 581 662 390 heat IHPAC 11/17/04 430 (49) 375 547 607 (226) 390 1206 563 (212) 383 1091 NA NA heat IHPAC 11/18/04 465 (51) 390 569 656 (223) 438 1186 602 (200) 422 1073 561 330 heat IHPAC

Classroom HVAC: Improving and Saving Energy (IVSE) Laboratory Study
24
Table 7. Measured indoor and outdoor sulfur hexafluoride (SF6) tracer gas concentrations and SF6–determined outside air ventilation supply rates in the LBNL RC Test Bed. Ventilation rates were calculated from indoor-minus outdoor steady-state SF6 concentrations. The indoor SF6 source injection rate was approximately 12.5 mL min-1.
Test Outside SF6 (ppb) Supply SF6 (ppb) Return SF6 (ppb) OA Flow HVAC HVAC Date Avg (Stdev) Min Max Avg (Stdev) Min Max Avg (Stdev) Min Max m3 h-1 CFM Mode Type
9/16/05 140 (9) 13 59 740 (169) 194 825 504 (130) 124 589 826 486 cool 10 SEER10/16/04 90 (53) 21 297 743 (433) 21 1801 670 (396) 21 1188 896 528 heat IHPAC10/17/04 81 (45) 20 240 713 (427) 27 1889 643 (364) 26 1097 972 572 none IHPAC10/18/04 70 (36) 11 190 648 (377) 11 1468 578 (344) 9 993 1003 590 heat IHPAC10/19/04 248 (144) 12 482 3360 (1914) 16 8589 2441 (1728) 15 5719 837 493 heat IHPAC10/20/04 82 (44) 17 247 728 (423) 17 1675 653 (396) 15 1179 680 400 heat IHPAC10/21/04 168 (550) 9 6368 737 (1188) 6 9096 442 (477) 6 1694 826 486 heat IHPAC10/22/04 76 (52) -1 273 996 (1180) 0 10123 772 (366) -2 1170 822 484 heat IHPAC10/23/04 63 (36) 1 125 720 (415) 1 1320 682 (440) -1 1528 839 493 heat IHPAC10/24/04 60 (35) -5 125 720 (414) -5 1394 661 (430) -8 1454 849 499 heat IHPAC10/25/04 70 (44) -5 348 809 (368) -3 1386 773 (379) -7 1432 880 518 heat IHPAC10/26/04 60 (33) -3 121 665 (396) -5 1256 663 (418) -7 1575 872 513 heat IHPAC10/27/04 58 (34) -2 128 698 (386) -2 1292 653 (407) -4 1550 859 505 heat IHPAC10/28/04 59 (43) -8 370 687 (423) -9 1290 691 (437) -11 1618 821 483 heat IHPAC11/2/04 938 (301) 142 1646 123 (191) 54 973 984 (180) 429 1250 805 474 mixed IHPAC11/3/04 648 (444) -22 1592 46 (41) -21 106 680 (425) -19 1200 871 512 heat IHPAC11/4/04 608 (416) -23 1702 35 (37) -23 107 863 (1232) -20 8009 901 530 heat IHPAC11/5/04 655 (452) -23 2662 35 (38) -23 112 934 (1413) -20 9620 878 517 heat IHPAC11/6/04 669 (421) -23 1126 40 (48) -21 277 838 (1078) -18 9487 816 480 mixed IHPAC11/7/04 658 (418) -30 1131 37 (49) -29 234 822 (926) -28 8348 818 482 heat IHPAC11/8/04 685 (423) -35 1190 35 (56) -34 303 697 (468) -30 1511 838 493 heat IHPAC11/9/04 661 (423) -35 1160 37 (52) -35 231 703 (475) -32 1669 831 489 heat IHPAC
11/10/04 662 (420) -35 1154 36 (61) -36 293 686 (465) -33 1604 837 493 heat IHPAC11/11/04 673 (432) -39 1184 34 (65) -41 329 709 (473) -37 1604 839 494 heat IHPAC

Classroom HVAC: Improving and Saving Energy (IVSE) Laboratory Study
25
Table 8. Performance of the heat pump system (PHPS) by date, on test dates shown. PHPS is the ratio of total enthalpy change of airstreams to energy consumed by the HVAC systems. Data are shown for heating, cooling, and mixed conditioning days for both 10 SEER and IHPAC systems for both school hours and 24 hour periods.
Study Date PHPS (school)
PHPS (24h)
HVAC Mode
09/14/2004 3.55 2.61 10 SEER Cool 09/15/2004 2.83 2.51 10 SEER Cool 09/27/2004 4.76 7.01 IHPAC mixed09/28/2004 1.94 4.65 IHPAC mixed09/29/2004 7.30 4.81 IHPAC mixed09/30/2004 5.95 6.83 IHPAC heat 10/02/2004 3.68 4.92 IHPAC mixed10/03/2004 3.88 5.34 IHPAC heat 10/04/2004 2.59 3.75 IHPAC heat 10/05/2004 4.01 5.48 IHPAC heat 10/06/2004 5.36 5.68 IHPAC mixed10/07/2004 4.25 4.61 IHPAC cool 10/08/2004 5.26 6.64 IHPAC mixed10/09/2004 4.41 5.97 IHPAC mixed10/10/2004 4.86 7.20 IHPAC mixed10/11/2004 5.10 5.92 IHPAC cool 10/12/2004 4.32 3.90 IHPAC cool 10/13/2004 4.11 4.11 IHPAC cool 10/14/2004 3.92 3.88 IHPAC cool 10/15/2004 3.60 4.59 IHPAC mixed10/16/2004 1.55 3.09 IHPAC heat 10/17/2004 1.29 1.56 IHPAC none 10/18/2004 3.32 4.79 IHPAC heat 10/19/2004 6.80 7.77 IHPAC heat 10/20/2004 4.35 6.92 IHPAC heat 10/21/2004 4.60 8.86 IHPAC heat 10/22/2004 3.60 7.40 IHPAC heat 10/23/2004 5.97 7.70 IHPAC heat
Study Date PHPS (school)
PHPS (24h)
HVAC Mode
10/24/2004 3.40 7.79 IHPAC heat 10/25/2004 3.97 7.12 IHPAC heat 10/26/2004 4.93 7.73IHPAC heat 10/27/2004 5.27 8.11 IHPAC heat 10/28/2004 4.61 7.81 IHPAC heat 10/29/2004 4.00 8.54 IHPAC mixed 10/30/2004 4.81 7.51 IHPAC heat 10/31/2004 6.39 9.38 IHPAC heat 11/01/2004 5.41 9.42 IHPAC heat 11/02/2004 4.10 8.55 IHPAC mixed 11/03/2004 6.91 8.27 IHPAC heat 11/04/2004 5.35 6.40 IHPAC heat 11/05/2004 5.29 6.82 IHPAC heat 11/06/2004 4.44 5.58 IHPAC mixed 11/07/2004 4.80 6.08 IHPAC heat 11/08/2004 5.99 7.07 IHPAC heat 11/09/2004 6.73 7.57 IHPAC heat 11/10/2004 7.80 7.38 IHPAC heat 11/11/2004 9.21 8.41 IHPAC heat 11/12/2004 6.39 6.67 IHPAC heat 11/19/2004 5.09 5.76 IHPAC heat 11/22/2004 5.36 6.88 IHPAC heat 11/23/2004 4.81 5.66 IHPAC heat 11/24/2004 4.37 5.09 IHPAC heat 03/01/2005 2.69 3.64 10 SEER heat 03/02/2005 2.81 3.47 10 SEER heat 03/03/2005 2.98 3.67 10 SEER heat 03/04/2005 3.80 3.71 10 SEER heat 03/05/2005 3.49 3.56 10 SEER heat 03/06/2005 3.59 3.42 10 SEER heat 03/07/2005 3.00 3.14 10 SEER heat 03/08/2005 3.62 3.37 10 SEER heat 03/09/2005 2.78 2.84 10 SEER mixed 03/10/2005 2.25 2.30 10 SEER cool 03/11/2005 1.88 1.87 10 SEER cool 03/12/2005 2.17 2.15 10 SEER cool 03/13/2005 1.95 2.08 10 SEER cool
Table 9. Average and standard deviation of PHPS by HVAC type and by conditioning mode.
HVAC Avg (Stdev) 10 SEER cool 2.44 (0.64)10 SEER heat 3.25 (0.24)10 SEER mixed 2.78 (-----)IHPAC cool only 4.34 (0.45)IHPAC heat 5.17 (1.4)IHPAC mixed (mostly heat) 4.31 (1.5)10SEER all 2.89 (0.63)IHPAC all 4.88 (1.4)
Ratios School Day
10 SEER/IHPAC (cool) 0.5610 SEER/IHPAC (heat) 0.6310 SEER/IHPAC (all meas.) 0.59
24-hours 10 SEER/IHPAC (cool) 0.52 10 SEER/IHPAC (heat) 0.50 10 SEER/IHPAC (all meas.) 0.46

Classroom HVAC: Improving and Saving Energy (IVSE) Laboratory Study
26
Table 10. Least Square regression fits between HVAC heating and cooling and HVAC Energy Consumption for both the 10 SEER and IHPAC and for aggregated heating and cooling data and separate space conditioning conditions. Statistics are presented for both school day and daily 24-hour data. PHPS ratios are also included for comparison purposes HVAC System
Conditioning Mode
Slope (kW/kW)
Fit (R2)
Regression Ratio
PHPS Ratio
School-Day Data 10 SEER cool 2.64 0.83 heat 3.23 0.57 All 3.03 0.81 IHPAC cool 4.30 0.90 heat 5.10 0.61 All Meas. 4.77 0.67 Ratio cool 0.61 0.56 heat 0.63 0.63 All Meas. 0.63 0.59
Daily 24 hour Data 10 SEER heat 3.50 0.93 cool 2.50 0.99 All Meas. 3.43 0.97 IHPAC cool 4.32 0.47 heat 7.42 0.90 All Meas. 7.04 0.83 Ratio cool 0.58 0.52 heat 0.47 0.50 All Meas. 0.49 0.46

Classroom HVAC: Improving and Saving Energy (IVSE) Laboratory Study
27
Table 11. Acoustic measurements in unoccupied LBNL RC Test Bed. Data include sound levels from the IHPAC, and a 10 SEER HVAC system under three different acoustic installation conditions. Measurements were made at four locations and with fan only, and compressor on. The IHPAC was operated in both Stage 1 and Stage 2 compressor modes. The 10 SEER compressor data are compared with both stages of the IHPAC system. These measurements were made with the RC lighting turned off. Background sound levels in the RC during these measurements, with all equipment off averaged 28±3.2 dB(A), meeting an NC-25 level.
Meas. Position
HVAC System/Configuration
Sound Pressure dB(linear) Sound Rating
Dist. x Ht. x ∠
63 Hz
125 Hz
250 Hz
500 Hz
1000 Hz
2000 Hz
4000 Hz
8000 Hz
NC Value
dB(A)
IHPAC 44.2 39.1 26.6 26.0 21.4 16.8 17.0 19.1 NC-25 34.310 SEER 49.2 50.9 48.4 43.6 44.4 41.2 36.9 29.4 NC-45 53.510 SEER Sound Wall 50.7 45.6 40.5 31.6 30.5 18.2 14.4 13.0 NC-30 41.2
FAN
10 x 5 10 SEER Sound Curb 47.9 43.3 36.7 32.4 26.4 19.3 16.3 20.1 NC-30 41.510 SEER 45.9 38.9 24.5 22.6 15.8 13.4 9.4 20.1 NC-25 32.810 SEER 50.6 49.4 43.4 39.5 39.4 35.1 31.4 26.0 NC-40 48.810 SEER Sound Wall 46.2 50.2 41.0 32.2 31.1 18.9 14.8 12.9 NC-35 42.5
FAN
10 x 5 x 45° 10 SEER Sound Curb 44.3 45.4 36.4 28.7 25.8 21.4 18.3 12.1 NC-30 41.2IHPAC 43.8 35.1 26.8 21.2 21.3 16.9 15.0 20.1 NC-25 32.010 SEER 47.0 44.4 40.2 37.9 36.1 33.7 29.1 24.4 NC-40 47.010 SEER Sound Wall 50.0 45.6 37.8 29.6 32.3 16.7 11.7 20.1 NC-35 39.9
FAN
20 x 5 10 SEER Sound Curb 43.2 41.0 37.7 31.4 26.8 19.4 13.6 20.1 NC-30 38.7IHPAC 38.5 32.8 23.0 19.3 19.7 13.3 11.1 20.1 NC-25 29.210 SEER 45.2 40.5 38.6 37.0 34.1 30.9 26.1 23.2 NC-35 44.810 SEER Sound Wall 51.0 46.9 32.9 29.0 33.8 16.5 10.4 20.1 NC-35 40.5
FAN
30 x 5 10 SEER Sound Curb 45.1 39.9 34.4 29.0 23.1 15.6 11.1 20.1 NC-25 36.9IHPAC 61.0 48.5 34.1 33.1 21.5 16.5 14.3 13.9 NC-40 40.810 SEER 66.8 55.5 57.5 44.6 43.3 39.9 36.8 31.5 NC-50 55.210 SEER Sound Wall 72.3 48.9 50.0 34.5 26.5 23.0 20.6 17.3 NC-55 49.1
STAGE1
10 x 5 10 SEER Sound Curb 66.7 50.6 39.4 35.2 32.9 25.7 23.8 19.9 NC-45 47.3IHPAC 55.5 51.5 31.5 33.0 19.1 13.3 10.8 20.1 NC-35 39.910 SEER 71.4 58.5 53.9 42.8 40.2 36.7 33.1 28.1 NC-55 54.410 SEER Sound Wall 62.2 51.2 43.6 35.3 28.7 21.7 18.6 16.3 NC-40 45.2
STAGE1
10 x 5 x 45° 10 SEER Sound Curb 59.2 49.5 40.0 33.7 29.7 23.0 20.0 16.9 NC-35 45.1IHPAC 54.3 43.3 30.7 26.1 18.0 12.0 18.0 20.1 NC-30 36.110 SEER 61.9 54.4 47.9 41.0 37.2 34.1 31.6 26.3 NC-40 50.510 SEER Sound Wall 70.1 52.0 45.6 32.2 25.5 17.0 14.3 12.3 NC-50 46.4
STAGE1
20 x 5 10 SEER Sound Curb 63.5 42.9 37.5 33.3 29.6 21.1 19.6 16.2 NC-40 41.9IHPAC 49.9 45.5 29.5 28.1 14.8 10.2 18.0 20.1 NC-30 34.610 SEER 60.9 48.3 44.7 40.1 35.0 32.3 29.0 24.7 NC-40 47.810 SEER Sound Wall 61.8 49.0 38.2 31.9 24.1 15.0 12.8 20.1 NC-40 41.9
STAGE1
30 x 5 10 SEER Sound Curb 65.8 43.3 33.8 32.6 26.0 18.9 16.6 13.9 NC-45 42.5IHPAC 60.8 52.1 36.3 33.0 30.1 24.2 16.6 12.1 NC-40 42.710 SEER 66.8 55.5 57.5 44.6 43.3 39.9 36.8 31.5 NC-50 55.210 SEER Sound Wall 72.3 48.9 50.0 34.5 26.5 23.0 20.6 17.3 NC-55 49.1
STAGE2
10 x 5 10 SEER Sound Curb 66.7 50.6 39.4 35.2 32.9 25.7 23.8 19.9 NC-45 47.3IHPAC 57.5 49.8 33.8 32.6 24.7 21.7 15.7 11.9 NC-35 40.610 SEER 71.4 58.5 53.9 42.8 40.2 36.7 33.1 28.1 NC-55 54.410 SEER Sound Wall 62.2 51.2 43.6 35.3 28.7 21.7 18.6 16.3 NC-40 45.2
STAGE2
10 x 5 x 45° 10 SEER Sound Curb 59.2 49.5 40.0 33.7 29.7 23.0 20.0 16.9 NC-35 45.1IHPAC 54.5 47.4 35.4 27.2 25.7 20.3 13.0 20.1 NC-30 38.810 SEER 61.9 54.4 47.9 41.0 37.2 34.1 31.6 26.3 NC-40 50.510 SEER Sound Wall 70.1 52.0 45.6 32.2 25.5 17.0 14.3 12.3 NC-50 46.4
STAGE2
20 x 5 10 SEER Sound Curb 63.5 42.9 37.5 33.3 29.6 21.1 19.6 16.2 NC-40 41.9IHPAC 50.0 43.0 31.1 28.7 21.0 19.0 14.0 20.1 NC-25 35.910 SEER 60.9 48.3 44.7 40.1 35.0 32.3 29.0 24.7 NC-40 47.810 SEER Sound Wall 61.8 49.0 38.2 31.9 24.1 15.0 12.8 20.1 NC-40 41.9
STAGE2
30 x 5 10 SEER Sound Curb 65.8 43.3 33.8 32.6 26.0 18.9 16.6 13.9 NC-45 42.5

Classroom HVAC: Improving and Saving Energy (IVSE) Laboratory Study
28
Figures
Figure 1. Photograph of interior of LBNL RC Test Bed depicting the occupant simulation system including 60W light bulbs (50% on in this case). Also note dual HVAC systems. The system on the left is the IHPAC and on the right is the 10SEER unit (sealed during IHPAC operation). The room monitoring sensors are located on the stand in the center. Duct and return sensor cables may be seen on the IHPAC side as well. Data from these sensors are logged using the APT datalogger seen on the left above the computer stand.

Classroom HVAC: Improving and Saving Energy (IVSE) Laboratory Study
29
Figure 2. External wall of LBNL RC Test Bed showing the 10 SEER (left) and prototype IHPAC (right) wall-mount units. Batt insulation seen above the IHPAC was used prior to completion of an insulated top discharge duct. The third HVAC system on the far left was the original system on this RC.

Classroom HVAC: Improving and Saving Energy (IVSE) Laboratory Study
30
Figure 3. HVAC heating and cooling versus HVAC Energy Consumption in both heating and cooling modes during school day periods (08:00 to 14:30 Monday – Friday).
y = 4.7688x
R2 = 0.6733
y = 3.0328x
R2 = 0.813
0
0.2
0.4
0.6
0.8
1
1.2
1.4
1.6
0 0.05 0.1 0.15 0.2 0.25 0.3 0.35 0.4
HVAC Energy Consumption (kW-Days)
IHPAC10 SEERLinear (IHPAC)Linear (10 SEER)
R2 = 0.813

Classroom HVAC: Improving and Saving Energy (IVSE) Laboratory Study
31
Figure 4. HVAC heating and cooling versus HVAC Energy Consumption in both heating and cooling modes during daily 24 hour periods).
y = 7.0386xR2 =
y = 3.4264xR2 =
0
1
2
3
4
5
6
7
0 0.2 0.4 0.6 0.8 1 1.2 1.4 1.6
HVAC Energy Consumption (kW-Days)
IHPAC10 SEERData Fit (IHPAC)Data Fit (10 SEER)
0.83
y = 3.4264x R2 = 0.97