Embed Size (px)
Citation preview

Imputation Strategies for Missing Continuous Outcomesin Cluster Randomized Trials
Monica Taljaard*, 1, Allan Donner2, and Neil Klar2
1 Ottawa Health Research Institute, Clinical Epidemiology Program, Ottawa Hospital,1053 Carling Avenue, Ottawa, Ontario, Canada
2 Department of Epidemiology and Biostatistics, Schulich School of Medicine,University of Western Ontario, Robarts Clinical Trials, Robarts Research, London, Ontario, Canada
Received 1 August 2007, revised 27 November 2007, accepted 3 March 2008
Summary
In cluster randomized trials, intact social units such as schools, worksites or medical practices – ratherthan individuals themselves – are randomly allocated to intervention and control conditions, while theoutcomes of interest are then observed on individuals within each cluster. Such trials are becomingincreasingly common in the fields of health promotion and health services research. Attrition is a com-mon occurrence in randomized trials, and a standard approach for dealing with the resulting missingvalues is imputation. We consider imputation strategies for missing continuous outcomes, focusing ontrials with a completely randomized design in which fixed cohorts from each cluster are enrolled priorto random assignment. We compare five different imputation strategies with respect to Type I and TypeII error rates of the adjusted two-sample t-test for the intervention effect. Cluster mean imputation iscompared with multiple imputation, using either within-cluster data or data pooled across clusters ineach intervention group. In the case of pooling across clusters, we distinguish between standard multi-ple imputation procedures which do not account for intracluster correlation and a specialized procedurewhich does account for intracluster correlation but is not yet available in standard statistical softwarepackages. A simulation study is used to evaluate the influence of cluster size, number of clusters,degree of intracluster correlation, and variability among cluster follow-up rates.We show that cluster mean imputation yields valid inferences and given its simplicity, may be anattractive option in some large community intervention trials which are subject to individual-level attri-tion only; however, it may yield less powerful inferences than alternative procedures which pool acrossclusters especially when the cluster sizes are small and cluster follow-up rates are highly variable.When pooling across clusters, the imputation procedure should generally take intracluster correlationinto account to obtain valid inferences; however, as long as the intracluster correlation coefficient issmall, we show that standard multiple imputation procedures may yield acceptable type I error rates;moreover, these procedures may yield more powerful inferences than a specialized procedure, espe-cially when the number of available clusters is small. Within-cluster multiple imputation is shown to bethe least powerful among the procedures considered.
Key words: Adjusted two-sample t-test; Attrition; Community intervention trial, Intraclustercorrelation; Mean imputation; Multiple imputation
1 Introduction
In cluster randomized trials, intact social units such as schools, worksites or medical practices –rather than individuals themselves – are randomly allocated to intervention and control conditions,while outcomes of interest are then observed on individuals within each cluster. Such trials are becom-
* Corresponding author: e-mail: [email protected], Phone: +01 613 798 5555, Fax: +01 613 761 5402
Biometrical Journal 50 (2008) 3, 329–345 DOI: 10.1002/bimj.200710423 329
# 2008 WILEY-VCH Verlag GmbH & Co. KGaA, Weinheim
ing increasingly common in the fields of health promotion and health services research; moreover,cluster randomized trials have become the gold standard for evaluating interventions designed tochange health care professional practices, that is, in the field of implementation research (Campbell,Millison and Grimshaw, 2001). A key characteristic of cluster randomized trials is the presence ofintracluster correlation, usually quantified by the intracluster correlation coefficient q. Failing to ac-count for q in the analysis is likely to result in spuriously significant results and confidence intervalswhich are too narrow (Donner and Klar, 2001).
In typical applications, the number of available clusters is limited, but a relatively large number ofindividuals are then enrolled in each cluster. For example, in the Community Intervention Trial forSmoking Cessation (COMMIT) (Gail et al., 1992), twenty-two communities were randomized withinmatched pairs to either an active community-based intervention or a control intervention. Smokingquit rates were then evaluated in cohorts of approximately 550 heavy smokers and 550 light-to-moder-ate smokers in each community, followed over 4 years. The investigators also compared changes insmoking prevalence based on independent cross-sectional surveys conducted in each community be-fore and after the intervention. An advantage of a cross-sectional design is that the problem of loss tofollow-up is circumvented –– although non-response in the cross-sectional surveys can cause analo-gous problems (Feldman and McKinlay, 1994; Diehr et al., 1995). In this article, we focus on loss tofollow-up in studies with a cohort design, assuming that individuals are identified and enrolled priorto random assignment. For simplicity, we focus on studies with one follow-up observation only, as-suming that baseline covariates are completely observed. Loss to follow-up is a problem in any rando-mized trial because the protection against known and unknown confounders conferred by randomassignment is compromised. In addition to potential bias, loss to follow-up weakens the power of thetrial due to the reduction in the number of observed values. Cluster randomized trials add an addi-tional dimension to such concerns since not only individuals, but also entire clusters may be lost tofollow-up.
Two main approaches for dealing with missing outcomes are likelihood-based or Bayesian analyseson the one hand, and imputation (filling in the missing values with one or more suitable estimatesprior to the analysis) on the other hand (Little and Rubin, 2002). It is well-known that under certainassumptions about the missing data, valid inferences can be obtained through a likelihood-based ana-lysis without prior imputation, provided all available data are analyzed (Molenberghs and Kenward,2007). Thus, valid inferences from a cluster randomized trial with missing outcomes may be obtainedfor example, by means of linear or generalized linear mixed models. A key difference between thesetwo approaches is that in imputation, the missing data treatment and analysis procedures are distinct;as a result, variables thought to be correlated with loss to follow-up, but not necessarily of interest inthe analysis, can be used to account for missing data prior to analysis (Rubin, 1996; Rubin and Schen-ker, 1991; Schafer, 2001). In cluster randomized trials enrolling a constant number of participants ineach cluster, imputation may also restore balance in the presence of variable cluster follow-up rates,with the associated benefit of increased efficiency. This article addresses the question of how theimputed values should be generated; for example, using only the data from the same cluster or datapooled across clusters in each group. From an intuitive perspective, pooling across clusters will yieldmore accurate estimates for the missing values, but it may then be necessary to account for intraclus-ter correlation when generating the imputed values. At present, imputation procedures available instandard statistical software packages (Horton and Lipsitz, 2001) assume that observations are inde-pendent; specialized software may therefore be required to account for intracluster correlation.
In Section 2, the well-known missing data mechanism framework of Rubin (1976) is expanded toaccommodate special characteristics of cluster randomized trials. In Section 3, the relevant statisticaltests in the absence of attrition are described: we focus on a simple test for the intervention effect, basedon the difference between the mean outcomes at follow-up between intervention and control groups. InSection 4, the missing data procedures of interest are described. In Section 5, we report the results of asimulation study to evaluate these procedures, while Section 6 presents an example of application of ourresults to an actual cluster randomized trial. Section 7 concludes with some discussion.
330 M. Taljaard, A. Donner and N. Klar: Imputation in Cluster Randomized Trials
# 2008 WILEY-VCH Verlag GmbH & Co. KGaA, Weinheim www.biometrical-journal.com

2 Missing Data Mechanisms for Clustered Data
Rubin (1976) distinguished among Missing Completely At Random (MCAR), Missing At Random(MAR), and Missing Not At Random (MNAR) mechanisms. As defined by Little and Rubin (2002),let Y ¼ ðyijÞ represent the complete data (where i indexes subjects, and j variables), and let R ¼ ðrijÞbe a response indicator such that rij ¼ 1 if the response is observed and rij ¼ 0 if it is missing. Thenf ðR j Y ;fÞ, where f denotes unknown parameters, represents the missing data mechanism. UnderMCAR, the probability that a response is missing does not depend on the observed or unobserveddata, i.e., f ðR j Y ;fÞ ¼ f ðR j fÞ. Under MAR, the probability of a missing response may depend onthe observed data Yobs but not on the unobserved data, i.e., f ðR j Y ;fÞ ¼ f ðR j Yobs;fÞ. When theprobability of a missing response depends on the unobserved data, the mechanism is called MNAR.
Now consider a cluster randomized trial in which k clusters are randomly allocated to each of anintervention and a control group, and m individuals are enrolled in each cluster. In practice, m mayvary from cluster to cluster, but for simplicity and without loss of generalizability, we assume herethat m is fixed. We consider a single outcome of interest, Yijl, where i ¼ 1, 2 indexes the intervention;j ¼ 1; . . . ; k indexes clusters; and l ¼ 1; . . . ;m individuals within clusters. The outcome is modeled bythe general linear mixed model:
Yijl ¼ Xijlbþ Uij þ eijl ; (1)
where b is a vector of fixed-effects parameters, Xijl is a matrix of fully observed individual-level orcluster-level covariates, Uij � Nð0; s2
BÞ represents random cluster-effects, and eijl � Nð0; s2WÞ repre-
sents individual error terms. Let
PðRijl ¼ 1 j Yij;Xij;UijÞ ¼ pijl ; 0 < pijl < 1 ; (2)
represent the conditional probability of observing a response, where Yij is the vector of outcomes inthe ij-th cluster. Thus, under this most general model, the probability that an individual is lost tofollow-up is allowed to depend on characteristics of the individual, the cluster, or other individuals inthe same cluster. For example, in a worksite intervention trial for smoking cessation, the probabilitythat an employee drops out may depend on that employee’s success in quitting as well as the meanquit rate at that worksite. Moreover, missing data indicators in the same cluster – as with any studyoutcome – are likely correlated. We assume the population-averaged approach to modeling clusteredbinary data (Neuhaus, 1992), with the potential correlation among missing data indicators accommo-dated by means of an exchangeable correlation structure.
As a special case of model (2), we consider
PðRijl ¼ 1 j Yij;Xij;UijÞ ¼ PðRijl ¼ 1Þ ¼ p ; 0 < p < 1 ; (3)
with exchangeable intracluster correlation coefficient for the missing data mechanism denoted t (Tal-jaard, Donner and Klar, 2007). Under this MCAR mechanism, the minimum possible correlation ist ¼ �1=ðm� 1Þ, which corresponds with clusters having identical follow-up rates; on the other hand,the maximum value t ¼ 1 implies that each cluster is either completely observed or completely miss-ing (Fleiss, 1981). Under MAR on the other hand, the minimum and maximum possible correlationmay depend on the individual follow-up probabilities of member-pairs in each cluster (Prentice, 1988).
3 Statistical Tests in the Absence of Missing Data
We assume here that Yijl is normally distributed with mean mi and variance s2 ¼ s2W þ s2
B, where s2W
denotes the within-cluster variance, s2B the between-cluster variance, and q ¼ s2
B
�s2. Let
�YYi ¼Xk
j¼1
Xm
l¼1
Yijl
�km denote the group mean and �YYij ¼
Xm
l¼1
Yijl
�m the mean of the ij-th cluster. A test
Biometrical Journal 50 (2008) 3 331
# 2008 WILEY-VCH Verlag GmbH & Co. KGaA, Weinheim www.biometrical-journal.com

for H0 : m2 ¼ m1 may be based on adjusting the standard two-sample t-test for the intracluster correla-tion (Donner and Klar, 2001):
T ¼�YY2 � �YY1ffiffiffiffiffiffiffiffiffiffiffiffiffiffiffiffiffiffiffiffiffiffiffiffiffiffiffiffiffiffiffiffiffiffiffiffiffiffi
2S2P
km1þ ðm� 1Þ qq½ �
r � t2ðk�1Þ ; (4)
where S2P ¼ S2
B þ S2W is the pooled variance estimate, S2
B ¼ ðMSC�MSWÞ=m and S2W ¼ MSW are the
estimated between-cluster and within-cluster variances, with
MSW ¼
X2
i¼1
Xk
j¼1
Xm
l¼1
ðYijl � �YYijÞ2
2kðm� 1Þand
MSC ¼X2
i¼1
Xk
j¼1
mð �YYij � �YYiÞ
2
2ðk � 1Þ ;
and qq ¼ S2B
�ðS2
B þ S2WÞ. An alternative procedure for testing H0 is to first calculate the cluster means
and then apply the standard two-sample t-test to the cluster means. Both of these procedures may beadjusted for covariates using a two-stage regression approach, as described by Gail, Tan and Piantado-si (1988). Yet another approach is to apply a mixed-effects regression model (Laird and Ware, 1982).In the absence of covariates, and assuming constant m, these tests are all identical (Donner and Klar,1994); moreover, they are equivalent to the non-parametric permutation test obtained by permuting therandom treatment assignments to the clusters, provided the number of clusters per group is large(Feng et al., 2001). For simplicity, we focus here on the impact of various imputation strategies on theadjusted two-sample t-test in equation 4.
4 Missing Data Strategies in Cluster Randomized Trials
4.1 No imputation approach
Under MCAR, a no-imputation approach, that is, applying the tests described in Section 3 to theobserved outcomes only, are valid due to the assumption that the missing data mechanism is indepen-dent of the outcome; under MAR however, a no-imputation approach would be valid provided theknown covariates associated with the missing data mechanism are adjusted for, e.g., by using a two-stage regression approach or a likelihood-based analysis such as mixed-effects regression. The two-stage regression approach was used for secondary analyses in COMMIT (1995), where permutationtests were applied to cluster means computed from residuals obtained after regressing the outcome onbaseline covariates.
4.2 Mean imputation
Mean imputation is an example of a deterministic procedure, where imputed values are estimatedmeans – for example, predicted values from regressing the outcome on a set of covariates assumed tobe correlated with the missing data mechanism. An advantage of deterministic imputation in generalis that it tends to yield more efficient estimates than an imputation procedure in which the imputedvalues are selected randomly, because the variability introduced by random selection is avoided (Littleand Rubin, 2002). Two choices for estimating the imputed values in cluster randomized trials are touse all the data pooled across clusters in each intervention group (here referred to as group meanimputation), or using the data from each cluster only (referred to as cluster mean imputation). Consid-
332 M. Taljaard, A. Donner and N. Klar: Imputation in Cluster Randomized Trials
# 2008 WILEY-VCH Verlag GmbH & Co. KGaA, Weinheim www.biometrical-journal.com

er the simplest case of MCAR and unconditional group mean imputation, which results in a com-pleted dataset Y* ¼ ðY*ijlÞ such that
Y*ijl ¼Yijl; if rijl ¼ 1�YYobs
i ; if rijl ¼ 0
�
where �YYobsi denotes the observed group mean. The adjusted two-sample t-test statistic (equation 4) is
then computed as:
T ¼�YY*2 � �YY*1ffiffiffiffiffiffiffiffiffiffiffiffiffiffiffiffiffiffiffiffiffiffiffiffiffiffiffiffiffiffiffiffiffiffiffiffiffiffiffiffiffiffi
2SP*2
km½1þ ðm� 1Þqq*�
s � t2ðk�1Þ ; (5)
where * refers to the imputation-completed data. Since m is constant, this test is identical to thecluster-level t-test; and when cluster follow-up rates are constant, it is straightforward to show that thestandard error is underestimated by a factor approximately equal to the overall follow-up rate �rr (seethe appendix). Thus, unless �rr � 1, group mean imputation is likely to yield tests with spurious signifi-cance. Intuitively, by replacing missing values in each cluster by the overall group mean, the variabil-ity among the cluster means �YY*ij is artificially attenuated.
In contrast with group mean imputation, cluster mean imputation does not result in attenuated stand-ard errors for tests for the intervention. This can be seen in the simplest case of unconditional clustermean imputation under MCAR, where
Y*ijl ¼Yijl; if rijl ¼ 1�YYobs
ij ; if rijl ¼ 0
�
where �YYobsij is the observed cluster mean. Since
�YY*ij ¼
Xm
l¼1
rijlYobsijl þ ð1� rijlÞ �YYobs
ij
h im
¼ �YYobsij ;
the standard error of the imputed cluster means �YY*ij will be identical to the appropriate standard errorof the observed cluster means �YYobs
ij .In COMMIT, cluster mean imputation was used for the primary analysis under an assumption of
MAR: 16 subgroups were formed in each cluster using known baseline covariates thought to be asso-ciated with the missing data mechanism, and the subgroup means were then imputed for missingoutcomes in each cluster. (This approach is equivalent to regression imputation with indicator vari-ables representing the subgroups.) The imputation-completed dataset was then analyzed by means ofpermutation tests applied to cluster means. The investigators explained that “. . . imputation is doneseparately by cluster because combining across the two communities of a pair would bias resultstoward the null, and combining across communities separately for intervention and comparison com-munities could jeopardize the exchangeability (under the null hypothesis) required for the permutationtest.”
4.3 Multiple imputation
Multiple imputation, first proposed by Rubin (1978, 1987), is considered the gold standard techniquefor imputation (Little and Rubin, 2002). In multiple imputation, N � 2 imputed values are simulatedfor each missing value from an appropriate distribution. By simulating imputed values randomly, thedistributional properties of the data being imputed are preserved; moreover, imputing multiple timesallows the uncertainty associated with the imputed values (the fact that the imputed values are esti-mated values instead of actually observed values) to be taken into account when calculating standard
Biometrical Journal 50 (2008) 3 333
# 2008 WILEY-VCH Verlag GmbH & Co. KGaA, Weinheim www.biometrical-journal.com

errors. As described below, this is done by adding the between-imputation variance to standard var-iance estimators.
4.3.1 Notation and standard results
Multiple imputation inferences for clustered data are obtained in the same fashion as multiple imputa-tion inferences for independent data: once the N sets of imputed values have been generated, there are
N estimates of the intervention effect md ¼ m2 � m1, denoted here as mmd*ð1Þ, mmd
*ð2Þ,. . ., mmd*ðNÞ, with corre-
sponding variance estimates VV*ð1Þ, VV*ð2Þ, . . ., VV*ðNÞ, and these estimates can be combined using thesame rules as for independent data. As described by Rubin (1987), the combined estimate for md issimply the average of the N estimates:
mmd ¼1N
XN
n¼1
mmd*ðnÞ ; (6)
and the combined variance estimate is the sum of two components:
VV ¼ �VVVV*þ 1þ 1N
� �B ; (7)
where
�VVVV* ¼ 1N
XN
n¼1
VV*ðnÞ ;
accounts for within-imputation variance, and
B ¼ 1N � 1
XN
n¼1
ðmmd*ðnÞ � mmdÞ2 ;
accounts for between-imputation variance. The combined inference, assuming N is small, is thenbased on
T ¼ mmd � mdffiffiffiffiVV
p � tnN :
The degrees of freedom are calculated as
nN ¼ ðN � 1Þð1þ q�1Þ2 ;
where
q ¼ 1þ 1N
� �B.
�VVVV* : ð8Þ
More appropriate degrees of freedom when the complete-data degrees of freedom ncom are small, werepresented by Barnard and Rubin (1999) as:
nadj ¼1
nNþ 1
nnobs
� ��1
� ncom ; ð9Þ
where
nnobs ¼ncom þ 1ncom þ 3
� �ncomð1� qÞ :
334 M. Taljaard, A. Donner and N. Klar: Imputation in Cluster Randomized Trials
# 2008 WILEY-VCH Verlag GmbH & Co. KGaA, Weinheim www.biometrical-journal.com
4.3.2 Parametric multiple imputation
For multiple imputation inferences to be valid, imputed values should be generated in a way that is“proper”. Rubin (1987) provided technical requirements for proper multiple imputation; for all practi-cal purposes, multiple imputation is usually considered proper when (1) the imputation model is com-patible or “congenial” with the analysis, which should be likelihood-based, and (2) imputations aredrawn from the Bayesian posterior predictive distribution of the missing values under a specifiedmodel for the data and the missing data mechanism (Zhang, 2003).
We consider here a relatively simple model for generating multiple imputations after pooling acrossclusters in each group. Under MAR, imputed values can be generated from the standard linear regres-sion model:
Yijl ¼ Xijlbþ eijl ; (10)
where Xijl is a vector of known covariates associated with the missing data mechanism, b is a vectorof unknown regression coefficients, and eijl � Nð0; s2Þ. Generating multiple imputations under thismodel is relatively straightforward; it involves two steps: (a) generate random values for the variances2 and the regression coefficients b from their respective observed-data posterior distributions, and (b)generate imputed values YYijl using model 10 and the randomly drawn parameter values from step (a).These steps are repeated N times to yield a dataset with N imputed values. Assuming non-informativepriors, the observed-data posterior distributions for s2 and b are the scaled inverted chi-square andnormal distributions respectively, from which values can be drawn directly (Zhang, 2003). This proce-dure has been implemented in various software packages, including SAS (Proc MI) (Yuan, 2000).Other procedures based on Markov Chain Monte Carlo (MCMC) simulation are also available whenmultiple variables are subject to missingness in a non-monotone pattern. We note that multiple imputa-tions drawn under the standard regression model ignoring the intracluster correlation are not strictlyproper, since the imputation model is not “congenial” (in the sense of Meng (1994)) with the analysismodel which does account for intracluster correlation.
Gomel et al. (1997) used the standard regression approach in a cluster randomized trial involving28 worksites, randomly assigned to 4 cardiovascular risk interventions. Missing values for variablesrequired for calculating a composite risk index for each employee were imputed N ¼ 5 times using astandard linear regression model. The standard regression approach has also been considered underMNAR mechanisms, for example, in the Pathways Study (Davis et al., 2001), which was a rando-mized, school-based intervention for prevention of obesity involving 41 schools. The analysis plan forthe study included an evaluation of three strategies for dealing with the anticipated loss to follow-upof individual children (Hunsberger et al., 2001). One approach was to draw multiple imputations fromthe posterior predictive distribution of the missing data using a standard linear regression model afterpooling across schools in the control group. This approach yielded the best results in the simulationstudies and was proposed for the final analysis. Another example where an approach ignoring theintracluster correlation was used, is a school-based study to evaluate suicide prevention approaches forpotential high-school dropouts (Thompson et al., 2001). Imputed values for multiple variables missingin a non-monotone pattern were generated N ¼ 10 times using MCMC simulation under a multivariatenormal model which did not account for correlation within schools.
We now consider proper multiple imputation under a regression model which does account for in-tracluster correlation. Consider the mixed-effects regression model defined in Eq. (1): multiple imputa-tion procedures for correlated data under this model were developed by Liu, Taylor and Belin (2000),and extended by Schafer (2001). These procedures have not yet been widely adopted in practice, possi-bly due to limited software availability. An S-Plus library, called “PAN” (for Panel data) (Schafer andYucel, 2001), can be downloaded from http://lib.stats.cmu.edu/. The procedure implements an MCMCsimulation algorithm and can handle multiple variables subject to missingness in non-monotone patterns.In the univariable case, current values of the parameters b, s2
W and s2A; the random effects Uij; and the
missing values Ymis, given the observed values Yobs, are updated in three steps (Schafer, 2001):
Biometrical Journal 50 (2008) 3 335
# 2008 WILEY-VCH Verlag GmbH & Co. KGaA, Weinheim www.biometrical-journal.com
a) Draw values of the random cluster effects Uij given plausible assumed values for the missingdata and the parameters b, s2
W and s2A;
b) Draw new random values for the parameters b, s2W and s2
A given assumed values for the missingdata and the random effects obtained in a);
c) Draw new random values for the missing data given the values of the random effects in a) andthe parameters obtained in b).
By iteratively repeating these steps, the simulated parameter values eventually converge in distributionto their correct posterior distributions. Convergence can be assessed using standard methods (Gilks,Richardson and Spiegelhalter, 1996); once convergence has been established, say, after c cycles, oneoption for drawing the final imputed values is to execute N runs of length c and retain the last value ofeach run; alternatively, execute a single run of length Nc and retain the completed datasets from cyclesc, 2c, . . ., Nc. Uniform priors may be assumed for fixed-effects regression coefficients, while indepen-dent inverse-Wishart priors are recommended for variance component parameters (Schafer, 2001).
In some cluster randomized trials, there could be multiple levels of clustering, for example, stu-dents nested within classrooms, which are in turn nested within schools. Carpenter and Goldstein(2004) have developed a multiple imputation macro for the MLwiN package, downloadable fromwww.missingdata.org.uk/software, which implements a similar MCMC routine and can be used toaccommodate up to four levels of clustering in the imputation model. Multiple imputation for missingoutcomes and predictors under the linear mixed model can also be implemented by a stand-aloneprogram called WinMICE (Multivariate Imputation by Chained Equations) (Van Buuren and Oud-shoorn, 1999), downloadable from http://www.multiple-imputation.com/.
4.3.3 Non-parametric multiple imputation
Non-parametric multiple imputation has the advantage of being less sensitive to model misspecifica-tion than parametric procedures. We consider the Approximate Bayesian Bootstrap (ABB) procedure,proposed by Rubin and Schenker (1986). This procedure approximates sampling from the appropriateposterior predictive distribution by first generating a pool of possible “donors” drawn with replace-ment from the observed data, and then drawing the imputed values with replacement from the donorpool. Using actually observed values as imputes has the additional advantage that imputed values willbe logically acceptable responses (Rubin and Schenker, 1991). Rubin and Schenker (1986) showedthat drawing imputed values directly from the observed data instead of from the donor pool would beimproper in the sense that the between-imputation variance would be underestimated. Lavori, Dawsonand Shera (1995) proposed to incorporate covariates by using “propensity scores” to define strata inwhich the ABB is then applied. The propensity score is the conditional probability of being missinggiven the observed data, and can be estimated by means of a logistic regression model; strata can thenbe defined based on quantiles of the estimated propensity scores. This approach is available in theSAS procedure MI (Yuan, 2000).
Two possible applications of the ABB in cluster randomized trials are to sample from all observedoutcomes in each intervention group, or to sample only from observed outcomes in the same cluster(here referred to as pooled ABB and within-cluster ABB respectively). In the Pathways study (Hunsber-ger et al., 2001), the pooled ABB was one of three alternative missing data strategies evaluated in asimulation study during the statistical planning of the trial. To account for the assumed MNAR mechan-ism in the intervention group, the investigators proposed to sample values disproportionately from theupper tail of the observed distribution of bodyweights in the intervention and control groups combined.
5 Simulation Study
We conducted a simulation study to compare the impact of these imputation strategies on the validityand power of the adjusted two-sample t-test for the intervention effect. The simulation study was de-
336 M. Taljaard, A. Donner and N. Klar: Imputation in Cluster Randomized Trials
# 2008 WILEY-VCH Verlag GmbH & Co. KGaA, Weinheim www.biometrical-journal.com
signed to resemble data from a worksite obesity intervention trial which will be presented as an exam-ple in section 6. For the purpose of the simulation study, we focus here on the outcome bodyweight.
5.1 Data generation
Bodyweight was generated as
Yijl ¼ mþ DXi þ Uij þ eijl ;
where Xi is the intervention indicator, D represents the effect size, Uij � Nð0; s2BÞ and eijl � Nð0; s2
WÞ.Fixed parameters in the simulation study were m ¼75 and s2 ¼ s2
W þ s2B ¼ 152. The effect size was
set at 0 to report type I error rates, or at D=s ¼ �0:2 to report power values. Parameters varied in thesimulation study are cluster size m ¼ (500, 200, 100, 50, 30), number of clusters k ¼ (6, 12, 16, 20,30), and intracluster correlation coefficient q ¼ (0.001, 0.005, 0.01, 0.05, 0.10).
Missing data indicators rijl were generated under the model in equation 3 with follow-up rate p ¼ 0:7.The intracluster correlation coefficient for the missing data mechanism was specified ast ¼�1=ðm� 1Þ, 0.1, 0.3, and 1 –– representing identical cluster follow-up rates, moderate imbalance,severe imbalance, and cluster-level loss to follow-up respectively. Note that under MCAR, the ex-
pected standard deviation of cluster follow-up rates is given byffiffiffiffiffiffiffiffiffiffiffiffiffiffiffiffiffiffiffiffiffiffiffiffiffiffiffiffiffiffiffiffiffiffiffiffiffiffiffiffiffiffiffiffiffiffiffiffiffiffiffiffipð1� pÞ½1þ ðm� 1Þt�=m
p; thus, in
the simulation study t ¼ 0:1 represents an expected standard deviation of approximately 15%, whilet ¼ 0:3 represents an expected standard deviation of approximately 25%. The method of Oman andZucker (2001) was used to generate rijl in the case of t ¼ 0:1 and t ¼ 0:3. For the combination k ¼ 6and t ¼ 1, some runs resulted in none or only one observed cluster per group; in practice, this wouldlikely result in the study being abandoned. Such runs were therefore deleted and the simulation re-peated to ensure at least two observed clusters per group in each simulation run.
5.2 Methods of analysis
We generated imputed values according to each of the procedures described in Section 4. The no-imputation approach is presented for comparison purposes. For multiple imputation, we used N ¼ 10;where required, non-informative priors were specified for fixed-effects regression parameters. Underthe mixed-effects regression approach, inverse-Wishart priors were specified for the variance param-eters; 2000 burn-in iterations were used and every 200-th simulated value was selected as an imputedvalue. With the exception of the mixed-effects regression approach which was carried out in SPlus(library PAN), all multiple imputation procedures were carried out in SAS Proc MI. We testedH0 : m1 ¼ m2 using the adjusted two-sample t-test with a ¼ 0:05 as described in Section 3, applied toeither the non-missing data (no-imputation approach) or the imputation-completed data. For multipleimputation, the test was based on the adjusted degrees of freedom in equation 9.
5.3 Results
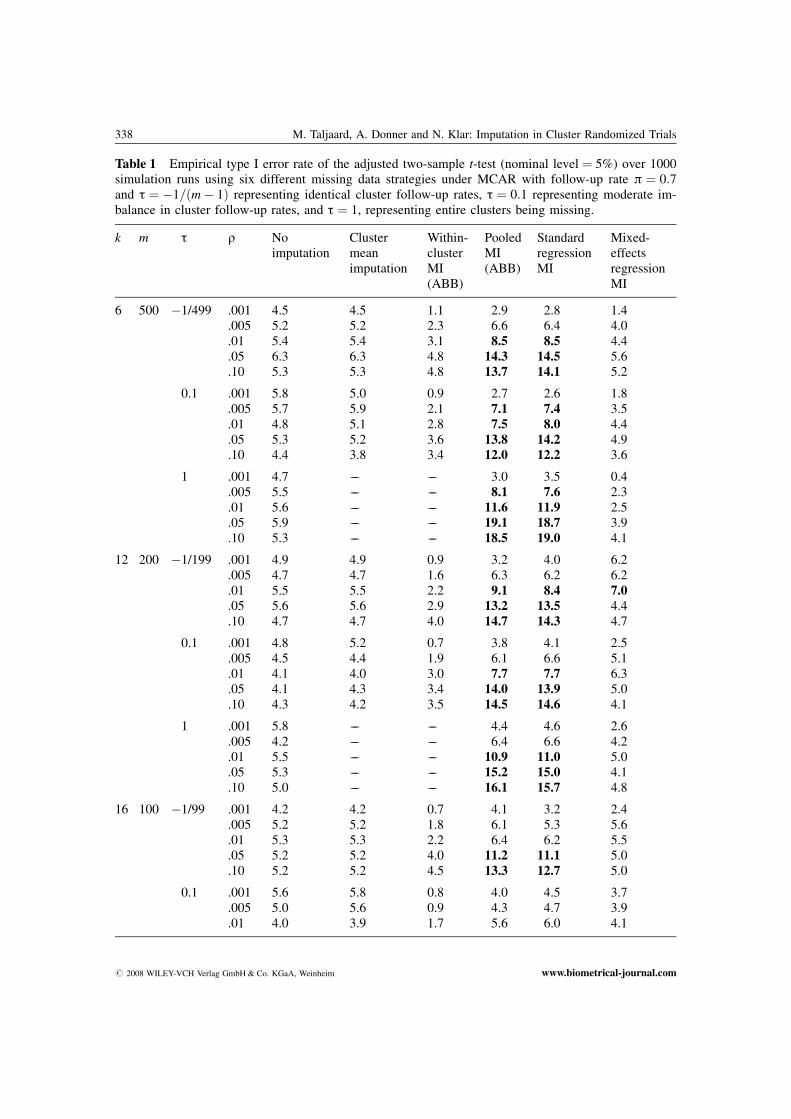
Empirical type I error rates over 1000 simulation runs are presented in Table 1. (Results for t ¼ 0:3were similar to those for t ¼ 0:1 and are not shown in Table 1.) Type I error rates exceeding 7% areprinted in boldface type. As expected, cluster mean imputation resulted in type I error rates close tothe nominal level throughout. Although within-cluster ABB multiple imputation also yielded validinferences, this approach tended to yield highly conservative inferences, with type I error rates oftenwell below the nominal level. Naturally, when t ¼ 1, within cluster imputation procedures are notpossible, and procedures which pool across clusters then need to be used. Among the three procedureswhich pool across clusters, only the proper (mixed-effects) regression approach yielded acceptabletype I error rates at all levels of q: the pooled multiple imputation approaches yielded acceptabletype I error rates at smaller values for q only –– in particular, type I error rates tended to exceed the
Biometrical Journal 50 (2008) 3 337
# 2008 WILEY-VCH Verlag GmbH & Co. KGaA, Weinheim www.biometrical-journal.com
338 M. Taljaard, A. Donner and N. Klar: Imputation in Cluster Randomized Trials
Table 1 Empirical type I error rate of the adjusted two-sample t-test (nominal level ¼ 5%) over 1000simulation runs using six different missing data strategies under MCAR with follow-up rate p ¼ 0:7and t ¼ �1=ðm� 1Þ representing identical cluster follow-up rates, t ¼ 0:1 representing moderate im-balance in cluster follow-up rates, and t ¼ 1, representing entire clusters being missing.
k m t q Noimputation
Clustermeanimputation
Within-clusterMI(ABB)
PooledMI(ABB)
StandardregressionMI
Mixed-effectsregressionMI
6 500 �1/499 .001 4.5 4.5 1.1 2.9 2.8 1.4.005 5.2 5.2 2.3 6.6 6.4 4.0.01 5.4 5.4 3.1 8.5 8.5 4.4.05 6.3 6.3 4.8 14.3 14.5 5.6.10 5.3 5.3 4.8 13.7 14.1 5.2
0.1 .001 5.8 5.0 0.9 2.7 2.6 1.8.005 5.7 5.9 2.1 7.1 7.4 3.5.01 4.8 5.1 2.8 7.5 8.0 4.4.05 5.3 5.2 3.6 13.8 14.2 4.9.10 4.4 3.8 3.4 12.0 12.2 3.6
1 .001 4.7 –– –– 3.0 3.5 0.4.005 5.5 –– –– 8.1 7.6 2.3.01 5.6 –– –– 11.6 11.9 2.5.05 5.9 –– –– 19.1 18.7 3.9.10 5.3 –– –– 18.5 19.0 4.1
12 200 �1/199 .001 4.9 4.9 0.9 3.2 4.0 6.2.005 4.7 4.7 1.6 6.3 6.2 6.2.01 5.5 5.5 2.2 9.1 8.4 7.0.05 5.6 5.6 2.9 13.2 13.5 4.4.10 4.7 4.7 4.0 14.7 14.3 4.7
0.1 .001 4.8 5.2 0.7 3.8 4.1 2.5.005 4.5 4.4 1.9 6.1 6.6 5.1.01 4.1 4.0 3.0 7.7 7.7 6.3.05 4.1 4.3 3.4 14.0 13.9 5.0.10 4.3 4.2 3.5 14.5 14.6 4.1
1 .001 5.8 –– –– 4.4 4.6 2.6.005 4.2 –– –– 6.4 6.6 4.2.01 5.5 –– –– 10.9 11.0 5.0.05 5.3 –– –– 15.2 15.0 4.1.10 5.0 –– –– 16.1 15.7 4.8
16 100 �1/99 .001 4.2 4.2 0.7 4.1 3.2 2.4.005 5.2 5.2 1.8 6.1 5.3 5.6.01 5.3 5.3 2.2 6.4 6.2 5.5.05 5.2 5.2 4.0 11.2 11.1 5.0.10 5.2 5.2 4.5 13.3 12.7 5.0
0.1 .001 5.6 5.8 0.8 4.0 4.5 3.7.005 5.0 5.6 0.9 4.3 4.7 3.9.01 4.0 3.9 1.7 5.6 6.0 4.1
# 2008 WILEY-VCH Verlag GmbH & Co. KGaA, Weinheim www.biometrical-journal.com
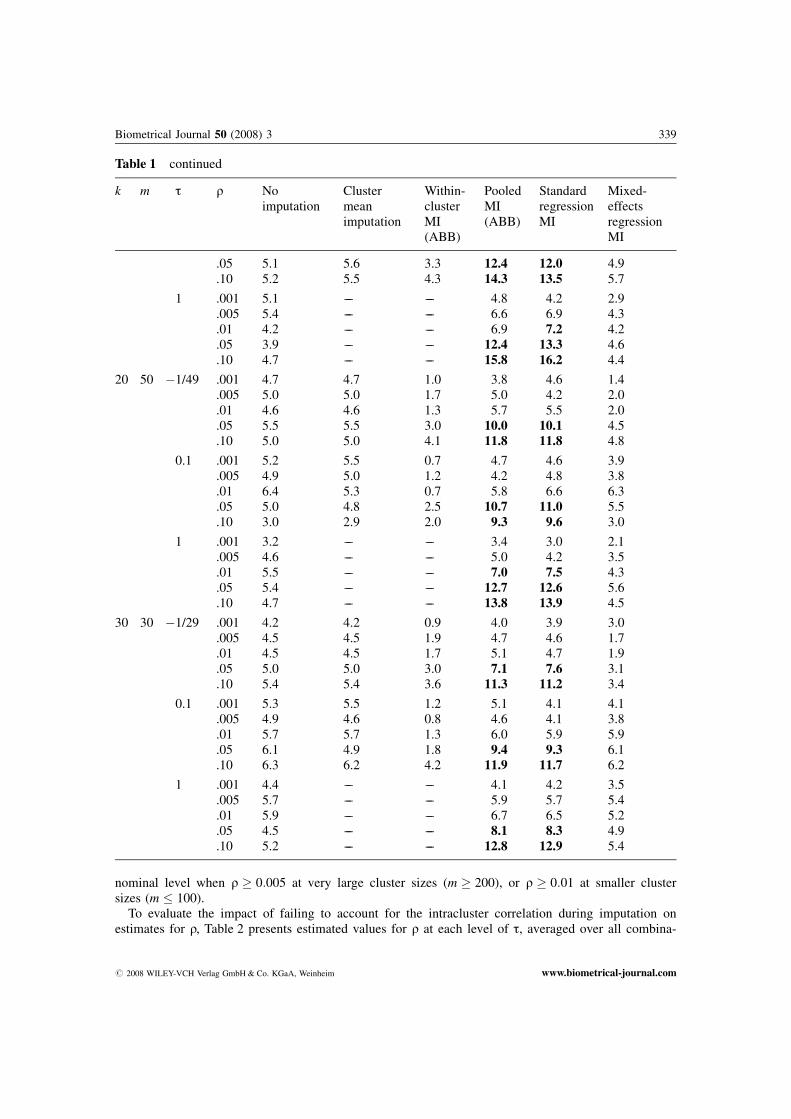
nominal level when q � 0:005 at very large cluster sizes (m � 200), or q � 0:01 at smaller clustersizes (m � 100).
To evaluate the impact of failing to account for the intracluster correlation during imputation onestimates for q, Table 2 presents estimated values for q at each level of t, averaged over all combina-
Biometrical Journal 50 (2008) 3 339
Table 1 continued
k m t q Noimputation
Clustermeanimputation
Within-clusterMI(ABB)
PooledMI(ABB)
StandardregressionMI
Mixed-effectsregressionMI
.05 5.1 5.6 3.3 12.4 12.0 4.9
.10 5.2 5.5 4.3 14.3 13.5 5.7
1 .001 5.1 –– –– 4.8 4.2 2.9.005 5.4 –– –– 6.6 6.9 4.3.01 4.2 –– –– 6.9 7.2 4.2.05 3.9 –– –– 12.4 13.3 4.6.10 4.7 –– –– 15.8 16.2 4.4
20 50 �1/49 .001 4.7 4.7 1.0 3.8 4.6 1.4.005 5.0 5.0 1.7 5.0 4.2 2.0.01 4.6 4.6 1.3 5.7 5.5 2.0.05 5.5 5.5 3.0 10.0 10.1 4.5.10 5.0 5.0 4.1 11.8 11.8 4.8
0.1 .001 5.2 5.5 0.7 4.7 4.6 3.9.005 4.9 5.0 1.2 4.2 4.8 3.8.01 6.4 5.3 0.7 5.8 6.6 6.3.05 5.0 4.8 2.5 10.7 11.0 5.5.10 3.0 2.9 2.0 9.3 9.6 3.0
1 .001 3.2 –– –– 3.4 3.0 2.1.005 4.6 –– –– 5.0 4.2 3.5.01 5.5 –– –– 7.0 7.5 4.3.05 5.4 –– –– 12.7 12.6 5.6.10 4.7 –– –– 13.8 13.9 4.5
30 30 �1/29 .001 4.2 4.2 0.9 4.0 3.9 3.0.005 4.5 4.5 1.9 4.7 4.6 1.7.01 4.5 4.5 1.7 5.1 4.7 1.9.05 5.0 5.0 3.0 7.1 7.6 3.1.10 5.4 5.4 3.6 11.3 11.2 3.4
0.1 .001 5.3 5.5 1.2 5.1 4.1 4.1.005 4.9 4.6 0.8 4.6 4.1 3.8.01 5.7 5.7 1.3 6.0 5.9 5.9.05 6.1 4.9 1.8 9.4 9.3 6.1.10 6.3 6.2 4.2 11.9 11.7 6.2
1 .001 4.4 –– –– 4.1 4.2 3.5.005 5.7 –– –– 5.9 5.7 5.4.01 5.9 –– –– 6.7 6.5 5.2.05 4.5 –– –– 8.1 8.3 4.9.10 5.2 –– –– 12.8 12.9 5.4
# 2008 WILEY-VCH Verlag GmbH & Co. KGaA, Weinheim www.biometrical-journal.com
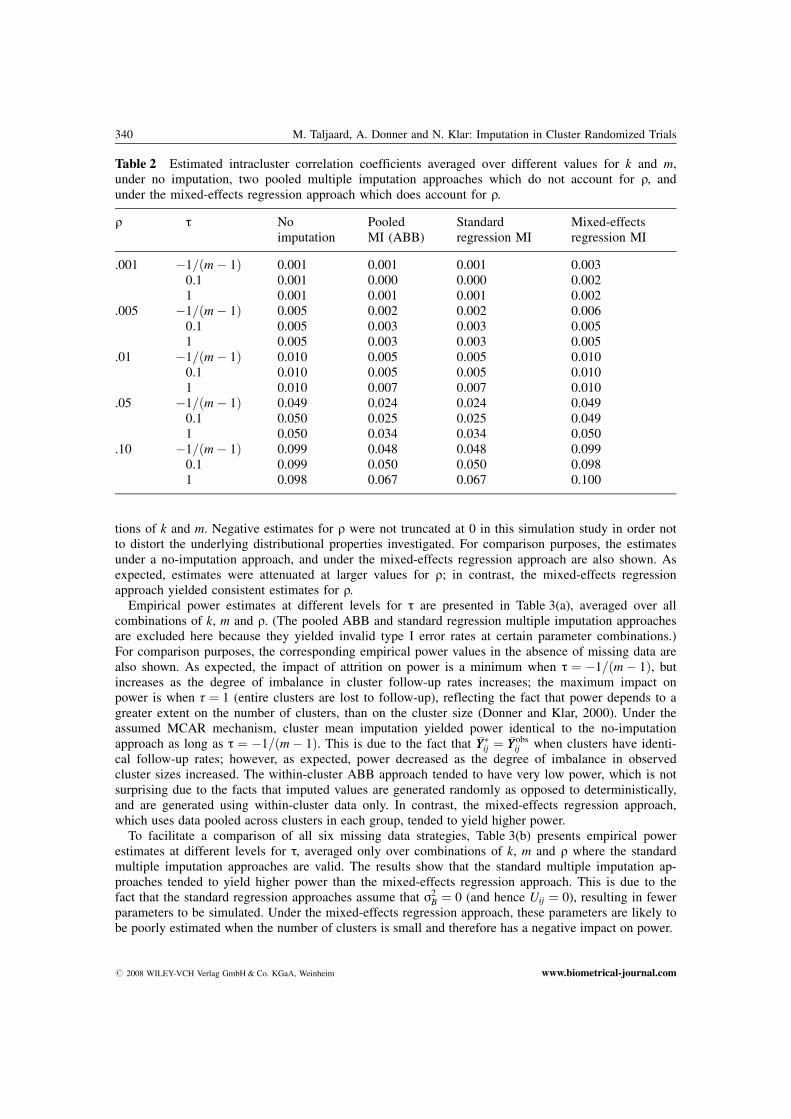
tions of k and m. Negative estimates for q were not truncated at 0 in this simulation study in order notto distort the underlying distributional properties investigated. For comparison purposes, the estimatesunder a no-imputation approach, and under the mixed-effects regression approach are also shown. Asexpected, estimates were attenuated at larger values for q; in contrast, the mixed-effects regressionapproach yielded consistent estimates for q.
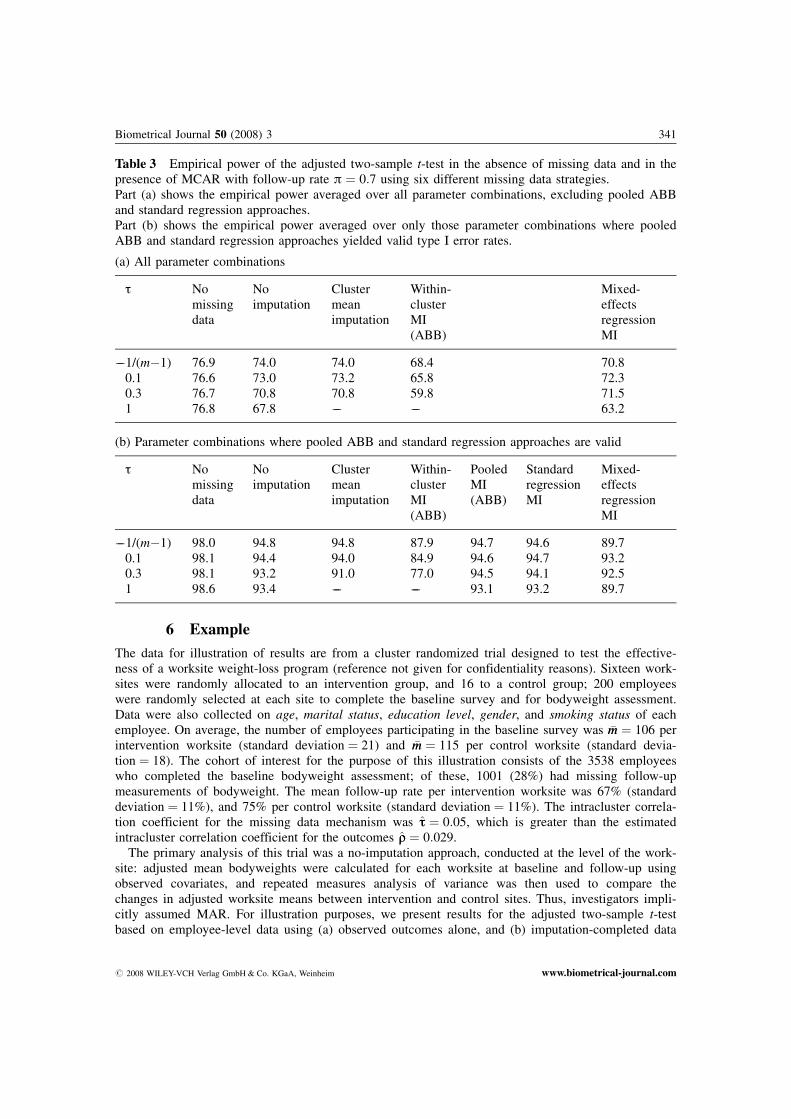
Empirical power estimates at different levels for t are presented in Table 3(a), averaged over allcombinations of k, m and q. (The pooled ABB and standard regression multiple imputation approachesare excluded here because they yielded invalid type I error rates at certain parameter combinations.)For comparison purposes, the corresponding empirical power values in the absence of missing data arealso shown. As expected, the impact of attrition on power is a minimum when t ¼ �1=ðm� 1Þ, butincreases as the degree of imbalance in cluster follow-up rates increases; the maximum impact onpower is when t ¼ 1 (entire clusters are lost to follow-up), reflecting the fact that power depends to agreater extent on the number of clusters, than on the cluster size (Donner and Klar, 2000). Under theassumed MCAR mechanism, cluster mean imputation yielded power identical to the no-imputationapproach as long as t ¼ �1=ðm� 1Þ. This is due to the fact that �YY�ij ¼ �YYobs
ij when clusters have identi-cal follow-up rates; however, as expected, power decreased as the degree of imbalance in observedcluster sizes increased. The within-cluster ABB approach tended to have very low power, which is notsurprising due to the facts that imputed values are generated randomly as opposed to deterministically,and are generated using within-cluster data only. In contrast, the mixed-effects regression approach,which uses data pooled across clusters in each group, tended to yield higher power.
To facilitate a comparison of all six missing data strategies, Table 3(b) presents empirical powerestimates at different levels for t, averaged only over combinations of k, m and q where the standardmultiple imputation approaches are valid. The results show that the standard multiple imputation ap-proaches tended to yield higher power than the mixed-effects regression approach. This is due to thefact that the standard regression approaches assume that s2
B ¼ 0 (and hence Uij ¼ 0), resulting in fewerparameters to be simulated. Under the mixed-effects regression approach, these parameters are likely tobe poorly estimated when the number of clusters is small and therefore has a negative impact on power.
340 M. Taljaard, A. Donner and N. Klar: Imputation in Cluster Randomized Trials
Table 2 Estimated intracluster correlation coefficients averaged over different values for k and m,under no imputation, two pooled multiple imputation approaches which do not account for q, andunder the mixed-effects regression approach which does account for q.
q t Noimputation
PooledMI (ABB)
Standardregression MI
Mixed-effectsregression MI
.001 �1=ðm� 1Þ 0.001 0.001 0.001 0.0030.1 0.001 0.000 0.000 0.0021 0.001 0.001 0.001 0.002
.005 �1=ðm� 1Þ 0.005 0.002 0.002 0.0060.1 0.005 0.003 0.003 0.0051 0.005 0.003 0.003 0.005
.01 �1=ðm� 1Þ 0.010 0.005 0.005 0.0100.1 0.010 0.005 0.005 0.0101 0.010 0.007 0.007 0.010
.05 �1=ðm� 1Þ 0.049 0.024 0.024 0.0490.1 0.050 0.025 0.025 0.0491 0.050 0.034 0.034 0.050
.10 �1=ðm� 1Þ 0.099 0.048 0.048 0.0990.1 0.099 0.050 0.050 0.0981 0.098 0.067 0.067 0.100
# 2008 WILEY-VCH Verlag GmbH & Co. KGaA, Weinheim www.biometrical-journal.com
6 Example
The data for illustration of results are from a cluster randomized trial designed to test the effective-ness of a worksite weight-loss program (reference not given for confidentiality reasons). Sixteen work-sites were randomly allocated to an intervention group, and 16 to a control group; 200 employeeswere randomly selected at each site to complete the baseline survey and for bodyweight assessment.Data were also collected on age, marital status, education level, gender, and smoking status of eachemployee. On average, the number of employees participating in the baseline survey was �mm ¼ 106 perintervention worksite (standard deviation ¼ 21) and �mm ¼ 115 per control worksite (standard devia-tion ¼ 18). The cohort of interest for the purpose of this illustration consists of the 3538 employeeswho completed the baseline bodyweight assessment; of these, 1001 (28%) had missing follow-upmeasurements of bodyweight. The mean follow-up rate per intervention worksite was 67% (standarddeviation ¼ 11%), and 75% per control worksite (standard deviation ¼ 11%). The intracluster correla-tion coefficient for the missing data mechanism was tt ¼ 0:05, which is greater than the estimatedintracluster correlation coefficient for the outcomes qq ¼ 0:029.
The primary analysis of this trial was a no-imputation approach, conducted at the level of the work-site: adjusted mean bodyweights were calculated for each worksite at baseline and follow-up usingobserved covariates, and repeated measures analysis of variance was then used to compare thechanges in adjusted worksite means between intervention and control sites. Thus, investigators impli-citly assumed MAR. For illustration purposes, we present results for the adjusted two-sample t-testbased on employee-level data using (a) observed outcomes alone, and (b) imputation-completed data
Biometrical Journal 50 (2008) 3 341
Table 3 Empirical power of the adjusted two-sample t-test in the absence of missing data and in thepresence of MCAR with follow-up rate p ¼ 0:7 using six different missing data strategies.Part (a) shows the empirical power averaged over all parameter combinations, excluding pooled ABBand standard regression approaches.Part (b) shows the empirical power averaged over only those parameter combinations where pooledABB and standard regression approaches yielded valid type I error rates.
(a) All parameter combinations
t Nomissingdata
Noimputation
Clustermeanimputation
Within-clusterMI(ABB)
Mixed-effectsregressionMI
––1/(m�1) 76.9 74.0 74.0 68.4 70.80.1 76.6 73.0 73.2 65.8 72.30.3 76.7 70.8 70.8 59.8 71.51 76.8 67.8 –– –– 63.2
(b) Parameter combinations where pooled ABB and standard regression approaches are valid
t Nomissingdata
Noimputation
Clustermeanimputation
Within-clusterMI(ABB)
PooledMI(ABB)
StandardregressionMI
Mixed-effectsregressionMI
––1/(m�1) 98.0 94.8 94.8 87.9 94.7 94.6 89.70.1 98.1 94.4 94.0 84.9 94.6 94.7 93.20.3 98.1 93.2 91.0 77.0 94.5 94.1 92.51 98.6 93.4 –– –– 93.1 93.2 89.7
# 2008 WILEY-VCH Verlag GmbH & Co. KGaA, Weinheim www.biometrical-journal.com
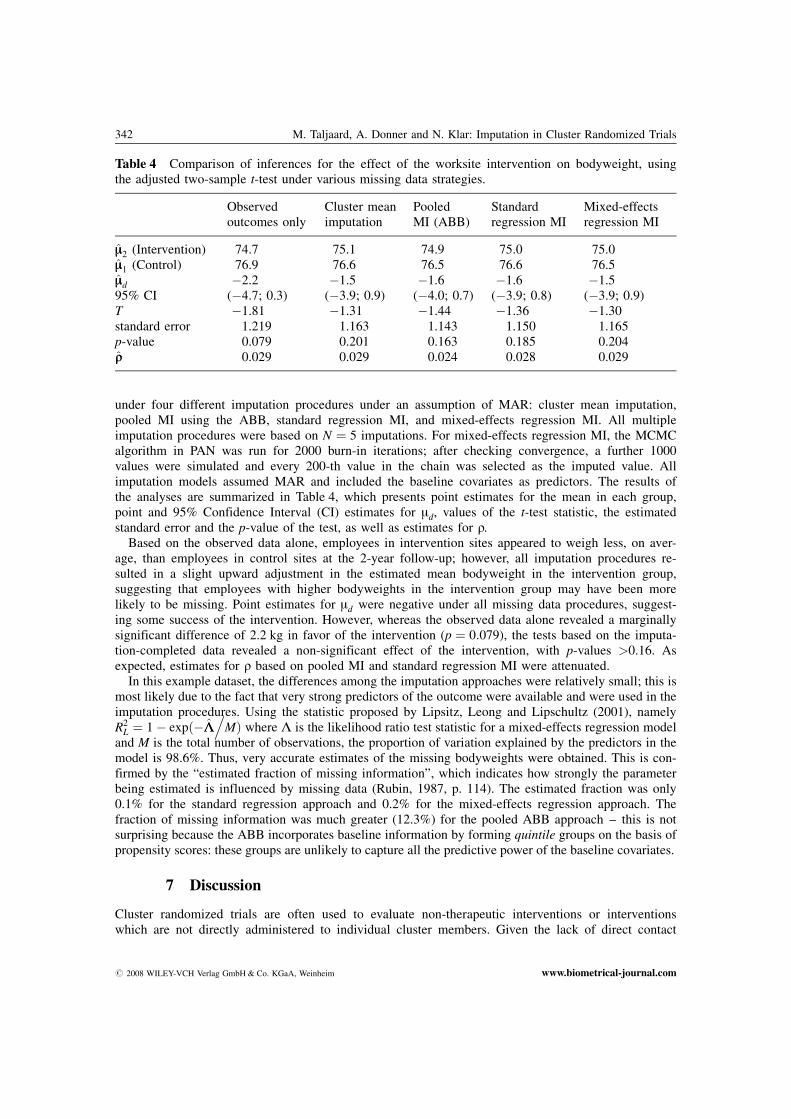
under four different imputation procedures under an assumption of MAR: cluster mean imputation,pooled MI using the ABB, standard regression MI, and mixed-effects regression MI. All multipleimputation procedures were based on N ¼ 5 imputations. For mixed-effects regression MI, the MCMCalgorithm in PAN was run for 2000 burn-in iterations; after checking convergence, a further 1000values were simulated and every 200-th value in the chain was selected as the imputed value. Allimputation models assumed MAR and included the baseline covariates as predictors. The results ofthe analyses are summarized in Table 4, which presents point estimates for the mean in each group,point and 95% Confidence Interval (CI) estimates for md, values of the t-test statistic, the estimatedstandard error and the p-value of the test, as well as estimates for q.
Based on the observed data alone, employees in intervention sites appeared to weigh less, on aver-age, than employees in control sites at the 2-year follow-up; however, all imputation procedures re-sulted in a slight upward adjustment in the estimated mean bodyweight in the intervention group,suggesting that employees with higher bodyweights in the intervention group may have been morelikely to be missing. Point estimates for md were negative under all missing data procedures, suggest-ing some success of the intervention. However, whereas the observed data alone revealed a marginallysignificant difference of 2.2 kg in favor of the intervention (p ¼ 0:079), the tests based on the imputa-tion-completed data revealed a non-significant effect of the intervention, with p-values >0.16. Asexpected, estimates for q based on pooled MI and standard regression MI were attenuated.
In this example dataset, the differences among the imputation approaches were relatively small; this ismost likely due to the fact that very strong predictors of the outcome were available and were used in theimputation procedures. Using the statistic proposed by Lipsitz, Leong and Lipschultz (2001), namelyR2
L ¼ 1� expð�LL.
MÞ where L is the likelihood ratio test statistic for a mixed-effects regression modeland M is the total number of observations, the proportion of variation explained by the predictors in themodel is 98.6%. Thus, very accurate estimates of the missing bodyweights were obtained. This is con-firmed by the “estimated fraction of missing information”, which indicates how strongly the parameterbeing estimated is influenced by missing data (Rubin, 1987, p. 114). The estimated fraction was only0.1% for the standard regression approach and 0.2% for the mixed-effects regression approach. Thefraction of missing information was much greater (12.3%) for the pooled ABB approach – this is notsurprising because the ABB incorporates baseline information by forming quintile groups on the basis ofpropensity scores: these groups are unlikely to capture all the predictive power of the baseline covariates.
7 Discussion
Cluster randomized trials are often used to evaluate non-therapeutic interventions or interventionswhich are not directly administered to individual cluster members. Given the lack of direct contact
342 M. Taljaard, A. Donner and N. Klar: Imputation in Cluster Randomized Trials
Table 4 Comparison of inferences for the effect of the worksite intervention on bodyweight, usingthe adjusted two-sample t-test under various missing data strategies.
Observedoutcomes only
Cluster meanimputation
PooledMI (ABB)
Standardregression MI
Mixed-effectsregression MI
mm2 (Intervention) 74.7 75.1 74.9 75.0 75.0mm1 (Control) 76.9 76.6 76.5 76.6 76.5mmd �2.2 �1.5 �1.6 �1.6 �1.595% CI (�4.7; 0.3) (�3.9; 0.9) (�4.0; 0.7) (�3.9; 0.8) (�3.9; 0.9)T �1.81 �1.31 �1.44 �1.36 �1.30standard error 1.219 1.163 1.143 1.150 1.165p-value 0.079 0.201 0.163 0.185 0.204qq 0.029 0.029 0.024 0.028 0.029
# 2008 WILEY-VCH Verlag GmbH & Co. KGaA, Weinheim www.biometrical-journal.com
with participants and often lengthy follow-up, the risk of attrition may be particularly high in suchtrials (Syme, 1978; Donner, Brown and Brasher, 1990). A further complication is that individuals and/or entire clusters may be missing. In this article, we focused on imputation to account for loss tofollow-up of individuals or entire clusters in trials with a completely randomized design. We ad-dressed the question of how the imputed values should be generated, comparing procedures usingwithin-cluster data only with procedures which pool across clusters in each group. We showed thatcluster mean imputation may be used to obtain valid inferences in community intervention trials, andgiven its simplicity relative to other procedures, may be an attractive option in some large communityintervention trials. However, its benefits should be weighed against the potential loss of power relativeto multiple imputation procedures which pool across clusters, particularly when the cluster follow-uprates are highly variable. Multiple imputation within clusters was shown to have low power.
When pooling across clusters, we showed that multiple imputations will usually need to takeintracluster correlation into account, unless q is very small; however, for values of q found in manycommunity intervention trials (say, q ¼ 0:005), standard multiple imputation procedures may yieldvalid results. Although imputed values are generated under the assumption that q ¼ 0, this naturallyaffects only a smaller subset of the data, and particularly when the rate of attrition is relativelysmall, the overall analysis based on the imputation-completed data may remain valid. One advantageof the standard approach is that inferences are likely to be more powerful than in an approachaccounting for q, because the simulation of between-cluster variance is avoided; moreover, standardapproaches are more easily implemented using commonly available statistical software packages suchas SAS.
Our simulation results were obtained under a simple model for the missing data mechanism(MCAR), and a simple test for the intervention effect without covariate adjustment. This has allowedus to evaluate the consequences of alternative procedures for generating imputed values without atten-tion to more elaborate modeling assumptions, and also allowed greater control over the effect ofintracluster correlation in the missing data mechanism, ranging from a minimum (representing identi-cal cluster follow-up rates) to a maximum (representing cluster-level loss to follow-up). However, thisdoes not preclude application of our results to MAR or MNAR mechanisms, which are often morerealistic. For example, Siddiqui, Flay and Hu (1996) identified factors associated with attrition in aschool-based smoking prevention study and found that students with lower academic achievement,smokers and certain ethnic groups were more likely to be missing. Under MAR, it is well-known thata likelihood-based analysis, using all the observed data, is fully efficient and valid (Little and Rubin,2002); thus, a mixed-effects regression analysis in which the covariates assumed to be correlated withthe missing data mechanism are included as predictors may be fitted to the data from a clusterrandomized trial. Nevertheless, imputation remains an important strategy in the case of covariates thatare not of interest in the analysis or whose inclusion would change interpretation of key parametersin the analysis model. Moreover, in the case of MNAR mechanisms, imputation remains a flexibletool for conducting sensitivity analyses under various alternative assumptions about the missing data.In both situations, the question about how the imputed values should be generated needs to be an-swered.
An important area for further research is the impact of different imputation strategies on powerunder MAR mechanisms. We suspect that under MAR, the loss in power under cluster mean imputa-tion may be more pronounced than was found in this simulation study, because additional parameterswould have to be estimated using within-cluster data only, and when observed cluster sizes are smallor when cluster follow-up rates are highly variable, these parameters may then be poorly estimated.
In this article, we have focused on studies using a completely randomized design; in the case ofstratified or pair-matched designs, the potential dependency of the missing data mechanism on cluster-level characteristics needs to be considered, and this may affect the choice between different imputa-tion strategies. Furthermore, we have dealt only with the case of missing continuous outcomes; furtherresearch is needed to compare alternative strategies in the case of missing binary or categorical data,or in the case of missing covariates.
Biometrical Journal 50 (2008) 3 343
# 2008 WILEY-VCH Verlag GmbH & Co. KGaA, Weinheim www.biometrical-journal.com

Appendix
In this appendix, we show that group mean imputation underestimates the standard error by a factorequal to the follow-up rate. Let * and obs refer to the imputation-completed data and the observed datarespectively. Consider the sample variance of the imputation-completed cluster means:
S2 �YY*ij� �
¼ 1k � 1
Xk
j¼1
�YY*ij � �YY*i� �2
¼ 1k � 1
Xk
j¼1
�rrij �YYobsij þ ð1� �rrijÞ �YYobs
i � �YYobsi
h i2
¼ 1k � 1
Xk
j¼1
�rr2ij
�YYobsij � �YYobs
i
h i2:
Assuming, for simplicity, that t ¼ �1=ðm� 1Þ, then
S2 �YY*ij� �
¼ 1k � 1
�rr2Xk
j¼1
�YYobsij � �YYobs
i
h i2¼ �rr2S2 �YYobs
ij
which proves the result.
Acknowledgements This work was partially supported by an Ontario Graduate Scholarship and grants from theNatural Sciences and Engineering Research Council of Canada.
Conflict of Interests StatementThe authors have declared no conflict of interest.
References
Barnard, J. and Rubin, D. B. (1999). Small-sample degrees of freedom with multiple imputation. Biometrika86(4), 948–955.
Campbell, M. K., Mollison, J., and Grimshaw, J. M. (2001). Cluster trials in implementation research: estimationof intracluster correlation coefficients and sample size. Statistics in Medicine 20(3), 391–399.
Carpenter J. R. and Goldstein H. (2004). Multiple imputation in MLwiN. Multilevel Modelling Newsletter 16, 9–18.COMMIT. (1995). Community intervention trial for smoking cessation: I. Cohort results from a four-year commu-
nity intervention. American Journal of Public Health 85(2), 183–192.Davis, C. E., Hunsberger, S., Murray, D. M., Fabsitz, R. R., Himes, J. H., Stephenson, L. K., Caballero, B., and
Skipper, B. (1999). Design and statistical analysis for the Pathways study. American Journal of ClinicalNutrition 69(S), 760S–763S.
Diehr, P., Martin, D. C., Koepsell, T., Cheadle, A., Wagner, E., and Psaty, B. (1995). Optimal survey design forcommunity intervention evaluations: cohort or cross-sectional? Journal of Clinical Epidemiology 48(12),1461–1472.
Donner, A., Brown, K. S., and Brasher, P. (1990). A methodological review of non-therapeutic intervention trialsemploying cluster randomization, 1979–1989. International Journal of Epidemiology 19(4), 795–800.
Donner, A. and Klar, N. (1994). Cluster randomization trials in epidemiology: theory and application. Journal ofStatistical Planning and Inference 42, 37–56.
Donner, A. and Klar, N. (2001). Design and Analysis of Cluster Randomization Trials in Health Research. Ar-nold, London.
Feldman, H. A. and McKinlay, S. M. (1994). Cohort versus cross-sectional design in large field trials: precision,sample size, and a unifying model. Statistics in Medicine 13, 61–78.
Feng, Z., Diehr, P., Peterson, A., and McLerran, D. (2001). Selected statistical issues in group randomized trials.Annual Review of Public Health 22, 167–187.
344 M. Taljaard, A. Donner and N. Klar: Imputation in Cluster Randomized Trials
# 2008 WILEY-VCH Verlag GmbH & Co. KGaA, Weinheim www.biometrical-journal.com

Fleiss, J. L. (1981). Statistical methods for rates and proportions. Wiley, New York.Gail, M. H., Byar, D. P., Pechacek, T. F., and Corle, D. K. (1992). Aspects of statistical design for the community
intervention trial for smoking cessation (COMMIT). Controlled Clinical Trials 13, 6–21.Gail, M. H., Tan, W. Y., and Piantadosi, S. (1988). Tests for no treatment effect in randomized clinical trials.
Biometrika 75, 57–64.Gilks, W. R., Richardson, S., and Spiegelhalter, D. J. (eds.) (1996). Markov-Chain Monte Carlo in Practice. Chap-
man and Hall, London.Gomel, M. K., Oldenburg, B., Simpson, J. M., Chilvers, M., and Owen, N. (1997). Composite cardiovascular risk
outcomes of a work-site intervention trial. American Journal of Public Health 87(4), 673–676.Horton, N. J. and Lipsitz, S. R. (2001). Multiple imputation in practice: Comparison of software packages for
regression models with missing variables. American Statistician 5(3), 244–254.Hunsberger, S., Murray, D., Davis, C. E., and Fabsitz, R. R. (2001). Imputation strategies for missing data in a
school-based multi-centre study: the Pathways study. Statistics in Medicine 20, 305–316.Laird, N. M. and Ware, J. H. (1982). Random-effects models for longitudinal data. Biometrics 38, 963–974.Lavori, P. W., Dawson, R., and Shera, D. (1995). A multiple imputation strategy for clinical trials with truncation
of patient data. Statistics in Medicine 14, 1913–1925.Lipsitz, S. R., Leong, T., and Lipschultz, S. (2001). A partial correlation coefficient and coefficient of determina-
tion for multivariate normal repeated measures data. The Statistician 50(1), 87–95.Little, R. J. A. and Rubin, D. B. (2002). Statistical analysis with missing data. 2nd ed. Wiley, New Jersey.Liu, M., Taylor, J. M. G., and Belin, T. R. (2000). Multiple Imputation and Posterior Simulation for Multivariate
Missing Data in Longitudinal Studies. Biometrics 56, 1157–1163.Meng, X. L. (1994). Multiple Imputation with Uncongenial Sources of Input (with discussion). Statistical Science
9, 538–574.Molenberghs, G. and Kenward M. G. (2007). Missing Data in Clinical Studies. Wiley, Chichester.Neuhaus, J. M. (1992). Statistical methods for longitudinal and clustered designs with binary responses. Statistical
Methods in Medical Research 1, 249–273.Oman, S. D. and Zucker, D. M. (2001). Modelling and generating correlated binary variables. Biometrika 88,
287–290.Prentice, R. L. (1988). Correlated binary regression with covariates specific to each binary observation. Biometrics
44, 1033–1048.Rubin, D. B. and Schenker, N. (1986). Multiple imputation for interval estimation from simple random samples
with ignorable nonresponse. Journal of the American Statistical Association 81(394), 366–374.Rubin, D. B. and Schenker, N. (1991). Multiple imputation in health-care databases: an overview and some appli-
cations. Statistics in Medicine 10, 585–598.Rubin, D. B. (1976). Inference and missing data. Biometrika 63, 581–592.Rubin, D. B. (1996). Multiple Imputation after 18þ years. Journal of the American Statistical Association
91(434), 473–489.Rubin, D. B. (1987). Multiple Imputation for Nonresponse in Surveys. Wiley, New York.Rubin, D. B. (1978). Multiple imputations in sample surveys. Procedures of the Survey Research Methods Section
of the American Statistical Association, 20–34.Schafer, J. L. and Yucel, R. M. (2001). PAN: Multiple imputation for multivariate panel data, software available at
http://www.stat.psu.edu/~jls/misoftwa.html.Schafer, J. L. (2001). Multiple imputation with PAN. In: Sayer, A. G., Collins, L. M. (eds.), New methods for the
analysis of change. American Psychological Association, Washington DC.Siddiqui, O., Flay, B. R., and Hu, F. B. (1996). Factors affecting attrition in a longitudinal smoking prevention
study. Preventive Medicine 25, 554–560.Syme, S. L. (1978). Life style intervention in clinic-based trials. American Journal of Epidemiology 108, 87–91.Taljaard, M., Donner, A., and Klar, N. (2007). Accounting for Expected Attrition in the Planning of Community
Intervention Trials. Statistics in Medicine 26, 2615–2628Thompson, E. A., Eggert, L. L., Randell, B. P., and Pike, K. C. (2001). Evaluation of Indicated Suicide Risk Pre-
vention Approaches for Potential High School Drop outs. American Journal of Public Health 91(5), 742–752.Van Buuren, S. and Oudshoorn, C. G. M. (1999). Flexible multivariate imputation by MICE. Leiden: TNO Preven-
tie en Gezondheid, TNO/PG 99.054.Yuan, Y. C. (2000). Multiple Imputation for Missing Data: Concepts and New Development. In Proceedings of the
Twenty-Fifth Annual SAS Users Group International Conference (Paper No. 267). SAS Institute, Cary, NC.Zhang, P. (2003). Multiple Imputation: Theory and Method. International Statistical Review 71(3), 581–592.
Biometrical Journal 50 (2008) 3 345
# 2008 WILEY-VCH Verlag GmbH & Co. KGaA, Weinheim www.biometrical-journal.com