Embed Size (px)
Citation preview
IMS5028
1
Analysis and delivery tools
Business Intelligence, OLAP, and customer analytics
2
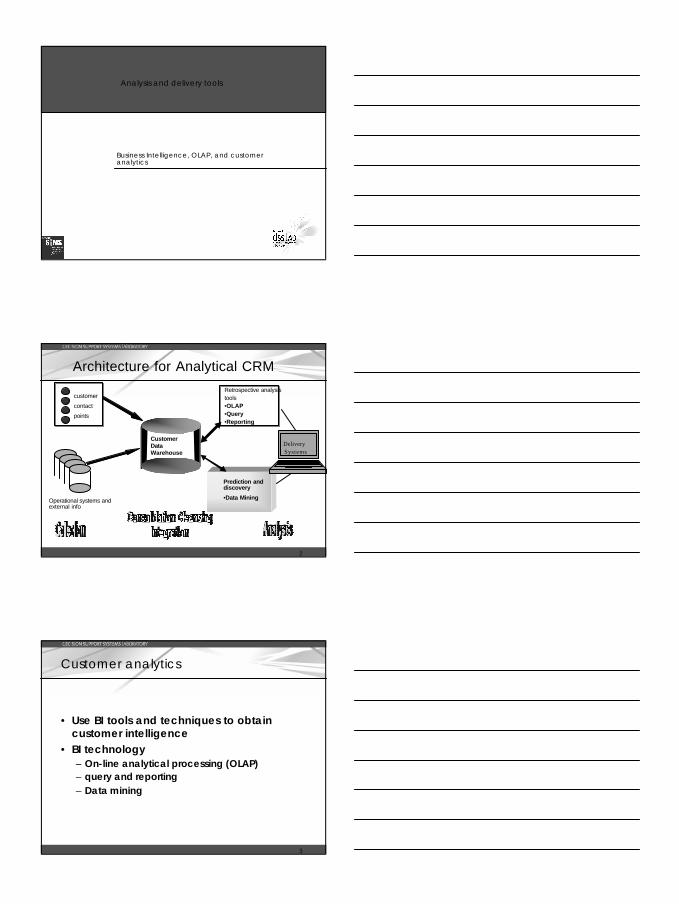
customer
contact
points
Retrospective analysistools•OLAP•Query•Reporting
Prediction and discovery
•Data Mining
Customer Data Warehouse
Architecture for Analytical CRM
Operational systems and external info
Delivery Systems
3
Customer analytics
• Use BI tools and techniques to obtain customer intelligence
• BI technology– On-line analytical processing (OLAP)– query and reporting– Data mining
IMS5028
2
4
Business Intelligence (BI)
• BI – many definitions
• “a broad category of software and solutions for gathering, consolidating, analysing and providing access to data in a way that lets enterprise users make better business decisions”Gartner(1994)
• Business intelligence is a product of analysing business data using business intelligence tools. It emerges as a result of this analysis (SAS institute, 1997)
5
What is OLAP?
• “a category of software technology that enables analysts, managers, and executives to gain insight into data….”
• “Derived from end-user requirements, OLAP enables end-users to perform ad hoc analysis of data in multiple dimensions, thereby giving them the insight and understanding they need for better decision-making”
• (OLAP council http://www.consortiuminfo.org/links/olap.php)
6
OLAP
• Isn’t a specific technology , it describes the rules for a technology
• “OLAP Council ---is a global consortium that was established in January 1995 to serve as an industry guide
• Codd’s 12 OLAP rules (1993)
IMS5028
3
7
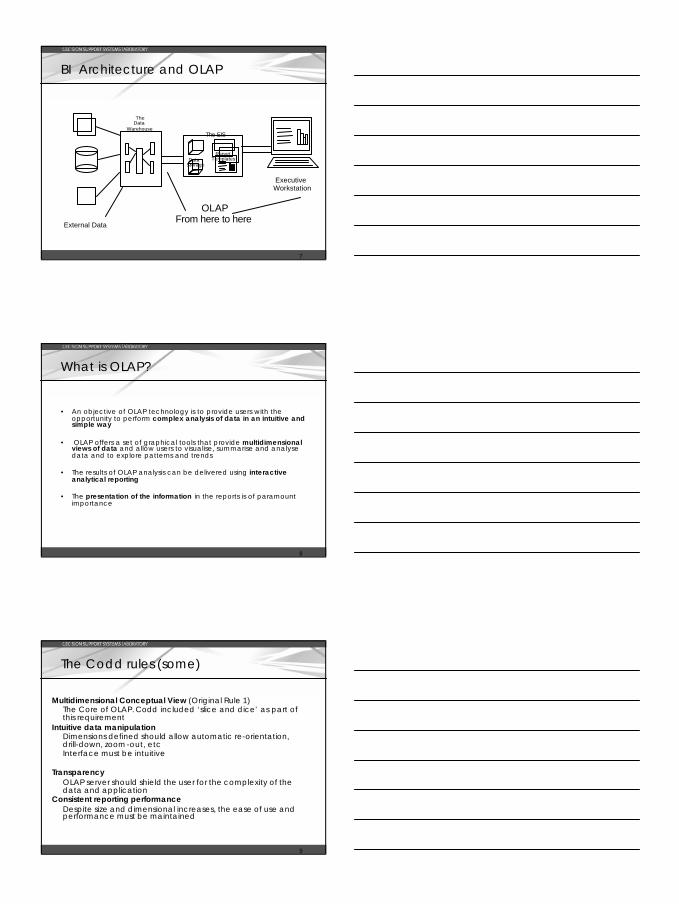
BI Architecture and OLAP
External Data
Data Storage
The EIS
Report Templates
Executive Workstation
The Data
Warehouse
OLAPFrom here to here
8
What is OLAP?
• An objective of OLAP technology is to provide users with the opportunity to perform complex analysis of data in an intuitive and simple way
• OLAP offers a set of graphical tools that provide multidimensional views of data and allow users to visualise, summarise and analysedata and to explore patterns and trends
• The results of OLAP analysis can be delivered using interactive analytical reporting
• The presentation of the information in the reports is of paramount importance
9
The Codd rules (some)
Multidimensional Conceptual View (Original Rule 1)The Core of OLAP. Codd included ‘slice and dice’ as part of this requirement
Intuitive data manipulationDimensions defined should allow automatic re-orientation, drill-down, zoom-out, etcInterface must be intuitive
TransparencyOLAP server should shield the user for the complexity of the data and application
Consistent reporting performanceDespite size and dimensional increases, the ease of use and performance must be maintained
IMS5028
4
10
The Codd rules
Flexible reporting• Any possible orientation• Rows and Columns be able to show from 0 to n dimensionsUnlimited dimensions and aggregation levels• From 15 - 20 dimensions maximum• Rare in reporting to go beyond 12 dimensions • 6-7 is usual• Unlimited aggregationUnrestricted cross-dimensional operations• Calculations are not singular dimensional even though they may
appear to beMulti-user support• Access, Integrity, Security
11
OLAP Multi-dimensionality
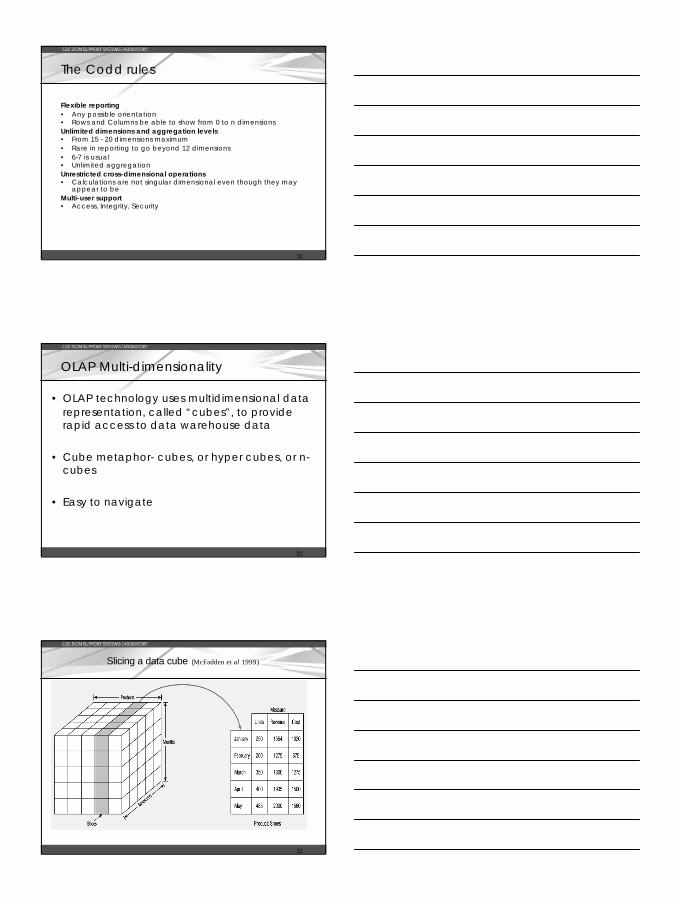
• OLAP technology uses multidimensional data representation, called “cubes”, to provide rapid access to data warehouse data
• Cube metaphor- cubes, or hyper cubes, or n-cubes
• Easy to navigate
12
Slicing a data cube (McFadden et al 1999)
IMS5028
5
13
Typical OLAP Operations
Slice and dice
Drill down: from higher level summary to lower level summary or detailed data
Drill-up (roll-up): reverse of drill down, summarises data by rolling up hierarchy
Pivot: Rotate the cube
Drill across: drilling across more than one fact table
14
Hierarchies
• Hierarchies within the dimensions are very important– Enable drill up and down– e.g. day, week, month, quarter, year
Example: store-countrystore-statestore-citystore-id
15
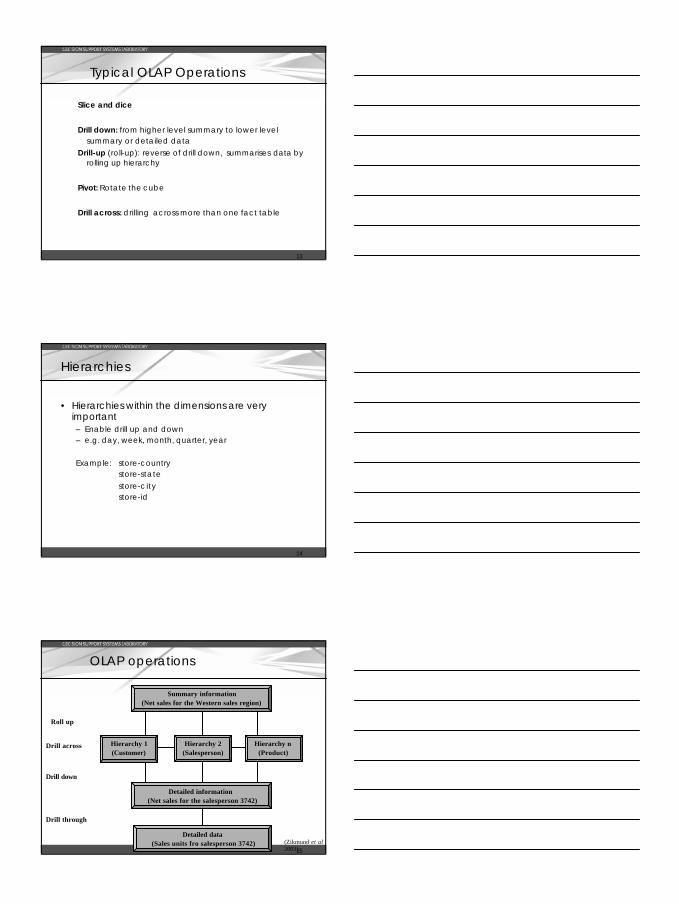
OLAP operations
Summary information(Net sales for the Western sales region)
Roll up
Drill across Hierarchy 1(Customer)
Drill down
Hierarchy 2(Salesperson)
Hierarchy n(Product)
Detailed information(Net sales for the salesperson 3742)
Detailed data(Sales units fro salesperson 3742)
Drill through
(Zikmund et al2003)
IMS5028
6
16
OLAP and dimensional models
• Star schema is compatible with OLAP systems
• Star schemas are efficient and easy to understand and use
17
Star schema and SQL queries
• DM organises data into structures that correspond to the way ana lysts query data
• textual attributes are used for constraining and grouping withindata warehouse queries.
Example query (Kimball) Find all the product brands that were sold in the first quarter of 1995 and
display the total sales and number of units
SQLSelect p.brand, sum(f.dollars), sum(f.units)From salesfact f, product p, time tWhere f.productkey = p.productkeyAnd f.timekey = t.timekeyAnd t.quarter = ‘1 Q 1995’Group by p.brandOrder by p.brand
18
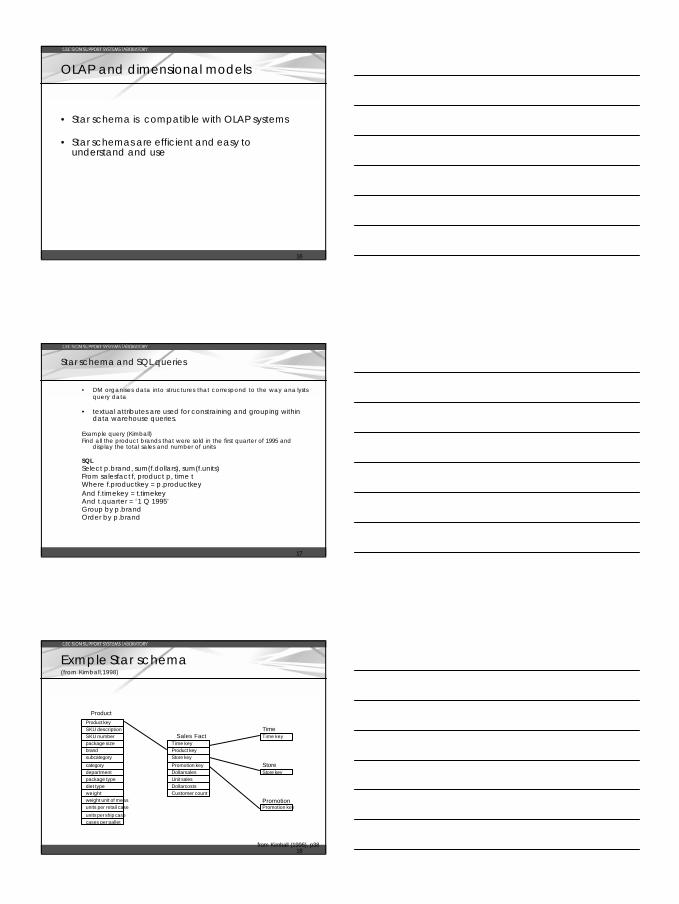
Exmple Star schema (from Kimball,1998)
Time keyProduct keyStore key
Promotion key
Sales Fact
Product
Unit salesDollar costsCustomer count
Dollar sales
Product keySKU descriptionSKU numberpackage size
subcategory
categorydepartment
brand
package type
weightweight unit of measunits per retail case
diet type
units per ship casecases per pallet
Time keyTime
Store keyStore
Promotion keyPromotion
from Kimball (1996), p38
IMS5028
7
19
Star schema and reports
• dimensions – provide a way of grouping the facts– appear as row headers in reports– Enable constraints and grouping within data
warehouse queries.
• textual attributes in dimension tables are used as the source of row headers in a report (example from Kimbal)
20
Last week’s example from FreeDataWarehouse.com
Dimensional model (Star Schema)
21
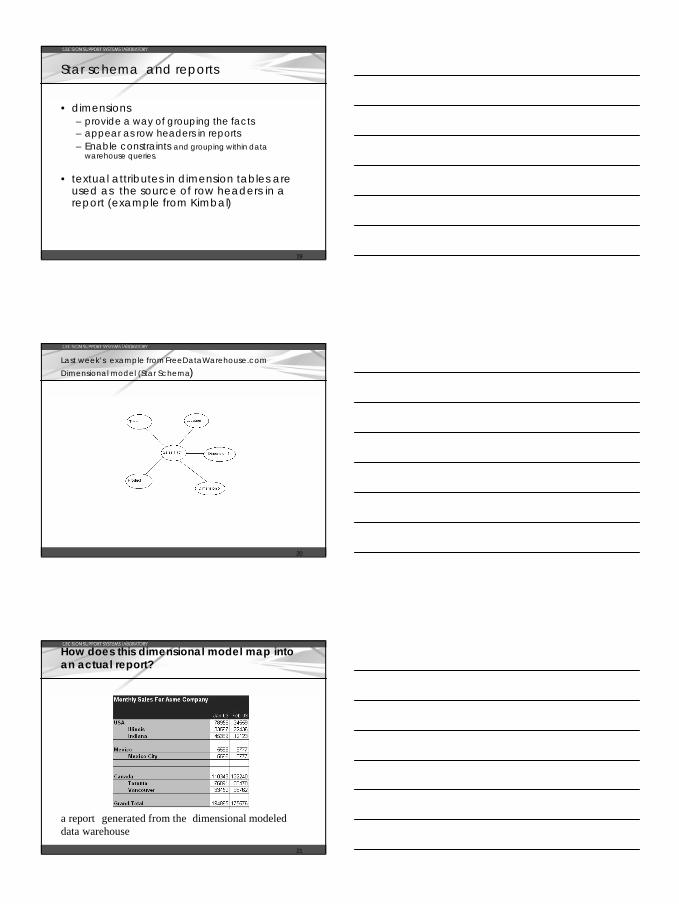
How does this dimensional model map into an actual report?
a report generated from the dimensional modeled data warehouse
IMS5028
8
22
Analysis of Customer Data
• OLAP, reporting, query Allow exploration of existing customer data, typically by– transaction– location – product – time
500 2000 1250
2 6 0 920 6 7 0
1 0 0 400 750Volume
C o s t
Revenue
MonthProduct
Measure
Measures
Volume Cost Revenue
Janua ry 100 260 500
February 400 920 2000
March 750 670 1250
Product 1
23
OLAP and Visualisation
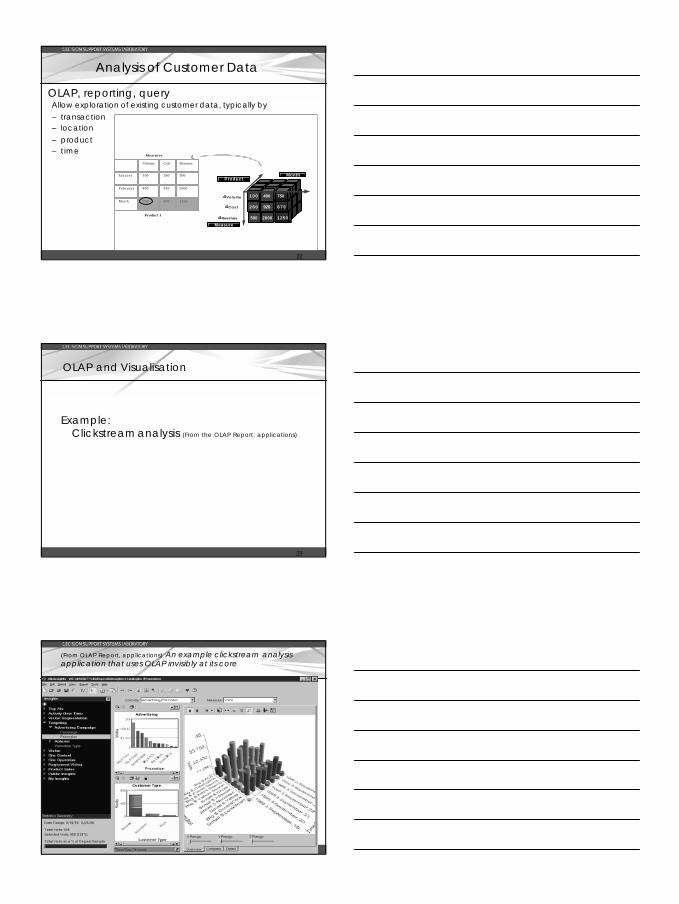
Example:Clickstream analysis (From the OLAP Report: applications)
24
(From OLAP Report, applications) An example clickstream analysis application that uses OLAP invisibly at its core
IMS5028
9
25
Cont.
• An example clickstream analysis application that uses OLAP invisibly at its core: – visitor segmentation (browsers, abandoners, buyers) for
various promotional activities
There are many dimensions to this analysis:Where the visitors came from, the time of day, the
route they take through the site, whether or not they started/completed a transaction, and any demographic data available about customer visitors
26
For more on OLAP and applications read the OLAP report
• http://66.40.99.72/about.htm• http://66.40.99.72/Applications.htm
Marketing and sales analysisDatabase marketing
• http://66.40.99.72/about.htm
27
CRM analytics using MicroStrategy
• From TeradataStudent network: www.teradatastudentnetwork.com password will be provided
• Go to MicroStrategy BI software
• Customer analysis module –provides OLAP style reports
• Exercises: Student are to explore customer analytics using the Customer Analysis Module and submit in week 11(or before)
IMS5028
10
28
MicroStrategy CRM reports
• Customer analysis module, four groups of reports:– Acquisition, retention and attrition– Customer segmentation– Profitability and cross-sell analysis– Scorecards
29
Acquisition, Retention and Attrition module
• Acquisition, Retention and Attrition reports focus on understanding customer churn and it's impact on overall revenue and profitability
• These reports provide an insight on trends and profiles of customers being lost, acquired and retained
30
Customer Segmentation module
Segmentation reports provide organizations the ability to analyze customer segments based on demographic, psychographic, geographic and profitability profiles
IMS5028
11
31
Profitability and Cross-Sell Analysis module
• Profitability and Cross-Sell reports provide insight on trends in customer profitability, product preferences, and products sold together
• These reports identify who are the most profitable customers, what they are buying and products selling well
32
Customer Segmentationmodule
• Segmentation reports provide organizations the ability to analyze customer segments based on demographic, psychographic, geographic and profitability profiles.
33
Scorecardsmodule
• contains personalized reports and dashboards that users view frequently to assess the overall situation within customer marketing
IMS5028
12
34
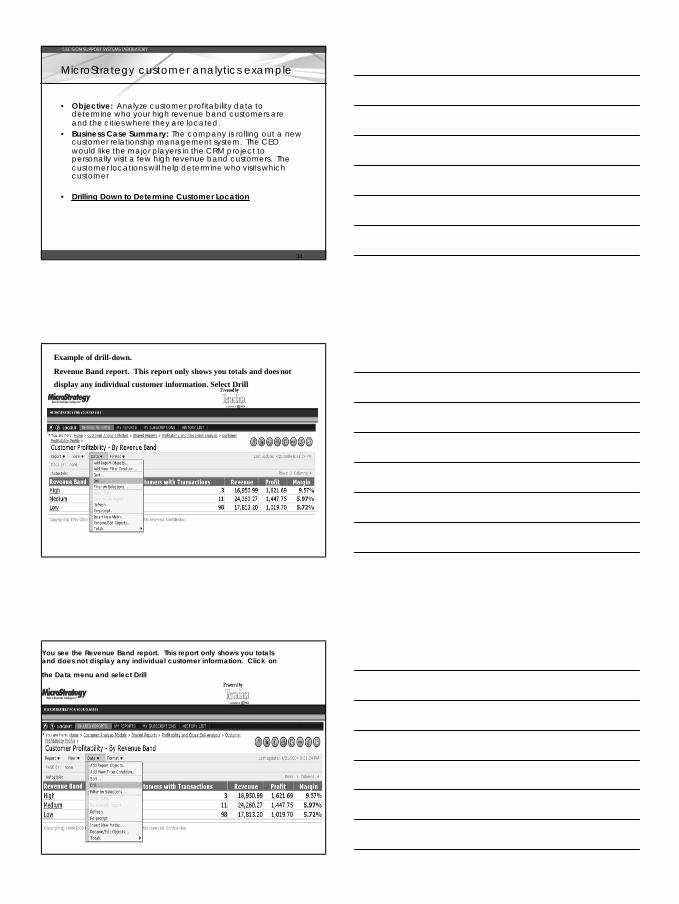
MicroStrategy customer analytics example
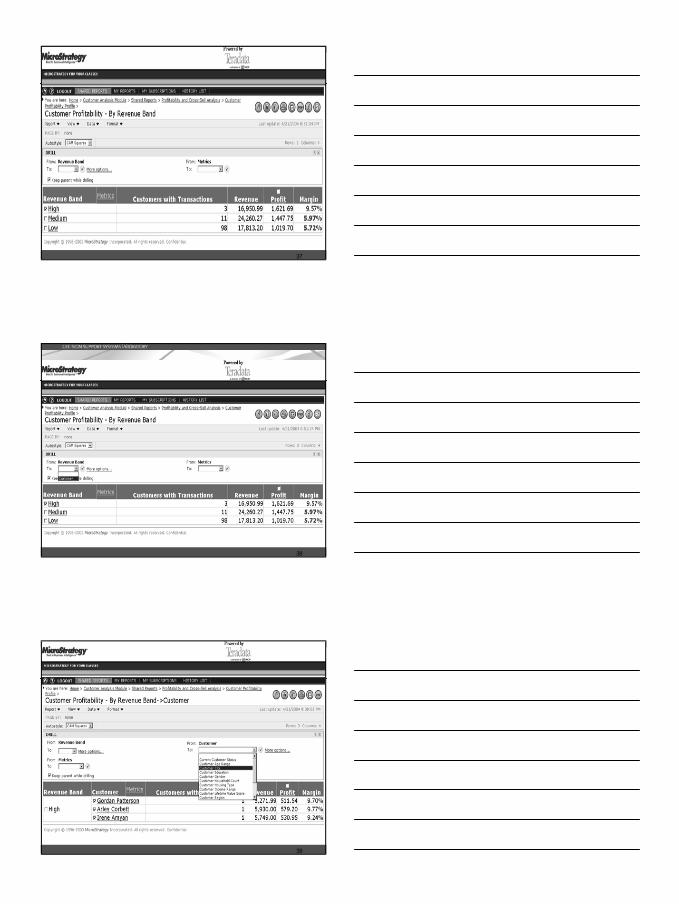
• Objective: Analyze customer profitability data to determine who your high revenue band customers are and the cities where they are located.
• Business Case Summary: The company is rolling out a new customer relationship management system. The CEO would like the major players in the CRM project to personally visit a few high revenue band customers. The customer locations will help determine who visits which customer
• Drilling Down to Determine Customer Location
Example of drill-down.
Revenue Band report. This report only shows you totals and does not
display any individual customer information. Select Drill
You see the Revenue Band report. This report only shows you totals and does not display any individual customer information. Click on
the Data menu and select Drill
IMS5028
13
37
38
39
IMS5028
14
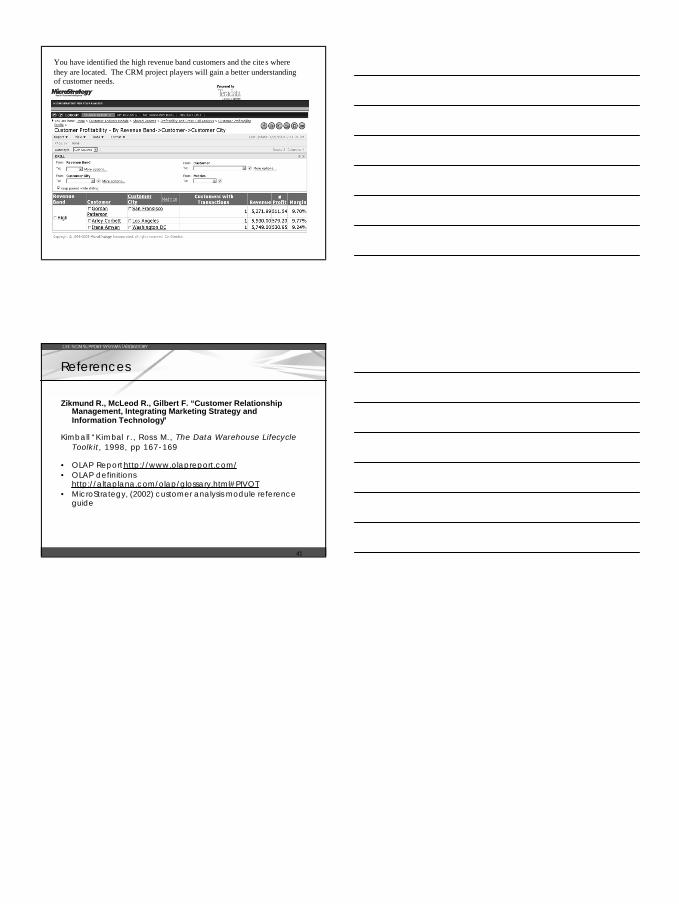
You have identified the high revenue band customers and the cite s where they are located. The CRM project players will gain a better understanding of customer needs.
41
References
Zikmund R., McLeod R., Gilbert F. “Customer Relationship Management, Integrating Marketing Strategy and Information Technology”
Kimball “Kimbal r., Ross M., The Data Warehouse Lifecycle Toolkit, 1998, pp 167-169
• OLAP Report http://www.olapreport.com/• OLAP definitions
http://altaplana.com/olap/glossary.html#PIVOT• MicroStrategy, (2002) customer analysis module reference
guide