Embed Size (px)
Citation preview
In a brave new pensions world what will DC members really want?Aon DC Member SurveyAon Hewitt and Cass Business School London, December 2014
Aon HewittRetirement | DC Consulting
Risk. Reinsurance. Human Resources.
2 DC Member Survey
Foreword . . . . . . . . . . . . . . . . . . . . . . . . . . . . . . . . . . . . . . . . . . . . . . . . . . 3
Executive summary . . . . . . . . . . . . . . . . . . . . . . . . . . . . . . . . . . . . . . . . . . 4
Key findings . . . . . . . . . . . . . . . . . . . . . . . . . . . . . . . . . . . . . . . . . . . . . . . 6
Introduction . . . . . . . . . . . . . . . . . . . . . . . . . . . . . . . . . . . . . . . . . . . . . . . 7
The survey sample . . . . . . . . . . . . . . . . . . . . . . . . . . . . . . . . . . . . . . . . . . 7
Contribution levels . . . . . . . . . . . . . . . . . . . . . . . . . . . . . . . . . . . . . . . . . 9
Sources of retirement income . . . . . . . . . . . . . . . . . . . . . . . . . . . . . . . . 11
Pension expectations – the new reality . . . . . . . . . . . . . . . . . . . . . . . . . 13
Annuities are dead... long live annuities! . . . . . . . . . . . . . . . . . . . . . . . 18
Making decisions on retirement spending . . . . . . . . . . . . . . . . . . . . . . 21
Managing drawdown . . . . . . . . . . . . . . . . . . . . . . . . . . . . . . . . . . . . . . 23
The way forward . . . . . . . . . . . . . . . . . . . . . . . . . . . . . . . . . . . . . . . . . . . 26
Table of Contents
Aon Hewitt 3
Foreword
With the Pensions Freedom announcement by the Treasury earlier this year, employer-sponsored
defined contribution (DC) pensions reached a turning point. DC scheme members now have
more choice around how to take their retirement income – cash lump sum, annuity, drawdown
– or a combination of all of these. At the same time, members are re-thinking how and when
they retire – partial or flexible retirement, for example, are emerging as preferred routes.
The ‘brave new pensions world’ will present significant challenges for employers, trustees
and product providers alike. For employers in particular, the changes pose challenges not
just in pension terms but also for their reward and incentive systems. Trustees of DC pensions
are now called upon to meet increasing and more complex governance and member
education requirements. And, providers are tackling the development of appropriate
products and services to meet the demands of this new pensions environment.
But, at the centre of this are the scheme members. As support for members of DC
schemes acquires greater focus, it is important to understand how they are responding
to the changes and how they plan to approach their retirement. Our collaboration
on this report with YouGov and Cass Business School sets out to do just this.
Our findings provide a refreshing insight in to what DC scheme members are thinking about their
pensions and individual approaches to retirement. It underscored the diversity of their needs
but also their pragmatism around their retirement prospects. Clearly, attitudes among scheme
members have reached a significant turning point and it is one to which we must all respond.
Andy Cox Aon Hewitt Consulting - EMEACEO Retirement & Financial Management
4 DC Member Survey
Executive summary
In this paper we present the results of a survey of over two thousand
members of occupational DC pension schemes. The survey has important
messages for employers, for trustees, and for product providers.
One of the key findings from this research is that there appears to be a welcome sense of
realism among employees about their retirement prospects. Nearly half of the respondents
expect their pension to be between 21% and 50% of their salary; the same proportion
expect to retire between the ages of 66 and 70; and nearly one in ten don’t expect to
be able to retire until they reach their 70s. The old expectation of a replacement ratio of
two thirds of pre-retirement income is now consigned to the history books (at least for
private sector DC members). You might say: two-thirds is dead – long live one third!
This realism about retirement prospects also extends to the way in which DC members
are planning to approach retirement. Only just under half of the sample expected to be
able to adopt the traditional approach to retirement, that is, work full time and then retire
fully from all paid employment. Just over 40% of our sample expect to ease into retirement
by working part-time before they retire, while nearly 5% expected not to retire at all!
While realism should be welcome, the clear intention for a significant proportion of members
to ‘glide’ into retirement, by gradually reducing their working hours, may present significant
challenges to employers. Dealing with these challenges will be easier if employers are
aware of the retirement intentions of their employees and, of course, these intentions will
be related to the adequacy, or inadequacy of the pension provision of members. Engaging
with employees well before retirement plans are put into action, and reviewing retirement
provision, where auto-escalation may play a role, will help employers manage their workforces
more effectively and, simultaneously, help employees achieve their retirement goals.
While one of the key messages of our survey is for employers to engage more fully with
their members in this more complex retirement environment, we also have a perhaps
surprising message for product providers. Although the recent changes to pension
regulations may seem to have been the final nail in the coffin for annuities, when we
asked individuals about their intentions with regard to their retirement savings, nearly
70% expressed a desire for a “steady, secure income”, where they will not outlive their
retirement savings. That is, an annuity in all but name! Furthermore, we also found that
survey respondents do not seem to value ‘flexibility’ in retirement income very highly and
that most do not see being able to leave their pension pot as a bequest as a key concern.
Aon Hewitt 5
New products will need to be developed to meet this demand, for annuity-
like products … although probably best not to refer to them as annuities!
Another key message from our survey relates to product providers’ search for the holy grail of a
‘one-size-fits-all’ DC pension solution. Our survey reveals that although pension savings will play
a key role in funding retirement spending, DC members are planning to use a variety of other
sources, including Individual Savings Accounts (ISAs) and property, to fund their retirement
spending. As a consequence, as much as the industry might like to have a ‘one-size fits all’
solution, the diversity of funding sources, the likely equally diverse, personal decumulation
strategies, and the likely increase in part-time working means that the search for one solution
for all is likely to be a fruitless one. We also find that only a very small proportion of respondents
(4%) would take that portion of their pension pot, in excess of the tax free allowance, as cash.
This finding might help to allay widespread fears that people would use the new pension rules
to ‘cash in’ all of their pension fund and potentially ‘blow it’ in the first few years of retirement.
In the likely absence of a ‘one-size-fits-all’ DC pension solution, DC members will face
many challenges in this heterogeneous and complex pension environment. How will they
traverse this landscape? One third of the survey sample intend to make these important
retirement-related decisions on their own, or with the help of friends and family. But the
very high proportion of DC members that currently invest in their default DC investment
option probably indicates that members do not engage much with the investment process
prior to retirement. It is not obvious that disengagement in the accumulation phase can be
switched easily to engagement in the decumulation phase, particularly when this phase now
offers far more choices. Another quarter of the respondents said that they would seek the
help of an Independent Financial Adviser (IFA). But post Retail Distribution Review (RDR) this
market has shrunk and remaining advisers are likely to focus predominantly on individuals
with investable assets greater than £150k. Taken together, our survey reinforces the message
for employers and trustees to engage more with their scheme members. Employers should
consider providing tools for members to guide them in their pension choice, while trustees
should consider how they might also be able to provide guidance and perhaps education
to support their members when they make these, potentially life-changing, decisions.
The survey results reported in this paper provide an invaluable insight into the behaviours,
expectations and concerns of members. As such, we hope it will be of great value to product
providers as they contemplate pension product design, and to employers and trustees
as they review their schemes against the backdrop of this brave, new pension world.
Sophia Singleton
Aon Hewitt
December 2014
Professor Andrew Clare Cass Business School
December 2014
6 DC Member Survey
Key findings
DC members have grasped the harsh realities of the 21st century pension environment:
• A pension of two thirds now seems to be dead – long live one third.
• Later and phased retirement looks to be the new norm.
The majority of DC members want an ‘annuity-like’ pension product but not necessarily an annuity:
• DC members do not seem to value flexibility in retirement income that highly.
• Fears about people cashing in their pension pots under the new regulations and ‘blowing’ the cash in the first few years are exaggerated.
A ‘one-size-fits-all’ DC solution may not be achievable, or even desirable.
Employers should consider providing members with tools to help them manage their approach to, and life after, retirement.
Employers and trutees should consider how they can provide education and guidance to those scheme members that wish to continue to invest their pension savings after retirement.
Aon Hewitt 7
Introduction
In collaboration with YouGov (www.yougov.co.uk), Aon Hewitt and Cass Business School conducted a nationwide survey of members of defined contribution (DC) pension schemes. The survey was designed to understand the retirement aspirations of the respondents and, in particular, the likely impact of the government’s new pension regulations on these aspirations.
The survey sample
The survey was conducted during September and October 2014 and produced responses
from just over two thousand members1 of DC pension schemes. The male/female split in
the sample was 63% and 37% respectively, which is broadly consistent with membership
of UK occupational schemes. The vast majority of the respondents (94%) were in full-time
employment (working more than 30 hours a week), while the remainder were in part-time
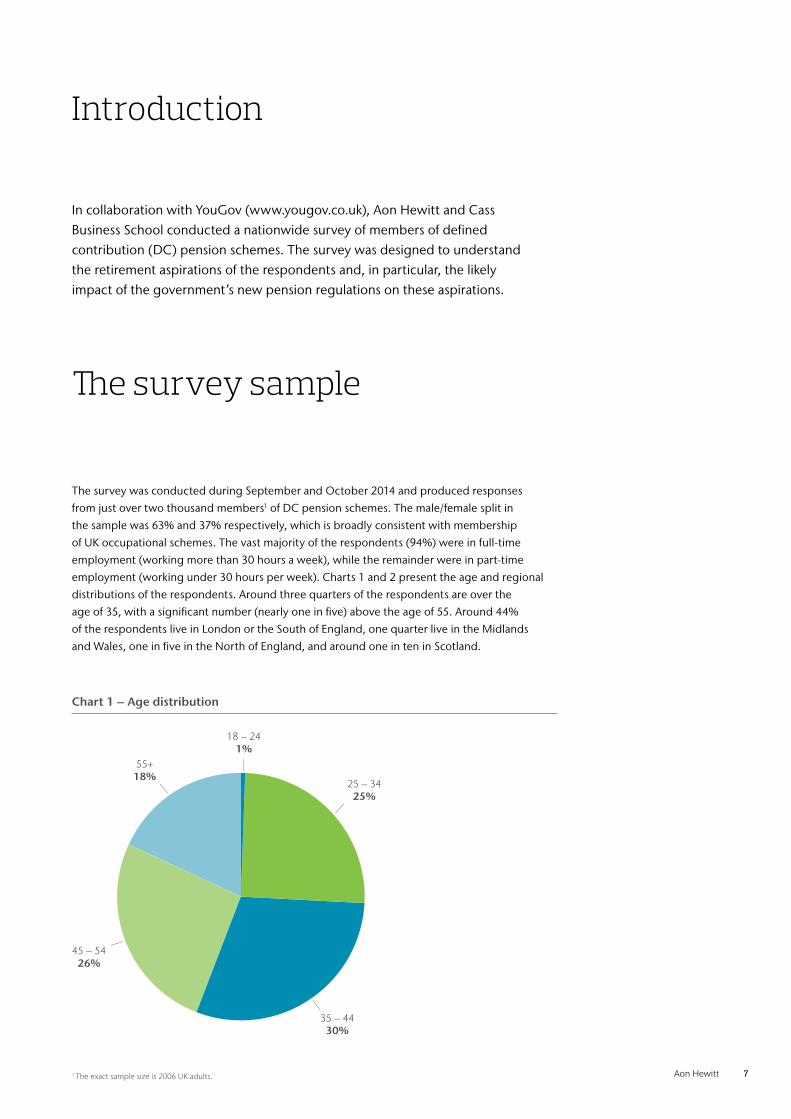
employment (working under 30 hours per week). Charts 1 and 2 present the age and regional
distributions of the respondents. Around three quarters of the respondents are over the
age of 35, with a significant number (nearly one in five) above the age of 55. Around 44%
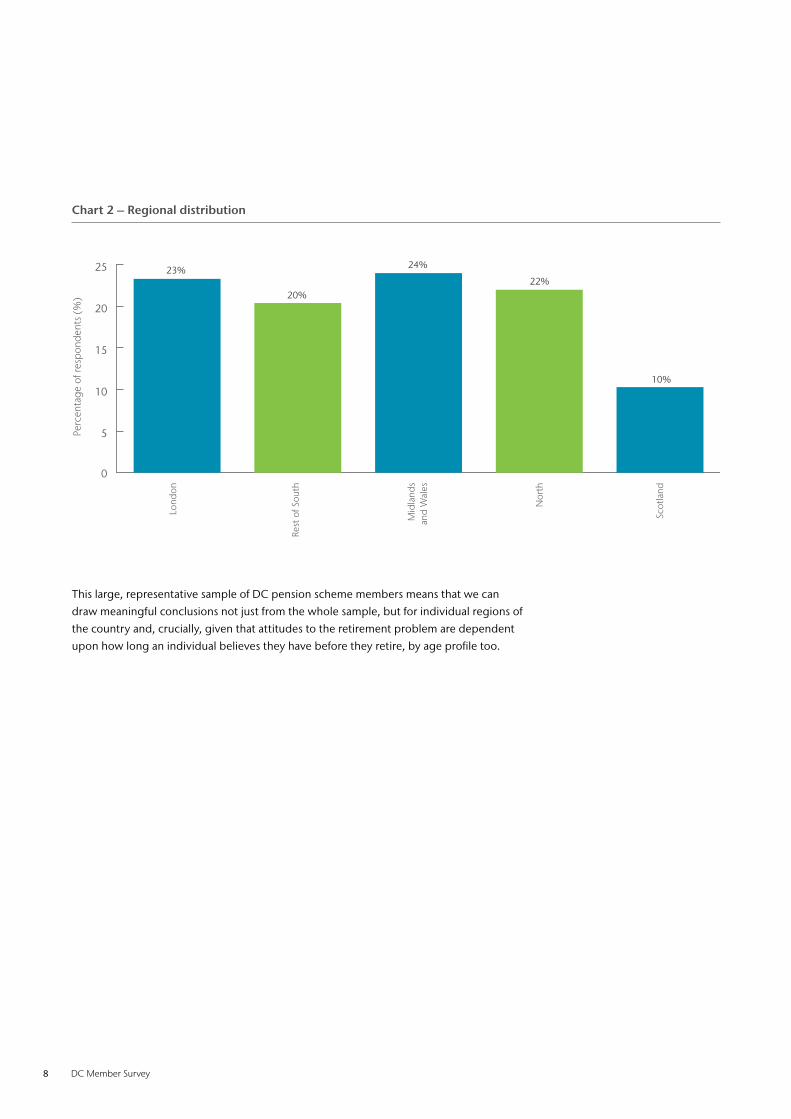
of the respondents live in London or the South of England, one quarter live in the Midlands
and Wales, one in five in the North of England, and around one in ten in Scotland.
Chart 1 – Age distribution
18 – 241%
25 – 3425%
55+18%
35 – 4430%
45 – 5426%
1 The exact sample size is 2006 UK adults.
8 DC Member Survey
This large, representative sample of DC pension scheme members means that we can
draw meaningful conclusions not just from the whole sample, but for individual regions of
the country and, crucially, given that attitudes to the retirement problem are dependent
upon how long an individual believes they have before they retire, by age profile too.
Chart 2 – Regional distribution
Lond
on
Rest
of S
outh
Mid
land
san
d W
ales
Nor
th
Scot
land
0
5
10
15
20
25 23%
20%
38%
24%
22%
10%
Perc
enta
ge o
f res
pon
den
ts (
%)
Aon Hewitt 9
Contribution levels
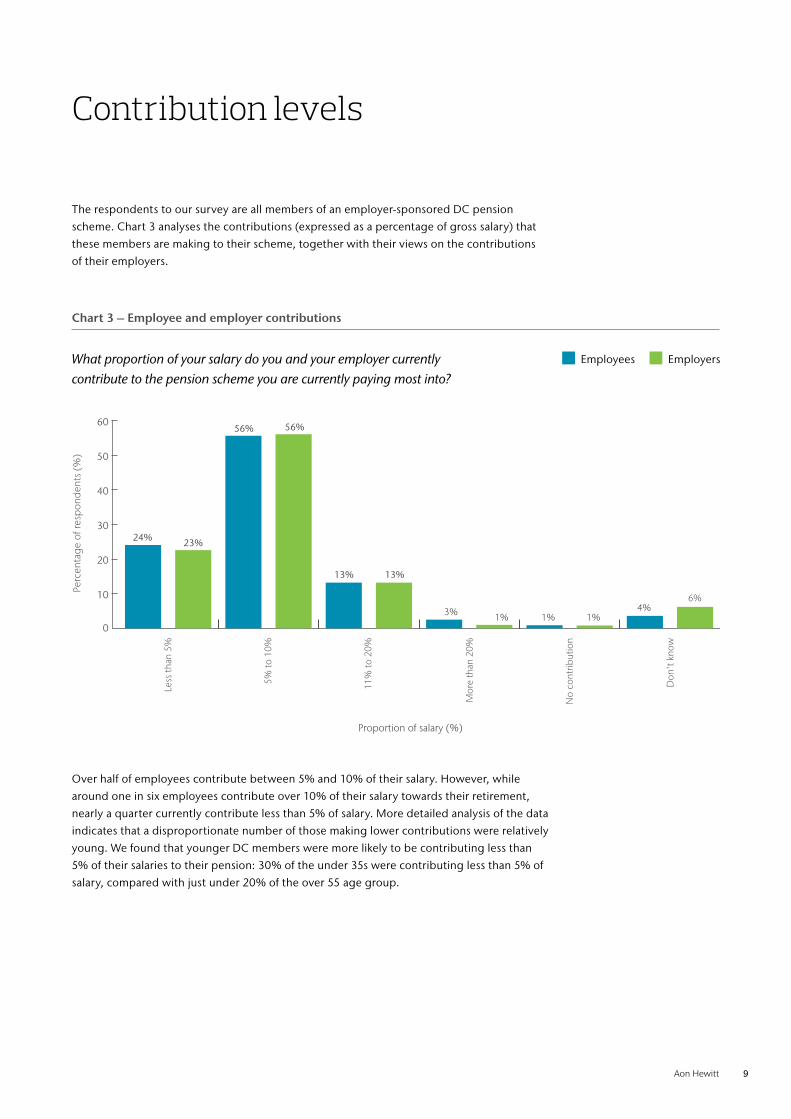
The respondents to our survey are all members of an employer-sponsored DC pension
scheme. Chart 3 analyses the contributions (expressed as a percentage of gross salary) that
these members are making to their scheme, together with their views on the contributions
of their employers.
Over half of employees contribute between 5% and 10% of their salary. However, while
around one in six employees contribute over 10% of their salary towards their retirement,
nearly a quarter currently contribute less than 5% of salary. More detailed analysis of the data
indicates that a disproportionate number of those making lower contributions were relatively
young. We found that younger DC members were more likely to be contributing less than
5% of their salaries to their pension: 30% of the under 35s were contributing less than 5% of
salary, compared with just under 20% of the over 55 age group.
0
10
20
30
40
50
60
Less
than
5%
Don
't k
now
24%
25%
5% to
10%
11%
to 2
0%
Mor
e th
an 2
0%
No
cont
ribut
ion
23%
Proportion of salary (%)
56% 56%
13% 13%
3% 1% 1% 1%4%
6%
Perc
enta
ge o
f res
pon
den
ts (
%)
What proportion of your salary do you and your employer currently contribute to the pension scheme you are currently paying most into?
Chart 3 – Employee and employer contributions
Employees Employers
10 DC Member Survey
That nearly one quarter of the respondents to our survey contribute less than 5% of their
gross salary should be of real concern. Where the contributions being paid are insufficient
to deliver realistic levels of retirement income, we believe that employers should consider
encouraging employees to save more. In such instances, there may be a strong case for
incorporating US-style auto-escalation techniques. US research2 has shown that auto-
escalation can lead to an almost doubling of member savings rates within 5 years.
Turning to employer contributions, Chart 3 shows a strong similarity in the distribution
of employer and employee contributions, with the average contributions payable by
employee and employer being closely aligned. Again more detailed analysis revealed
that 62% of respondents received matching contributions from their employer, while
20%3 received contributions from their employer that were greater than their own
contribution. But the results with regard to employee perceptions of employer contributions
are at odds with other industry surveys that suggest that employer contribution rates
are generally higher than equivalent employee contribution rates. For example, an
NAPF survey in 2013 of 950,000 DC members , found that the average employer
contribution rate was 8% while the average employee contribution rate was 4%4.
It is difficult to know how to reconcile these findings, but it seems likely to us that employees
may be unaware that their employer is, more often than not, contributing more than they are.
If this is the case, then employers probably need to do more to explain and communicate to
members the level of support that they are providing for their employees’ retirement pots.
2 Thaler, R.H. and Benartzi. S., Save more tomorrow: using behavioral economics to increase employee saving, Journal of Political Economy, 2004, vol. 112, no. 1, pt. 2.
3 17.9%, excluding those that responded ‘didn’t know’ to the question. 4 National Association of Pension Funds Annual Survey, 2013
(http://www.napf.co.uk/PressCentre/Press_releases/0370-National-Association-of-Pension-Funds-Annual-Survey-2013-key-findings.aspx)
“Employers probably need to do more to explain and communicate to members the level of support they are providing for their employees’ retirement pots.”
Aon Hewitt 11
Sources of retirement income
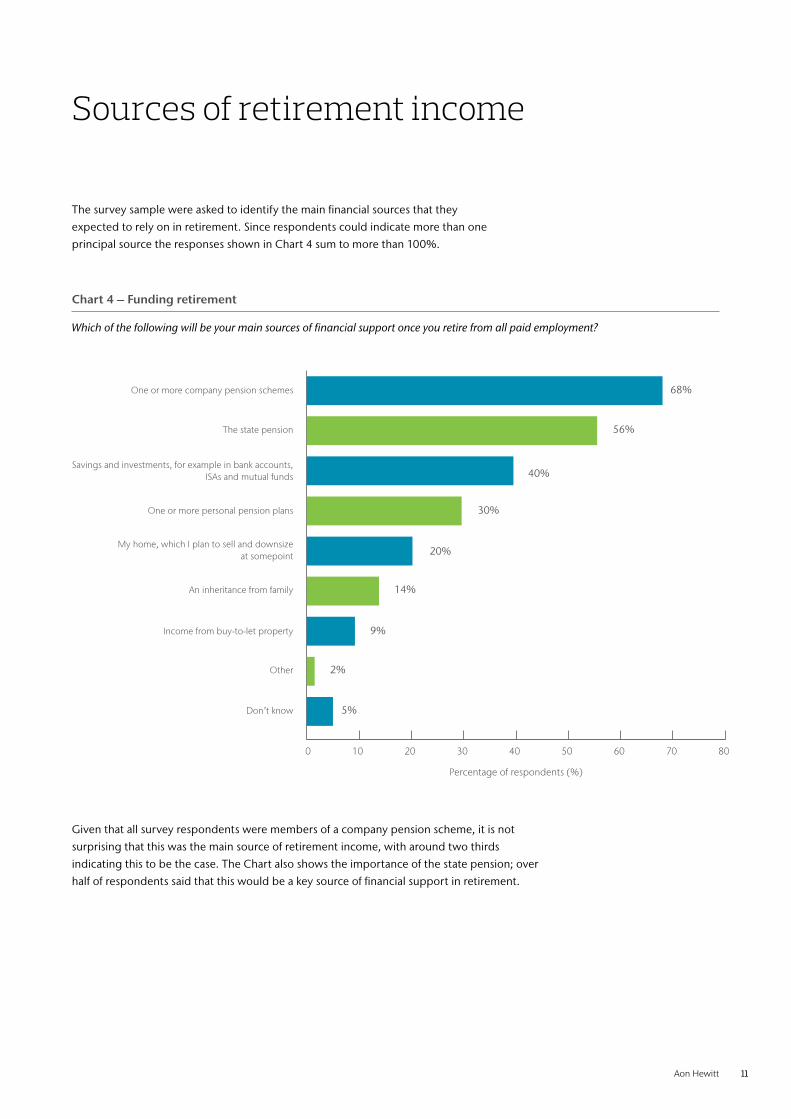
The survey sample were asked to identify the main financial sources that they
expected to rely on in retirement. Since respondents could indicate more than one
principal source the responses shown in Chart 4 sum to more than 100%.
Given that all survey respondents were members of a company pension scheme, it is not
surprising that this was the main source of retirement income, with around two thirds
indicating this to be the case. The Chart also shows the importance of the state pension; over
half of respondents said that this would be a key source of financial support in retirement.
Don’t know
Other
Savings and investments, for example in bank accounts,ISAs and mutual funds
My home, which I plan to sell and downsizeat somepoint
Income from buy-to-let property
An inheritance from family
One or more personal pension plans
One or more company pension schemes
The state pension
0 10 20 30 40 50 60 70 80
Percentage of respondents (%)
5%
2%
40%
20%
9%
14%
30%
68%
56%
Chart 4 – Funding retirement
Which of the following will be your main sources of financial support once you retire from all paid employment?
12 DC Member Survey
What is clear is that pensions will be supplemented by other sources: two out of five expected
to be drawing on other savings in the form of ISAs or other investments such as mutual funds.
The UK’s obsession with housing is also evident: one in five expect to be able to fund at least
some of their retirement through the sale of their home (via downsizing) and one in ten expect
to be able to draw on income from buy-to-let properties. Of those expecting to be able to fund
their retirement through the sale of their home, perhaps surprisingly, we do not find much
regional variation; the proportion expecting to take this approach was similar in London to
the rest of the UK, despite the difference in house prices in London compared to the rest of
the UK. Finally, inheritance plays a relatively small role as an expected key source of retirement
financing, with only one in seven mentioning this as being a likely source of retirement income.
Our results show that employees will be relying increasingly on a complex mix of sources
to fund their retirement. As such, one of the conclusions that we might draw is that a single
‘DC solution for all’ is unlikely to be achievable. Further, if employers wish to support their
employees then they will need to recognise the diversity of retirement funding sources and
help employees achieve a holistic view of their finances, and not just a view of their current
DC arrangements. Tools that help employees keep track of previous pension pots and other
savings would be a major help in pulling this overall financial picture together. Indeed, giving
employees access to this information could prove to be as important as direct financial support.
“Employees will be relying increasingly on a complex mix of sources to fund their retirement. Employers will need to help employees achieve a holistic view of their finances.”

Aon Hewitt 13
Pension expectations – the new reality
Arguably the retirement aspirations of those contributing to occupational pension schemes
in the 1980s and 1990s could be crudely characterised as: “work to state pension age and
then retire with a pension of two thirds of final salary”. However, with plenty of talk in the
media about ‘pension crises’ and the related ‘longevity crisis’, it is possible that the retirement
aspirations of the UK’s population, including those in employer-sponsored DC schemes, are
now less ambitious. Indeed, one of the most important findings of the survey is the very
different expectations that today’s workforce have about their retirement prospects.
We asked respondents when they expected to retire; the results are presented in Chart 5.
The responses show quite a dramatic skew towards post 65 retirement, with few members
having expectations of full retirement before the age 60. Nearly half expect to retire
between the ages of 66 and 70, nearly one in ten don’t expect to be able to retire until
they reach their 70s, and one in forty expect never to retire! These results suggest that
members of employer-sponsored DC plans in the UK are taking what could be described
as a realistic view of their retirement prospects. We are already seeing some manifestation
of this trend towards later retirement in the broader UK workforce. A recent Department
for Work and Pensions (DWP) report5 estimated that the employment rate for those
aged 65 and over had already increased from 5% in 2001 to almost 10% by 2013.
0
10
20
30
40
50
Expected age to retire from all paid employment (years)
Perc
enta
ge o
f res
pond
ents
(%
)
3%
11%
31%
42%
6%
1%2% 4%
Less
than
55
56 to
60
61 to
65
66 to
70
71 to
75
76 o
r old
er
Nev
er
Don
’t k
now
5 Department of Work and Pensions, Older Workers Statistical Information Booklet, Dec 2013. (https://www.gov.uk/government/collections/older-workers-statistical-information-booklet).
Chart 5 – Expected retirement age
At what age do you expect to retire from all paid employment?
14 DC Member Survey
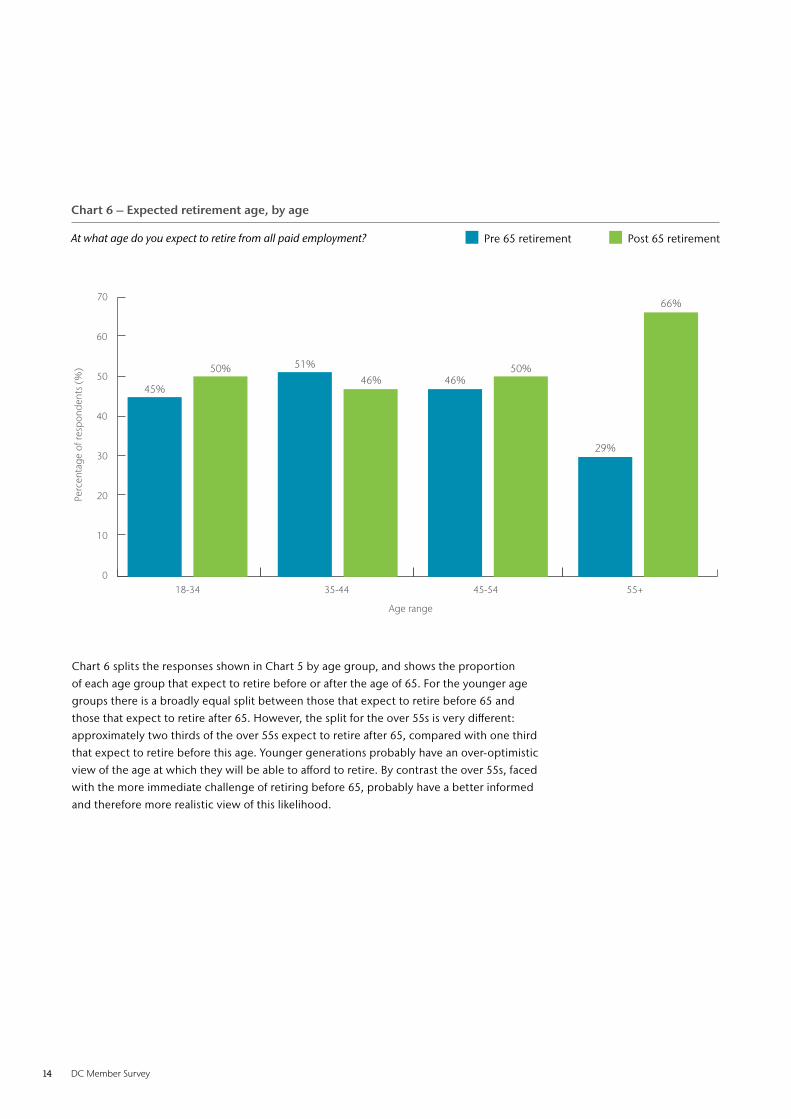
Chart 6 splits the responses shown in Chart 5 by age group, and shows the proportion
of each age group that expect to retire before or after the age of 65. For the younger age
groups there is a broadly equal split between those that expect to retire before 65 and
those that expect to retire after 65. However, the split for the over 55s is very different:
approximately two thirds of the over 55s expect to retire after 65, compared with one third
that expect to retire before this age. Younger generations probably have an over-optimistic
view of the age at which they will be able to afford to retire. By contrast the over 55s, faced
with the more immediate challenge of retiring before 65, probably have a better informed
and therefore more realistic view of this likelihood.
0
10
20
30
50
70
Age range
Perc
enta
ge o
f res
pond
ents
(%
)
60
40
18-34 35-44 45-54 55+
45%
50% 51%
46% 46%50%
29%
66%
Chart 6 – Expected retirement age, by age
At what age do you expect to retire from all paid employment? Pre 65 retirement Post 65 retirement
Aon Hewitt 15
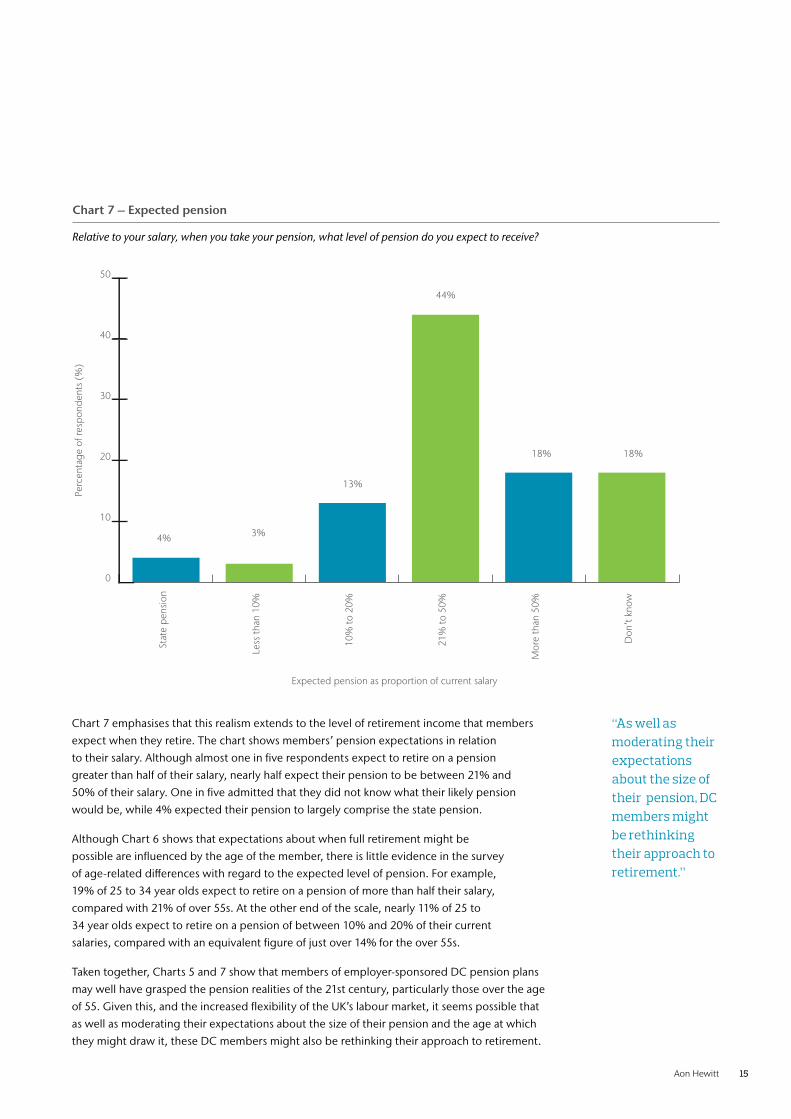
Chart 7 emphasises that this realism extends to the level of retirement income that members
expect when they retire. The chart shows members’ pension expectations in relation
to their salary. Although almost one in five respondents expect to retire on a pension
greater than half of their salary, nearly half expect their pension to be between 21% and
50% of their salary. One in five admitted that they did not know what their likely pension
would be, while 4% expected their pension to largely comprise the state pension.
Although Chart 6 shows that expectations about when full retirement might be
possible are influenced by the age of the member, there is little evidence in the survey
of age-related differences with regard to the expected level of pension. For example,
19% of 25 to 34 year olds expect to retire on a pension of more than half their salary,
compared with 21% of over 55s. At the other end of the scale, nearly 11% of 25 to
34 year olds expect to retire on a pension of between 10% and 20% of their current
salaries, compared with an equivalent figure of just over 14% for the over 55s.
Taken together, Charts 5 and 7 show that members of employer-sponsored DC pension plans
may well have grasped the pension realities of the 21st century, particularly those over the age
of 55. Given this, and the increased flexibility of the UK’s labour market, it seems possible that
as well as moderating their expectations about the size of their pension and the age at which
they might draw it, these DC members might also be rethinking their approach to retirement.
Chart 7 – Expected pension
Relative to your salary, when you take your pension, what level of pension do you expect to receive?
0
10
20
30
40
50
Perc
enta
ge o
f res
pond
ents
(%
)
Mor
e th
an 5
0%
21%
to 5
0%
10%
to 2
0%
Less
than
10%
Don
’t k
now
Expected pension as proportion of current salary
Stat
e pe
nsio
n
4% 3%
13%
44%
18% 18%
“As well as moderating their expectations about the size of their pension, DC members might be rethinking their approach to retirement.”
16 DC Member Survey
I have never really thought about this issue
I expect to have to continue to work indefinitely
I expect to wind down from work gradually by workingfewer hours, but at the same time accessing my pension
fund until I finally retire from all paid employment
I expect to work full time, and then to reduce my hours to work part-time until I finally retire from all paid employment
I expect to work full time until I retire fully from allpaid employment
7%
5%
7%
33%
48%
0 10 20 30 40 50
Percentage of respondents (%)
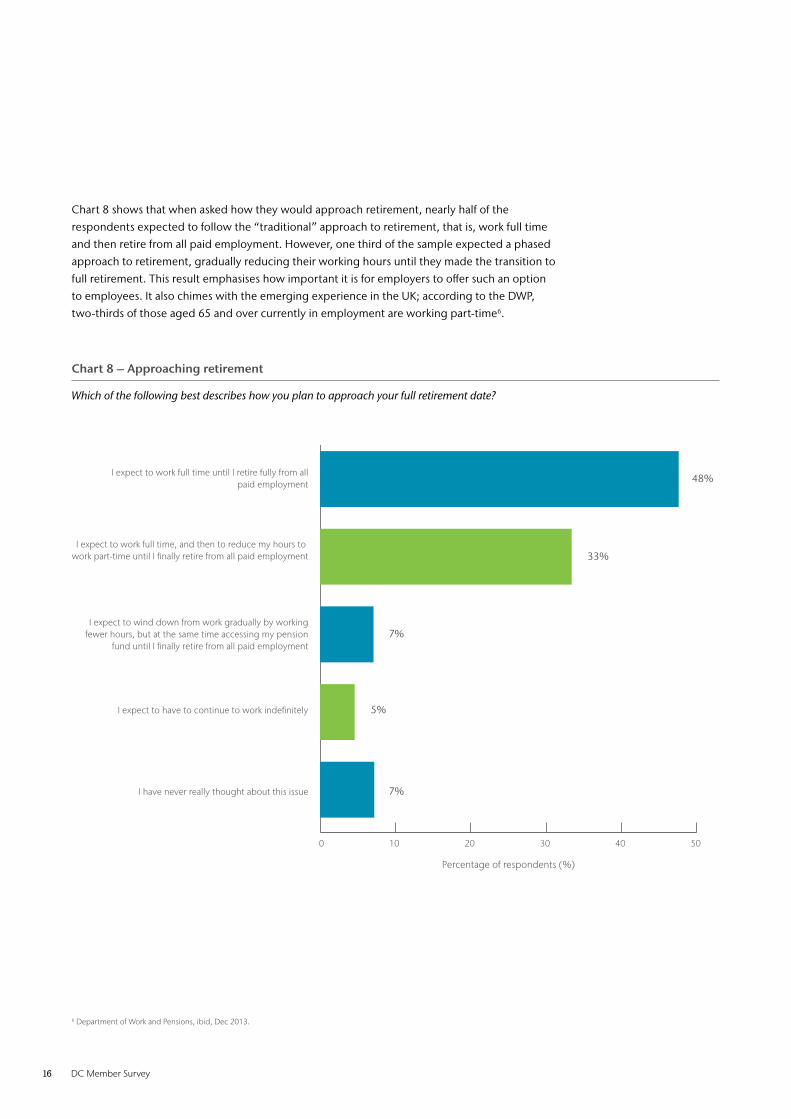
Chart 8 shows that when asked how they would approach retirement, nearly half of the
respondents expected to follow the “traditional” approach to retirement, that is, work full time
and then retire from all paid employment. However, one third of the sample expected a phased
approach to retirement, gradually reducing their working hours until they made the transition to
full retirement. This result emphasises how important it is for employers to offer such an option
to employees. It also chimes with the emerging experience in the UK; according to the DWP,
two-thirds of those aged 65 and over currently in employment are working part-time6.
Chart 8 – Approaching retirement
Which of the following best describes how you plan to approach your full retirement date?
6 Department of Work and Pensions, ibid, Dec 2013.
Aon Hewitt 17
The results in Chart 8 also indicate some willingness to supplement part-time income with a
pension income: 7% of respondents expect to supplement their income from reduced working
hours, by simultaneously accessing their pension savings. Facilitating this type of arrangement
can be problematic under current pension legislation, although we expect demand for it to
increase as the Budget flexibilities become better known and they start to change expectations
in the market place. And again, perhaps sadly, there is a small but non-trivial minority of
respondents for whom retirement is not on the cards, and who expect to work indefinitely.
Finally, it is clear that proximity focuses the mind on retirement. Among the respondents who
said that they had never thought about their approach to retirement, only 8% of those over the
age of 55 hadn’t given it any thought, compared to 43% of those between the ages of 25 and 34.
The realism about pension prospects is clearly a good thing. However, the clear intention for a
significant proportion of members to ‘glide’ into retirement, by gradually reducing their working
hours, may present significant challenges for employers. Dealing with this challenge will be
easier if employers are aware of the retirement intentions of their employees, and of course
these intentions may well be related to the adequacy, or inadequacy of pension provision.
Engaging with employees well before retirement plans are put into action, and reviewing
retirement provision, where auto-escalation may play a role, will help employers manage their
workforces more effectively and, simultaneously, help employees achieve their retirement goals.
“The clear intention for a significant proportion of members to ‘glide’ into retirement by gradually reducing their working hours, may present significant challenges for employers.”
18 DC Member Survey
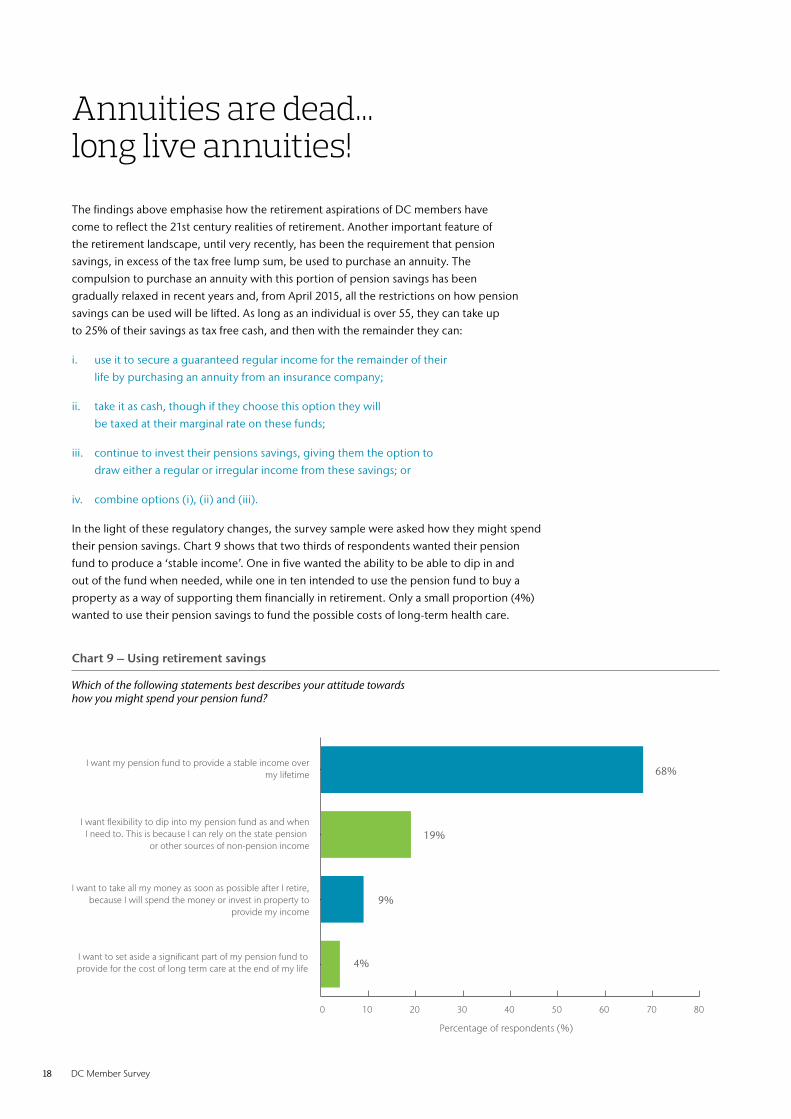
Chart 9 – Using retirement savings
Which of the following statements best describes your attitude towards how you might spend your pension fund?
The findings above emphasise how the retirement aspirations of DC members have
come to reflect the 21st century realities of retirement. Another important feature of
the retirement landscape, until very recently, has been the requirement that pension
savings, in excess of the tax free lump sum, be used to purchase an annuity. The
compulsion to purchase an annuity with this portion of pension savings has been
gradually relaxed in recent years and, from April 2015, all the restrictions on how pension
savings can be used will be lifted. As long as an individual is over 55, they can take up
to 25% of their savings as tax free cash, and then with the remainder they can:
i. use it to secure a guaranteed regular income for the remainder of their
life by purchasing an annuity from an insurance company;
ii. take it as cash, though if they choose this option they will
be taxed at their marginal rate on these funds;
iii. continue to invest their pensions savings, giving them the option to
draw either a regular or irregular income from these savings; or
iv. combine options (i), (ii) and (iii).
In the light of these regulatory changes, the survey sample were asked how they might spend
their pension savings. Chart 9 shows that two thirds of respondents wanted their pension
fund to produce a ‘stable income’. One in five wanted the ability to be able to dip in and
out of the fund when needed, while one in ten intended to use the pension fund to buy a
property as a way of supporting them financially in retirement. Only a small proportion (4%)
wanted to use their pension savings to fund the possible costs of long-term health care.
Annuities are dead... long live annuities!
I want to set aside a significant part of my pension fund toprovide for the cost of long term care at the end of my life
I want to take all my money as soon as possible after I retire,because I will spend the money or invest in property to
provide my income
I want flexibility to dip into my pension fund as and whenI need to. This is because I can rely on the state pension
or other sources of non-pension income
I want my pension fund to provide a stable income overmy lifetime 68%
19%
9%
4%
0 10 20 30 40 50 60 70 80
Percentage of respondents (%)
Aon Hewitt 19
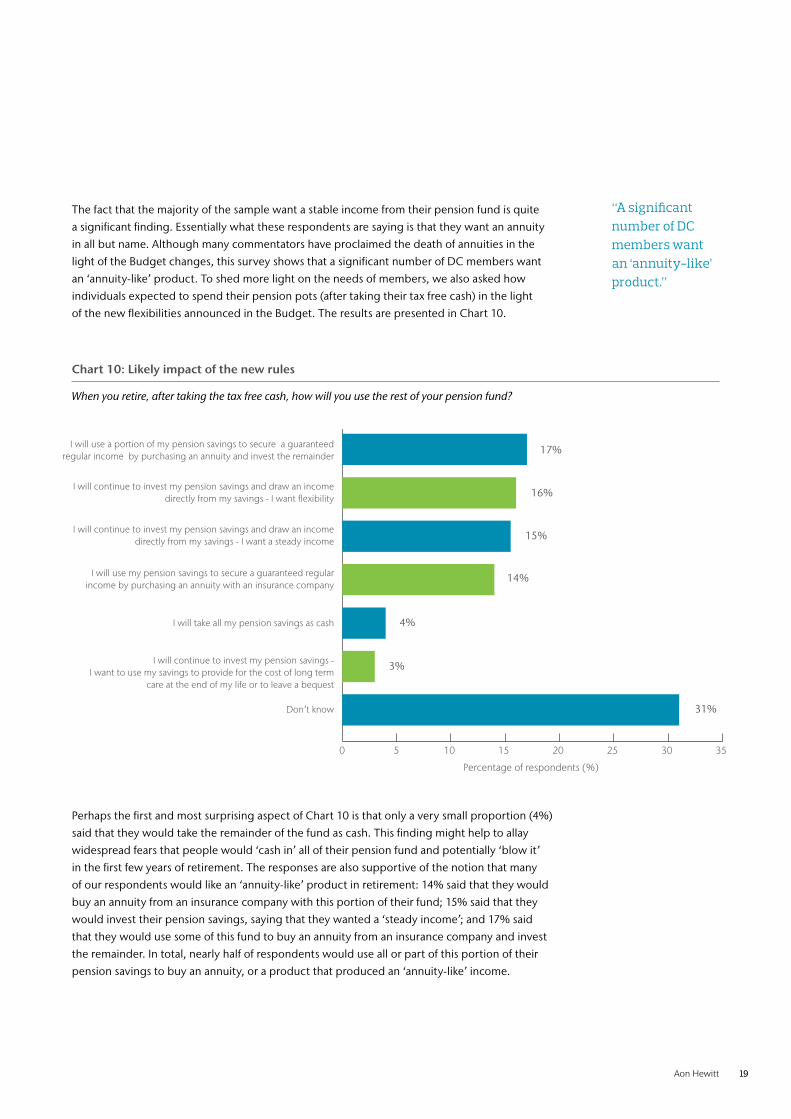
Chart 10: Likely impact of the new rules
When you retire, after taking the tax free cash, how will you use the rest of your pension fund?
The fact that the majority of the sample want a stable income from their pension fund is quite
a significant finding. Essentially what these respondents are saying is that they want an annuity
in all but name. Although many commentators have proclaimed the death of annuities in the
light of the Budget changes, this survey shows that a significant number of DC members want
an ‘annuity-like’ product. To shed more light on the needs of members, we also asked how
individuals expected to spend their pension pots (after taking their tax free cash) in the light
of the new flexibilities announced in the Budget. The results are presented in Chart 10.
Perhaps the first and most surprising aspect of Chart 10 is that only a very small proportion (4%)
said that they would take the remainder of the fund as cash. This finding might help to allay
widespread fears that people would ‘cash in’ all of their pension fund and potentially ‘blow it’
in the first few years of retirement. The responses are also supportive of the notion that many
of our respondents would like an ‘annuity-like’ product in retirement: 14% said that they would
buy an annuity from an insurance company with this portion of their fund; 15% said that they
would invest their pension savings, saying that they wanted a ‘steady income’; and 17% said
that they would use some of this fund to buy an annuity from an insurance company and invest
the remainder. In total, nearly half of respondents would use all or part of this portion of their
pension savings to buy an annuity, or a product that produced an ‘annuity-like’ income.
I will use a portion of my pension savings to secure a guaranteedregular income by purchasing an annuity and invest the remainder
I will continue to invest my pension savings and draw an incomedirectly from my savings - I want flexibility
I will continue to invest my pension savings and draw an incomedirectly from my savings - I want a steady income
I will use my pension savings to secure a guaranteed regularincome by purchasing an annuity with an insurance company
I will take all my pension savings as cash
I will continue to invest my pension savings -I want to use my savings to provide for the cost of long term
care at the end of my life or to leave a bequest
Don’t know
0 5 10 15 20 25 30 35
Percentage of respondents (%)
3%
4%
14%
15%
16%
17%
31%
“A significant number of DC members want an ‘annuity-like’ product.”
20 DC Member Survey
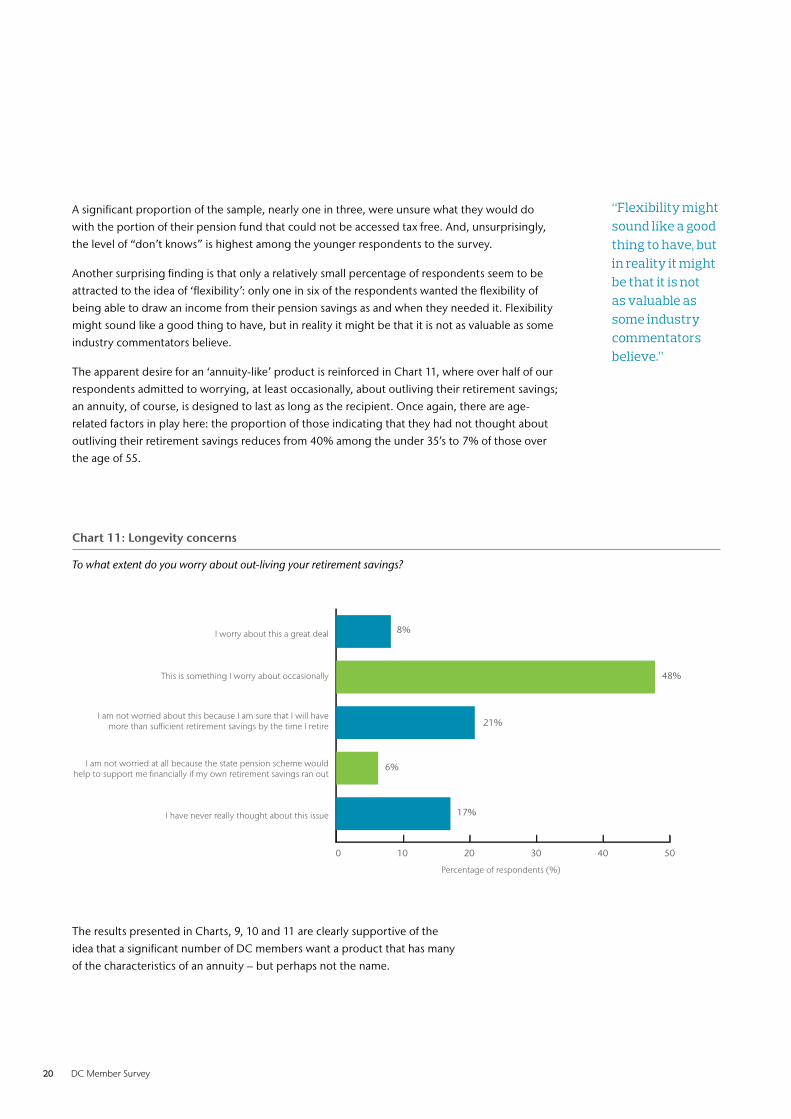
Chart 11: Longevity concerns
To what extent do you worry about out-living your retirement savings?
A significant proportion of the sample, nearly one in three, were unsure what they would do
with the portion of their pension fund that could not be accessed tax free. And, unsurprisingly,
the level of “don’t knows” is highest among the younger respondents to the survey.
Another surprising finding is that only a relatively small percentage of respondents seem to be
attracted to the idea of ‘flexibility’: only one in six of the respondents wanted the flexibility of
being able to draw an income from their pension savings as and when they needed it. Flexibility
might sound like a good thing to have, but in reality it might be that it is not as valuable as some
industry commentators believe.
The apparent desire for an ‘annuity-like’ product is reinforced in Chart 11, where over half of our
respondents admitted to worrying, at least occasionally, about outliving their retirement savings;
an annuity, of course, is designed to last as long as the recipient. Once again, there are age-
related factors in play here: the proportion of those indicating that they had not thought about
outliving their retirement savings reduces from 40% among the under 35’s to 7% of those over
the age of 55.
The results presented in Charts, 9, 10 and 11 are clearly supportive of the
idea that a significant number of DC members want a product that has many
of the characteristics of an annuity – but perhaps not the name.
0 10 20 30 40 50
I worry about this a great deal
This is something I worry about occasionally
I am not worried about this because I am sure that I will havemore than sucient retirement savings by the time I retire
I am not worried at all because the state pension scheme would help to support me financially if my own retirement savings ran out
I have never really thought about this issue
8%
48%
21%
6%
17%
Percentage of respondents (%)
“Flexibility might sound like a good thing to have, but in reality it might be that it is not as valuable as some industry commentators believe.”
Aon Hewitt 21
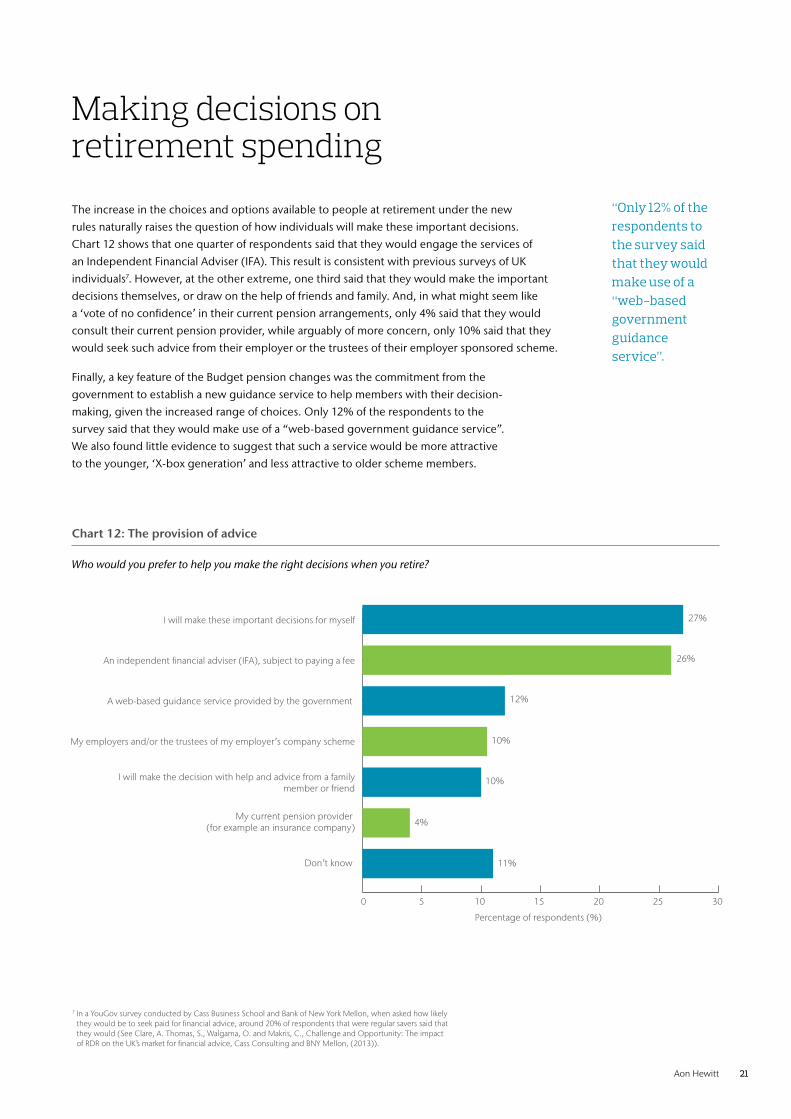
The increase in the choices and options available to people at retirement under the new
rules naturally raises the question of how individuals will make these important decisions.
Chart 12 shows that one quarter of respondents said that they would engage the services of
an Independent Financial Adviser (IFA). This result is consistent with previous surveys of UK
individuals7. However, at the other extreme, one third said that they would make the important
decisions themselves, or draw on the help of friends and family. And, in what might seem like
a ‘vote of no confidence’ in their current pension arrangements, only 4% said that they would
consult their current pension provider, while arguably of more concern, only 10% said that they
would seek such advice from their employer or the trustees of their employer sponsored scheme.
Finally, a key feature of the Budget pension changes was the commitment from the
government to establish a new guidance service to help members with their decision-
making, given the increased range of choices. Only 12% of the respondents to the
survey said that they would make use of a “web-based government guidance service”.
We also found little evidence to suggest that such a service would be more attractive
to the younger, ‘X-box generation’ and less attractive to older scheme members.
Making decisions on retirement spending
0 5 10 15 20 25 30
Percentage of respondents (%)
I will make these important decisions for myself
An independent financial adviser (IFA), subject to paying a fee
A web-based guidance service provided by the government
My employers and/or the trustees of my employer’s company scheme
I will make the decision with help and advice from a familymember or friend
My current pension provider (for example an insurance company)
Don’t know
27%
26%
12%
10%
10%
4%
11%
Chart 12: The provision of advice
Who would you prefer to help you make the right decisions when you retire?
“Only 12% of the respondents to the survey said that they would make use of a “web-based government guidance service”.
7 In a YouGov survey conducted by Cass Business School and Bank of New York Mellon, when asked how likely they would be to seek paid for financial advice, around 20% of respondents that were regular savers said that they would (See Clare, A. Thomas, S., Walgama, O. and Makris, C., Challenge and Opportunity: The impact of RDR on the UK’s market for financial advice, Cass Consulting and BNY Mellon, (2013)).
22 DC Member Survey
The results in Chart 12 give rise to two concerns. First, the fact that one third of the sample
intend to make these important decisions on their own, or with the help of friends and family.
The very high proportion of DC members that invest in the default investment option probably
indicates that members do not engage much with the investment process prior to retirement.
It is not obvious that disengagement in the accumulation phase can be switched easily to
engagement in the decumulation phase, particularly when this phase now offers far more choice.
It is clear that members will need a significant degree of support, information, help
and guidance as they approach retirement. In many senses, we have been fortunate
to date – for the accumulation phase of pensions savings, we can put in place suitable
defaults that address the needs of the majority of DC members. However, decumulation
pension saving is very much an individual decision. Employers will need to engage
with individuals to help them make suitable choices against a complex backdrop.
Second, although the Retail Distribution Review (RDR) and other changes to the market for
financial advice may well have led to an increase in the quality of advice from the industry
(which was the then-FSA’s original intention with RDR), the stricter regulatory RDR environment
has led to a rapid (and continuing) decline in IFA numbers across the country and, of those
remaining, that nearly 60% will offer a ‘restricted service’, that is, they will only advise on a
limited number of providers’ products, rather than on the full range of product possibilities8.
Furthermore, RDR has accelerated changes to IFA business models such that, to make a client
economically viable, the clients of fee charging IFAs would need to have around £150,000 of
investable assets8. Many DC members will not meet these requirements. Taken together, it
is not obvious then that the IFA community will have the capacity to deal with the demand
from DC members for full and independent financial advice at the point of retirement.
In our view, Chart 12 points to an important role for employers and scheme trustees.
Employers should consider providing tools for members to aid them in their
pension choices, while trustees should consider how they might be able to provide
guidance and support for their members at this important time in their lives.
8 See Clare, et al, ibid, (2013).
“It is not obvious that the IFA community will have the capacity to deal with the demand from DC members for full and independent financial advice at the point of retirement.”
Aon Hewitt 23
The new pension rules allow individuals to invest all or a portion of their pension savings in
some form of investment and to draw either a regular or irregular income from these savings. In
addition, there is a greater opportunity for individuals to pass on any remaining pension funds
on their death. For example, pension funds can be passed to beneficiaries tax free, where the
member dies before age 75. This new flexibility means that people can retain greater control of
their pension pot. But there are clearly potential drawbacks. If individuals draw down too much,
or if investment markets perform poorly, or if an individual lives longer than they were expecting
perhaps incurring significant healthcare costs at the same time, or in a worst case scenario if all of
these things happen, then any retirement income could diminish to levels that no longer support
the individual, or run out completely. Managing these investments efficiently and effectively will
clearly be crucial if people are going to maximise their chances of having a happy and well-
funded, retired life. Other developed economies where drawdown is the default way of dealing
with retirement, such as the USA and Australia, have developed tools and techniques to address
this issue, and we expect a number of these to be made available in the UK in due course.
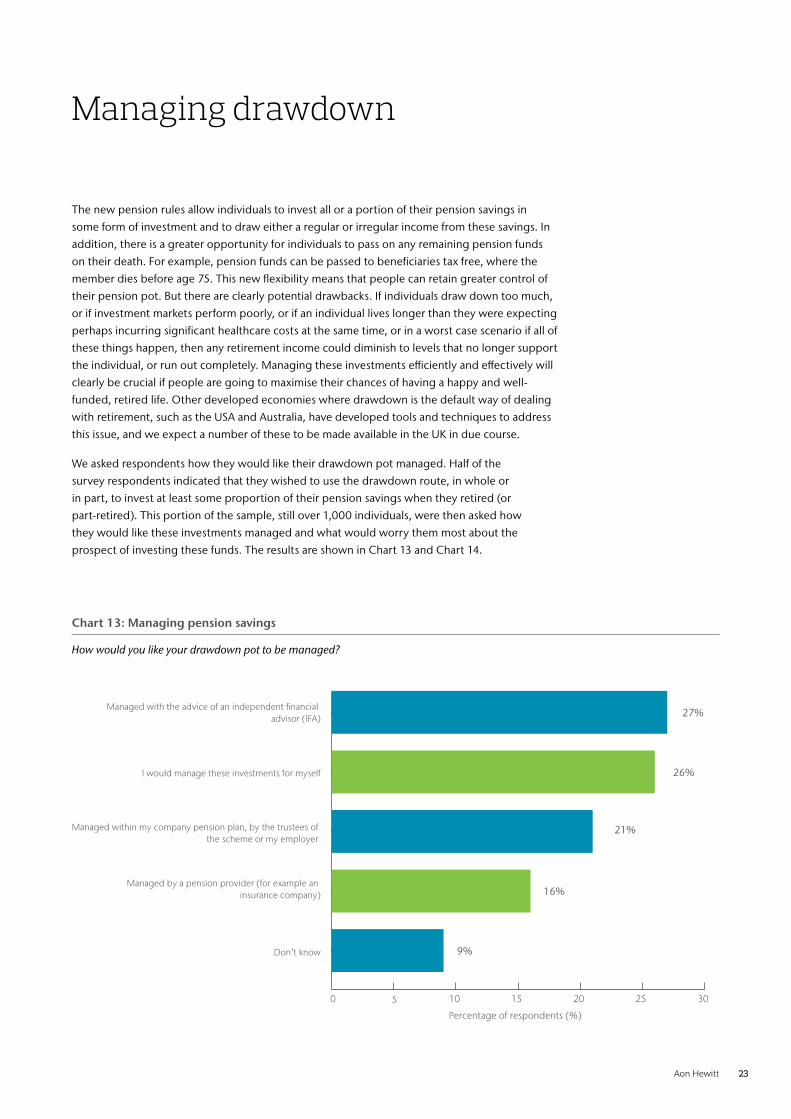
We asked respondents how they would like their drawdown pot managed. Half of the
survey respondents indicated that they wished to use the drawdown route, in whole or
in part, to invest at least some proportion of their pension savings when they retired (or
part-retired). This portion of the sample, still over 1,000 individuals, were then asked how
they would like these investments managed and what would worry them most about the
prospect of investing these funds. The results are shown in Chart 13 and Chart 14.
Managing drawdown
Don’t know
I would manage these investments for myself
Managed with the advice of an independent financial advisor (IFA)
Managed by a pension provider (for example an insurance company)
Managed within my company pension plan, by the trustees of the scheme or my employer
0 5 10 15 20 25 30
Percentage of respondents (%)
16%
21%
26%
27%
9%
Chart 13: Managing pension savings
How would you like your drawdown pot to be managed?
24 DC Member Survey
One in five of this sub-sample of DC members indicated that they would like to see their
pension investment fund managed within their existing scheme, while around one in six
would like to have this fund managed by a pension provider such as an insurance company.
However, one quarter of this sub-sample would be willing to have the investments managed
under the advice of an IFA, a result that again emphasises that DC members believe that
the IFA community will be able to meet their demand. A similar proportion, just over
one quarter of respondents, said that they would manage these investments themselves,
while a small proportion did not know how they would want these funds invested.
One consequence of managing their DC pots outside of the company pension plan,
either with or without the advice of an IFA, could be higher investment management
fees. That is, by ‘going it alone’ DC members may not be able to benefit from the
economies of scale that should come from leaving their investment pots with their
existing schemes. Trustees and employers will need to steer members towards sensibly-
priced products and guidance to support members at retirement and beyond.
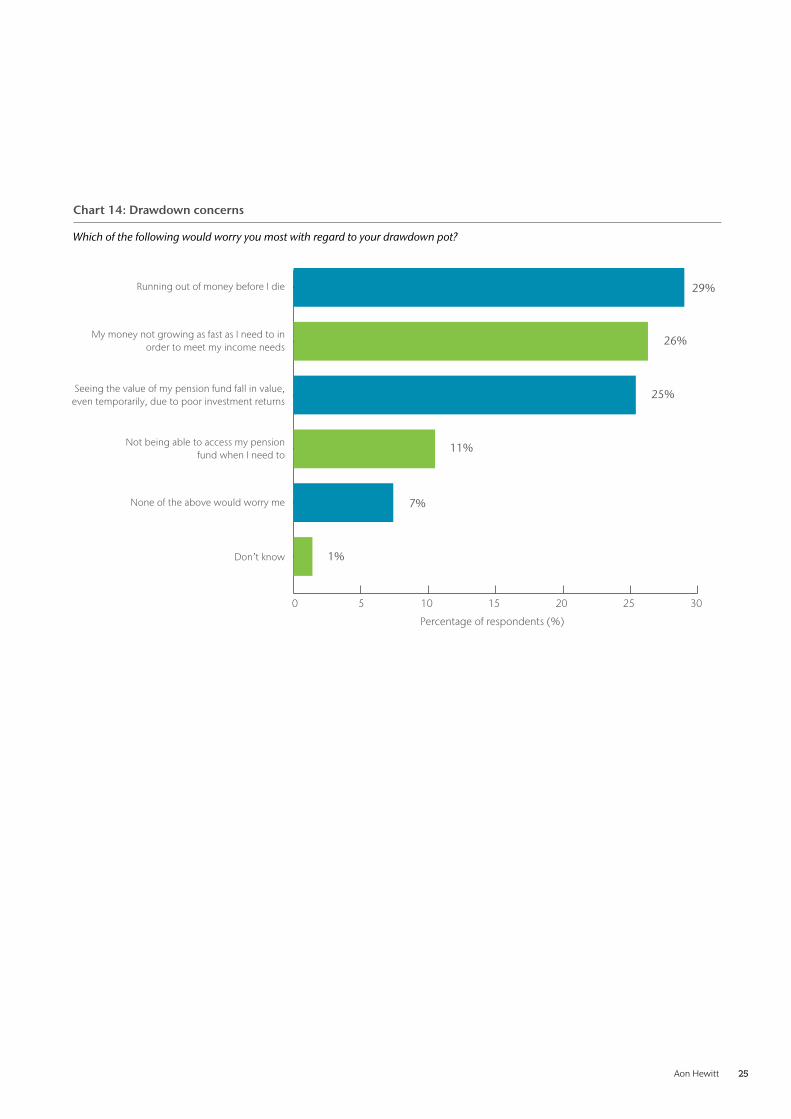
Finally, Chart 14 provides more support for the need for an annuity-like product. The chart
shows the main concerns of DC members that choose not to put all of their pension pot into
an annuity. Nearly one third would worry most about running out of money before they died.
An annuity, of course, could obviate this concern. Unsurprisingly over half would be most
concerned about the performance of these investments. Again, the certainty of an annuity, or
an ‘annuity-like’ investment product would help to overcome these concerns. Arguably then,
four-fifths of this sub-sample of DC members would benefit to some degree from having an
‘annuity-like’ product. Indeed, one of the traditional perceived downsides of an annuity, that is,
their inflexibility, would appear to be an issue for only a small proportion of the respondents:
only 11% said that they were concerned about access to their retirement investment funds.
When looking at these results by household income, lower income households were
most concerned about maintaining the value of their fund and accessing it when they
need to. For higher income households, achieving investment performance was key.
“By ‘going it alone’ DC members may not be able to benefit from the economies of scale. Trustees and employers will need to steer members towards sensibly-priced products and guidance.”
Aon Hewitt 25
Running out of money before I die
My money not growing as fast as I need to inorder to meet my income needs
Seeing the value of my pension fund fall in value,even temporarily, due to poor investment returns
Not being able to access my pensionfund when I need to
None of the above would worry me
Don’t know
0 5 10 15 20 25 30
Percentage of respondents (%)
1%
7%
11%
25%
26%
29%
Chart 14: Drawdown concerns
Which of the following would worry you most with regard to your drawdown pot?
26 DC Member Survey
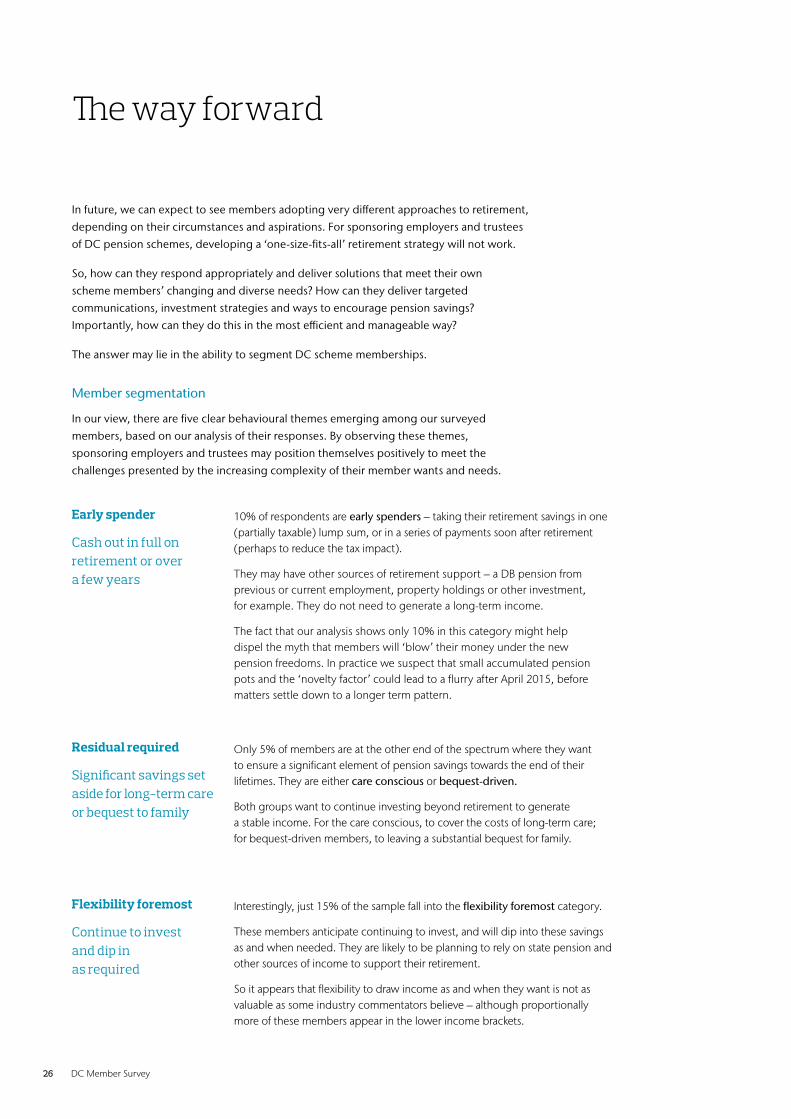
In future, we can expect to see members adopting very different approaches to retirement,
depending on their circumstances and aspirations. For sponsoring employers and trustees
of DC pension schemes, developing a ‘one-size-fits-all’ retirement strategy will not work.
So, how can they respond appropriately and deliver solutions that meet their own
scheme members’ changing and diverse needs? How can they deliver targeted
communications, investment strategies and ways to encourage pension savings?
Importantly, how can they do this in the most efficient and manageable way?
The answer may lie in the ability to segment DC scheme memberships.
Member segmentation
In our view, there are five clear behavioural themes emerging among our surveyed
members, based on our analysis of their responses. By observing these themes,
sponsoring employers and trustees may position themselves positively to meet the
challenges presented by the increasing complexity of their member wants and needs.
The way forward
Early spender
Cash out in full on retirement or over a few years
Residual required
Significant savings set aside for long-term care or bequest to family
Flexibility foremost
Continue to invest and dip in as required
10% of respondents are early spenders – taking their retirement savings in one (partially taxable) lump sum, or in a series of payments soon after retirement (perhaps to reduce the tax impact).
They may have other sources of retirement support – a DB pension from previous or current employment, property holdings or other investment, for example. They do not need to generate a long-term income.
The fact that our analysis shows only 10% in this category might help dispel the myth that members will ‘blow’ their money under the new pension freedoms. In practice we suspect that small accumulated pension pots and the ‘novelty factor’ could lead to a flurry after April 2015, before matters settle down to a longer term pattern.
Only 5% of members are at the other end of the spectrum where they want to ensure a significant element of pension savings towards the end of their lifetimes. They are either care conscious or bequest-driven.
Both groups want to continue investing beyond retirement to generate a stable income. For the care conscious, to cover the costs of long-term care; for bequest-driven members, to leaving a substantial bequest for family.
Interestingly, just 15% of the sample fall into the flexibility foremost category.
These members anticipate continuing to invest, and will dip into these savings as and when needed. They are likely to be planning to rely on state pension and other sources of income to support their retirement.
So it appears that flexibility to draw income as and when they want is not as valuable as some industry commentators believe – although proportionally more of these members appear in the lower income brackets.
Aon Hewitt 27
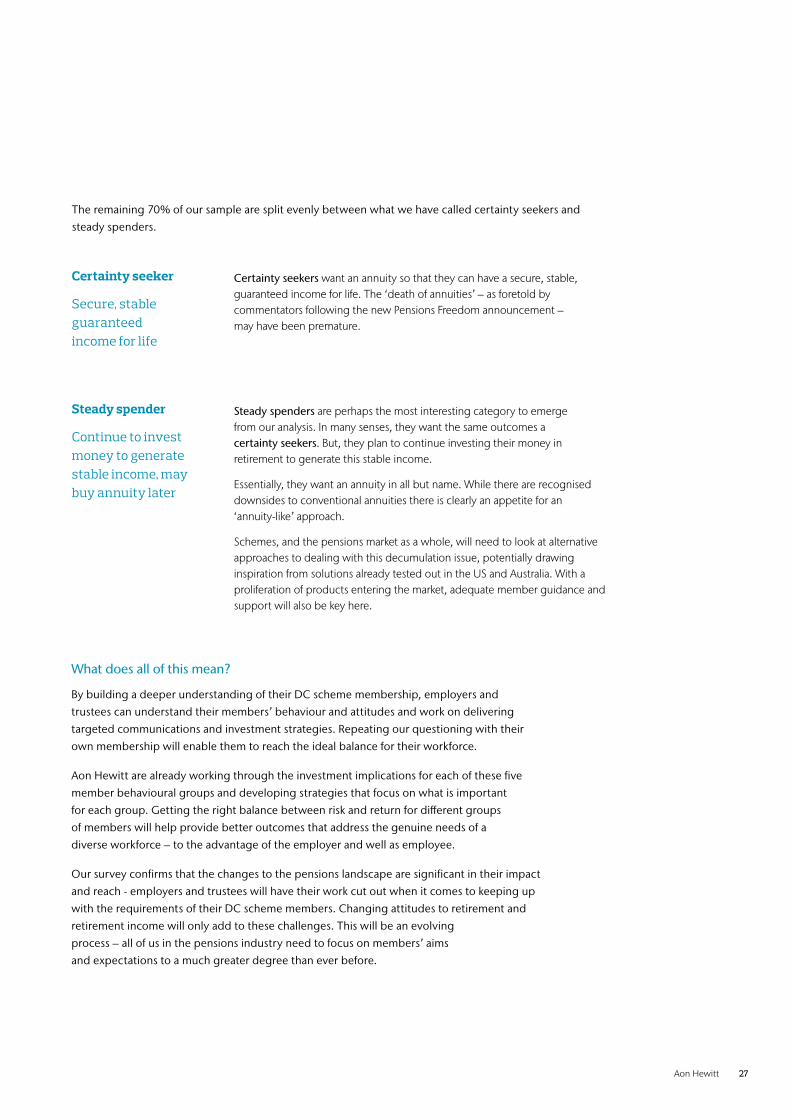
The remaining 70% of our sample are split evenly between what we have called certainty seekers and
steady spenders.
What does all of this mean?
By building a deeper understanding of their DC scheme membership, employers and
trustees can understand their members’ behaviour and attitudes and work on delivering
targeted communications and investment strategies. Repeating our questioning with their
own membership will enable them to reach the ideal balance for their workforce.
Aon Hewitt are already working through the investment implications for each of these five
member behavioural groups and developing strategies that focus on what is important
for each group. Getting the right balance between risk and return for different groups
of members will help provide better outcomes that address the genuine needs of a
diverse workforce – to the advantage of the employer and well as employee.
Our survey confirms that the changes to the pensions landscape are significant in their impact
and reach - employers and trustees will have their work cut out when it comes to keeping up
with the requirements of their DC scheme members. Changing attitudes to retirement and
retirement income will only add to these challenges. This will be an evolving
process – all of us in the pensions industry need to focus on members’ aims
and expectations to a much greater degree than ever before.
Certainty seeker
Secure, stable guaranteed income for life
Steady spender
Continue to invest money to generate stable income, may buy annuity later
Certainty seekers want an annuity so that they can have a secure, stable, guaranteed income for life. The ‘death of annuities’ – as foretold by commentators following the new Pensions Freedom announcement – may have been premature.
Steady spenders are perhaps the most interesting category to emerge from our analysis. In many senses, they want the same outcomes a certainty seekers. But, they plan to continue investing their money in retirement to generate this stable income.
Essentially, they want an annuity in all but name. While there are recognised downsides to conventional annuities there is clearly an appetite for an ‘annuity-like’ approach.
Schemes, and the pensions market as a whole, will need to look at alternative approaches to dealing with this decumulation issue, potentially drawing inspiration from solutions already tested out in the US and Australia. With a proliferation of products entering the market, adequate member guidance and support will also be key here.

28 DC Member Survey
Notes

Contacts
Sophia Singleton T: +44 (0)1372 733 [email protected]
Debbie Falvey T: +44 (0)117 900 [email protected]
Joanna SharplesT: +44 (0)1252 76 [email protected]
Kevin Wesbroom T: +44 (0)20 7086 9350 [email protected]
Andrew Clare T: +44 (0)20 7040 5244 [email protected]
About Aon Hewitt
Aon Hewitt empowers organisations and individuals to
secure a better future through innovative talent, retirement
and health solutions. We advise, design and execute a wide
range of solutions that enable clients to cultivate talent to
drive organisational and personal performance and growth,
navigate risk while providing new levels of financial security,
and redefine health solutions for greater choice, affordability
and wellness. Aon Hewitt is a global leader in human resource
solutions, with over 30,000 professionals in 90 countries
serving more than 20,000 clients worldwide. For more
information on Aon Hewitt, please visit: aonhewitt.com
Follow Aon on Twitter: twitter.com/Aon_plc
Sign up for News Alerts:
http://aon.mediaroom.com/index.php?s=58
Risk. Reinsurance. Human Resources.
About Aon Aon plc (NYSE:AON) is the leading global provider
of risk management, insurance and reinsurance
brokerage, and human resources solutions and
outsourcing services. Through its more than
66,000 colleagues worldwide, Aon unites to
empower results for clients in over 120 countries via
innovative and effective risk and people solutions
and through industry-leading global resources
and technical expertise. Aon has been named
repeatedly as the world’s best broker, best insurance
intermediary, best reinsurance intermediary, best
captives manager, and best employee benefits
consulting firm by multiple industry sources. Visit
aon.com for more information on Aon and aon.
com/manchesterunited to learn about Aon’s global
partnership with Manchester United.
Aon Hewitt Limited
8 Devonshire Square
London EC2M 4PL
aonhewitt.co.uk/dcpensions
© Aon plc 2014. All rights reserved.The information contained herein and the statements expressed
are of a general nature and are not intended to address the
circumstances of any particular individual or entity. Although we
endeavor to provide accurate and timely information and use
sources we consider reliable, there can be no guarantee that
such information is accurate as of the date it is received or that it
will continue to be accurate in the future. No one should act on
such information without appropriate professional advice after a
thorough examination of the particular situation.
Aon Hewitt Limited is authorised and regulated by the
Financial Conduct Authority. Registered in England & Wales.
Registered No: 4396810.