Embed Size (px)
Citation preview
WU
PP
ER
TA
L S
PE
ZIA
L 2
7e
Calculating MIPSResource productivity of products and services
Michael RitthofHolger RohnChrista Liedtkein cooperation with Thomas Merten

Wuppertal Spezial 27e
Calculating MIPS
Resource productivity of products and services
Michael RitthoffHolger RohnChrista Liedtke
in cooperation with Thomas Merten
Wuppertal Institute for Climate, Environment and Energyat the Science Centre North Rhine-Westphalia
© Wuppertal Institut for Climate, Environment and Energy
at the Science Centre North Rhine-Westphalia, 2002
Layout: Visualisation Lab Wuppertal Institute
ISBN 3-929944-56-1e
How to read this book:
1. Important maxims, references and explanatory examples are especially
emphasised to the right and to the left and/or summarised there
2. Where indicated, praxis examples have been added to illustrate calculations.
3. Keywords are in italics. Explanations are found in the glossary.
funded by:
All information has been identified to the best of our knowledge. However, we
cannot accept any responsibility for the correctness of the information given.
Translation by Susan Mattern, Monika Kieslich and Jackie Sairawan (Foreword)
Contents
Foreword 5
Word of thanks 7
Introduction 8
The MIPS concept 9
MIPS in short 9
The difference between MIPS, MIT and MI 12
System boundaries and cut-off criteria 12
MI-categories 13
MI-factors 14
MIPS Calculation in seven steps 16
STEP 1: Definition of the aims, objects and
the Service unit 18
STEP 2: Representation of the process chain 21
STEP 3: Compiling of data 22
STEP 4: Calculation of the Material Input
“From the cradle to the product” 28
STEP 5: Calculation of the Material Input
“From the cradle to the grave” 30
STEP 6: From Material Input to MIPS 32
STEP 7: Interpretation of the results 33
Optimising Strategies 34
Glossary 36
Appendix 39
Tables 39
Calculation Examples 42
Worth Knowing 52


Foreword
Bill Gates once said that progress is going to come anyway – so we should make
the most of it. We don’t know the future of course. But we do shape it. Every day.
Companies prepared to take a risk play a leading role here. In doing this they often
encounter the borders set by society, for example because people do not always
like new products and services. And also borders which the state establishes, thus
influencing the driving forces of the market economy – striving for profits and
competition – either inspiring them or crippling them, either giving them the
freedom to do mostly as they please or seeking to protect the weak.
And since the early 70s we know that there are also borders to consuming
natu ral resources when shaping progress. It’s true that we can influence people’s
tastes, habits and income, but we have however not succeeded in pushing the bor-
ders of nature to where we would like to have them.
Each one of us changes the environment every day, consciously or uncon-
sciously, regardless of whether we are rich or poor. We do not intend to disturb
nature. We behave so because within the context of our economy it’s worth
behaving so. And this is not because the market economy as such leads us astray,
but because the outmoded framework conditions of our economy lead to false
price signals and tolerate massive subsidies, which reward the consumption of
natural resources. Labour in Germany is much too expensive because it is being
“milked” as a source of revenue and because resources are, almost without excep-
tion, so cheap that full-cost-pricing is out of the question. And who likes to save
on things, which are cheap? The economy will become sustainable when it cre-
ates use for everyone within the framework of natural borders. To these borders
belongs in particular the most economical consumption possible of natural
resources. This is for two reasons. First of all, the waste and emissions of our econ-
omy are the reason for the climate acting abnormally even today, leading to nat-
ural disasters costing more than 150 billion Euros per year. The worldwide trend
is to take the risk every day of more costs for repairs and more dangers to people
caused by flooding, storms and the spreading of deserts. Secondly, we would need
more than two planet Earth’s for providing resources if the type of wealth enjoyed
by the western world would be available to all people on Earth. The global trend
today is to run into this trap with our eyes wide open.
What can we do? A good step would be to heed once again the wise old say-
ing that profits can be increased when the input of production factors is kept as
low as possible. This is also true for natural resources, even if the price of these
is far removed from full-cost-pricing. According to a new study from A.D. Little,
Germany could save 25% natural resources without any loss of quality, which
would mean savings of 5,000 Euros per household every year and 700,000 new
jobs for Germany. New taxes would then become unnecessary because the state
would have far more income than it today attempts to have with the help of taxes.
The economy should thus first of all be dematerialised for economic reasons.
However, such a development is not possible for management without a unit of
measurement. For this reason 10 years ago I invented MIPS – Material Input from
nature Per Service (or use) unit – as a measure for intelligent management. I hit
upon this idea at that time because I was worried about the stability of the
5

environment. And I also recognised – and this is true today more than ever – that
this stability can only be guaranteed if we dematerialise the western style of
wealth by at least a Factor 10. However, at today’s prices for work and material,
and considering today’s subsidies and standards, this is not profitable. For this
reason an undeterred group has been demanding for years that the economic
framework conditions be adapted as necessary. Otherwise sustainability can
definitely not be achieved. From the point of view of classical engineering, Factor
10 at first glance looks almost absurd. But it is not. And this is for two reasons.
First of all, it does not mean making existing goods and machines ten times
smaller while giving the same performance (although even this is sometimes
possible), but rather fulfilling the desired utilisation with new technical solutions.
This has been obvious to us for a long time for increasing labour productivity, and
the technical achievements in this area far exceed a Factor 10. Secondly, when mea-
suring the inputs of natural resources, all materials used to obtain original mate-
rials such as copper, must be considered from the first dig of the spade onwards.
I called this the ecological rucksack factor. With copper this weighs 500 kg/kg, with
aluminium 85 and with steel between 5 and 25 kg/kg. Every kilogram of copper
saved means that 500 kg of nature is left at its original setting. But this also means
that the selection of original materials when designing artefacts, taking each one’s
rucksack factors into consideration, can contribute much more to increasing
resource productivity than the saving of weight shows.
Japan has long since recognised the economic importance of MIPS, Factor 4
and Factor 10 as well as ecological rucksacks, and included these in 2001 in its eco-
nomic strategy. For this I received together with Ernst Ulrich von Weizsäcker in
2001 the “World Environment Award” of the Japanese Takeda Foundation. This
award was intentionally established as the “Nobel Prize for Environment”. In
Europe, too, and in the United Nations there is now some movement underway.
Enterprises in Germany should for the sake of their own future answer the
following question: who or which country will in the not so distant future be able
to successfully serve the world market in view of the fact that natural resources
are becoming scarcer and scarcer and that those we use will undoubtedly lead to
environmental changes with subsequent costs?
This manual was written by Christa Liedtke and her staff and is available in
German and English. In clear language, it leads those interested step by step
through the process of innovating new technical solutions using the MIPS concept.
The first step is the hardest. This also and especially applies to the attempt to
convince producers and consumers that it is possible, necessary and also
profitable for the benefit of mankind to shape progress within the natural guard-
rails – making the most of progress. Christa and her staff have genuinely earned
gratitude, recognition and further major success.
Professor Friedrich Schmidt-Bleek
Factor 10 Institute
Carnoules, Provence, October 2002
6
Word of thanks
This handbookwas made possible by the intensive co-operation of several enter-
prises (e.g. Kambium Möbelwerkstatt GmbH, Hess Natur Textilien GmbH,
Eurotec Pazen GmbH) and institutions (Ministry for the Environment, Agri-
culture and Consumer Protection of North Rhine-Westphalia, (MUNLV), the
Federal Ministry of Education and Research, BMBF, Factor 10 Innovation Net-
work, etc.) during the past 8 years. The first version of the publication was devel-
oped within the project, “Act for the world tomorrow- Resource management at
Hess-Natur, by Hess Natur Textilien GmbH: our particular thanks go to Mrs.
Katharina Paulitsch and Mr. Roland Sturm.
Our thanks also go to our colleagues from the Material Flows and Structural
Change Division and from the Working Group on Eco-efficiency and Sustain-
able Enterprises at the Wuppertal Institute, all of whom in recent years have
worked at and with the MIPS concept. They have all contributed in their many
ways to the creation of this publication. Particular thanks go to Hartmut Stiller
who accompanied the development of this manual during many discussions, and
to Stefan Bringezu for his very constructive corrections.
Last but not least, and not to be forgotten, are the diploma students, Ph.D.
students and student trainees who made calculations according to the MIPS
guidelines, and whose queries and problems contributed to a higher degree of
comprehensibility and application of this publication.
7
Introduction
This manual sets out to be an instruction guide for the implementation of analy-
ses according to the MIPS concept. MIPS stands for Material Input Per Service
unit, a measure developed at the Wuppertal Institute, which serves as an indica-
tor of precautionary environmental protection.
This publication is not however a comprehensive description of the methods
used, but should rather be seen as supplementing existing publications, in par-
ticular, the MAIA Handbook. Those interested in the theoretical basis of MIPS
will need to refer to additional, explanatory literature (see Literature)
This practical guide contains additional information, which cannot be part
of a methodological description, but which is indispensable for the practical
work, e.g. reference to possible problems, which the user may encounter whilst
implementing a MIPS analysis, and possible solutions according to the method.
Some of what is mentioned may seem to be dispensable or unnecessary. How-
ever, our experience shows that elements that are often taken for granted still need
to be recalled.
MIPS can be applied on several levels e.g. for products and services, enter-
prises, households, regions and national economies.
This manual is directed at enterprises and persons, who wish to carry out
MIPS or material analysis in relation to products or services. We hope that this
publication will contribute to more such calculations and instigate constructive
forms of optimisation, thus contributing towards the conservation of the envi-
ronment and natural resources.
This manual gives a general impression of what MIPS is, and how MIPS is
calculated.
Basic terms and ways of approach will be explained in the following sections,
with examples and additional advice.
Concurrently we will attempt to provide a certain amount of supplementary
information, e.g. conversion tables, which are often very useful.
8
The MIPS concept
MIPS in short
MIPS means Material Input Per Service unit. In order to estimate the input ori-
entated impact on the environment caused by the manufacture or services of a
product, MIPS indicates the quantity of resources (known as “material” in the
MIPS concept) used for this product or service. Once one has the reciprocal, a
statement can be made about resource productivity, i.e. it can be calculated how
much use can be obtained from a certain amount of “nature”.
Material extractions and emissions cause changes in natural material flows and
cycles. Previously stable cycle systems become unstable (see greenhouse effect).
This drastically and/or permanently alters conditions in the environment.
MIPS – as a targeted and practicable indicator - helps to show up the positive
as well as the financial potential of a resource-conserving entrepreneurship (use-
and service management, cost- and resource-efficiency). By using the MIPS con-
cept this sustainable entrepreneurship can be realised on the company level, as
well as outside of it branch wide, in all areas of business economy, on a regional,
national and global level. By interlocking the processes on all these levels, opti-
misation of all material inputs contributes to an increase in resource productiv-
ity life-cycle-wide or in terms of the overall economy.
MIPS calculates the use of resources from the point of their extraction from
nature: all data corresponds to the amount of moved tons in nature, thus to the
categories of biotic or renewable raw material, abiotic or non renewable raw
material, water, air and earth movement in agriculture and silviculture (incl. ero-
sion). All material consumption during manufacture, use and recycling or dis-
posal is calculated back to resource consumption. This is done by simple calcu-
lation factors for energy consumption or also for transport, which are expressed
in t/MWh or t/tkm. Complex system analyses are concealed there, which, for
example, indicate resource consumption per energy carrier and type of power
plant. This simplifies the projection and still remains targeted. MIPS thus
becomes practicable and comprehensible and harmonised.
By means of MIPS, enterprises can undertake up-to-date life-cycle-wide envi-
ronmental observations of their products and services. In addition, MIPS pro-
vides the distinct advantage that potentials for product- and process innovations
deduced from the analyses and calculations, can be kept and applied to current
and future markets. The crucial difference to those indicators that relate to out-
puts (emissions) is the active orientation towards sustainable products and ser-
vices, and not only the reduction of emissions caused by existing products and
product families.
9
MIPS = Material Input per Service unit = MI/S
Reciprocal of MIPS = resourceproductivity � S/MI
Indirectly MIPS says more
Sooner or later, all material input becomes an output: waste or emission. If every
input becomes an output anyway, then by measuring the input, one can arrive at
an estimation of the environmental impact potential. Most methods of evalu -
ating the ecological quality of a product investigate a variety of outputs (emis-
sions) whose relevance is known, or at least partially described. Compared to the
multitude of emitted substances (some hundred thousand to a million), the
number of substances, which have been thoroughly and comprehensively
researched to their effect, is, however, miniscule (a few hundred).
However, if we look at the inputs, then the outputs (quantitative) are auto-
matically included in the calculation. Through processes, inputs become outputs
– but, unfortunately, only very few of the outputs are usable or desired (only the
products). By measuring the inputs, we may not arrive at a (qualitative) impact
assessment, but at a valuable (quantitative) indicator of the potential for envi-
ronmental impact of a product or service. Thus MIPS is suitable as an indicator
of precautionary environmental protection, and fills a gap, which other ecolog-
ical estimation systems omit. MIPS is unspecific to particular materials and sub-
stance specific hazards, is precautionary and, through a reduction of material
flows, is directed at the known as well as the yet unknown, environmental prob-
lems.
Life-cycle-wide observations
The same applies to MIPS as to any other form of ecological assessment: in order
to be meaningful, it has to be carried out life-cycle-wide. All phases of a product
have to be examined here, i.e.:
• Production (including the extraction of raw materials, the manufacturing of
pre-products, transport and sales);
• Use (including all consumption, transport and repairs) and
• Recycling and/or disposal.
This extensive examination of the life cycle of a product is necessary, as it is not
always apparent what environmental impact has occurred during manufacture,
and what impact is connected with the use of a product. The products carry with
them an invisible “ecological rucksack”, i.e. according to the MIPS concept, their
environmental effects.
Through MIPS an attempt is made to demonstrate these aspects and in this
way to arrive at a comprehensive view of life-cycle-wide resource consumption.
MIPS calculates life-cycle-wide and worldwide, and in this way the “exported”
incursions in the environment are brought to light. The MIPS concept is based
on the opinion that the environmental impact potential of a product can be
assessed on the basis of the life-cycle-wide material input: The fewer raw
materials used, the less environmental impact ensues.
10
Usable indicators for determin-ing relevant potential of envi-ronmental impact must satisfythe following requirements:
3 They must be scientificallyfounded.
3 They must guaranteetransparent and repro-ducible estimates of poten-tial of environmentalimpact for all processes,goods and services, fromcradle to grave.
3 They must be easy to applyin practical use, as well asbeing time and cost effi-cient.
3 They must give targetedanswers.
3 They must practically andconceptionally, be relevantto the economy and toprofitability aspects.
3 They must be applicable onall levels: locally, regionallyand globally.
Objection:The life-cycle-wide investiga-tion is too expensive and tootime-consuming.
Answer:The effects and measures, aswell as the stimulus towardsproduct and process innova-tion strengthen the economy,and often surpass the invest-ment by far.
11
Below are some explanations illustrating life-cycle-wide examinations (to
the right, some examples):
3 Similar products are often produced quite differently and thus cause
quite different environmental impact. The individual life cycles are not
independent of each other. When optimising a system, one must be
aware that changes in one place can cause changes in other places. A
more efficient production is of no use if the life span of a product or
service is reduced or maintenance thereof is increased. The aim must
always be the best solution, overall. A producer/supplier also influences
the use of a product (Examples A, B, D, E).
3 The significance of individual life-cycle phases can vary from product
to product. There are products, which are material-intensive at the
production level; i.e. the most environmental exploitation occurs dur-
ing manufacture and there are products, which are material-intensive
during use (Example B).
3 From time to time, it is worth comparing solutions, where one variant
is use-intensive, and the other production-intensive (Example C).
3 The significance of the individual phases can change during the devel-
opment of a product, or can even be reversed. When working at
optimising only one phase of a life cycle, it may not be noticed that, in
the meantime, another phase has become more significant (Examples
B, E).
3 In many cases not all life-cycle phases take place in the same region.
This means that we are often only aware of the environmental prob-
lems that directly affect us. Processes and products are then often opti-
mised on the basis of (limited) subjective observations. Preceding
problems are often exported and then never registered or recorded
again, or if so, in a distorted fashion (Example D).
3 The most relevant areas are not always recognised (Example E).
Life-cycle-wide observations
A) Soda is sold both as syn-thetic soda (Solvay process) aswell as natural soda (sodalakes). Both types of soda havedifferent material intensities,but the same properties of use.
B) The greatest impact on theenvironment from cars stilloccurs during the use-phase.However, with reduced fueluse and increased complexityof the vehicles, the relationshipbetween manufacture and useis changing. Manufacturinggains in importance.
C) In order to achieve a pleas-ant room climate, one caneither heat or improve insula-tion. Insulation is production-intensive (high use ofresources during manufac-ture); heating is more use-intensive (higher consumptionduring use).
D) Shifting the manufacture ofmass goods or/ basic sub-stances and the allied environ-mental effects from industrialcountries to developing andemerging countries, e.g. manu-facture of metal and leathergoods.
E) It is a well-known fact thatthe laundering (and more andmore also drying in the tumble-dryer) of textiles causes highenvironmental impact. But theequally high or even higherresource consumption duringmanufacture, and all along theglobal production line, oftenremains unknown to the con-sumer.
Service unit
When comparing different variants of a solution, it is necessary to establish a
measure of comparison. According to the MIPS concept, this measure is called
a Service unit.By using a Service unit it is possible to make a comparison between
the material and “non-material” fulfilment of a service.
The difference between MIPS, MIT and MI
In some cases it is enough to calculate the MI values, instead of the MIPS values,
derived from a particular use. If one wishes, for example, to compare various
material alternatives, the Material Input (MI) for the manufacture of one ton ini-
tially gives adequate information. Material input in relation to weight unit is then
called Material Intensity (MIT). Material Intensities can also be calculated, for
example, for energy carriers, electricity or transport possibilities (see MI factors):
they are then not given in units [t/t] or [kg/kg], but, for example, in [kg/MWh]or [kg/tkm (tonkilometer)].
If these material intensities are then applied, for example, to the comparison
of two transmission pylons, one of wood and one of steel, they become MIPS val-
ues, derived from the material intensities through the relation to the Service unit
(in this case, “the holding of a power cable above the ground for a certain period
of time in a prescribed way”).
System boundaries and cut-off criteria
System boundaries
When carrying out an analysis according to the MIPS concept, all technically
caused movements of materials in the ecosphere are examined. All materials are
counted, which are removed by human beings from their natural deposits.
With this we draw a system boundary between the ecosphere – the natural
environment - and the technosphere, which encompasses all human activities.
The technosphere is entrenched in the ecosphere and exchanges materials with
it. On the one hand resources flow into the technosphere, upon which we build
our prosperity. We speak here of Input. On the other hand these resources are
then returned, sooner or later, back to nature in the same form or in the form of
overburden, waste, emissions, waste water (Output).
The system boundary between the ecosphere and the technosphere is – the-
oretically - the only one for comprehensive life-cycle analysis, as all movement
of materials from the ecosphere into the technosphere must be accounted for.
However, so-called cut-off criteria are necessary for the delimitation of the work.
12
The measure “Service unit”:
We need a measure like thiswhen, for instance, we userail-bound vehicles – theRegional Express, Intercity, orIntercity Express – in order tocover the distance between,for example, Cologne andWuppertal. “Passenger trans-port between Cologne andWuppertal“ is taken here asthe main Service unit. In thisway, the various means oftransport can be comparedwith each other. Even if the“use” can be regarded as verysimilar, when seen specificallyand especially subjectively, itcan be very different, e.g. oneonly has to think of the busi-ness-class compartmentswhich can be reserved in theICE 3. Regardless of the sub-jective differences in humanneeds, a comparison on thelevel of passenger kilometresis sufficiently abstract for mostuses. Consumers can integrateadditional factors into theirpersonal choices and prefer-ences, e.g. legroom, occupa-tion quota, etc.
MIPS = Material Input per Ser-vice unit
= MIS
MI = Material Input (sum of theused resources)
MIT = Material Intensity (Material Input in relation toe.g. a weight, energy or trans-port unit)
It is advisable to record theunits in order to be able toclearly differentiate betweenMI, MIT and MIPS.
Cut-off criteria
In the course of the MIPS analysis, all use of resources, caused by the investigated
product, or by its use should be examined. This examination is very extensive as
the pre-process-chains can be very long and branched. Therefore, it is necessary
not only to differentiate between the ecosphere and the technosphere, but also
between the examined product cycle and the rest of the technosphere. That
means, process chains, which are irrelevant to the ecological evaluation of the
investigated product (e.g. the ship and its production for the transport of wool
to Germany, as the ship is used so often that the material flows caused per trans-
port of goods are scarcely worth mentioning). Thus a second differentiation is
necessary: cut-off criteria. These are established under practical and method-
ological viewpoints. By establishing cut-off criteria, certain pre-process-chains
need not be considered: those processes, which have negligible influence on the
final result. It could be e.g. (the production technologies, the production buildings
or even the production of auxiliary and operating materials. Some material flows
within a system or process can be so small, for example, that they can be ignored.
From what point onwards this can be the case, is determined by the cut-off cri-
teria. Cut-off criteria should be well and carefully considered, and then roughly
estimated so that none of the essential resources remain unconsidered. It is
important to document system boundaries and cut-off criteria, and to draw uni-
form comparisons. (same depth of investigation).
MI categories
In the MIPS concept, the material inputs are divided into five different input cat-
egories. These five categories are:
3 abiotic raw materials
3 biotic raw materials
3 earth movements in agriculture and silviculture
(mechanical earth movement or erosion)
3 water and
3 air.
The division into these five categories came into being over a period of several
years of research and implementation of the MIPS concept and is practised fairly
uniformly. National and international statistics increasingly use these categories
for the accounting of material flows, so that the information systems fit together
on the macro- as well as the micro-levels.
By differentiating between the inputs in the stated categories, the classic sep-
aration of earth, water and air can be taken into account. Earth, as a resource, is
further divided into three single categories in the MIPS concept in order to attain
more meaningful results: abiotic raw materials, biotic raw materials and earth
movements.
13
An example of the complexity of systems:
For the manufacture of apullover, wool has to be trans-ported to Germany from Aus-tralia, for which a freighter isnecessary, which is made ofsteel, which was produced in asteelworks. These steelworkshave to be constructed, forwhich building materials areextracted from quarries ordredging lakes, which againnecessitates tools and equip-ment made from steel… (Hereit becomes apparent that anysystem can become complex.It is therefore crucial that onlythe relevant system elementsof a product or service areinvestigated. What is “rele-vant” depends, amongst otherthings, upon the specific material flows, but also uponthe aims/objectives -see ‘cut-off criteria’.)
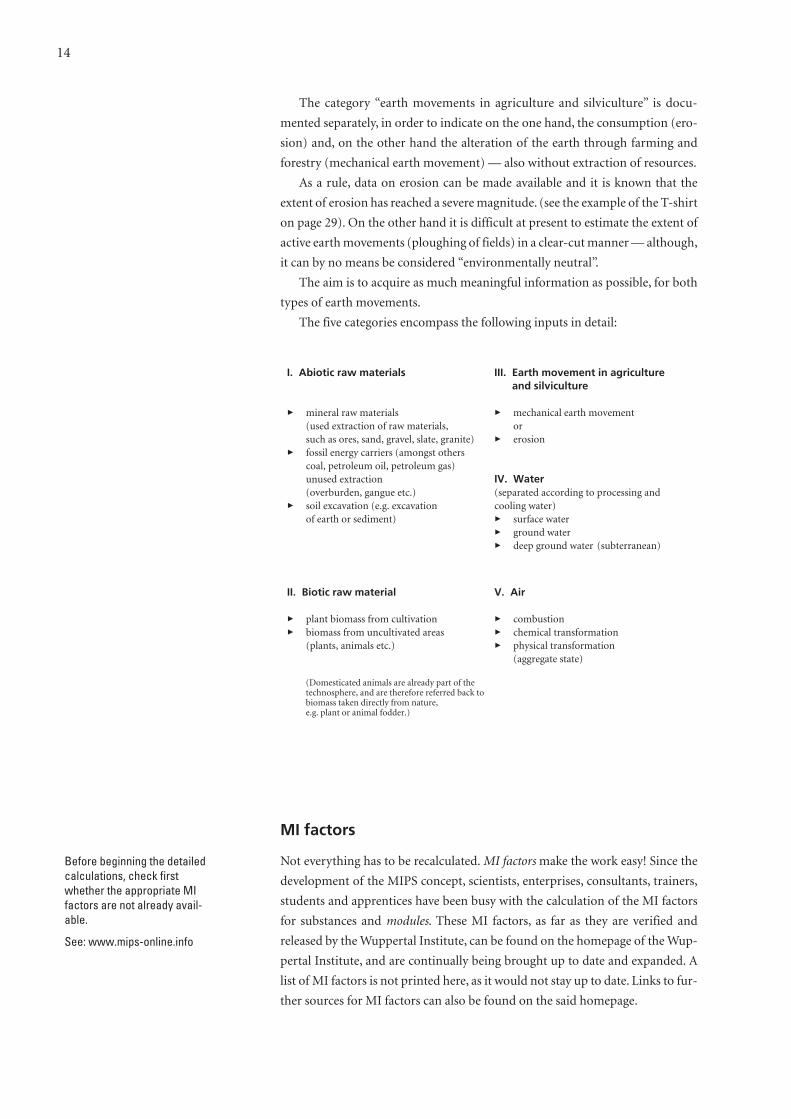
The category “earth movements in agriculture and silviculture” is docu-
mented separately, in order to indicate on the one hand, the consumption (ero-
sion) and, on the other hand the alteration of the earth through farming and
forestry (mechanical earth movement) — also without extraction of resources.
As a rule, data on erosion can be made available and it is known that the
extent of erosion has reached a severe magnitude. (see the example of the T-shirt
on page 29). On the other hand it is difficult at present to estimate the extent of
active earth movements (ploughing of fields) in a clear-cut manner — although,
it can by no means be considered “environmentally neutral”.
The aim is to acquire as much meaningful information as possible, for both
types of earth movements.
The five categories encompass the following inputs in detail:
MI factors
Not everything has to be recalculated. MI factorsmake the work easy! Since the
development of the MIPS concept, scientists, enterprises, consultants, trainers,
students and apprentices have been busy with the calculation of the MI factors
for substances and modules. These MI factors, as far as they are verified and
released by the Wuppertal Institute, can be found on the homepage of the Wup-
pertal Institute, and are continually being brought up to date and expanded. A
list of MI factors is not printed here, as it would not stay up to date. Links to fur-
ther sources for MI factors can also be found on the said homepage.
14
I. Abiotic raw materials III. Earth movement in agriculture and silviculture
3 mineral raw materials 3 mechanical earth movement(used extraction of raw materials, orsuch as ores, sand, gravel, slate, granite) 3 erosion
3 fossil energy carriers (amongst others coal, petroleum oil, petroleum gas)unused extraction IV. Water(overburden, gangue etc.) (separated according to processing and
3 soil excavation (e.g. excavation cooling water)of earth or sediment) 3 surface water
3 ground water3 deep ground water (subterranean)
II. Biotic raw material V. Air
3 plant biomass from cultivation 3 combustion3 biomass from uncultivated areas 3 chemical transformation
(plants, animals etc.) 3 physical transformation (aggregate state)
(Domesticated animals are already part of the technosphere, and are therefore referred back tobiomass taken directly from nature,e.g. plant or animal fodder.)
Before beginning the detailedcalculations, check firstwhether the appropriate MIfactors are not already avail-able.
See: www.mips-online.info
MI factors can always be applied for MIPS calculations wherever generally used
materials (e.g. steel, aluminium, cement, synthetic materials, glass, etc.) or so-
called modules are included (electricity, transport etc.). This has the great advan-
tage that not every pre-process-chain (e.g. pre-process -chain of steel) needs to
be recalculated by each user. The application of the MI factors is however lim-
ited, as the data is not valid for every situation. Thus, for instance, the module
“energy” contains the MI values for power generation, considering various
energy carriers and generation systems. If special process chains need to be taken
into account (power supply through supplier XY), then MI factors are generally
not available to the public in databases or publications. They have to be calcu-
lated separately.
The calculation of the MI factor is made in the same way as the following
described calculation of the Material input of products and services – only that
here, for example, the weight or volume unit of the material/substance, or the
calorific value of the energy carrier is used as the Service unit. MI factors can be
calculated for an unlimited number of substances and modules, and are prepared
in lists. In fact, every single MIPS analysis contains a multitude of such MI fac-
tors (MI factors of the various substances used can be calculated through process
orientated data gathering).
15
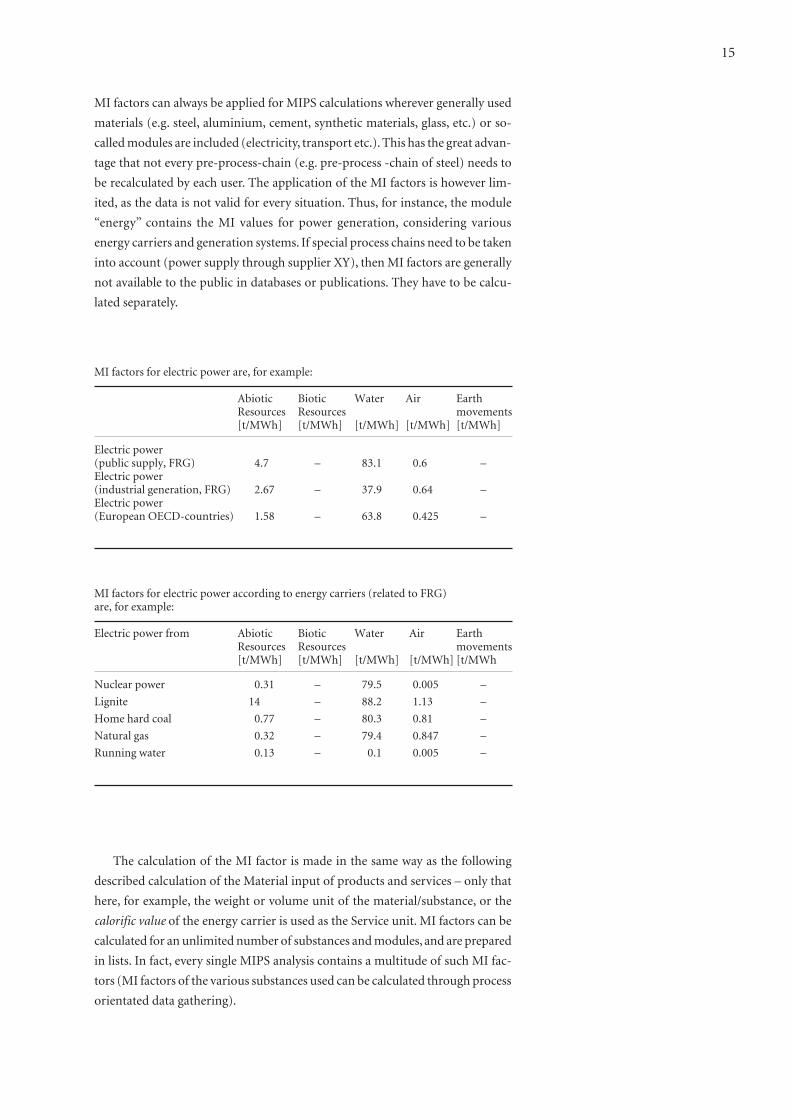
MI factors for electric power are, for example:
Abiotic Biotic Water Air EarthResources Resources movements [t/MWh] [t/MWh] [t/MWh] [t/MWh] [t/MWh]
Electric power (public supply, FRG) 4.7 – 83.1 0.6 –Electric power (industrial generation, FRG) 2.67 – 37.9 0.64 –Electric power (European OECD-countries) 1.58 – 63.8 0.425 –
MI factors for electric power according to energy carriers (related to FRG) are, for example:
Electric power from Abiotic Biotic Water Air EarthResources Resources movements[t/MWh] [t/MWh] [t/MWh] [t/MWh] [t/MWh
Nuclear power 0.31 – 79.5 0.005 –
Lignite 14 – 88.2 1.13 –
Home hard coal 0.77 – 80.3 0.81 –
Natural gas 0.32 – 79.4 0.847 –
Running water 0.13 – 0.1 0.005 –
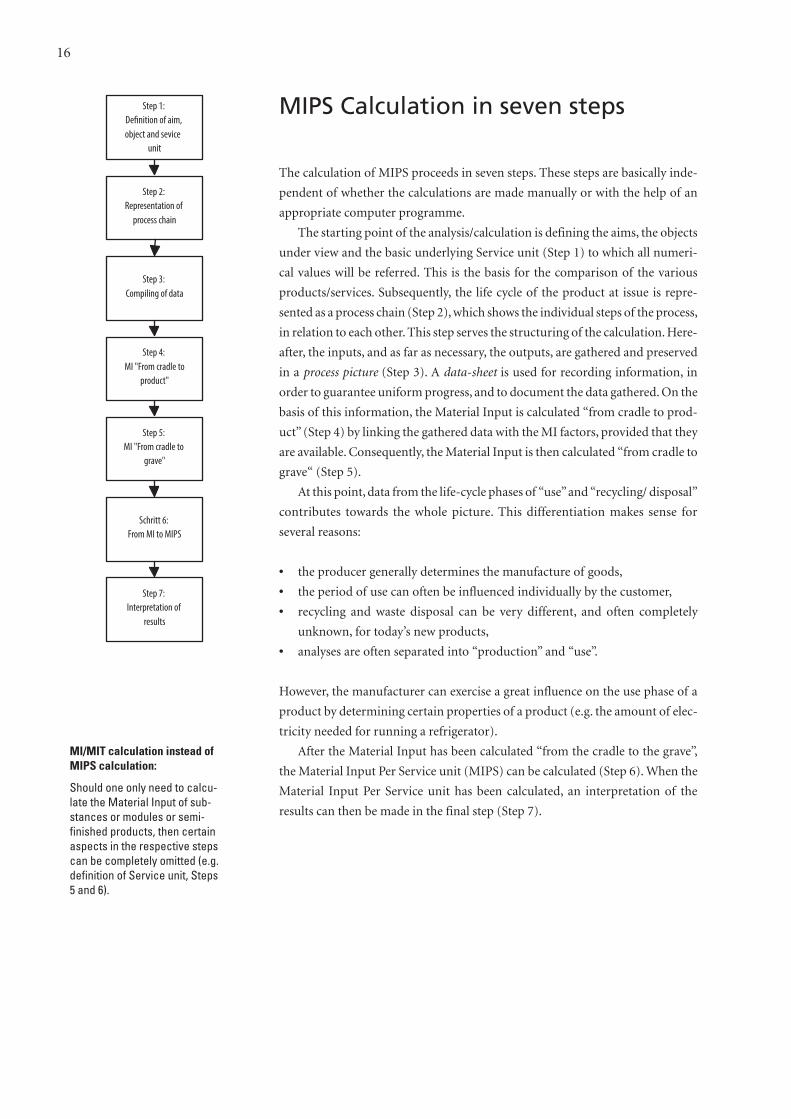
MIPS Calculation in seven steps
The calculation of MIPS proceeds in seven steps. These steps are basically inde-
pendent of whether the calculations are made manually or with the help of an
appropriate computer programme.
The starting point of the analysis/calculation is defining the aims, the objects
under view and the basic underlying Service unit (Step 1) to which all numeri-
cal values will be referred. This is the basis for the comparison of the various
products/services. Subsequently, the life cycle of the product at issue is repre-
sented as a process chain (Step 2), which shows the individual steps of the process,
in relation to each other. This step serves the structuring of the calculation. Here-
after, the inputs, and as far as necessary, the outputs, are gathered and preserved
in a process picture (Step 3). A data-sheet is used for recording information, in
order to guarantee uniform progress, and to document the data gathered. On the
basis of this information, the Material Input is calculated “from cradle to prod-
uct” (Step 4) by linking the gathered data with the MI factors, provided that they
are available. Consequently, the Material Input is then calculated “from cradle to
grave“ (Step 5).
At this point, data from the life-cycle phases of “use” and “recycling/ disposal”
contributes towards the whole picture. This differentiation makes sense for
several reasons:
• the producer generally determines the manufacture of goods,
• the period of use can often be influenced individually by the customer,
• recycling and waste disposal can be very different, and often completely
unknown, for today’s new products,
• analyses are often separated into “production” and “use”.
However, the manufacturer can exercise a great influence on the use phase of a
product by determining certain properties of a product (e.g. the amount of elec-
tricity needed for running a refrigerator).
After the Material Input has been calculated “from the cradle to the grave”,
the Material Input Per Service unit (MIPS) can be calculated (Step 6). When the
Material Input Per Service unit has been calculated, an interpretation of the
results can then be made in the final step (Step 7).
16
MI/MIT calculation instead ofMIPS calculation:
Should one only need to calcu-late the Material Input of sub-stances or modules or semi-finished products, then certainaspects in the respective stepscan be completely omitted (e.g.definition of Service unit, Steps5 and 6).
Step 1: De�nition of aim, object and sevice
unit
Step 2: Representation of
process chain
Step 3: Compiling of data
Step 4: MI "From cradle to
product"
Step 5: MI "From cradle to
grave"
Schritt 6: From MI to MIPS
Step 7: Interpretation of
results

17
Use of auditing software
Given sufficient time, the MIPS can be calculated by using only a sharp
pencil and a couple of sheets of paper. However, in the interest of the user,
a spreadsheet at least should be used. ECO-auditing programmes, i.e. pro-
grammes, which are especially designed for carrying out eco-auditing and
material-flow analyses, can be used partly for carrying out MIPS analyses.
Many of these programmes improve the overall picture of a project and
guarantee a consistent flow of data. They integrate a variety of helpful and
necessary functions into a programme. Therefore, they are often a prereq-
uisite for carrying out a time and cost-efficient analysis. In our experience,
the initial effort put into training and acquisition stands in direct propor-
tion to the greater aims and results. The following programmes have been
thoroughly reviewed and are to our view suitable: GaBi® from the Institut
für Kunststoffprüfung und Kunststoffkunde (IKP) from the University of
Stuttgart and PE Product Engineering GmbH, and Umberto® from ifeu
(Institut für Energie- und Umweltforschung, Heidel berg) and ifu (Insti-
tut für Umweltinformatik, Hamburg).
This list is not final. There are several other software systems about eco-
logical assessment on the market. They should be checked by each user
according to each individual criterion.

Step 1: Definition of the aims, objects and the Service unit
At the beginning of the MIPS calculation, it must be clear what the objectives are.
The aim of the analysis and evaluation must be clearly defined, as well as the
objects under scrutiny. Generally a differentiation must be made between a com-
parison of one or more objects, of a single object analysis, or of optimising pro-
duction or of the use of the objects. The aim of the analysis and objects under
analysis influence to a greater extent the system boundaries open to choice, but
also the financial budget and human resources available for the implementation.
In other words: when one’s budget is known, the extent of the analysis to be car-
ried out with it should be carefully considered, i.e. how cost/use elements stand
in proportion to one another.
In most cases, but above all in order to make a comparison of various prod-
ucts, a unit of measurement must be set initially to which all data can then be
related. In the MIPS concept, this measure is called a Service unit and specifies,
which use a particular product provides. In addition, the Service unit should also
throw light on non-material product alternatives and innovative services. The
establishment of a Service unit compels one to consider whether, how and which
different things are to be compared.
When calculating the intermediary steps and results, it is generally wise to not
yet refer to this Service unit, but to refer to weight units. For example, strictly
speaking an intermediary product (as a rule so-called semi-finished products
such as sheet-steel or a part of a facade, etc.) does not yet fulfil a service, and its
use in the end product can still be open (sheet-steel can be part of a car, a house
or a toy, etc., or not included in the product at all, but categorised as “produc-
tion waste”).
But why do we need a specific measurement of comparison at all if we only
want to compare two simple things quickly with each other? Quite simply:
because even “similar” goods can provide different uses.
Were transport systems to be examined, then passenger kilometres (Pkm)
could, with some reservations, be selected as a specific measurement of com-
parison for different vehicles. We would then see that a private car per Pkm is
cheaper than a truck (of course, a truck is not built for passengers, but many
small trucks can if required be used for passenger transport). However, if we
change the Service unit and consider the tonkilometre (tkm), then it is quickly
obvious that a truck is cheaper than a car (of course, a car is not built for…).
The results of such comparisons can be completely different – with the same
objects of comparison! There can be no clear-cut answer to the question: is A bet-
ter than B? The answer to the question must be as follows: assuming that under
XY circumstances and conditions A is better than B, under other circumstances
and conditions B can be better than A. Thus it is of utmost importance that the
Service unit is specified and explained.
18
What is a “Service”?A service in the textilebranch can, for instance, be“clean laundry”. This ser-vice can be provided by awashing machine, washingby hand, or an innovativeinvention (e.g. using newtextiles, combined with newcleansing products orprocesses).
“Service” of intermediaryproductsIf two cars are to be com-pared and the Service unit[Pkm] is agreed upon, thenthere is no point in referringthe production of the carbattery to this Service unit.The Material Input per bat-tery [kg/battery] is, how-ever, necessary whenanalysing the productionand use phase of a motor-car. Furthermore, car bat-teries can be used for manyother things, e.g. electricfences.
“Service” of complex endproductsA motorcar can be used, forexample, as a stationaryadvertisement, as a privatevehicle, as a crash-testvehicle or as a taxi. Differ-ent results can be deducedfrom the manner of use foreach life-cycle phase rela-tive to the specific Serviceunits. Thus, whilst a station-ary car has almost no wearand tear, a taxi on the otherhand does.
“Service” of disposablegoodsIn general, disposablegoods usually have aclearly defined and shortlife. The definition of theService unit is also rela-tively simple; e.g. the pur-pose of a throwaway plasticbeaker is to have a bever-age, ready to drink, immedi-ately. Afterwards, thebeaker is then disposed of.

The following rules must be considered when determining a Service unit:
• A Service unit should enable many different product alternatives to be com-
pared. Therefore, it should be formulated in as general terms as possible.
• The Service unit should reflect all the important aspects of the use of a
product.
A compromise must be found between both of these aspects. It is hardly pos sible
that both criteria can be completely fulfilled. This is because the use that even a
simple product provides can be too complex to describe easily, and also that the
variety of solutions are manifold and very different (and thus not identical in all
aspects of use).
Therefore, every comparison unit must be restricted to the central properties
and uses of each individual product. Other aspects (e.g. aesthetics, portability,
ergonomics, individual preferences) are important and must be taken into
account before decisions are made. These cannot however be the basis of a lim-
ited ecological assessment.
Nevertheless, it makes sense to make comparisons as they highlight the
strengths and weaknesses of products. One must delve in order to find out nec-
essary and perhaps also less important properties of certain products. Thus not
only are our powers of discernment enhanced, we also learn to understand our
own products better and also to discover new alternatives.
It can be a lot simpler where standardised products are under review (e.g.
standardised rolling bearings, screws, materials, etc.). Where such standards are
concerned, very detailed demands and conditions are often stipulated. In con-
struction, only these properties are taken into account so that any possible “over-
fulfilment“ does not have to be considered. Not defining a Service unit only
makes sense under certain conditions:
• if there is only one intermediary and unserviceable product to be calculated
(e.g. a substance, or semi-finished product);
• when products do not need to be compared, but “only” the process chain
needs to be optimised (e.g. cement production);
• if the products to be compared serve the same purpose (e.g. two throwaway
beakers).
Outcome of Step 1
The Service unit of comparison is determined as a result of this step. For exam-
ple, to be clothed with a white T-shirt for one wearing cycle. A wearing cycle con-
sists of, e.g. two days’ use, and the subsequent washing and ironing.
19
A possible way to define theservice of a built-in kitchen:
The storage space of a stan-dard kitchen, according to DIN18022, was calculated at 2,061litres.A life span of 50 years wasestimated for the solid woodkitchen, and 20 years for thefibreboard kitchen. One litrestorage space/year can bedefined as a Service unit.But the Service unit of thekitchen could also be dividedinto the following categories:
3 storage of supplies3 food preparation and cook-
ing3 boiling, roasting, frying,
keeping warm3 serving3 eating3 cleaning, washing up3 garbage disposal.
A rundown of Service unitshere is inordinately complex.
Product comparisons can givecompletely different resultsdepending on the specific orsupposed use as unit of measurement. Identical products can withlow-use intensity have a com-paratively high MIPS value,and in the case of high-useintensity have a low use ofresources — or the other wayround.
20
Service unit of clothing…“To be clothed for a certain period oftime” could be defined as the smallestcommon denominator when describingthe “service” of clothing. This “beingclothed” not only describes “protection”as the basic use of clothing, but alsoincludes “well-being” and “self-expres-sion”. “Person-year” could be taken as ameasure for comparison.
On the basis of this, the expenditurefor clothing can be recorded and com-pared.
Often, it is not necessary to ascertainthe complete clothing expenditure, butonly to carry out comparisons of theproducts. One “classic” question in con-nection with clothing and textiles could
be: Are natural fibres more environmen-tally friendly than synthetics? Or, “Seenfrom the whole manufacturing process, isa cotton pullover more resource-efficientthan one made of pure wool?”. Point ofreference in a comparison can be the complete expenditure of energy/resourcesper wearing-time. Here, for example, themeasure for comparison, “pullover-year”,could be introduced. The service providedwould need to be defined in several steps.“To be clothed with top clothing, in winter, outdoors, in casual situations, fora certain period of time.”
… and printing cartridgesHere, the common denominator can bedefined as “the writing of text” or “draw-ing of pictures” in a certain quantity. Car-tridges contain different amounts, func-tion in different ways, but because of thenumber of printed norm-pages, they areeasily compared with one another. Asprinting cartridges generally do not fulfilany aesthetic or other functions, the Ser-vice unit is relatively simple. And if onedoes not believe the manufacturer’sclaims about the capacity of the car-tridges, it is relatively simple to test it outoneself.
Practical examples
Step 2: Representation of the process chain
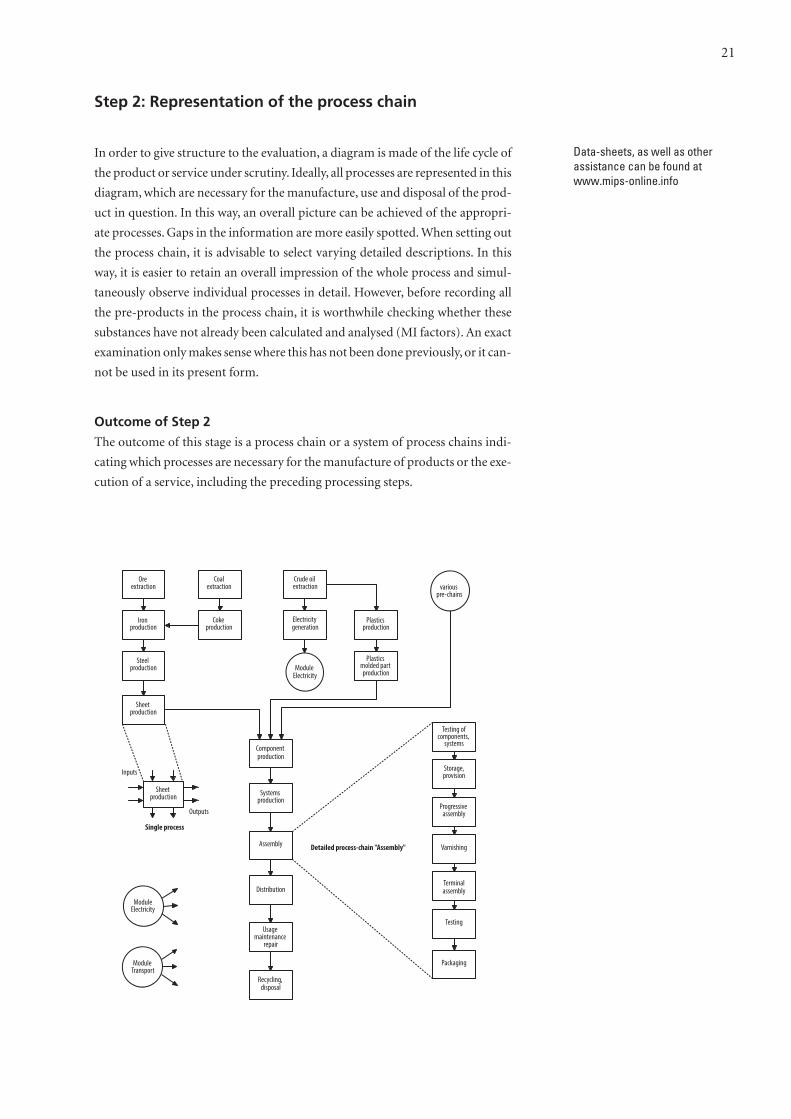
In order to give structure to the evaluation, a diagram is made of the life cycle of
the product or service under scrutiny. Ideally, all processes are represented in this
diagram, which are necessary for the manufacture, use and disposal of the prod-
uct in question. In this way, an overall picture can be achieved of the appropri-
ate processes. Gaps in the information are more easily spotted. When setting out
the process chain, it is advisable to select varying detailed descriptions. In this
way, it is easier to retain an overall impression of the whole process and simul-
taneously observe individual processes in detail. However, before recording all
the pre-products in the process chain, it is worthwhile checking whether these
substances have not already been calculated and analysed (MI factors). An exact
examination only makes sense where this has not been done previously, or it can-
not be used in its present form.
Outcome of Step 2
The outcome of this stage is a process chain or a system of process chains indi-
cating which processes are necessary for the manufacture of products or the exe-
cution of a service, including the preceding processing steps.
21
Data-sheets, as well as otherassistance can be found atwww.mips-online.info
Ore extraction
Iron production
Steel production
Sheet production
Coalextraction
Coke production
Crude oil extraction
Electricity generation
Plastics production
Plastics molded part production
Component production
Systems production
Assembly
Distribution
Usage maintenance
repair
Recycling, disposal
Sheet production
Testing ofcomponents,
systems
Storage,provision
Progressive assembly
Varnishing
Terminalassembly
Testing
Packaging
Module Electricity
various pre-chains
Inputs
Outputs
ModuleElectricity
Module Transport
Detailed process-chain "Assembly"
Single process
Step 3: Compiling of data
In the third stage, the necessary data is gathered about each identified process.
All data should be fully documented with source, year of reference, explanatory
notes, exact amounts, units, etc. If none of the aforementioned software is used,
it is advisable to use uniform data sheets.
The gathering of data (and verifying thereof) is the most important and fre-
quently the most time-consuming step of the MIPS analysis.
Sources of information can be:
• Direct measurements: they give specific data and (mostly) reliable results.
• Interviews: they often provide firsthand, invaluable experience (interviews
with and/or assessments by experts).
• Literature references: they are often the only possibility of acquiring infor-
mation about procedures outside of the enterprise. Reference books, rele-
vant periodicals and articles and specialised dictionaries can also be referred
to. Data bases can be very useful in literature research.
Even so, there are often still gaps in the information, and it will be repeatedly
necessary to carry out “qualified estimations”. Specialised knowledge of similar
processes is necessary for estimation. Theoretical calculations can provide impor-
tant data in particular where process-engineering procedures are concerned.
It is crucial that the source of information is precisely documented, particu-
larly if estimation is being made.
When assessing one’s own product, care should be taken not to unrealistically
over-estimate the product. In particular when comparing competitive products
(or average products), a minimum estimation should be made initially, and where
one’s own product is concerned, a maximum estimation. Even so, if one’s own
product is indeed found to be better after such a comparison, a further more
detailed examination of the product has to be made to be absolutely sure. For
more thorough examinations, where information may be lacking, minimum as
well as maximum estimates should be carried out to provide a complete range of
results.
It is both helpful and useful to have several sources of information at hand.
Even if one’s own test results are available, additional information such as liter-
ature and bibliographical references or one’s own specialised knowledge can all
be useful, helpful and necessary to test plausibility. As it can never be completely
ruled out that a miscalculation has occurred somewhere, either when gathering
data or when taking measurements, or that inadequate information has been
gathered, it is wise to check particularly good or particularly bad results.
Note: if basic data differs considerably to that in literature references, the rea-
son for this should be determined and the difference explained.
The investigated data (or available data) will generally be heterogeneous.
Basically, there is a differentiation between general and specific data.
General data represents average values and relates to a product classification,
e.g. white cotton T-shirt, size L. General data reflects specific branch or national
averages.
22
Incomplete information isexpanded on by “qualified”estimates.
In principle, every single resultshould be checked: even anticipated results can be incorrect.
When data deviates from literature sources, one should beable to explain this.
Specific data, however, is only valid for the product under scrutiny and under
special conditions.
A further important difference is the scope of data. Thus, electricity produc-
tion systems for a manufacturing process in South America cannot be applied,
under the same conditions, to a similar process in Germany. Similarly, recorded
data should relate to the same period of time (situation and duration) in order
to preclude any seasonal variations (e.g. average values of several years). In the
case of agricultural products or heating energy consumption, it is necessary to
include averages covering several years. If the data is available for only one year,
and the product is new, it can be particularly difficult to calculate these values.
One can then only refer to one year, and must indicate the limitation of this infor-
mation. Better insulation in a warm winter pays off less than in a cold winter.
However, it can in principle be said that the quality of data is decisive for the
quality of values, which are later calculated. When compiling data, it is worth
observing several general rules:
• Material flows have to be stated in an appropriated weight-unit (kg, t, etc.).
• It is important to state the unit alongside the numeric values. Many a sur-
prising result can be avoided in this way. Quantitative information without
a unit is always wrong!
• Primary raw materials necessary in the process are first listed under Input.
They are divided into five categories. These Inputs have no pre-process
chain; they generally occur in those processes, which are at the beginning of
the whole process chains (with the exception of combustion air and partly
water). In addition, all other (non-primary) inputs are listed: Substances,
sources of energy, pre-products, modules, infrastructure, auxiliary and oper-
ating materials. These inputs have preceding process chains and are calcu-
lated within them, or there are MI factors already available for them.
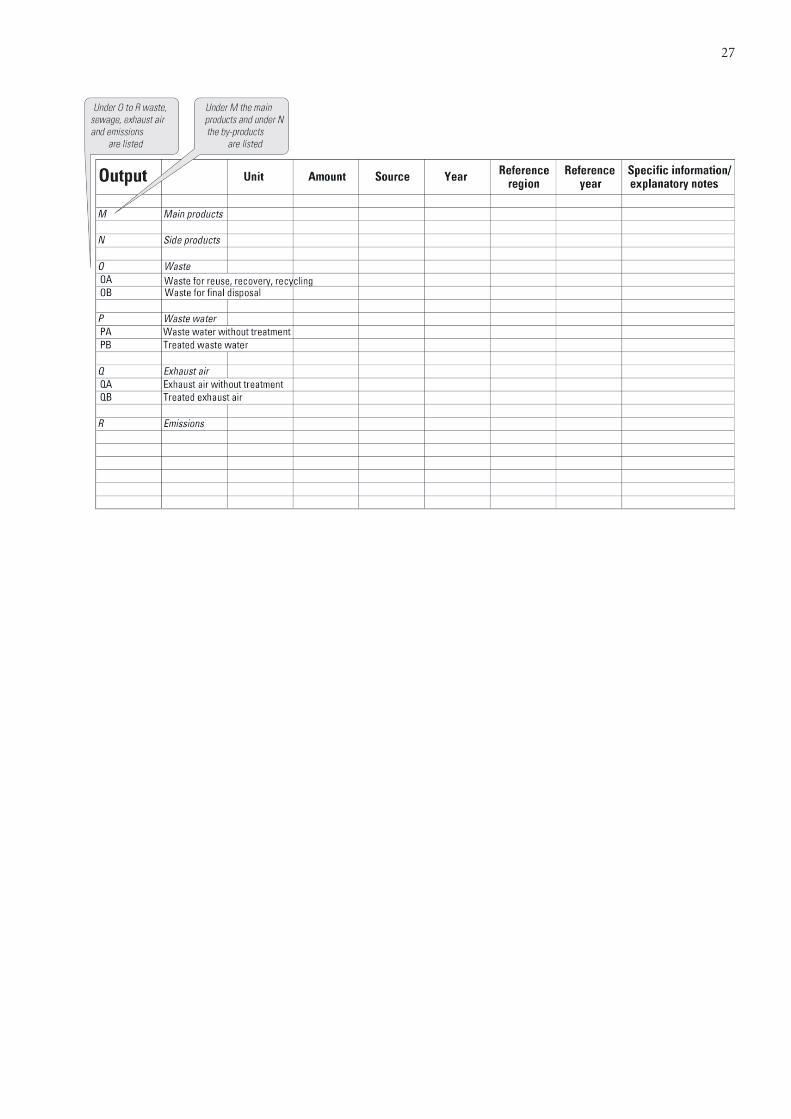
• Listed under Output are all main products and by-products, as well as waste,
sewage, exhaust air, and emissions, which are released into the air, water and
the earth.
• Not all inputs and outputs need to be recorded. This depends on the choice
and establishment of the system boundaries and cut-off criteria. Waste,
sewage, exhausts air, and emissions only need to be recorded according to
the MIPS concept if they are to be further processed (e.g. in a recycling
plant, or in an exhaust air purification plant) and require further material
input.
• The source of data must be recorded for every material, for every form of
energy, for every pre-product.
• Special information should also be recorded, e.g. additional explanations
about data, data source, etc.
“Classical traps”:
• Quantitative information without units is always wrong!
• One can only compare comparables!
• The conversion of units can be tricky!
23
Data quality is decisive for thequality of the calculated results.
At the end of the investigation, it isadvisable to establish how manyof the material flows involved inthe process chain can actually besupported by documentary evi-dence, and by which.
An Argument for SI Units (Système International d’Unité)
If conversions have been made into other units, then the original particulars
should always be documented. When making conversions, it is important to
ensure that the original units have been correctly interpreted. A ton does not
necessarily weigh 1,000 kg; it could be an U.S. (short) ton (907.185 kg); or it may
be a British (long) ton (1,016 kg). If one is working with combined units and is
not sure of a certain value, then a premature end can threaten all endeavours. It
is good to recall that a “billion” in, for example, the US is a “Milliarde” in, for
example, Germany.
Outcome of Step 3
After this step, one has an overall picture of the material and energetic inputs and
outputs of the individual processes used during the manufacturing of a product
and appropriate services. By this time, a first check has been made of the acquired
information in terms of conclusiveness. Gaps in the information have been
recognised and resolved (at least with estimates).
24
25
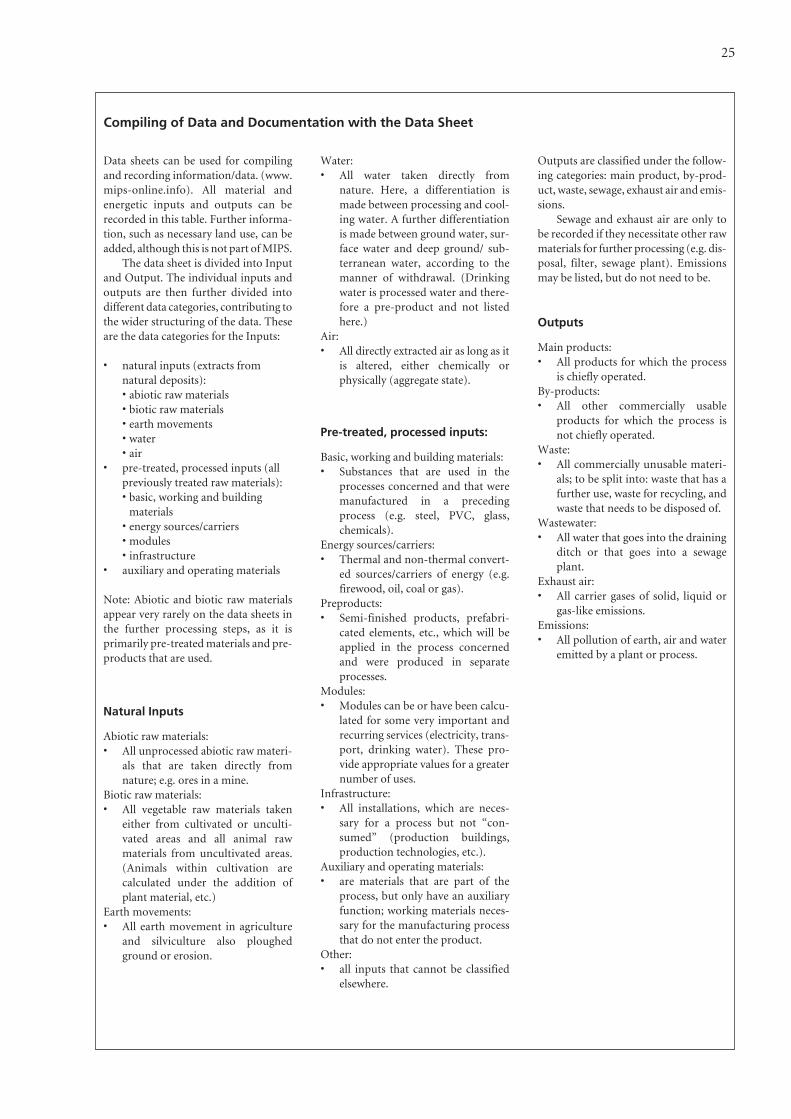
Data sheets can be used for compilingand recording information/data. (www.mips-online.info). All material andener getic inputs and outputs can berecorded in this table. Further informa-tion, such as necessary land use, can beadded, although this is not part of MIPS.
The data sheet is divided into Inputand Output. The individual inputs andoutputs are then further divided intodifferent data categories, contributing tothe wider structuring of the data. Theseare the data categories for the Inputs:
• natural inputs (extracts from natural deposits):• abiotic raw materials• biotic raw materials• earth movements• water• air
• pre-treated, processed inputs (allpreviously treated raw materials):• basic, working and buildingmaterials
• energy sources/carriers• modules• infrastructure
• auxiliary and operating materials
Note: Abiotic and biotic raw materialsappear very rarely on the data sheets inthe further processing steps, as it is primarily pre-treated materials and pre-products that are used.
Natural Inputs
Abiotic raw materials: • All unprocessed abiotic raw materi-
als that are taken directly fromnature; e.g. ores in a mine.
Biotic raw materials: • All vegetable raw materials taken
either from cultivated or unculti-vated areas and all animal rawmaterials from uncultivated areas.(Animals within cultivation are calculated under the addition ofplant material, etc.)
Earth movements: • All earth movement in agriculture
and silviculture also ploughedground or erosion.
Water: • All water taken directly from
nature. Here, a differentiation ismade between processing and cool-ing water. A further differentiationis made between ground water, sur-face water and deep ground/ sub-terranean water, according to themanner of withdrawal. (Drinkingwater is processed water and there-fore a pre-product and not listedhere.)
Air: • All directly extracted air as long as it
is altered, either chemically orphysi cally (aggregate state).
Pre-treated, processed inputs:
Basic, working and building materials:• Substances that are used in the
processes concerned and that weremanufactured in a precedingprocess (e.g. steel, PVC, glass,chemicals).
Energy sources/carriers: • Thermal and non-thermal convert-
ed sources/carriers of energy (e.g.firewood, oil, coal or gas).
Preproducts: • Semi-finished products, prefabri-
cated elements, etc., which will beapplied in the process concernedand were produced in separateprocesses.
Modules: • Modules can be or have been calcu-
lated for some very important andrecurring services (electricity, trans-port, drinking water). These pro-vide appropriate values for a greaternumber of uses.
Infrastructure: • All installations, which are neces-
sary for a process but not “con-sumed” (production buildings,production technologies, etc.).
Auxiliary and operating materials: • are materials that are part of the
process, but only have an auxiliaryfunction; working materials neces-sary for the manufacturing processthat do not enter the product.
Other: • all inputs that cannot be classified
elsewhere.
Outputs are classified under the follow-ing categories: main product, by-prod-uct, waste, sewage, exhaust air and emis-sions.
Sewage and exhaust air are only tobe recorded if they necessitate other rawmaterials for further processing (e.g. dis-posal, filter, sewage plant). Emissionsmay be listed, but do not need to be.
Outputs
Main products: • All products for which the process
is chiefly operated.By-products: • All other commercially usable
products for which the process isnot chiefly operated.
Waste: • All commercially unusable materi-
als; to be split into: waste that has afurther use, waste for recycling, andwaste that needs to be disposed of.
Wastewater: • All water that goes into the draining
ditch or that goes into a sewageplant.
Exhaust air: • All carrier gases of solid, liquid or
gas-like emissions.Emissions: • All pollution of earth, air and water
emitted by a plant or process.
Compiling of Data and Documentation with the Data Sheet

26
Sheet for compiling data:Data refer to:
Input Unit Amount Source Year Referenceregion
Speci�c information/explanatory notes
Natural inputsA Abiotic raw materials AA Minerals AB Energy carrier AC Unused extraction AD Soil excavation
B Biotic raw materials BA Plant biomass from cultivation BB Plant biomass not from cultivation BC Animal biomass not from cultivation
C Earth movements CA aktive: e.g. ploughed earth CB passive: e.g. erosion
D Water DA Process water DAA Surface extraction DAB Groundwater extraction DAC Deep groundwater extractionDB Cooling water DBA Surface extraction DBB Groundwater extraction DBC Deep groundwater extraction
E Air EA Combustion EB Chemical conversion EC Physical conversion (aggregate state) ED Other extracted air
Pre-treated/processed inputsF Basic, working and building materials
G Energy carriers GA Energy carrier (thermal conversion) GB Energy carrier (non-thermal conversion)
H Pre-products
I Modules IA Electricity IB Transport IC Drinking water
J Infrastrukture JA Production buildings JB Production technologies
K Auxiliary and operating materials KA Auxiliary materials KB Operating materials
L Others
Referenceyear
Name ofprocess
Measure for comparison / unit
Informationon inputamount
Informa-tion on
units
Informationon datasource
Informationon year ofpublishing
Informationon reference
region
Informationon reference
year
Under A to Eall direct extractions from
nature are listed(natural inputs,
incl. water)
Under F to Lall pretreated and treated
inputs are listed(materials, products,
modules, etc.)
27
Step 4: Calculation of the Material Input “From the cradle to the product”
In this step, the Material Input is calculated right through to the finished prod-
uct. If “only” MI calculations are being made of a material, module or a semi-
finished product, etc., then the following implementation is almost analogous.
The data and results compiled in Step 3 (Compiling of data) are used for these
calculations. Then the respective Material Inputs (in kg) or Material Intensities
(e.g. in kg/kg or kg/MJ) are determined for the respective intermediary products,
depending upon the processes necessary for the direct extraction of resources.
MI factors were already calculated for a number of the processes and sub-
stances. These can be referred to if necessary. This applies in particular to energy
carriers, but is, however, similar for a number of the frequently used basic, work-
ing, and building materials. A list of these values can be downloaded from the
homepage (www.mips-online.info). These lists are regularly brought up to date.
Prototypes of the data and calculation sheets can also be found at this website.
The calculation of the Material Input (MI) is arrived at by multiplying the
individual input quantities by the specific Material Intensities (MIT) of the input
substances. When these have been added together, one arrives at the Material
Input of the relevant intermediary product. It is important to consider that
whilst compiling data and calculation, one only adds up within each individual
category.
For products (intermediary products), which are handled in weight units
(wool as opposed to pullover), it is advisable to give the Material Intensity as a
result, i.e. Material Input per kg of the good. Where no Service unit can be
defined for such products or intermediary products, it is not possible to calcu-
late the MIPS value.
Note: the Material Intensity carries the unit [kg/kg]. The only deviation from
this rule, however, is when dealing with weightless goods such as electrical power
or heat, where it is then necessary to give the details of the Material Intensity in
another unit, e.g. [kg/kWh]. A weight unit always appears in the numerator, and
the usual unit for the product appears in the denominator.
When calculating the Material Input and the Material Intensity, the differ-
entiation between main products and by-products can be essential. Main prod-
ucts can be summarised as all the products for which the process is mainly oper-
ated. The Material Input of a process is attributed to the main product, or split
into the various main products according to weight shares. By-products are
products which are also marketable, but for which the process is not mainly oper-
ated, perhaps because the market price is too low, or because they accumulate as
surplus. The Material Input of the process is not added to by-products, only the
possible additional expenditure of further processing. This classification can
vary from case to case, and can depend upon other circumstances and con -
ditions. The question of main products and by-products thus takes a central
position in a MIPS analysis, and attention should be paid to it when establishing
the para meters of a system.
28
Material Input = input amount xmaterial intensityMI = Amount x MIT. In units:kg = kg x kg/kg orkg = MJ x kg/MJ orkg = Pkm x kg/Pkm etc.
The single categories are notsummed up, but listed seperately.
Material Input has the unit [kg].
Material Intensity carries theunit [kg/unit], e.g.[kg/kg],[kg/kWh], etc.
An example:If heat is only expelled duringpower production, then it is anemission; if, on the other hand,it is fed into a district-heatingnetwork, then it can be consid-ered as a by-product (forwhich further processes areneeded: construction andoperation of the district heatingnetwork). If one constructs asmall-scale cogenerationplant, primarily designed andoperated to meet heat demand,then power and warmth areboth main products.
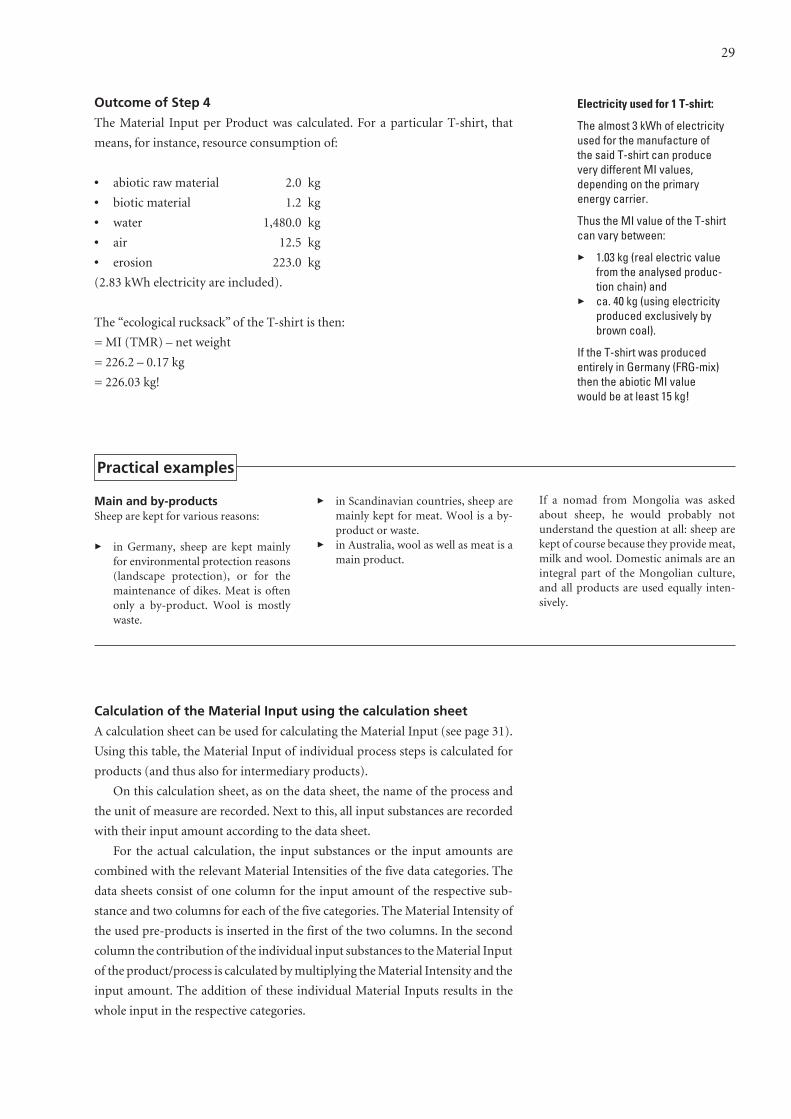
Outcome of Step 4
The Material Input per Product was calculated. For a particular T-shirt, that
means, for instance, resource consumption of:
• abiotic raw material 2.0 kg
• biotic material 1.2 kg
• water 1,480.0 kg
• air 12.5 kg
• erosion 223.0 kg
(2.83 kWh electricity are included).
The “ecological rucksack” of the T-shirt is then:
= MI (TMR) – net weight
= 226.2 – 0.17 kg
= 226.03 kg!
Calculation of the Material Input using the calculation sheet
A calculation sheet can be used for calculating the Material Input (see page 31).
Using this table, the Material Input of individual process steps is calculated for
products (and thus also for intermediary products).
On this calculation sheet, as on the data sheet, the name of the process and
the unit of measure are recorded. Next to this, all input substances are recorded
with their input amount according to the data sheet.
For the actual calculation, the input substances or the input amounts are
combined with the relevant Material Intensities of the five data categories. The
data sheets consist of one column for the input amount of the respective sub-
stance and two columns for each of the five categories. The Material Intensity of
the used pre-products is inserted in the first of the two columns. In the second
column the contribution of the individual input substances to the Material Input
of the product/process is calculated by multiplying the Material Intensity and the
input amount. The addition of these individual Material Inputs results in the
whole input in the respective categories.
29
Electricity used for 1 T-shirt:
The almost 3 kWh of electricityused for the manufacture ofthe said T-shirt can producevery different MI values,depending on the primaryenergy carrier.
Thus the MI value of the T-shirtcan vary between:
3 1.03 kg (real electric valuefrom the analysed produc-tion chain) and
3 ca. 40 kg (using electricityproduced exclusively bybrown coal).
If the T-shirt was producedentirely in Germany (FRG-mix)then the abiotic MI valuewould be at least 15 kg!
Main and by-productsSheep are kept for various reasons:
3 in Germany, sheep are kept mainlyfor environmental protection reasons(landscape protection), or for themaintenance of dikes. Meat is oftenonly a by-product. Wool is mostlywaste.
3 in Scandinavian countries, sheep aremainly kept for meat. Wool is a by-product or waste.
3 in Australia, wool as well as meat is amain product.
If a nomad from Mongolia was askedabout sheep, he would probably notunderstand the question at all: sheep arekept of course because they provide meat,milk and wool. Domestic animals are anintegral part of the Mongolian culture,and all products are used equally inten-sively.
Practical examples
Step 5: Calculation of the Material Inputs “From the cradle to the grave”
All processes of a production line are drawn up on a data sheet and a calculation
sheet in order to calculate the system-wide Material Input of services or prod-
ucts. The use of resources can be summed up in life-cycle phases, and displayed
separately.
The calculation of resource use right up to the complete product occurs in
Step 4. The majority of products cause expenditure of resources, not only dur-
ing manufacture, but also during use and disposal. These expenditures often
depend upon the user, or are determined by the specific use/function of a prod-
uct. Therefore, these resource expenditures should be calculated separately from
the manufacture in this step.
Outcome of Step 5
In addition to manufacturing, the expenditure of usage and disposal are calcu-
lated and included. Therefore, e.g. 100 wearing-cycles of a T-shirt -> Manufac-
ture + 100 x washing + 100 x ironing.
• abiotic raw material 119.5 kg
• biotic raw materials 1.2 kg
• water 4,200.0 kg
• air 40.0 kg
• erosion 223.0 kg
The result arrived at is the Material Input of a product, assuming usage through-
out all life-cycle phases.
30
Besides production expenditure of a T-shirt, the actual use of the article,through the necessary laundry, causesresource consumption. This consump-tion generally lies above and beyond thatof manufacture. Repairs do not at presentplay a relevant role with most textiles, asopposed to shoes.
Practical examples

31
Step 6: From Material Input to MIPS
The relation to the Service unit is achieved in this final step of the actual calcu-
lation. MIPS, i.e. Material Input Per Service unit, is reached by dividing the Mate-
rial Input by the number of the Service units. MIPS has the unit [weight of
moved nature / service] or [weight of moved nature / product (weight of prod-
uct)]. MIPS is recorded in five different categories (abiotic raw material, biotic
raw material, earth movement, water and air).
Outcome of Step 6:
The result of Step 5 is now applied to the Service unit. As a wearing-cycle was
defined as a Service unit, the calculation of the MIPS value of the result of Step
5, which refers to 100 wearing cycles, has to be divided by 100.
• abiotic raw material 1.2 kg
• biotic raw material 0.01 kg
• water 42 kg
• air 0.04 kg
• erosion 2.2 kg
With this result, a comparison can be made with a T-shirt that, for example, has
a life span of only 20 wearing cycles. If one takes a Service unit of, for example,
“being clothed with a T-shirt for 5 years”, then it is possible to calculate specific
values. A “long-life” T-shirt has only one production process, whereas a “short-
life” T-shirt needs to be produced several times. The usage-expenditures “wash-
ing and ironing”, however, remain the same.
32
Step 7: Interpretation of the results
Subsequent to the compiling of data and the calculation of the Material Inputs,
the Material Intensity or the MIPS values, the evaluation and interpretation of
the results follows.
A comprehensive interpretation of the category “earth movement” is not
possible at the moment. It is obvious that our methods of agriculture and silvi-
culture, ploughing and monoculture represent a severe interference with our nat-
ural environment. This trend cannot go on and has to be reduced (e.g. the inor-
dinately high rate of erosion in the quoted example).
When interpreting the results, it is permissible and often makes sense to com-
pile the following categories equally: “abiotic raw materials”, “biotic raw materi-
als”, as well as “earth movement”, (but here, only “erosion”). However, a differ-
entiation between the categories must remain possible.
The sum of these categories can be understood as a main indicator of these
observations and is called “Total Material Requirement” (TMR). This indicator
is used in the resource accounting of national economies.
The category “water” should likewise be examined separately, as interference
with water can have very different effects and consequences regionally. Differ-
entiating between processing and cooling water helps to avoid making the spe-
cific significance of this value unnecessarily difficult, because of the vast amounts
of water necessary for cooling.
When considering the category “air”, the various uses of particles are to be
comprehensively summed up (combustion, chemical transformation and physi -
cal transformation). CO2 emissions are dealt with in the section “combustion
air”. The category “air” should also not be summed up with others.
Concerning the significance of a comparison, one should always check what
percentage of the input was actually analysed, and what was only estimated. The
amount of analysed and calculated inputs should be “as large as possible”.
Outcome of Step 7:
A comparison of alternatives could determine the preferred ones. Particularly
material intensive process steps were sought. On the basis of these results, appro-
priate optimising strategies can now be selected.
33
On the particular position ofthe category “earth move-ment”:
Earth movement embraces the“active” moving of earth, e.g.ploughing fields, and the “passive” movement of earth(triggered) erosion. As theavailability of reliable docu-mentation is inadequate todate, the category “earthmovement” only encompassesdata about erosion.
Therefore TMR is the sum ofthe abiotic and biotic rawmaterials and of erosion. Thispractice is valid until furthernotice. Current developmentscan be followed on the home-page.
Optimising Strategies
The point of a MI(PS) analysis often lies in optimising the substances used, the
products under scrutiny or the services. Some possible suggestions are presented
in the following illustration:
• Reduction of Material Input within the investigated process chain (process
optimisation);
• Reduction of material input in a product (product optimisation);
• Increase in the Service unit, and in use (product optimisation);
• Comparison of product and service alternatives.
Optimising possibilities generally present themselves in all processes and in all
life-cycle phases. Of course, optimising makes most sense where the most sav-
ings can be made ultimately. The first and most important step is to find this out
and still retain an overall view of the whole life cycle: the so-called “hot spot
analysis”. Once the processes to be optimised are spotted and recognised, then a
list of priorities can be compiled according to the extent of the potential cost and
resource savings. The question then arises, which of these processes can be
changed independently, which depend indirectly on others, and which ones can-
not be changed, or, if so, only with difficulty. Subsequently, the processes, which
are deemed capable of being optimised, are listed in the following way:
• Processes where directly responsible (e.g. internal processes of a firm).
• Processes where indirectly responsible (e.g. processes of suppliers or cus-
tomers).
• Processes outside the field of influence (e.g. extraction of raw materials,
power generation).
To which of these three above-mentioned categories the specific processes belong
depends very much on the specific circumstances and situation. It can be, for
example, that an internal process in the automobile supply industry does not
allow for scope of action, as the stipulations of the car concern are too restric-
tive. On the other hand, the MI value of, for example, power generation, can be
directly influenced by one’s own, if only partial, generation of power (cogener-
ation/trigeneration, solar energy). In addition, processes can be divided into
points for optimisation according to type; following some examples.
Examples for the reduction of Material Input (MI):
• Choice of working materials (e.g. use of recyclable materials).
• Choice of production methods (e.g. use of energy efficient machines, water
cycles).
• Special surface technology for reducing and preventing corrosion, friction,
soiling (e.g. use of the “Lotus effect” to reduce the soiling of surfaces).
• Design (e.g. exchangeable kitchen fronts to suit fashion trends and
resource-conserving use).
• Transport (e.g. simple robust transport possibilities, short distances).
• Packaging (e.g. multi-use systems).
34

• Material recycling, disposal (e.g. detachable connections, recyclability, mini -
mal variety of materials).
Examples for the enhancement of the Service unit (S):
• Application, use (e.g. eco-wash programmes for washing machines, switch-
ing-off options for freezers, multi-purpose tools and equipment, long life-
span).
• Service, maintenance (e.g. exchange options for parts that are subject to
wear and tear, up-grading possibilities).
• Re-usability (re-use of trade fair stands, a mustard jar becomes a drinking
glass).
• Services with optimised resource input (e.g. renting of tools or machines
which are seldom used).
Of course, a list like this only provides a selection of several typical possibilities.
It does not automatically cover all areas of action, as the specific content is gen-
erally too complex.
35
Implementation in the enterprise:
If the MIPS concept is to be completely integrated into one’s own enterprise
as an ecological method of assessment, then it is recommended to start with
a pilot project if this has not already occurred. During such a project where
time and scope are restricted, the staff accustoms itself to the MIPS concept
by using one or more objects of reference. The following procedure has
proved worthwhile:
3 Meetings of the employees concerned (design, planning, production,
buying and selling department, etc.), of the decision-makers in manage-
ment, maybe also of the suppliers, customers and target groups.
3 Brainstorming: gathering of ideas (e.g. by means of mind mapping).
3 Formulation of the most promising ideas (e.g. by means of a subjective
point system by the participants).
3 Assessment of the ideas according to certain criteria (e.g. operational
know-how, the competition situation, value added).
3 Detailed comparison of the “best” ideas in order of importance.
3 Selection of the “best” ideas, planning and the implementation of the
necessary measures.
Only after the satisfactory completion of a pilot project are the contents and
methods of the MIPS concept introduced, step-by-step, into the individual
departments and business processes.
A detailed description of all aspects connected with the application and
implementation would go beyond the scope of this publication. If requested,
the authors are ready to name qualified contact persons for the implementa-
tion of the MIPS concept in your enterprise or organisation.
Further information at www.mips-online.info
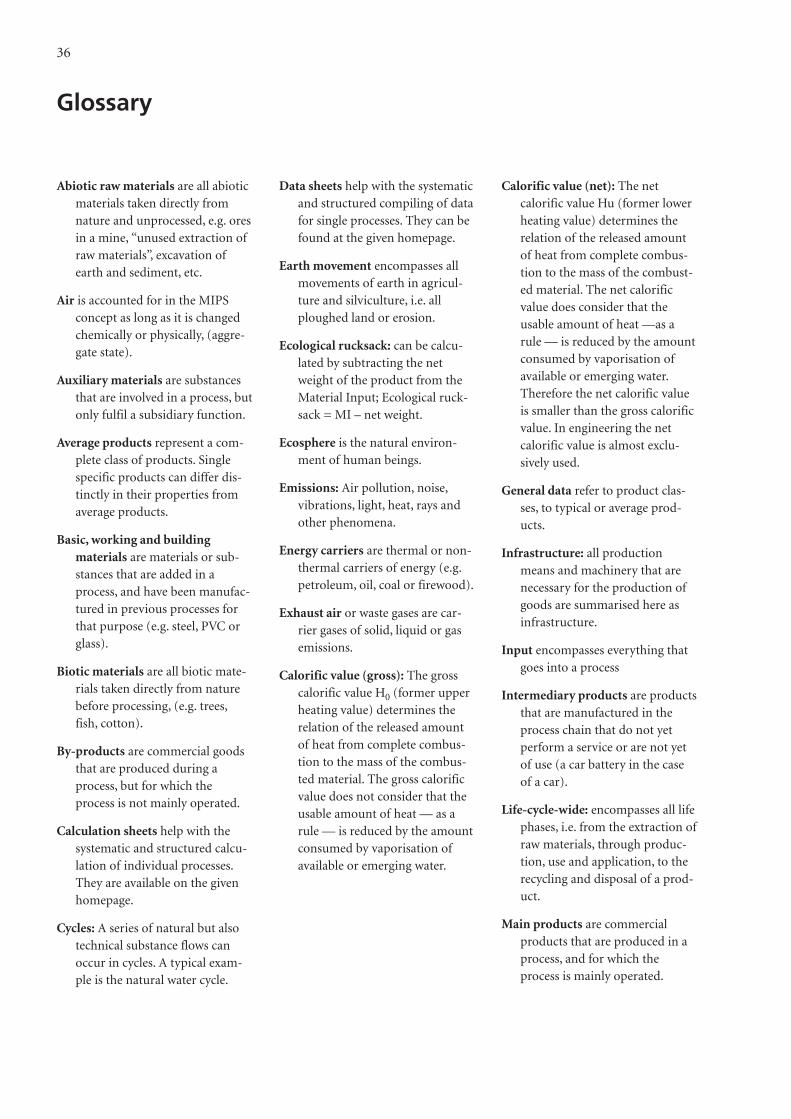
Abiotic raw materials are all abioticmaterials taken directly fromnature and unprocessed, e.g. oresin a mine, “unused extraction ofraw materials”, excavation ofearth and sediment, etc.
Air is accounted for in the MIPSconcept as long as it is changedchemically or physically, (aggre-gate state).
Auxiliary materials are substancesthat are involved in a process, butonly fulfil a subsidiary function.
Average products represent a com-plete class of products. Singlespecific products can differ dis-tinctly in their properties fromaverage products.
Basic, working and building materials are materials or sub-stances that are added in aprocess, and have been manufac-tured in previous processes forthat purpose (e.g. steel, PVC orglass).
Biotic materials are all biotic mate-rials taken directly from naturebefore processing, (e.g. trees,fish, cotton).
By-products are commercial goodsthat are produced during aprocess, but for which theprocess is not mainly operated.
Calculation sheets help with thesystematic and structured calcu-lation of individual processes.They are available on the givenhomepage.
Cycles: A series of natural but alsotechnical substance flows canoccur in cycles. A typical exam-ple is the natural water cycle.
Data sheets help with the systematicand structured compiling of datafor single processes. They can befound at the given homepage.
Earth movement encompasses allmovements of earth in agricul-ture and silviculture, i.e. allploughed land or erosion.
Ecological rucksack: can be calcu-lated by subtracting the netweight of the product from theMaterial Input; Ecological ruck-sack = MI – net weight.
Ecosphere is the natural environ-ment of human beings.
Emissions: Air pollution, noise,vibrations, light, heat, rays andother phenomena.
Energy carriers are thermal or non-thermal carriers of energy (e.g.petroleum, oil, coal or firewood).
Exhaust air or waste gases are car -rier gases of solid, liquid or gasemissions.
Calorific value (gross): The grosscalorific value H0 (former upperheating value) determines therelation of the released amountof heat from complete combus-tion to the mass of the combus -ted material. The gross calorificvalue does not consider that theusable amount of heat — as arule — is reduced by the amountconsumed by vaporisation ofavailable or emerging water.
Calorific value (net): The netcalorific value Hu (former lowerheating value) determines therelation of the released amountof heat from complete combus-tion to the mass of the combust-ed material. The net calorific value does consider that theusable amount of heat —as arule — is reduced by the amountconsumed by vaporisation ofavailable or emerging water.Therefore the net calorific valueis smaller than the gross calorificvalue. In engineering the netcalorific value is almost exclu-sively used.
General data refer to product clas -ses, to typical or average prod-ucts.
Infrastructure: all productionmeans and machinery that arenecessary for the production ofgoods are summarised here asinfrastructure.
Input encompasses everything thatgoes into a process
Intermediary products are productsthat are manufactured in theprocess chain that do not yetperform a service or are not yetof use (a car battery in the caseof a car).
Life-cycle-wide: encompasses all lifephases, i.e. from the extraction ofraw materials, through produc-tion, use and application, to therecycling and disposal of a prod-uct.
Main products are commercialproducts that are produced in aprocess, and for which theprocess is mainly operated.
36
Glossary
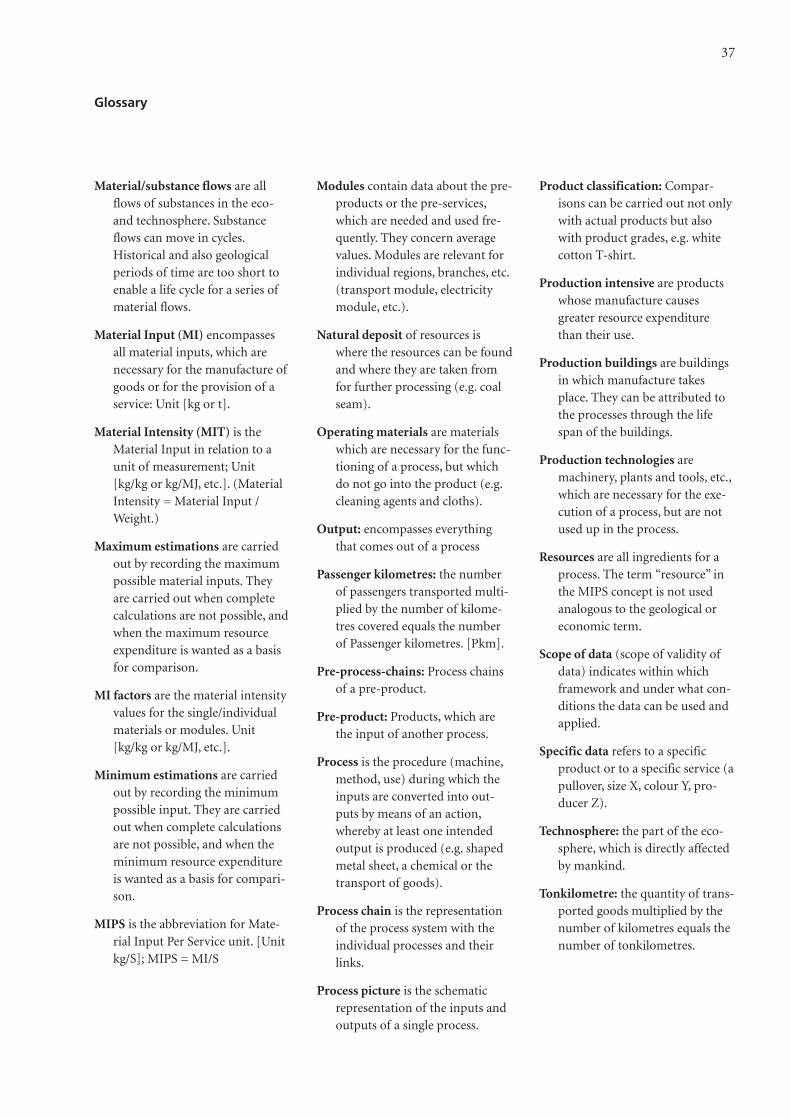
Material/substance flows are allflows of substances in the eco-and technosphere. Substanceflows can move in cycles.Histori cal and also geologicalperiods of time are too short toenable a life cycle for a series ofmaterial flows.
Material Input (MI) encompassesall material inputs, which arenecessary for the manufacture ofgoods or for the provision of aservice: Unit [kg or t].
Material Intensity (MIT) is theMaterial Input in relation to aunit of measurement; Unit[kg/kg or kg/MJ, etc.]. (MaterialIntensity = Material Input /Weight.)
Maximum estimations are carriedout by recording the maximumpossible material inputs. Theyare carried out when completecalculations are not possible, andwhen the maximum resourceexpenditure is wanted as a basisfor comparison.
MI factors are the material intensityvalues for the single/individualmaterials or modules. Unit[kg/kg or kg/MJ, etc.].
Minimum estimations are carriedout by recording the minimumpossible input. They are carriedout when complete calculationsare not possible, and when theminimum resource expenditureis wanted as a basis for compari-son.
MIPS is the abbreviation for Mate -rial Input Per Service unit. [Unitkg/S]; MIPS = MI/S
Modules contain data about the pre-products or the pre-services,which are needed and used fre-quently. They concern averagevalues. Modules are relevant forindividual regions, branches, etc.(transport module, electricitymodule, etc.).
Natural deposit of resources iswhere the resources can be foundand where they are taken fromfor further processing (e.g. coalseam).
Operating materials are materialswhich are necessary for the func-tioning of a process, but whichdo not go into the product (e.g.cleaning agents and cloths).
Output: encompasses everythingthat comes out of a process
Passenger kilometres: the numberof passengers transported multi-plied by the number of kilome-tres covered equals the numberof Passenger kilometres. [Pkm].
Pre-process-chains: Process chainsof a pre-product.
Pre-product: Products, which arethe input of another process.
Process is the procedure (machine,method, use) during which theinputs are converted into out-puts by means of an action,whereby at least one intendedoutput is produced (e.g. shapedmetal sheet, a chemical or thetransport of goods).
Process chain is the representationof the process system with theindividual processes and theirlinks.
Process picture is the schematic representation of the inputs andoutputs of a single process.
Product classification: Compar-isons can be carried out not onlywith actual products but alsowith product grades, e.g. whitecotton T-shirt.
Production intensive are productswhose manufacture causesgreater resource expenditurethan their use.
Production buildings are buildingsin which manufacture takesplace. They can be attributed tothe processes through the lifespan of the buildings.
Production technologies aremachinery, plants and tools, etc.,which are necessary for the exe-cution of a process, but are notused up in the process.
Resources are all ingredients for aprocess. The term “resource” inthe MIPS concept is not usedanalogous to the geological oreconomic term.
Scope of data (scope of validity ofdata) indicates within whichframework and under what con-ditions the data can be used andapplied.
Specific data refers to a specificproduct or to a specific service (apullover, size X, colour Y, pro-ducer Z).
Technosphere: the part of the eco -sphere, which is directly affectedby mankind.
Tonkilometre: the quantity of trans-ported goods multiplied by thenumber of kilometres equals thenumber of tonkilometres.
37
Glossary
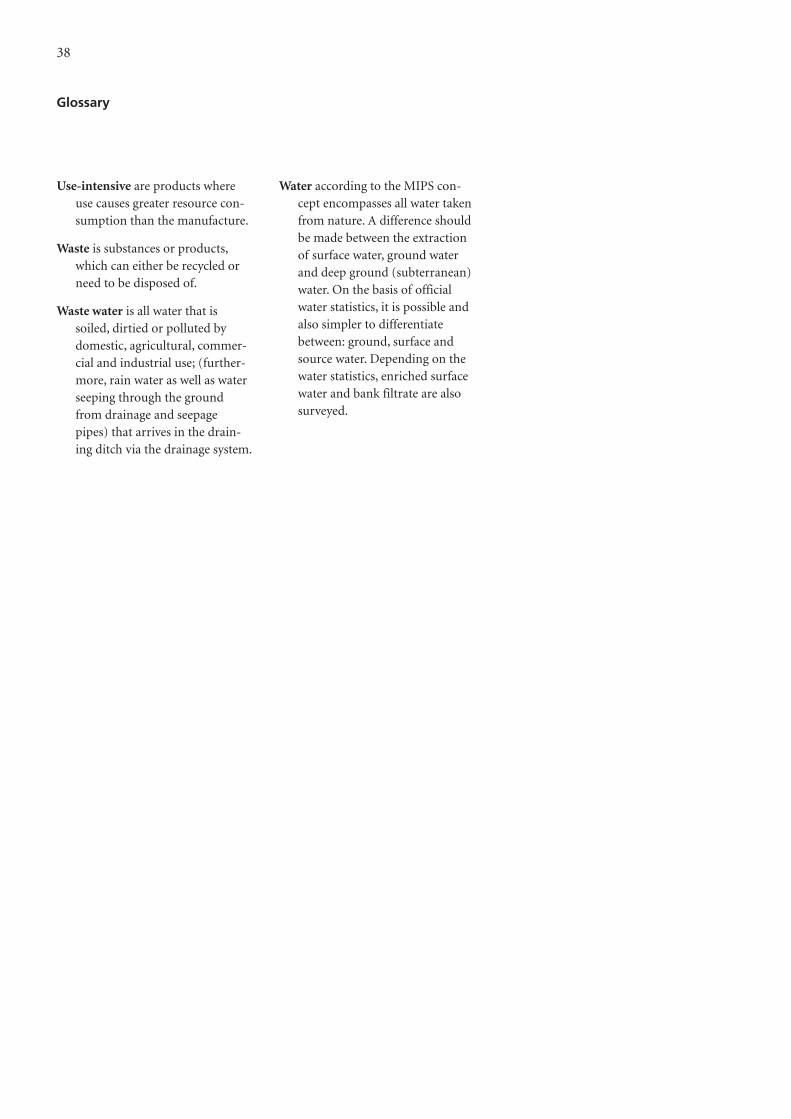
Use-intensive are products whereuse causes greater resource con-sumption than the manufacture.
Waste is substances or products,which can either be recycled orneed to be disposed of.
Waste water is all water that issoiled, dirtied or polluted bydomestic, agricultural, commer-cial and industrial use; (further-more, rain water as well as waterseeping through the groundfrom drainage and seepagepipes) that arrives in the drain-ing ditch via the drainage system.
Water according to the MIPS con-cept encompasses all water takenfrom nature. A difference shouldbe made between the extractionof surface water, ground waterand deep ground (subterranean)water. On the basis of officialwater statistics, it is possible andalso simpler to differentiatebetween: ground, surface andsource water. Depending on thewater statistics, enriched surfacewater and bank filtrate are alsosurveyed.
38
Glossary
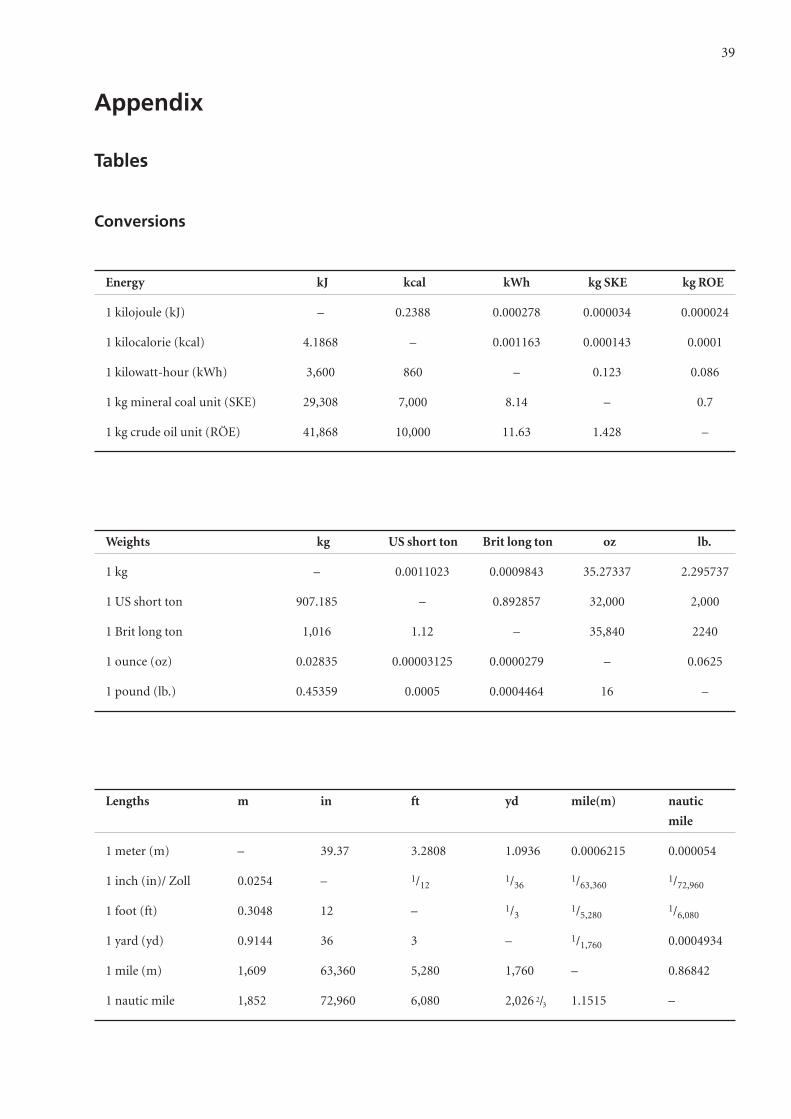
39
Appendix
Tables
Conversions
Energy kJ kcal kWh kg SKE kg ROE
1 kilojoule (kJ) – 0.2388 0.000278 0.000034 0.000024
1 kilocalorie (kcal) 4.1868 – 0.001163 0.000143 0.0001
1 kilowatt-hour (kWh) 3,600 860 – 0.123 0.086
1 kg mineral coal unit (SKE) 29,308 7,000 8.14 – 0.7
1 kg crude oil unit (RÖE) 41,868 10,000 11.63 1.428 –
Weights kg US short ton Brit long ton oz lb.
1 kg – 0.0011023 0.0009843 35.27337 2.295737
1 US short ton 907.185 – 0.892857 32,000 2,000
1 Brit long ton 1,016 1.12 – 35,840 2240
1 ounce (oz) 0.02835 0.00003125 0.0000279 – 0.0625
1 pound (lb.) 0.45359 0.0005 0.0004464 16 –
Lengths m in ft yd mile(m) nautic
mile
1 meter (m) – 39.37 3.2808 1.0936 0.0006215 0.000054
1 inch (in)/ Zoll 0.0254 – 1/12 1/36 1/63,360 1/72,960
1 foot (ft) 0.3048 12 – 1/3 1/5,280 1/6,080
1 yard (yd) 0.9144 36 3 – 1/1,760 0.0004934
1 mile (m) 1,609 63,360 5,280 1,760 – 0.86842
1 nautic mile 1,852 72,960 6,080 2,026 2/3 1.1515 –
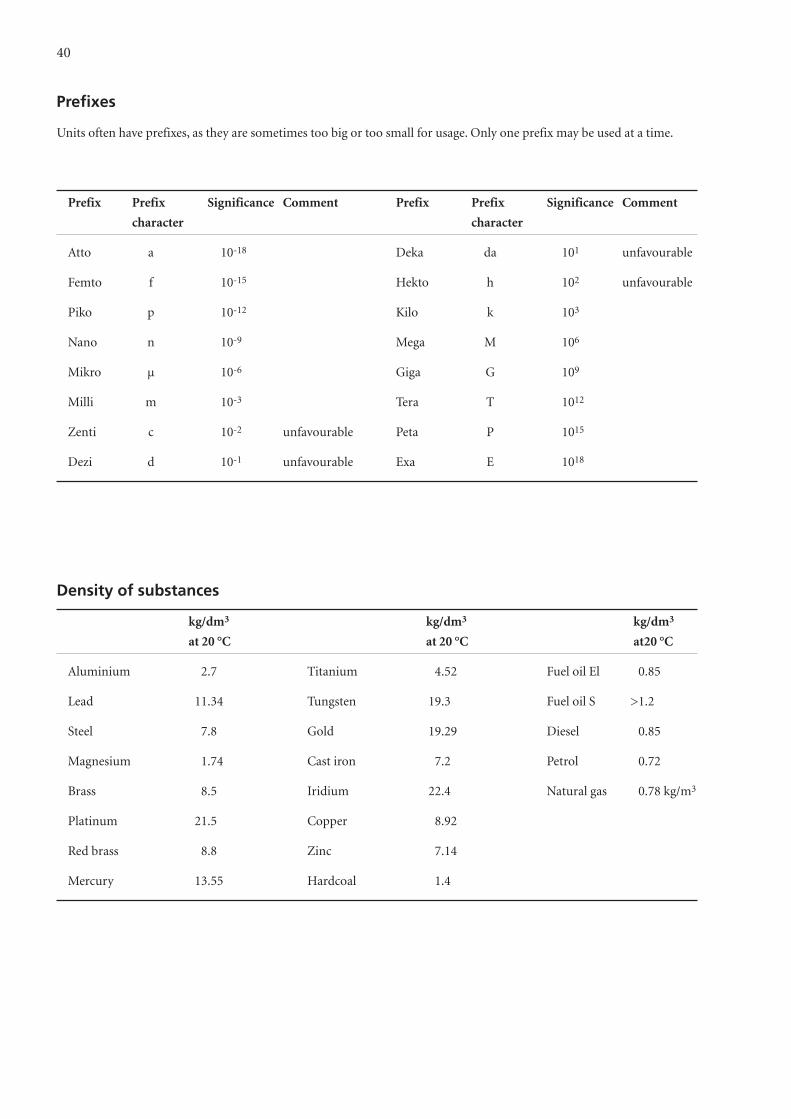
40
Prefixes
Units often have prefixes, as they are sometimes too big or too small for usage. Only one prefix may be used at a time.
Prefix Prefix Significance Comment Prefix Prefix Significance Comment
character character
Atto a 10-18 Deka da 101 unfavourable
Femto f 10-15 Hekto h 102 unfavourable
Piko p 10-12 Kilo k 103
Nano n 10-9 Mega M 106
Mikro µ 10-6 Giga G 109
Milli m 10-3 Tera T 1012
Zenti c 10-2 unfavourable Peta P 1015
Dezi d 10-1 unfavourable Exa E 1018
Density of substances
kg/dm3 kg/dm3 kg/dm3
at 20 °C at 20 °C at20 °C
Aluminium 2.7 Titanium 4.52 Fuel oil El 0.85
Lead 11.34 Tungsten 19.3 Fuel oil S >1.2
Steel 7.8 Gold 19.29 Diesel 0.85
Magnesium 1.74 Cast iron 7.2 Petrol 0.72
Brass 8.5 Iridium 22.4 Natural gas 0.78 kg/m3
Platinum 21.5 Copper 8.92
Red brass 8.8 Zinc 7.14
Mercury 13.55 Hardcoal 1.4
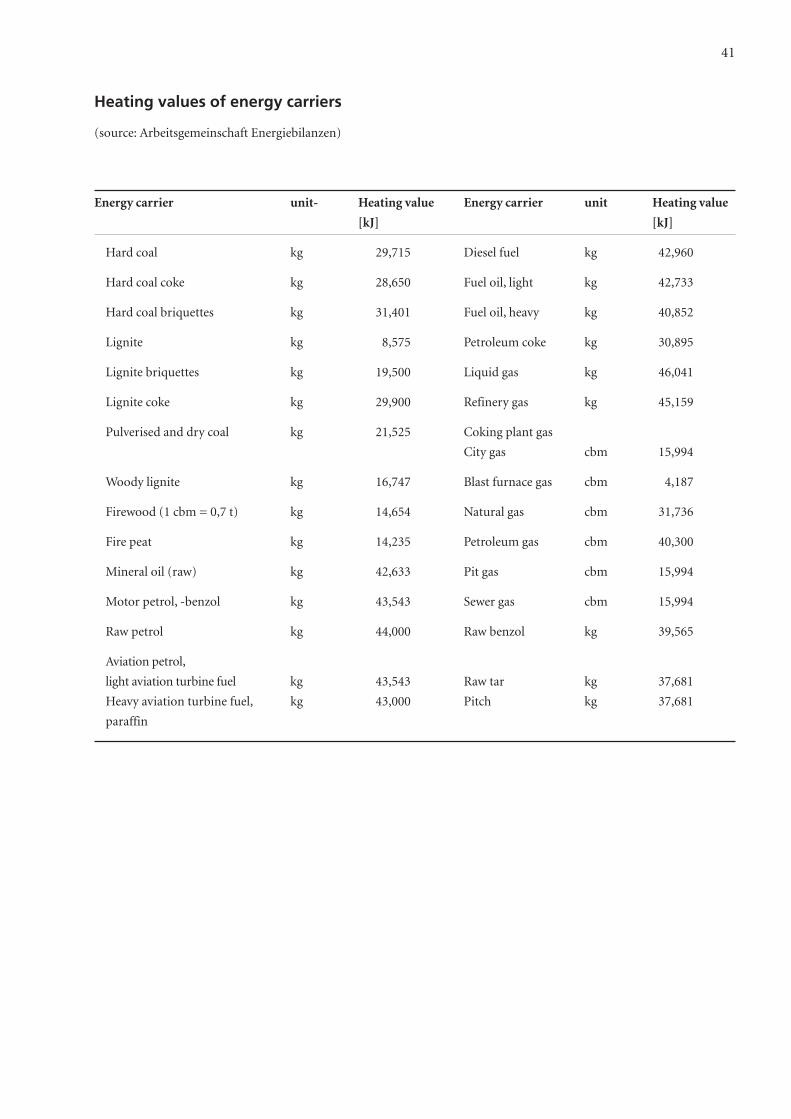
41
Heating values of energy carriers
(source: Arbeitsgemeinschaft Energiebilanzen)
Energy carrier unit- Heating value Energy carrier unit Heating value
[kJ] [kJ]
Hard coal kg 29,715 Diesel fuel kg 42,960
Hard coal coke kg 28,650 Fuel oil, light kg 42,733
Hard coal briquettes kg 31,401 Fuel oil, heavy kg 40,852
Lignite kg 8,575 Petroleum coke kg 30,895
Lignite briquettes kg 19,500 Liquid gas kg 46,041
Lignite coke kg 29,900 Refinery gas kg 45,159
Pulverised and dry coal kg 21,525 Coking plant gas
City gas cbm 15,994
Woody lignite kg 16,747 Blast furnace gas cbm 4,187
Firewood (1 cbm = 0,7 t) kg 14,654 Natural gas cbm 31,736
Fire peat kg 14,235 Petroleum gas cbm 40,300
Mineral oil (raw) kg 42,633 Pit gas cbm 15,994
Motor petrol, -benzol kg 43,543 Sewer gas cbm 15,994
Raw petrol kg 44,000 Raw benzol kg 39,565
Aviation petrol,
light aviation turbine fuel kg 43,543 Raw tar kg 37,681
Heavy aviation turbine fuel, kg 43,000 Pitch kg 37,681
paraffin
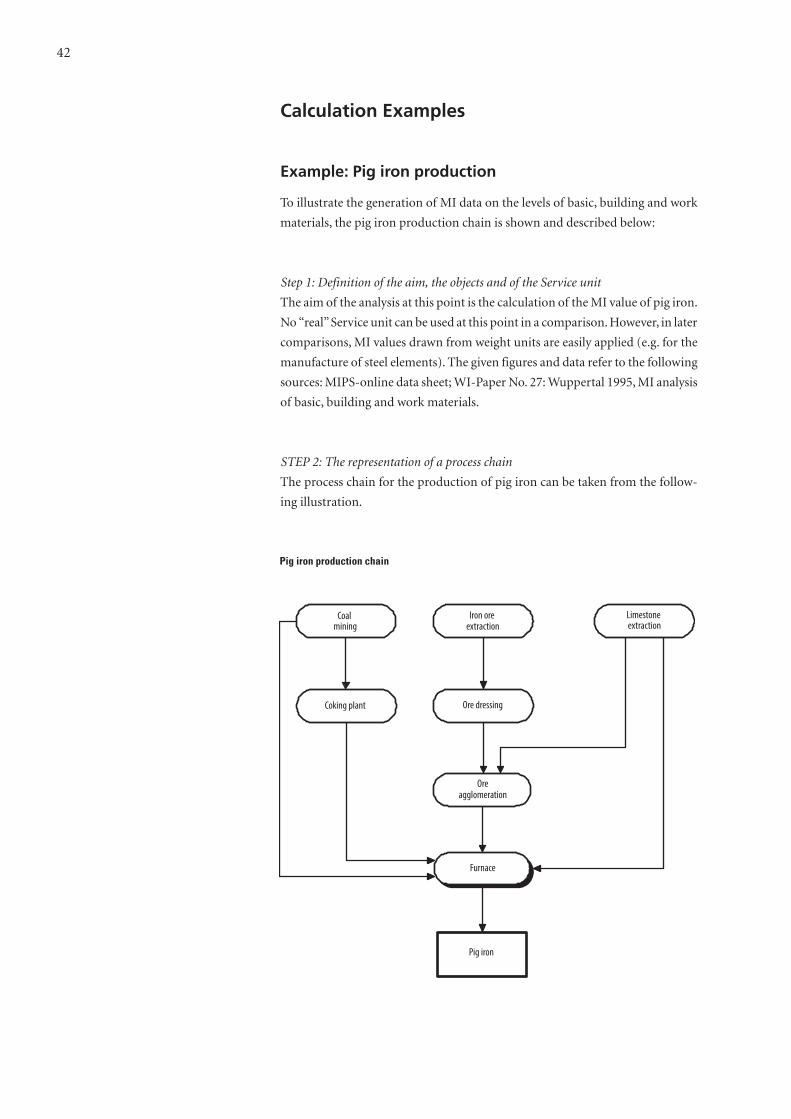
Calculation Examples
Example: Pig iron production
To illustrate the generation of MI data on the levels of basic, building and work
materials, the pig iron production chain is shown and described below:
Step 1: Definition of the aim, the objects and of the Service unit
The aim of the analysis at this point is the calculation of the MI value of pig iron.
No “real” Service unit can be used at this point in a comparison. However, in later
comparisons, MI values drawn from weight units are easily applied (e.g. for the
manufacture of steel elements). The given figures and data refer to the following
sources: MIPS-online data sheet; WI-Paper No. 27: Wuppertal 1995, MI analysis
of basic, building and work materials.
STEP 2: The representation of a process chain
The process chain for the production of pig iron can be taken from the follow-
ing illustration.
42
Oreagglomeration
Coking plant
Furnace
Pig iron
Ore dressing
Pig iron production chain
Coal mining
Iron ore extraction
Limestone extraction
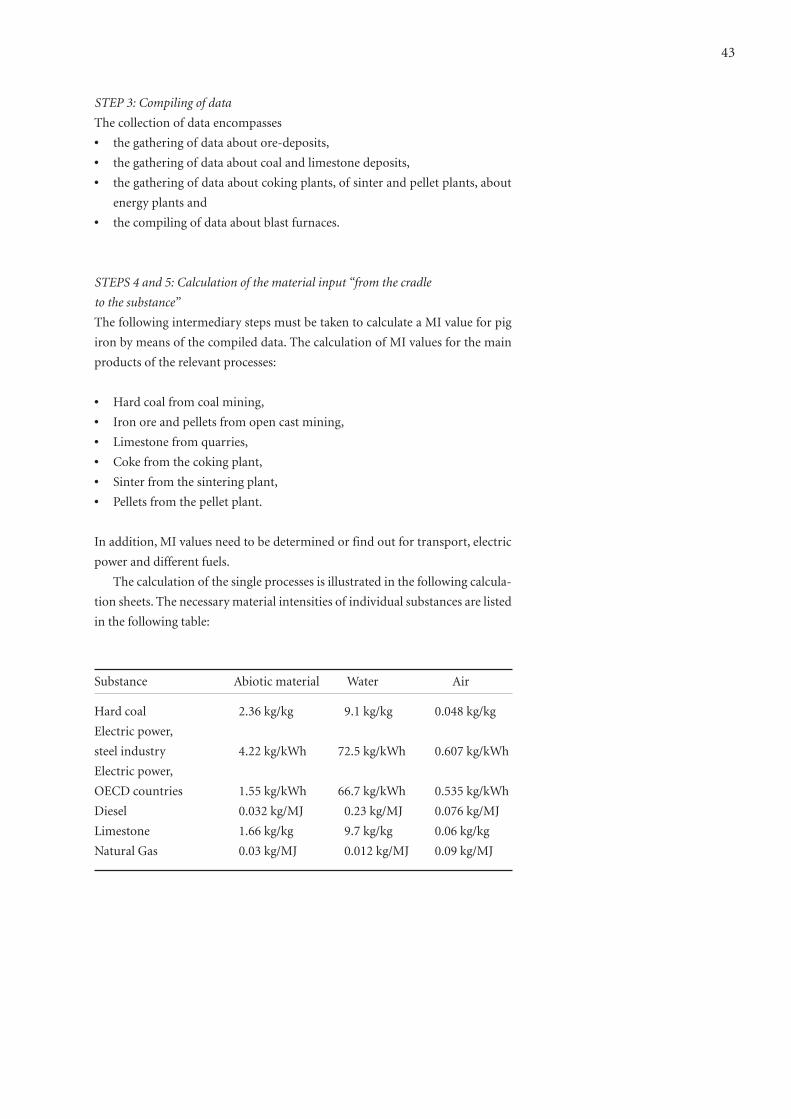
STEP 3: Compiling of data
The collection of data encompasses
• the gathering of data about ore-deposits,
• the gathering of data about coal and limestone deposits,
• the gathering of data about coking plants, of sinter and pellet plants, about
energy plants and
• the compiling of data about blast furnaces.
STEPS 4 and 5: Calculation of the material input “from the cradle
to the substance”
The following intermediary steps must be taken to calculate a MI value for pig
iron by means of the compiled data. The calculation of MI values for the main
products of the relevant processes:
• Hard coal from coal mining,
• Iron ore and pellets from open cast mining,
• Limestone from quarries,
• Coke from the coking plant,
• Sinter from the sintering plant,
• Pellets from the pellet plant.
In addition, MI values need to be determined or find out for transport, electric
power and different fuels.
The calculation of the single processes is illustrated in the following calcula-
tion sheets. The necessary material intensities of individual substances are listed
in the following table:
43
Substance Abiotic material Water Air
Hard coal 2.36 kg/kg 9.1 kg/kg 0.048 kg/kg
Electric power,
steel industry 4.22 kg/kWh 72.5 kg/kWh 0.607 kg/kWh
Electric power,
OECD countries 1.55 kg/kWh 66.7 kg/kWh 0.535 kg/kWh
Diesel 0.032 kg/MJ 0.23 kg/MJ 0.076 kg/MJ
Limestone 1.66 kg/kg 9.7 kg/kg 0.06 kg/kg
Natural Gas 0.03 kg/MJ 0.012 kg/MJ 0.09 kg/MJ
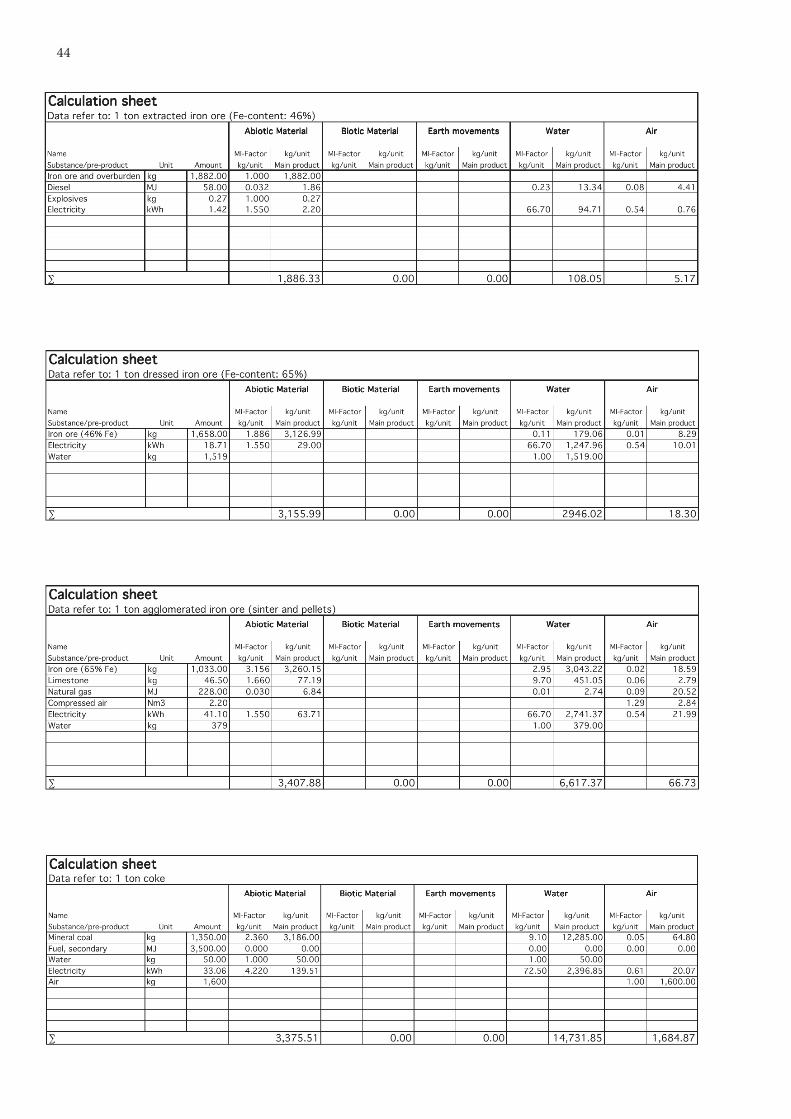
44
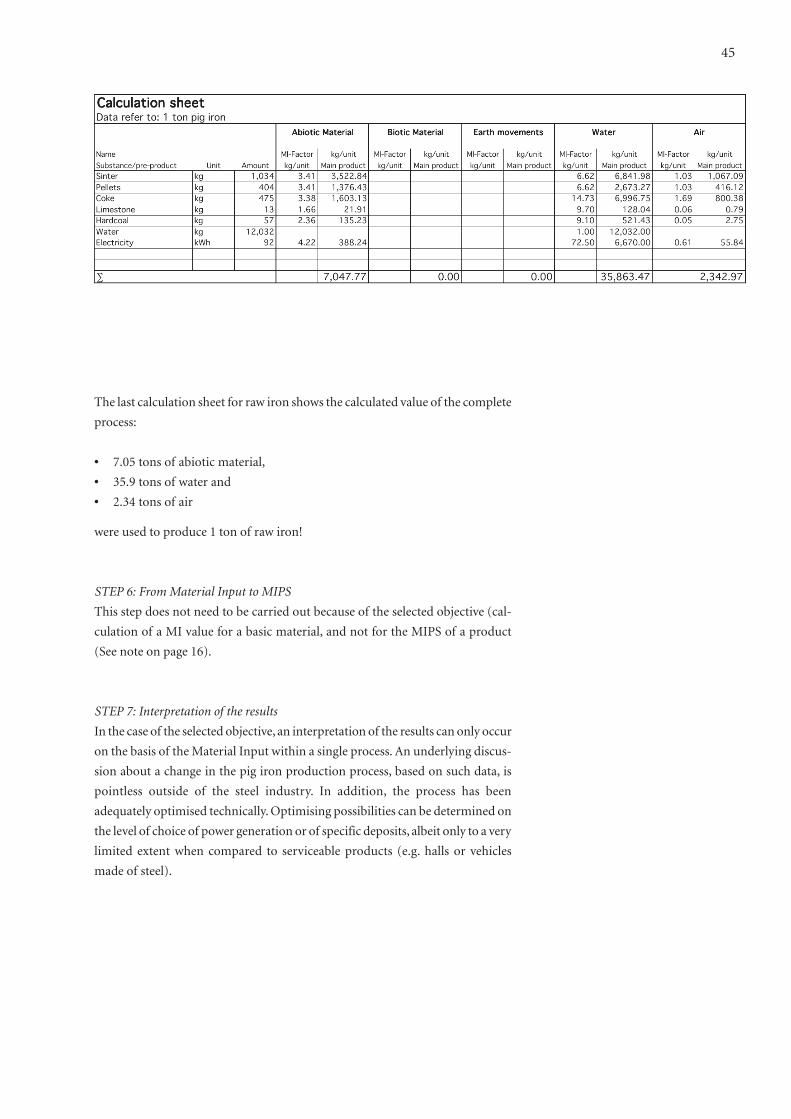
The last calculation sheet for raw iron shows the calculated value of the complete
process:
• 7.05 tons of abiotic material,
• 35.9 tons of water and
• 2.34 tons of air
were used to produce 1 ton of raw iron!
STEP 6: From Material Input to MIPS
This step does not need to be carried out because of the selected objective (cal-
culation of a MI value for a basic material, and not for the MIPS of a product
(See note on page 16).
STEP 7: Interpretation of the results
In the case of the selected objective, an interpretation of the results can only occur
on the basis of the Material Input within a single process. An underlying discus-
sion about a change in the pig iron production process, based on such data, is
pointless outside of the steel industry. In addition, the process has been
adequately optimised technically. Optimising possibilities can be determined on
the level of choice of power generation or of specific deposits, albeit only to a very
limited extent when compared to serviceable products (e.g. halls or vehicles
made of steel).
45
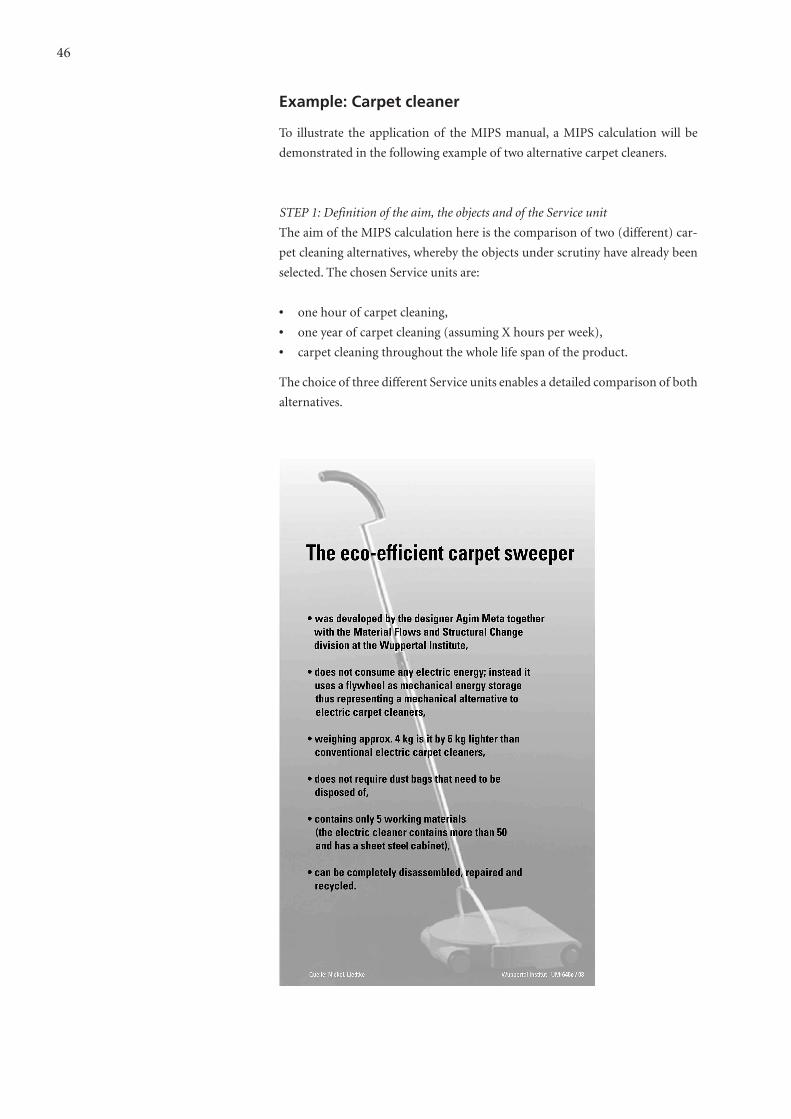
Example: Carpet cleaner
To illustrate the application of the MIPS manual, a MIPS calculation will be
demonstrated in the following example of two alternative carpet cleaners.
STEP 1: Definition of the aim, the objects and of the Service unit
The aim of the MIPS calculation here is the comparison of two (different) car-
pet cleaning alternatives, whereby the objects under scrutiny have already been
selected. The chosen Service units are:
• one hour of carpet cleaning,
• one year of carpet cleaning (assuming X hours per week),
• carpet cleaning throughout the whole life span of the product.
The choice of three different Service units enables a detailed comparison of both
alternatives.
46
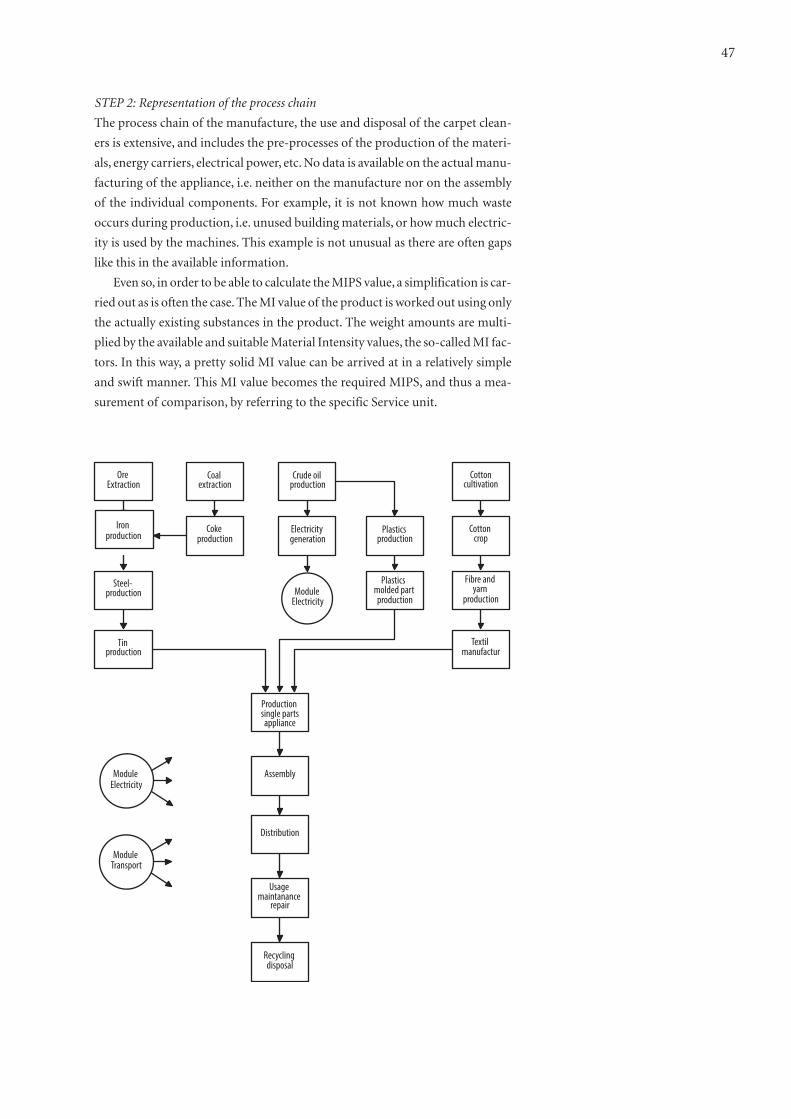
STEP 2: Representation of the process chain
The process chain of the manufacture, the use and disposal of the carpet clean-
ers is extensive, and includes the pre-processes of the production of the materi-
als, energy carriers, electrical power, etc. No data is available on the actual manu -
facturing of the appliance, i.e. neither on the manufacture nor on the assembly
of the individual components. For example, it is not known how much waste
occurs during production, i.e. unused building materials, or how much electric-
ity is used by the machines. This example is not unusual as there are often gaps
like this in the available information.
Even so, in order to be able to calculate the MIPS value, a simplification is car-
ried out as is often the case. The MI value of the product is worked out using only
the actually existing substances in the product. The weight amounts are multi-
plied by the available and suitable Material Intensity values, the so-called MI fac-
tors. In this way, a pretty solid MI value can be arrived at in a relatively simple
and swift manner. This MI value becomes the required MIPS, and thus a mea-
surement of comparison, by referring to the specific Service unit.
47
Ore Extraction
Iron production
Steel- production
Tin production
Coal extraction
Coke production
Crude oil production
Electricity generation
Plastics production
Plastics molded part production
Module Electricity
Production single partsappliance
Assembly
Distribution
Usage maintanance
repair
Recycling disposal
Module Electricity
Module Transport
Cottoncultivation
Cotton crop
Fibre and yarn
production
Textil manufactur
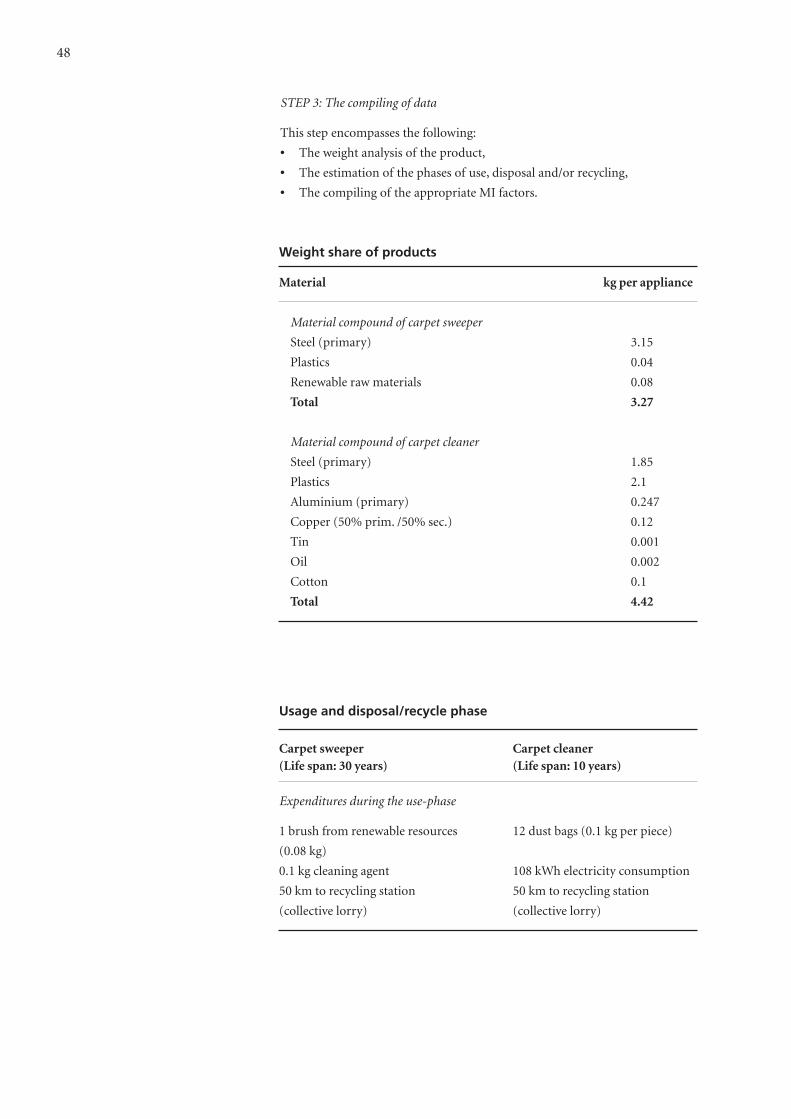
STEP 3: The compiling of data
This step encompasses the following:
• The weight analysis of the product,
• The estimation of the phases of use, disposal and/or recycling,
• The compiling of the appropriate MI factors.
48
Weight share of products
Material kg per appliance
Material compound of carpet sweeper
Steel (primary) 3.15
Plastics 0.04
Renewable raw materials 0.08
Total 3.27
Material compound of carpet cleaner
Steel (primary) 1.85
Plastics 2.1
Aluminium (primary) 0.247
Copper (50% prim. /50% sec.) 0.12
Tin 0.001
Oil 0.002
Cotton 0.1
Total 4.42
Usage and disposal/recycle phase
Carpet sweeper Carpet cleaner (Life span: 30 years) (Life span: 10 years)
Expenditures during the use-phase
1 brush from renewable resources 12 dust bags (0.1 kg per piece)
(0.08 kg)
0.1 kg cleaning agent 108 kWh electricity consumption
50 km to recycling station 50 km to recycling station
(collective lorry) (collective lorry)
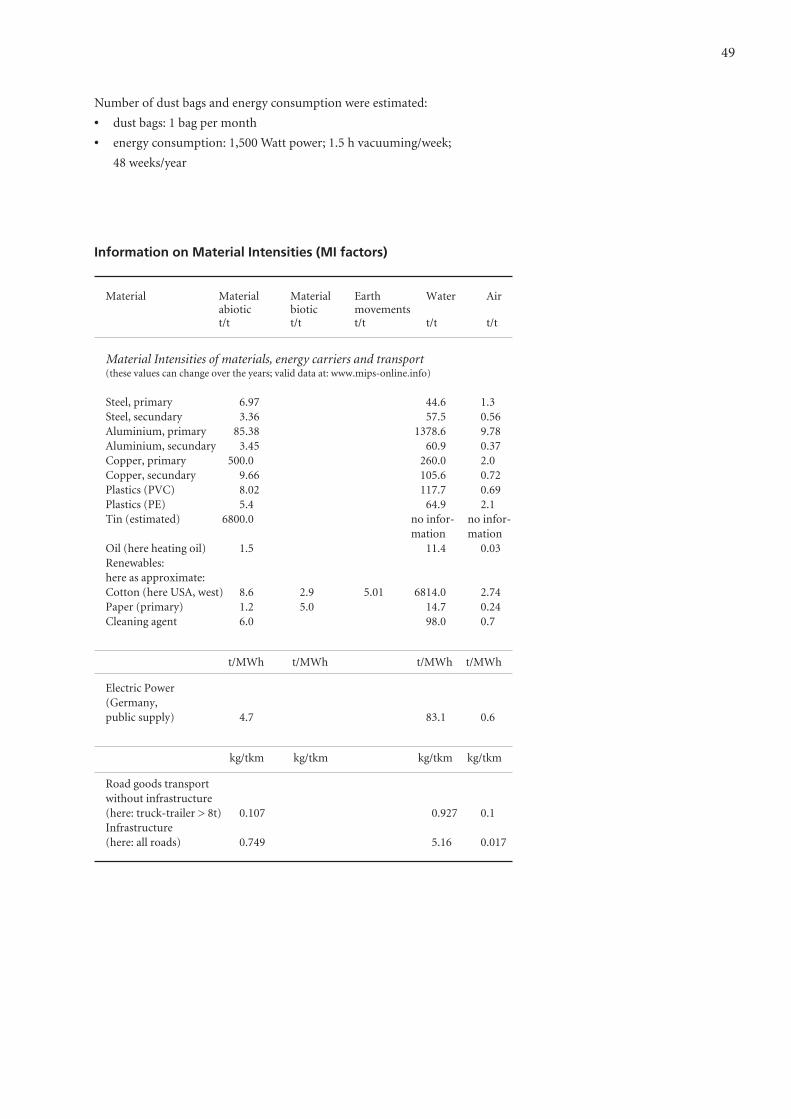
Number of dust bags and energy consumption were estimated:
• dust bags: 1 bag per month
• energy consumption: 1,500 Watt power; 1.5 h vacuuming/week;
48 weeks/year
49
Information on Material Intensities (MI factors)
Material Material Material Earth Water Air abiotic biotic movementst/t t/t t/t t/t t/t
Material Intensities of materials, energy carriers and transport(these values can change over the years; valid data at: www.mips-online.info)
Steel, primary 6.97 44.6 1.3 Steel, secundary 3.36 57.5 0.56 Aluminium, primary 85.38 1378.6 9.78 Aluminium, secundary 3.45 60.9 0.37 Copper, primary 500.0 260.0 2.0 Copper, secundary 9.66 105.6 0.72 Plastics (PVC) 8.02 117.7 0.69 Plastics (PE) 5.4 64.9 2.1 Tin (estimated) 6800.0 no infor- no infor-
mation mationOil (here heating oil) 1.5 11.4 0.03 Renewables: here as approximate: Cotton (here USA, west) 8.6 2.9 5.01 6814.0 2.74 Paper (primary) 1.2 5.0 14.7 0.24 Cleaning agent 6.0 98.0 0.7
t/MWh t/MWh t/MWh t/MWh
Electric Power (Germany, public supply) 4.7 83.1 0.6
kg/tkm kg/tkm kg/tkm kg/tkm
Road goods transport without infrastructure (here: truck-trailer > 8t) 0.107 0.927 0.1 Infrastructure (here: all roads) 0.749 5.16 0.017
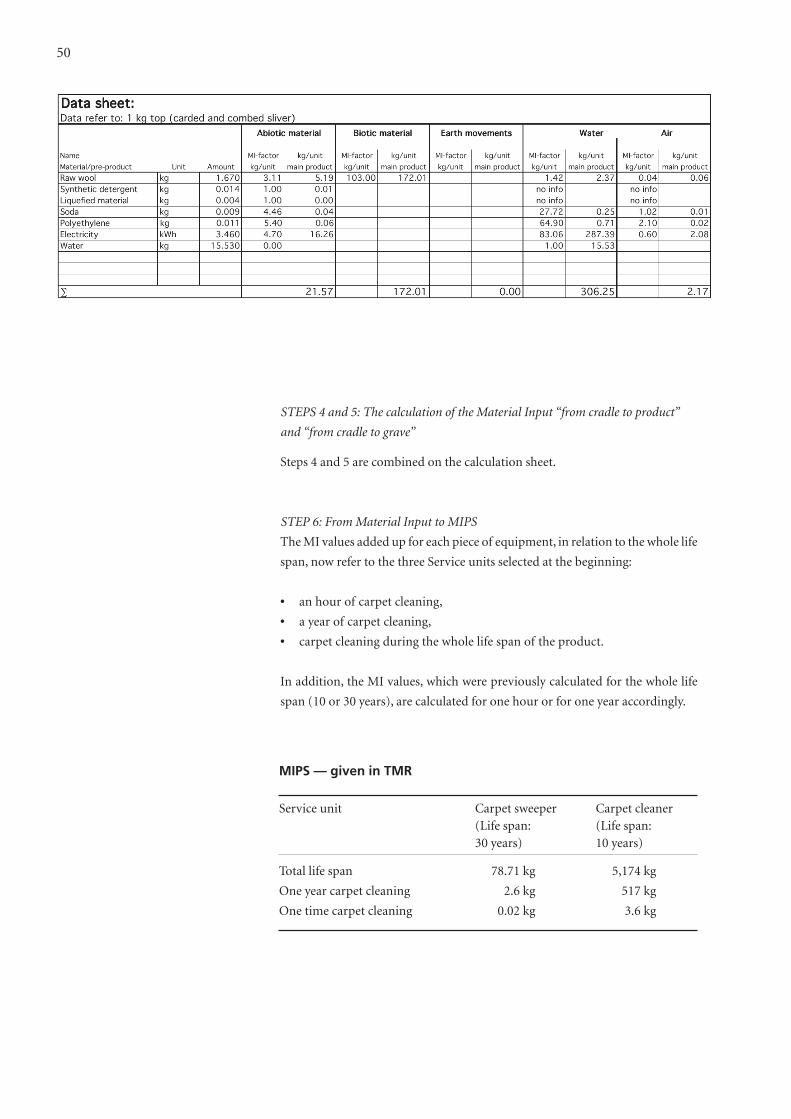
STEPS 4 and 5: The calculation of the Material Input “from cradle to product”
and “from cradle to grave”
Steps 4 and 5 are combined on the calculation sheet.
STEP 6: From Material Input to MIPS
The MI values added up for each piece of equipment, in relation to the whole life
span, now refer to the three Service units selected at the beginning:
• an hour of carpet cleaning,
• a year of carpet cleaning,
• carpet cleaning during the whole life span of the product.
In addition, the MI values, which were previously calculated for the whole life
span (10 or 30 years), are calculated for one hour or for one year accordingly.
50
MIPS — given in TMR
Service unit Carpet sweeper Carpet cleaner(Life span: (Life span: 30 years) 10 years)
Total life span 78.71 kg 5,174 kg
One year carpet cleaning 2.6 kg 517 kg
One time carpet cleaning 0.02 kg 3.6 kg

STEP 7: Interpretation of the results
The listed values alone clearly demonstrate the difference in the use of materi-
als, TMR, of both carpet cleaners. In addition, if the life-cycle phases are looked
at separately (see fig ox), then it can be seen that the phase of use of the conven-
tional vacuum cleaner is the decisive factor, in particular regarding the use of
resources due to electricity consumption.
In this case, a subsequent optimisation of the product based on this calculation
is also possible: optimising the conventional carpet cleaner during the phase of
use where the most raw materials are used. An optimisation beyond the already
existing product provided the designer, Agim Meta, the opportunity to create a
comparable “carpet sweeper”. Starting with the conventional carpet cleaner, a
carpet cleaner has been conceived and designed which uses the least possible
resources. And we are of the opinion that the comparison is well worth looking
into!
51
MIPS (given in TMR) per life-cycle phase
Life-cycle phase Carpet sweeper Carpet cleaner(Life span: (Life span: 30 years) 10 years)
Manufacture 23.5 kg 84.4 kg
Usage 55 kg 5,150 kg
Disposal/Recycling 0.24 kg 0.2 kg
Worth-knowing
LiteratureBringezu, S. “Ressourcennutzung in Wirtschaftsräumen – Stoffstromanalaysen für eine
nachhaltige Raumentwicklung”, Berlin, Heidelberg, New York 2000
Eurostat “Economy-wide material flow accounts and derived indicators. A methodolog-ical guide”, Luxembourg, 2001
Schmidt-Bleek, F.: Wieviel Umwelt braucht der Mensch? MIPS - Das Maß für ökologis-ches Wirtschaften, Basel: Birkhäuser Verlag, 1994
Schmidt-Bleek, F.; Bringezu, S.; Hinterberger, F.; Liedtke, C.; Spangenberg, J.; Stiller, H.;Welfens, M. J.: Handbuch der Materialintensitätsanalyse MAIA.: Berlin; Basel;Boston: Birkhäuser Verlag, 1998
Schmidt-Bleek, F.:”Das MIPS Konzept: weniger Naturverbrauch – mehr Lebensqualitätdurch Faktor 10“, München: Knaur, 2000
Further information and links
www.mips-online.info
www.wupperinst.org
www.factor10.de
Software/Eco-auditing programmesGabi® vom Institut für Kunststoffprüfung und Kunststoffkunde (IKP), Uni Stuttgart
und PE Product Engineering GmbH: www.ifeu.de bzw. www.ifu.com
Umberto® des Ifeu (Institut für Energie- und Umweltforschung, Heidelberg) und Ifu(Institut für Umweltinformatik, Hamburg): www.gabi-software.com
52

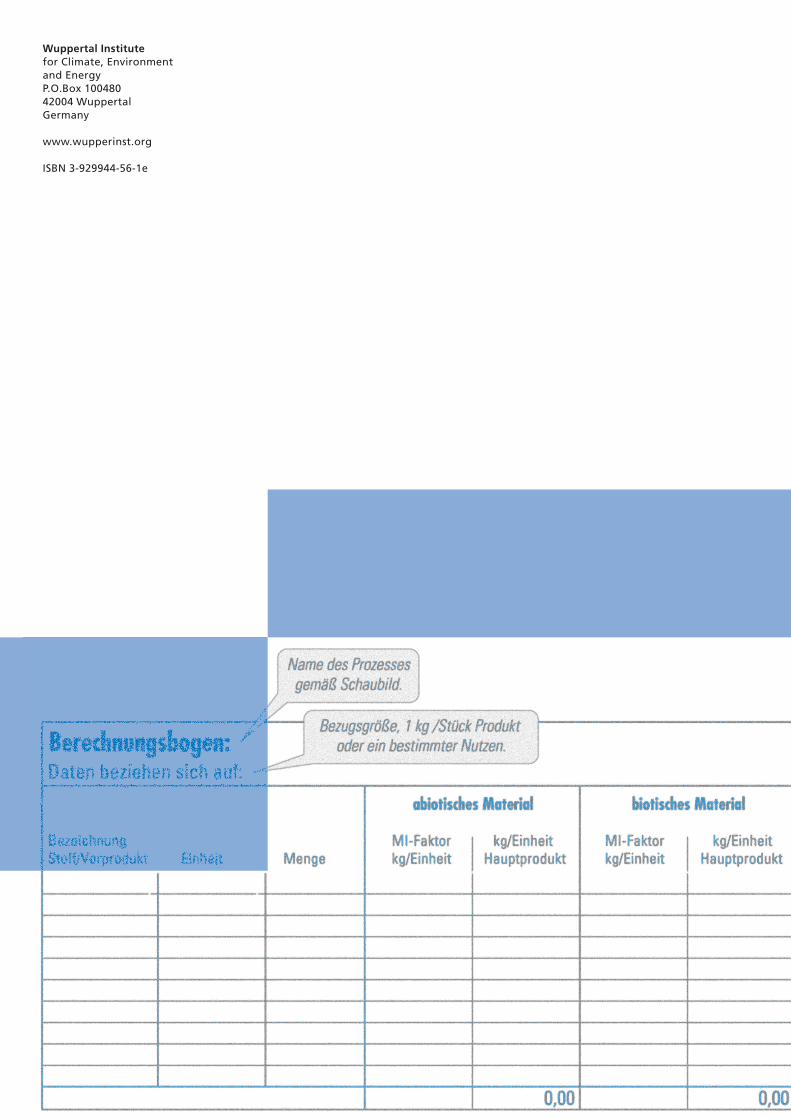
Wuppertal Institute for Climate, Environmentand EnergyP.O.Box 10048042004 WuppertalGermany
www.wupperinst.org
ISBN 3-929944-56-1e