Embed Size (px)
Citation preview

Research Collection
Doctoral Thesis
Personalized drug dosing through modeling and feedback
Author(s): Caruso, Antonello L. G.
Publication Date: 2009
Permanent Link: https://doi.org/10.3929/ethz-a-006005960
Rights / License: In Copyright - Non-Commercial Use Permitted
This page was generated automatically upon download from the ETH Zurich Research Collection. For moreinformation please consult the Terms of use.
ETH Library

Diss. ETH No. 18819
Personalized drug dosingthrough modeling and feedback
A dissertation submitted to
ETH ZURICH
for the degree of
DOCTOR OF SCIENCES
presented by
ANTONELLO L. G. CARUSO
M.Eng. Biomedical Engineering
Politecnico di Milano
born 25.04.1981
citizen of Italy
accepted on the recommendation of
Prof. Dr. Manfred Morari, examiner
Priv.-Doz. Thomas Bouillon, co-examiner
Zurich 2009

© 2009
Antonello Caruso
All rights reserved
ISBN 978-3-909386-30-7

Da chimico un giorno avevo il potere
di sposare gli elementi e farli reagire,
ma gli uomini mai mi riuscı di capire
perche si combinassero attraverso l’amore
affidando ad un gioco la gioia e il dolore.
Fabrizio De Andre
Un chimico
Non al denaro, non all’amore ne al cielo (1971)

6

Acknowledgements
A most sincere thank you to Prof. Manfred Morari for giving me the opportunity to
join his group and for his continued support throughout my Master’s thesis project,
Ph.D. and Post-doc. His leadership and charisma have been a great example and
influence.
Thank you to Priv.-Doz. Thomas Bouillon for being a trusted and enlightening
research partner. Thank you for having almost always an answer and very often a
question.
Thank you to all the people I collaborated with at the University Hospital Bern,
SenTec AG, the Medical University of Vienna, and the SMS Lab at D-MAVT:
Peter, Martin, Michele, Gorazd, Volker, Pascal, Andreas, Urs, Jurg, Gisela, Daniel
and Alexander. I share with them the success of this work.
Thank you to the undergraduate students who I worked with and supervised
during my Ph.D.: Philip, Urs, Stephanie and Arthur. The projects were improbable
and refreshing and fun!
I am extremely grateful to the superb institution that is the ETH for all the
opportunities it has offered me. It’s been a great ride and I am proud to become
an ETH Alumnus. Thank you to the administrative staff at IfA: Martine, Alice,
Martha, Katerina, Esther, and Danielle for their precious support during my stay
at IfA.
Thank you to all the people I met at IfA and in general during my work at the
ETH. I learnt a lot from you and I am happy we shared a number of experiences.
Thanks to Eleonora and Valentina for paving the way and for always answering
my questions. Thanks to Frank for being my Virgil in Zurich. Thanks to Colin
for the good times we shared at work and at home. Cristian: han pasado cuatro
anos y estamos en la recta final. I will always treasure the memories. Eres un
amigazo, te mereces... 5000 Superpunkte! Thanks to everybody for the friendship,
the uncountable coffee breaks and the discussions that usually ensued.
Grazie a Papa, Mamma ed Elisabetta per essere la mia famiglia, per esserci stati
e per esserci. Rivolgo un pensiero particolare ai nostri Nonni, purtroppo ci hanno
lasciato troppo presto. Gli sforzi per portare a termine questo lavoro sono dedicati
a loro.
i

ii

Abstract
The research work presented in this thesis discusses innovative strategies for the
delivery of personalized pharmacologic therapy through modeling and feedback
control. The objective is to enable medical practitioners to deliver drug therapies
with a higher standard of care, better outcomes and improved patient well being.
Individualizing dosing to the specific needs of each patient allows to adequately fulfil
the therapeutic requirements of the individual and prevent the risks and inefficacy
associated with over- and under-dosing.
In Chapter 1, the topic of personalized drug dosing is introduced in relation to
two clinical problems that are addressed in this thesis: the delivery of sedation and
the administration of antiplatelet therapy. Also, the structure of this document is
outlined.
Chapter 2 discusses the terminology and basic pharmacology concepts that are
extensively used throughout the thesis. The goal is to acquaint the reader with the
phenomena involved with drug disposition and action on the human body and the
mathematical models that have been proposed to describe them.
In Chapter 3, the problem of anesthetic dosing for the delivery of sedation and
analgesia is addressed. The pronounced interindividual variability in drug sensitiv-
ity and the changing surgical stimulus require to continuously evaluate the pharma-
cologic effects and personalize anesthetic delivery. Titration to effect is used in the
clinical practice to optimize the desired effects (analgesia, sedation and anxiolisys)
and minimize the extent of the adverse effects (cardiorespiratory depression). In
this thesis, a novel dosing paradigm for the safe and effective delivery of personal-
ized sedation is proposed. A respiratory model is used as a patient simulator for
the design of the feedback control dosing strategy and to test the feasibility of the
proposed anesthetic paradigm.
Chapter 4 is focused on antiplatelet therapy and the modeling of anticoagulant
effects. Optimal platelet inhibition is based on maximizing antithrombotic proper-
ties while minimizing bleeding risk, and it is critically dependent on the assessment
of the individual sensitivity to the drugs. The objective of the work is to provide
a quantitative description of anticoagulant effects and to formulate dosing recom-
mendations in the individual. The study also yields experimental validation for
iii

iv
a novel model of pharmacodynamic interactions that combines therapeutic and
adverse effects into a comprehensive framework for analysis of drug usefulness.
The main achievements of the research work discussed in this thesis are sum-
marized in Chapter 5, as well as the potential areas for improvement and further
investigation.
In Appendices A, B, and C three clinical study protocols addressing further
instances of therapy individualization are included. These clinical trials have been
planned, prepared, and initiated, however final results are regrettably not available
at the time of writing. The aim is to provide the reader with a more comprehensive
insight into the range of projects directed at personalizing drug delivery that were
undertaken within the scope of the PhD work.

Sommario
In questa tesi vengono presentate e discusse nuove strategie volte alla somminis-
trazione di terapie farmacologiche personalizzate attraverso l’utilizzo di tecniche
di modellazione e di controllo automatico in retroazione. L’obiettivo e quello di
fornire agli operatori medici strumenti innovativi per formulare terapie farmaco-
logiche caratterizzate da migliori risultati clinici e aumento del benessere dei pazi-
enti. La personalizzazione del dosaggio in base alle specifiche caratteristiche di ogni
paziente consente di rispondere alle necessita terapeutiche individuali e di prevenire
i rischi e l’inefficacia associati a casi di sovra- e sottodosaggio.
Nel Capitolo 1, il tema del dosaggio farmacologico personalizzato e introdotto in
relazione a due problemi clinici affrontati in questa tesi: la somministrazione della
sedazione cosciente e la somministrazione di terapie anticoagulative. Viene inoltre
illustrata la struttura di questo documento.
Nel Capitolo 2 si discute la terminologia ed i concetti farmacologici chiave che
sono utilizzati nella tesi. Lo scopo e quello di familiarizzare il lettore con i fenomeni
di distribuzione ed azione dei farmaci sul corpo umano, e con i modelli matematici
che sono stati proposti nella letteratura per descriverli.
Nel Capitolo 3 si affronta il problema del dosaggio di anestetici per la sommin-
istrazione della sedazione cosciente. La notevole variabilita interindividuale nella
sensibilita ai farmaci, nonche i continui cambiamenti della stimolazione intraopera-
toria, richiedono di valutare continuamente gli effetti farmacologici e di adeguare il
dosaggio dell’anestetico. Tale regolazione del dosaggio viene effettuata nella prat-
ica clinica per ottimizzare gli effetti terapeutici desiderati (analgesia, sedazione
ed ansiolisi) e minimizzare gli effetti indesiderati (depressione cardiorespiratoria).
In questa tesi viene presentato un nuovo paradigma di dosaggio per la somminis-
trazione personalizzata della sedazione in maniera sicura ed efficace. Un modello
respiratorio e utilizzato come simulatore per la progettazione della strategia di con-
trollo in retroazione utilizzata per regolare il dosaggio, e per testare la validita del
paradigma anestetico qui proposto.
Il Capitolo 4 e focalizzato sulla terapia anticoagulativa e sulla modellazione degli
effetti farmacologici degli anticoagulanti. L’inibizione piastrinica ottimale si basa
sulla massimizzazione delle proprieta antitrombotiche e sulla contemporanea min-
v

vi
imizzazione del rischio emorragico. Essa dipende in maniera cruciale dalla valu-
tazione della sensibilita individuale ai farmaci. L’obiettivo di questo lavoro e quello
di fornire una descrizione quantitativa degli effetti degli anticoagulanti e di per-
mettere la formulazione di raccomandazioni per il dosaggio individualizzato. Lo
studio costituisce anche una validazione sperimentale di un modello innovativo di
interazione farmacodinamica che unifica gli effetti farmacologi desiderati e quelli in-
desiderati in un’unica piattaforma per l’analisi dell’efficacia ed utilita del farmaco.
I principali contributi del lavoro di ricerca discusso in questa tesi sono riassunti
nel Capitolo 5, in cui si commenta inoltre sulle potenziali future aree di ricerca e
sperimentazione.
Nelle Appendici A, B e C sono riportati tre protocolli di studi clinici che af-
frontano ulteriori problemi di personalizzazione di terapie mediche. Tali studi clinici
sono stati ideati, preparati ed iniziati nel corso del dottorato, tuttavia alla stesura
di questo documento i risultati finali non sono purtroppo disponibili. L’obiettivo
e quello di fornire al lettore una visione piu completa dei progetti che sono stati
svolti nel corso del dottorato, aventi in comune l’obiettivo di consentire e facilitare
l’individualizzazione delle terapie farmacologiche.

Contents
1 Introduction 1
1.1 Personalized drug therapy . . . . . . . . . . . . . . . . . . . . . . . . . 2
1.2 Feedback control of sedation . . . . . . . . . . . . . . . . . . . . . . . . 2
1.3 Pharmacodynamic modeling for antiplatelet therapy . . . . . . . . . 6
1.4 Further research projects . . . . . . . . . . . . . . . . . . . . . . . . . . 8
2 Concepts and methods 9
2.1 Introduction . . . . . . . . . . . . . . . . . . . . . . . . . . . . . . . . . . 10
2.2 Pharmacokinetic modeling . . . . . . . . . . . . . . . . . . . . . . . . . 10
2.2.1 Compartmental models . . . . . . . . . . . . . . . . . . . . . . . 11
2.2.2 Physiology based models . . . . . . . . . . . . . . . . . . . . . . 13
2.3 Pharmacodynamic modeling . . . . . . . . . . . . . . . . . . . . . . . . 17
2.3.1 The relationship between plasma concentration and pharma-
cological effect . . . . . . . . . . . . . . . . . . . . . . . . . . . . 18
2.3.2 The effect compartment . . . . . . . . . . . . . . . . . . . . . . 19
2.3.3 Pharmacodynamic variability . . . . . . . . . . . . . . . . . . . 23
3 Feedback control of sedation 25
3.1 Introduction . . . . . . . . . . . . . . . . . . . . . . . . . . . . . . . . . . 26
3.1.1 Anesthesia . . . . . . . . . . . . . . . . . . . . . . . . . . . . . . 26
3.1.2 Conscious sedation . . . . . . . . . . . . . . . . . . . . . . . . . 28
3.1.3 Automatic control in anesthesia . . . . . . . . . . . . . . . . . 30
3.1.4 Problem formulation . . . . . . . . . . . . . . . . . . . . . . . . 32
3.1.5 Aim of the work . . . . . . . . . . . . . . . . . . . . . . . . . . . 33
3.1.6 Chapter content . . . . . . . . . . . . . . . . . . . . . . . . . . . 33
3.2 Background . . . . . . . . . . . . . . . . . . . . . . . . . . . . . . . . . . 34
3.2.1 Ventilatory regulation in the human body . . . . . . . . . . . 34
3.2.2 State of the art in respiratory modeling . . . . . . . . . . . . . 37
3.3 Respiratory model structure . . . . . . . . . . . . . . . . . . . . . . . . 38
3.3.1 Compartmental gas exchange system . . . . . . . . . . . . . . 38
3.3.2 Cardiovascular regulation . . . . . . . . . . . . . . . . . . . . . 43
vii

viii Contents
3.3.3 Ventilatory regulation . . . . . . . . . . . . . . . . . . . . . . . 46
3.3.4 Ventilatory regulation in the presence of an opioid . . . . . . 52
3.4 Model analysis . . . . . . . . . . . . . . . . . . . . . . . . . . . . . . . . 58
3.4.1 Assessment of the gas exchange system . . . . . . . . . . . . . 58
3.4.2 Response of the ventilatory control system in the absence of
drug . . . . . . . . . . . . . . . . . . . . . . . . . . . . . . . . . . 61
3.4.3 Ventilatory depressant effect of the opioid . . . . . . . . . . . 70
3.5 Proposed model improvements . . . . . . . . . . . . . . . . . . . . . . . 74
3.5.1 Blood dissociation curves . . . . . . . . . . . . . . . . . . . . . 75
3.5.2 Transcutaneous PCO2 sensing . . . . . . . . . . . . . . . . . . 76
3.5.3 Drug naıve ventilatory regulation . . . . . . . . . . . . . . . . . 76
3.5.4 Pharmacodynamic modeling . . . . . . . . . . . . . . . . . . . . 81
3.5.5 Opioid induced respiratory depression . . . . . . . . . . . . . . 83
3.5.6 Results discussion . . . . . . . . . . . . . . . . . . . . . . . . . . 88
3.6 Proportional-integral control for remifentanil sedation . . . . . . . . . 89
3.6.1 Control design . . . . . . . . . . . . . . . . . . . . . . . . . . . . 89
3.6.2 State estimation . . . . . . . . . . . . . . . . . . . . . . . . . . . 90
3.6.3 Closed loop delivery of remifentanil sedation . . . . . . . . . . 90
3.6.4 Results discussion . . . . . . . . . . . . . . . . . . . . . . . . . . 91
3.7 Parsimonious modeling of ventilatory regulation . . . . . . . . . . . . 93
3.7.1 Introduction . . . . . . . . . . . . . . . . . . . . . . . . . . . . . 93
3.7.2 Model of the controlled system . . . . . . . . . . . . . . . . . . 94
3.7.3 Ventilatory response to O2 and CO2 . . . . . . . . . . . . . . . 96
3.7.4 Pharmacodynamic modeling . . . . . . . . . . . . . . . . . . . . 98
3.7.5 Opioid induced ventilatory depression . . . . . . . . . . . . . . 99
3.7.6 Results discussion . . . . . . . . . . . . . . . . . . . . . . . . . . 100
3.8 Parsimonious modeling of the metabolic system . . . . . . . . . . . . 103
3.8.1 Introduction . . . . . . . . . . . . . . . . . . . . . . . . . . . . . 103
3.8.2 Model of the controlled system . . . . . . . . . . . . . . . . . . 105
3.8.3 Ventilatory response to O2 and CO2 . . . . . . . . . . . . . . . 106
3.8.4 Pharmacokinetic analysis . . . . . . . . . . . . . . . . . . . . . 106
3.8.5 Effect compartment modeling . . . . . . . . . . . . . . . . . . . 109
3.8.6 Pharmacodynamic modeling . . . . . . . . . . . . . . . . . . . . 109
3.8.7 Alfentanil induced ventilatory depression . . . . . . . . . . . . 110
3.8.8 Results discussion . . . . . . . . . . . . . . . . . . . . . . . . . . 111
3.9 Model predictive control for propofol sedation . . . . . . . . . . . . . 112
3.9.1 Control design . . . . . . . . . . . . . . . . . . . . . . . . . . . . 112
3.9.2 Closed loop delivery of propofol sedation . . . . . . . . . . . . 116

Contents ix
3.9.3 Results discussion . . . . . . . . . . . . . . . . . . . . . . . . . . 117
3.10 Clinical investigation: respiratory depression during propofol seda-
tion in colonoscopy patients . . . . . . . . . . . . . . . . . . . . . . . . 117
3.10.1 Study investigators . . . . . . . . . . . . . . . . . . . . . . . . . 117
3.10.2 Introduction . . . . . . . . . . . . . . . . . . . . . . . . . . . . . 118
3.10.3 Background . . . . . . . . . . . . . . . . . . . . . . . . . . . . . . 118
3.10.4 Study methodology . . . . . . . . . . . . . . . . . . . . . . . . . 120
3.11 Sedation delivery system prototype . . . . . . . . . . . . . . . . . . . . 122
3.11.1 System setup . . . . . . . . . . . . . . . . . . . . . . . . . . . . . 122
3.11.2 Device drivers . . . . . . . . . . . . . . . . . . . . . . . . . . . . 124
3.11.3 Supervisory module . . . . . . . . . . . . . . . . . . . . . . . . . 126
3.11.4 Graphical user interfaces . . . . . . . . . . . . . . . . . . . . . . 145
3.12 Preliminary clinical study results . . . . . . . . . . . . . . . . . . . . . 145
3.12.1 Experimental findings . . . . . . . . . . . . . . . . . . . . . . . . 145
3.12.2 Preliminary results discussion . . . . . . . . . . . . . . . . . . . 146
4 Pharmacodynamic modeling for antiplatelet therapy 149
4.1 Introduction . . . . . . . . . . . . . . . . . . . . . . . . . . . . . . . . . . 150
4.1.1 Antiplatelet therapy . . . . . . . . . . . . . . . . . . . . . . . . 150
4.1.2 Problem formulation . . . . . . . . . . . . . . . . . . . . . . . . 150
4.1.3 Aim of the work . . . . . . . . . . . . . . . . . . . . . . . . . . . 151
4.1.4 Chapter content . . . . . . . . . . . . . . . . . . . . . . . . . . . 151
4.2 Pharmacodynamic interaction and global outcome model . . . . . . . 152
4.3 Clinical investigation: anticoagulant pharmacodynamic interaction
modeling . . . . . . . . . . . . . . . . . . . . . . . . . . . . . . . . . . . . 155
4.3.1 Study investigators . . . . . . . . . . . . . . . . . . . . . . . . . 155
4.3.2 Study methodology . . . . . . . . . . . . . . . . . . . . . . . . . 155
4.4 Parameter estimation for antiplatelet therapy data . . . . . . . . . . 158
4.5 Experimental results and model estimation . . . . . . . . . . . . . . . 159
4.6 Results discussion . . . . . . . . . . . . . . . . . . . . . . . . . . . . . . 171
5 Main achievements and outlook 175
5.1 Feedback control of sedation . . . . . . . . . . . . . . . . . . . . . . . . 176
5.2 Pharmacodynamic modeling for antiplatelet therapy . . . . . . . . . 178
A Clinical investigation: antagonism of remifentanil induced respi-
ratory depression by postoperative pain 181
A.1 Study investigators . . . . . . . . . . . . . . . . . . . . . . . . . . . . . . 182
A.2 Introduction . . . . . . . . . . . . . . . . . . . . . . . . . . . . . . . . . . 182

x Contents
A.3 Study aims . . . . . . . . . . . . . . . . . . . . . . . . . . . . . . . . . . 183
A.4 Study design . . . . . . . . . . . . . . . . . . . . . . . . . . . . . . . . . 184
A.5 Study methodology . . . . . . . . . . . . . . . . . . . . . . . . . . . . . 184
A.5.1 Patient population . . . . . . . . . . . . . . . . . . . . . . . . . 184
A.5.2 Study plan . . . . . . . . . . . . . . . . . . . . . . . . . . . . . . 184
A.5.3 Model building . . . . . . . . . . . . . . . . . . . . . . . . . . . . 189
A.5.4 Measurement of remifentanil plasma concentrations . . . . . . 191
A.5.5 Sample size calculation and statistics . . . . . . . . . . . . . . 191
A.6 Ethical aspects . . . . . . . . . . . . . . . . . . . . . . . . . . . . . . . . 192
B Clinical investigation: determining the optimal drug regimen in
individual patients with chronic pain 195
B.1 Study investigators . . . . . . . . . . . . . . . . . . . . . . . . . . . . . . 196
B.2 Introduction . . . . . . . . . . . . . . . . . . . . . . . . . . . . . . . . . . 196
B.3 Study design . . . . . . . . . . . . . . . . . . . . . . . . . . . . . . . . . 197
B.4 Study methodology . . . . . . . . . . . . . . . . . . . . . . . . . . . . . 198
B.4.1 Drugs used . . . . . . . . . . . . . . . . . . . . . . . . . . . . . . 198
B.4.2 Patient population . . . . . . . . . . . . . . . . . . . . . . . . . 199
B.4.3 Study plan . . . . . . . . . . . . . . . . . . . . . . . . . . . . . . 199
B.4.4 Optimization procedure . . . . . . . . . . . . . . . . . . . . . . 200
B.4.5 Data collection . . . . . . . . . . . . . . . . . . . . . . . . . . . . 201
B.4.6 Sample size calculation and statistics . . . . . . . . . . . . . . 201
B.5 Ethical aspects . . . . . . . . . . . . . . . . . . . . . . . . . . . . . . . . 202
B.6 Expected benefits . . . . . . . . . . . . . . . . . . . . . . . . . . . . . . 202
B.7 Subprotocol: Time profile of side effects caused by oxycodone, pre-
gabalin and amitriptyline . . . . . . . . . . . . . . . . . . . . . . . . . . 203
B.7.1 Background . . . . . . . . . . . . . . . . . . . . . . . . . . . . . . 203
B.7.2 Study aims . . . . . . . . . . . . . . . . . . . . . . . . . . . . . . 203
B.7.3 Study methodology . . . . . . . . . . . . . . . . . . . . . . . . . 203
C Clinical investigation: a novel procedure for provocation discogra-
phy 207
C.1 Study investigators . . . . . . . . . . . . . . . . . . . . . . . . . . . . . . 208
C.2 Introduction . . . . . . . . . . . . . . . . . . . . . . . . . . . . . . . . . . 208
C.3 Study aims . . . . . . . . . . . . . . . . . . . . . . . . . . . . . . . . . . 210
C.4 Market background . . . . . . . . . . . . . . . . . . . . . . . . . . . . . 211
C.5 Solution proposal . . . . . . . . . . . . . . . . . . . . . . . . . . . . . . . 211
C.6 Bench testing . . . . . . . . . . . . . . . . . . . . . . . . . . . . . . . . . 212

Contents xi
C.7 Study design . . . . . . . . . . . . . . . . . . . . . . . . . . . . . . . . . 212
C.8 Study methodology . . . . . . . . . . . . . . . . . . . . . . . . . . . . . 212
C.8.1 Patient population . . . . . . . . . . . . . . . . . . . . . . . . . 212
C.8.2 Study plan . . . . . . . . . . . . . . . . . . . . . . . . . . . . . . 212
C.8.3 Feasibility and applicability of the automatic system . . . . . 214
C.8.4 Pressure pain threshold . . . . . . . . . . . . . . . . . . . . . . . 215
C.8.5 Further assessments . . . . . . . . . . . . . . . . . . . . . . . . . 216
C.9 Time schedule . . . . . . . . . . . . . . . . . . . . . . . . . . . . . . . . . 216
C.10 Data analysis . . . . . . . . . . . . . . . . . . . . . . . . . . . . . . . . . 216
C.10.1 Main aim . . . . . . . . . . . . . . . . . . . . . . . . . . . . . . . 216
C.10.2 Secondary aim . . . . . . . . . . . . . . . . . . . . . . . . . . . . 217
C.11 Ethical aspects . . . . . . . . . . . . . . . . . . . . . . . . . . . . . . . . 218
C.12 Expected benefits . . . . . . . . . . . . . . . . . . . . . . . . . . . . . . 218
Bibliography 219
Curriculum Vitae 239

xii Contents

1
Introduction

2 1 Introduction
1.1 Personalized drug therapy
The quantitative analysis of the interactions between drugs and biological sys-
tems has received considerable attention over the last decades. The biomedical
community at large and medical researchers in particular, the medical technology
and pharmaceutical industry have devoted substantial resources to investigate this
topic. The rationale is that quantifying drug, physiology, disease, and trial infor-
mation is believed to determine improvements in clinical outcomes and support
efficient drug development and regulatory decisions. The use of modeling, iden-
tification, optimization, and automatic control methods and tools is increasingly
permeating the process of drug development as well as clinical practice. Individ-
ualizing drug therapy is one of the most exciting and promising outcomes that
researchers are striving to achieve in a vast number of applications.
Over the past 15 years, the Automatic Control Laboratory at the ETH Zurich
(Prof. Manfred Morari, D-ITET) has been an active player in this field with the
collaboration of several industrial and academic research partners: the University
Hospital Bern, the Vienna Medical University, Drager Medical AG, and SenTec
AG, amongst others.
Successful research work performed at the Institute include the following projects.
Gentilini and coworkers in 2001 proposed an automatic control scheme based on
the Bispectral Index (BIS, Aspect Medical Systems, MA, USA) for the delivery
of hypnosis with isoflurane. In 2003, Stadler and collaborators designed a model-
based closed-loop controller performing neuromuscular blockade with mivacurium.
In 2006 Zanderigo, Sartori and coworkers proposed a novel drug interaction model
combining positive and negative effects into a general drug utility framework.
This doctoral thesis continues and expands the work in the research areas of
pharmacological modeling and control with the objective to propose novel tech-
niques for achieving personalized drug dosing. In the following chapters we will
focus on two main research topics: the application of automatic control techniques
for the delivery of sedation and the clinical validation of novel pharmacodynamic
interaction models for antithrombotic therapy.
1.2 Feedback control of sedation
Sedation techniques are used to provide analgesia and reduce anxiety during diag-
nostic and minor surgical procedures such as endoscopy, bronchoscopy, extracor-
poreal shockwave lithotripsy and wounds/burns debridement [163]. Sedation and
analgesia is defined as a medically controlled state of depressed consciousness that

1.2 Feedback control of sedation 3
allows protective reflexes (cardiorespiratory control) to be maintained. The mod-
erate depression of consciousness is intended to facilitate the performance of the
medical procedure while ensuring patient comfort and cooperation. The sedated
patient retains the ability to breathe autonomously and to protect his airways; de-
pending on the depth of sedation, he can respond to verbal commands and tactile
stimulation with different degrees of purposefulness [84].
Drugs used for sedation are propofol, benzodiazepines or opioids, all of which
are respiratory depressants. The magnitude of this effect depends on dosing his-
tory (rate of administration, cumulation, coadministration of other drugs) and in-
dividual sensitivity to the drug(s). Drug combinations, high doses and/or rapid
administration rates can dangerously blunt the respiratory drive and lead to seri-
ous cardiorespiratory depression in both adults and children [7, 48, 90]. Hypoxia,
potentially progressing towards cardiocirculatory arrest is the most feared conse-
quence. Oxygenation is usually supported via provision of supplemental oxygen.
However, sufficient oxygenation does not imply adequate ventilation and therefore
hypercarbia and respiratory acidosis may still develop.
Serious injuries and cardiorespiratory events associated with drug overdosing dur-
ing sedation have significant social and economic repercussions. A recent survey
of surgical anesthesia malpractice claims over the years 1990-2002 concluded that
monitored anesthesia care has the highest proportion of claims for death/permanent
brain damage (sedation: 41%; general anesthesia: 37%; regional anesthesia: 21%)
and the highest median payment to the plaintiff (sedation: 159 kUSD; GA: 140
kUSD; RA: 127 kUSD) [19]. The survey identified oversedation leading to respi-
ratory depression as the main mechanism of patient injuries during sedation and
suggested improved monitoring through capnography and vigilance to reduce mor-
bidity.
The pronounced interindividual variability of drug sensitivity and the changing
surgical stimulus mandate the continuous evaluation of the pharmacologic effects
and the individualization of drug delivery. The goal is to optimize the desired effects
(i.e., analgesia, sedation and reduction of anxiety and agitation) while minimizing
the occurrence of adverse effects (cardiorespiratory depression) [42]. Titration to
effect is compounded by the lack of a preemptive indicator of analgesia and seda-
tion. In fact, the therapeutic effects are difficult to quantify; analgesia, for instance,
can only be assessed after the patient has been exposed to a noxious stimulus. It
has been suggested to use EEG-derived indicators such as the BIS to provide a
continuous measurement of the desired effects, however, EEG-derived parameters
display pronounced fluctuations in moderately sedated patients and are insensitive
to opioids in the therapeutic concentration range [62, 106, 118]. Clinical sedation

4 1 Introduction
scales (e.g. the VAS scale, the OASS scale) are user-dependent classifications and
are not automated. End-expiratory capnography delivers false low readings during
shallow breathing and partial airway obstruction and it is difficult to assess without
a tight fitting, low dead-space mask. A simple, objective and robust measure of
the therapeutic effects is therefore not available [189]. Titration to side effect as an
alternative dosing paradigm so far suffered from the lack of a fast and artifact re-
sistant sensor for respiratory depression. Apnea is not rapidly detected by sedation
providers without continuous monitoring of CO2 [175]. Recognition of apnea or
hypoventilation in patients who receive supplemental oxygen may also be delayed
if oxygen saturation (SpO2) alone is monitored [61].
In Chapter 3 we will advocate the combined use of transcutaneous CO2 tension
(PtcCO2) and SpO2 for respiratory monitoring during sedation. The reliability
of PtcCO2 readings is independent of airway status and pulse oximetry provides
information on the adequacy of peripheral oxygenation. A device combining tran-
scutaneous CO2 and SpO2 sensing has been recently introduced into anesthetic
practice. Its favorable dynamic properties (time constant of PtcCO2 sensor =
0.67 min) enable it to detect the onset of apnea significantly faster than pulse
oximetry alone [94, 170, 113, 141]. Beyond serving as a monitor for patient safety,
such a device could also provide an objective, continuously accessible and ther-
apeutically meaningful surrogate endpoint for the automatic titration of opioids
and propofol during sedation. In fact, the desired and undesired effects are medi-
ated by the same receptors, therefore drug induced respiratory depression always
correlates with analgosedation, and viceversa [137] (with the exception of opioid
tolerant subjects, for whom this remains to be established). Mu receptors in the
brainstem and the thalamus mediate both the analgesic and the respiratory depres-
sant effect of highly potent opioids [53,153] so that the two effects share important
pharmacodynamic characteristics [56] and exhibit similar plasma-effect site equili-
bration properties [85,10]. Benzodiazepines and propofol exert their sedative effect
at gamma-aminobutyric acid (GABA) receptors, that have also been shown to in-
duce respiratory inhibition [153]. Since the concentration-effect relationships for
the desired and undesired effect are similar, we believe that deliberately targeting
moderate levels of hypercapnia is a viable approach for sedation. The degree of hy-
percapnia can be selected by the care provider within a safe range (45-60 mmHg)
and serves as the setpoint of a feedback infusion system. Such a system would both
simplify the titration task and protect against lapses caused by lack of vigilance in
a highly dynamic environment.
This novel dosing paradigm for delivery of sedation is discussed further in Chap-
ter 3. The aim of the project is to implement the proposed paradigm into a feedback
1.2 Feedback control of sedation 5
control system, that is, to design a system for the automatic delivery of monitored
anesthesia care based on transcutaneous SpO2 and CO2 monitoring. The system
should achieve and maintain drug concentrations corresponding to adequate seda-
tion and analgesia, avoiding marked respiratory depression. The project is based
on the completion of the following tasks:
a. Develop a comprehensive model of human respiratory control that can repli-
cate experimental ventilatory responses to O2 and CO2 challenges.
b. Integrate the ventilatory model with the pharmacokinetics (PK) and pharma-
codynamics (PD) of the drug, specifically to achieve a suitable quantitative
description of the respiratory depressant effect of the anesthetic (= virtual
patient).
c. Design a control strategy for the automatic performance of sedation that
individualizes drug delivery, manages surgical stimulation, and prevents the
occurrence of severe respiratory depression.
d. Analyze the performance of the system adopting the virtual patient as a
substrate for simulations.
e. Implement the proposed paradigm into a control software system interfaced
to the commercially available PtcCO2 sensor and syringe pump for real time
sensing and calculation of dosing in human subjects.
f. Plan and perform clinical experiments at the University Hospital in Bern
to validate the dosing paradigm and test the feedback control drug delivery
system.
Chapter 3 is largely based on:
[36] A. Caruso, T. Bouillon, P.M. Schumacher, E. Zanderigo and M. Morari:
Control of drug administration during Monitored Anesthesia Care. IEEE
Transactions on Automation Science and Engineering 2006, Special Issue on
Drug Delivery Automation, 6:256-264.
[37] A. Caruso, and M. Morari: Model predictive control for propofol sedation.
Proceedings of the World Congress on Medical Physics and Biomedical En-
gineering, Munich, Germany, 2009.

6 1 Introduction
[94] V. Hartwich, P. M. Schumacher, A. Caruso and M. Luginbuhl: Dynamical
properties of a new transcutaneous carbon dioxide sensor. Proceedings of the
American Society of Anesthesiologists Annual Meeting, New Orleans, LA,
USA, 2009.
[35] A. Caruso, T. Bouillon, P.M. Schumacher and M. Morari: On the modeling
of drug induced respiratory depression in the non-steady-state. Proceedings of
the IEEE Engineering in Medicine and Biology Society Annual International
Conference, Vancouver, Canada, 2008.
[34] A. Caruso, T. Bouillon, P.M. Schumacher, M. Luginbuhl and M. Morari:
Drug-induced respiratory depression: an integrated model of drug effects on
the hypercapnic and hypoxic drive. Proceedings of the IEEE Engineering in
Medicine and Biology Society Annual International Conference, Lyon, France,
2007.
[208] E. Zanderigo, A. Caruso, T. Bouillon, M. Luginbuhl and M. Morari: Phar-
macodynamic modeling of drug-induced ventilatory depression and automatic
drug dosing in conscious sedation. Proceedings of the IEEE Engineering in
Medicine and Biology Society Annual International Conference, New York
City, NY, USA, 2006.
[29] T. Bouillon, A. Caruso, M. Luginbuhl, M. Morari, P.M. Schumacher and E.
Zanderigo: A system for controlling administration of anaesthesia. Patent
granted, 2006. Assignee: Universitat Bern and ETH Zurich. Priority date:
2006-06-21 (EP 20060102702). Publication number: WO 2007147505.
1.3 Pharmacodynamic modeling for antiplatelet
therapy
Platelet activation and aggregation play a pivotal role in cardiovascular disease,
triggering adverse events such as acute coronary syndrome and stroke. Inhibition
of platelet aggregation is therefore a primary therapeutic objective [58].
The goals of antiplatelet therapy are to attenuate platelet activation and ag-
gregation, prevent occlusive thrombus formation, arrest procoagulant activity and
inflammation, promote platelet disaggregation, and facilitate perfusion. Optimal
platelet inhibition is based on maximizing antithrombotic properties while minimiz-
ing bleeding risk, and it is critically dependent on the assessment of individual pa-
tient risk [24]. However, current practice guidelines are based mainly on large-scale

1.3 Pharmacodynamic modeling for antiplatelet therapy 7
trials that have been conducted without an evaluation of the antiplatelet response
in individual patients [110, 156]. The data available from translational research
studies strongly indicate that the present “one-size-fits-all” antiplatelet strategy is
flawed [91, 130]. At one end of the spectrum, selected patients with excessively
low platelet reactivity may bleed, whereas patients with high platelet reactivity
may have ischemic events. Determining a therapeutic target of optimal platelet
reactivity associated with reduced thrombotic risk and bleeding events remains an
elusive goal [91]. In the future, it is foreseeable that optimal antiplatelet therapy
will involve an objective assessment of the individual thrombotic potential based
on the measurement of platelet function. Subsequent treatment of each patient
will be directed by laboratory measurements to ensure an appropriate therapeutic
response.
In Chapter 4 we will characterize the concentration-effect surface for the combi-
nation of two anticoagulants (iloprost and MeSAMP) in vitro. A model recently
proposed by two Institute alumni will be used to investigate the global effect of
therapeutic regimens on the patient’s well being [208]. Said model combines de-
sired effects (such as the inhibition of platelet aggregation) and undesired effects
(like the risk of bleeding) into one comprehensive framework for analysis of drug
usefulness.
The aim of the project is twofold. First, we want to validate the novel global
outcome model mentioned above through application to a relevant clinical question.
Second, we want to achieve recommendations for personalized antiplatelet therapy
based on the objective assessment of the individual thrombotic potential through
measurements of platelet function.
The project is based on the completion of the tasks listed below:
a. Investigate the dose-response relationship of two selected antiplatelet drugs
through laboratory measurements of platelet reactivity performed at the Med-
ical University of Vienna in a population of 15 human volunteers
b. Determine the type (additivity, synergism, or infra-additivity/antagonism)
and extent of pharmacodynamic interactions
c. Take both positive (therapeutic) pharmacologic effects and negative (unde-
sired) effects into account and combine them into a global framework evalu-
ating drug usefulness and drug regimen desirability
d. Find the optimal drug regimen in the individual
Chapter 4 is based on the following publications:

8 1 Introduction
[181] G. Sveticic, A. Caruso, G. Scharbert, M. Curatolo, S.A. Kozek-Langenecker
and M. Morari: Determining optimal drug regimen for antiplatelet therapy
using a novel drug interaction model. In preparation, to be submitted to
Anesthesiology, 2009.
[39] A. Caruso, G. Sveticic, G. Scharbert, S.A. Kozek-Langenecker, M. Curatolo
and M. Morari: Pharmacodynamic interaction modeling for optimal drug dos-
ing in antithrombotic therapy. Proceedings of the International Conference
on Drug Discovery and Therapy, Dubai, UAE, 2010.
[38] A. Caruso, G. Sveticic, G. Scharbert, S.A. Kozek-Langenecker, M. Curatolo
and M. Morari: Pharmacodynamic modeling and optimal drug regimen for
antiplatelet therapy. Proceedings of the International Society for Anaesthetic
Pharmacology Annual Meeting, New Orleans, LA, USA, 2009.
1.4 Further research projects
Biomedical research is an exciting frontier of human knowledge and desire for
progress. Regrettably, researchers in this area often have to face significant hurdles
in carrying out the experimental part of their work. Amongst the reasons imposing
such constraints we can mention the following: limited or insufficient resources in
terms of project funding, project support by the management, human skills, or
human time; low prevalence of the condition under investigation (which limits the
possibility to carry out experimental work and the general interest in the matter);
ethical issues restricting the type or extent of the experiments.
As a biomedical researcher, I have come to realize that the time necessary to
design, plan, perform, and report a clinical study is often comparable to the dura-
tion of a PhD program. Despite having been fortunate enough during my PhD to
meet and collaborate with brilliant and motivated scientists, several of the projects
I contributed to are not completed at the time of writing. The lack of final results
to be presented here, however, does not do justice to the amount of work and the
efforts that have been devoted to the realization of those projects. Therefore in
Appendices A, B, and C I include the study protocols of three incomplete clini-
cal trials I participated in the design of. The aim is to provide the reader with
a more comprehensive insight into the range of projects directed at personalizing
drug delivery that I have undertaken during my work at IfA.

2
Concepts and methods
10 2 Concepts and methods
2.1 Introduction
The aim of this chapter is to acquaint the reader with the terminology and basic
concepts of pharmacology that will be used in this thesis. An overview of the most
widespread modeling methodologies for drug distribution and action is provided.
The chapter deals primarily with pharmacokinetics and pharmacodynamics. Phar-
macokinetics characterizes the distribution and elimination of drugs by the body,
in particular the relationship between drug concentration and time. Pharmacody-
namics, on the other hand, describes the relationship between concentration and
response (or effect): it explains how the drug affects the body.
2.2 Pharmacokinetic modeling
Pharmacokinetics (PK) are identified on the basis of observed input-output data
sequences. A drug bolus is administered and the concentration time course is
measured by blood sampling. The infusion time of the bolus is usually neglected,
therefore the response of the physiological system can be regarded as an approx-
imation of the system impulse response [178]. For many drugs the time course
of plasma concentration following an intravenous bolus can be described (using
non-linear regression) by a n-exponential equation, as depicted in Figure 2.1. The
mathematical representation of the pharmacokinetic model is then a sum of ex-
ponentials [173]. Best-fit estimation of the equation constants provides a suitable
solution for pharmacokinetics.
This approach to the PK problem has its grounds in linear system theory, where
the input-output relationship of a linear, time-invariant system is wholly defined by
its impulse response. Therefore the underlying assumption is that the dose-plasma
drug concentration relationship is linear and time-invariant. In broad terms it im-
plies that the parameters of the PK model are constant. This is clearly not a fully
satisfactory representation of the phenomena that take place in a complex biolog-
ical system undergoing a major external influence, such as anesthesia in humans.
However, for modeling purposes this approach is fully adequate and justifiable.
The time course of drug disposition in the body can be described through a num-
ber of approaches. Figure 2.2 portrays a classification of pharmacokinetic models.
Three widespread approaches characterize drug distribution and elimination via:
- empirical models;
- compartmental mammillary models;

2.2 Pharmacokinetic modeling 11
C(t) = A ⋅ eα⋅t +B ⋅ eβ⋅t +C ⋅ eγ⋅t
Cp
Time after bolus
Figure 2.1: Plasma concentration following a drug bolus
- physiologically based models.
Empirical models are black box models relating input and output by means of an
analytical expression, such as the n-exponential function discussed above. Com-
partmental models are formulated on the basis of the minimum number of com-
partments that adequately fits the observed data. Physiologically based models
are the most realistic representation of drug kinetics, because the parameters relate
directly to physiology, to anatomy and to biochemistry [178]. Mammillary and
physiologically based models are further discussed in the following.
2.2.1 Compartmental models
Compartmental models represent a customary solution for pharmacokinetic mod-
eling. They are based on the assumption that different regions of the body can
be represented by virtual compartments disregarding the physical properties of the
described tissues. For the sake of example, a hypothetical three-compartment mam-
millary model is shown in Figure 2.3, where a central compartment is connected to
two peripheral compartments.
As mentioned above, the plasma concentration time course following a drug bo-
lus can be fitted by a n-exponential function. The pharmacokinetics problem then
commonly reduces to finding the constants of the exponentials with a curve-fitting

12 2 Concepts and methods
Models
Linear Non-linear
Time-variant Time-invariant
Empirical
Compartmental
Physiological
Figure 2.2: Taxonomy of pharmacokinetic models. Adapted from the literature
[193].
procedure. In the case of mammillary models, drug distribution to and from each
PK model compartment is usually considered a first order process [3, 173]. There-
fore, the solution consists in the identification of compartmental volumes and first
order rate constants. Estimating the parameters of a sufficient number of compart-
ments allows for the fitting of experimental data. The major advantage of mam-
millary models is that an adequate description of the concentration time course can
be achieved with a low level of complexity [178].
Strictly speaking, the compartments have no physiological meaning [178]. In
clinical literature the central compartment is often identified as the “plasma” com-
partment, given that the compartmental concentration is the plasma concentration,
Cp. However, the exponential equation should be regarded as the solution of the
differential equation describing the central compartment drug concentration that
results from a bolus injection into the n-compartment model. The central com-
partment concentration is calculated from the intake rate, the elimination rate,
the inflow and outflow compartmental rates, which are assigned to fit experimen-
tal observations. Therefore the identification of a compartment as a well-defined

2.2 Pharmacokinetic modeling 13
V1
V2V3
k13
k31 k21
k12
Bolus
k10
Figure 2.3: Diagram of a 3-compartment mammillary model. Vi is the volume of
the i-th compartment (i = 1,2,3); kij the drug distribution rate from
compartment i to compartment j (i, j = 1,2,3); k10 the drug elimination
rate from the central compartment.
physiological region represents a misconception of the problem.
2.2.2 Physiology based models
Physiology based pharmacokinetic models use actual physiological parameters such
as breathing rates, blood flow rates and tissue volumes to describe the pharmacoki-
netic process. These parameters are coupled with chemical-specific parameters like
blood/gas partition coefficients, tissue/blood partition coefficients and metabolic
constants to predict the dynamics of compound distribution in the physiological
system. An advantage of such models is that by simply using appropriate physio-
logical and biochemical parameters, the same model can be employed to describe
the dynamics of different drugs in different species [96].
The greatest potential of physiology based modeling is that it offers the possi-
bility of predicting physiological phenomena. A suitable pharmacodynamic model
can be coupled to the physiologically based pharmacokinetic model. The modeled

14 2 Concepts and methods
pharmacological effect can then influence drug pharmacokinetics via physiological
homeostatic mechanisms. This would be particularly useful for drugs that influence
cardiac output and regional blood flows, which in turn can affect drug distribution
and elimination [126].
Another advantage of physiology based over mammillary models is that elimi-
nation can be modeled as occurring in the tissue where it actually takes place in
the body [178]. Given that a mammillary model compartment does not represent a
clearly defined physiological region, it is not possible to model explicitly the renal
or hepatic clearance, for example.
On the other hand, a serious disadvantage of whole-body physiology based PK
models is their extensive dimensionality and complexity. Such drawbacks have
limited their use to date. Compromising between model descriptive properties
and computational complexity is a critical issue in physiologically based model
development. This approach should only be applied to cases where the potential
benefits justify the time and cost associated with its implementation [43].
A common approach to decrease the complexity of physiologically based pharma-
cokinetics is lumping suitable tissues within the structure of the model. Lumping
can be defined as a structural transformation of a complex physiological model to
obtain a simpler model with identical kinetic behavior. Proper lumping should
guarantee that no useful information about the kinetics of the underlying process
are lost [147].
Lumping of the whole-body model is an iterative procedure and is usually per-
formed in two ways:
- combining parallel tissues with identical specification and occupying identical
positions in the system so to form an aggregate tissue, in case they have
similar time constants (i.e., if they show similar kinetics);
- adjoining a serially connected tissue either to the compartment at its input
or to that at its output, or to both if they have small time constant (that is,
drug equilibration is rapid). See Figure 2.5 for an example of physiologically
based model lumping.
To date, mass transfer at the capillaries and mass diffusion within cells and inter-
stitial fluid are physical phenomena which are yet to be exhaustively appreciated.
Measured data are usually explained in terms of membrane permeability. Moreover,
there are two factors which can increase the modeling effort:
- active transport of solutes through biological membranes;

2.2 Pharmacokinetic modeling 15
Lungs
Heart
Brain
Muscles
Fat
Bone
Skin
Stomach
Pancreas
Spleen
Gut
Liver
Kidneys
Hepatic clearance
Renal clearance
Pulmonary shunt
Ven
ous
circ
ula
tion
Arterial
circulation
Figure 2.4: A possible whole-body physiologically based PK model. Adapted from
the literature [147].
- bulk fluid flow in the capillaries.
Both can be neglected for our purposes [20].
Modeling complexity for each tissue varies depending on the assumptions. Each
modeled tissue can have:
- a perfusion-limited representation;
- a diffusion-limited representation.

16 2 Concepts and methods
Lungs
Heart
Brain
Muscles
Fat
Liver
Splanchnic
Kidneys
Hepatic Clearance
Renal Clearance
Pulmonary shunt
Ven
ous
circ
ula
tion
Arterial
circulation
Figure 2.5: Possible physiologically based model lumping. Adapted from the liter-
ature [147].
Capillary
Interstitial fluid
Tissue
Tissue
Vei
n
Vei
n
Art
ery
Art
ery
Figure 2.6: Local tissue models. To the left, a diffusion-limited representation; to
the right, a perfusion-limited representation. Adapted from the litera-
ture [20].

2.3 Pharmacodynamic modeling 17
In perfusion-limited PK representations, the drug entering a tissue from the capil-
lary bed is assumed to distribute instantaneously over the entire tissular volume.
The tissue is referred to as a “well-stirred tank” where mass distribution is imme-
diate. Movement of drug to and from the tissue is considered a first order process,
therefore a single-compartment model is employed. Diffusion-limited representa-
tions, on the other hand, make use of two or three-compartment models in order to
describe mass distribution from the capillary to the tissue, thorough the interstitial
fluid. See Figure 2.6 for an example of tissular representation.
Perfusion-limited pharmacokinetics constitute a convenient simplification of diffusion-
limited ones. However, the existence of diffusion barriers to fentanyl and alfentanil
in several organs and tissues has been determined in rats [21]. The early uptake of
the drugs resulted to be much lower than predicted. Even diffusion-limited tissular
representations fail to predict the initial distribution of fentanyl. A comparative
study of flow-limited and diffusion-limited physiologically based models for fentanyl
concluded that the two approaches show differences mainly in the first minute of
distribution, but that curve trends do not differ considerably.
In common physiologically based PK models, cardiac output and tissular blood
flows are constant during the uptake of the anesthetic, while clinical practice shows
that cardiac output and ventilation depend on the level of anesthesia. Nevertheless,
simulation results demonstrate that a change in cardiac output has little effect on
the initial distribution of the anesthetic [205].
2.3 Pharmacodynamic modeling
While pharmacokinetic models allow for the assessment of drug distribution and
elimination, the clinical and therapeutic value of a drug depends upon its dynamic
effect. Pharmacodynamics (PD) describes the relationship between drug mass and
pharmacological effect. PD modeling implies making the following fundamental
assumption: that the effect can be associated with the amount of drug measured
or computed in plasma (or another body fluid or tissue) [173].
Wagner [199] proposed to use the well-known Hill equation to relate effect inten-
sity with drug amount in a body fluid:
E = Aeγ
Aeγ +A50e
γ (2.1)
where E is the intensity of the pharmacological effect expressed as a fraction of
maximal effect, Ae is a pharmacokinetic quantity to which effect is related (usually
drug mass or concentration), A50e is a constant giving the value of Ae at 50% effect,

18 2 Concepts and methods
and γ is a parameter that alters the sigmoidicity of the Ae-to-effect relationship
[173]. Refer to Figure 2.7 for a graphical representation of the proposed sigmoid
pharmacodynamic model.
In Equation 2.1 the term E signifies the magnitude of the pharmacological effect
expressed as a fraction of the maximal effect. It is worth mentioning that in the
literature the effect is usually not normalized. The maximal effect Emax is included
in the equation for pharmacodynamics, yielding the following equation:
E = Emax ⋅ Aeγ
Aeγ +A50e
γ (2.2)
where E is the absolute intensity of pharmacological effect.
Equation 2.2 represents the most common pharmacodynamic effect equation; it
is referred to as the Emax pharmacodynamic model.
Finally, it is relevant to mention that the pharmacodynamic model varies signif-
icantly with the effect of interest. This implies that the pharmacodynamic model
parameters have to be re-estimated when considering a different pharmacological
effect or a different set of experimental conditions (i.e., different FIO2, breathing
apparatus, and the like).
2.3.1 The relationship between plasma concentration and
pharmacological effect
Traditional pharmacokinetic models are concerned with the disposition of drug
masses in the body: any site which receives small amounts of drug is disregarded.
Relatively to the pharmacological active site, there is no reason a priori to assume
that it corresponds with a region receiving large amounts of the compound. A way
to envision the problem is considering that the effect site of the drug is most likely a
small area in the central nervous system; for example, a receptor or a neural centre.
In general, it should be expected that drug kinetics in plasma are different than
that at the site of action [3,173]. Indeed, several authors report clinical observations
that support this hypothesis. Nowadays it is generally acknowledged that a given
plasma concentration exhibits a temporally varying relationship to drug effect [121].
The typical Cp versus effect curve drawn from experimental observations exhibits
hysteresis. The fact that plasma concentration does not always correlate with the
clinical effect is apparent above all during induction and emergence from anesthesia.
Moreover, the most relevant effects of anesthetic agents are patient sedation and
hypnosis. The site where the drug exerts these effects (termed the biophase or
effect site) is the cerebral tissue. Clearly, it is not feasible to measure the actual

2.3 Pharmacodynamic modeling 19
0
0.5
1
E
Ae
E = Aeγ
Aeγ+A50e
γ
Figure 2.7: Sigmoid pharmacodynamic function associating Ae to E. Ae represents
the amount of drug resulting from the pharmacokinetic model, E the
fraction of maximal response.
cerebral concentration of the drug. Even if direct measurements were possible, it
would be necessary to determine the concentration at the receptors where the drug
exerts its effect, in order to successfully relate concentration to effect [3].
2.3.2 The effect compartment
At steady state no disequilibrium between the various sites or compartments is
possible, and a constant proportionality between plasma and effect site concentra-
tion is achieved. Hence it would be possible to relate drug effect with steady state
plasma concentration in order to describe the sensitivity of an individual to a drug.
However, this is not sufficient to fully describe pharmacodynamics, since temporal
characteristics must be modeled as well [173].
The temporal aspects of pharmacodynamics are described by postulating a hy-
pothetical “effect” compartment in the PK model. The kinetics of such effect
compartment are defined as to match the time dependence of the pharmacologi-
cal effect, in order to obtain a hysteresis-free relationship between concentration
and effect. The response of the body to the drug has a time dependence which

20 2 Concepts and methods
relies on physical and physiological processes that relate drug in blood to drug at
its site of action: perfusion, diffusion, partition, drug-receptor interaction and the
relationship between receptor occupancy and effect.
Sheiner and coworkers [173] proposed the use of Equation 2.1 to relate drug
effect to the hypothetical amount of drug in the effect compartment. Plasma con-
centration is modeled by whatever pharmacokinetic model is necessary to fit the
experimental drug concentration data. As stated above, the mathematical repre-
sentation of a PK model is usually a sum of exponentials, often arising from a
mammillary compartmental model. Under this interpretation of the pharmacoki-
netic problem, the effect compartment is modeled as an additional compartment
linked to the central compartment by a first order process. It is thought to receive
a negligible amount of drug, therefore its exponential does not enter into the PK
solution for mass drug disposition in the body [173]. Id est, the effect compartment
does not enter the mass balance equations of the PK model. See Figure 2.8 for a
representation of the pharmacokinetic model including an effect compartment.
The effect compartment is shown connected to the central compartment by a
first order rate constant, k1e, while drug dissipation from the effect compartment
occurs via another first order rate constant, ke0. Mass transfer to the effect com-
partment can be neglected if k1e is assumed to be small relatively to the magnitude
of the smallest rate constant of the PK model. Once this assumption is made,
the exact value of k1e is unimportant, as will be shown below. Conversely, the
rate constant for drug removal from the effect compartment, ke0, characterizes the
temporal aspects of equilibration between Cp and pharmacological effect.
The following differential equation determines the amount of drug in the effect
compartment:dAe
dt= k1eA1 − ke0Ae (2.3)
where Ae is the hypothetical drug amount in the effect compartment, A1 the drug
amount in the central compartment, k1e and ke0 as defined above. If the analytical
solution for drug in the central compartment after a bolus is:
A1 = D ⋅ N
∑i=1Aie
−αit (2.4)
where D is the dose, Ai and αi are constants (being i = 1,2 . . . N), then the solution
to Equation 2.3 is:
Ae(t) = k1e ⋅N
∑i=1
Ai(ke0 −αi)(e−αit − e−ke0t) (2.5)
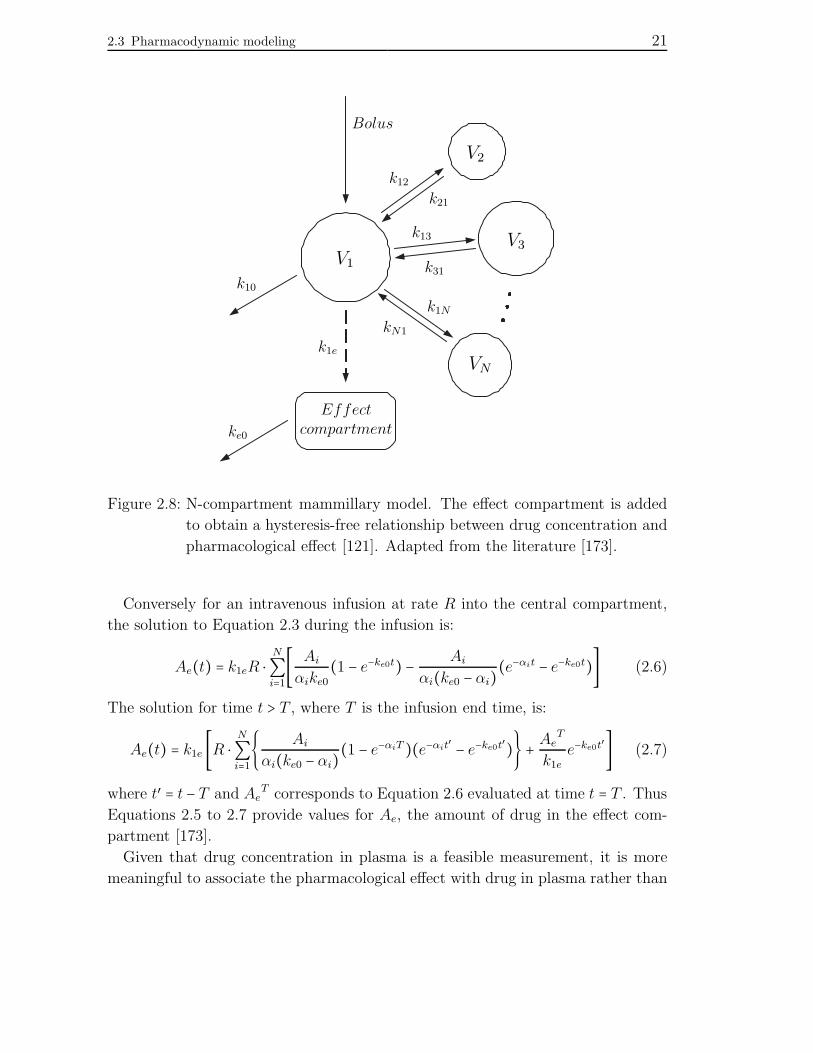
2.3 Pharmacodynamic modeling 21
V1
V2
V3
VN
Effect
compartment
k31
k21
k12
k10
k13
k1e
ke0
Bolus
k1N
kN1
Figure 2.8: N-compartment mammillary model. The effect compartment is added
to obtain a hysteresis-free relationship between drug concentration and
pharmacological effect [121]. Adapted from the literature [173].
Conversely for an intravenous infusion at rate R into the central compartment,
the solution to Equation 2.3 during the infusion is:
Ae(t) = k1eR ⋅N
∑i=1[ Ai
αike0
(1 − e−ke0t) − Ai
αi(ke0 − αi)(e−αit − e−ke0t)] (2.6)
The solution for time t > T , where T is the infusion end time, is:
Ae(t) = k1e [R ⋅ N
∑i=1 Ai
αi(ke0 − αi)(1 − e−αiT )(e−αit′
− e−ke0t′) + AeT
k1e
e−ke0t′] (2.7)
where t′ = t − T and AeT corresponds to Equation 2.6 evaluated at time t = T . Thus
Equations 2.5 to 2.7 provide values for Ae, the amount of drug in the effect com-
partment [173].
Given that drug concentration in plasma is a feasible measurement, it is more
meaningful to associate the pharmacological effect with drug in plasma rather than

22 2 Concepts and methods
with drug in a hypothetical effect compartment. To do so, one has to consider that
at steady state there is a steady state plasma concentration (Cp, ss) and a unique
corresponding steady state Ae. The task consists in expressing the pharmacody-
namic model in terms of the Cp, ss that gives rise to a certain Ae, rather than in
terms of Ae itself.
For any compartment (including the effect compartment) to reach steady state,
its exit rate must be greater than zero. It is assumed that ke0 obeys this constraint.
At steady state no net mass transfer into or out of any compartment occurs, so
thatdAe
dt= 0 (2.8)
Thus, from Equation 2.3
k1e ⋅A1, ss = ke0 ⋅Ae, ss ⇒ A1, ss = Ae, ss ⋅ke0
k1e
(2.9)
Given the definition of drug plasma concentration
Cp = A1
V1
(2.10)
where V1 is the volume of the central compartment, from Equation 2.9 it results
Cp, ss = Ae, ss ⋅ke0/k1e
V1
(2.11)
The term Ae(t) can be substituted in this last equation using Equation 2.5, 2.6,
or 2.7. The choice of the equation to be used for substituting depends on central
compartment drug intake. For all equations, replacing Ae gives
Cp, ss = ke0
k1e
⋅ k1e ⋅Z
V1
= ke0 ⋅Z
V1
(2.12)
where Z stands for the right hand side of Equation 2.5, 2.6, or 2.7, except for k1e.
As k1e cancels out of Equation 2.12, its exact value is of little relevance, as long
as we assume it to be small enough that it can be ignored in the PK solution for
Cp [173]. The Cp, ss determined by Equation 2.12 may be used in Equation 2.2 to
give
E = Emax ⋅(ke0 ⋅ Z
V1)γ
(ke0 ⋅ ZV1)γ +C50p, ss
γ(2.13)
where all the parameters relative to the PK model can be estimated. The new
parameters introduced for the modeling of pharmacodynamic are γ, Emax and

2.3 Pharmacodynamic modeling 23
C50p, ss. The latter is the Cp, ss causing 50% maximal effect; in the following it
shall be referred to as C50 (effective concentration 50), in accordance with the
clinical literature. Equation 2.13 determines the magnitude of drug effect in terms
of steady state plasma concentration, while the kinetics of the effect are quantified
by the parameter ke0 [3, 173].
Using the model, the effect data can be fitted to Equation 2.13 with input infor-
mation being:
- the observed effect at time t;
- the estimated pharmacokinetic constants Ai and αi (for i = 1,2 . . . N) that
determine Cp at time t.
Hence the pharmacodynamic parameters γ, Emax and C50, as well as ke0, can be
estimated.
When ke0 takes on a large value compared to other exponential coefficients of
the model, the kinetics of the effect compartment parallel those of the driving
compartment [173]. If a mammillary model is considered, it means that the effect
compartment concentration is uniformly proportional to Cp over time.
2.3.3 Pharmacodynamic variability
Inter- and intra-individual pharmacodynamic variability is intrinsic to the nature
of biological systems. Sensitivity to a drug therapy can vary greatly between sub-
jects or even within the same subject at different time points or under different
conditions. For this reason, drug dosing must often be adjusted for the specific
individual based on the observed type and extent of pharmacological effects.
In the following we shall exemplify the clinical problem posed by pharmacody-
namic variability by discussing some of the factors that influence patient sensitivity
to anesthetics.
Age
Aging has been shown to reduce the C50 for propofol, implying increased sensitivity
of the elderly to the action of the anesthetic. Greater hemodynamic effects are
displayed, although the time to maximal effect can be delayed. The equilibration
rate between central and effect site compartment has been reported not to be altered
by age [3].
Similarly, remifentanil C50 is reduced with age. However, the clinical data show
that remifentanil equilibration between plasma and effect site is slower in the el-
derly [3]. These properties suggest that induction in elderly patients should be

24 2 Concepts and methods
achieved with lower plasma concentrations than in younger adults. It is worth
mentioning that the anesthetic should also be titrated more slowly to avoid emer-
gence of side effects.
Systemic diseases
To date, extensive research has been carried out on the influence of systemic dis-
eases, such as renal and hepatic diseases, on the pharmacokinetics of intravenous
hypnotics and opioids. However, little work was performed to examine their rel-
ative potency in patients with a systemic disease. In clinical practice it is often
assumed that patients in significantly pathologic conditions require less anesthetic.
Lower dosing could result from an increased central nervous system sensitivity to
the drug (a pharmacodynamic change) or a lessened fraction of drug molecules
subject to plasma protein binding (a subtle pharmacokinetic change) [3]. However,
no increased clinical effect for a specific blood concentration has been assessed in
pathologic subjects. In fact, patients with hepatic cirrhosis have been shown to
remain alert at the same propofol plasma concentration as healthy controls. Fur-
thermore little difference in propofol binding to plasma proteins has been found in
patients with hepatic and renal pathologies [3].
Titrating anesthesia to stimulus
Despite the fact that C50s have not clearly been shown to change in pathologic
conditions, there is significant patient variability to pharmacodynamic effects. Ob-
viously, the likelihood of patient response to a stimulus depends on the depth of
anesthesia, the effect site concentration and the degree of surgical stimulation. For
example, opioid dosing during intubation has to be higher than during skin inci-
sion to prevent the patient from experiencing pain [200]. Therefore the depth of
sedation should be tailored continuously to the sensitivity of the patient and the
extent of surgical stimulation by titrating drug concentration.

3
Feedback control of sedation

26 3 Feedback control of sedation
3.1 Introduction
3.1.1 Anesthesia
Anesthesia refers to a condition of reduced sensibility in the body. The term comes
from the Greek word aesthesia, which means “ability to sense”. The prefix a- (an-,
in the presence of a vowel) is used for negation. Therefore anesthesia stands for
“inability to sense” and it indicates a “condition of deprived sensibility”.
Anesthesia is a reversible pharmacological state induced by the administration
of anesthetic drugs. Delivery of adequate anesthesia during medical treatments
ensures patient hypnosis, analgesia and muscle relaxation.
Hypnosis describes a state of unconsciousness and the absence of post-operative
recall. A patient undergoing a surgical procedure might feel pain and is generally
in a position of great discomfort and anxiety. If the patient is not properly sedated,
the awareness of the events taking place in the operating room can be a traumatic
experience. It is therefore important to make sure that the patient is amnesic, i.e.
that the patient will retain no explicit memory of the events occurring during the
surgery.
Analgesia is associated with the relief of painful stimuli. The stress produced
by surgical pain triggers different autonomic responses that have an influence on
metabolism, immune function and the cardiovascular system [66]. Diverse reac-
tions to surgical stimulation can be observed, from rapid hemodynamic changes to
awakening. A stable analgesic state is necessary for the achievement of a steady
level of hypnosis, and vice versa. However, difficulties in quantifying both painful
stimulation and patient sensitivity make it troublesome to guarantee a stable anal-
gesic state. Analgesia is provided with the administration of analgesic drugs, such
as opioids (fentanyl, alfentanil, sufentanil, and remifentanil, amongst others). At
present there is no specific measure, parameter or sensor to evaluate analgesia in-
traoperatively. The concept of pain perception in the unconscious is actually still
debated and questioned [83]. Another source of complexity results from the fact
that clinical signs that could indicate the perception of pain by the patient, such
as tearing, pupil reactivity, eye moving and grimacing, are partially suppressed by
muscle relaxants, vasodilators and vasopressors.
Skeletal muscle relaxation is induced to facilitate tracheal intubation and the
access to internal organs. It also depresses movement responses to surgical stimu-
lation that could represent a health threat for the patient. Relaxation is achieved
via neuromuscular blocking agents and it can be assessed by the muscular response
to electrical stimulation. For example, it can evaluated by measuring the force of

3.1 Introduction 27
thumb adduction during ulnar nerve stimulation [83].
According to the International Association for the Study of Pain (IASP), regu-
lar re-evaluation of drug dosing during medical and surgical treatments is required.
Pronounced individual variability in the response to the drug and to surgical stimuli,
combined with changes in responsiveness over time, requires the individualization
of drug delivery. Tailoring the administration profile to a patient is based on a con-
tinuing process of effect appraisal and dose titration. The objective is to optimize
the desired effects (e.g. analgesia, anxiolysis and sedation) while minimizing the
undesired effects [42]. The work described in this chapter provides a method to
effectively address these issues.
There are several forms of anesthesia. Arguably the simplest classification is:
- general anesthesia;
- local or regional anesthesia;
- monitored anesthesia care (MAC), or (conscious) sedation.
In modern clinical practice, general anesthesia is provided only when strictly
necessary in order to reduce the invasiveness of the procedure. Hypnosis is delivered
via the administration of a hypnotic, which can be a volatile (e.g. isoflurane) or
an intravenous agent (e.g. propofol). Until recently no direct measure of hypnosis
under general anesthesia was available; arterial blood pressure was often used as
an indirect indicator. Nowadays the electroencephalogram is considered as the
major source of information to assess the level of hypnosis [83]. EEG patterns
show gradual modifications as the drug concentration increases in the body. In
1996 Aspect Medical Systems (MA, USA) proposed the Bispectral Index (BIS),
an EEG derived parameter which adequately evaluates the hypnotic component of
anesthesia.
Most surgeries are performed with local/regional anesthesia or monitored anes-
thesia care. The former (spinal, lumbar epidural, caudal anesthesia are examples)
requires small amounts of anesthetic and it is usually well tolerated by the body.
Emergence of the anesthetized is often rapid and unproblematic. The latter entails
the simultaneous practice of regional anesthesia and patient sedation, according to
the American Society of Anesthesiologists (ASA) [84].
Conscious sedation is defined as a medically controlled state of depressed con-
sciousness that allows protective reflexes to be maintained. The sedated patient
retains the ability to breathe autonomously and to protect the airways. Depending
on the depth of sedation, the patient can respond to verbal commands and tactile
stimulation with different degrees of purposefulness [152]. This procedure, usually

28 3 Feedback control of sedation
termed conscious sedation or sedation and analgesia, represents the field of interest
of the present work. In the following, conscious sedation and its implications on
ventilatory regulation are discussed with detail.
3.1.2 Conscious sedation
Conscious sedation is a widespread procedure providing analgesia and relieving
the stress, the anxiety and the discomfort often associated with medical proce-
dures [84, 168]. Although the drugs employed for sedation do not produce deep
unconsciousness, the patient is usually left with little or no memory of the surgical
treatment.
At present, conscious sedation is a well-established procedure carried out in hos-
pitals all around the world. It is employed in the clinical practice for a wide range
of medical treatments. The procedure is routinely performed during the following
surgical interventions:
- endoscopy (mainly gastroscopy and colonoscopy);
- evacuation of chronic epidural hematoma;
- superficial cleansing of wounds, abscess drainage;
- bronchoscopy or fiber optic intubation;
- virtual probe plastic surgery;
- ESWL (Extracorporeal ShockWave Lithotripsy);
- cystoscopy;
- ovocyte harvest for artificial fertilization;
- dental surgical interventions.
Several factors make sedation attractive compared to general anesthesia. Low
drug and equipment costs, the lack of prolonged monitoring following the proce-
dure, the short duration of patient recovery keep clinical costs at a moderate level.
Conversely, general anesthesia and the subsequent postanesthesia care have a sig-
nificant impact on clinical costs in terms of equipment, medications and human
resources. Moreover, the induction of a prolonged state of unconsciousness in the
patient affects adversely the duration and quality of recovery. Patients treated with
sedation are usually dehospitalized faster than those undergoing general anesthesia.

3.1 Introduction 29
On the other hand, conscious sedation is not suitable for all surgical treatments.
Markedly invasive surgeries, for example, usually require the provision of general
anesthesia and delay patient home readiness.
During sedation the patient is constantly observed. Blood pressure and oxygena-
tion, the heart rate and the ECG are monitored to determine the health conditions
of the patient. The electrical activity of the cardiac muscle is recorded by elec-
trocardiographic means, usually with a three-lead setup. The inspection of the
electrocardiogram is fundamental to assess the patient’s well-being. However, the
ECG is not able to provide by itself complete information on the cardiovascular
system. In fact the evidence of cardiac electrical activity alone does not reassure
the physician on the adequacy of peripheral perfusion. For such reason, electrocar-
diography is coupled with pulse oximetry. A pulse oximeter provides a continuous
measurement of arterial oxygen saturation [% SpO2] and pulse rate [beats min−1].
The measurements are performed via an IR sensor attached to the patient’s finger
or ear lobe. The probe can determine the actual presence of blood flow in the
periphery and detect hypoxia before the patient becomes clinically cyanosed.
Blood pressure, on the other hand, is measured with a plethysmograph unit
which comprises a tourniquet placed at the patient’s arm. The apparatus provides
a measurement every three to five minutes. Hence the information coming from
the plethysmograph is highly discontinuous and sporadic.
Although ventilation is impaired by the analgesic, the patient is able to breath
autonomously. The fact that mechanical ventilation is unnecessary decreases to
some extent the invasiveness of the procedure. The patient breathes room air, i.e.
the fraction of inspired oxygen is equal to 0.21. Usually such FIO2 is not sufficient
to maintain an adequate saturation in the blood. Extra oxygen is therefore provided
to the patient via a nasal cannula or a non-rebreather face mask. Typical oxygen
flows delivered during conscious sedation amount to 2-4 l/min.
Presently, ventilation is not monitored during patient sedation in the operating
theater. However, different factors hint at the necessity for a ventilatory mea-
surement - above all, the fact that the analgesic depresses ventilation. To date,
the death of the sedated patient can still occur due to respiration-related causes.
It is believed that pathologic conditions make the patient more sensitive to the
drug-induced ventilatory decline [3]. The monitoring of ventilation could assist the
anesthetist in tailoring drug infusion to the patient and the surgical situation. To
record ventilation several methods are available, including those listed below:
- visual inspection of the thorax;
- detection of thoracic electrical impedance changes;

30 3 Feedback control of sedation
- capnographic appraisal of end-tidal PCO2.
The simplest way of monitoring ventilation consists in the visual inspection of
the thorax. In the absence of any other respiratory measurement, it represents
the method anesthetists rely on to verify whether the patient is apnoeic. Clearly,
this method performs very poorly in terms of reliability, precision, repeatability,
automatization.
The second method is based on the positioning of electrodes on the thorax and
allows for the determination of tidal volumes. In fact, thoracic electrical impedance
changes in accord with changes in thoracic volume [158]. The method is very artifact
prone; movements of the patient and of the cables reduce the SNR of the detected
signal.
Finally, capnographic systems provide continuous monitoring of the respiratory
rate and end-tidal PCO2 (PetCO2). The apparatus employs a nasal cannula for
exhaled breath sampling. The cannula, 3 to 5 cm in length, does not impair sponta-
neous ventilation, however it yields incorrect measurements if the patient breathes
through the mouth. Another sampling setup makes use of a facial mask. The
deadspace of the tubes and of the mask itself reduces the reliability of the PetCO2
measurements, therefore only the respiratory rate data are usually considered. Both
setups are sensitive to shallow breathing and airway obstruction.
The adequacy of ventilation can be indirectly determined by measuring tran-
scutaneous CO2 tension (PtcCO2) and oxygen saturation. The measurement of
transcutaneous carbon dioxide pressure is not yet a routinary procedure in the
clinical practice. However, innovative sensors have been released that could en-
hance the monitoring of PtcCO2 for a noninvasive assessment of ventilation. These
devices combine pulse oximetry and PtcCO2 detection, therefore they record the
pulse rate, SpO2 and PtcCO2. Currently three manufacturers commercialize sen-
sors with equivalent characteristics. The manufacturers are: SenTec AG (Therwil,
Switzerland); Linde Medical Sensors (Basel, Switzerland); Radiometer A/S (Copen-
hagen, Denmark). Results of the recent clinical studies evaluating these devices can
be found in [94, 18, 97, 113, 192].
3.1.3 Automatic control in anesthesia
Anesthetists take care of patient’s well-being long before and after the surgical pro-
cedure. Before the surgery starts, they assess the health conditions of the patient
and select the type of anesthesia that should be induced. During the operation, they
confer with the surgical team, provide pain relief to the patient and support the
vital functions. At the end of the surgical treatment, they supervise the emergence

3.1 Introduction 31
hypnotics
analgesics
muscle relaxants
ventilation
surgical stimuli
blood loss
hypnosis
muscle relaxation
analgesia
EEG patterns
heart rate
blood pressure
expired CO2
⋮
⋮
unmeasurable
outputs
outputs
measurable
variablesmanipulated
disturbances
Figure 3.1: Schematic MIMO representation of the anesthesia problem. Adapted
from the literature [79].
from anesthesia and relieve pain, if necessary [178]. It becomes clear that anesthe-
sia is a complex, multifaceted problem, entailing the simultaneous supervision of
several variables. From an engineering point of view, anesthesia can be modeled as
an input-output system with manipulated variables, disturbances, measurable and
unmeasurable outputs. A multiple-input, multiple-output (MIMO) representation
of the anesthesia problem is depicted in Figure 3.8.1. The three components of
anesthesia are labelled “unmeasurable” in the figure since they cannot be directly
evaluated. Their appraisal is based on the available physiological measurements,
as discussed in the previous section.
In the operating theater anesthetists supply drugs and adjust several medical
devices to achieve analgesia, muscle relaxation, hypnosis and to compensate for the
effect of surgical disturbances. Throughout the entire process it is fundamental to
maintain the vital functions of the patient. The physician modifies the manipu-
lated variables of Figure 3.8.1 based on specific target values (such as plasma drug
concentration) and on monitor readings. Thus the role of the anesthetist resembles
that of a feedback controller, to a certain extent. It is straightforward to speculate
whether automatic controllers could manage and improve specific aspects of such
complex and delicate decision making process.
Several authors have recognized the advantages associated with the use of auto-
matic control in anesthesia [83, 178]. For example if automatic controllers would
carry out the most routinary aspects of the procedure, anesthetists would be able
to focus on those tasks that are most critical for the health of the patient [59]. Au-
tomatic control can plan and deliver drug administration profiles which, together
with accurate infusion devices, would avoid the risks associated with drug misdos-

32 3 Feedback control of sedation
ing. It is obvious what the disadvantages of drug overdosing are. However, it is
worth mentioning that drug underdosing should be also be prevented when possi-
ble. Underdosing can induce a state of inadequate anesthesia, which in turn makes
the patient experience pain and reduces the inhibition of movement responses to
surgical stimuli. The attempt to avoid occurrence of inadequate anesthesia in the
clinical practice results in an increased risk of overdosing. Therefore, automatic
systems can reduce the risks and costs related to drug consumption. Moreover,
reduced dosage shortens the time needed to the patient for emergence and, in turn,
the duration of his/her stay in the post-anesthesia care unit. Controllers should
also be able to compensate for interindividual variability and tailor drug adminis-
tration to the specific stimuli occurring during the surgical procedure [83]. Finally,
an automatic controller could play the role of a “reference” anesthetist to be used
in research during clinical studies.
To date, extensive research has been carried out on the application of automatic
control theory to the anesthetic practice, mainly general anesthesia. Automatic
systems have been developed, validated and tested on humans to control target
levels of hypnosis and muscle relaxation [83, 178].
3.1.4 Problem formulation
Anesthetics administered to deliver patient sedation have a significant inhibitory
influence on ventilation. Propofol and potent opioids, such as remifentanil, alfen-
tanil and fentanyl, have a dose-dependent respiratory depressant effect that can
ultimately lead to apnea and pose a death risk.
Drug-induced respiratory inhibition becomes dramatically of interest for surgical
procedures where the use of anesthesia is not coupled with artificial ventilation.
This is the case when conscious sedation is performed. As mentioned above, a
sedated patient retains the ability of breathing autonomously. If the ventilatory
decline induced by the anesthetic becomes significant, the anesthetist can supply an
extra flow of oxygen via a nasal cannula or a non-rebreather face mask. Adequate
levels of oxygen in the body are established as a result. On the contrary, no
reassurance relative to the CO2 levels can comfort the anesthetist. If the respiratory
decline is pronounced, an acidic state sets up in the body due to the excessive
amount of CO2. This phenomenon is referred to as respiratory acidosis; equivalent
terms are hypercapnic acidosis and carbon dioxide acidosis.
Although conscious sedation is a well-established, widespread clinical procedure,
it is far from being unproblematic. Clinical experience emphasizes the need for a
better understanding and management of respiratory-related events taking place

3.1 Introduction 33
during conscious sedation. It calls for the application of engineering and automatic
control concepts and methods in order to tailor drug administration profiles, shrink
the risk of opioid misdosing and ultimately reduce the mortality and morbidity of
the procedure.
3.1.5 Aim of the work
The present study aims at contributing to the improvement of conscious sedation
anesthetic care. The most difficult task anesthetists have to face when delivering
conscious sedation is handling drug administration and dosing. Extreme patient
inter- and intra-individual variability in sedative pharmacodynamics and the ven-
tilatory response to the drug makes anesthetic dosing for conscious sedation a
complex and delicate task. Drug dosing based solely on clinical experience is not
entirely satisfactory and can cause the onset of significant pharmacological side
effects during the procedure.
Objective of the work is to design an automatic feedback controller capable of
driving anesthetic infusion for sedation based on indicators of the patient’s ventila-
tory state. The recent commercialization of innovative, noninvasive PCO2 sensors
makes it feasible to routinely monitor tissular CO2 levels in the operating the-
ater. Optimizing the administration profile is expected to minimize the ventilatory
impairment and prevent the occurrence of adverse respiratory events, therefore
minimizing the risks associated with the anesthetic procedure.
3.1.6 Chapter content
This chapter is structured as follows. In Section 3.2 the reader is introduced to
the physiological systems that contribute to ventilatory regulation in the human
body. A brief review of the mathematical models proposed in the literature to
describe human respiratory control is also provided. Section 3.3 presents a com-
prehensive mathematical model of human ventilatory regulation and anesthetic
induced respiratory depression. The response of the model under different ventila-
tory conditions is analyzed in Section 3.4 (both drug naıve and after exposure to
respiratory depressants). Based on those results, proposed model changes and re-
finements are discussed in Section 3.5. With the model developed in these sections,
a proportional-integral control strategy for the delivery of personalized remifentanil
sedation is designed in Section 3.6.
In order to overcome the limitations of the model described in Section 3.3 in
terms of complexity and agreement with experimental results, a new model of

34 3 Feedback control of sedation
human ventilatory regulation is proposed in this thesis. In Section 3.7 a parsimo-
nious mathematical description of respiratory control and pharmacological effects
of ventilatory depressants is presented. In Section 3.8 a simplified model for the
controlled physiological metabolic plant is discussed and validated with simulation
results of drug induced respiratory depression in the non-steady state. This parsi-
monious model is then used as a physiological platform to design and test a model
predictive controller delivering propofol sedation (Section 3.9).
Finally, the clinical validation of the sedation paradigm is discussed. In Section
3.10 the protocol of the clinical study aimed at investigating respiratory depression
during sedation is described. Section 3.11 deals with the design and implementation
of a system for the delivery of personalized sedation. This platform is currently in
use to perform the clinical trials in gastroenterology patients. It also constitutes
the proof-of-concept prototype for a prospective commercial device delivering auto-
matic sedation. The preliminary clinical results collected through November 2009
are presented and discussed in Section 3.12.
3.2 Background
3.2.1 Ventilatory regulation in the human body
Human ventilatory response and control is a central issue of this work. Acquain-
tance with the regulatory systems that contribute to modulating ventilation is es-
sential for the understanding of ventilation related issues in the field of anesthesia.
Especially of interest is the pharmacological effect of anesthetic drugs on ventila-
tory neural centres and reflexes. This section intends to provide an overview of
the physiological mechanisms that control ventilation in the human body. Most of
the regulatory mechanisms illustrated below are included in the physiology-based
model described in Section 3.3.
Central respiratory centres
Spontaneous ventilation is the result of rhythmic neural activity in respiratory cen-
tres within the brainstem. Two medullary neural centres can be recognized: a
dorsal respiratory group, active primarily during inspiration, and a ventral respi-
ratory group, which is active during expiration. Although not firmly established,
the origin of the basic respiratory rhythm is due to either a spontaneous discharge
activity in the dorsal group or a reciprocating activity between the dorsal and ven-
tral groups. The close association of the dorsal respiratory group with the tractus

3.2 Background 35
solitarius may explain reflex changes in ventilation resulting from vagal or glos-
sopharyngeal nerve stimulation [144].
Two pontine areas influence the dorsal (inspiratory) medullary centre. A lower
pontine (apneustic) centre is excitatory, while an upper pontine (pneumotaxic)
centre is inhibitory. The pontine centres seem to fine-tune the respiratory rate.
Central sensors
The most important central sensors are the chemoreceptors that respond to changes
in hydrogen ion concentration. Central chemoreceptors are believed to lie on the an-
terolateral surface of the medulla and respond primarily to changes in cerebrospinal
fluid [H+]. This mechanism is effective in regulating arterial CO2 partial pressure
because the blood-brain barrier is permeable to dissolved carbon dioxide but not
to bicarbonate ions. Acute changes in PaCO2 are reflected in the cerebrospinal
fluid (CSF), but not those in arterial [HCO3−]. Thus a change in CO2 results in
a change of [H+]:CO2 +H2O H+ +HCO3
− (3.1)
Over the course of a few days, cerebrospinal fluid [HCO3−] can compensate to
match the changes in arterial [HCO3−] [144].
Increases in PaCO2 elevate CSF hydrogen ion concentration and activate the chemore-
ceptors. Brain hypoxia, on the other hand, depresses central chemoreceptive activ-
ity.
Peripheral sensors
Peripheral sensors are classified into peripheral chemoreceptors and lung receptors,
according to their position.
Peripheral chemoreceptors include the carotid bodies at the bifurcation of the
common carotid arteries and the aortic bodies surrounding the aortic arch [92].
The carotid bodies are the principal peripheral chemoreceptors in humans and are
sensitive to changes in PaO2, PaCO2, pH and arterial perfusion pressure. They
interact with central respiratory centres via the glossopharyngeal nerves, producing
reflex increases in alveolar ventilation in response to reductions in PaO2 and arterial
perfusion or increases in [H+] and PaCO2 [92].
Action potentials from these receptors are carried centrally by the vagus nerve.
Stretch receptors are distributed in the smooth muscle of airways. They are respon-
sible for inhibition of inspiration when the lung is inflated to excessive volumes (the
Hering-Breuer inflation reflex) and shortening of exhalation when the lung is de-
flated (the deflation reflex). Stretch receptors normally play a minor role in humans.

36 3 Feedback control of sedation
PaCO2 [mmHg]
Alv
eola
rve
nti
lati
on[l
min−1]
metabolic acidosishypoxia (adult)
awake
asleep
narcoticschronic airway obstruction
hypoxia (neonate)removal of carotid bodies
deep anesthesia
Figure 3.2: CO2 response curve under different conditions.
In fact, bilateral vagal nerve blocks have a minimal effect on the normal respiratory
pattern.
Irritant receptors in the tracheobronchial mucosa react to noxious gases, smoke,
dust and cold gases. Their activation produces reflex increases in respiratory rate,
bronchoconstriction and coughing [144].
Effects of anesthesia on respiratory control
The most important pharmacological effect of anesthetic drugs on breathing is a
general tendency to promote hypoventilation. The mechanism is probably twofold:
a central inhibition of chemoreceptors is coupled with a depression of external inter-
costal muscle activity. The anesthetic also inhibits the genioglossus, the geniohyoid
and other pharyngeal dilator muscles. The magnitude of the hypoventilating effect
is generally proportional to the depth of anesthesia. With increasing drug concen-
tration, a depression of the slope and a rightward shift can be observed in the CO2
response curve (refer to Figure 3.2). This effect is partially reversed by surgical

3.2 Background 37
stimulation.
Under anesthesia, a decline in functional residual capacity (FRC) can be ob-
served. Declines amount to 10-25% in healthy adults (independently of muscle
relaxants dosage) and to 35-45% in 6 to 18 year-old subjects. In young infants
under general anesthesia the FRC may be reduced to 10-15% of the basal value,
especially if the anesthetic is combined with muscle relaxants. FRC impairment
may lead to small airway closure, atelectasis, V /Q mismatch, declining SpO2.
3.2.2 State of the art in respiratory modeling
Mathematical modeling of the respiratory system dates back to the mid-1950s with
the pioneering works by Grodins and coworkers [88, 89]. The structure of those
early models is very comprehensive. They include a formulation of physiological
regulatory mechanisms, gas transport and chemical buffering in the human body.
Most of the models published in recent times, on the other hand, focus on spe-
cific regulatory aspects rather than on describing the behavior of the system as a
whole. For example, some studies [119, 186] explain thoroughly the dynamics of
regulation to analyze the transition to instability, but do not incorporate chemical
variables. Others [124] report exhaustive descriptions of acid-base equilibrium and
blood dissociation curves, but do not address the control of respiration.
In 1997 Chiari and colleagues [44] proposed a comprehensive model of the human
respiratory system that describes both ventilatory and cardiovascular regulation
and includes aspects of physiological gas transport and chemical buffering. At
the time the model was innovative in that it was the first one to merge different
regulatory features into a single theoretical framework. Four years later, Ursino
et al. [195] published a development of the work by Chiari. The mathematical
model was improved in the description of the regulatory mechanisms controlling
ventilation. The representation by Ursino comprises the modeling of peripheral
and central chemoreceptors and the central inhibitory regulation induced by brain
hypoxia.
In 2004 Magosso and coworkers [129] proposed a further development of the model
that takes into account the influence exerted on ventilation by fentanyl, an opioid
drug. More precisely, the model by Magosso yields a quantitative description of
the effect of fentanyl on the ventilatory control system and on respiratory volumes.
Therefore it enables the assessment of the respiratory inhibition caused by the
opioid and it provides a meaningful tool for the design of analgesia and sedation
controllers.
In the initial part of this study, we use a model derived from the work by Magosso

38 3 Feedback control of sedation
and colleagues [129] to simulate the effect of anesthetic drugs on the human body.
The Magosso model was initially considered because it is one of the most complete
representations of the ventilatory control system to date, as mentioned above.
Nevertheless, simulation results provided by the model are not entirely satisfac-
tory. Model behavior under determined conditions does not match what can be
inferred from the clinical practice. Thus the initial part of our study is focused on
further developing the original model. The following sections provide a detailed
description of the original model, the simulation results, and the proposed changes.
3.3 Respiratory model structure
The structure of the model proposed by Ursino and coworkers [195] is depicted in
Figure 3.3, 3.4, and 3.5. The model includes three compartments for gas storage
and exchange, namely the lung, the brain and the tissular compartment (see Figure
3.3). The brain is modeled as a stand-alone compartment because it is the site
where central respiratory nuclei and chemoreceptors are found. Local O2 and CO2
concentrations have a relevant influence on ventilation, therefore the gas exchanges
taking place in the brain are to be modeled separately.
A blood flow controller and a ventilation controller act as cardiorespiratory reg-
ulatory mechanisms in the model. They mimic the action of different physiological
feedback components, such as the central and peripheral chemoreceptors, that will
be discussed in the coming paragraphs.
3.3.1 Compartmental gas exchange system
Tissular mass balance equations
In each compartment, O2 and CO2 mass changes occur over time resulting from
mass transport, exchange, production and consumption. In the lungs, mass ex-
change takes place between alveolar air and pulmonary capillaries. In the tissues,
mass changes refer to metabolic CO2 production and O2 consumption. To take
into account mass variations per unit time, mass balance equations are written for
each state variable. The state variables are:
- O2 and CO2 partial pressures in the alveoli;
- O2 and CO2 concentrations in the brain and the tissue compartments.
Equations 3.2-3.6 are the mass balance equations for the lung, brain and tissue
compartments [195, 129]. In these mathematical equations, subscripts are used

3.3 Respiratory model structure 39
to identify the different compartments. The subscript A is employed for terms
referring to the alveoli, b for the brain tissue, t for body tissues. The subscript
a is used to refer to arterial variables (partial pressure or concentration). Labels
relative to venous terms are slightly more elaborate. The subscript v is used for
mixed-blood venous quantities, while vb, e, and vt refer to blood flowing out of the
brain, lung and tissular compartment, respectively.
VA ⋅dPA,j
dt= VA (PI,j −PA,j) + λQ (1 − s)(cv,j − ce,j) (3.2)
Vi ⋅dci,j
dt= Qi (ca,j − cvi,j) −Mi,j (3.3)
where
i = b, t (3.4)
j = O2,CO2 (3.5)
Mi,O2= ⎧⎪⎪⎨⎪⎪⎩
Mi,O20 if Pi,O2 > 6 mmHg
16Pi,O2
Mi,O2if Pi,O2 < 6 mmHg
(3.6)
In the above VA denotes alveolar ventilation, Q is the cardiac output, Qi the
blood flow through compartment i, and s the pulmonary shunt. Mi,j represents
the metabolic rate of the specific compartment; it is a positive quantity when re-
ferred to CO2 (implying production) and negative when relative to O2 (entailing
consumption). λ is a coefficient to convert blood concentrations at standard tem-
perature and pressure (dry) into alveolar partial pressures at body pressure and
temperature (saturated). Finally, PI,j is the gas pressure in the inspired air, being
j either O2 or CO2.
The values of all the parameters that appear in the equations are summarized in
Table 3.1.
Gas pressures and concentrations in blood
Respiratory gases do not exhibit a linear relationship between blood concentration
and partial pressure due to the presence of hemoglobin. When a mass exchange
takes place, O2 and CO2 blood content has to be taken into account. Therefore,
knowledge of the respiratory gas concentration in the blood flowing into and out
of the compartment is necessary to compute the mass balance equation. To that
purpose, the following steps are taken:

40 3 Feedback control of sedation
- blood flowing into a compartment is considered to be arterial blood while
blood flowing out of a compartment is regarded as venous;
- Henry’s law is used to compute gas partial pressures from blood concentra-
tions in the brain and tissue compartments;
- partial pressures in the blood outflowing from a compartment are assumed
equal to pressures in the tissue (i.e., Pvi,j = Pi,j and Pe,j = PA,j where i = b, tand j = O2,CO2);
- gas dissociation curves are used to determine venous blood concentrations
from O2 and CO2 partial pressures;
- gas dissociation curves are inverted to obtain arterial blood partial pressures
from gas concentrations;
- mixed venous blood concentrations are computed from brain and tissular
venous concentrations;
- arterial blood concentrations are determined taking into account the pul-
monary shunt (which, in the model, accounts for 2.4% of the overall cardiac
output).
Concerning the blood dissociation curves, Magosso and collaborators relied on
the work by Spencer and coworkers [176] who proposed a set of mathematical
equations to relate O2 and CO2 blood concentration to partial pressure. These
equations account for both the Bohr and the Haldane effect in order to account.
They are also invertible, so that it is possible to calculate the gas partial pressure
in the blood as a function of concentration. Both direct and inverse forms of the
mathematical equations are available in the original paper and are not rewritten
here for the sake of conciseness.
With respect to the computation of oxygen and carbon dioxide concentration in
mixed venous and arterial blood, the following equations are employed:
ca,j = (1 − s) ce,j + scv,j (3.7)
cv,j = Qb ⋅ cvb,j +Qt ⋅ cvt,j
Qb +Qt
(3.8)
j = O2,CO2
In 3.7, the mixing of blood flow from the alveoli and that from the pulmonary
shunt determines the O2 and CO2 arterial concentration. Similarly, the venous
concentration in 3.8 is obtained via weighted averaging of the concentration in
cerebral and tissular venous flows.

3.3 Respiratory model structure 41
LungsVA, PA
BrainVb, Cb
TissuesVt, Ct
Lung Shunt
Qb, Cvb
Qt, Cvt
Qb, Cab
Qt, Cat
Q, Ca
Q, Cv
PA, V PI , V
Q ⋅ (1 − s)
Q ⋅ s Ce, Q ⋅ (1 − s)
Figure 3.3: Three-compartment gas exchange system.
CO2 tissular concentration
It was mentioned above that the CO2 partial pressure in the tissues is computed
via Henry’s law from the blood concentration of the species. However, CO2 trans-
port in blood occurs via three distinct mechanisms. Less than 10% of total carbon
dioxide is dissolved in the plasma, while approximately 20% chemically binds to
hemoglobin. The remaining 70% is converted into carbonic acid by carbonic anhy-
drase, an enzyme that catalyzes the hydration of carbon dioxide:
CO2 +H2O H2CO3 (3.9)
Carbonic acid then dissociates to form bicarbonate ions:
H2CO3 H+ +HCO3− (3.10)
Given that hemoglobin is confined within red blood cells, carbon dioxide in the
tissues is either dissolved or in the form of bicarbonate ions. Henry’s law applies
to dissolved species only, therefore it is necessary to distinguish between total and
dissolved tissular CO2. Chiari and colleagues [44] express total compartmental
CO2 as follows:
[CO2]toti = [CO2]dissolvedi+ [HCO3
−]i (3.11)

42 3 Feedback control of sedation
Mass balance in the alveoli
VA = 3.28 l s = 0.024
PI,O2= 149 mmHg PI,CO2
= 0 mmHg
Mass balance in the tissues
Vb = 1.32 l Vt = 38.68 l
[HCO3−]b = 26 mEq
l[HCO3
−]t = 26 mEql
Mb,O2= 0.05
l (STDP )min
Mt,O2= 0.2
l (STDP )min
Mb,CO2= 0.04
l (STDP )min
Mt,CO2= 0.16
l (STDP )min
Henry’s law
αO2= 3.17⋅10−5 l (STDP )
l mmHg
αCO2= 6.67⋅10−4
l (STDP )l mmHg
Conversion factors
λ = 863 mmHg
Table 3.1: Parameter values for compartmental mass balance equations and Henry’s
law.
= αi,CO2⋅ Pi,CO2
+ [HCO3−]i (3.12)
i = b, t
where αi,CO2is the solubility coefficient of the species and i = t, b, e. Reshuffling the
terms, we obtain the following equation for dissolved tissular carbon dioxide:
[CO2]dissolvedi= [CO2]toti − [HCO3
−]i (3.13)
Bicarbonate ion content in the tissues is assumed to remain constant since only a
negligible part is involved in acid-base reactions. CO2 partial pressure can then be
computed as
Pi,CO2= [CO2]dissolvedi
αi,CO2
(3.14)

3.3 Respiratory model structure 43
3.3.2 Cardiovascular regulation
The model describes cardiac output regulation and it is capable of predicting tissu-
lar and cerebral blood flow based on O2 and CO2 blood content. In the human body
cardiovascular regulation takes place due to the action of multiple control mecha-
nisms. Such mechanisms can induce vasodilation, vasoconstriction, and changes in
cardiac output and systemic arterial pressure.
The model determines cardiac output as the sum of the cerebral blood flow Qb
and the tissular blood flow Qt. The basal cardiac output is assumed to be 5 l min−1
and basal cerebral perfusion is 0.75 l min−1. Local regulation of cerebral blood flow
is dependent on O2 and CO2 arterial content. Qt, on the other hand, is dependent
on arterial O2 only. In fact, different authors report that carbon dioxide partial
pressure has a scarce influence on noncerebral tissular blood flow [129, 195, 196].
The mathematical description of cardiovascular regulation in the model is:
ψO2(Pa,O2
) = c1 [e−Pa,O2
c2 − e−Pa,O20
c2 ] (3.15)
dyO2
dt= 1
τO2
⋅ (ψO2− yO2
) (3.16)
ψCO2(Pa,CO2
) = A +B/(1 +CeD log(Pa,CO2))
A +B/(1 +CeD log(Pa,CO20)) − 1 (3.17)
dyCO2
dt= 1
τCO2
⋅ (ψCO2− yCO2
) (3.18)
Qb = Qb0 (1 + yO2+ yCO2
) (3.19)
Qt = Qt0 (1 + ρ ⋅ yO2) (3.20)
Q = Qt +Qb (3.21)
Equations 3.16 and 3.18 represent the mechanism dynamics for O2 and CO2 regu-
lation, respectively. The value of yO2and yCO2
is zero in basal conditions, i.e. when
Pa,O2= Pa,O20 = 95 mmHg and Pa,CO2
= Pa,CO20 = 40 mmHg.
As it can be inferred from Equation 3.19, the O2 and CO2 regulatory mecha-
nisms interact linearly to determine cerebral blood flow. On the contrary, tissular
circulation depends solely on arterial O2 blood content. Parameter ρ in Equation
3.20 is the fraction of tissular blood flow which is subject to oxygen local regulation.
This ratio is smaller than 1 due to the existence of the splanchnic circulation and
other vascular beds which are scarcely affected by arterial O2 changes. In Equation
3.21, the cardiac output Q is computed as the sum of cerebral and tissular blood
flow.

44 3 Feedback control of sedation
+
VA
Brain
VE
Central Chem.
deadspace
∆VEP
∆VEC
CVD
Pb,CO2 Pb,O2
Lungs
QbQb
cvb,O2cvb,CO2
Mb,O2
Peripheral Chem.
Q
Mb,CO2
sQsQ
QtQt
Shunt
Blood
diss. curve
(1 − s)Q(1 − s)Q
VE0
Blood flow
Blood flow
regulation
regulation
cvt,O2cvt,CO2
ct,O2
ct,CO2
Tissues
Mt,CO2Mt,O2
ca,CO2
ca,O2
cv,O2cv,CO2
ce,CO2
ce,O2
cv,O2
cv,CO2
PI,O2 PI,CO2
Pa,O2
Pa,CO2
Figure 3.4: Block diagram representation of the model. The figure illustrates the
compartments and the physiological quantities discussed in the text.
The meaning of symbols and subscripts is: PA,j, PI,j (j = O2, CO2):
alveolar partial pressure and gas pressure in inspired air, respectively;
s: pulmonary shunt fraction; Q: cardiac output; ce,j, cv,j , ca,j : gas con-
centration in blood outflowing from the alveoli, in mixed venous blood,
in arterial blood; cvt,j , cvb,j : gas concentration in blood outflowing from
tissues and brain; ct,j , cb,j : tissular and cerebral gas concentration; Pb,j,
Pa,j : gas partial pressure in brain and in arterial blood; Mi,O2, Mi,CO2
(i = t, b): O2 consumption and CO2 production rate in the compart-
ment; Qi: compartmental perfusion; ∆VE0, ∆VEP , ∆VEP : basal venti-
lation and chemoreceptive ventilatory regulation; VE, VA: minute and
alveolar ventilation. Adapted from the literature [196].

3.3 Respiratory model structure 45
+
×
VA
CVD
deadspace
VE0
Central Chem.
∆VEP
∆VEC
Peripheral Chem.
Lungs
Brain
Tissues
Mt,CO2, Mb,CO2
Mt,O2, Mb,O2
PI,O2 PI,CO2
VE
Blood flow
regulation
Pb,CO2
Pb,O2
Pa,O2
Pa,CO2
Pt,CO2
Pt,O2
Figure 3.5: Alternative structural representation of the model. The figure empha-
sizes the reciprocal relationships between model components. Variables
involved in regulation are displayed. Adapted from the literature [129].

46 3 Feedback control of sedation
Ventilatory regulation
VE0 = 6.62 l (BTPS)min
k = 0.333 Pa,O2c = 45 mmHg
K = 1.738 Bp = 18 mmHg kpc = 29.27 mmHg
τp = 7 s fpcmax = 12.3 spikess
kDp = 0.588 l
τc = 60 s fpcmin = 0.8352 spikess
kDc = 0.9239 l
Gp = 2.5l/min
spikes/s Gc,high = 2l/min
mmHg
Gc,low = 0.12l/min
mmHg
Central ventilatory decline
τα = 300 s Gα = 10 Pb,O20 = 32 mmHg
θmax = 35 mmHg θmin = 29.8 mmHg
Cardiovascular regulation
c1 = 17 c2 = 11 mmHg
A = 20.9 B = 92.8 C = 10570
D = -5.251
τO2= 10 s τCO2
= 20 s
Pa,O20 = 95 mmHg Pa,CO20 = 40 mmHg
Qb0 = 0.75 lmin
Qb0 = 0.75 lmin
ρ = 0.32
Table 3.2: Parameter values for regulatory mechanisms.
Parameter values are estimated to reproduce cardiovascular regulation experi-
mental data (Figure 3.6). The values are reported in Table 3.2. Parametric assign-
ment and estimation are discussed in [129, 195, 196] and are not reported here for
the sake of brevity.
3.3.3 Ventilatory regulation
In the model, ventilatory regulation is performed by three different mechanisms.
They mimic physiological respiratory control by inducing changes in minute venti-
lation based on blood O2 and CO2 content. The three regulatory systems are the

3.3 Respiratory model structure 47
20 40 60 80 100
1
1.5
2
2.5
Arterial PO2 [mmHg]
Nor
mal
ized
car
diac
out
put [
−]
Model Koehler et al.
20 40 60 80 100
1
1.5
2
2.5
3
3.5
4
Arterial PO2 [mmHg]
Nor
mal
ized
cer
ebra
l blo
od fl
ow [−
]
Model McPherson et al., 1987 McPherson et al., 1994 Ulatowski et al.
Figure 3.6: Dependence of normalized cardiac output and cerebral perfusion on
arterial O2 pressure at basal PCO2 pressure. Solid lines: model simu-
lation results. Symbols: experimental data are taken from Koehler and
coworkers in dogs [114], McPherson and coworkers in dogs [133, 134]
and Ulatowski and collaborators in cats [194]. Adapted from the liter-
ature [195].

48 3 Feedback control of sedation
peripheral chemoreceptors, the central chemoreceptors and the central ventilatory
depression (CVD).
According to the literature, chemoreceptive stimulation exerts an additive effect
on ventilation; the interaction between peripheral and central chemoreceptors does
not show significant non-linearities [195]. The CVD mechanism, on the other hand,
acts as an inhibitory gain on the peripheral chemoreceptive system in case of brain
tissue hypoxia [129]. Total minute ventilation is then computed via the following
equation:
VE = (VE0 + α ⋅∆VEP +∆VEC) ⋅H(VE0 + α ⋅∆VEP +∆VEC) (3.22)
where VE0 is the value of ventilation in basal conditions, and ∆VEP and ∆VEC rep-
resent the changes in ventilation produced by the peripheral and central chemore-
ceptive activity, respectively. The multiplicative term α refers to the hypoxic
ventilatory depression and it is equal to 1 in basal conditions. Finally, H() de-
notes the Heaviside function which prevents ventilation from taking on negative
values. Given that ∆VEP and ∆VEC can be either positive or negative quantities, a
strong inhibitory chemoreceptive stimulation could in fact produce negative values
of minute ventilation.
Alveolar ventilation is determined from minute ventilation. The lung dead space
is assumed to be a constant fraction of minute ventilation [195], therefore it is
possible to calculate alveolar ventilation as
VA = VE (1 − k) (3.23)
where k is a constant parameter < 1 related to the dead space.
A more detailed description of the ventilation regulatory systems is given below.
Peripheral Chemoreceptors
In the model, the discharge frequency of peripheral chemoreceptors is described as
a function of the arterial O2 and CO2 pressure. The discharge frequency represents
a way to quantify the chemoreceptive activity that is afferent to the central nervous
system. It is determined as the number of action potentials occurring per second
(spikes s−1). Experimental data recorded in cats by Fitzgerald and coworkers [76]
were considered to determine the relationship between oxygen and carbon dioxide
partial pressure and the discharge activity of the peripheral chemoreceptors. From
the data it can be inferred that the relationship between discharge frequency and

3.3 Respiratory model structure 49
oxygen pressure at constant PaCO2 can be described as a sigmoidal curve [76,195].
The following equation is used to compute peripheral chemoreceptive activity:
fpc =K ln(Pa,CO2
Bp
)fpcmax + fpcmin ⋅ exp [(Pa,O2−Pa,O2c)kpc
]1 + exp [(Pa,O2
−Pa,O2c)kpc
] (3.24)
where the PaO2-dependent term translates the sigmoidal interrelation of chemore-
ceptive activity and oxygen pressure. K, Bp, fpcmax, fpcmin, Pa,O2c, kpc are constant
parameters and their value is assigned to reproduce experimental findings (see Fig-
ure 3.7). fpc stands for the action potential frequency in the chemoreceptive affer-
ent fibres, while fpcmax and fpcmin represent its upper and lower saturation levels.
Their value is 12.3 spikes s−1 and 0.8352 spikes s−1, respectively. Pa,O2c is a constant
parameter equal to 45 mmHg. According to Ursino and colleagues, it represents
the “arterial oxygen pressure at the central point of the sigmoid” [195]. However,
no experimental data supporting such values could be found in the literature, nor
any reference to a point on the sigmoid function holding physiological significance.
The values were determined solely with the aim of reproducing experimental find-
ings. Therefore in what follows Pa,O2c, fpcmax and fpcmin are considered as constant
parameters with no apparent physiological meaning.
Chemoreceptive discharge activity affects minute ventilation by producing the
ventilation change ∆VEP appearing in Equation 3.46. The ventilation response to
peripheral chemoreceptive stimulation is modeled via a first order low-pass dynam-
ics with time constant τp and static gain Gp. The time constant τp of chemoreceptor
dynamics was given the value of 7 s according to the data reported in the litera-
ture [195]. Chemoreceptor activity is further described by a time delay Dp which is
inversely proportional to cardiac output Q and mimics the time required for blood
transport to the receptor [44]. The equation regulating the changes in ventilation
due to the arousal of peripheral chemoreceptors is:
d∆VEP (t)dt
= 1
τp−∆VEP +Gp ⋅ [fpc(t −Dp)] − fpc0 (3.25)
being
Dp = kDp
Q(3.26)
fpc0 is the basal value of the activity in the peripheral chemoreceptive afferent
fibres, meaning the discharge frequency value for PaO2= 95 mmHg and PaCO2=
40 mmHg. kDp, on the other hand, is a constant parameter assigned to produce
a time delay equal to 7 s in basal cardiac output conditions (Q = 5 l min−1), as
reported in the literature [195].

503
Feed
back
contro
lofsed
atio
n
Figure 3.7: Discharge frequency of peripheral chemoreceptors as a function of arterial CO2 partial pressure. Receptor
activity is evaluated at different levels of arterial O2 pressure (ranging from hypoxia to hyperoxia). Solid
lines: model simulation results. Symbols: experimental data recorded in cats by Fitzgerald and coworkers
[76]. Adapted from the literature [195].

3.3 Respiratory model structure 51
Central Chemoreceptors
In the human body, central chemoreceptors play the role of a carbon dioxide sensor
that detects PCO2 changes in the medulla. According to the literature the receptors
are insensitive to changes of oxygen content in the blood [153]. Therefore in the
model central chemoreceptive activity depends on brain tissue PCO2.
Similarly as for the peripheral receptors, the ventilatory response to central
chemoreceptive stimulation is described by first order low-pass dynamics. The time
constant τc of the system is equal to 60 s in accordance with the literature [195].
The equation for computing ventilatory changes driven by central chemoreceptive
stimulation is:
d∆VEC(t)dt
= 1
τc⋅ −∆VEC +Gc ⋅ [Pb,CO2
(t −Dc)] − Pb,CO20 (3.27)
where
Dc = kDc
Q(3.28)
In Equation 3.27, Pb,CO20 stands for brain tissue CO2 pressure in basal conditions.
The gain Gc of the mechanism is not a constant parameter. Varying the mecha-
nism’s gain on ventilation reflects the existence of a breakpoint in the ventilatory
CO2 response curve [129]. Depending whether Pb,CO2> Pb,CO20 or Pb,CO2
< Pb,CO20,
Gc assumes the value of 2 or 0.12 (l/min)(mmHg)−1, respectively. Finally, as in the
case of peripheral chemoreceptors kDc is a constant parameter which determines
the time delay of the mechanism. For basal cardiac output conditions, the delay is
equal to 11 s [195].
Central Ventilatory Depression
In the model, ventilation is regulated by the central and peripheral chemorecep-
tors together with the depressant effect of hypoxia. From this point onwards we
shall refer to the latter mechanism as the central ventilatory depression (CVD).
The CVD describes the inhibition of the ventilatory response occurring during sus-
tained cerebral hypoxia. Inhibition of respiratory neurons due to hypoxia causes a
decline of ventilation. More precisely, brain hypoxia diminishes the CNS ventilatory
response to peripheral stimulation. Evidence of such effect in the human body is
reported in the literature [129]. In accordance to such findings, the CVD is modeled
as a varying gain on the peripheral chemoreceptive response [see Equation 3.46].
The gain is equal to 1 when O2 pressure in the brain is at its basal level, i.e. for

52 3 Feedback control of sedation
Pb,O20 = 32 mmHg. For other O2 values the gain varies linearly between an upper
and lower bound. At both thresholds the mechanism effect saturates and does not
exhibit further changes. The following equations describe the central ventilatory
depression effect:
αb,O2 =⎧⎪⎪⎪⎪⎪⎪⎪⎨⎪⎪⎪⎪⎪⎪⎪⎩
1 +Gα(θmin−Pb,O20)
Pb,O20
if Pb,O2 < θmin
1 +Gα(Pb,O2
−Pb,O20)Pb,O20
if θmax > Pb,O2 > θmin
1 +Gα(θmax−Pb,O20)
Pb,O20
if Pb,O2 > θmax
(3.29)
dα
dt= 1
τα⋅ (α − αb,O2) (3.30)
where θmax and θmin are the upper and lower Pb,O2thresholds, respectively. τα
describes the mechanism time constant. Equation (3.30) computes the variable α:
it represents the hypoxic ventilatory gain on peripheral chemoreceptive response.
3.3.4 Ventilatory regulation in the presence of an opioid
In 2004 the model described so far was extended by Magosso and collaborators [129]
to reproduce the effect of opioids on the ventilatory system. Fentanyl and other
opioids have a dose dependent depressant effect on ventilation. The extended model
takes into account the plasma concentration of the drug to quantify its effect on
the respiratory system. Minute ventilation is determined based on the O2- and
CO2-dependent regulatory mechanisms described in the above, and by the opioid
concentration in blood. Drug effects on ventilation include the inhibition of the
chemoreceptive response and the decline of respiratory neural activity.
A comprehensive description of drug effect modeling is provided in the following
paragraphs. See Figure 3.8 for a block-diagram representation of the extended
model as proposed by Magosso and colleagues [129].
Opioid effect on chemoreceptors
In the model it is assumed that fentanyl acts on chemoreceptive ventilatory regu-
lation by reducing the mechanism gain. The attenuation is a nonlinear function of
opioid plasma concentration. The higher drug content in blood, the stronger the
effect on ventilation. Moreover, drug effects are modeled in such a way that the
opioid exerts the same attenuation on both the peripheral and the central chemore-
flex response. This assumption is based on the hypothesis that fentanyl acts on
the respiratory neurons in the medulla rather than at a chemoreceptive level. The

3.3 Respiratory model structure 53
information coming from peripheral and central chemoreceptors is processed in the
medulla. Therefore a depression of medullary neural activity results in the inhi-
bition of chemoreflex sensitivities. Evidence that opioid drugs act via a unique
mechanism on the same central site can be found in the literature [129]. Neverthe-
less, it is worth mentioning that other authors report different theories. Sarton and
coworkers, for instance, proposed the idea that drug mechanism and site of action
are receptor-specific [167]. Is such case the effect of the drug on the central and
peripheral chemoreceptive sensitivity would differ.
As mentioned above, the model makes use of a single attenuating factor to mimic
the influence of fentanyl on both chemoreceptive drives. Equations 3.25 and 3.27
are modified as follows:
d∆VEP (t)dt
= 1
τp⋅ −∆VEP +A(Cf) ⋅Gp ⋅ [fpc(t −Dp) − fpc0] (3.31)
d∆VEC(t)dt
= 1
τc⋅ −∆VEC +A(Cf) ⋅Gc ⋅ [Pb,CO2
(t −Dc) − Pb,CO20] (3.32)
where Cf stands for fentanyl blood concentration andA(Cf) represents the concentration-
dependent attenuation factor. The dependence of the attenuating factor on Cf is
described by the following equations:
Astatic = A0 ⋅ [1 − 1
2⋅ ( Cf
C50)γA] ⋅H A0 ⋅ [1 − 1
2⋅ ( Cf
C50)γA] (3.33)
dA
dt= 1
τf⋅ [−A +Astatic(Cf)] (3.34)
Astatic is the steady state drug concentration-effect relationship, which is expressed
in the form of a power model. Some authors report that the power model is more
accurate than the commonly used Emax model in reproducing physiological re-
sults [55]. Therefore a power function is used here for pharmacodynamic modeling.
Nevertheless, other studies showed that the power model performs relatively poorly
in describing the observations when compared to a sigmoidal Emax function [25].
Such divergent conclusions demonstrate the importance of evaluating different mod-
els in pharmacodynamic research.
In Equation 3.33 the term A0 is a constant parameter that represents the value
of the attenuating factor in the absence of drug. A0 is defined equal to 1 so that for
Cf = 0, Astatic = A0 = 1. Hence in steady state conditions the attenuation factor
A(Cf) assumes a unitary value and chemoreceptive sensitivities remain unaltered.
C50 and γA are constant parameters. The C50 (effective concentration 50) is
the fentanyl concentration level that produces an effect of 50%, that is, the blood

54 3 Feedback control of sedation
concentration causing a 50% decline in ventilation. γA is the power coefficient of
the pharmacodynamic model. C50 and γA were given values that could reproduce
clinical results in terms of CO2 response curve changes. As mentioned in Section
3.2.1, a depression of the slope and a rightward shift can be observed in the CO2 re-
sponse curve after administration of anesthetic (Figure 3.2). The values assigned to
C50 and γA allow for the reproduction of measured changes in CO2 responsiveness
(Figure 3.9).
Finally, H() stands for the Heaviside function which prevents chemoreceptor
gains from taking on negative values when Cf ≥ 21/γA ⋅C50.
In Equation 3.34, τf is the mechanism time constant. It takes into account
the time required to achieve equilibration between plasma concentration and effect
site concentration (medullary concentration). τf in the model was assigned the
value of 4 min; such value was chosen in accordance with the findings reported in
physiological literature [129].
Equation 3.33 and 3.34 show that the dependence of the attenuating factor on Cf
includes a non-linear static function and a first order low pass dynamics. The reason
A(Cf) has such mathematical description is discussed in the following. Magosso
and colleagues [129] did not include an effect compartment in their extended model.
The pharmacodynamic power model receives as an input the plasma concentration
rather than the effect compartment concentration. As explained in Section 2.3.2,
the plasma concentration does not always correlate with the clinical effects of anes-
thetic drugs [200]. To obtain a hysteresis-free relationship between drug concentra-
tion and pharmacological effect, an effect site compartment is added to the standard
three-compartment pharmacokinetic model [121]. The effect compartment per def-
inition does not take part in drug mass exchanges. Movement of the drug between
the central compartment and the effect site compartment is considered to be a first
order process with a specific time constant [3]. Hence the effect site concentration
is computed from plasma concentration via a first order dynamics. The pharma-
codynamic model then evaluates the magnitude of the effect through a nonlinear
static function. The mechanism that determines A(Cf) in the model has to mimic
the role of the effect compartment. This is the reason why the attenuation term
depends on Cf via a non-linear static function and a first order dynamics.
Opioid effect on respiratory neurons
In the model the effect of fentanyl includes a direct inhibition of the spontaneous
respiratory activity. Several experimental findings support the existence of a central
depressant mechanism of the drug, besides the influence on chemoreflex gains [129].

3.3 Respiratory model structure 55
The equation for minute ventilation (Equation 3.46) is modified as follows:
VE = (VE0 −K(Cf) +α ⋅∆VEP +∆VEC) ⋅H(VE0 −K(Cf) + α ⋅∆VEP +∆VEC) (3.35)
to add the term K(Cf) which mimics the drug inhibitory influence on the res-
piratory neural centers. ∆VEP and ∆VEC result from Equation 3.31 and 3.32,
respectively.
The inhibitory term depends on the fentanyl plasma concentration. The mech-
anism effect is evaluated through a static relationship and a first order dynamics,
like the chemoreceptive attenuation term A(Cf) discussed in the above. The static
relationship Kstatic is a power function of fentanyl concentration Cf . It exhibits an
upper saturation to prevent the occurrence of apnea after a bolus injection. Opioid
boluses produce temporarily an extremely high plasma concentration of the drug,
but clinical experience shows that patients do no become apneic. The mathematical
description of the mechanism is:
Kstatic =⎧⎪⎪⎨⎪⎪⎩K0 ⋅C
γK
f for Cf ≤ Cf
K0 ⋅Cf
γKfor Cf > Cf
(3.36)
dK
dt= 1
τf⋅ [−K +Kstatic(Cf)] (3.37)
where τf is the same time constant appearing in Equation 3.34. The same equi-
libration rate is used for both mechanisms because the basic respiratory rhythm
originates in the medulla, where chemoreflex stimuli are processed. Therefore the
two regulatory systems have the same site of action [129].
K0, γK , Cf are constant parameters; their values are listed in Table 3.3. Para-
metric estimation was carried out in order to achieve model results consistent with
the literature. Clinical data considered for parameter selection was measured by
Mildh and coworkers in healthy volunteers at increasing steady state plasma concen-
trations [137]. The data comprise minute ventilation, arterial O2 partial pressure
and arterial CO2 partial pressure recordings at different levels of fentanyl plasma
concentration.
Simulation-based results provided by the model are presented in the following
section.

56 3 Feedback control of sedation
+
×
×
×
VA
CVD
deadspace
−
VE0
K(Cf)Central Chem.
∆VEP
∆VEC
A(Cf)
A(Cf)Peripheral Chem.
Lungs
Brain
Tissues
Mt,CO2, Mb,CO2
Mt,O2, Mb,O2
PI,O2PI,CO2
VE
Blood flow
regulation
Pb,CO2
Pb,O2
Pa,O2
Pa,CO2
Pt,CO2
Pt,O2
Figure 3.8: Block diagram representation of the extended model. Shaded blocks
denote the effects of the opioid on the respiratory system. Cf : fentanyl
plasma concentration; A(Cf): fentanyl attenuation of peripheral and
central chemoreceptive response; K(Cf): fentanyl direct inhibition of
the respiratory activity. Adapted from the literature [129].

3.3 Respiratory model structure 57
Figure 3.9: Opioid induced changes in CO2 sensitivity. Experimental results re-
ported in the literature are compared to model simulations performed
at four different steady state levels of fentanyl plasma concentration
(Cf = 1, 2, 3, 4 ng ml−1). In vivo sensitivities are measured with the re-
breathing technique. The experimental conditions are reproduced in the
simulation environment at each concentration level. This is achieved by
linearly increasing PACO2 by 20 mmHg over 4 minutes (starting from
baseline) and evaluating ventilation at the beginning and at the end of
each interval. Adapted from the literature [129].
Ventilatory regulation in the presence of fentanyl
A0 = 1 γA = 0.5457 C50 = 2.571 ng/ml
K0 = 10 (l/min)(ng/ml)−1 γK = 0.5 Cf = 4 ng/ml
τf = 4 min
Table 3.3: Parameter values for drug-induced ventilatory depression.

58 3 Feedback control of sedation
3.4 Model analysis
In this section we shall analyze the response of the model under different condi-
tions. Simulated results will be compared to experimental observations in order to
determine whether the model provides an adequate description of the respiratory
control system. Section 3.4.1 evaluates model behavior by means of the alveolar
alveolar gas equation, a mathematical tool well known to respiratory physiologists.
Ventilatory system response in the absence of drug is assessed in Section 3.4.2. Of
particular interest for our purposes is the ventilatory response in the presence of
drug, discussed in Section 3.4.3.
3.4.1 Assessment of the gas exchange system
A method to evaluate model adequacy in describing gas exchange phenomena be-
tween tissular compartments relies on use of the alveolar gas equation. In the
medical field, this equation is frequently employed to estimate O2 alveolar pres-
sure from CO2 arterial pressure. We now describe how the alveolar gas equation is
derived, and the way it is used to assess model performance.
Metabolism refers to the chemical processes occurring within a living organism
in order to maintain life. Such processes consume oxygen and produce carbon
dioxide as a by-product. The ratio of produced CO2 to consumed O2 is called
respiratory quotient (RQ). The respiratory quotient depends on the metabolic
substrates supplied for energy production. If carbohydrates are the substrate, RQ
= 1; if proteins, RQ = 0.8; if lipids, RQ= 0.7. Cells, however, do not rely on a
single substrate so that on average RQ amounts to 0.8 circa.
Oxygen and carbon dioxide are exchanged between the alveoli and the pulmonary
capillaries. The ratio VCO2/VO2 (V being the exchanged volume) is called res-
piratory ratio (R). In steady state R = RQ, but they can differ during tran-
sients. For example, when a person hyperventilates RQ remains approximately
constant while R rises. The volume of exchanged carbon dioxide increases as more
CO2 is eliminated from blood during hyperventilation. Oxygen uptake, however,
changes slightly because of hemoglobin saturation and low physical solubility of
O2 in plasma. Therefore, the overall result is that the ratio VCO2/VO2 increases
during periods of hyperventilation.
The level of alveolar oxygen is the result of a balance between O2 delivery to the
alveoli and O2 uptake by the perfusing blood. Oxygen delivery depends on alveolar
ventilation and the level of O2 in the inspired air, whereas O2 uptake by the blood
depends on tissular oxygen consumption. Therefore:

3.4 Model analysis 59
VO2= VA ⋅ (FI,O2
−FA,O2) (3.38)
FI,O2− FA,O2
= VO2
VA
(3.39)
Given that
PI,O2−PA,O2
= (FI,O2− FA,O2
) ⋅ (Patmospheric − PH2O vapor) (3.40)
we have
PI,O2−PA,O2
= VO2
VA
⋅ (P atmospheric − P H2O vapor) (3.41)
= VO2
VA
⋅ (P atmospheric − 47)Moveover,
if R = 1 Ô⇒ PI,O2− PA,O2
= PA,CO2(3.42)
if R ≠ 1 Ô⇒ PI,O2− PA,O2
= PA,CO2
R(3.43)
In an ideal lung PACO2 = PaCO2, so that (for R = 0.8)
PI,O2− PA,O2
= Pa,CO2
R(3.44)
This mathematical equation is termed alveolar gas equation, and it is valid under
steady state conditions. Filley [153] proposed an alternative equation which is
applicable also to non-steady state cases:
PI,O2− PA,O2
= Pa,CO2
R⋅ [1 − FI,O2
(1 −R)] (3.45)
We now make use of Equation 3.45 to determine whether the model is able to predict
correct alveolar PO2 results. To this purpose, the simulation of a fentanyl bolus
injection (0.5 mg) is performed. We consider the case of a drug bolus because
it induces a strong and rapid respiratory decline. Therefore PAO2 is expected
to undergo major changes, enabling the appraisal of model performance through
the alveolar gas equation. Drug infusion and opioid effect on ventilation will be
extensively covered in Section 3.4.3.
Amongst model outputs, PAO2 and PaCO2 time courses are taken into consider-
ation. The former illustrates model response to the bolus, while the latter enables

60 3 Feedback control of sedation
0 2 4 6 8 1020
30
40
50
60
70
80
90
100
110
Alv
eola
r P
O2 [m
mH
g]
time [min]
0 2 4 6 8 1020
30
40
50
60
70
80
90
100
110
Alv
eola
r P
O2 [m
mH
g]
time [min]
Figure 3.10: Alveolar PO2 changes in response to a fentanyl bolus (0.5 mg). Bolus
administration occurs at time t = 0 [min]. Input drug plasma con-
centration coincides with the first 10 minutes of Figure 3.18 Cf time
course. Top: alveolar oxygen pressure resulting from model simula-
tion. Bottom: alveolar oxygen pressure computed via the alveolar gas
equation (Equation 3.45). The equation is computed for FIO2 = 0.21,
PIO2 = 149 mmHg, R = 0.8. PaCO2 values considered for equation
solving result from model simulation. The agreement between simu-
lated and computed PAO2 is fully satisfactory.
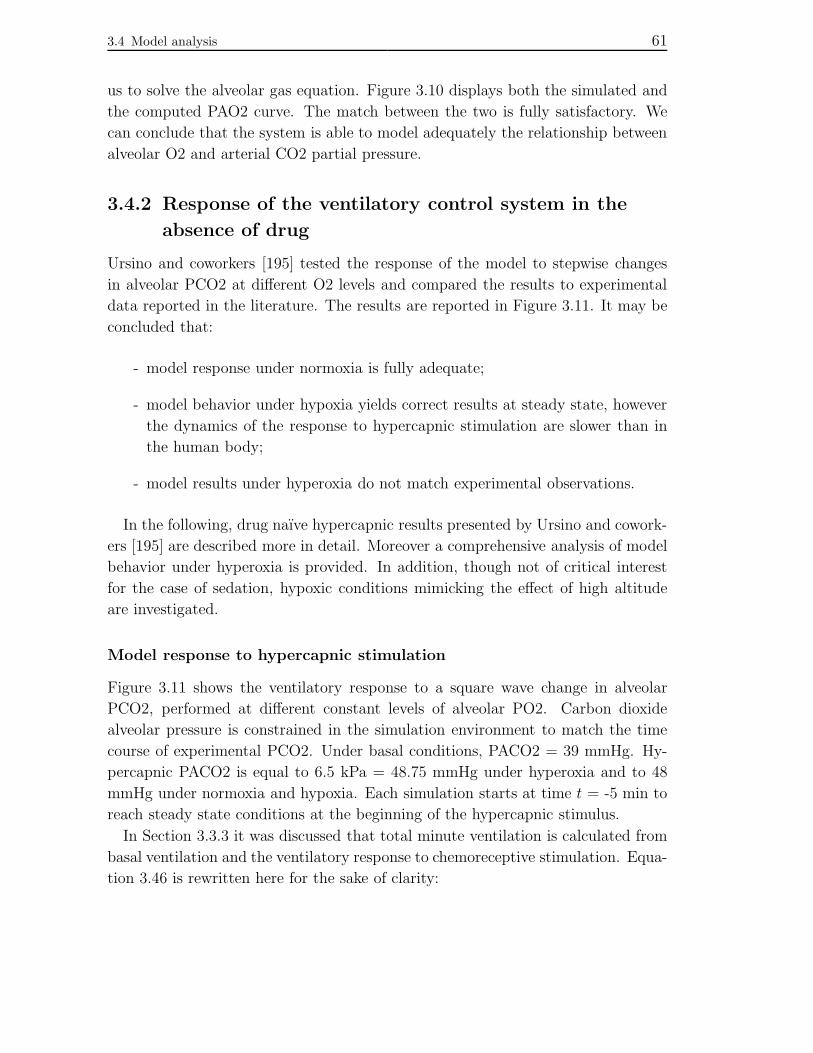
3.4 Model analysis 61
us to solve the alveolar gas equation. Figure 3.10 displays both the simulated and
the computed PAO2 curve. The match between the two is fully satisfactory. We
can conclude that the system is able to model adequately the relationship between
alveolar O2 and arterial CO2 partial pressure.
3.4.2 Response of the ventilatory control system in the
absence of drug
Ursino and coworkers [195] tested the response of the model to stepwise changes
in alveolar PCO2 at different O2 levels and compared the results to experimental
data reported in the literature. The results are reported in Figure 3.11. It may be
concluded that:
- model response under normoxia is fully adequate;
- model behavior under hypoxia yields correct results at steady state, however
the dynamics of the response to hypercapnic stimulation are slower than in
the human body;
- model results under hyperoxia do not match experimental observations.
In the following, drug naıve hypercapnic results presented by Ursino and cowork-
ers [195] are described more in detail. Moreover a comprehensive analysis of model
behavior under hyperoxia is provided. In addition, though not of critical interest
for the case of sedation, hypoxic conditions mimicking the effect of high altitude
are investigated.
Model response to hypercapnic stimulation
Figure 3.11 shows the ventilatory response to a square wave change in alveolar
PCO2, performed at different constant levels of alveolar PO2. Carbon dioxide
alveolar pressure is constrained in the simulation environment to match the time
course of experimental PCO2. Under basal conditions, PACO2 = 39 mmHg. Hy-
percapnic PACO2 is equal to 6.5 kPa = 48.75 mmHg under hyperoxia and to 48
mmHg under normoxia and hypoxia. Each simulation starts at time t = -5 min to
reach steady state conditions at the beginning of the hypercapnic stimulus.
In Section 3.3.3 it was discussed that total minute ventilation is calculated from
basal ventilation and the ventilatory response to chemoreceptive stimulation. Equa-
tion 3.46 is rewritten here for the sake of clarity:

62 3 Feedback control of sedation
0 5 10 15 20
0
10
20
30
40
Time [min]
Ven
tilat
ion
[l m
in−
1 ]
20
25
30
35
40
45
50
55
PA
CO
2 [mm
Hg]
Hypercapnia during hyperoxia
0 2 4 6 8 10 12
35
40
45
50
55
Time [min]
PA
CO
2 [mm
Hg]
11
22
33
44
55
Ven
tilat
ion
[l m
in−
1 ]
Hypercapnia during normoxia
0 2 4 6 8 10 12
35
40
45
50
Time [min]
PA
CO
2 [mm
Hg]
11
22
33
44
55
Ven
tilat
ion
[l m
in−
1 ]
Hypercapnia during hypoxia
Figure 3.11: Left: experimental data reported in the literature [54, 12]: minute
ventilation time courses observed in healthy volunteers. Right: sim-
ulated time course of minute ventilation (blue line) in response to a
square change in alveolar PCO2 (red line). Hypercapnic stimulation
is performed under hyperoxia (top), normoxia (middle) and hypoxia
(bottom). Adapted from the literature [195].

3.4 Model analysis 63
VE = (VE0 + α ⋅∆VEP +∆VEC) ⋅H(VE0 +α ⋅∆VEP +∆VEC) (3.46)
where VE0 is the value of minute ventilation under basal conditions and ∆VEP
and ∆VEC represent the changes in ventilation produced by the peripheral and
central chemoreceptive activity, respectively. The multiplicative term α refers to
the hypoxic ventilatory inhibition (CVD) described in (3.3.3).
The agreement between model results and clinical observations is partially sat-
isfactory. The figure shows that the model is able to correctly predict the respi-
ratory sensitivity to CO2 changes under normoxia (Figure 3.11, middle diagrams).
Under hypoxia steady state results exhibit good agreement with experimental ob-
servations, however model dynamics in response to the hypercapnic stimulation
is slower than that of the human body (Figure 3.11, lower panels). Finally, the
top diagrams of Figure 3.11 display the time course of minute ventilation under
hyperoxic conditions. The disagreement between results cannot be neglected. The
model predicts a strong depressant effect of hyperoxia on ventilation leading to
apnea which is not supported by clinical evidence. Minute ventilation is equal to 0
l min−1 in basal PACO2 conditions; it rises to positive values (approximately 12.5
l min−1) only at the onset of the hypercapnic stimulus. Simulated results can be
explained as follows. The excess of oxygen in the alveolar compartment causes pe-
ripheral chemoreceptors to exert an inhibitory effect on ventilation (∆VEP = -10 l
min−1 circa). Central chemoreceptors work as a carbon dioxide sensor, therefore in
basal PACO2 conditions their ventilatory stimulation is null. The outcome is that
simulated minute ventilation drops to zero. Conversely, apnoea does not occur in
healthy volunteers exposed to a slight increase in FIO2, such as the one determining
a PAO2 of 200 mmHg. Spontaneous ventilation in the human body results from the
rhythmic activity of respiratory centres in the brainstem. The breathing stimulus
is fundamental for survival, therefore inhibition by respiratory gases is limited and
cannot induce apnoea.
Individual contributions of central and peripheral chemoreceptors to minute ven-
tilation are purposely not displayed in Figure 3.11. Such results are in fact difficult
to interpret. No experimental data regarding the quantitative effect of chemore-
ceptive activity on ventilation are reported in the literature. Simulated results are
therefore of mere speculative nature. Nevertheless, in Ursino and coworkers [195]
the interested reader can find a discussion on the response of the regulatory system
in terms of chemoreceptive components ∆VEP and ∆VEC .

64 3 Feedback control of sedation
Model response under hyperoxia
Exposure to hyperoxia is investigated further to better characterize model behavior
and performance under such condition.
Ventilatory regulation in the model is performed by chemoreceptors and the
central ventilatory depression. These mechanisms exert their action on minute
ventilation depending on arterial O2 and CO2 content. It is of interest for our
investigation to evaluate how increased fractions of inspired oxygen reflect on the
compartmental gas exchange system. We turn to clinical expertise to determine
what the expected behavior is.
In the medical practice the pulmonary shunt fraction is estimated through the
following procedure. The patient is provided with 100% oxygen to breathe (FIO2 =
1). At sea level, the alveolar O2 partial pressure is:
PA,O2= P atmospheric − P H2O vapor − PA,CO2
= (3.47)
= 760 − 47 − 40 = 673 [mmHg]
where P atmospheric is the barometric pressure, P H2O vapor is the vapor pressure of
water when air is saturated, and PACO2 is the alveolar carbon dioxide pressure
under basal conditions. The pulmonary shunt is the mixing of deoxygenated blood
from pulmonary veins with oxygenated blood coming from pulmonary capillaries.
Therefore mixed blood has a lower oxygen content than the blood in pulmonary
capillaries. The shunt fraction can be estimated by measuring arterial PO2 and
comparing it to the alveolar pressure determined above (Equation 3.48). This
method only works for FIO2 = 1. In fact, ventilation and perfusion heterogeneity
can produce a reduction in arterial PO2 which cannot be distinguished from the
effect of a shunt unless FIO2 = 1. Clinical observations suggest that, when 100%
oxygen is administered, the arterial partial pressure has a value in the range 450-500
mmHg. Refer to Figure 3.12 for a graphical representation of these phenomena.
Simulating the effect of exposure to 100% O2 in the model yields results that
do not entirely agree with clinical experience. For FIO2 = 1, the model quite
correctly predicts that PAO2 = 655 mmHg, while PaO2 results to be equal to 190
mmHg. The reason for the mismatch between simulated and experimental arterial
partial pressure can be explained as follows. Blood storage of respiratory gases
in the model is described by a set of equations proposed by Spencer et al. [176].
The validity of the fit provided by the equations is stated to be in the range of
0-120 mmHg of oxygen partial pressure and 0-80 mmHg of carbon dioxide partial
pressure [176]. Agreement between experimental observations and results provided
by the equations is not assured for pressure levels outside the specified ranges.

3.4 Model analysis 65
Figure 3.12: Oxygen dissociation curve. O2 content in blood is associated with
oxygen partial pressure. The diagram illustrates the O2 content in
pulmonary capillaries and in mixed blood, and the relative alveolar-
arterial PO2 difference.
0 100 200 300 400 500 600 7000
4
8
12
16
20
24
P O2 [mmHg]
O2 c
onte
nt [v
ol %
]
Figure 3.13: The oxygen dissociation curve employed in [195] for gas exchange mod-
eling. Blood O2 content in basal PaCO2 conditions is shown. The
agreement with experimental data is satisfactory only over the PaO2
range of 0-120 mmHg.

66 3 Feedback control of sedation
It results that under hyperoxia the equations provide an imprecise description of
oxygen content in blood. In fact:
- at high O2 pressure, the curve predicts an oxygen content which is lower than
physiological values;
- above PO2 = 200 mmHg, the curve becomes horizontal predicting saturation
of oxygen content in blood.
In the model the mixing of oxygenated blood from the alveolar compartment
with shunted venous blood produces a correct, moderate reduction in blood O2
content. However, such small decrease in content produces a substantial change
in partial pressure due to the flatness of the curve at high PO2. This is the rea-
son why exposure to hyperoxic FIO2 produces a mismatch between simulated and
experimental arterial PO2.
Improving the description of blood gas storage would require the definition of
a different set of equations relating PaO2, PaCO2 to ca,O2, ca,CO2
, and vice versa.
This issue will be addressed in Section 3.5.1.
Model response under hypoxia
Further investigation of model behavior under hypoxia is carried out. The objective
is to determine whether ventilatory regulation is described accurately over a wide
range of hypoxic conditions. To this purpose, we study the respiratory response to
stepwise, acute exposure to simulated altitude (3000 and 6000 m above sea level).
It is well known that barometric pressure decreases with altitude. A reduction of
atmospheric pressure determines a proportional decrease in oxygen partial pressure.
For example, at 3000 m barometric pressure decreases to 523 mmHg and oxygen
partial pressure to 110 mmHg. Although the fraction of inspired oxygen is un-
changed compared to sea level (FIO2 = 0.21), we are under hypoxic conditions. A
non-acclimatized subject breathing atmospheric air at high altitude hyperventilates
in order to compensate for the decreased inspiratory PO2.
To reproduce acute exposure to hypoxia, we study the response of the model to
negative square changes in inspired O2 partial pressure. During 30-minute intervals,
PIO2 is kept constant at 100 mmHg and at 73 mmHg to simulate oxygen pressure
in air at 3000 m and 6000 m, respectively. PAO2 and PACO2 model results are
displayed in Table 3.4, together with clinical observations reported in the literature
[92]. Simulation results and experimental data are in excellent agreement at 3000 m
altitude. The match is not as adequate at a simulated altitude of 6000 m. Reported

3.4 Model analysis 67
Exposure to altitude
Altitude Barometric PO2 PAO2 PACO2
[m] pressure [mmHg] [mmHg] [mmHg] [mmHg]
0 760 159 104 40
3000 523 110 67 (67) 36 (35)
6000 349 73 40 (34) 24 (34)
Table 3.4: Atmospheric, oxygen, and alveolar O2 and CO2 pressure at different
altitudes above sea level. Physiological observations are compared to
model results (shown in brackets). Clinical data are reported in [92].
observations illustrate that at this altitude, physiological PAO2 and PACO2 are
respectively higher and lower than model predictions. However, those experimental
observations may be be explained as resulting from a state of depressed metabolism
in the subjects monitored during the study.
Guyton and coworkers [92] report that exposure to low-pressure air at very high
altitude causes an increase in ventilation at rest of maximum 65%. Cardiac output
is reported to increase by approximately 30%. These physiological responses occur
immediately after exposure and compensate for the reduced availability of oxygen
in inspired air. Figure 3.14 displays simulation results in terms of minute ventila-
tion and cardiac output. As expected, the model counteracts the decrease in PIO2
by increasing ventilation. The match between model results and experimental ob-
servations is satisfactory. For example, at 6000 m the model predicts a steady state
increase in cardiac output of 30%. The increase in ventilation amounts to 27%.
To determine the influence of cardiovascular regulation on the ventilatory re-
sponse of the model, the simulations described above are repeated neglecting the
effect cardiac output changes. That is, Equation 3.16 and 3.18 are manipulated so
that
⎧⎪⎪⎨⎪⎪⎩dyO2/dt = 0
dyCO2/dt = 0
Ô⇒
⎧⎪⎪⎪⎪⎪⎨⎪⎪⎪⎪⎪⎩
Qb(t) = Qb0
Qt(t) = Qt0
Q(t) = Qb0 +Qt0 = 5 l min−1
(3.48)
All other simulation conditions are identical. Model results are displayed in Figure
3.14 together with the ventilation time course for unconstrained Q. Given that

68 3 Feedback control of sedation
4.5
5
5.5
6
6.5
7
Q[l
min−
1]
0 30 60 90 120 150
149
73
110
PIO
2[m
mH
g]
Time [min]
6000 maltitude
3000 maltitude
6
8
10
12
14
VA
[lm
in−
1]
0 30 60 90 120 150
149
73
110P
IO2
[mm
Hg]
Time [min]
6000 maltitude
3000 maltitude
Figure 3.14: Circulatory and respiratory response to simulated altitude. Exposure
to low-pressure air occurs stepwise. Each step lasts for 30 min, starting
at time t = 30 min (3000 m altitude) and t = 90 min (6000 m altitude).
Top: cardiac output in response to altitude (blue line). To evaluate the
effect of cardiovascular regulation on the ventilatory response, a second
simulation was performed constraining cardiac output to its baseline
value (Q = 5 l min−1) (red dashed line). Bottom: ventilatory response
to simulated altitude. The ventilation time course for unconstrained
Q (blue line) is compared with the response obtained for constant
Q = 5 l min−1 (red dashed line). The discrepancy between the two
results is very small. At 6000 m altitude, VE changes from 8.31 l
min−1 (unconstrained Q) to 8.42 l min−1 (constant Q).

3.4 Model analysis 69
the dynamics of cardiovascular regulation are slower than those of ventilation, an
appreciable difference between the two cases is obtained only at steady state. How-
ever, the discrepancy is very small. For example, at 6000 m altitude the difference
in minute ventilation at steady state between the two cases is of about 1.5%. The
divergence in cardiac output, however, amounts to 30%, given that Q is constrained
to the constant value of 5 l min−1.
What can be inferred about this model is that small changes in ventilation can
compensate for relatively large adjustments in cardiac output. Indeed, such premise
is confirmed under several simulated conditions. In principle, it could be justifi-
able to eliminate the systems regulating cardiac output in order to attain a simpler
mathematical representation of the ventilatory system. This would lead to a reduc-
tion in model complexity, number of parameters and variables, and computational
time.
Summary of drug naıve model results
We can summarize the results discussed so far as follows:
- under normoxia, the model response is in good agreement with experimental
data;
- under hypoxia, simulations match experimental results under steady state
but not during transients;
- under hyperoxia, the model predicts a strong depressant effect of oxygen on
ventilation which is not supported by the literature.
Figure 3.15 and 3.16 recapitulate these results. The two diagrams display model
outcomes relating alveolar ventilation to arterial partial pressure. The results il-
lustrate the ventilatory response of the model under exposure to a wide range of
alveolar O2 and CO2 levels. In the simulations, alveolar oxygen partial pressure
is kept constant while stepwise changes in PACO2 are performed to evaluate the
ventilatory response of the model. Simulated alveolar O2 pressure values range
from hypoxia to hyperoxia (40, 60, 100, 300, 700 mmHg). Similarly, alveolar CO2
changes range from hypocapnia to hypercapnia (5-mmHg step increases from 30 to
60 mmHg). The two representations are helpful in emphasizing different aspects of
model behavior. Figure 3.15 highlights how hyperoxia produces ventilatory inhibi-
tion leading to apnea in basal PACO2 conditions. Figure 3.16 highlights that under
hyperoxic conditions the model predicts PaO2 values below 200 mmHg, which do
not match clinical observations.

70 3 Feedback control of sedation
30 35 40 45 50 55 60
0
10
20
30
40
50
60
PaCO2 [mmHg]
Alv
eola
r ve
ntila
tion
[l m
in−
1 ]40 mmHg
100mmHg
700 mmHg
300 mmHg
PAO2 = 60 mmHg
Figure 3.15: CO2 response curves for different PAO2 levels. Stepwise changes in
PACO2 are performed at constant alveolar O2 pressure. Under hyper-
oxia (PAO2 = 300, 700 mmHg) the model predicts a strong ventilatory
decline.
3.4.3 Ventilatory depressant effect of the opioid
Intravenous anesthesia is delivered with the injection of anesthetic drugs into the
bloodstream. When the rate of administration is very high and the duration is in the
order of a few seconds, we speak of a bolus injection. When drug administration
takes place over the course of minutes, we speak of drug infusion. Anesthetists
use a combination of boluses and infusions to deliver anesthesia. Therefore both
administration profiles are to be considered to assess the adequacy of the model in
describing the pharmacological effects on ventilation. Figure 3.17 and 3.18 display
model results following a constant infusion and a bolus administration, as reported
by Magosso and coworkers [129].
Figure 3.17 shows the response of the model to increasing steady state plasma
concentration levels. Results of interest for the purposes of this work are minute
ventilation, arterial O2 and CO2 partial pressure. Simulation results are compared

3.4 Model analysis 71
20 40 60 80 100 120 140 160 180 200 220
2030
4050
6070
0
10
20
30
40
50
60
PaO2 [mmHg]PaCO2 [mmHg]
Alv
eola
r ve
ntila
tion
[l m
in−
1 ]
Figure 3.16: O2-CO2 response surface. Under hyperoxia PaO2 takes on values that
are lower than physiologically expected. Line color code: colored lines
refer to the same PAO2 values as in Figure 3.15. Green line: alveolar
ventilation simulation results under baseline PACO2 conditions.
to experimental observations recorded in healthy volunteers by Mildh and cowork-
ers [137]. Simulation results provide an acceptable fit to experimental findings,
therefore we may conclude the model is able to predict the pharmacological effect
of fentanyl on ventilation during drug infusion.
Figure 3.18 displays the response of the model to a fentanyl bolus (0.5 mg).
Simulated observations are compared with clinical data reported by Stoeckel and
coworkers [129]. Fentanyl plasma concentrations measured in vivo after drug ad-
ministration are used to compute model plasma concentration, Cf . The response of
the model to drug infusion is reported here in terms of minute ventilation and arte-
rial PO2 and PCO2. Results are in fair accord with the experimental observations,
as can be inferred from Figure 3.18. The model is able to reasonably simulate the
time course of respiratory inhibition caused by a drug bolus.
However, it does not capture the rapid onset of fentanyl-induced ventilatory

72 3 Feedback control of sedation
0.1 0.16 0.25 0.4 0.630
0.2
0.4
0.6
0.8
1
1.2
1.4
1.6
Fentanyl plasma concentration [ng/ml]
Nor
mal
ized
min
ute
vent
ilatio
n [−
]
0.1 0.16 2.5 0.63 1 1.6 2.5 4 6.3 100.4
0.6
0.8
1
1.2
1.4
Fentanyl plasma concentration [ng/ml]
Nor
mal
ized
PaO
2 [−
]
0.1 0.16 0.25 0.4 0.63 1 1.6 2.5 4 6.30.8
0.9
1
1.1
1.2
1.3
1.4
1.5
1.6
1.7
1.8
Fentanyl plasma concentration [ng/ml]
Nor
mal
ized
PaC
O2
[−]
Figure 3.17: Simulated minute ventilation, PaO2 and PaCO2 (continuous lines)
under steady state conditions for increasing levels of fentanyl plasma
concentration. Model results are compared to experimental data ob-
served by Mildh and coworkers in healthy volunteers under steady state
conditions [137]. All results are normalized with respect to the basal
value, i.e. to the value for Cf = 0 ng/ml.

3.4 Model analysis 73
0 50 100 150 200 250
1
2
5
10
20
50
Time [min]
Fen
tany
l pla
sma
conc
entr
atio
n [n
g m
l−1 ]
0 50 100 150 200 2500
0.2
0.4
0.6
0.8
1
1.2
1.4
Time [min]N
orm
aliz
ed m
inut
e ve
ntila
tion
[−]
0 50 100 150 200 2500
0.2
0.4
0.6
0.8
1
1.2
Time [min]
Nor
mal
ized
PaO
2 [−
]
0 50 100 150 200 2500.8
1
1.2
1.4
1.6
1.8
Time [min]
Nor
mal
ized
PaC
O2
[−]
Figure 3.18: Ventilatory response to a fentanyl bolus (0.5 mg). Top left diagram:
in vivo time course of fentanyl plasma concentration is approximated
with a biexponential function to determine model input Cf . Other di-
agrams: simulated minute ventilation, PaO2 and PaCO2 (continuous
lines) are compared to clinical observations reported by Stoeckel and
coworkers [129] (bullets, mean ± SD).

74 3 Feedback control of sedation
decline. Minute ventilation shows a decrease which starts immediately after bo-
lus administration but reaches a minimum in approximately 7 minutes. It is not
known when the experimental minimum takes place because clinical data are sparse.
However, physiological observations exhibit a strong ventilatory inhibition after less
than 3 minutes, illustrating the fast onset of the pharmacological effect in the body.
Although the model provides a fairly satisfactory match of the experimental data
considered so far, the description of pharmacological effects proposed by Magosso
and coworkers presents the following drawbacks:
- drug effects on the regulatory mechanisms that control ventilation in the
human body are not wholly understood. Particularly, the quantitative as-
sessment of pharmacological effects on isolated regulatory mechanisms (as
attempted with the terms A(Cf),K(Cf)) is not supported by sound experi-
mental evidence in the literature;
- the pharmacodynamic description used in this model involves 7 parameters
(see Table 3.3). As the parameter estimation requires a considerable amount
of costly experimental data, it is difficult to apply this model to other drugs.
For instance, it is not possible to employ the C50 potency values reported
in the literature because the pharmacodynamic model does not consider this
parameter.
Therefore, we suggest to substitute the pharmacodynamic description proposed
by Magosso and coworkers [129] with the Emax sigmoid model discussed in Section
2.3. The proposal will be covered with detail in Section 3.5.4.
3.5 Proposed model improvements
The discussion in Section 3.4 was helpful to identify the aspects of ventilatory
regulation that the model is not able to describe satisfactorily. In the following
a few model changes are proposed with the objective to improve the agreement
between model results and physiological observations and to adapt the model to
the requirements of the research project.
Section ??n Section 3.5.3 we suggest a possible solution for the modeling of
minute ventilation under hyperoxia. Section 3.5.4 proposes the use of a different
PD representation for the modeling of pharmacological effect on ventilation.

3.5 Proposed model improvements 75
Oxygen blood dissociation curve
a = 3.22 ⋅10−2 mmHg−1 b = 8.153 ⋅10−3 mmHg−1 c = 2.646
= 0.2415 kPa−1 = 6.12 ⋅10−2 kPa−1
αO2= 1.32 µmol(mmHg l)−1 K = 14.74 mmHg CO2
= 8.848 mmol/l
= 9.9 µmol(kPa l)−1 = 1.965 kPa
Table 3.5: Parameter values for the modified oxygen dissociation curve.
3.5.1 Blood dissociation curves
As discussed in Section 3.3.1, oxygen and carbon dioxide transport in blood is
described with mathematical equations modeling O2 and CO2 dissociation and
accounting for the Bohr and Haldane effects [176]. The agreement with experimen-
tal data measured in whole blood (hemoglobin content = 15 g/dl, base excess =
0 mEq/l at 37 C) is adequate in the range 0-120 mmHg for PO2 and 0-80 mmHg
for PCO2. However, these dissociation curve equations disregard the amount of
oxygen carried in dissolved form. This term becomes significant when breathing
oxygen-enriched air, a condition that is relevant to this study. Therefore we modify
the original equation describing O2 molar concentration in blood as a function of
PO2 and PCO2 (Equation 4 in [176]) as follows:
CO2= CO2
[PO2
1+bP CO2
K(1+aP CO2)]
c
1 + [PO2
1+bP CO2
K(1+aP CO2)]
c +αO2PO2
(3.49)
where αO2is the Henry constant (solubility coefficient) of oxygen in blood and
the term αO2PO2
is the contribution of dissolved oxygen to total blood content, in
accord with Henry’s law. Linear least squares fit values of Equation 3.49 parameters
are listed in Table 3.5. CO2holds physiological significance since it corresponds to
the oxygen molar concentration in blood for 100% saturated hemoglobin. Because
the maximum O2 capacity of human hemoglobin is 1.34 ml/g = 0.059 mmol/g and
the average hemoglobin content in blood is 150 g/l, CO2is assigned a value of 8.848
mmol/l. The modified dissociation curve equation matches well the experimental
data over the entire PO2 range that is meaningful for the present investigation
(maximum FIO2 = 1 at room temperature and pressure).

76 3 Feedback control of sedation
3.5.2 Transcutaneous PCO2 sensing
The dosing paradigm for personalized sedation proposed in this thesis entails titra-
tion of anesthetic delivery based on PtcCO2 measurements. Therefore, the physi-
ological model must incorporate a mathematical description of the transcutaneous
PCO2 signal. In two studies performed in collaboration with the University Hospi-
tal Bern, the dynamic properties of the SenTec V-Sign sensor (SenTec AG, Therwil,
Switzerland) were evaluated through volunteer rebreathing experiments [94, 170].
This sensor is a Severinghaus-type device for the transcutaneous monitoring of the
partial pressure of carbon dioxide (PtcCO2). The studies concluded that the sen-
sor PtcCO2 can be related to end-tidal PCO2 (PetCO2) with a two compartment
model. Assuming that PetCO2 = PACO2, we can describe the model with the
following equation:
dPtcCO2(t)
dt= −k12PtcCO2
(t) + k21
V2
V1
(PACO2(t − Tlag) − Pss) (3.50)
with intercompartmental rate constant k12 = k21V2
V1= 1.27 min−1 and a time delay
Tlag of 25 s. The steady state PtcCO2-PeCO2 offset is 0.66 mmHg. This PtcCO2
model is included into the respiratory simulator to test the feasibility of the pro-
posed anesthetic paradigm.
3.5.3 Drug naıve ventilatory regulation
Model inadequacy in the description of ventilation under hyperoxia was discussed
with detail in Section 3.4.2. We now aim to improve the modeling of ventilatory
control in order to achieve a better agreement with physiological observations.
Of the three systems that regulate ventilation in the model, only peripheral
chemoreceptors are to be considered for amendment. The central ventilatory de-
pression (CVD) is a mechanism that acts upon the onset of brain hypoxia, therefore
it does not modify ventilation under hyperoxic conditions. Central chemoreceptors,
on the other hand, measure arterial CO2 pressure and affect ventilation accordingly.
Therefore the modeling efforts described in this section are focused on peripheral
chemoreceptors only.
The equations describing peripheral chemoreceptive activity are rewritten below
for the sake of clarity:
Dp = kDp
Q(3.51)

3.5 Proposed model improvements 77
20 40 60 80 100
1
2
3
4
5
6
7
8
PaCO2 [mmHg]
Che
mor
ecep
tive
activ
ity [s
pike
s s−
1 ]
200
300 700
PaO2 = 100 mmHg
150
Figure 3.19: Activity in chemoreceptive afferent fibers versus arterial CO2 pressure
at different levels of arterial O2 (ranging from normoxia to hyperoxia).
fpc =K ln(Pa,CO2
Bp
)fpcmax + fpcmin ⋅ exp [(Pa,O2−Pa,O2c)kpc
]1 + exp [(Pa,O2
−Pa,O2c)kpc
] (3.52)
d∆VEP (t)dt
= 1
τp−∆VEP +Gp ⋅ [fpc(t −Dp)] − fpc0 (3.53)
where Dp is the lung-receptor transit time (mechanism time delay), fpc stands for
the discharge frequency of the receptors, and ∆VEP is the change in ventilation due
to peripheral chemoreceptive stimulation. The meaning of all other terms in these
equations is discussed in Section 3.3.3.
Equation 3.52 and 3.53 indicate that the ventilatory response to peripheral
stimulation depends on both oxygen and carbon dioxide arterial partial pressure.
Chemoreceptive discharge frequency over a wide range of PaO2 and PaCO2 levels
is depicted in Figure 3.19, which summarizes the results reported in Figure 3.7.
A possible solution to model inadequacy under hyperoxia is a new parametric
assignment. The goal is to ensure that the peripheral discharge activity fpc yields
correct ventilatory results under hyperoxia while remaining unchanged under hy-
poxia and normoxia. Parameters liable to change are those included in the PaO2
dependent part of Equation 3.52. Thus, a new parameter estimation is performed
for fpcmax, fpcmin, kpc, and PaO2c.

78 3 Feedback control of sedation
fpcmax = 8.73 spikes s−1 kpc = 15.08 mmHg
fpcmin = 2.23 spikes s−1 Pa,O2c = 56.67 mmHg
Table 3.6: Estimated parameter values to describe peripheral chemoreceptive ac-
tivity.
According to Ursino and coworkers [195], fpcmax and fpcmin (in spikes s−1) hold a
well defined physiological meaning. They represent the upper and lower saturation
levels of peripheral discharge frequency in afferent fibres, respectively. Ursino and
colleagues cite the work by Fitzgerald and coworkers [76] to support their state-
ment. Fitzgerald reports experimental observations concerning peripheral receptors
activity in cats subject to different levels of inspired O2 and CO2 [76]. However,
the results by Fitzgerald and colleagues are not expressed in spikes s−1, but as a
percentage of the maximum response to asphyxia, % MAR. Therefore we are free to
change the value of the parameters with no risk of overlooking any physiologically
significant issue.
The parameter estimation is performed with the objective to improve the agree-
ment with clinical observations under hyperoxia. Model behavior under normoxia
and hypoxia is to remain unchanged. The experimental data considered for param-
eter estimation were recorded by Dahan and collaborators in healthy volunteers
under hyperoxic conditions [54]. Least square parameter estimates are listed in
Table 3.6. Figure 3.20 displays the relationship between fpc and PaCO2 under hy-
peroxia with the original and the newly estimated set of parameters. Simulation
results are compared to experimental observations reported by Fitzgerald and col-
laborators [76]. Figure 3.21 reproduces the ventilatory results displayed in Figure
3.11 and shown here a second time with regard to the updated parameter values.
Both figures indicate that the newly estimated parameters improve the agreement
between model results and experimental observations under hyperoxia, while main-
taining unaltered the behavior of the model under normoxia and hypoxia.
With the objective of mimicking the effects of intraoperative noxious stimula-
tion, we incorporate a description of human ventilatory response to pain into the
physiological model. The effect of painful stimulation is modeled as a respiratory
tonic drive producing a 15% increase in minute ventilation baseline, in agreement
with the experimental observations reported in the literature [69, 86, 166].

3.5 Proposed model improvements 79
0 20 40 60 80 100
5
10
15
20
25
30
PaCO2 [mmHg]
Che
mor
ecep
tive
activ
ity [s
pike
s s−
1 ]
PaO2 = 500 mmHg
Figure 3.20: Discharge frequency of peripheral chemoreceptors as a function of ar-
terial CO2 partial pressure under hyperoxic conditions. Top: fpc curve
computed with original parametric values. Simulated data (continuous
line) are compared with experimental observations (symbols) recorded
in cats by Fitzgerald and coworkers [76]. Adapted from the liter-
ature [195]. Bottom: fpc curve computed a second time with the
updated parameter values. Newly estimated parameters improve the
agreement between model results and experimental observations.

80 3 Feedback control of sedation
0 5 10 15 20
0
10
20
30
40
Time [min]
Ven
tilat
ion
[l m
in−
1 ]
20
25
30
35
40
45
50
55
PA
CO
2 [mm
Hg]
Hypercapnia during hyperoxia
0 2 4 6 8 10 12
35
40
45
50
55
Time [min]
PA
CO
2 [mm
Hg]
11
22
33
44
55
Ven
tilat
ion
[l m
in−
1 ]
Hypercapnia during normoxia
0 2 4 6 8 10 12
35
40
45
50
Time [min]
PA
CO
2 [mm
Hg]
11
22
33
44
55
Ven
tilat
ion
[l m
in−
1 ]
Hypercapnia during hypoxia
Figure 3.21: Ventilatory regulation response to hypercapnic stimulation under hy-
peroxia, normoxia, hypoxia with the newly estimated parametric val-
ues. Experimental protocols are discussed in Section 3.4.2. Compared
to Figure 3.11, the agreement with the experimental observations is
greatly enhanced under hyperoxia.

3.5 Proposed model improvements 81
3.5.4 Pharmacodynamic modeling
In [129] Magosso and coworkers simulate the ventilatory response to the opioid
fentanyl and propose a detailed description of drug effects on the different mecha-
nisms that regulate ventilation. Their description of anesthetic pharmacodynamics
was discussed in Section 3.3.4. Arguably, modeling drug effects with this level of
detail is not sufficiently supported by the literature. The reason is that it is nearly
impossible to design an experimental protocol geared towards simultaneously deter-
mining O2 and CO2 regulatory dynamics as well as drug effects on each regulatory
subsystem in a human subject.
In the following we propose to consider a pharmacodynamic model with a more
parsimonious structure. We suggest to describe pharmacological respiratory effects
as a concentration-dependent inhibition of minute ventilation. Pharmacodynamic
modeling is performed using the inhibitory fractional sigmoid Emax model for
drug effects on minute ventilation (see Section 2.3). The choice of the Emax
model over other commonly used pharmacodynamic models (such as the power
model) is justified by its widespread use and accuracy in reproducing experimental
results [25]. Effect quantitation is achieved with the following equation:
E = 1 −Emax ⋅Cγ
e
Cγe +C50γ (3.54)
where E is the pharmacological effect (minute ventilation inhibition) as a function
of the drug concentration, Emax the maximal effect, C50 the drug concentration
causing 50% depression of minute ventilation under isohypercapnia, and γ is the
sigmoidicity (Hill) factor. Assuming the drug is a full agonist (that is, Emax =1), the dynamic effect of the drug can be determined with a minimal number of
parameters. The effect E takes on values ranging from 1 (no depressant effect for
Ce = 0) to 0 (total ventilatory inhibition for Ce → ∞). Figure 3.28 illustrates the
structure of the modified model.
We shall now test the pharmacodynamic model discussed in the above. Results
in terms of fentanyl induced ventilatory depression obtained with the Emax model
will be compared with those reported by Magosso and coworkers [129]. In order
to achieve adequate model validation we shall take into account two additional
opioids: alfentanil and remifentanil.

82 3 Feedback control of sedation
Ventilatory Regulation
PeripheralChemoreceptors
ChemoreceptorsCentral
Lungs
Brain
Tissues
Gas ExchangePI,CO2
PI,O2
Cardiovascular Regulation
Q
VA
VE
VE0
Pb,CO2
Pb,O2
Pa,CO2
Pa,O2
Pt,CO2
Pt,O2
Dead Space
Link Model
Ce
PD Model
I
Cp
PK Model
Ptc,CO2
E
Figure 3.22: The metabolic model and its relationship to the ventilatory and car-
diovascular control systems (CVD not shown). Model inputs are the
metabolic rates of oxygen consumption/carbon dioxide production
(not shown) and the partial pressures of the respiratory gases in in-
spired air (PI,O2, PI,CO2
). Pi,CO2, i = a, b, t, tc: arterial, cerebral, tissue,
transcutaneous partial pressure of carbon dioxide (equivalent nota-
tion for oxygen). Shaded blocks depict the structure of the anesthetic
pharmacokinetic-dynamic model. I, Cp, and Ce are the infusion rate,
plasma and effect site concentration of the anesthetic, respectively. E:
pharmacological depressant effect on ventilation; VE0: baseline venti-
lation; VE: minute ventilation; VA: alveolar ventilation; Q: cardiac
output. The dead space indicates the fraction of minute ventilation
that does not participate in gas exchange (VA = 23⋅ VE).

3.5 Proposed model improvements 83
3.5.5 Opioid induced respiratory depression
Ventilatory results in the presence of fentanyl
The goal is to reproduce the ventilatory results recorded during fentanyl infusion
that were presented in Section 3.4.3 with the physiological model modified according
to Sections 3.5.1-3.5.4. Emax pharmacodynamic parameters are estimated via least
squares fitting to reproduce experimental observations of respiratory depression
following a fentanyl bolus (0.5 mg) in volunteers reported by Stoeckel and colleagues
[180]. The time course of drug plasma concentration (Cf) that is input to the model
is depicted in Figure 3.18 (first panel).
Estimated pharmacodynamic parameters are listed in Table 3.7. The results in
terms of model ventilatory response to the bolus are shown in Figure 3.23. Minute
ventilation is computed both with the original pharmacodynamic description by
Magosso and coworkers [129] and with the Emax model discussed in Section 3.5.4.
The figure shows clearly that Emax pharmacodynamics enhances the agreement
of model behavior with clinical observations. Moreover, the sigmoid pharmacody-
namic function enables the model to capture the fast onset of the pharmacological
effect. A minimum in the ventilatory response is reached within 1 minute after
bolus administration. The original pharmacodynamic model takes about 7 minutes
to reach the minimum, therefore missing the initial fast decline in ventilation that
is recognizable from the clinical data displayed in the figure.
Ventilatory results in the presence of alfentanil
In order to provide further validation for model behavior, another opioid is taken
into consideration: alfentanil. Use of alfentanil in anesthesia care units to provide
conscious sedation is widespread. Therefore it is meaningful to investigate whether
the model is capable of reproducing experimental observations recorded during
alfentanil infusion.
Emax pharmacodynamic parameters are estimated via least squares fitting in
order to match the ventilatory response of the model to clinical observations. Pa-
rameter values are listed in 3.7. The experimental data used for parametric as-
signment were provided by the Anesthesia Department of the University Hospital
Bern. The experimental protocol used for collecting the data will be discussed in
Section 3.8.7.
Figure 3.24 shows the results in terms of the Cp and ventilation time course
following an alfentanil bolus injection. The plasma concentration, Cp, that is in-
put to the model is calculated by fitting experimental blood concentration data.

84 3 Feedback control of sedation
0 50 100 150 2000
0.2
0.4
0.6
0.8
1
1.2
1.4
Time [min]
Nor
mal
ized
min
ute
vent
ilatio
n [−
]
Figure 3.23: Ventilatory response to a fentanyl bolus (0.5 mg). Simulated minute
ventilation obtained with the original pharmacodynamic model by
Magosso and coworkers [129] (purple line) and with the proposed
Emax model are compared to clinical observations reported by
Stoeckel and coworkers [180] (bullets, mean ± SD). Emax pharma-
codynamics improve the agreement between model and experimental
results, particularly it enables the model to match the experimental
rapid onset of the pharmacological effect.
The figure shows a good agreement between model ventilatory results and clinical
observations.
PaCO2 results in the presence of remifentanil
The last sedative drug to be taken into account is remifentanil, a highly potent
opioid. Remifentanil is often employed to provide sedation and at high doses it can
be used to induce general anesthesia. The use in the clinical practice is widespread
and well established. The main advantages of remifentanil over other opioids are:
- remifentanil is susceptible to rapid ester hydrolysis by nonspecific esterases in
blood and tissue. Biotransformation is so fast that the duration of a remifen-
tanil infusion has little influence on wake-up time. Its context-sensitive half-
time (that is, the time required for plasma drug concentration to decline by
50% after discontinuing the infusion) is approximately 3 minutes, regardless

3.5 Proposed model improvements 85
0 10 20 300
50
100
150
200
250
Time [min]
Alfe
ntan
il C
p [ng
ml−
1 ]
0 10 20 300
0.2
0.4
0.6
0.8
1
1.2
1.4
Time [min]
Nor
mal
ized
min
ute
vent
ilatio
n [−
]
Figure 3.24: Ventilatory response to an alfentanil bolus. Bullets (mean ± SD):
experimental data provided by the University Hospital Bern. Top:
alfentanil plasma concentration time course. Experimental results are
fitted to determine model input Cp (continuous purple line). Bottom:
ventilatory results of the model (continuous blue line) are compared
to in vivo observations. The agreement between simulated ventilation
and experimental observations is satisfactory.

86 3 Feedback control of sedation
0 20 40 60 80 100 120 140 1600
2
4
6
8
10
12
time [min]
Rem
ifent
anil
plas
ma
conc
entr
atio
n [n
g m
l−1 ]
0 50 100 15035
40
45
50
55
60
65
70
75
Time [min]
PaC
O2
[mm
Hg]
Figure 3.25: Arterial PCO2 response to a remifentanil infusion in one study sub-
ject. Experimental data are provided by the University Hospital Bern.
Top: remifentanil plasma concentration time course calculated by a
TCI infusion pump. The concentration profile is used as an input to
the model. Bottom: PaCO2 model results (continuous blue line) are
compared to in vivo observations (red dashed line).
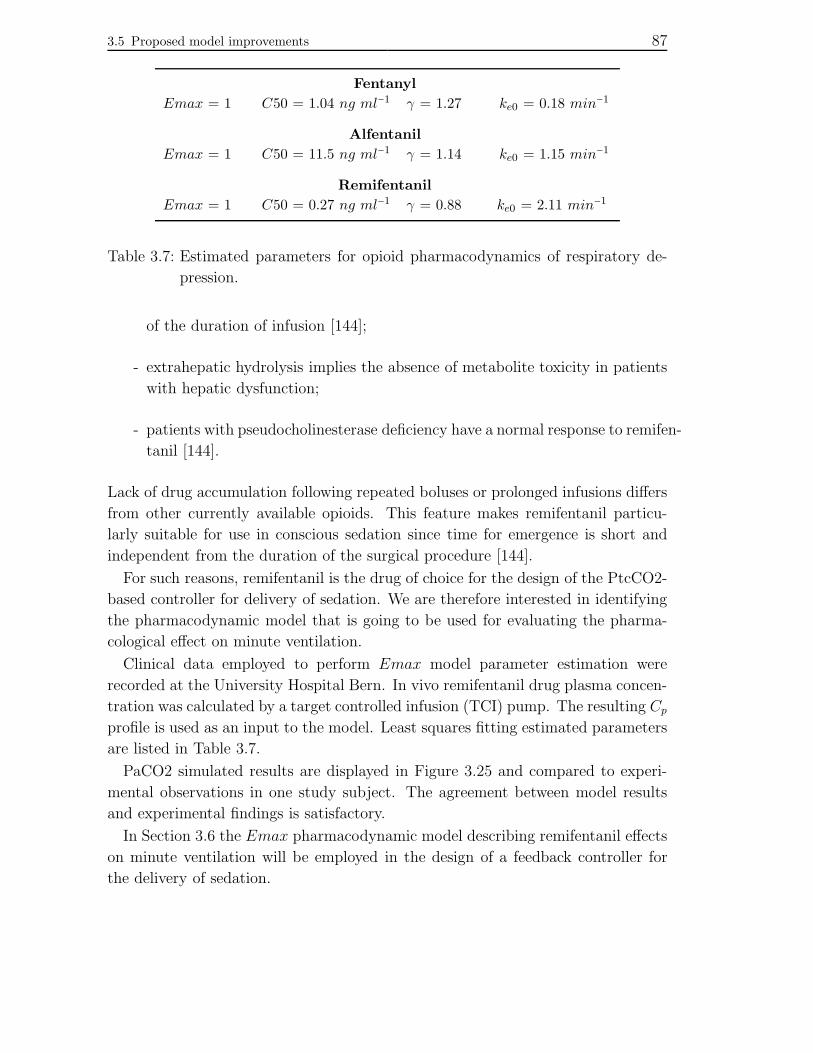
3.5 Proposed model improvements 87
Fentanyl
Emax = 1 C50 = 1.04 ng ml−1 γ = 1.27 ke0 = 0.18 min−1
Alfentanil
Emax = 1 C50 = 11.5 ng ml−1 γ = 1.14 ke0 = 1.15 min−1
Remifentanil
Emax = 1 C50 = 0.27 ng ml−1 γ = 0.88 ke0 = 2.11 min−1
Table 3.7: Estimated parameters for opioid pharmacodynamics of respiratory de-
pression.
of the duration of infusion [144];
- extrahepatic hydrolysis implies the absence of metabolite toxicity in patients
with hepatic dysfunction;
- patients with pseudocholinesterase deficiency have a normal response to remifen-
tanil [144].
Lack of drug accumulation following repeated boluses or prolonged infusions differs
from other currently available opioids. This feature makes remifentanil particu-
larly suitable for use in conscious sedation since time for emergence is short and
independent from the duration of the surgical procedure [144].
For such reasons, remifentanil is the drug of choice for the design of the PtcCO2-
based controller for delivery of sedation. We are therefore interested in identifying
the pharmacodynamic model that is going to be used for evaluating the pharma-
cological effect on minute ventilation.
Clinical data employed to perform Emax model parameter estimation were
recorded at the University Hospital Bern. In vivo remifentanil drug plasma concen-
tration was calculated by a target controlled infusion (TCI) pump. The resulting Cp
profile is used as an input to the model. Least squares fitting estimated parameters
are listed in Table 3.7.
PaCO2 simulated results are displayed in Figure 3.25 and compared to experi-
mental observations in one study subject. The agreement between model results
and experimental findings is satisfactory.
In Section 3.6 the Emax pharmacodynamic model describing remifentanil effects
on minute ventilation will be employed in the design of a feedback controller for
the delivery of sedation.

88 3 Feedback control of sedation
3.5.6 Results discussion
The physiological model presented in the above combines several isolated phar-
macological and physiological aspects of respiratory regulation and drug induced
respiratory depression under various conditions. Several studies in the literature
address the effect of chemical stimuli and anesthetics on specific respiratory and
metabolic subsystems. Our work provides a unified picture of respiratory regu-
lation and drug effects on breathing under different clinically relevant conditions.
The model serves as a simulator/test bed for both drug tolerability and control
issues under non-steady state conditions.
The patient simulator expresses drug induced respiratory depression as a concen-
tration dependent effect on minute ventilation. It does not describe the pharmaco-
logical effects on tidal volume and respiratory rate separately, although it has been
shown that their dynamics are different [5]. Modeling these two ventilatory com-
ponents may improve the capability to predict apneic events and could therefore
be of interest to the anesthetic practice.
This study modeled the effects of remifentanil on breathing and did not consider
coadministration of other drugs. Polypharmacy of sedative/analgesic drugs can
cause severe respiratory effects due to the pharmacological interaction of the drugs.
However, coadministration of another respiratory depressant would lead to more
pronounced hypercapnia and therefore reduce administration of the automatically
administered drug, thereby protecting the patient. This hypothesis should be tested
in the clinical environment with sedation trials based on multiple drug protocols.
Despite the modeling efforts described in Sections 3.5.1-3.5.5, the agreement be-
tween model simulation results and experimental data of ventilatory regulation
and drug induced respiratory depression is not entirely satisfactory. Moreover, the
model proposed by Magosso and collaborators [129] provides a level of physiolog-
ical detail that may not be required to address the problem of sedation. That
translates into substantial model complexity and a large number of parameters to
be estimated if the model is to be adapted to the individual. For the purposes of
our work, a more parsimonious model structure is desirable. The objective is to
achieve a mathematical representation of human breathing and respiratory depres-
sion pharmacodynamics that can be easily adjusted to different anesthetic agents
and adapted to the individual by estimating a limited number of parameters. To
this purpose, a simplified model of human ventilatory regulation is proposed in Sec-
tion 3.7. A parsimonious description of the controlled metabolic system is discussed
in Section 3.8.

3.6 Proportional-integral control for remifentanil sedation 89
Controller
Override
I
I
SpO2
Windup
Anti-on/off
PI
Safety
Patient
Simulator
PKPD
Vent.
System
error
PtcCO2
PtcCO2
P tcCO2 Kalman
Filter
Figure 3.26: Configuration for the closed-loop control of sedation delivery. I: drug
infusion rate; PtcCO2: sensor measurement of transcutaneous CO2
partial pressure; P tcCO2: estimated measurement; PtcCO2: control
setpoint. The override system enforces the SpO2, Cp, and Ce thresh-
olds in order to maximize the safety of opioid administration.
3.6 Proportional-integral control for remifentanil
sedation
3.6.1 Control design
Using the respiratory model developed in the previous sections as a test bed, we
design a feedback control strategy for the delivery of personalized remifentanil se-
dation. The aim of the control algorithm is to manage drug administration for
induction of sedation and maintenance of the PtcCO2 setpoint defined by the anes-
thesiologist. Adequate management of intraoperative painful stimuli, surgical dis-
turbances and inter-patient variability is required. An endpoint of 50 mmHg is
selected for paradigm validation because in volunteers it corresponds to mild res-
piratory depression and plasma concentrations well in the analgesic range [127].
The control algorithm must fulfil the following conservative constraints to ensure
patient safety: SpO2 > 93%, remifentanil Cp and Ce < 4 ng/ml. In case the thresh-
olds are exceeded (e.g. for exceptional drug sensitivity), a safety override stops the
automatic infusion and reverts the responsibility of dosing to the care provider.

90 3 Feedback control of sedation
In the region of interest for application to sedation, the PtcCO2 response of
the model to stepwise changes in Ce is approximately linear and of first order, so
the requirements in terms of controller sophistication are limited [9]. Therefore,
a proportional-integral (PI) control strategy is selected. A two-degree-of-freedom
control structure is employed to improve tracking performance while ensuring rapid
suppression of disturbance effects.
3.6.2 State estimation
A state observer is included in the sedation system to perform estimation of the
PtcCO2 signal. As observer the Kalman filter is selected because we do not rule
out the presence of stochastic noise in the PtcCO2 signal. The positioning of the
Kalman filter within the control loop and the configuration of the sedation delivery
system are depicted in Figure 3.26.
The use of Kalman PtcCO2 estimates is also intended to assist in the detection
of sensor failure or disconnection [77]. For instance, during the medical procedure
it may happen that the sensing element is displaced from its measurement site on
the patient. The PtcCO2 measurements would then rapidly approach a value of
zero because the CO2 content in atmospheric air is equal to 0.04%. In the sedation
system, a substantial mismatch between the measured and estimated PtcCO2 is
interpreted as being indicative of a fault. We define that the system detects a sensor
failure/disconnection if the sensor output undershoots the Kalman estimate by 7
mmHg or more. Following the detection of a fault, the system rejects the sensor
output. The prediction at each time step is then based on the previous estimate
and the current control command only. In the clinical implementation a warning
message would be issued at this stage, drawing the attention of the care provider.
The system does not discard measurement information when the sensor reading is
higher than the estimated value, since false high readings revert the virtual patient
to a safe state by decreasing the infusion rate.
3.6.3 Closed loop delivery of remifentanil sedation
In order to validate the proposed dosing paradigm for sedation, we simulated titra-
tion to and maintenance of a target PtcCO2 using the physiological model described
in the above as a virtual patient. Closed-loop results for a PtcCO2 target of 50
mmHg and FIO2 = 33% in three virtual patients are displayed in Figure 3.27. The
three patients are differently sensitive to the respiratory depressant (high, average,
low sensitivity). To mimic the nuisance phenomena that often occur in the oper-

3.6 Proportional-integral control for remifentanil sedation 91
ating theater during sedation delivery, the following disturbances were reproduced
in the simulation studies:
i a painful stimulus at t = 90 min;
ii a generic surgical disturbance at t = 160 min that causes an abrupt increase
of 4 mmHg in arterial PCO2 (to mimic for instance the effect of tourniquet
release);
iii the disconnection of the sensor at t = 230 min.
The Cp versus time diagram in Figure 3.27 shows that the control algorithm adjusts
drug dosing to track the reference signal, reject the disturbances and individualize
drug delivery depending on the specific sensitivity of the virtual patient. Remifen-
tanil plasma concentrations delivered by the controller (between 1 ng/ml and 2.5
ng/ml at steady state) lie within the analgesic and therapeutic range for seda-
tion [127]. When sensor disconnection occurs, the PtcCO2 signal quickly drops to
zero; thereafter at each time step the Kalman filter outputs a PtcCO2 estimate
based on the previous estimate and the current control command only (no estimate
update with measurement information since the sensor is detached) as discussed in
Section 3.6.2. Minute ventilation is displayed as another indicator of drug induced
respiratory depression. Ventilation remains at safe levels, both transiently and
at steady state. Throughout the entire simulated procedure the hypoxic override
remains inactive since blood oxygenation stays always above the 93% threshold.
3.6.4 Results discussion
The ability of opioids to provide adequate analgesia is limited by the ventilatory
depression associated with overdosing in spontaneously breathing patients. There-
fore, quantitation of drug induced ventilatory depression is a pharmacokinetic-
pharmacodynamic problem relevant to the practice of anesthesia and in particular
to the delivery of monitored anesthesia care.
The goal of the work discussed in this chapter is to address the problem of drug
delivery in the spontaneously breathing patient and to provide a solution that en-
hances safety in clinical practice. Dosing during sedation is critical because there
is no direct, objective measurement of the therapeutic effect and the drug induced
adverse effects are life threatening. We proposed an innovative dosing strategy
that entails the measurement of the pharmacological side effect rather than the
evaluation of the therapeutic effect to provide guidance for the automatic control

92 3 Feedback control of sedation
0 50 100 150 200 25040
45
50
55
est.
Ptc
CO
2[m
mH
g]
reference C50 = 0.7 [ng/ml] C50 = 1 [ng/ml] C50 = 1.3 [ng/ml]
40
45
50
55
mea
s. P
tcC
O2
[mm
Hg]
0 50 100 150 200 2500
5
0 50 100 150 200 2500
1
2
3
Cp [n
g/m
l]
0 50 100 150 200 2500.6
0.7
0.8
0.9
1
Time [min]
Ven
tilat
ion
[−]
Figure 3.27: Simulated closed-loop induction and maintenance of sedation (FIO2 =
0.33). Model results in terms of estimated PtcCO2, measured PtcCO2,
remifentanil plasma concentration and normalized minute ventilation
are displayed. The reference PtcCO2 signal is changed from baseline
to 50 mmHg at time t = 20 min, thereby activating the controller and
initiating drug infusion. A painful stimulation and a generic surgical
disturbance occur for 10 minutes at time t = 90 min and t = 160 min
respectively. At t = 230 min PtcCO2 signal loss occurs (reproducing
for instance the detachment of the sensor). The sequence of events is
simulated for three different levels of drug sensitivity: high sensitivity
(C50 = 0.7 ng/ml, dotted line), average sensitivity (C50 = 1 ng/ml,
solid line), low sensitivity (C50 = 1.3 ng/ml, dash-dotted line).

3.7 Parsimonious modeling of ventilatory regulation 93
of drug delivery (surrogate endpoint based dosing paradigm). More specifically, we
suggested titrating the administration of sedatives and analgesics to the individ-
ual sensitivity based on transcutaneous measurements of PCO2. In the following
we validate the dosing paradigm by means of computer simulations. The results in
Figure 3.27 show that the control algorithm individualizes drug infusion, titrates in-
fusion to effect and delivers concentrations within the analgesic range. Closed-loop
control may also be effective and robust to intraoperative disturbances, individual
drug sensitivity, and sensor disconnection.
Improved safety, reliable and adequate therapy, workload reduction for the care
providers, cost saving in terms of drugs and manpower would be the most prominent
benefits of implementing the proposed dosing paradigm into a therapeutic device
for use during sedation. The system may fulfil the clinical demand for improved
sedation care and has therefore the potential to be converted into a commercial
healthcare device. Moreover the technology of the single components (sensor, actu-
ator, processing and control unit) is available and relatively inexpensive compared
to anesthesia workstations. However a second, independent sensor (e.g. a nasal
thermistor) may be necessary to detect ongoing breathing and identify possible
single fault conditions.
It is relevant to mention that the dosing paradigm was exemplified here with the
choice of remifentanil as anesthetic drug. Nevertheless, in principle the paradigm
can be applied to other sedative/analgesic drugs with respiratory depressant side
effects (for instance, other opioids such as fentanyl and alfentanil; propofol; combi-
nations of drugs). Indeed, in Section 3.9 we shall design a control strategy for the
delivery of propofol sedation.
3.7 Parsimonious modeling of ventilatory
regulation
3.7.1 Introduction
As discussed in Section 3.5.6, it is desirable to simplify the physiological model of
ventilatory control in order to deal with a more parsimonious set of parameters. In
the following we address an alternative description of the mechanisms regulating
ventilation based on oxygen and carbon dioxide blood content.
Multiple studies have investigated the response of the human (cardio)respiratory
system to chemical stimuli both in the presence and absence of ventilatory depres-
sant drugs. More specifically, experimental results are reported in the literature de-
94 3 Feedback control of sedation
scribing: the effect of oxygen on the hypercarbic respiratory drive [54,123]; the effect
of carbon dioxide on the acute hypoxic respiratory drive [203, 160, 111]; the effect
of respiratory depressant anesthetics on the hypercarbic drive [137, 206, 30, 25, 26];
the effect of drugs on the acute hypoxic drive [112, 187, 72, 149]. Unfortunately,
most of them are not suitable for simulation, inter/extrapolation and dose find-
ing, the reason being that the experimental paradigms are geared towards isolating
specific physiological phenomena rather than providing a unified description of the
respiratory system behavior.
The aim of the work described in this section is to integrate the available knowl-
edge into a parsimonious mathematical ventilatory model describing the synergistic
interaction between the hypoxic and the hypercarbic respiratory drive and the ef-
fects of anesthetic drugs on the control of breathing. The following criteria were
defined prior to model building:
i The model must provide an adequate description of the hypercarbic respira-
tory drive, the acute hypoxic respiratory drive and their interaction in the
absence of drug;
ii The model must reproduce the inhibitory effects of major anesthetic drugs
on both the O2 and CO2 ventilatory response;
iii The model must be parameterized completely with published parameters
and/or parameters from published data.
In the following a concise presentation of the proposed model for ventilatory reg-
ulation is provided (Section 3.7.3 and 3.7.4). The descriptive power of the model
is evaluated through simulations performed in the Matlab/Simulink software envi-
ronment (The MathWorks, Natick, MA, U.S.). Simulation results are compared to
published experimental data and critically discussed (Section 3.7.5 and 3.7.6).
3.7.2 Model of the controlled system
To characterize ventilatory regulation (both in presence and absence of respiratory
depressant drugs) a controlled plant representing physiological metabolism and gas
exchange is required. We shall adopt the model of respiratory gas exchange and
metabolism discussed in Sections 3.3-3.5. For the sake of clarity, the main charac-
teristics of the metabolic system are summarized below.
The model describes oxygen and carbon dioxide disposition in the body in terms
of O2 and CO2 metabolism, transport in blood and exchange within tissues [44,195].

3.7 Parsimonious modeling of ventilatory regulation 95
Ventilatory Regulation
AHORD
HCRD
Lungs
Brain
Tissues
Gas ExchangePICO2
PIO2
Cardiovascular Regulation
Q
VA
VE
VE0
PbCO2
PbO2
PaCO2
PaO2
PtCO2
PtO2
Dead Space
Figure 3.28: The gas exchange system and its relationships to the ventilatory and
cardiovascular control mechanisms are displayed. The inputs to the
system are the partial pressures of the respiratory gases in inspired air
(PIO2, PICO2
) and the metabolic rates of oxygen consumption/carbon
dioxide production (not shown). PiCO2, i = a, b, t: arterial, cere-
bral, tissular partial pressure of carbon dioxide (equivalent notation
for oxygen). HCRD: hypercarbic respiratory drive; AHORD: acute
hypoxic respiratory drive; VE0: baseline ventilation; VE: minute ven-
tilation; VA: alveolar ventilation; Q: cardiac output. The dead space
indicates the fraction of minute ventilation that does not participate
in gas exchange (VA = 23VE).
It comprises a compartment for the lungs and one for the brain; all other tissues
are lumped together into a third compartment. The inputs to the model are the
inspiratory PO2 and PCO2 and the rate of metabolic CO2 production and O2
consumption in the tissues. The content of oxygen and carbon dioxide in each
compartment is determined through mass balance equations that take into account
tissular exchange with blood and consumption/production within the tissue. Re-
gional blood flow is controlled by a cardiovascular regulatory system that operates
to maintain tissular PO2 and PCO2 close to baseline. Figure 3.28 displays the
interconnections between the metabolic plant and the regulatory mechanisms of
regional blood flow and respiration.

96 3 Feedback control of sedation
3.7.3 Ventilatory response to O2 and CO2
The control of breathing in man acts to achieve respiratory homeostasis in response
to oxygen and carbon dioxide challenges. In the following we shall focus on ven-
tilatory regulation in the absence of drug. We shall first describe the respiratory
effects of O2 and CO2 separately; we will then integrate the two mechanisms into
a synergistic model of respiratory control.
Carbon dioxide is a powerful stimulant of breathing. The ventilatory response to
CO2 under isooxic conditions has been frequently described as a linear relationship
between minute ventilation and carbon dioxide partial pressure and the existence
of a CO2 apneic threshold has been postulated by extrapolation [54,12]. At present
there is however no consensus on whether the CO2 ventilatory sensitivity is inde-
pendent of PCO2. In fact, an abrupt change in slope has been observed in the
hypocapnic region of the human CO2 ventilatory response curve [148]. Different
studies have concluded that the ventilatory response to PCO2 in the hypocapnic
range is nonlinear and the responsiveness to carbon dioxide extends well below eu-
pneic levels [17, 155]. Moreover, experimental evidence of resting ventilation fully
supported by a wakefulness or neural (non-chemoreceptive) drive contradicts the
notion of an apneic PCO2 threshold [142]. To account for these findings we model
the ventilatory response to carbon dioxide with the following (steady state) expres-
sion that predicts a non-linear decrease of ventilation under progressive hypocapnia
and that has been validated in the hypercapnic range through rebreathing experi-
ments in humans [25, 26]:
VE(ss)VE0
= [PaCO2(ss)
PaCO20
]F
(3.55)
where VE(ss)VE0
is the fractional (i.e. normalized) minute ventilation; PaCO2(ss) and
PaCO20 are the steady state and baseline arterial partial pressure of carbon dioxide,
respectively; F denotes the carbon dioxide responsiveness of the specific individual
[25, 26, 30].
The influence of oxygen on respiratory control under isocapnia has been suitably
described in the literature both in terms of a VE − PO2hyperbolic relationship
[123, 203] and a VE-SatO2 linear dependence [160, 111]:
VE(ss)VE0
= C + kO2
PaO2(ss) −A (3.56)
= 1 + n [SatO20 − SatO2(ss) ] (3.57)

3.7 Parsimonious modeling of ventilatory regulation 97
where PaO2(ss) and SatO2(ss) are the arterial partial pressure and saturation of
oxygen at steady state; kO2is the shape parameter of the hyperbolic function
and represents the degree of hypoxic responsiveness; parameter C is the fractional
ventilation during isocapnic hyperoxia; parameter A describes the location of the
vertical asymptote of the hypoxic ventilatory drive [203,111]; SatO20 is the oxygen
saturation at baseline and n the slope of the acute hypoxic respiratory drive [160].
These relationships carry identical information on the effect of oxygen on ventilatory
regulation, therefore they can be used interchangeably after transformation of PO2
into SatO2 (or vice versa).
Although the relationships in Equations 3.56, 3.57 provide an equivalent descrip-
tion of the hypoxic respiratory drive, the VE - SatO2 expression might be preferred
because: i) there is evidence that the stimulus to the peripheral chemoreceptors is
O2 saturation or content, not PO2 [203]; ii) oxygen saturation can be measured
easily in the clinical practice via pulse oximetry; iii) a linear relationship might
be a more convenient tool for care providers (e.g. anesthesiologists) to predict
ventilatory changes during medical procedures.
The CO2- and O2-dependent regulatory terms presented in the above ought to be
merged into a single mechanism to provide an integrated description of respiratory
control in man (in the absence of drugs). Several authors reported the existence of
a positive interaction between the ventilatory effects of carbon dioxide and oxygen
[123, 12, 54, 201]. A simple and effective way to express the synergism between
the hypercarbic and the hypoxic drive is the multiplication of the respective terms
[195,184]. Assuming that both respiratory drives exhibit first-order dynamics [185,
54, 195, 44], we can express the integrated model of ventilatory regulation in the
non-steady state as follows:
VE = VE0 ⋅ VCO2(t) ⋅ VO2
(t) (3.58)
being
τCO2
dVCO2(t)
dt+ VCO2
(t) = [PaCO2(t − TCO2
)PaCO20
]F
(3.59)
τO2
dVO2(t)
dt+ VO2
(t) = C + kO2
PaO2(t − TO2
) −A (3.60)
= 1 + n [SatO20 − SatO2 (t − TO2) ] (3.61)
where τCO2, τO2
and TCO2, TO2
are the time constants and time delays (lung-receptor
transit times) of the CO2- and O2-dependent mechanisms, respectively.

98 3 Feedback control of sedation
The model is parameterized entirely with published parameters and/or parame-
ters extrapolated from published data in order to achieve a satisfactory agreement
with experimental ventilatory results in the non-steady state (see Figure 3.30): F =
4.0 [30, 25, 26]; C = 0.6, kO2= 24.3 mmHg [203,111]; A = 32 mmHg [203,111,47];
n = 0.1 [203]; τO2= 9.8 s, TO2
= 9.3 s, τCO2= 45 s and TCO2
= 10.5 s [54, 186].
3.7.4 Pharmacodynamic modeling
The pharmacodynamics of drug-induced respiratory depression are described by
means of the well-established inhibitory sigmoid Emax model. Multiple studies
provide evidence that drug effects on the acute hypoxic and the hypercarbic respi-
ratory drive are different [31,187,149,206]. Therefore the pharmacologic effects on
the CO2 and the O2 response terms (Equations 3.59, 3.61) are modeled separately
as follows:
τCO2
dVCO2(t)
dt+ VCO2
(t) = [PaCO2(t − TCO2
)PaCO20
]F
⋅
⎡⎢⎢⎢⎢⎢⎣1 −
(Ce(t)C50a)γ
1 + (Ce(t)C50a)γ⎤⎥⎥⎥⎥⎥⎦
(3.62)
τO2
dVO2(t)
dt+ VO2
(t) = 1 + n [SatO20 − SatO2 (t − TO2) ] ⋅⎡⎢⎢⎢⎢⎢⎣1 −
(Ce(t)C50b)
1 + (Ce(t)C50b)⎤⎥⎥⎥⎥⎥⎦
(3.63)
where Ce is the effect compartment (or biophase) drug concentration; C50a (C50b)
represents the drug concentration determining a 50% decrease in the hypercarbic
(acute hypoxic) respiratory drive, for unchanged PaCO2 (SatO2); Emax = 1; γ is
the sigmoidicity (Hill) factor [137].
To yield a unified and comprehensive picture of respiratory pharmacodynam-
ics we examine the influence of anesthetics on O2 and CO2 metabolism. As
hypnotics and sedatives inhibit oxygen and carbon dioxide metabolic consump-
tion/production up to 30% of their basal value [157], a correction for the reduced
CO2 production is introduced using an inhibitory Emax model [26]:
MPCO2(t) =MPCO20 ⋅
⎡⎢⎢⎢⎢⎢⎢⎣1 − (1 −MP CO2min) ⋅ (
Ce(t)C50c)δ
1 + (Ce(t)C50c)δ⎤⎥⎥⎥⎥⎥⎥⎦
(3.64)
being MPCO20 the baseline metabolic production of carbon dioxide and MPCO2min
the minimal fractional CO2 production under anesthesia. Because carbon dioxide
excretion equals production only at steady state, it is not possible to determine

3.7 Parsimonious modeling of ventilatory regulation 99
40 60 80 100 120 140 1600
1
2
3
4
5
6
7
PetO2 [mmHg]
Nor
mal
ized
min
ute
vent
ilatio
n [−
]
PetCO2 = 51.3 mmHg
PetCO2 = 46.2 mmHg
PetCO20 = 41.5 mmHg
Figure 3.29: The ventilatory response to hypoxia at different end-tidal PCO2 levels
ranging from normocapnia to hypercapnia in one subject. Symbols:
steady state experimental measurements of minute ventilation in re-
sponse to the hypoxic challenge (subject 4 in [123]). Lines: minute
ventilation resulting from model simulations that replicate the exper-
imental conditions (individual parameter values determined via least
squares fitting: kO2= 15.0 mmHg; C = 0.8; A = 30 mmHg; F = 7;
PaCO20 = 41.5 mmHg).
experimentally the inhibitory effect of the drug on the CO2 metabolic production
in the non-steady state, nor to differentiate it from the effects on the hypercarbic
response. Consequently, we employ single set of pharmacodynamic parameters to
express both effects; that is, C50a = C50c and γ = δ.
3.7.5 Opioid induced ventilatory depression
The model adequately describes experimental data published in the literature rel-
ative to the interaction between the hypercarbic and the acute hypoxic respiratory
drive in the absence of drug. The model was tested against several hypoxic response

100 3 Feedback control of sedation
experiments measured in healthy volunteers at different isocapnic levels (ranging
from normocapnia to hypercapnia) reported in [123]. Figure 3.29 shows the steady
state ventilatory response curve to progressive hypoxia under normocapnia and the
synergistic effect of hypercarbia on the hypoxic respiratory drive for one represen-
tative subject; the experimental observations are compared to the corresponding
model simulations. Due to the pronounced interindividual variability, predictions
based on population parameters do not adequately describe the data for all the sub-
jects. However individualization of the parameters leads to a satisfactory fit, there-
fore the model structure is acceptable. The dynamic behavior of the respiratory
model was tested against experimental CO2 step challenges performed in healthy
subjects under hyperoxic, euoxic and hypoxic conditions (see Figure 3.30) [54, 12].
Further simulations were carried out to evaluate the performance of the model
in the presence of drug. The predicted pharmacologic effect on the hypercarbic
respiratory drive was judged against experimental data recorded during infusions of
fentanyl and alfentanil [137]. Minute ventilation versus plasma concentration results
measured in healthy volunteers breathing room air (FIO2 = 0.21) are displayed in
Figure 3.31 and compared to model simulations. With respect to drug effects on
the hypoxic response, the model matches published results on isoflurane-induced
hypoxic drive depression at different arterial PCO2 levels (C50b = 0.1 MAC) [112,
187,72].
3.7.6 Results discussion
The work discussed in the previous sections proposes a parsimonious mathemat-
ical model integrating several isolated physiological and pharmacological aspects
of acute drug-induced respiratory depression under various conditions. Our work
does not aim at extending the physiological knowledge on a singular regulatory
mechanism; rather, it constitutes an original effort to combine multiple features of
human ventilatory control into a single theoretical framework. The model fulfils the
stated specifications and adequately describes published data on the hypercarbic
and hypoxic drive interaction and the global effect of drugs on respiration.
Several authors have described the ventilatory response to carbon dioxide in
terms of a central (slower) and a peripheral (faster) mechanism with different
gains [54, 184, 12, 195]. Such a model has been extensively discussed in Sections
3.3-3.5. However, the relative contribution of the chemoreflexes in determining
ventilation is unclear under many circumstances. It appears that only under deep
anesthesia and non-rapid eye movement (NREM) sleep are the chemoreceptors the
sole determinants of respiration [201]. The contribution of a wakefulness drive may

3.7 Parsimonious modeling of ventilatory regulation 101
0
10
20
30
40
50
Time [min]
Ven
tilat
ion
[l m
in−1
]
0 5 10 15 20
35
40
45
50
55
Pet
CO
2 [mm
Hg]
Hypercapnia under hyperoxia
0 2 4 6 8 10 1230
35
40
45
50
55
Ven
tilat
ion
[l m
in−1
]
0
11
22
33
44
55
Time [min]
Pet
CO
2 [mm
Hg]
Hypercapnia under normoxia
0 2 4 6 8 10 1230
35
40
45
50
55
Ven
tilat
ion
[l m
in−1
]0
11
22
33
44
55
Time [min]
Pet
CO
2 [mm
Hg]
Hypercapnia under hypoxia
Figure 3.30: Left diagrams: the ventilatory response to a hypercapnic challenge is
measured in healthy volunteers under hyperoxia, euoxia and hypoxia
(PetO2 = 200, 100, and 53 mmHg respectively). The experimental
measurements are reported in [54] (upper panel) and in [12] (middle
and bottom). Right diagrams: simulated response of the ventilatory
control system to a square change in PCO2. The simulations replicate
the experimental conditions in terms of PetO2 and PetCO2 with null
pulmonary shunt fraction. Baseline minute ventilation is 12 l/min
under hyperoxia, 8.7 l/min under normoxia and hypoxia.
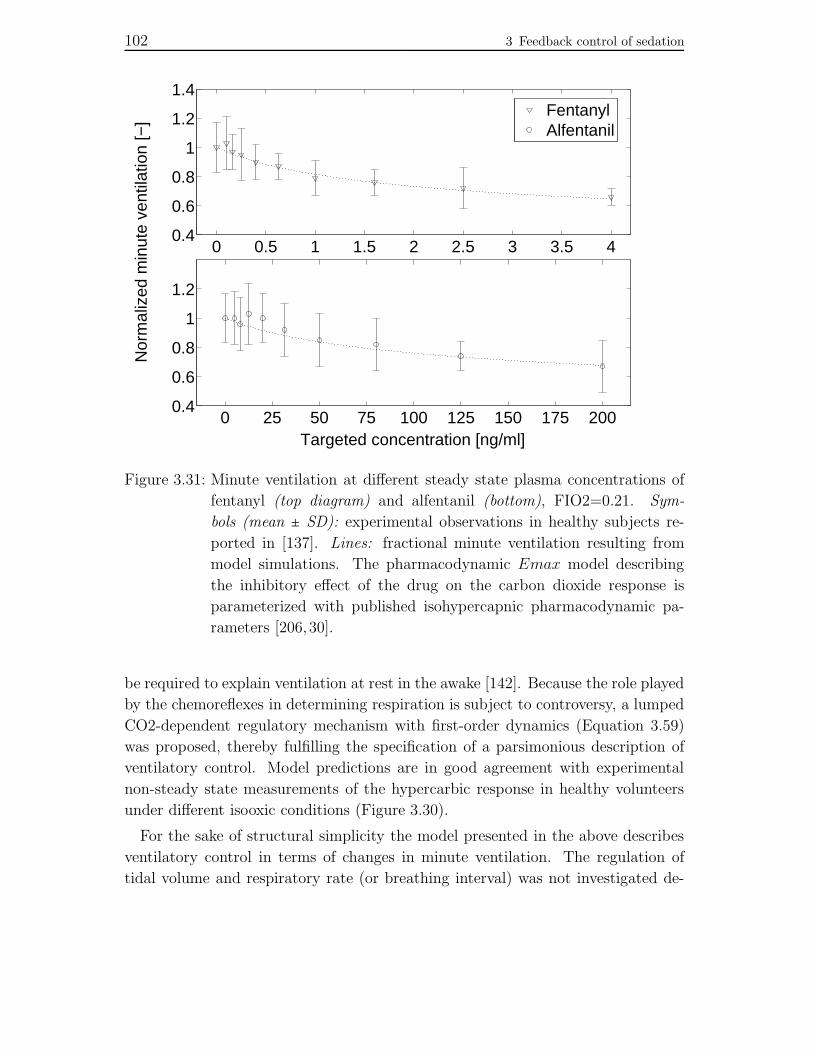
102 3 Feedback control of sedation
0 0.5 1 1.5 2 2.5 3 3.5 40.4
0.6
0.8
1
1.2
1.4
Nor
mal
ized
min
ute
vent
ilatio
n [−
]
0 25 50 75 100 125 150 175 2000.4
0.6
0.8
1
1.2
Targeted concentration [ng/ml]
Fentanyl Alfentanil
Figure 3.31: Minute ventilation at different steady state plasma concentrations of
fentanyl (top diagram) and alfentanil (bottom), FIO2=0.21. Sym-
bols (mean ± SD): experimental observations in healthy subjects re-
ported in [137]. Lines: fractional minute ventilation resulting from
model simulations. The pharmacodynamic Emax model describing
the inhibitory effect of the drug on the carbon dioxide response is
parameterized with published isohypercapnic pharmacodynamic pa-
rameters [206, 30].
be required to explain ventilation at rest in the awake [142]. Because the role played
by the chemoreflexes in determining respiration is subject to controversy, a lumped
CO2-dependent regulatory mechanism with first-order dynamics (Equation 3.59)
was proposed, thereby fulfilling the specification of a parsimonious description of
ventilatory control. Model predictions are in good agreement with experimental
non-steady state measurements of the hypercarbic response in healthy volunteers
under different isooxic conditions (Figure 3.30).
For the sake of structural simplicity the model presented in the above describes
ventilatory control in terms of changes in minute ventilation. The regulation of
tidal volume and respiratory rate (or breathing interval) was not investigated de-

3.8 Parsimonious modeling of the metabolic system 103
spite experimental evidence that respiratory depressant anesthetics may have un-
equal effects on those components of breathing [5]. Differentiating between the
contribution of tidal volume and respiratory rate to minute ventilation during drug
delivery may be of interest for the anesthetic practice and specifically the delivery
of sedation.
The coadministration of sedatives and analgesics is often employed in the clinical
theater and can lead to severe cardiorespiratory depression due to the synergistic
interaction of the drugs. This modeling approach however does not examine the
influence of anesthetic polypharmacy on breathing. The expressions in Equations
3.62-3.64 describe the effect of a single respiratory depressant on the control of
breathing and carbon dioxide metabolism, and we caution the reader not to ex-
trapolate the pharmacodynamics of respiratory depression for drug combinations.
Modeling the ventilatory effects of anesthetic polypharmacy would represent a phys-
iologically meaningful and clinically relevant development of the respiratory model.
The model presented here describes several isolated physiological and pharma-
cological aspects of breathing regulation and drug-induced respiratory depression
under various conditions. Pharmacologic respiratory effects on the isohypercapnic
hypoxic drive and the isooxic hypercarbic drive, including their interaction, are
combined into a single framework with substantial predictive capability in the clin-
ical situation. The model can also serve as a patient simulator to investigate issues
of drug tolerability, automatic control of drug delivery and individualization of drug
dosing under non-steady state conditions. Moreover, the hypoxic respiratory drive
has little influence on ventilation at PaO2 > 80 mmHg even under severe hyper-
capnia. Drug effects on the hypoxic response are therefore of minor significance
compared to the inhibitory effects on the hypercapnic drive in the clinical setting,
where oxygenation is usually supported via the provision of O2-enriched air to the
patient. This aspect is further discussed in Section 3.8.3.
3.8 Parsimonious modeling of the metabolic
system
3.8.1 Introduction
The goal of the work presented in this section is to implement a parsimonious model
of physiological gas exchange, metabolism and disposition in the human body.
After integration with the ventilatory regulation model proposed in Section 3.7,
we achieve a parsimonious mathematical model describing the ventilatory response

104 3 Feedback control of sedation
Figure 3.32: The controlled metabolic plant and its relationship to the ventila-
tory regulation mechanisms. HCRD: hypercarbic respiratory drive;
AHORD: acute hypoxic respiratory drive. Neglecting PO2 dynamics
as described in Section 3.8.3, the gas exchange system can be simpli-
fied to a one-compartment model for CO2 disposition as discussed in
Section 3.8.2. Dead space is assumed to be equal to 30% of minute
ventilation, that is, VA = 0.7 VE .
to hypercarbia and the effects of anesthetic drugs on the control of breathing.
An integrated description of drug induced ventilatory depression in the non-
steady state with parameters identifiable from clinically accessible data is not avail-
able so far. Several studies describe the effect of respiratory depressant drugs on iso-
lated endpoints: minute ventilation under isohypercapnic and pseudo-steady state
conditions, minute ventilation under isohypercapnic conditions, partial pressure of
carbon dioxide (arterial, PaCO2, or end-expiratory, PetCO2) under pseudo- and
non-steady state conditions. Nevertheless, concomitant modeling of minute venti-
lation and PCO2 changes in the non-steady state has not yet been undertaken.
In the following we propose a model describing simultaneously measured minute
ventilation and PaCO2 changes after administration of a fast-onset respiratory de-
pressant agent. The model is validated with experimental data regarding the ad-
ministration of a highly potent anesthetic agent, alfentanil. All parameters, includ-
ing CO2 sensitivity, are identified from measured PaCO2 and minute ventilation
experimental data.

3.8 Parsimonious modeling of the metabolic system 105
3.8.2 Model of the controlled system
Possibly the simplest model of carbon dioxide disposition in the human body is
a one-compartment model characterized by a constant rate of CO2 production
(representing baseline metabolic production in the absence of drug) and a rate of
CO2 elimination that is a function of ventilation [30, 25, 26]. We can approximate
the physical behavior of carbon dioxide in the compartment to that of an ideal gas
stored in a well-mixed tank. Assuming constant temperature and compartmental
volume, changes in CO2 amount over time can then be equivalently described with
balance equations employing CO2 mass, amount of substance or partial pressure
as the dependent variable. Changes of CO2 partial pressure in the compartment
over time can then be expressed as:
dPaCO2(t)
dt= kin − kout(t) (3.65)
where PaCO2(t) is the arterial partial pressure of carbon dioxide, kin is the baseline
(constant) rate of CO2 production, and kout(t) is the rate of elimination. We can
express kout(t) as the product of the current elimination rate constant of carbon
dioxide, kel, and PaCO2(t):dPaCO2
(t)dt
= kin − kel(t)PaCO2(t) (3.66)
= kin −VA(t)VdCO2
PaCO2(t) (3.67)
being VA(t) the alveolar ventilation, and VdCO2the apparent volume of carbon diox-
ide distribution in the body. Under the assumption that carbon dioxide production
is constant in the absence of drug, and assuming the system to be at steady state
at t = 0, the following expression for kin is derived:
dPaCO2(t)
dt∣t=0= 0 ⇒ kin = VA0
VdCO2
PaCO20 (3.68)
where VA0 and PaCO20 are the baseline alveolar ventilation and arterial CO2 partial
pressure, respectively. The change of PaCO2 in the compartment over time can in
conclusion be described as follows:
dPaCO2(t)
dt= VA0
VdCO2
PaCO20 −VA(t)VdCO2
PaCO2(t) (3.69)
The metabolic system described in the above and the ventilatory regulation
model discussed in the next section are depicted in Figure 3.32.

106 3 Feedback control of sedation
Parameter Mean SE SD
VdCO2[l] 36.03 3.38 10.68
F [−] 4.01 0.16 0.51
MPCO2min [−] 0.67 0.04 0.13
ke0MV [min−1] 0.78 0.15 0.46
ke0CO2[min−1] 0.55 0.08 0.25
C50 [ng/ml] 65.34 1.82 5.76
γ [−] 1.81 0.10 0.32
Table 3.8: Estimated population values of respiratory model parameters: bolus ad-
ministration data (SE: standard error; SD: standard deviation).
3.8.3 Ventilatory response to O2 and CO2
In Section 3.7.3 the ventilatory regulation model was parameterized entirely with
published parameters and/or parameters extrapolated from published data in or-
der to achieve adequate agreement with drug-naıve experimental ventilatory re-
sults. In the work discussed here, however, the carbon dioxide sensitivity, F , and
the pharmacodynamic parameters are estimated in each study subject from mea-
sured PaCO2 and minute ventilation values after administration of a fast acting
mu agonist, alfentanil.
Simulation case studies using a sophisticated model of respiratory and metabolic
physiology [195] demonstrate that, despite sustained hypoventilation (precisely, forVE(ss)
VE0
= 0.5), arterial blood is fully saturated (SatO2 ≈ 100%) when breathing
oxygen-enriched air (FIO2 ≥ 0.5). This is in agreement with what was concluded
in Section 3.7.6. Therefore the modeled oxygen dependent term of ventilatory
regulation, VO2, can be simplified to a constant factor. In the following we shall
assume VO2(t) = 0.8, ∀ t.
3.8.4 Pharmacokinetic analysis
To describe drug distribution kinetics we opt for a compartmental mammillary
modeling approach. This customary class of pharmacokinetic models is based on
the following simplifying assumptions:
- different regions of the body can be represented by virtual compartments
disregarding the physical properties of the described tissues;
- intravenously administered drugs mix instantaneously and completely within
an initial distribution volume, termed the central compartment (i.e., the cen-

3.8 Parsimonious modeling of the metabolic system 107
0
200
400
500
100
300
Alfe
ntan
il C
p[n
g/m
l]
30
40
50
60
70
PaC
O2
[mm
Hg]
0 10 20 30 405 15 25 35 450
0.2
1
1.41.2
0.80.60.4N
orm
aliz
edm
inut
e ve
ntila
tion
[−]
Time [min]
Figure 3.33: The alfentanil plasma concentration, arterial CO2 partial pressure and
fractional minute ventilation time course after administration of 1 mg
alfentanil intravenous bolus. Bullets: experimental observations in 10
healthy volunteers. Dash-dotted lines: respiratory model simulation
results (individual fits). Continuous lines: simulation results achieved
with population respiratory model parameters (see Table 3.8).

108 3 Feedback control of sedation
0 100 200 300 4000
100
200
300
400
Measured Cp [ng/ml]
Sim
ulat
ed C
p[n
g/m
l]
30 40 50 60 70 8030
40
50
60
70
80
Measured PaCO2 [mmHg]
Sim
ulat
ed P
aCO
2[m
mH
g]
0.2 0.4 0.6 0.8 1 1.2
0.2
0.4
0.6
0.8
1
1.2
Measured normalized minute ventilation [−]
Sim
ulat
ed n
orm
.m
inut
e ve
ntila
tion
[−]
Figure 3.34: Goodness-of-fit diagnostic plot for the ventilatory control model.
Model predictions of alfentanil plasma concentration, PaCO2, and
fractional minute ventilation based on individual parameter values are
plotted against measurements taken in 14 ASA status I-II patients
during intravenous constant infusion of alfentanil.

3.8 Parsimonious modeling of the metabolic system 109
tral compartment to which drugs are input exhibits well-mixed tank behav-
ior);
- the dose-drug concentration relationship is linear and time-invariant.
A two-compartment mammillary model is fitted to each individual plasma con-
centration versus time course, Cp(t). The mass balance equations for the two
compartments are:
dC1(t)dt
= −(k10 + k12)C1(t) + k21C2(t) + I(t)V1
(3.70)
dC2(t)dt
= k12C1(t) − k21C2(t) (3.71)
Cp(t) = C1(t) (3.72)
where I(t) is the drug infusion rate, V1 and V2 the volumes of distribution, k10 the
central elimination rate constant, k12 and k21 the intercompartmental (distribution)
rate constants.
3.8.5 Effect compartment modeling
We hypothesize the existence of distinct sites of pharmacologic action for the drug
dependent decrease of minute ventilation and metabolic CO2 production. A central
link model [173] is therefore introduced for each of the effects, according to the
following equations:
dCeMV (t)dt
= ke0MV [Cp(t) −CeMV (t)] (3.73)
dCeCO2(t)
dt= ke0CO2
[Cp(t) −CeCO2(t)] (3.74)
where Cp(t) is the drug concentration in plasma calculated from the individual
dosing history and pharmacokinetic parameters (Equations 3.70-3.72); Ce(t) is the
drug concentration in the effect compartment; ke0 is the first-order rate constant
governing the transfer of drug from the central to the effect compartment, and vice
versa. The subscripts MV and CO2 indicate whether the quantities refer to the
pharmacologic effect on minute ventilation or CO2 production, respectively.
3.8.6 Pharmacodynamic modeling
To describe drug effects on ventilatory regulation, the pharmacodynamic model
presented in Section 3.7.4 is considered. Assuming the administration of oxygen-
enriched air, we can neglect the hypoxic respiratory drive as well as drug effects on

110 3 Feedback control of sedation
Parameter Mean SE SD
VdCO2[l] 41.82 3.46 12.95
F [−] 4.27 0.17 0.65
MPCO2min [−] 0.78 0.03 0.11
ke0MV [min−1] 1.25 0.11 0.41
ke0CO2[min−1] 0.71 0.06 0.21
C50 [ng/ml] 71.66 3.33 12.45
γ [−] 1.77 0.08 0.30
Table 3.9: Estimated population values of respiratory model parameters: constant
infusion data.
the O2 response (see Section 3.8.3). Therefore the pharmacodynamic model can be
simplified and reduced to the following equations:
VE(t) = VE(0) ⋅ VCO2(t) ⋅ VO2
(t) ⋅⎡⎢⎢⎢⎢⎢⎣1 −
(Ce(t)C50)γ
1 + (Ce(t)C50)γ⎤⎥⎥⎥⎥⎥⎦
(3.75)
MP CO2(t) =MPCO20 ⋅
⎡⎢⎢⎢⎢⎢⎣1 − (1 −MPCO2min) ⋅ (
Ce(t)C50)γ
1 + (Ce(t)C50)γ⎤⎥⎥⎥⎥⎥⎦
(3.76)
3.8.7 Alfentanil induced ventilatory depression
The descriptive performance of the model is evaluated through simulations aimed
at reproducing experimental results of drug effects on ventilatory regulation after
administration of a fast-onset mu agonist. The experimental data was provided by
our collaborators at the University Hospital Bern. The clinical protocol employed
to collect the experimental measurements is described in the following.
After obtaining institutional review board approval and written informed consent,
we enroled 24 subjects for administration of a fast-onset, highly potent mu agonist,
alfentanil.
Amongst the study subjects, 14 men classified as American Society of Anesthe-
siologists (ASA) physical status I or II were scheduled for major urologic surgery.
The unpremedicated patients were studied before anesthesia was induced. A 2.3
µg (kg min)−1 intravenous infusion of alfentanil was started while the patients
were breathing oxygen-enriched air (FIO2 = 0.5) over a tightly fitting face mask.
This enabled recording of the respiratory rate, approximate minute ventilation, and
end-expiratory partial pressure of carbon dioxide using the standard monitors of

3.8 Parsimonious modeling of the metabolic system 111
an anesthesia workstation (Cicero; Drager, Lubeck, Germany). Minute ventilation
was averaged per minute from single breath values. The infusion was discontinued
when a cumulative dose of 70 µg/kg had been administered, the end-expired partial
pressure of carbon dioxide exceeded 65 mmHg, or apneic periods lasting more than
60 s occurred. Arterial blood samples were drawn before and 3, 6, 9, 12, 15, 20,
25, 30, 35, 40, 45, 50, and 60 min after the start of the infusion for alfentanil assay
and determination of PaCO2.
The second group of study subjects constituted of 10 volunteers that received
1 mg alfentanil i.v. bolus while breathing pure oxygen (FIO2 = 1). PaCO2 was
sampled at 0, 1, 2, 3, 4, 5, 7.5, 10, 12.5, 15, 20, 30, 45 minutes.
The simulated ventilatory response achieved with least-squares estimates of the
individual parameters and the experimental data measured after administration
of 1 mg alfentanil bolus are displayed in Figure 3.33. Model predictions of arte-
rial PCO2 and fractional minute ventilation based on individual parameters are
plotted in Figure 3.34 against measured data in constant infusion study subjects.
The proposed model adequately describes the experimental data under both drug
administration conditions.
Ventilatory and pharmacodynamic parameters for the population are naıvely
derived by averaging the individual parameter values, according to the experimental
dosing regimen. The estimated population parameters are summarized in Table 3.8
and 3.9 for the bolus administration and the constant infusion group, respectively.
3.8.8 Results discussion
The model of respiratory regulation has a parsimonious yet comprehensive struc-
ture with substantial predictive capability in the non-steady state. It was shown
in Section 3.7 that the ventilatory model provides an adequate description of the
hypercarbic respiratory drive, the acute hypoxic respiratory drive and their inter-
action in the absence of drug. Here, we establish that the proposed model can
describe clinical experimental results of drug induced respiratory depression under
non-steady state conditions for diverse dosing regimens of a fast-acting and potent
anesthetic agent. The estimated population parameters are in good agreement with
results published in the literature [30, 25]. Interestingly, CO2 sensitivity could be
estimated without performing drug naıve CO2 response curves.
Introduction of a single hypothetical effect compartment for the drug dependent
decrease of minute ventilation and CO2 production was attempted but it performed
relatively poorly describing the observations when compared to the model discussed
here, demonstrating the importance of evaluating multiple models in pharmacody-

112 3 Feedback control of sedation
namic research.
Besides providing clinically relevant predictions of respiratory depression, the
model can also serve as a test bed to investigate issues of drug tolerability and dose
finding/control under non-steady state conditions. In the next section we shall
employ it as a virtual patient for the design and test of a model-based feedback
control strategy aimed at delivering propofol sedation.
3.9 Model predictive control for propofol
sedation
In order to investigate the applicability of the proposed sedation paradigm to clin-
ical practice we undertake further testing in a simulation environment.
The use of propofol in gastroenterology practice has been steadily increasing
over the last decade [99] because of its favorable pharmacokinetics/dynamics and
side effect profile. With prospective application to colonoscopy patients at the
University Hospital Bern, in the next sections we investigate the problem of propofol
administration for delivery of sedation.
The unified framework of ventilatory physiology and respiratory drug effects pro-
posed in Section 3.8 is employed in the following to design and test a feedback con-
troller for the administration of sedation. As control strategy, we choose a model
predictive control (MPC) algorithm in order to take advantage of the capabilities
inherent to this method of predicting future plant behavior and fulfilling problem
constraints. The design of the MPC controller for the automatic delivery of sedation
is described in the next section.
3.9.1 Control design
In the following we discuss a reference tracking problem for a linear constrained
system in the presence of disturbances and plant-model mismatch. The objective
is to achieve offset free performance and apply such control law to the delivery of
propofol sedation.
Model linearization
Because we consider linear MPC, we linearize the nonlinear plant described in
Section 3.8 (virtual patient) around the operating point PtcCO2 = 52 mmHg, Ce =2.9 µg/ml, which according to clinical experience corresponds to moderate/deep
sedation [26, 27].

3.9 Model predictive control for propofol sedation 113
Preliminaries
For control design we consider a linear, time invariant discrete system:
xk+1 = Axk +Buk (3.77)
yk = Cxk (3.78)
in which xk ∈ Rnx, uk ∈ Rnu , yk ∈ Rny , A ∈ Rnx×nx , B ∈ Rnx×nu , C ∈ Rny×nx . We
assume (A,B) stabilizable and (C,A) detectable with C full row rank (i.e. the
output variables must be independent of each other). We define the controlled
variables as z =Hy, where z ∈ Rnz , H ∈ Rnz×ny , with H full row rank and nu ≥ nz.
We consider the following receding horizon optimal control problem with quadratic
objective function:
J∗(xk) ∶= minu0,...,uN−1
N−1
∑i=0(xT
i Qxi + uTi Rui) + xT
NQNxN (3.79)
s.t. xi ∈ X ⊆ Rnx, ui−1 ∈ U ⊆ R
nu , ∀ i ∈ 1, . . . ,NxN ∈ Txi+1 = Axi +Bui
R ≻ 0, Q ⪰ 0, QN ⪰ 0
The optimization problem is defined by the plant model matrices (A,B), the
prediction horizon N , the current state vector x0, the objective function cost ma-
trices Q and R, the terminal set T and terminal cost QN . At every time step k the
optimal input sequence is computed as the solution of the optimization problem
above for x0 = xk. Of the computed optimal open-loop control sequence, the input
uk = u∗0 is applied to the plant and the rest of the input sequence (u∗1, . . . , uN−1) is
discarded [154,128].
We assume the state vector is not directly measurable, therefore the states are
estimated from the plant measurements by means of a Kalman state observer with
filter gain L. At each time step k, the state vector is estimated as:
xk+1∣k = (A −LC)xk∣k−1 +Buk +Lyk (3.80)

1143
Feed
back
contro
lofsed
atio
n
0 500 1000 150035
40
45
50
55
Time (s)
Ptc
CO
2 (m
mH
g)
0 500 1000 1500−1
0
1
2
3
4
Time (s)
Ce (
µg/m
l)
C50 = 1.2 C50population
0 500 1000 15000
50
100
150
200
250
300
Time (s)
Infu
sion
rat
e 1%
pro
pofo
l (m
l/h)
0 500 1000 15000
50
100
150
200
250
Time (s)
Cum
ulat
ive
prop
ofol
dos
e (m
g)
0 500 1000 150035
40
45
50
55
Time (s)
Ptc
CO
2 (m
mH
g)
0 500 1000 15000
1
2
3
4
Time (s)
Ce (
µg/m
l)
C50 = C50population
0 500 1000 15000
50
100
150
200
250
300
Time (s)
Infu
sion
rat
e 1%
pro
pofo
l (m
l/h)
0 500 1000 15000
50
100
150
200
250
Time (s)
Cum
ulat
ive
prop
ofol
dos
e (m
g)
0 500 1000 150035
40
45
50
55
Time (s)
Ptc
CO
2 (m
mH
g)
0 500 1000 15000
1
2
3
4
Time (s)
Ce (
µg/m
l)
C50 = 0.8 C50population
0 500 1000 15000
50
100
150
200
250
300
Time (s)In
fusi
on r
ate
1% p
ropo
fol (
ml/h
)0 500 1000 1500
0
50
100
150
200
250
Time (s)
Cum
ulat
ive
prop
ofol
dos
e (m
g)
Figure 3.35: Simulation results of the MPC propofol sedation problem.

3.9 Model predictive control for propofol sedation 115
Disturbance model
In order to achieve offset-free performance, we augment the system state with an
additional integrating disturbance vector [154, 128]. As mentioned in the above,
the state vector is repeatedly estimated from the plant measurements by using a
Kalman estimator designed for the following augmented system:
[ xk+1
dk+1
] = [ A Bd
0 I] [ xk
dk
] + [ B0]uk +wk (3.81)
yk = [ C Cd ] [ xk
dk
] + vk (3.82)
where dk ∈ Rnd, Bd ∈ Rnx×nd, Cd ∈ Rny×nd. The vectors wk ∈ Rnx+nd and vk ∈ Rny
are the process and measurement zero-mean white-noise disturbances, respectively.
The estimator gain matrix for the augmented model is:
L = [ Lx
Ld
] (3.83)
being Lx ∈ Rnx×ny and Ld ∈ Rnd×ny the matrices for the augmented state and the
disturbance, respectively. The Kalman estimate is therefore:
[ xk+1∣k
dk+1∣k] = [ A Bd
0 I] [ xk∣k−1
dk∣k−1] + [ B
0]uk+
+ [ Lx
Ld
] (yk −Cxk∣k−1 −Cddk∣k−1) (3.84)
MPC controller
We employ a steady state target calculator to compute the steady state target
xss(rss, dss) and uss(rss, dss) for a given reference rss and disturbance dss, as de-
scribed in [146, 154]:
[ I −A −BHC 0
] [ xss
uss
] = [ Bd
−HCd
]dss + [ 0
I] rss (3.85)
A solution exists for any rss, dss if:
rank [ I −A −BHC 0
] = nx + nz (3.86)

116 3 Feedback control of sedation
The objective is to asymptotically eliminate the error in the control sequence, given
a constant reference signal r∞ and assuming constant, non-decaying disturbances
and plant-model mismatch and stability of the closed loop, that is:
z(k) → r∞ for k →∞ (3.87)
Let the solution to Equation 3.86 exist; we modify the MPC problem according
to the target variables xss, uss:
J∗(xk) ∶= minu0,...,uN−1
N−1
∑i=0(xi − xss)TQ(xi − xss)+
+ (xN − xss)TQN(xN − xss)+ (ui − uss)TR(ui − uss) (3.88)
s.t. xi ∈ X ⊆ Rnx , ui−1 ∈ U ⊆ R
nu , ∀ i ∈ 1, . . . ,NxN ∈ T (xss, uss)xi+1 = Axi +Bui
R ≻ 0, Q ⪰ 0, QN ⪰ 0
3.9.2 Closed loop delivery of propofol sedation
We apply the control strategy outlined in the above to the administration of propo-
fol for the delivery of sedation. We assume the use of 1% propofol emulsion (10
mg/ml). The prediction horizon is chosen to be N = 50 with a sampling time
Ts = 10 s, which accounts for the relatively slow dynamics of the physiological CO2
response. The following constraints on the input and the outputs are defined in
agreement with clinical recommendations for sedation [98]:
0 ml/h < u < 270 ml/h
40 mmHg < PtcCO2 < 60 mmHg
0 µg/ml < Ce < 4 µg/ml
(3.89)
In Figure 3.35 we depict the results of a representative simulated sedation case
that includes an initial induction phase and a subsequent maintenance phase. At
time t = 0− s the system is drug-naıve and in steady state at baseline (PtcCO2 =
40 mmHg, Ce = 0 µg/ml). At t = 0 s the setpoints for control are set to the
following values: PtcCO2 = 50 mmHg, Ce = 2.5 µg/ml. The results are shown
in terms of PtcCO2, Ce, rate of delivered infusion, and cumulative dose for three
3.10 Respiratory depression during propofol sedation in colonoscopy patients 117
different virtual patients: one subject with normal sensitivity to the drug (i.e. C50
= C50population = 1.33 µg/ml [26]), and two subjects with significant variability
in drug sensitivity (± 20% of C50population). The controller successfully manages
the physiological variability and achieves the PtcCO2 and Ce setpoints despite the
plant-model mismatch with satisfactory timing. Similar results can be obtained
with other setpoints, provided they satisfy the constraints stated in Equation 3.89.
3.9.3 Results discussion
The physiological model derived in Section 3.8 allowed us to investigate efficiently
the use of a model based controller to deliver propofol sedation. The MPC controller
adjusts drug delivery and achieves the target PtcCO2 and Ce setpoints despite sig-
nificant pharmacodynamic variability. Employing the model based control strategy
presented in this section is advantageous compared to the less sophisticated design
that was considered in Section 3.6 because it optimizes future control moves based
on the predicted evolution of the system and it offers the possibility to handle
constraints on the input and outputs.
The proposed dosing paradigm is currently being investigated in gastroenterology
patients at the University Hospital Bern, our clinical partner institution. In the
next section the study methods are discussed. Preliminary results of the feasibility
study are presented in Section 3.12.
3.10 Clinical investigation: respiratory
depression during propofol sedation in
colonoscopy patients
3.10.1 Study investigators
Investigators:
M. Eng. Antonello Caruso, Automatic Control Lab, ETH Zurich, Switzerland
Prof. Manfred Morari, Automatic Control Lab, ETH Zurich, Switzerland
Priv.-Doz. Dr. med. Martin Luginbuhl, Department of Anesthesiology and
Pain Therapy, University Hospital Bern, Switzerland
Dr. sc. tech. Peter Schumacher, Head R&D, SenTec AG, Therwil, Switzer-
land

118 3 Feedback control of sedation
Dr. med. Pascal Vuilleumier, Department of Anesthesiology and Pain Ther-
apy, University Hospital Bern, Switzerland
CRNA Volker Hartwich, Department of Anesthesiology and Pain Therapy,
University Hospital Bern, Switzerland
3.10.2 Introduction
The proposed dosing paradigm for the automatic delivery of sedation is lacking
in vivo validation. Therefore during my time at IfA we planned an observational
clinical study to validate the sedation paradigm in patients. The study was designed
and prepared in collaboration with our research partners at the Inselspital (see
below for a complete list of clinical investigators). Because of the widespread use of
sedation for gastroenterologic procedures, we identified colonoscopy (the endoscopic
examination of the colon) as a suitable clinical application. The study is currently
being completed at the Inselspital. Regrettably, final results are not yet available
for presentation and discussion at the time of writing.
In the following we will provide a description of the study plan and methods. In
Section 3.11 we shall describe the most significant features of the clinical prototype
that was designed and is currently being used to perform the clinical study. The
prototype was conceived and implemented by myself and the D-MAVT Bachelor
student Philip Jonas at IfA and by Dr. Peter Schumacher at the Inselspital in
several stages between March 2008 and April 2009. Finally, in Section 3.12 we will
provide the preliminary clinical findings from the first batch of colonoscopy patients
we investigated as of November 2009.
3.10.3 Background
Propofol administration performed by non anesthesiologists is increasingly frequent,
especially for gastroenterologic procedures [99]. Data on safety have been published
mainly in the non anesthesiologic literature [102, 101]. In Switzerland but not in
other European countries the sedation rate is high and the vast majority of patients
are monitored via pulse oximetry [99,117]. Gastroenterologists administer propofol
mostly by boluses of 10-20 mg i.v. and titrate to effect, resulting in total doses of
1.5-2.4 mg/kg for esophago-gastro-duodenoscopies and colonoscopies, respectively
[100]. The rate of side effects reported in the gastroenterologic literature is as
follows:
- Decrease of mean arterial pressure greater than 25% in 32%

3.10 Respiratory depression during propofol sedation in colonoscopy patients 119
- systolic arterial pressure < 90 mmHg in 15
- bradycardia < 50 min−1 in 3.7%
- SpO2 below 90% in 1.6% with oxygen administration of at least 2 l/min
nasally.
Higher incidences were reported in ASA 3 and 4 patients [100].
Although these data show that the incidence of severe side effects is low there are
several concerns. Propofol induces hypoventilation and upper airway obstruction
already in the concentration range of 2.5 mcg/ml plasma concentration [26, 68].
Oxygen administration masks the decrease of the respiratory volume. Oxygen de-
saturation to SpO2 90% occurs only 8 min after start of apnea in pre-oxygenated
adults [14], whereas it occurs after 1 min in a non pre-oxygenated adult of normal
weight [63]. With a transcutaneous carbon dioxide monitor (V-Sign, SenTec AG,
Therwil, Switzerland), detection of hypoventilation in sedated patients undergoing
colonoscopies was more rapid, and a 7.6 mmHg increase in transcutaneous carbon
dioxide partial pressure was recorded [97]. The sedative and respiratory depressant
effect of propofol occurs in the same concentration range in unstimulated patients.
Measurement of the sedation level by means of processed EEG parameters, such
as the Bispectral Index, or the state or response entropy, is unreliable because of
artifacts [78,190]. Respiratory depression can be easily measured with a transcuta-
neous carbon dioxide monitor and may therefore represent a promising alternative.
Titration of a sedative drug to a safe level of respiratory depression with a closed
loop control system may facilitate propofol sedation, particularly when provided
by non anesthesiologists.
The purpose of this observational study is:
1. to compare the respiratory depression effect of propofol in terms of the in-
crease of transcutaneous PCO2 in patients undergoing elective colonoscopy
before and during the exam
2. to determine the transcutaneous PCO2 associated with adequate sedation
during colonoscopy
3. to design a controller algorithm according to these findings
4. prospectively, to test said controller in a group of patients.
120 3 Feedback control of sedation
3.10.4 Study methodology
Study design
Observational, single center study, setting: University Hospital Bern
Study population
50 patients of American Society of Anesthesiologists (ASA) physical status I-III
scheduled for colonoscopy under conscious sedation will be enrolled.
The exclusion criteria are:
- chronic treatment with CNS active drugs or opioids or chronic alcohol con-
sumption of more than 20 g daily
- symptomatic neurologic (including epilepsy) or psychiatric disease
- history of severe cardiovascular, pulmonary, renal and liver disease
- difficult airway (more than one of the criteria predicting difficult intubation,
Mallampati score > 2, retrognathy, mouth opening less than 4 cm, short neck
and limited cervical spine reclination)
- obstructive sleep apnea.
Because it is an observational study no control group and no randomization is
necessary. A randomized controlled study is planned as follow-up study.
Study plan
Upon arrival in the endoscopy suite the unpremedicated patients are connected
to a Datex AS3 compact monitor (GE Healthcare, Helsinki, Finland) for ECG,
SpO2, end-expiratory CO2 and NIBP, and a venous line is placed in an antecu-
bital vein. After calibration a transcutaneous sensor (V-Sign, SenTec AG, Therwil,
Switzerland) for measuring transcutaneous carbon dioxide and oxygen saturation
is attached to the earlobe. The data from both monitors is recorded on a computer
hard disc. The V-Sign (CO2) monitor is connected to a laptop computer which
drives an ASENA GH infusion pump (Cardinal Health, Baesweiler, Germany) used
for infusing propofol (Disoprivan, Astra-Zeneca, Grafenau, Switzerland). Addition-
ally respiratory rate is monitored with the end-expiratory CO2 curve.
Before starting the propofol infusion, nasal prongs are attached and connected
to the AS3 monitor CO2 sampling tube. Oxygen 6 l/min is administered via face
mask.
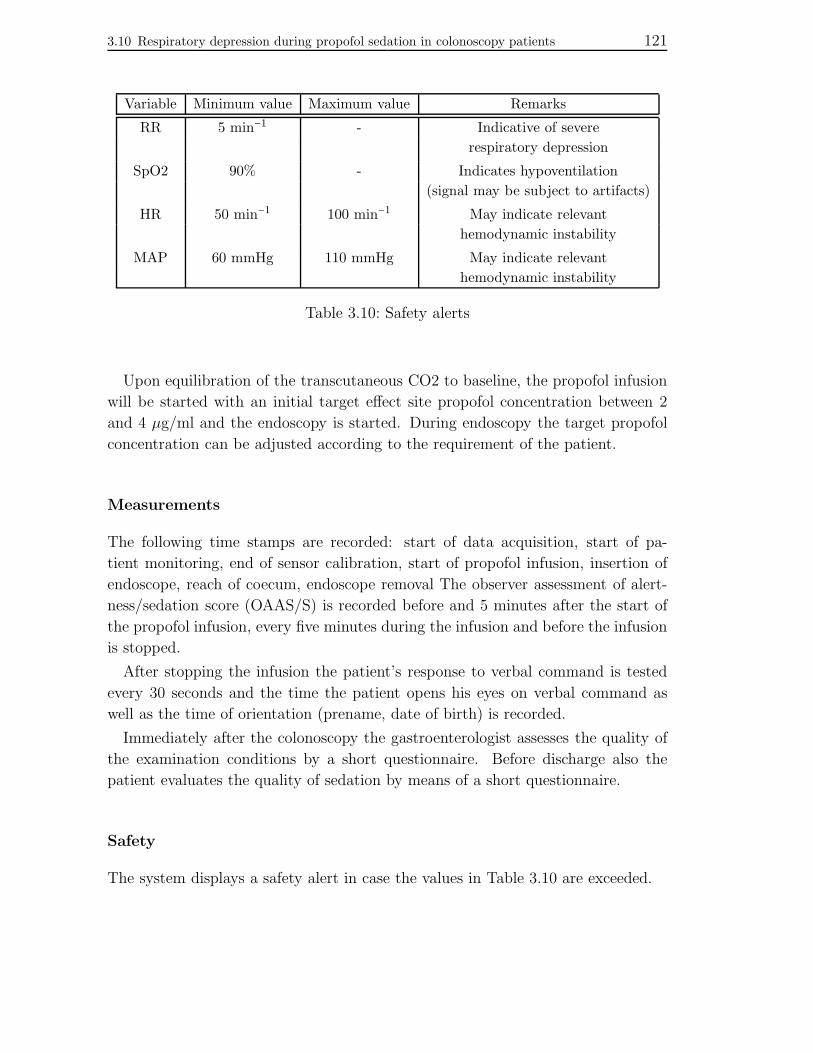
3.10 Respiratory depression during propofol sedation in colonoscopy patients 121
Variable Minimum value Maximum value Remarks
RR 5 min−1 - Indicative of severe
respiratory depression
SpO2 90% - Indicates hypoventilation
(signal may be subject to artifacts)
HR 50 min−1 100 min−1 May indicate relevant
hemodynamic instability
MAP 60 mmHg 110 mmHg May indicate relevant
hemodynamic instability
Table 3.10: Safety alerts
Upon equilibration of the transcutaneous CO2 to baseline, the propofol infusion
will be started with an initial target effect site propofol concentration between 2
and 4 µg/ml and the endoscopy is started. During endoscopy the target propofol
concentration can be adjusted according to the requirement of the patient.
Measurements
The following time stamps are recorded: start of data acquisition, start of pa-
tient monitoring, end of sensor calibration, start of propofol infusion, insertion of
endoscope, reach of coecum, endoscope removal The observer assessment of alert-
ness/sedation score (OAAS/S) is recorded before and 5 minutes after the start of
the propofol infusion, every five minutes during the infusion and before the infusion
is stopped.
After stopping the infusion the patient’s response to verbal command is tested
every 30 seconds and the time the patient opens his eyes on verbal command as
well as the time of orientation (prename, date of birth) is recorded.
Immediately after the colonoscopy the gastroenterologist assesses the quality of
the examination conditions by a short questionnaire. Before discharge also the
patient evaluates the quality of sedation by means of a short questionnaire.
Safety
The system displays a safety alert in case the values in Table 3.10 are exceeded.

122 3 Feedback control of sedation
3.11 Sedation delivery system prototype
In this section the platform currently in use to perform the sedation clinical study
is described. The system enables the control and operation of a syringe pump for
anesthetic delivery in real time; it gathers sensor data and embodies a number of
sensor checks and alarms; it provides past and predicted PCO2 and drug concentra-
tion values; it allows the storage of clinical data for later access and analysis. This
platform was specifically designed for the sedation trials and implemented jointly
at IfA and the Inselspital between March 2008 and April 2009. It comprises of both
hardware and software elements which are described in the following.
3.11.1 System setup
Hardware configuration
The hardware configuration of the clinical prototype built to perform PCO2 based
sedation is depicted in Figure 3.36. Two computers constitute the backbone of
the system: a host PC running a graphical user interface (GUI) and managing all
interactions with the end-user, and an embedded real time platform connected to
the system’s actuator and sensors. As real time device we use a xPC TargetBox
(The MathWorks Inc, Natick, MA, USA), a product purposely designed for rapid
prototyping applications. The two computers are Ethernet connected.
The SenTec V-Sign sensor (SenTec AG, Therwil, Switzerland) provides accu-
rate, continuous real time monitoring of patient ventilation and oxygenation. For
backup and validation purposes we also use the Nico monitor (Philips Respironics,
Murrysville, PA, USA) that infers cardiac output based on changes in respiratory
carbon dioxide concentration. A Alaris GH Syringe Pump is employed for drug
delivery to the patient. All three devices are connected with the xPC TargetBox
via a serial connection.
Software configuration
The anesthetic platform is implemented in two different software environments, as
shown in Figure 3.37. The pharmacokinetic/dynamic patient model and the drivers
for actuator and sensors are implemented in the Matlab/Simulink environment
running on the host PC. The graphical user interfaces are also executed on the host
machine, enabling the care provider to monitor and operate the sedation system.
The Simulink and Stateflow models of the Matlab/Simulink environment are then
deployed into the xPC Target environment on the xPC TargetBox for real time

3.11 Sedation delivery system prototype 123
Figure 3.36: Hardware setup of the sedation system prototype.
Figure 3.37: Software setup of the anesthetic application showing the two software
environments discussed in Section 3.11.1.

124 3 Feedback control of sedation
execution.
3.11.2 Device drivers
In the following individual features of actuator/sensor drivers are identified.
Pump driver
The sedation system enables the end user to perform the following tasks on the
syringe pump:
- enable/disable the pump driver for device control via GUI or manual
- remotely switch on/off the pump
- start/pause/stop the infusion
- set the infusion rate
Figure 3.38 illustrates the pump control hierarchy. The user can only control
the device when the driver is enabled, otherwise the pump responds exclusively to
commands set on its physical interface. To verify correct connection between the
device and the xPC TargetBox, the pump driver confirms every two seconds its
functionality. When this signal is lost the pump device alerts the system user with
a RS232 timeout warning.
The actuator driver provides information about the current status of the pump.
The device updates and outputs every second the following signals:
- actual infusion rate [ml/h]
- total infused volume [ml]
- time to infusion end due to empty syringe [s]
SenTec sensor driver
Every second the sensor driver provides the following signals:
- transcutaneous CO2 partial pressure [mmHg]
- oxygen saturation [%]
- sensor status information (status flags)

3.11 Sedation delivery system prototype 125
Figure 3.38: Actuator control hierarchy.
The PCO2 signal provides a measurement of carbon dioxide in the blood. The
SpO2 signal quantifies blood oxygen saturation. Sensor flags detect the following
conditions:
- sensor resting in docking station
- digital monitor failure
- unit ready
- movement artefact in measurements
- movement and low signal
- CO2 stabilization
- sensor detached from patient, signal lost
- sensor calibration
- excess ambient light

126 3 Feedback control of sedation
Figure 3.39: Schematic illustration of the anesthetic platform architecture. Blue
ovals: signals transferred between system elements. Yellow rectangles:
anesthesia system components deployed into the real time environ-
ment. Green rectangle: graphical user interfaces running on the host
computer.
- sensor failure
Nico sensor driver
The following sensor signals are provided by the driver:
- respiratory rate [min−1]
- device internal time [s]
Contrary to the SenTec sensor, the Nico monitor updates the output signals at
the end of each respiratory cycle. The internal time signal is used to ensure that
connection to the monitor is not lost during system operation, in case the device
output is not updated because of patient apnea.
3.11.3 Supervisory module
Clinical and technical requirements as well as safety concerns mandate the use of
a supervisory module within the sedation system. Its purpose is to handle the
interactions between the user via the GUIs and the device drivers. It also manages

3.11 Sedation delivery system prototype 127
Figure 3.40: The top layer of the supervisory module chart.
system initialization and shutdown as well as data storage, transfer and recovery.
Moreover, during system operation the supervisory module continuously monitors
the actuator and sensor signals to detect crossing of potentially dangerous pre-
defined thresholds. When a violation occurs, the supervisory module prompts the
user for action. Figure 3.39 outlines the location and connections of the supervisory
module within the sedation system architecture.
The supervisory module is implemented as a Stateflow chart. As discussed in
the above, the module acts as a control unit for the sedation system with the main
task to operate the pump, manage the sensor signals and handle user-system in-
teractions. The sedation system can be in four states as illustrated in Figure 3.40.
At startup the system is in a state labeled initialization mode. During normal exe-
cution the system switches to the operating mode. At shutdown the system enters
the stop mode. In case of an emergency the system is forced into the emergency
mode. The conditions to switch from one state to another are listed beside the
corresponding arrow. Text shaded in yellow symbolizes a button in the main sys-
tem GUI (see Section 3.11.4) that must be pressed to induce the state transition.
The tasks performed by the system during normal execution (operating mode) are
shown in Figure 3.41.

128 3 Feedback control of sedation
Figure 3.41: Hierarchy of the state operating mode.
Figure 3.42: Configuration Gui. The input fields refer to the parameters of the
automatic controller, the patient metrics and the PK model.

3.1
1Sed
atio
ndeliv
erysy
stempro
toty
pe
129
Figure 3.43: Main Gui. As an example, the therapy is running in closed loop with a PtcCO2 setpoint of 55 mmHg. The
SenTec and Nico sensor signals are displayed numerical and also plotted in the right pane of the interface.
Additionally, the pharmacokinetic model predictions for the plasma and effect propofol concentration are
shown from 15 minutes into the past to 10 minutes into the future.

1303
Feed
back
contro
lofsed
atio
n
0 500 1000 1500 2000 2500 3000 3500 4000 45003540455055
Ptc
CO
2[m
mH
g]
5 5 5 3 1 4 5 5 5
0 500 1000 1500 2000 2500 3000 3500 4000 45000
1020304050
RR
[cou
nts/
min
]
0 500 1000 1500 2000 2500 3000 3500 4000 45000
100200300400
Time [s]
requested inf. rate [ml/hr] delivered rate cumulative infusion [mg]
0 500 1000 1500 2000 2500 3000 3500 4000 4500
90
10095
SpO
2 [%
]
0 500 1000 1500 2000 2500 3000 3500 4000 45000
2
4C
e
Patient 6
propofol setpoint fentanyl C
e [ng/ml]
propofol Ce [µg/ml]
PtcCO2 [mmHg] endoscope in−to coecum from coecum−out pain intraop. event
Figure 3.44: Intraoperative measurements for Patient 6 (see Section 3.12.1 for a detailed explanation of figure content).

3.1
1Sed
atio
ndeliv
erysy
stempro
toty
pe
131
36 38 40 42 44 46 4840
60
80
100
PtcCO2 [mmHg]B
IS [−
]
Patient 6
Pearson ρ = −0.86392Spearman ρ = −0.85433
0 500 1000 1500 2000 2500 3000 3500 4000 450035
40
45
50P
tcC
O2
[mm
Hg]
Time [s]
0 500 1000 1500 2000 2500 3000 3500 4000 450040
60
80
100
BIS
[−]
Time [s]
pre−op post−op intra−op linear fit
Figure 3.45: Top: BIS measurements vs. transcutaneous CO2 partial pressure readings in Patients 6. The clinical data
is presented as raw measurements before, during and after the colonoscopy (red, blue, and green circles,
respectively), and the linear fit for all measurements (blue line). Center and bottom: transcutaneous CO2
partial pressure and BIS measurements (color coded as in top panel).

1323
Feed
back
contro
lofsed
atio
n
0 500 1000 1500 2000 2500 3000 3500 40003540455055
Ptc
CO
2[m
mH
g]
5 5 5 5 5 2 0 0 5
0 500 1000 1500 2000 2500 3000 3500 4000
95100
90SpO
2 [%
]
0 500 1000 1500 2000 2500 3000 3500 40000
1020304050
RR
[cou
nts/
min
]
0 500 1000 1500 2000 2500 3000 3500 40000
100200300400
Time (s)
0 500 1000 1500 2000 2500 3000 3500 40000
2
4
Patient 7
Ce
propofol setpoint fentanyl C
e [ng/ml]
propofol. Ce [µg/ml]
PtcCO2 [mmHg] endoscope in−to coecum from coecum−out pain intraop. event
requested inf. rate [ml/hr] delivered rate cumulative infusion [mg]
Figure 3.46: Intraoperative measurements for Patient 7 (see Section 3.12.1 for a detailed explanation of figure content).
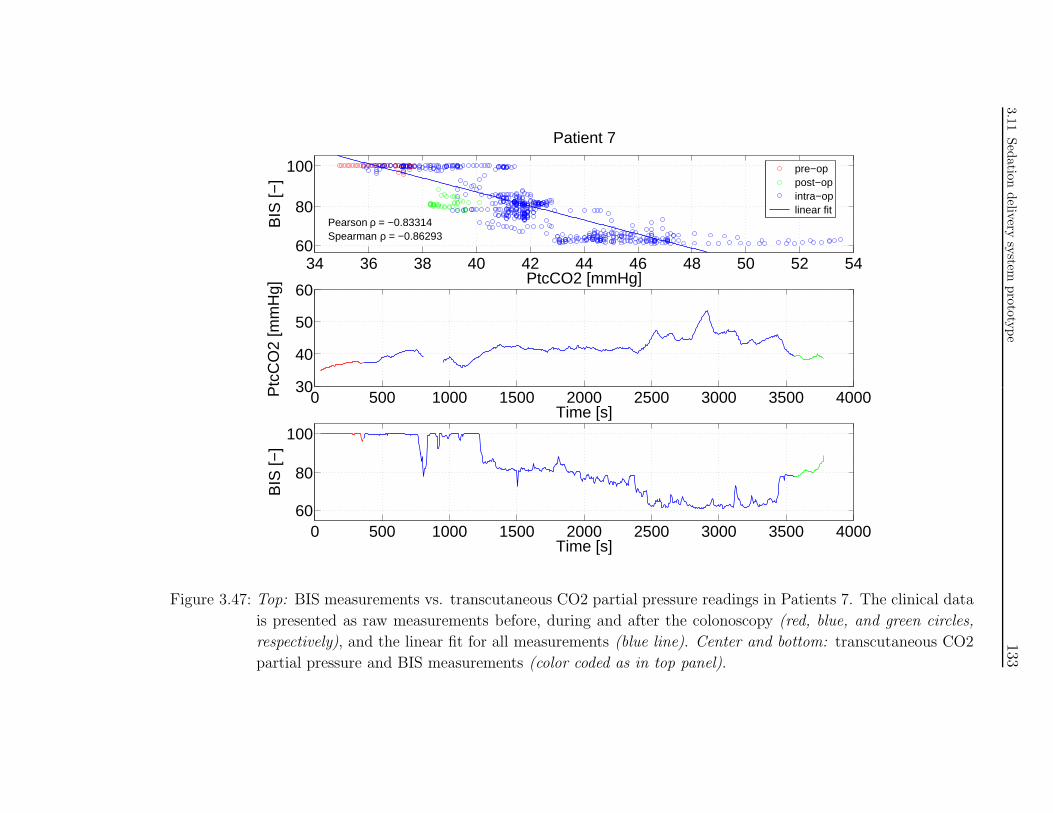
3.1
1Sed
atio
ndeliv
erysy
stempro
toty
pe
133
34 36 38 40 42 44 46 48 50 52 5460
80
100
PtcCO2 [mmHg]B
IS [−
]
Patient 7
Pearson ρ = −0.83314Spearman ρ = −0.86293
pre−op post−op intra−op linear fit
0 500 1000 1500 2000 2500 3000 3500 400030
40
50
60P
tcC
O2
[mm
Hg]
Time [s]
0 500 1000 1500 2000 2500 3000 3500 400060
80
100
BIS
[−]
Time [s]
Figure 3.47: Top: BIS measurements vs. transcutaneous CO2 partial pressure readings in Patients 7. The clinical data
is presented as raw measurements before, during and after the colonoscopy (red, blue, and green circles,
respectively), and the linear fit for all measurements (blue line). Center and bottom: transcutaneous CO2
partial pressure and BIS measurements (color coded as in top panel).

1343
Feed
back
contro
lofsed
atio
n
0 500 1000 1500 2000 2500 3000 35000
2
4
Ce
Patient 8
0 500 1000 1500 2000 2500 3000 35003540455055
Ptc
CO
2[m
mH
g]
5 0 0 5
0 500 1000 1500 2000 2500 3000 3500
9095
100
SpO
2 [%
]
0 500 1000 1500 2000 2500 3000 35000
10
20
RR
[cou
nts/
min
]
0 500 1000 1500 2000 2500 3000 35000
50
100
150
Time (s)
requested inf. rate [ml/hr] delivered rate cumulative infusion [mg]
PtcCO2 [mmHg] endoscope in−to coecum from coecum−out pain intraop. event
propofol setpoint fentanyl C
e [ng/ml]
propofol Ce [µg/ml]
Figure 3.48: Intraoperative measurements for Patient 8 (see Section 3.12.1 for a detailed explanation of figure content).

3.1
1Sed
atio
ndeliv
erysy
stempro
toty
pe
135
36 37 38 39 40 41 42 43 44 45 4660
80
100
PtcCO2 [mmHg]B
IS [−
]
Patient 8
Pearson ρ = −0.68892Spearman ρ = −0.63574
pre−op post−op intra−op linear
0 500 1000 1500 2000 2500 3000 350035
40
45
50P
tcC
O2
[mm
Hg]
Time [s]
0 500 1000 1500 2000 2500 3000 350060
80
100
BIS
[−]
Time [s]
Figure 3.49: Top: BIS measurements vs. transcutaneous CO2 partial pressure readings in Patients 8. The clinical data
is presented as raw measurements before, during and after the colonoscopy (red, blue, and green circles,
respectively), and the linear fit for all measurements (blue line). Center and bottom: transcutaneous CO2
partial pressure and BIS measurements (color coded as in top panel).

1363
Feed
back
contro
lofsed
atio
n
200 400 600 800 1000 1200 1400 1600 18000
2
4
Ce
Patient 9
200 400 600 800 1000 1200 1400 1600 1800
40455055
Ptc
CO
2[m
mH
g]
5 2 0 2 4
200 400 600 800 1000 1200 1400 1600 1800
95
100
SpO
2 [%
]
200 400 600 800 1000 1200 1400 1600 18000
10
20
30
RR
[cou
nts/
min
]
200 400 600 800 1000 1200 1400 1600 18000
50
100
150
Time (s)
requested inf. rate [ml/hr] delivered rate cumulative infusion [mg]
propofol setpoint fentanyl C
e [ng/ml]
propofol Ce [µg/ml]
PtcCO2 [mmHg] endoscope in−to coecum from coecum−out pain event
Figure 3.50: Intraoperative measurements for Patient 9 (see Section 3.12.1 for a detailed explanation of figure content).

3.1
1Sed
atio
ndeliv
erysy
stempro
toty
pe
137
38 39 40 41 42 43 44 45 46 47 4860
80
100
PtcCO2 [mmHg]B
IS [−
]
Patient 9
Pearson ρ = −0.66648Spearman ρ = −0.63664
post−op intra−op linear fit
0 200 400 600 800 1000 1200 1400 1600 180035
40
45
50P
tcC
O2
[mm
Hg]
Time [s]
0 200 400 600 800 1000 1200 1400 1600 180060
80
100
BIS
[−]
Time [s]
Figure 3.51: Top: BIS measurements vs. transcutaneous CO2 partial pressure readings in Patients 9. The clinical data
is presented as raw measurements before, during and after the colonoscopy (red, blue, and green circles,
respectively), and the linear fit for all measurements (blue line). Center and bottom: transcutaneous CO2
partial pressure and BIS measurements (color coded as in top panel).

1383
Feed
back
contro
lofsed
atio
n
0 200 400 600 800 1000 1200 1400 1600 18000
2
4
Ce
Patient 10
0 200 400 600 800 1000 1200 1400 1600 180020
4030
50
Ptc
CO
2[m
mH
g]
5 5 5
0 200 400 600 800 1000 1200 1400 1600 1800
95
100
SpO
2 [%
]
0 200 400 600 800 1000 1200 1400 1600 18000
20
40
RR
[cou
nts/
min
]
0 200 400 600 800 1000 1200 1400 1600 18000
50
100
150
Time (s)
requested inf. rate [ml/hr] delivered rate cumulative infusion [mg]
propofol setpoint fentanyl C
e [ng/ml]
propofol Ce [µg/ml]
PtcCO2 [mmHg] endoscope in−to coecum from coecum−out pain intraop. event
Figure 3.52: Intraoperative measurements for Patient 10 (see Section 3.12.1 for a detailed explanation of figure content).

3.1
1Sed
atio
ndeliv
erysy
stempro
toty
pe
139
20 22 24 26 28 30 32 34 36 38
80
90
100
PtcCO2 [mmHg]
BIS
[−]
Patient 10
Pearson ρ = 0.075158Spearman ρ = 0.031871
pre−op post−op intra−op linear fit
0 200 400 600 800 1000 1200 1400 1600 180020
30
40P
tcC
O2
[mm
Hg]
Time [s]
0 200 400 600 800 1000 1200 1400 1600 1800
80
90
100
BIS
[−]
Time [s]
Figure 3.53: Top: BIS measurements vs. transcutaneous CO2 partial pressure readings in Patients 10. The clinical data
is presented as raw measurements before, during and after the colonoscopy (red, blue, and green circles,
respectively), and the linear fit for all measurements (blue line). Center and bottom: transcutaneous CO2
partial pressure and BIS measurements (color coded as in top panel).

1403
Feed
back
contro
lofsed
atio
n
0 200 400 600 800 1000 1200 1400 1600 1800 2000 22000
2
4C
e
Patient 11
0 200 400 600 800 1000 1200 1400 1600 1800 2000 220030
40
50
Ptc
CO
2[m
mH
g]
5 5 5 5
0 200 400 600 800 1000 1200 1400 1600 1800 2000 2200
95
100
SpO
2 [%
]
0 200 400 600 800 1000 1200 1400 1600 1800 2000 22000
10
20
30
RR
[cou
nts/
min
]
0 200 400 600 800 1000 1200 1400 1600 1800 2000 22000
50100150200
Time (s)
requested inf. rate [ml/hr] delivered rate cumulative infusion [mg]
propofol setpoint fentanyl C
e [ng/ml]
propofol Ce [µg/ml]
PtcCO2 [mmHg] endoscope in−to coecum from coecum−out pain intraop. event
Figure 3.54: Intraoperative measurements for Patient 11 (see Section 3.12.1 for a detailed explanation of figure content).
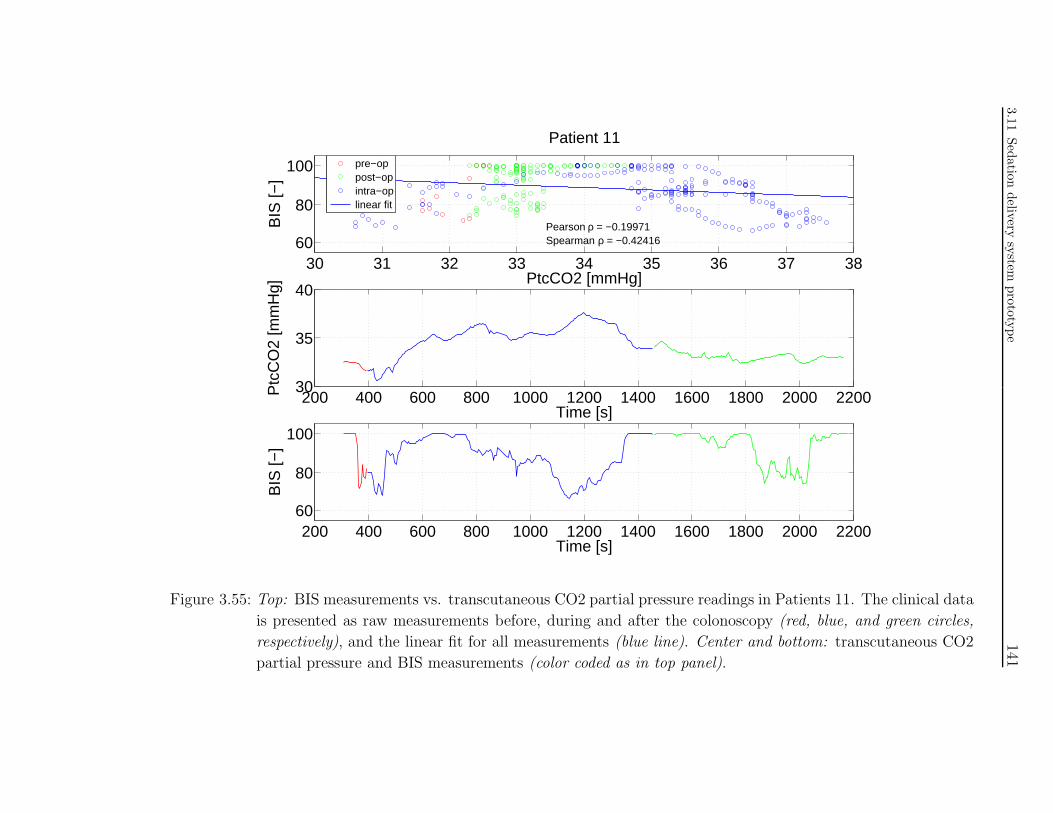
3.1
1Sed
atio
ndeliv
erysy
stempro
toty
pe
141
30 31 32 33 34 35 36 37 3860
80
100
PtcCO2 [mmHg]B
IS [−
]
Patient 11
Pearson ρ = −0.19971Spearman ρ = −0.42416
pre−op post−op intra−op linear fit
200 400 600 800 1000 1200 1400 1600 1800 2000 220030
35
40P
tcC
O2
[mm
Hg]
Time [s]
200 400 600 800 1000 1200 1400 1600 1800 2000 220060
80
100
BIS
[−]
Time [s]
Figure 3.55: Top: BIS measurements vs. transcutaneous CO2 partial pressure readings in Patients 11. The clinical data
is presented as raw measurements before, during and after the colonoscopy (red, blue, and green circles,
respectively), and the linear fit for all measurements (blue line). Center and bottom: transcutaneous CO2
partial pressure and BIS measurements (color coded as in top panel).

1423
Feed
back
contro
lofsed
atio
n
30 35 40 45 50 5540
60
80
100
BIS
[−]
Pearson ρ = −0.65213Spearman ρ = −0.6531
Patients 6−11
PtcCO2 [mmHg]
0.9 1 1.1 1.2 1.3 1.4 1.540
60
80
100
BIS
[−]
PtcCO2 [norm]
Pearson ρ = −0.34237Spearman ρ = −0.33589
Figure 3.56: BIS measurements vs. CO2 partial pressure readings for patients 1-11 taken during the procedure. Top:
Raw measurements (blue circles) and linear fit (red line). Bottom: CO2 partial pressure measurements
are normalized to individual baseline.

3.11 Sedation delivery system prototype 143
0 1 2 3 4 525
30
35
40
45
50
55
OASS [−]
PC
O2
[mm
Hg]
Patients 1−11
measurements linear fit
0 1 2 3 4 525
30
35
40
45
50
55
PC
O2
[mm
Hg]
Patients 1−11
OASS [−]
Figure 3.57: CO2 partial pressure measurements vs. OASS scores for patients 1-11
taken during the procedure. Top: Raw measurements (blue circles)
and linear fit (red line). Bottom: Measurements are depicted with
boxplots. The same linear fit is superimposed.

144 3 Feedback control of sedation
0 1 2 3 4 50.8
0.9
1
1.1
1.2
1.3
1.4
1.5
1.6
PC
O2
[−]
OASS [−]
Patients 1−11
measurements linear fit
0 1 2 3 4 50.9
1
1.1
1.2
1.3
1.4
1.5
1.6
PC
O2
[−]
Patients 1−11
OASS [−]
Figure 3.58: CO2 partial pressure measurements normalized to individual baseline
vs. OASS scores for patients 1-11 taken during the procedure. Top:
Normalized measurements (blue circles) and linear fit (red line). Bot-
tom: Measurements are depicted with boxplots. The same linear fit is
superimposed.

3.12 Preliminary clinical study results 145
3.11.4 Graphical user interfaces
With the configuration GUI shown in Figure 3.42, the sedation system user is able
to enter the initial platform configuration data. Patient information is used to
calculate the individual pharmacokinetic model with the possible choice between
the Schnider [169] or Marsh [132] model. In the event of new connection after a
host PC or network crash the system enables the recovery of data stored until the
crash.
The main system GUI, illustrated in Figure 3.43, serves as an operational inter-
face to the real time application running on the xPC TargetBox. Its design and
layout are tailored to the requirements of the clinical study and fulfil the clinical
recommendations of our research partners at the University Hospital Bern.
3.12 Preliminary clinical study results
3.12.1 Experimental findings
In this section the preliminary outcomes of the clinical study investigating respira-
tory depression during propofol sedation are presented. These findings are discussed
in Section 3.12.2.
To date, 11 colonoscopy patients have been enrolled in the study. Patient recruit-
ment at the University Hospital Bern is currently ongoing with the aim to complete
the target study population of 50 subjects as planned in the experimental protocol
(see Section 3.10).
The first 4 patients enrolled in the study were treated according to an exploratory
protocol that differs from the one described in this thesis. Moreover no BIS mea-
surements were recorded in these patients. For reasons of consistency, the time
courses of the intraoperative recordings for Patients 1-4 are not presented here.
Data regarding the relationship between respiratory depression and depth of seda-
tion in these and the other patients enrolled so far are presented in Figure 3.57 and
3.58.
Intraoperative recordings in Patient 5 are not shown here because the measure-
ment set is incomplete. The sedation system shut off briefly after the initiation of
propofol delivery. This incident was a case of operator error. The PCO2 sensor
cables were not connected to the study platform that correctly detected the fault
and shut itself off for safety reasons.
Figures 3.44-3.55 display the intraoperative recordings in individual subjects for
Patient 6 to 11.
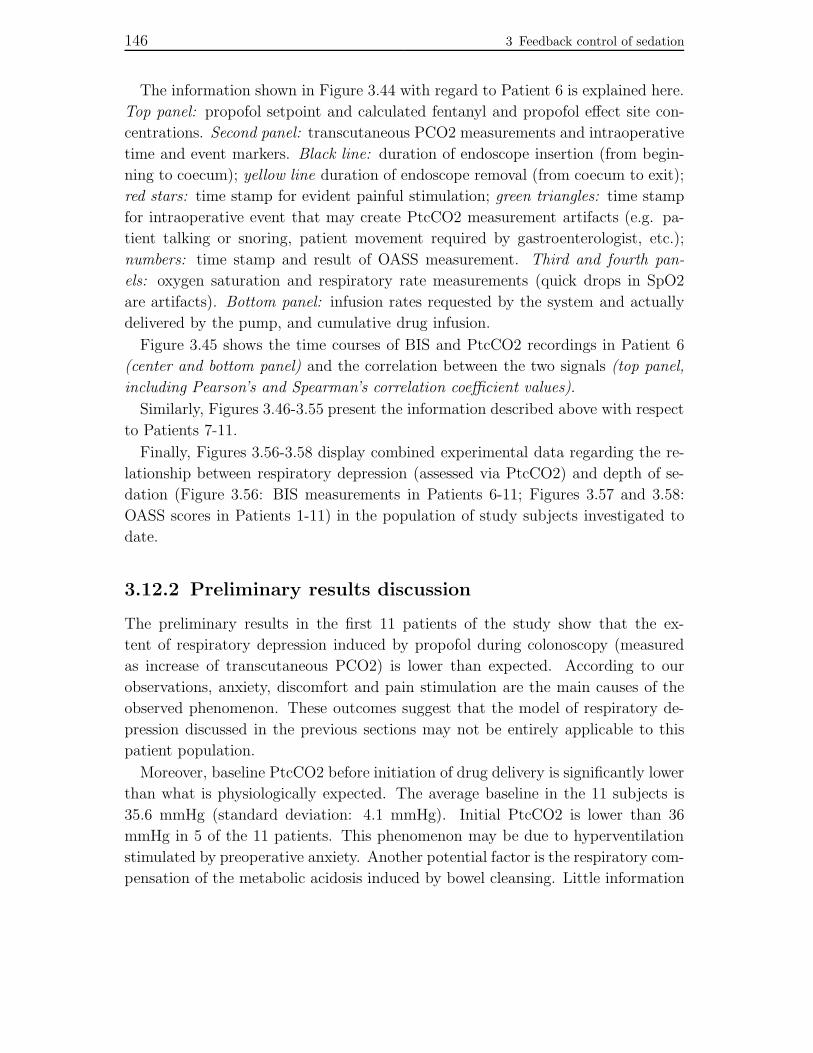
146 3 Feedback control of sedation
The information shown in Figure 3.44 with regard to Patient 6 is explained here.
Top panel: propofol setpoint and calculated fentanyl and propofol effect site con-
centrations. Second panel: transcutaneous PCO2 measurements and intraoperative
time and event markers. Black line: duration of endoscope insertion (from begin-
ning to coecum); yellow line duration of endoscope removal (from coecum to exit);
red stars: time stamp for evident painful stimulation; green triangles: time stamp
for intraoperative event that may create PtcCO2 measurement artifacts (e.g. pa-
tient talking or snoring, patient movement required by gastroenterologist, etc.);
numbers: time stamp and result of OASS measurement. Third and fourth pan-
els: oxygen saturation and respiratory rate measurements (quick drops in SpO2
are artifacts). Bottom panel: infusion rates requested by the system and actually
delivered by the pump, and cumulative drug infusion.
Figure 3.45 shows the time courses of BIS and PtcCO2 recordings in Patient 6
(center and bottom panel) and the correlation between the two signals (top panel,
including Pearson’s and Spearman’s correlation coefficient values).
Similarly, Figures 3.46-3.55 present the information described above with respect
to Patients 7-11.
Finally, Figures 3.56-3.58 display combined experimental data regarding the re-
lationship between respiratory depression (assessed via PtcCO2) and depth of se-
dation (Figure 3.56: BIS measurements in Patients 6-11; Figures 3.57 and 3.58:
OASS scores in Patients 1-11) in the population of study subjects investigated to
date.
3.12.2 Preliminary results discussion
The preliminary results in the first 11 patients of the study show that the ex-
tent of respiratory depression induced by propofol during colonoscopy (measured
as increase of transcutaneous PCO2) is lower than expected. According to our
observations, anxiety, discomfort and pain stimulation are the main causes of the
observed phenomenon. These outcomes suggest that the model of respiratory de-
pression discussed in the previous sections may not be entirely applicable to this
patient population.
Moreover, baseline PtcCO2 before initiation of drug delivery is significantly lower
than what is physiologically expected. The average baseline in the 11 subjects is
35.6 mmHg (standard deviation: 4.1 mmHg). Initial PtcCO2 is lower than 36
mmHg in 5 of the 11 patients. This phenomenon may be due to hyperventilation
stimulated by preoperative anxiety. Another potential factor is the respiratory com-
pensation of the metabolic acidosis induced by bowel cleansing. Little information

3.12 Preliminary clinical study results 147
on this topic is available in the literature because CO2 monitoring does not belong
to the standard clinical protocol for colonoscopy. However a study by Kim and
coworkers provides evidence supporting this hypothesis [109].
At the time of writing patient recruitment and investigation is ongoing. Regret-
tably, only preliminary outcomes are available for presentation in this thesis. In
light of these results, it can be inferred that mental stress and painful stimulation
may reduce the respiratory depressant effect of propofol. Moreover upon arrival in
the gastroenterology suite the patient is in a state of metabolic acidosis induced by
the bowel preparation that is required prior to the colonoscopy. This causes res-
piratory compensation through hyperventilation and likely determines an increase
in CO2 responsiveness (steeper CO2 response curve, see Figure 3.2) [64]. In con-
clusion, applicability of the proposed dosing paradigm for personalized sedation to
colonoscopy procedures is unclear at the time of writing.

148 3 Feedback control of sedation
4
Pharmacodynamic modeling
for antiplatelet therapy

150 4 Pharmacodynamic modeling for antiplatelet therapy
4.1 Introduction
4.1.1 Antiplatelet therapy
Platelet activation and aggregation play a pivotal role in cardiovascular disease.
Physiological procoagulant and anticoagulant mechanisms balance each other in a
refined and delicate equilibrium. Coagulation disorders trigger adverse events such
as acute coronary syndrome, stroke with ensuing ischemia, and thromboembolism.
Inhibition of platelet aggregation is therefore a primary therapeutic objective [58].
Antiplatelet therapy is intended to attenuate thrombocyte activation and ag-
gregation, prevent occlusive clot formation, arrest procoagulant activity, promote
thrombus disaggregation, and facilitate tissular perfusion. Optimal platelet inhibi-
tion is based on maximizing antithrombotic properties while minimizing bleeding
risk, and it is critically dependent on the assessment of individual patient risk [24].
4.1.2 Problem formulation
Abundant clinical and experimental evidence supports the notion that inhibiting
platelet reactivity is a viable and effective way to reduce thrombotic risks in pa-
tients with cardiovascular diseases [91] and prevent ischemic complications after
acute coronary syndromes and stenting [130]. Nonetheless, current anticoagulation
guidelines are based mostly on large-scale trials that have been conducted without
an evaluation of the antiplatelet response in individual patients [110,156]. The data
available from translational research studies strongly indicate that the present “one-
size-fits-all” antiplatelet strategy is flawed [91, 130]. At one end of the spectrum,
selected patients with excessively low platelet reactivity may bleed. Patients with
high platelet reactivity may on the other hand be subject to ischemic events. Deter-
mining a therapeutic target of optimal platelet reactivity associated with reduced
thrombotic risk and bleeding events remains an elusive goal [91]. In the future, it is
foreseeable that optimal antiplatelet therapy will involve an objective assessment of
the individual thrombotic potential based on the measurement of platelet function.
Subsequent treatment of each patient will be directed by laboratory measurements
to ensure an appropriate therapeutic response.
Drug combinations are frequently used in medical therapies because of the ex-
pected enhancement of the positive effect(s). Indeed, since different anticoagu-
lants inhibit platelet aggregation through different pathways, dual (or multiple)
antiplatelet therapy provides complementary and additive benefits compared with
single agents. However, side effects may also be potentiated through synergistic
pharmacodynamic interactions, possibly resulting in the reduced or limited clinical

4.1 Introduction 151
usefulness of the multiple drug regimen. A pharmacodynamic interaction model re-
cently proposed by two Institute alumni combines desired pharmacological effects
and undesired effects into one comprehensive framework for analysis of drug useful-
ness [208]. In the following said model is employed to investigate the global effect of
anticoagulation therapeutic regimens in relation to the observed magnitude of the
intended effect (inhibition of platelet aggregation) and the undesired effect (risk of
bleeding).
4.1.3 Aim of the work
This work aims at addressing several aspects of anticoagulant pharmacodynam-
ics for both single and multiple drug therapies. First, quantitation of iloprost
and MeSAMP anticoagulant potency has not yet been undertaken to the best of
our knowledge. Therefore we intend to investigate the dose-response relationship
of those antiplatelet drugs through laboratory measurements of platelet reactiv-
ity in a population of human volunteers. Second, we aim to determine the type
and extent of their pharmacodynamic interactions (additivity, synergism, or infra-
additivity/antagonism). We shall take both positive (therapeutic) pharmacologic
effects and negative (undesired) effects into account and combine them into a global
framework evaluating drug usefulness and drug regimen desirability. Thus we will
experimentally validate the theoretical global outcome model proposed in [208]
through its application to a relevant clinical question. Finally, we want to achieve
recommendations for personalized antiplatelet therapy based on the objective as-
sessment of the individual thrombotic potential through measurements of platelet
function.
4.1.4 Chapter content
This chapter is structured as follows. In Section 4.2 the global outcome model
mentioned in the above is presented with the prospective application to antiplatelet
therapy data. The protocol of the clinical study aimed at investigating iloprost and
MeSAMP anticoagulant effects in volunteers is described in Section 4.3. In Section
4.4 the parameter estimation methodology is discussed with respect to the specific
type of data at hand. Finally, the experimental measurements and modeling results
are presented and discussed in Sections 4.5-4.6.

152 4 Pharmacodynamic modeling for antiplatelet therapy
4.2 Pharmacodynamic interaction and global
outcome model
As discussed in the above, drug combinations are administered in a wide range of
medical therapies in order to take advantage of the expected enhancement of the
desired effect(s). Pharmacodynamic interactions may however also occur for the
undesired effects. It is therefore desirable to design an integrated measure of drug
benefits and related risks, characterized over the entire dose or concentration range.
To address this question Zanderigo and Sartori, two former students at IfA, and
their collaborators proposed the “well being” parameter as a way to summarize
the pharmacological desired and undesired effects into a single index [208]. This
methodology can be applied to single drug therapies as well as to multiple drug
regimens. With the objective to achieve a general modeling framework of drug
interaction, effect, and utility, the mathematical description of pharmacodynamic
interactions proposed by Minto and coworkers [140] was extended in [208] to con-
sider the occurrence of the drugs’ negative effects. The Authors were then able to
define and quantify the global outcome of therapies relying on drug combinations
based on the administered drug amounts.
In the case of the simultaneous administration of two drugs, the global outcome
index can be graphically represented with a 3D surface, where the x and y axes de-
scribe the biophase concentrations of the two drugs and the z-axis the corresponding
value of global outcome.
An accurate mathematical description of the model can be found in the litera-
ture [208]. In the following, a summary of the model will be presented as a basis
for later discussion of antiplatelet therapy results. Without loss of generality, we
shall concentrate on the two-drug case because the antiplatelet therapy study plan
mandates investigation of iloprost-MeSAMP combinations.
Minto and coworkers proposed that when two drugs A and B are administered
simultaneously in a defined, fixed ratio θ, they can be thought as behaving as a new
pseudo-drug having its own specific concentration-effect relationship. In analogy to
the one drug case, we can then make the assumption that the pharmacodynamics of
each drug combination (characterized by a definite θ value) can be described with
a sigmoid function relating the drug effect to the drug combination concentration.
The latter is determined by adding quantities of the drugs A and B in the fixed θ
ratio characterizing the drug combination in question. In the following will shall
label drug quantities as U (e.g. UA and UB). In order to account for the difference
in potency between the two drugs, said quantities need to represent drug amounts
in terms of units of potency. After normalization of potency, quantities of different

4.2 Pharmacodynamic interaction and global outcome model 153
drugs can be compared and related directly to the pharmacological effect.
The mathematical equations describing what discussed so far are:
UA = CA
C50A
, UB = CB
C50B
(4.1)
and
θ = UB
UA +UB
, θ ∈ [0,1] (4.2)
Only drug A is present if θ = 0. Conversely, only drug B is present when θ = 1.
The model is therefore fully reversible to the single drug case.
The dose-response relationship for drug combinations is modeled as:
E(θ) = Emax(θ) ⋅ (UA+UB
U50(θ) )γ(θ)1 + (UA+UB
U50(θ) )γ(θ)(4.3)
U50(θ) represents the potency of the drug combination of ratio θ. Per definition,
U50(θ = 0) = U50A = 1 and U50(θ = 1) = U50B = 1. γ(θ) is the steepness of the sig-
moidal function. Emax(θ) is the maximal effect that the combination with ratio
θ can achieve. In case of partial agonism, Emax is going to be smaller than the
maximum possible effect. If UA or UB are zero, Equation 4.3 collapses to the classic
Emax model description of single drug pharmacodynamics.
The parameters Emax, U50, and γ can be expressed as functions of the drug
ratio θ by a generic polynomial of the form:
f(θ) = k
∑i=0βiθ
i, for θ ∈ [0,1] and f = U50, γ or Emax (4.4)
In this equation, k is the order of the polynomial. Considering the high interpatient
variability and the cost of every experimental data point, it may be not realistic to
estimate a large number of parameters. Moreover, it becomes difficult to clinically
interpret the coefficients when more than the second power is present. Therefore, for
simplicity, we consider the model restricted to the second order coefficients (k = 2),
as already implemented in the simulations by Minto and Zanderigo [140, 208]:
f(θ) = β0 + β1θ + β2θ2 (4.5)
Considering that
f(θ = 0) = β0 = fA (4.6)
f(θ = 1) = β0 + β1 + β2 = fB ⇒ β1 = fB − fA − β2, (4.7)

154 4 Pharmacodynamic modeling for antiplatelet therapy
Equation 4.5 becomes:
f(θ) = fA + (fB − fA − βf) ⋅ θ + βf ⋅ θ2 (4.8)
where we have relabeled β2 as βf . Under the assumptions discussed in the above
and provided that single drug pharmacodynamic parameters are known, each com-
bination parameter f = U50, γ or Emax can therefore be expressed as a function
of θ following the estimation one single interaction parameter, βf .
In the case of U50, given that U50(θ = 0) = U50A = U50(θ = 1) = U50B = 1, Equa-
tion 4.8 further simplifies to
U50(θ) = 1 − βf ⋅ θ + βf ⋅ θ2 (4.9)
Extending the model presented so far to consider the occurrence of undesired
effects, in the case of administration of a two drug regimen the resulting negative
effect EN can be described as:
EN(θN) = EmaxN(θN) ⋅ (UA,N+UB,N
U50N (θN ))γN (θN )
1 + (UA,N+UB,N
U50N (θN ))γN (θN )
(4.10)
where all the variables and parameters have the same meaning as described for the
positive effect. Analogously to Equation 4.8 and 4.9, EmaxN , γN and U50N are
represented as a function of the undesired effect pharmacodynamic parameters for
the single drugs composing the regimen (EmaxA,N , γA,N , U50A,N , EmaxB,N , γB,N ,
U50B,N), of their ratio θN , and of the interaction parameters for the negative effect
(βEmax,N , βγ,N , βU50,N).
According to the interaction model by Zanderigo and coworkers [208], the global
outcome W is calculated as the algebraic sum of the positive and the negative
effects as:
W = E(θ) − ω ⋅EN(θN) (4.11)
where ω represents the relative weight of the two effects. In the following we shall
consider ω = 1 for the sake of simplicity and the lack of specific clinical requirements.
Note that the presented model is a pharmacodynamic interaction model and no
assumptions on possible pharmacokinetic interactions are made.
4.3 Clinical investigation: anticoagulant pharmacodynamic interaction modeling 155
4.3 Clinical investigation: anticoagulant
pharmacodynamic interaction modeling
4.3.1 Study investigators
Investigators:
M. Eng. Antonello Caruso, Automatic Control Lab, ETH Zurich, Switzerland
Prof. Manfred Morari, Automatic Control Lab, ETH Zurich, Switzerland
Dr. med. Gorazd Sveticic, Department of Anesthesiology and Intensive Care
Medicine, Medical University of Vienna, Austria
Dr. med. Gisela Scharbert, Department of Anesthesiology and Intensive Care
Medicine, Medical University of Vienna, Austria
Prof. Sybille Kozek-Langenecker, Department of Anesthesiology and Inten-
sive Care Medicine, Medical University of Vienna, Austria
Prof. Michele Curatolo, Department of Anesthesiology and Pain Therapy,
University Hospital Bern, Switzerland
4.3.2 Study methodology
Study design
Observational, single center study, setting: Medical University of Vienna
Study population
After obtaining the written informed consent, blood from 15 healthy adult volun-
teers is investigated in vitro. Exclusion criteria include: known hematological or
other systemic disease, intake of any systemic medication within the previous 14
days or illicit drug or alcohol abuse.
Study plan
The study is conducted in the hemostasis laboratory to perform platelet function
tests immediately after sampling. On arrival in the laboratory, subjects are asked to
rest for 10 minutes before drawing blood samples. Blood for platelet aggregometry

156 4 Pharmacodynamic modeling for antiplatelet therapy
is withdrawn into 13 3.0 ml DTI-tubes (direct thrombin inhibitor blood collec-
tion tube: hirudin 25 µg/ml; Dynabyte, Munich, Germany) from an antecubital
vein by venipuncture without stasis using a 21-gauge butterfly needle. The first 3
ml are discarded. Platelet aggregometry is then performed using the impedance
aggregometer Multiplate (Dynabyte, Munich, Germany).
Study drugs
The drugs selected to perform the study are iloprost and MeSAMP.
Adenosine diphosphate (ADP), released by activated platelets, is a potent platelet
aggregator that activates platelets by interacting with the P2Y1 and P2Y12 re-
ceptors. Iloprost, a chemically stable compound with prostacyclin PGI2 mimetic
activity, inhibits platelet aggregation by stimulating adenylyl cyclase. The P2Y12
receptor is in fact negatively coupled to adenylyl cyclase. Its inhibition further
exerts antithrombotic effects through the potentiation of prostacyclin antiplatelet
activity [41].
Methyl-S-adenosine monophosphate (MeSAMP) is a direct-acting, reversible and
short-acting inhibitor of the platelet P2Y12 receptor, preventing ADP-induced
platelet activation and subsequent aggregation [4,145,197]. Despite its widespread
use for laboratory experiments on platelet reactivity, to the best of our knowledge
MeSAMP is not commercially available for clinical use.
A more obvious selection of anticoagulant drugs would have included clopidogrel
and/or aspirin, being the two most common compounds used in antiplatelet ther-
apy. However clopidogrel is a prodrug, i.e. it necessitates conversion in vivo by
the hepatic CYP system to the active metabolite, which irreversibly binds to the
platelet P2Y12 receptor and inhibits platelet function for the life of the affected
platelet [74]. Clopidogrel could not therefore be used in an in vitro study. As-
pirin, on the other hand, has been shown not to affect the coagulative response to
TRAP [105]. We confirmed this behavior with preliminary tests at our hemostasis
laboratory.
Effects
In this work we shall consider drug effects on ADP-induced platelet reactivity as
the positive (therapeutic) effect, and effects on TRAP-induced platelet reactivity
as the negative (undesired) effect. The rationale for the choice of the positive effect
is that clinical data support the view that inhibiting platelet reactivity to ADP
determines a reduction in the incidence of ischemic events [91]. The choice of the
negative effect is explained in the next paragraph.

4.3 Clinical investigation: anticoagulant pharmacodynamic interaction modeling 157
Clinical and experimental evidence has indicated that ADP-mediated P2Y12 sig-
naling appears to play a prominent role in platelet activation. P2Y12 antagonists
(i.e. iloprost and MeSAMP) have a broad inhibitory profile and can inhibit platelet
aggregation in response to multiple agonists, such as thromboxane, collagen, and
thrombin [177]. On the other hand, bleeding is a significant complication of anti-
coagulant treatment. More intense anticoagulation has been reported to increase
the risk of major hemorrhage [188,120] and thrombin inhibition is associated with
spontaneous bleeding [125, 116]. We investigate drug concentrations that disrupt
the coagulative mechanisms mediated by thrombin, posing a threat of spontaneous
hemorrhage that is clinically undesirable. Hence, massive inhibition of TRAP-
induced aggregation is regarded as a negative pharmacologic effect.
Measurements
Whole blood aggregometry measures electrical impedance between electrodes im-
mersed in whole blood. Blood is stirred using an electromagnetic stirrer (800 rpm).
The attachment of platelet aggregates on the electrodes increases the impedance
between them. The impedance change is transformed to arbitrary aggregation units
by the system software and plotted against time. In contrast to optical aggregome-
try, the use of whole blood eliminates the need for centrifugation and tests platelet
function under more physiological conditions.
Impedance aggregometry was introduced by Cardinal and Flower in 1980 [32].
The Multiplate technique is an improvement of impedance aggregometry using a
computer-controlled 5-channel device and disposable test cells with a dual sensor
unit. With the use of disposable test cells there is no need to clean and ensure the
integrity of the electrodes after each test.
Platelet aggregation (drug naıve or in the presence of anticoagulants) is deter-
mined in response to ADP (12.8 µg M) and thrombin receptor activating peptide
(TRAP, 1 mM), using commercially available test reagents recommended for Mul-
tiplate analysis. Pipetting is performed using an electronic pipette connected to
the analyzer.
Safety
The risk of drawing blood from a healthy volunteer is negligible.

158 4 Pharmacodynamic modeling for antiplatelet therapy
4.4 Parameter estimation for antiplatelet therapy
data
Without loss of generality, in the analysis of antiplatelet data we shall consider
an inhibitory sigmoid Emax model because the drugs under investigation exert
an inhibitory effect on platelet aggregation. Equation 4.3 and 4.10 are therefore
modified as follows:
E(θ) = E0 −Emax(θ) ⋅ (UA+UB
U50(θ) )γ(θ)1 + (UA+UB
U50(θ) )γ(θ)(4.12)
EN(θN) = E0 −EmaxN(θN) ⋅ (UA,N+UB,N
U50N (θN ))γN (θN )
1 + (UA,N+UB,N
U50N (θN ))γN (θN )
(4.13)
where E0 is the value of platelet reactivity at baseline (i.e. without exposure to the
drugs).
As discussed in Section 4.2, in order to calculate the global outcome response
surface for the combination of two drugs it is necessary to estimate from the exper-
imental data the pharmacodynamic parameters for the single drugs (EmaxA, γA,
C50A, EmaxB , γB, C50B, and the corresponding ones for the negative effect) as
well as the 6 interaction parameters for both positive and negative effects (βEmax,
βEmax,N , βγ, βγ,N , βU50,N , βU50). The E0s, i.e. the extent of platelet drug-naıve
aggregation in response to different activating reagents, must also estimated from
the experimental data.
Assuming that the probability distribution for the observations is Gaussian (more
precisely: that the experimental errors are independent and normally distributed
with constant standard deviation), the least squares and maximum likelihood esti-
mators coincide. Therefore all the parameters mentioned in the above are estimated
via least squares fitting using the impedance aggregometry results collected in the
study population of volunteers.
To assess the quality of the estimates we use two graphical tools: the Tukey-
Anscombe (TA) plot and the normal quantile-quantile (QQ) plot. The TA plot is
a qualitative test for the homogeneity of residual variance. The residuals (i.e. the
model errors in predicting the observations) are plotted against the fitted values
and in the ideal case vary randomly around the horizontal axis. When the TA
plot shows a trend, there is evidence that the estimated model parameters are not
appropriate (assuming the model structure is). In this case a data transformation
(logarithm, square root, reciprocal) is attempted for improvement.

4.5 Experimental results and model estimation 159
To identify outliers and test for normality of the residuals, their empirical quan-
tiles are plotted against the theoretical quantiles of a N (0,1) distribution. The re-
sulting plot is the so-called QQ plot. If the observations are normally distributed,
the QQ plot is linear.
Goodness-of-fit plots are also used here to identify patterns in the performance
of the model to predict experimental measurements. Predicted results are plotted
against the corresponding platelet aggregation data and theoretically the model
should not consistently under- or over-estimate the experimental results.
During the analysis it was observed that MeSAMP is a partial TRAP aggregation
antagonist, i.e. MeSAMP cannot completely inhibit platelet aggregation in response
to TRAP when administered alone. Therefore the MeSAMP Emax for TRAP is
smaller than E0 for almost all subjects taking part in the study. However small
relative amounts of iloprost, a full agonist, are sufficient to make the combination
exhibit a complete inhibitory effect (i.e. for θ values approaching 1, EmaxN = E0).
Because Equation 4.8 does not seem appropriate to describe TRAP pharmacody-
namics (more precisely, to capture the behavior of EmaxN as a function of θN ),
βEmax,N is determined minimizing the sum of squared residuals for a power function
of θN constrained to cross only the EmaxN(θN = 1) data point. Let us label θN′
the drug ratio value at which this function crosses the EmaxN = 1 horizontal line.
Then we define EmaxN(θN) as follows:
for θN ≤ θ′N EmaxN(θN) = 1
for θN > θ′N EmaxN(θN) = 1 − (θN − θ′N)βEmax,N (4.14)
4.5 Experimental results and model estimation
Complete estimation results for two of the fifteen subjects taking part in the study
are presented in this section. Subject A and Subject C were selected for presentation
here amongst study participants on the basis of experimental data availability. They
are in fact the subjects in which most drug combination ratios were investigated.
More precisely, seven ratios were studied in Subject A and nine ratios in Subject
C. Because Subject A and C are two of the clinical investigators involved in the
study, they were available for repeated blood withdrawals. Assessment of primary
hemostasis capacity through platelet aggregometry should be performed within the
first 2 hours after harvesting [107]. Large sets of data can therefore only be collected
with repeated sampling of blood. Depending on individual availability, a minimum
of five ratios was investigated in each subject, with the exception of two subjects
for which only three ratios were studied.

1604
Pharm
aco
dynam
icm
odelin
gfo
rantip
latelet
thera
py
0 0.2 0.80.4 0.6 10.4
0.6
0.8
1
1.2
θ [−]
U50
[−]
Subject A
0 0.40.2 0.6 0.8 10
1
2
3
4
θ [−]
γ [−
]
0 0.2 0.4 10.6 0.80.2
0.4
0.6
0.8
1
1.2
θ [−]
Em
ax [−
]
ADP TRAP f(θ)
ADP for f = U50, γ or Emax
f(θ)TRAP
for f = U50, γ or Emax
Figure 4.1: Experimental measurements (stars) and model fit (dashed lines) for parameters U50(θ), γ(θ), Emax(θ).The graphs show platelet aggregation data for Subject A in response to ADP (in red) and TRAP (in blue).
θ = 0 for pure iloprost, θ = 1 for pure MeSAMP. Emax is normalized to estimated E0.

4.5 Experimental results and model estimation 161
0 0.2 0.4 0.6 0.8 1 1.20
0.2
0.4
0.6
0.8
1
1.2
Measured aggregation [AU⋅min]
Pre
dict
ed a
ggre
gatio
n [A
U⋅m
in]
ADP goodness−of−fit
0 0.2 0.4 0.6 0.8 1 1.20
0.2
0.4
0.6
0.8
1
1.2
Measured aggregation [AU⋅min]
Pre
dict
ed a
ggre
gatio
n [A
U⋅m
in]
Figure 4.2: Top: experimental measurements (symbols) and response surface model
of platelet aggregation in response to ADP in Subject A. White lines:
iso-effect curves. Red line: 50% iso-effect curve. These lines are also
projected onto the z = 0 plane and depicted as a contour plot. Red and
blue sigmoidal curves: model fit for pure iloprost (θ = 0) and MeSAMP
(θ = 1), respectively. Black sigmoidal curves: model fit for different
θ (i.e. drug ratio) values. The investigated ratios are shown in Fig-
ure 4.1. Bottom: goodness-of-fit plot relative to the response surface
shown above. The right panel shows the same data as the left panel,
differentiating the dots according to the θ value.

162 4 Pharmacodynamic modeling for antiplatelet therapy
0 0.2 0.4 0.6 0.8 1 1.20
0.2
0.4
0.6
0.8
1
1.2
Measured aggregation [AU⋅min]
Pre
dict
ed a
ggre
gatio
n [A
U⋅m
in]
TRAP goodness−of−fit
0 0.2 0.4 0.6 0.8 1 1.20
0.2
0.4
0.6
0.8
1
1.2
Measured aggregation [AU⋅min]
Pre
dict
ed a
ggre
gatio
n [A
U⋅m
in]
Figure 4.3: Top: experimental measurements (symbols) and response surface model
of platelet aggregation in response to TRAP in Subject A. White lines:
iso-effect curves. Red line: 50% iso-effect curve. These lines are also
projected onto the z = 0 plane and depicted as a contour plot. Red and
blue sigmoidal curves: model fit for pure iloprost (θ = 0) and MeSAMP
(θ = 1), respectively. Black sigmoidal curves: model fit for different
θ (i.e. drug ratio) values. The investigated ratios are shown in Fig-
ure 4.1. Bottom: goodness-of-fit plot relative to the response surface
shown above. The right panel shows the same data as the left panel,
differentiating the dots according to the θ value.

4.5 Experimental results and model estimation 163
0 200 400 600 800 1000 12000
10
20
30
40
50
60
70
Iloprost [pg/ml]
Subject A: Global outcome response surface
MeS
AM
P [µ
g/m
l]
0
0.1
0.2
0.3
0.4
0.5
0.6
0.7
0.8
Figure 4.4: Top: global outcome response surface for Subject A, obtained from
the ADP- and TRAP-induced platelet aggregation response surfaces
(Figure 4.2 and 4.3). Bottom: concentration map of the global outcome
surface shown above. Potentially optimal drug regimens that maximize
the global outcome are located in the region adjacent to the combination
Ciloprost = 278 pg/ml, CMeSAMP = 6.6 µg/ml (corresponding to W =80%). Similar global outcomes can be obtained with single drugs (in the
region centered at Ciloprost = 535 pg/ml with W = 80%, or at CMeSAMP =45.2 µg/ml with W = 83%).

1644
Pharm
aco
dynam
icm
odelin
gfo
rantip
latelet
thera
py
0 0.2 0.80.4 0.6 10
1
2
3
θ [−]
U50
[−]
Subject C
0 0.2 0.4 10.6 0.80.4
0.6
0.8
1
1.2
θ [−]
Em
ax [−
]
0 0.40.2 0.6 0.8 10
2
4
6
8
θ [−]
γ [−
]
ADP TRAP f(θ)
ADP for f = U50, γ or Emax
f(θ)TRAP
for f = U50, γ or Emax
Figure 4.5: Experimental measurements (stars) and model fit (dashed lines) for parameters U50(θ), γ(θ), Emax(θ).The graphs show platelet aggregation data for Subject C in response to ADP (in red) and TRAP (in blue).
θ = 0 for pure iloprost, θ = 1 for pure MeSAMP. Emax is normalized to estimated E0.

4.5 Experimental results and model estimation 165
0 0.2 0.4 0.6 0.8 1 1.20
0.2
0.4
0.6
0.8
1
1.2
Measured aggregation [AU⋅min]
Pre
dict
ed a
ggre
gatio
n [A
U⋅m
in]
0 0.2 0.4 0.6 0.8 1 1.20
0.2
0.4
0.6
0.8
1
1.2
Measured aggregation [AU⋅min]
Pre
dict
ed a
ggre
gatio
n [A
U⋅m
in]
ADP goodness−of−fit
Figure 4.6: Top: experimental measurements (symbols) and response surface model
of platelet aggregation in response to ADP in Subject C. White lines:
iso-effect curves. Red line: 50% iso-effect curve. These lines are also
projected onto the z = 0 plane and depicted as a contour plot. Red and
blue sigmoidal curves: model fit for pure iloprost (θ = 0) and MeSAMP
(θ = 1), respectively. Black sigmoidal curves: model fit for different
θ (i.e. drug ratio) values. The investigated ratios are shown in Fig-
ure 4.5. Bottom: goodness-of-fit plot relative to the response surface
shown above. The right panel shows the same data as the left panel,
differentiating the dots according to the θ value.

166 4 Pharmacodynamic modeling for antiplatelet therapy
0 0.2 0.4 0.6 0.8 1 1.20
0.2
0.4
0.6
0.8
1
1.2
Measured aggregation [AU⋅min]
Pre
dict
ed a
ggre
gatio
n [A
U⋅m
in]
0 0.2 0.4 0.6 0.8 1 1.20
0.2
0.4
0.6
0.8
1
1.2
Measured aggregation [AU⋅min]
Pre
dict
ed a
ggre
gatio
n [A
U⋅m
in]
TRAP goodness−of−fit
Figure 4.7: Top: experimental measurements (symbols) and response surface model
of platelet aggregation in response to TRAP in Subject C. White lines:
iso-effect curves. Red line: 50% iso-effect curve. These lines are also
projected onto the z = 0 plane and depicted as a contour plot. Red and
blue sigmoidal curves: model fit for pure iloprost (θ = 0) and MeSAMP
(θ = 1), respectively. Black sigmoidal curves: model fit for different
θ (i.e. drug ratio) values. The investigated ratios are shown in Fig-
ure 4.5. Bottom: goodness-of-fit plot relative to the response surface
shown above. The right panel shows the same data as the left panel,
differentiating the dots according to the θ value.

4.5 Experimental results and model estimation 167
0 100 200 300 400 500 600 700 8000
5
10
15
20
25
30
35
40
45
50
Subject C: Global outcome response surface
Iloprost [pg/ml]
MeS
AM
P [µ
g/m
l]
0
0.1
0.2
0.3
0.4
0.5
0.6
0.7
0.8
Figure 4.8: Top: global outcome response surface for Subject C, obtained from the
ADP- and TRAP-induced platelet aggregation response surfaces (Fig-
ure 4.6 and 4.7). Bottom: concentration map of the global outcome sur-
face show above. Potentially optimal drug combinations that maximize
the global outcome are located in the region centered at Ciloprost = 331
pg/ml, CMeSAMP = 15.0 µg/ml (corresponding to W = 81%).

168 4 Pharmacodynamic modeling for antiplatelet therapy
0 1 2 3 4 5 60
20
40
60
80
100
120
Fitted equation : E = E0 −Emax ·
(UA+UB)γ
(UA+UB)γ+U50γ
Sum of error = 3541.3430,Emax = 78.9956,U50 = 0.6385, γ = 1.0931,E0 = 78.9956
UA + U
BA
DP
rea
ctiv
ity
10 20 30 40 50 60 70 800 90−40
−20
0
20
40
Predicted reactivity
Res
idua
ls
TA plot
−2.5 −2 −1.5 −1 −0.5 0 0.5 1 1.5 2 2.5−40
−20
0
20
40
Standard normal quantiles
Qua
ntile
s of
in
put s
ampl
e
QQ plot
0 1 2 3 4 5 60
1
2
3
4
5
Fitted equation : E = E0 −Emax ·
(UA+UB)γ
(UA+UB)γ+U50γ
Sum of error = 1.6743,Emax = 76.4788,U50 = 0.6609, γ = 1.1598,E0 = 76.4788
UA + U
B
AD
P r
eact
ivity
1 1.5 2 2.5 3 3.5 4 4.5 5
−0.6
0
−0.3
0.3
0.6
Predicted reactivity
Res
idua
ls
TA plot
−2.5 −2 −1.5 −1 −0.5 0 0.5 1 1.5 2 2.5−1
−0.5
0
0.5
1
Standard normal quantiles
Qua
ntile
s of
inpu
t sam
ple
QQ plot
Figure 4.9: Top panels: the untransformed data clearly exhibit a funnelling trend in
the TA plot. Bottom panels: after a log-transformation, the trend dis-
appears. Normality of the residuals may arguably also have improved,
as shown in the QQ plot. Experimental data: Subject C, ADP-induced
coagulation data, θ = 0.8914.

4.5 Experimental results and model estimation 169
0 0.5 1 1.5 2 2.5 30
20
40
60
80
100
120
Fitted equation : E = E0 −Emax ·
(UA+UB)γ
(UA+UB)γ+U50γ
Sum of error = 490.0026,Emax = 99.9526,U50 = 0.7577, γ = 2.7463,E0 = 99.9526
UA + U
B
TR
AP
rea
ctiv
ity
0 10 20 30 40 50 60 70 80 90 100−20
−10
0
10
20
Predicted reactivity
Res
idua
ls
TA plot
−2 −1.5 −1 −0.5 0 0.5 1 1.5 2−20
−10
0
10
20
Standard normal quantiles
Qua
ntile
s of
inpu
t sam
ple
QQ plot
0 0.5 1 1.5 2 2.5 30
2
4
6
Fitted equation : E = E0 −Emax ·
(UA+UB)γ
(UA+UB)γ+U50γ
Sum of error = 0.3182,Emax = 89.8879,U50 = 0.9114, γ = 5.4750,E0 = 89.8879
UA + U
B
TR
AP
rea
ctiv
ity
−1 0 1 2 3 4 5 6−0.4
−0.2
0
0.2
0.4
Predicted reactivity
Res
idua
ls
TA plot
−2 −1.5 −1 −0.5 0 0.5 1 1.5 2−0.4
−0.2
0
0.2
0.4
Standard normal quantiles
Qua
ntile
s of
inpu
t sam
ple
QQ plot
Figure 4.10: Top panels: the untransformed data clearly exhibit a funnelling trend
in the TA plot. Bottom panels: after a log-transformation, the trend
disappears. Experimental data: Subject I, TRAP-induced coagulation
data, θ = 0.6977.

1704
Pharm
aco
dynam
icm
odelin
gfo
rantip
latelet
thera
py
Subject C50iloprost,ADP C50MeSAMP,ADP βADP C50iloprost,TRAP C50MeSAMP,TRAP βTRAP
[pg/ml] [µg/ml] [-] pg/ml [µg/ml] [-]
A 192 14.1 1.5 1321 77.3 2.3
B 275 8.0 2.2 841 3 50.9 -0.3
C 286 17.4 1.4 517 31.3 -4.8
D 393 14.9 -0.3 2557 142.6 0.1
E 99 3.9 -1.1 1464 121.7 1.7
F 237 10.0 -4.9 1098 68.9 0.1
G 181 4.2 -11.7 1127 95.1 1.6
H 59 2.7 -3.6 755 81.6 0.5
I 199 8.7 1.7 1028 44.5 1.0
J 409 6.6 1.8 985 53.1 1.8
K 133 6.5 0.5 1035 40.7 -0.6
L 189 23.4 0.2 1295 22.7 -6.1
M 161 2.7 -11.1 1150 119.7 2.5
N 117 7.2 -6.2 816 120.5 1.3
O 85 2.6 -1.1 845 3.9 -11.0
average 201 8.9 -2.0 1122 71.6 -0.7
st. dev. 104 6.1 4.5 465 41.4 3.6
Table 4.1: C50 estimation results in the 15 volunteers and in the population (averaged values), for both iloprost and
MeSAMP, ADP- and TRAP-induced effects.

4.6 Results discussion 171
Pharmacodynamic interaction parameter plots are displayed in Figure 4.1 and
4.5 for Subject A and C, respectively. Figures 4.2-4.3 and 4.6-4.7 show the modeled
concentration-effect surface of platelet reactivity in response to ADP and TRAP
and the relative goodness-of-fit plots for the two subjects. Figure 4.4 and 4.8 show
the overall 3D global outcome response surface as well as the projection of said
surface on the z = 0 plane, in order to highlight the regions of maximal global
outcome.
Figure 4.9 and 4.10 show two examples of the improvement of residual variance
and residual normality that can be achieved through data transformation. Guidance
for data transformation is obtained by inspecting the TA and the QQ plots relative
to the untransformed data.
C50 estimation results for each individual and in the population are summarized
in Table 4.1, as well as the estimated C50 interaction parameters for ADP and
TRAP effects. Other parameter estimation results are not reported here for the
sake of conciseness and because of limited clinical usefulness.
4.6 Results discussion
The aim of this study was to apply the novel pharmacodynamic interaction model
proposed in [208] to a clinically relevant problem, specifically to the description
of the inhibitory effects produced by anticoagulants on platelet reactivity. We
tested hemostasis in response to ADP and TRAP with impedance aggregometry
in the presence of iloprost and MeSAMP. Through the use of least squares esti-
mation methods and residual analysis tools, pharmacodynamic response surfaces
were achieved that exhibit a good fit to the experimental data taken in the study
population of volunteers.
As discussed in Section 4.4, MeSAMP is a partial agonist for the inhibition
of platelet activation in response to TRAP. Iloprost is a full TRAP aggregation
antagonist. We observed experimentally that small relative amounts of iloprost
in iloprost-MeSAMP combinations would achieve maximal inhibition of platelet
response to TRAP. In this study, we proposed to model the behavior of EmaxN
as a function of θN according to Equation 4.14. Nonetheless, further investigation
is required to determine with higher confidence the exact relationship between
the maximum anticoagulant effect and the ratio of the two anticoagulants in the
combination.
Parameter estimation results for the study population are listed in Table 4.1.
They are adequately consistent in terms of drug C50s for ADP and TRAP ef-

172 4 Pharmacodynamic modeling for antiplatelet therapy
fects. There are however outliers. Subject O, for instance, seems to be significantly
sensitive to the drugs, particularly to MeSAMP. Subject D, on the other hand,
appears to be rather insensitive, especially to iloprost. Whether these results are
accurate or rather influenced by experimental imprecision is unclear at the time
of writing. Because this is the first study addressing quantitation and modeling
of anticoagulant pharmacodynamics, there is no data available in the literature for
comparison of the estimates. Further investigation in at least these two subjects
may be necessary.
Another objective of this work was to determine the optimal combination of
iloprost and MeSAMP in the individual. Results for Subject A and C are dis-
played in Figure 4.4 and 4.8, respectively. Optimal dosing outcomes for all subjects
participating in the study are summarized in Table 4.2. Recommendations for
personalized dosing are listed in this table with the corresponding global outcome
index value, W .
Most subjects exhibit only a global maximum in the W surface (e.g. Subject
C, see Figure 4.4). The optimal combination is then simply defined as the con-
centration pair that maximizes W . Six subjects however exhibit one or two local
maxima besides the global maximum (e.g. Subject A, see Figure 4.4). This may
for instance occur when the therapeutic window of a single drug is very wide in
the specific individual. As the onset of the negative effect occurs at concentrations
that are considerably higher than those producing the positive effect, the outcome
parameter may reach values close to the global maximum.
From a clinical point of view, a small difference in W may not translate into a
visible improvement in patient well being. In the presence of local maxima, from a
clinical perspective it may be desirable to take into account other factors, beyond
the W value. For instance, it may be argued that the increment in W between
a local and a global maximum does not justify the higher dosage (if that’s the
case). A conservative criterion such as the following could then for instance be
defined. When the global and local maxima differ by less than 5% in W value, the
optimal combination is chosen amongst those pertaining to the (global and local)
maxima as the least potent one with respect to the negative effect. That is, as
the concentration pair that minimizesUiloprost,N+UMeSAMP,N
U50N (θN ). The results listed in
Table 4.2 are derived according to this criterion. Different criteria could similarly
be defined based on clinical requirements and recommendations.
The dose optimization results of Table 4.2 are in agreement with therapeutic
(i.e. effective) drug dosages suggested in the literature for single drugs [1,131]. No
information on dosing for the combination is available in the open literature at the
time of writing. As the experimental measurements this work is based on were

4.6 Results discussion 173
Subject Ciloprost CMeSAMP W
[pg/ml] [µg/ml] [%]
A 278 6.6 80
B 206 2.8 78
C 331 15.0 81
D 269 29.4 87
E 81 13.4 88
F 483 0.0 78
G 265 0.0 84
H 83 26.9 85
I 401 2.0 90
J 0 21.5 77
K 295 7.3 87
L 641 0.5 85
M 34 20.7 81
N 57 28.3 73
O 617 1.3 83
Table 4.2: Recommendations for personalized antiplatelet therapy in the study pop-
ulation. Optimal drug combinations are listed in the table with the
corresponding global outcome value, W .
taken in vitro, the clinical applicability of this dose optimization methodology still
remains to be investigated.

174 4 Pharmacodynamic modeling for antiplatelet therapy

5
Main achievements and outlook

176 5 Main achievements and outlook
5.1 Feedback control of sedation
In this thesis we propose and discuss a novel anesthetic paradigm for the safe and
effective delivery of personalized sedation. The objective is to tailor drug admin-
istration to the needs of the specific patient while minimizing the risks associated
with anesthetic delivery. The dosing paradigm takes advantage of the similar phar-
macodynamics of drug induced ventilatory depression and sedation. We suggest to
purposely titrate drug dosing to a moderate extent of the undesired effect in order
to safely achieve an adequate level of the desired, therapeutic effect.
The rationale for the proposed methodology is that light sedation is difficult to
quantify, and drug overdosing leads to dangerous cardiorespiratory events. Markers
for the ventilatory state of the patient are readily available on the market and can
therefore be employed to increase the safety of anesthetic practice. Our preferred
indicator for ventilation is CO2 partial pressure, which can be obtained with a
noninvasive, continuous combined transcutaneous capnometry/pulse oximetry de-
vice such as the SenTec PtcCO2 monitor (SenTec AG, Therwil, Switzerland). As
discussed in Chapter 3, the PtcCO2 signal correlates well with the capnogram and
the sensing technology is not prone to respiratory and movement artifacts and does
not require access to the airways.
In order to protect the intellectual property related to the novel sedation paradigm,
in 2006 we filed an international patent application that was subsequently granted.
We envision the concept could be implemented into a commercial product provid-
ing computer assisted personalized sedation. In 2008 patent rights were licensed to
SenTec AG for product development and commercial use.
Chapter 3 of this thesis provides substantial contributions to support the sedation
protocol proposed in this thesis. Prior to the validation in the clinical environment,
we tested and refined the paradigm using a human physiology platform that we de-
veloped to that purpose. Respiratory metabolism and regulation, drug distribution
in the body, and dynamics of pharmacological effects were taken into consideration
and included in the human ventilatory model described in Section 3.5, 3.7, and 3.8.
The model underwent several refinements and simplifications in order to isolate
the respiratory mechanisms that have an impact on the problem at hand and to
reduce complexity. Achieving a comprehensive yet parsimonious model structure is
of uttermost significance. On the one hand, an incomplete model would not provide
meaningful or reliable predictions under specific conditions. On the other hand, an
overly complex model would not allow for estimation of individual parameters from
the little data that is available for a typical sedation patient.
The physiological model allowed us to investigate efficiently the use of several

5.1 Feedback control of sedation 177
different controller structures. The objective was to verify whether a feedback
controller targeting mild hypercapnia/hypoventilation (PtcCO2 between 45 and
60 mmHg) and anesthetic effect site concentrations corresponding to moderate to
deep sedation in the population would yield acceptable performance and safety.
Two of the control structures mentioned above are presented in this thesis. First,
a proportional-integral controller was tested on the respiratory platform to deliver
sedative concentrations of remifentanil (Section 3.6). Then we developed a model
based controller, specifically a model predictive control algorithm, to deliver propo-
fol sedation in a refined version of the respiratory platform (Section 3.9). Both
controllers successfully individualize drug delivery based on the feedback informa-
tion received from the physiological plant and achieve the target PtcCO2 and Ce
setpoints despite significant pharmacokinetic/dynamic variability.
The pharmacodynamic modeling and feedback control theoretical advances must
be matched with experimental work verifying our assumptions and validating our
concepts. To that purpose our collaboration with the Anesthesiology and Pain
Therapy Department at the University Hospital Bern is most valuable. Together
with our research partners in Bern, we designed, planned, and initiated two clinical
studies to provide evidence for the feasibility of the proposed paradigm.
A first study was designed with the objective to provide support for the correla-
tion between ventilation, and PCO2 as a ventilatory indicator, and the anesthetic
therapeutic endpoint. The clinical trial involves gastroenterology patients enrolled
at the University Hospital Bern, Switzerland. A prototype of the sedation deliv-
ery system was built in order to carry out the clinical experiments and administer
computer assisted anesthesia. Regrettably at the time of writing the study is incom-
plete and therefore final results cannot be discussed here. However as of November
2009, an initial batch of colonoscopy patients has already been investigated. These
preliminary experimental results are presented and discussed in Section 3.12.
In a second study, discussed in Appendix A, we investigate the effect of pain on
ventilatory regulation. Clinical experience and numerous studies reported in the
literature suggest that pain has an excitatory influence on ventilation and may an-
tagonize anesthetic induced respiratory depression. As we expect pain stimulation
to occur during the performance of the medical procedures sedation is used for,
we are testing the extent of pain antagonism of respiratory depression pharmaco-
dynamics. The results obtained through this study will be helpful to revise the
controller algorithm and improve its applicability and effectiveness in the clinical
environment.

178 5 Main achievements and outlook
5.2 Pharmacodynamic modeling for antiplatelet
therapy
In Chapter 4 we discussed a novel modeling platform to investigate drug interac-
tions and their optimal dosage. Originally proposed by two IfA alumni and cowork-
ers in [208], the model takes into account the pharmacodynamic interactions that
multidrug regimens may exhibit. It also combines positive and negative pharma-
cological effects into one comprehensive framework for analysis of drug usefulness.
This framework enables to assess efficiently global therapy outcomes and patient
well being by mapping drug concentrations to a single index describing therapy
quality.
In this thesis we sought to both validate experimentally the theoretical frame-
work and further fulfil the needs for personalized drug dosing in medical care. We
provided experimental support for the modeling platform through its application
to antiplatelet therapy, a clinical practice in which the demand for therapy indi-
vidualization is rapidly increasing. According to recent opinions reported in the
literature [91, 130], the “one-size-fits-all” antiplatelet strategy presently suggested
by practice guidelines has severe limitations. Patients with excessively low platelet
reactivity may bleed, whereas patients with high platelet reactivity may be subject
to ischemic events. Optimal antiplatelet therapy should involve an objective assess-
ment of the individual thrombotic potential based on the measurement of platelet
function. Individual treatment is critically dependent on the assessment of patient
risk and should be directed by laboratory measurements to ensure an appropriate
therapeutic response. In this thesis we focused on the anticoagulant properties
of two drugs, iloprost and MeSAMP, and described their pharmacological activity
through response surface modeling.
The work presented in Chapter 4 has multiple objectives. First, we intended to
investigate the concentration-effect relationship of the anticoagulants and provide a
quantitative description of their pharmacodynamics. Second, we studied iloprost-
MeSAMP pharmacodynamic interactions for both positive and negative effects.
Finally, we achieved suggestions of optimal drug dosing for antiplatelet therapy in
the individual.
The work provides experimental support for the applicability of the proposed
modeling framework in the clinical practice to evaluate drug usefulness and deliver
personalized therapy. It also yields clinically relevant information in terms of phar-
macodynamic parameters for the single drugs as well as drug interaction coefficients
for regimens employing iloprost-MeSAMP combinations.
Further research and experimental investigation is required to provide additional

5.2 Pharmacodynamic modeling for antiplatelet therapy 179
validation for the theoretical modeling framework discussed in the above. For in-
stance, in some clinical applications it may be desirable to take multiple positive
and/or negative pharmacological effects into account to achieve a global assess-
ment of therapy quality. The modeling platform could be expanded to fulfil this
requirement. Nevertheless, an important experimental limitation could arise in the
investigation of severe side effects in humans because of ethical reasons. Another
potential area of improvement is the lack of a pharmacokinetic model describing
drug distribution in the body. Combining drug kinetics and dynamics into the
framework would allow to associate drug dosing and therapy outcomes and directly
derive dosing recommendations for optimal therapy.
Regarding the results on antiplatelet therapy, our first successful experience with
iloprost and MeSAMP suggests in the future we should consider drugs of more
widespread use in the clinical practice. Moreover the study has been conducted in
vitro, therefore the clinical validity of the results still remains to be ascertained.

180 5 Main achievements and outlook

A
Clinical investigation:
antagonism of remifentanil
induced respiratory depression
by postoperative pain
182 A Antagonism of remifentanil induced respiratory depression by postoperative pain
A.1 Study investigators
Investigators:
M. Eng. Antonello Caruso, Automatic Control Lab, ETH Zurich, Switzerland
Prof. Manfred Morari, Automatic Control Lab, ETH Zurich, Switzerland
Priv.-Doz. Dr. med. Martin Luginbuhl, Department of Anesthesiology and
Pain Therapy, University Hospital Bern, Switzerland
Dr. med. Dagmar Kaiser, Department of Anesthesiology and Pain Therapy,
University Hospital Bern, Switzerland
Dr. sc. tech. Peter Schumacher, Department of Anesthesiology and Pain
Therapy, University Hospital Bern, Switzerland
Dr. med. Lorenz Theiler, Department of Anesthesiology and Pain Therapy,
University Hospital Bern, Switzerland
A.2 Introduction
Opioids are frequently used for postoperative pain control and conscious seda-
tion. Respiratory depression is the most serious and potentially fatal side ef-
fect in intravenous patient controlled analgesia (IV PCA) with a frequency of
110% [172, 162, 40]. There remains a low but unpredictable risk of severe respi-
ratory depression even in young healthy patients because current monitoring tech-
niques and clinical practices are insufficiently reliable to detect opioids induced
respiratory depression (e.g. pulse oximetry in the presence of supplemental oxygen
administration [204]. In a recent closed claims study hypoxia due to respiratory
depression was the most frequent cause in cases with fatal outcome or permanent
brain damage in monitored anesthesia care [19]. Despite its favourable pharmacoki-
netic properties, respiratory depression during conscious sedation with remifentanil
was reported by several authors [103, 122, 171]. Bouillon and co-workers reported
a model for remifentanil induced respiratory depression in the non-steady state,
which can be used for dose finding [25]. In this model the effect of painful stim-
ulation is not included, however. The indirect response model accounts for the
respiratory stimulant effects of CO2, which invariably follows a drug-induced re-
duction of ventilation. The plasma remifentanil concentration inducing a reduction
of 50% in minute ventilation at constant PaCO2 is 0.92 ± 0.2 ng/mL according to

A.3 Study aims 183
this model. This concentration reduces alveolar ventilation to a reasonable 88% of
baseline in steady state, and compares well to the 50% minute ventilation reduction
found under iso-hypercapnic conditions in a previous study [150]. The non-steady
state indirect response model by Bouillon et al. describes drug effect and ventilation
changes at the same time and therefore better represents the clinical reality [25].
Experimental pain stimulation without analgesic drug administration was associ-
ated with increasing ventilation and decreasing end-tidal carbon dioxide concentra-
tion [166, 65]. Chronic intractable pain induced chronic hyperventilation [86] and
in patient under treatment with IV Morphine the sudden reduction of pain by a
peripheral nerve block is associated with an increased number of oxygen desatura-
tions [46]. Pain induced by diagnostic or therapeutic interventions such as percuta-
neous transhepatic cholangioplasty, shock wave lithotripsy in urology or postoper-
ative wound pain may therefore affect opioid induced respiratory depression. The
impact of pain on opioids respiratory depression has been poorly investigated so far.
Quantifying the impact of pain on opioid induced respiratory depression may help
to improve dosing guidelines and patient safety during postoperative pain treatment
and conscious sedation. The opioids most frequently used in anesthesia (fentanyl,
alfentanil, remifentanil and sufentanil) are pure receptor agonists. It can be as-
sumed that the analgesic effect is mediated by the same receptor as the respiratory
depressant effect. For alfentanil the C50 of respiratory depression in the absence of
painful stimulation (73 ng/ml) [30] is similar as the plasma alfentanil concentration
needed for postoperative analgesia (100 ng/ml) [104]. This suggests the analgesic
and respiratory depressant effect of opioids may be parallel. Recently a novel device
to measure transcutaneous CO2 has been validated (SenTec AG, Therwil, Switzer-
land) and a computer to measure alveolar ventilation (NICO monitor, Respironix
Inc. Pittsburg, PA, USA) is available. The respiratory effects of remifentanil and
painful stimulation will thus be directly measurable. The purpose of this open la-
bel observational cross-over study is to develop a model for remifentanil-induced
respiratory depression including a parameter for the presence or absence of painful
stimulation and to assess the analgesic effect of remifentanil titrated to moderate
respiratory depression (i.e. a transcutaneous PCO2 of 50 mmHg) on postoperative
wound pain. Further the previous clinical validation of the transcutaneous CO2
monitor shall be confirmed.
A.3 Study aims
The study aims at verifying the following hypotheses:

184 A Antagonism of remifentanil induced respiratory depression by postoperative pain
1. Postoperative pain will induce a significant respiratory stimulation and thus a
right-shift of the response curve of the remifentanil concentration on alveolar
ventilation or arterial PCO2. The inclusion of pain as a covariate will improve
the fit of the data on remifentanil induced respiratory depression measured
with PtcCO2 and alveolar ventilation (main hypothesis).
2. The PtcCO2 and the predicted plasma remifentanil equally predict the anal-
gesic effect of remifentanil.
3. Transcutaneous CO2 (PtcCO2) correlates closely with PaCO2 and PetCO2
in a dynamic situation.
4. PtcCO2 inversely correlates with the pain score (VAS 0-100)
A.4 Study design
Open label prospective observational study in a University Hospital (Inselspital).
A.5 Study methodology
A.5.1 Patient population
After approval by the ethics committee of the Canton of Bern and after obtaining
written informed consent 20 patients scheduled for major orthopedic surgery under
general anesthesia (with postoperative IV analgesia) with a planned duration of
surgery not exceeding 3 hours will be enrolled. Patients with ASA physical status
of III or higher will be excluded, i.e. patients with relevant neurologic, cardiac,
pulmonary, liver or kidney disease. Patients under analgesic treatment with opioids
or patients with alcohol or any drug abuse and patients under treatment with
central-nervous system affecting drugs (anti-depressants, sedatives, anti-epileptics)
will also be excluded.
A.5.2 Study plan
After a fasting period of 6 hours and without giving any sedative drug for pre-
medication the patients will be connected to a Datex AS3 anesthesia monitor (GE
Health Care, Helsinki, Finland) and to a SenTec transcutaneous PCO2 monitor
(SenTec single sensor monitoring, Therwil, Switzerland). A cannula is placed in
an antecubital vein for drug infusion. A continuous infusion of Ringer’s Lactate 2

A.5 Study methodology 185
Figure A.1: Study plan to evaluate the antagonism of opioid induced respiratory
depression exerted by postoperative pain. Preop test: first step-wise
increase of remifentanil to assess remifentanil induced ventilatory de-
pression without pain stimulation. Postop stabilization: first hour in
the PACU, titration of remifentanil to achieve VAS ≤ 30. Postop test:
second step-wise increase of remifentanil to assess remifentanil induced
respiratory depression with concomitant pain stimulation. Possibility
1: respiratory depression end-point with remifentanil concentration at
the end of postoperative stabilization not reached. Possibility 2: respi-
ratory depression end-point with remifentanil concentration at the end
of postoperative stabilization already reached.

186 A Antagonism of remifentanil induced respiratory depression by postoperative pain
ml/kg will be given and 2 mg of tropisetron (Navoban, Novartis, Basel, Switzerland)
will be injected i.v. A 20 G Flowswitch Viggo arterial catheter will be inserted after
local anesthesia into the radial artery of the non-dominant hand after confirming
patency of the ulnar artery with the Allen’s test [81]. A continuous positive airway
pressure mask will be placed and connected to a modified Mapleson D Bain Sys-
tem. At the y-piece of the breathing circuit a the NICO rebreathing system will
be inserted and connected to the NICO monitor (Respironix Inc. Pittsburg, PA,
USA). All data will be recorded on a laptop computer throughout the study using
Labview software (Labview version 5.0, National Instruments Corporation, Austin,
Texas USA). Heart rate, blood pressure, ventilatory rate, tidal volume, minute ven-
tilation, body temperature (esophageal probe) and inspiratory/expiratory oxygen
and carbon dioxide concentrations will be recorded from the Datex AS3 Monitor,
transcutaneous PCO2 and SpO2 from the Sentec Monitor and alveolar ventilation
will be computed by the NICO monitor based on CO2 production (ml/min) and
end-expiratory CO2 concentration. A graphical representation of the study plan is
presented in Figure A.1.
Part 1 (prior to surgery)
After recording baseline data for 10 minutes a target-controlled remifentanil in-
fusion will be started with an Alaris PK TCI syringe pump (Cardinal Health,
Basingstoke, Hampshire, UK) using the pharmacokinetic parameters by Minto and
co-workers [139]. Starting with 2 ng/ml the plasma target concentration will be
increased in steps of 2 (± 1) ng/ml until the respiratory rate falls below 5 min−1
for longer than 5 min. or until transcutaneous PCO2 is higher than 60 mmHg.
A 20 minutes equilibration period will be observed at each target concentration
(Figure A.2). When one of the endpoints of respiratory depression will be reached
the infusion will be stopped and the plasma remifentanil concentration be allowed
to passively decrease to zero. Arterial blood samples will be withdrawn at baseline,
2 min. before, and 2 min. after every increase of target concentration, as well as
immediately 2 min. before and 2, 5, 10 and 20 min. after stopping the infusion for
arterial blood gas analysis and measurement of plasma remifentanil concentrations
(12 samples).
Part 2 (during anesthesia and surgery)
Before induction the remifentanil target concentration will be increased to 4 ng/ml
and anesthesia will be induced with propofol (1.5 to 2.5 mg/kg). Tracheal in-

A.5 Study methodology 187
Figure A.2: Simulation of the ventilatory response to a remifentanil plasma con-
centration of 2 ng/ml according to Bouillon and coworkers [25]. Dot-
ted line: predicted plasma remifentanil concentration. Fine solid line:
predicted effect site remifentanil concentration. Dash-dotted line: pre-
dicted PaCO2. Thick solid line: predicted alveolar ventilation.
tubation will be facilitated with rocuronium (0.5 mg/kg). In cases operated in
prone position, 0.2 mg of glycopyrrolate will be given IV before turning the patient
from supine to prone position. Anesthesia will be maintained with desflurane in
80% oxygen, adjusted to keep the BIS between 40 and 60 and to maintain the
mean arterial pressure within ± 20% of baseline (= pre-induction value). During
surgery the remifentanil target concentration will be kept constant at 3 ng/ml in
order to avoid development of acute tolerance [2]. This concentration corresponds
to the plasma concentration, reached with a fixed infusion rate of 0.1 µg/kg min
which has been used by Guignard and co-workers [2] in a 40 year-old man with a
BMI of 27 (Simulation according to the pharmacokinetic parameters of Minto and

188 A Antagonism of remifentanil induced respiratory depression by postoperative pain
co-workers [139]). The patients that developed acute opioid tolerance received a
mean intraoperative remifentanil infusion rate of 0.3 µg/kg min [2], resulting in a
remifentanil plasma concentration of 8 ng/ml. During surgery tachycardia (heart
rate exceeding 100 min−1) not related to hypovolemia will be treated by boluses or
an infusion of esmolol, hypotension not due to hypovolemia with norepinephrine.
After surgery and postoperative x-ray control desflurane will be turned off, the
fresh gas flow will be increased to 10 l/min, residual neuromuscular blockade will be
antagonized with 2.5 mg of neostigmine and 0.5 mg of glycopyrrolate. The target
remifentanil concentration will be maintained at 3 ng/ml. If spontaneous respira-
tion does not start at this concentration, the target remifentanil concentrations will
be allowed to decrease in steps of 0.5-1 ng/ml until spontaneous respiration starts.
The patient will be extubated as soon as he/she responds to verbal command and
sufficient spontaneous respiration has resumed. 10 minutes after extubation the
pain score (VAS 0-100) will be assessed. If greater than 30 the remifentanil con-
centration will be increased in steps of 0.5-2 ng/ml until the pain score (VAS) is ≤30. Arterial blood samples for measurement of arterial blood gases and remifentanil
plasma concentrations will be withdrawn 15 minutes after skin incision and 10 min.
after extubation (2 samples).
Part 3 (PACU)
After transfer to the PACU the target remifentanil concentration will be adjusted
to maintain the VAS score ≤ 50 until one hour after PACU arrival. According to
the rapid elimination kinetics of desflurane [207] the end-expiratory concentration
one hour after extubation will be have been decreased to less than 10% of the value
before turning off the vaporizer before emergence (simulation based on the Yasuda
Model [207] assuming a duration of desflurane administration of 120 minutes).
Assuming an end-tidal desflurane concentration of 6 vol%, the concentration 1
hour after emergence will be around 0.5 vol%, which is even lower than the sub-
anesthetic concentration of desflurane (0.2 MAC) where van den Elsen and Dahan
did not find a significant effect on hypoxic or hypercapnic respiratory drive [73,57].
One hour after PACU arrival the patient will be asked to quantify the pain
intensity (VAS 0-100) and the actual target remifentanil plasma concentration will
be recorded. A tight fitting face mask is then attached and connected to the
modified Mapleson D Bain System. If the end-points of respiratory depression are
already reached at the target remifentanil concentration associated with a VAS ≤ 30
the remifentanil concentration will then be allowed to decrease in steps of 0.5 ng/mL

A.5 Study methodology 189
until the VAS score increases to 50. If the end-points of respiratory depression are
not reached the target remifentanil concentrations will be increased in steps of 0.5-2
ng/ml, until the end-points of respiratory depression are reached. An equilibration
period of 20 min. is observed at each target concentration unless pain intensity
is > VAS of 50. At each target plasma concentration the VAS score, the arterial,
end-expiratory and transcutaneous PCO2 will be recorded. After reaching the
maximal target remifentanil concentration the plasma remifentanil concentration
will be allowed to passively decrease to the mininal effective concentration or until
the VAS score is > 30. Data acquisition will be stopped 30 minutes later.
Arterial blood samples will be drawn on arrival in the PACU, at the minimal
effective concentration, 12 min. before and 2 min. after each change of the target
remifentanil concentration (during the upward titration) and 2 min. before and
2, 5, 10, 20, 40 and 60 minutes after reduction of the infusion rate for blood gas
analysis and measurement of plasma remifentanil concentrations (ca. 16 samples
depending on the number of titration steps).
The patients will be discharged to the ward according to clinical practice of the
department. During the decay of the remifentanil concentration fentanyl will be
given IV as soon as VAS is higher than 30 and a patient controlled analgesia with
fentanyl will be installed according to the clinical protocol of the department.
A.5.3 Model building
For the analysis we will make the following assumptions:
- The CO2-minute ventilation response curve in our patients is similar as in
the population investigated by Bouillon et al. [25].
- The postoperative wound pain between 1 and 2 hours after surgery will be
more or less constant.
- Potential acute opioids tolerance induced by remifentanil will similarly affect
analgesia and respiratory depression.
We will extend the models of the remifentanil induced respiratory depression
for steady state and non-steady state by Bouillon et al. [25] by a parameter for
pain stimulation. Under steady state conditions (stable CO2 and remifentanil) the
alveolar ventilation was estimated according to the following equation:
Valv(ss) = Valv(0) ⋅ (1 − Cp(ss)γC50γ +Cp(ss)γ )
1
F+1
(A.1)

190 A Antagonism of remifentanil induced respiratory depression by postoperative pain
where Valv(ss) and Valv(0) denote the alveolar ventilation at steady state and
at baseline, Cp(ss) the plasma remifentanil concentration at steady state, C50 the
plasma remifentanil concentration with 50% depression of alveolar ventilation and
F the gain of minute ventilation by increasing CO2 concentrations.
For the non-steady state they suggested the following model.
Valv(Cp, PecCO2) = Valv(0) ⋅ (1 − Cp(ss)γC50γ +Cp(ss)γ ) ⋅ (
PecCO2(t)PecCO2(0))
F
(A.2)
where Valv(Cp, PecCO2) denotes the alveolar ventilation at a given plasma con-
centration of remifentanil and a given effect site CO2 concentration, Valv(0) the
alveolar ventilation at baseline, Cp the plasma remifentanil concentration at time t,
C50 the plasma remifentanil concentration with 50% depression of alveolar ventila-
tion, PecCO2 the effect site CO2 concentration and F the gain of minute ventilation
by increasing CO2 concentrations. The effect site CO2 concentration was be com-
puted based on the parameters determined by Bouillon et al [25] according to the
following equation:
dPecCO2
dt= ke0 ⋅ (PetCO2(t) − PecCO2(t)) (A.3)
with PetCO2 denoting the end-expiratory CO2 concentration, and the ke0 the
end-expiratory-effect site equilibration constant for CO2. The same ke0 will be
used as determined previously [25].
We hypothesize that postoperative wound pain at a given effect remifentanil
concentration will increase alveolar ventilation. Repeated transcutaneous electri-
cal stimulation increased minute ventilation in volunteers breathing room air with
unclamped CO2 by 28%, i.e. Valv(stimulation) = 1.28 ⋅ Valv(baseline) [166]. Pain-
induced increase of baseline alveolar ventilation will be described as follows:
Valv pain(0) = Valv(0) ⋅ (1 +P ⋅K) (A.4)
where P denotes the presence or absence of pain stimulation (with P = 1 or
0) and K the increase of baseline alveolar ventilation during painful stimulation.
This equation will be applied in steady state as well as in non-steady state. Our
assumption is that pain will be constant during the second test period in the PACU,
implies that K is also constant during the test period.
Error models: proportional and exponential models will be used to describe the
interindividual variability of the parameters as appropriate:
θi = θTV ⋅ (1 − η(i)) (A.5)

A.5 Study methodology 191
or
θi = θTV ⋅ eη(i) (A.6)
where θi refers to the individual value of the respective parameter in the ith
individual and θTV is the typical value of the respective parameter in the population,
and η varies randomly between individuals with mean zero and variance Ω2. An
additive (constant SD) error model was chosen for residual variability:
DVobs =DVexp + ε (A.7)
DVobs refers to the observed value of the dependent variable DVexp refers to
the value predicted based on dose, time, and the individual pharmacokinetic and
pharmacodynamic parameters. ε is a normally distributed random variable with
mean zero and variance Ω2.
A.5.4 Measurement of remifentanil plasma concentrations
The arterial blood will be sampled in tubes previously prepared with citric acid
and centrifuged immediately after withdrawal. They will be frozen at −20 C
until analysis. The remifentanil plasma concentrations will be determined by gas
chromatography mass spectrometry as described previously [8].
A.5.5 Sample size calculation and statistics
In the previous study by Bouillon and co-workers 10 volunteer were tested [25].
In other previous pharmacokinetic-pharmacodynamic studies investigating a single
drug a sample size of 20 patients allowed to estimate the model parameters with
sufficient precision [71,70]. In interaction studies or in studies where more complex
models with a number of covariates were investigated a sample size of 40 to 60
patients have to be investigated [139,28].
The program system NONMEM, version V (GloboMax LLC, NONMEM Project
Team Hanover, MD, USA) will be used for all model fits and empirical Bayesian
estimation of the individual parameters. The population data of test 1 and test
2 (remifentanil ramp up with and without pain) will be fit for steady state and
non-steady state. The improvement of the fit by including pain as a covariate will
be tested using the log likelihood test, with a P < 0.01 considered significant.
The correlation of the transcutaneous, the end-tidal and the arterial PCO2 will
be tested with a Bland-Altman plot.
The correlation of the VAS score and the transcutaneous and the arterial PCO2
will be tested with a Spearman rank order correlation. The transcutaneous and the

192 A Antagonism of remifentanil induced respiratory depression by postoperative pain
arterial PCO2 and the predicted plasma remifentanil concentration associated with
a sufficient analgesia (VAS ≤ 30) will be determined in a receiver operator curve
plot.
The prediction probability (Pk) of the CO2 concentrations and the predicted
remifentanil concentrations to correctly predict sufficient analgesia will be deter-
mined according to Smith and co-workers [174].
A.6 Ethical aspects
Remifentanil is a short acting and easily titratable opioid, which is not routinely
used for postoperative analgesia in our department. It is regularly used, however,
for conscious sedation (e.g. for shock wave lithotripsy in urology). Opioid side
effects are of limited duration because of its rapid elimination by plasma esterases.
For study purposes an arterial cannula will be inserted and the patients will be
infused remifentanil before the induction of anesthesia for 45 minutes. The patients
have to tolerate a tight fitting face mask during the pre-operative and postoperative
testing of respiratory depression. The facemask is essential in order to measure
minute ventilation, tidal volumes and end-tidal carbon dioxide concentrations. The
patients will be informed about these points before enrollment.
The placement of an arterial line has a very low rate of serious complications,
provided a patent ulnar artery. Patency of the ulnar artery will be checked with
the Allen’s test before placement. Although the higher remifentanil concentrations
will decrease alveolar ventilation the patients will not become hypoxic because they
will breathe 100% oxygen. Hypercapnia will be limited to 60 mmHg. Because of
the rapid elimination of remifentanil a more serious respiratory depression would
be easily reversible after discontinuation of the remifentanil infusion. A short tem-
porary hypercapnia in the range of 60 mmHg is frequently observed immediately
after emergence of anesthesia and is well tolerated.
“Permissive” hypercapnia of even higher values is applied in patients with severe
ARDS.
Because of the rapid elimination of remifentanil with rapid decreases of effect site
concentrations a break through of pain is possible. In order to minimize this the
postoperative part of the study starts at an effect site remifentanil concentration
where the pain intensity is in the usual target level (VAS ≤ 30). The immediate
postoperative pain control will be similar as in routine cases since analgesic drugs
have often to be titrated in the first 3 hours after surgery. Pain scores of 50 or
higher are therefore not unusual in daily routine. The study will provide additional

A.6 Ethical aspects 193
basic data which may help to improve patient safety in postoperative analgesia with
opioids and during monitored anesthesia care.

194 A Antagonism of remifentanil induced respiratory depression by postoperative pain

B
Clinical investigation:
determining the optimal drug
regimen in individual patients
with chronic pain

196 B Determining optimal drug regimen in individual patients with chronic pain
B.1 Study investigators
Investigators:
M. Eng. Antonello Caruso, Automatic Control Lab, ETH Zurich, Switzerland
Prof. Manfred Morari, Automatic Control Lab, ETH Zurich, Switzerland
Prof. Michele Curatolo, Department of Anesthesiology and Pain Therapy,
University Hospital Bern, Switzerland
Dr. med. Urs Eichenberger, Department of Anesthesiology and Pain Therapy,
University Hospital Bern, Switzerland
Dr. med. Jurg Schliessbach, Department of Anesthesiology and Pain Ther-
apy, University Hospital Bern, Switzerland
Dr. med. Andreas Siegenthaler, Department of Anesthesiology and Pain
Therapy, University Hospital Bern, Switzerland
Dr. med. Gorazd Sveticic, Department of Anesthesiology and Pain Therapy,
University Hospital Bern, Switzerland
B.2 Introduction
In pain management, single drugs often do not provide satisfactory pain relief but
may at the same time cause unacceptable side effects. For example, adverse events
of opioids may restrict their use in non-cancer pain: substantial proportion of
patients on opioids (22%) withdraws from therapy because of adverse events [143].
Combining drugs that act at different receptors and on different pain mechanisms
may enhance pain relief and allow a reduction in the amount of single components.
In that way, the same analgesic effect with a lower incidence of side-effects may be
achieved.
Chronic neuropathic pain and musculoskeletal pain syndromes have enormous
medical, social and economic implications [87, 136, 60]. Even though various com-
binations of different drugs are commonly used in the therapy of these syndromes,
this practice is poorly supported by the published evidence [52]. There is very little
literature comparing a combination with a single-drug regimen. Furthermore, the
optimal doses of each combination regimen remain unknown.
In randomized controlled trials, two or more groups of different drug combina-
tions are usually investigated. However, when combining drugs at different doses,

B.3 Study design 197
hundreds of combinations are possible. For instance, if 5 different values for 3 drugs
are considered, 53 = 125 different combinations exist. Therefore, the optimal com-
bination is unlikely to be identified by randomized controlled studies, since a very
small proportion of all possible combinations are analyzed.
Further, even when a relevant randomized controlled trial generates a definite
answer, its result may not apply to an individual patient: regardless of the overall
trial result, some patients appear to benefit from the experimental therapy and
some do not. In addition, extrapolation may not be appropriate if the patient does
not meet eligibility criteria.
Double blind, randomized controlled trials of single subjects or individualized
medication effectiveness tests (n-of-1 trials or IMETs) have been developed to con-
firm or disprove the effectiveness of the treatment regimen in the individual patient6
and to provide useful information for clinical decisions [151]. A series of pair treat-
ment periods is used so that each patient randomly receives either active therapy
or placebo in crossover design manner.
No studies combining the n-of-1 paradigm with an optimization model to find an
optimal combination of drug regimen have been published so far.
In a previous study [51], we applied a model [16] to optimize drug combination for
thoracic epidural analgesia after major abdominal surgery. Later, we improved the
method and applied it to two additional studies: one on intravenous patient con-
trolled analgesia [182] and one on lumbar epidural analgesia after major orthopedic
surgery [183]. By using for the first time an optimization model in clinical inves-
tigations, these studies provided a new tool for optimizing clinical regimens [75].
Using this method, the optimum can be reached by investigating a limited number
of combinations [51, 16, 182, 183,75].
The aim of the present study is to find the optimal combination of different drug
regimes for individual patients with neuropathic or chronic musculoskeletal pain by
using a scientific method as an alternative to the empirical dose finding strategy
currently used.
The optimal combination is defined as the one producing the highest analgesic
effect with an acceptable incidence of side effects. To this purpose, we will develop
and apply for the first time a model of stepwise individual optimization of drug
combination.
B.3 Study design
Observational, single center study, setting: University Hospital Bern

198 B Determining optimal drug regimen in individual patients with chronic pain
B.4 Study methodology
B.4.1 Drugs used
Amitriptyline (Tryptizol)
Analgesic action of tricyclic antidepressants (TCAs) has been extensively studied
and proven [138]. Antidepressant drugs have been showed to be effective in variety
of neuropathic pains and are often the first choice treatment, the best evidence
available being for amitriptyline [164]. The use of anti-depressants in the treatment
of regional musculoskeletal pain conditions is only weakly supported by results from
controlled clinical trials [115].
Pregabalin (Lyrica)
Antiepileptic drugs are commonly used in the treatment of chronic neuropathic
pain. Results from clinical trials have been positive in the treatment of trigeminal
neuralgia, painful diabetic neuropathy (DPN) and postherpetic neuralgia (PHN)
[198, 179, 191]. The availability of newer anticonvulsants tested in higher qual-
ity clinical trials has marked a new era in the treatment of neuropathic pain.
Gabapentin has the most clearly demonstrated analgesic effect for the treatment
of neuropathic pain, specifically for treatment of painful diabetic neuropathy and
postherpetic neuralgia [191]. Efficacy, tolerability, and safety of pregabalin for
treatment of chronic neuropathic pain associated with DPN or PHN was demon-
strated in randomized controlled trial [80]. Pregabalin reduced symptoms of pain,
disturbed sleep, and fatigue compared with placebo in the treatment of fibromyal-
gia syndrome (FMS), characterized by widespread musculoskeletal pain and low-
ered pain threshold [49]. It was well tolerated and improved global measures and
health-related quality of life.
Oxycodone (Oxycontin)
Opioids are increasingly used in the treatment of chronic non-malignant pain. Effi-
cacy and safety of oxycodone in ambulatory patients with moderate to severe non-
cancer pain (low back pain, osteoarthritis pain, postherpetic neuralgia and painful
diabetic neuropathy) requiring opioid therapy was demonstrated in randomized-
controlled trials [93, 82, 108, 45].

B.4 Study methodology 199
Drug combinations
The combinations used for each study subject will be determined according to
previous medication or personal judgment of the practicing chronic pain specialist.
Possible drug combinations are:
1. Amitriptyline and pregabalin
2. Amitriptyline and oxycodone
3. Pregabalin and oxycodone
B.4.2 Patient population
Recruited at the Division of Pain Therapy, patients suffering from chronic neuro-
pathic and chronic musculoskeletal pain will be studied. A definite diagnosis of
neuropathic or chronic musculoskeletal pain will be made by an experienced, prac-
ticing chronic pain specialist, based on the history of daily pain lasting at least 6
months [135]. Written informed consent will be obtained by all patients.
Patients will have to complete at least 4 daily pain diaries during the 7 days
prior to randomization, using a visual analogue scale with 0 as ‘no pain’ and 10 as
‘worst possible pain’, with an average score ≥ 3 out of 10 over this period being an
inclusion criteria to participate in the study.
Exclusion criteria include: age < 18 yr, pregnancy, occurrence of unacceptable
side effects with drugs investigated, known renal impairment, epilepsy, clinically
significant hepatic disease, significant neurological or psychiatric disorders unrelated
to the chronic pain, other severe pain that might impair the assessment of the
investigated pain syndrome and illicit drug or alcohol abuse.
B.4.3 Study plan
Each combination will be given during 1 week without a washout period. The
initial complex will include 4 combinations at choice of the investigator, that are
expected to produce analgesia with no or minimal side effects. Thus the initial set
of combinations will be studied during a period of 4 weeks. Patient will get a set of
standard dose capsules to take every 12 hours during the week. Patients, physician
in charge, staff who informed patients and collected the data will not be aware of
the dosage of the drugs used at the particular optimization step.
The hospital pharmacy will take care of the correct dose and blinding, using
neutral looking capsules containing the investigated regimen defined by blinded
investigators for each optimization step.

200 B Determining optimal drug regimen in individual patients with chronic pain
B.4.4 Optimization procedure
The procedure is a modification of the novel optimization method previously applied
in a clinical study for post-operative pain management1. The aim of the procedure
is to optimize the analgesic effect, i.e. to minimize the pain score. To this purpose,
the optimal combination of drug A and drug B is sought. Constraint of the search
procedure is an unacceptable incidence of side effects. When a combination hits
the constraint, a regression algorithm is applied to bring the search back to the
therapeutic range.
The investigation consists of sequential optimization steps. The basic principle
is to utilize the results obtained by the analysis of a group of combinations to
create subsequent combinations in a stepwise manner, until optimal analgesia with
an acceptable incidence of side effects is reached. The group of 4 combinations
analyzed at each step is named a “complex”. The following procedure is used for
each complex.
1. Analysis of analgesia and side effects of the combinations included in the
complex studied.
2. Identification of the combination characterized by the worst analgesic effect
or associated with an unacceptable incidence of side effects. This combination
is not included in the subsequent complexes.
3. Creation of a new complex of combinations. This complex includes the best
3 combinations of the previous complex (best analgesia with acceptable in-
cidence of side effects) and the new combination generated from the results
obtained with the previous complex. This new combination is identified by
applying the novel optimization method presented in the recent work by Sveti-
cic and colleagues [183]. The new combination replaces the one mentioned in
point 2. The new combination is then administered to the patient.
4. Application of the procedure 1-3 to the new complex.
The optimization procedure is interrupted when no further improvement in the
mean pain score is achieved after three consecutive steps.
Rules of the search include: minimum and maximum value of variables, minimum
increase (lowest clinically relevant dose increment) and maximum increase (highest
safe dose increment) of variables, and constraints (Table B.1).
For oxycodone there is no upper limit, because for clinical use opioids are ad-
ministered according to analgesia and side effects without maximum dose levels.
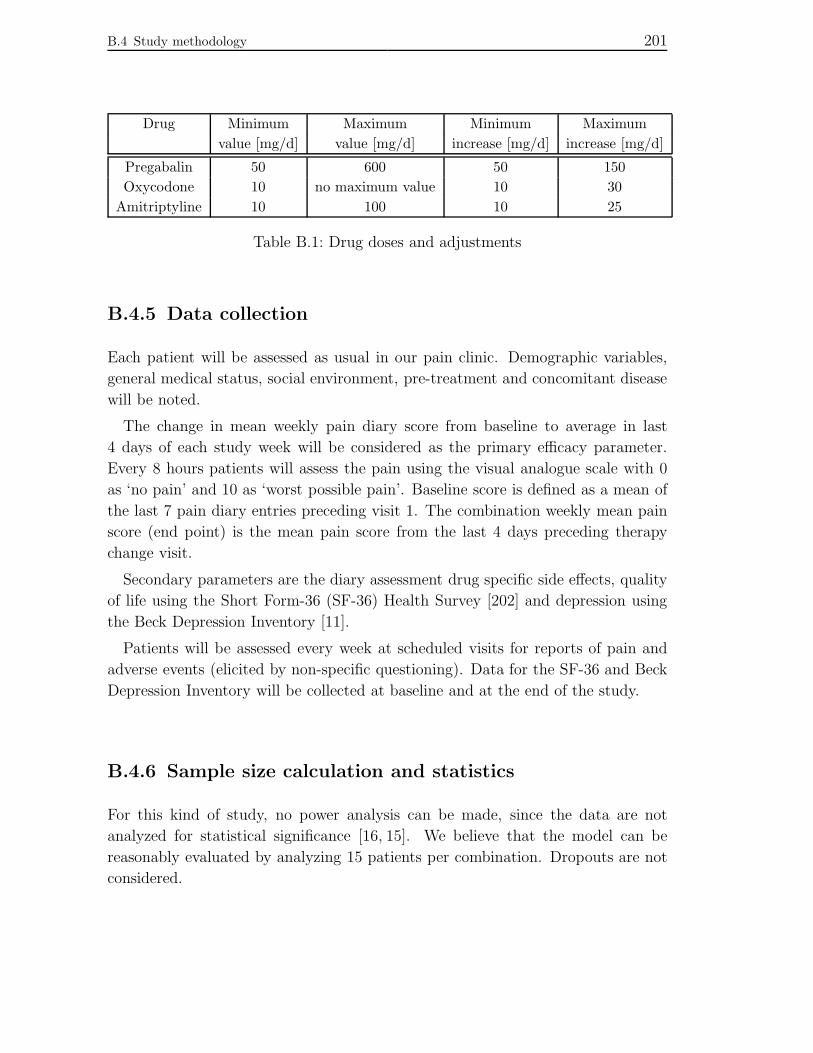
B.4 Study methodology 201
Drug Minimum Maximum Minimum Maximum
value [mg/d] value [mg/d] increase [mg/d] increase [mg/d]
Pregabalin 50 600 50 150
Oxycodone 10 no maximum value 10 30
Amitriptyline 10 100 10 25
Table B.1: Drug doses and adjustments
B.4.5 Data collection
Each patient will be assessed as usual in our pain clinic. Demographic variables,
general medical status, social environment, pre-treatment and concomitant disease
will be noted.
The change in mean weekly pain diary score from baseline to average in last
4 days of each study week will be considered as the primary efficacy parameter.
Every 8 hours patients will assess the pain using the visual analogue scale with 0
as ‘no pain’ and 10 as ‘worst possible pain’. Baseline score is defined as a mean of
the last 7 pain diary entries preceding visit 1. The combination weekly mean pain
score (end point) is the mean pain score from the last 4 days preceding therapy
change visit.
Secondary parameters are the diary assessment drug specific side effects, quality
of life using the Short Form-36 (SF-36) Health Survey [202] and depression using
the Beck Depression Inventory [11].
Patients will be assessed every week at scheduled visits for reports of pain and
adverse events (elicited by non-specific questioning). Data for the SF-36 and Beck
Depression Inventory will be collected at baseline and at the end of the study.
B.4.6 Sample size calculation and statistics
For this kind of study, no power analysis can be made, since the data are not
analyzed for statistical significance [16, 15]. We believe that the model can be
reasonably evaluated by analyzing 15 patients per combination. Dropouts are not
considered.

202 B Determining optimal drug regimen in individual patients with chronic pain
B.5 Ethical aspects
Combining drugs for treatment of chronic pain is common practice. In our study,
we will use only already established drug combinations in the usual dosages, our
aim being the optimization of a therapy that would be implemented independent
of the participation in the study.
The basic optimization method has been used in 2 previous investigations on
epidural analgesia [51, 183] and in one on patient controlled analgesia [182]. This
model led to a progressive reduction in the incidence of side effects and to an
improvement in the quality of analgesia. No complications have been observed. In
the present study, we will use an improvement of the previously used optimization
models, based on a retrospective analysis of the data collected in the previous
investigations and adjusted for the use in individual patients.
We therefore do not expect additional hazards resulting from the study.
B.6 Expected benefits
For chronic pain patients, pain is one of the most important symptoms affecting
the quality of their life, social functioning and social costs. Pain treatment is one
of the most relevant aspects characterizing the quality of patient care. Providing
an optimal pain therapy is an ethical commitment.
The identification of the optimal combination can improve treatment of chronic
pain and reduce the incidence of side effects. This might improve the quality of life
and reduce the social costs.
There is a lack of published data on the use of drug combinations. Research
on drug combinations may offer a perspective of better treatment of these difficult
pain conditions.
Scientific based approach should be preferred to the purely empiric criteria usu-
ally employed to select the combinations analyzed in randomized controlled trials.
The presented novel model for optimizing therapy in individual patients can repre-
sent a useful tool in future clinical research, not only in the field of pain manage-
ment.

B.7 Subprotocol: Time profile of pharmacological side effects 203
B.7 Subprotocol: Time profile of side effects
caused by oxycodone, pregabalin and
amitriptyline
B.7.1 Background
It is known that all the three investigated drugs cause side effects mostly at the
beginning of the titration phase. These side effects may decrease or disappear
during treatment in part of the patients. However, there have been no studies
that formally addressed the issue of time course of side effects. This information
is important to establish a profile of the three drugs investigated before they are
combined for the optimization study. Furthermore, the results would be clinically
relevant, since better information of patients on the time profile of side effects could
increase compliance and adherence to treatment.
B.7.2 Study aims
To describe the time factor of side effects for oxycodone, pregabalin and amitripty-
line.
B.7.3 Study methodology
Patient population
All consecutive patients who are referred to our pain unit for ambulatory evaluation
will be potential participants. Additionally, patients will be recruited by advertise-
ment in local newspapers as for the optimization study. Patients will be included
in the study if one of the three drugs investigated will be clinically indicated.
Ongoing treatment with either an opioid, antiepileptic or antidepressant is an ex-
clusion criterion for recruiting patients in the oxycodone, pregabalin and amitripty-
line groups, respectively. Further exclusion criteria will be the same as for the main
study approved by the ethics committee: pain duration < 6 months, age < 18 yr,
pregnancy, occurrence of unacceptable side effects with drugs investigated, known
renal impairment, epilepsy, clinically significant hepatic disease, significant neuro-
logical or psychiatric disorders unrelated to the chronic pain, other severe pain that
might impair the assessment of the investigated pain syndrome and illicit drug or
alcohol abuse.

204 B Determining optimal drug regimen in individual patients with chronic pain
For this kind of study, no power analysis can be made, since the data are not
analyzed for statistical significance. We believe that the model can be reasonably
evaluated by analyzing 30 patients per drug.
Assessments
Each patient will be assessed as usual in our pain clinic. Routinely collected pa-
rameters include: demographic characteristics, pain intensity (BPI), work status,
interference of pain with daily activities (MPI), depression (BDI), catastrophizing
(CSQ-subscale), pressure algometry at 2nd toe and DNIC by ice water test.
Patients will be asked to fill daily a pain diary (Schmerztagesbuch) for one week
before start of the study medication and during the whole period of the study.
Patients will be assessed every week at scheduled consultations for reports of
pain and adverse events (nausea, dizziness, tiredness, and others to be defined by
the patient) as recorded by the pain diary. At the end of each dose step, overall
change compared with the previous dose step will be assessed by the Patient Global
Impression of Change Scale, whereby the change is rated as one of 7 categories, from
‘very much improved’ to ‘very much worse’ [67]
Medication
The choice of one of the three drugs will be left to the treating physician according
to the optimal treatment for the individual patient. Only one of the three drugs
is administered, i.e. no combination of the three drugs is prescribed. Concomitant
intake of other analgesics is at best avoided by stopping medication. However, if
the clinical indication is given, the intake of drugs of other classes is allowed, as
long as they are known not to cause any of the side effects listed above.
Patients and doctors will not be blinded to the study medication in order to
mimic clinical conditions as close as possible. The following titration schedules will
be used.
- Oxycodone slow-release (one dose every 12h): 5-5, 10-10, 20-20, 30-30, 40-40,
50-50.
- Pregabalin (one dose every 12h): 50-50, 100-100, 150-150, 150-150-150 (one
dose every 8h), 300-300 mg.
- Amitriptyline slow-release (one dose every 24h): 0-0-25, 0-0-50, 0-0-75, 0-0-
100 mg.

B.7 Subprotocol: Time profile of pharmacological side effects 205
The increase in dose will be made taking into consideration the pharmacoki-
netic characteristics of the drugs, in particular the time to reach a steady state.
These times are 24h [161], 24-48h [13] and 7-10 days for oxycodone, pregabalin
and amitriptyline (including the main metabolite nortriptilyne), respectively. We
therefore define the following minimal titration times for each dose:
- Oxycodone slow-release: 7 days;
- Pregabalin: 7 days;
- Amitriptyline: 14 days.
Side effects will not be treated pharmacologically. Whenever side effects are
observed, the following procedures will be adopted:
1. mild side effects with little or no impairment of daily life: increase the dose
as described above;
2. moderate side effects with significant impairment of daily life: no increase in
dose in the following week;
3. strong and intolerable side effects: reduction in dose to the previous step;
discontinuation of the treatment only if the patient is not willing to continue
or if clinically indicated.
Titration will be stopped when a reduction in pain intensity that is rated as
satisfactory by the patient is reached.
Analysis
The measurements on the time behavior of the side effects will be analyzed and
modeled in order to describe the transient overshoot in effect magnitude upon
increase of dosage. Possibly also the response to dosage decreases will be analyzed.
A mathematical model of pharmacodynamics will be proposed that captures the
transient and steady state behavior of the effects and that will necessarily deal
with issues of non-linearity and physiological variability. The characteristics of the
effect vs. time curve (amplitude, time constant of decay, time delay, etc.) will be
estimated from the data measured in patients.
206 B Determining optimal drug regimen in individual patients with chronic pain
Ethical aspects
The patients receive assessments and treatments according to the routine of our pain
unit. The drug is chosen based on the optimal treatment for the individual patient.
The protocol is a preparation for the study approved by the ethics committee, using
the same drugs according to the routine of the pain clinic. According to the rules
of the local ethics committee, no permission is required.
Expected benefits
There are no data on how fast and how often side effects decrease over time. This
represents a problem when these drugs are combined in the planed study on the
optimization procedure. Furthermore, this knowledge is important for better infor-
mation of patients on the expected resolution of side effects.
C
Clinical investigation:
a novel procedure
for provocation discography

208 C A novel procedure for provocation discography
C.1 Study investigators
Investigators:
M. Eng. Antonello Caruso, Automatic Control Lab, ETH Zurich, Switzerland
Prof. Manfred Morari, Automatic Control Lab, ETH Zurich, Switzerland
Prof. Michele Curatolo, Department of Anesthesiology and Pain Therapy,
University Hospital Bern, Switzerland
Dr. sc. tech. Peter Schumacher, Department of Anesthesiology and Pain
Therapy, University Hospital Bern, Switzerland
Prof. Paul Heini, Department of Orthopedic Surgery, University Hospital
Bern, Switzerland
Prof. Lars Arendt-Nielsen, Center for Sensory-Motor Interaction, University
of Aalborg, Denmark
C.2 Introduction
Chronic low back pain is a common medical problem. One of the possible causes
is a disruption in the annulus fibrosus of an intervertebral disc. Since the annulus
fibrosus, especially its outer third, is strongly innervated [23], degenerative changes
or internal tears can result in chronic nociceptive stimulation causing low back pain
as well as referred pain to the lower extremities. These internal disc disruptions
are radial fissures which extend to the inner (grade 1 of disruption), the middle
(grade 2), the outer third (grade 3) or even spread circumferentially (grade 4)
within the annulus [165]. They are predominantly located in the posterior part, i.e.
the area of innervation of the sinuvertebral nerve. Intradiscal lesions, however, are
hardly revealed by imaging techniques such as CT or MRI, so that the diagnosis of
discogenic pain is difficult to make in a first attempt by these means [22].
Provocation discography is generally accepted as the gold standard method for
the diagnosis of discogenic pain. A spinal needle is inserted into the nucleus pul-
posus of the suspected disc (as well as into two additional discs serving as negative
controls) under X-ray view. Contrast medium is then injected into the nucleus,
continuously augmenting intradiscal pressure. The pressure that is recorded at the
first appearance of the contrast medium is termed “opening pressure”. As pressure
rises proportionate to the amount of injected fluid, the patient is repeatedly asked

C.2 Introduction 209
whether he feels pain, and, if so, whether this pain is concordant (i.e. the same
pain, radiating to the same areas it usually does). The pain intensity is recorded
on a numeric rating scale (NRS), i.e. a scale on which the patient indicates his
actual pain intensity within an interval ranging from 0 (no pain) to 10 (strongest
pain imaginable). With the contrast medium still in the disc, a possible lesion
can be detected either by X-ray during discography, or on following CT. In case
of a positive result of discography, surgical fusion, disc prosthesis or intradiscal
electrothermal annuloplasty (IDET) can be therapeutic options.
The criteria according to which a disc is considered positive are defined by the
International Spine Intervention Society (ISIS). It is important to emphasize that
healthy discs usually do not hurt upon pressure application during discography
(hence the two negative controls), or, in few cases, only when pressure rises to high
levels. Because pressure levels are continuously monitored during the procedure,
it is possible not only to determine whether a disc is positive, but also to asses its
exact pain threshold.
The lower the pain threshold of the stimulated disc is, the stronger the evidence
that the disc is the source of pain. Conversely, the higher the threshold is, the more
probable a false-positive results. Such false-positive responses can be, for instance,
due to subjective components in pain perception or to altered pain processing re-
sulting from central sensitization. One possible hypothesis suggests that perpetual
nociceptive input from chronic painful processes in adjacent structures, e.g. the zy-
gapophysial joint, may lead to extension of the receptive field of sensory neurons to
the intervertebral disc and to lowering of the pain threshold when stimulating that
disc. In this case, the disc could be considered positive by discography, although
the true pathology lies in a different anatomical site [33].
There are a number of problems associated with the procedure that may seri-
ously impact the validity of the diagnostic information gained form it. First and
probably foremost is that the increase of intradiscal pressure is not standardized
and, depending on lesions and the morphology of the disc, cannot be properly con-
trolled by the performing physician. Especially if lesions are present the intradiscal
pressure increase will be linked by a non-linear and time variant relationship to
the amount of injected contrast medium. Secondly the pain intensity rating of the
patient during the procedure is by nature a subjective rating. It is additionally
influenced by the communication between physician and patient, e.g. the time in-
terval between questions and also possible misunderstandings between patient and
physician. Thirdly there is no blinding of the physician in regard to the investigated
disc, the physician knows whether he/she is examining the control or suspected disc
which in turn might influence his/her assessment. Without explicit evidence These

210 C A novel procedure for provocation discography
combined factors likely result in a high inter- and intraobserver variability which
make it difficult to arrive at diagnostic conclusions that are fully reproducible and
therefore meaningful.
C.3 Study aims
In this study we present a novel method to perform provocative discography that
addresses above mentioned problems of conventional discography. This method
has the potential to deliver more reliable and reproducible results for the diagnostic
assessment of discogenic pain. In a first phase we will develop the technical platform
to standardize the provocative discography procedure. In a second phase we will
perform an exploratory clinical proof of concept study to verify the feasibility of
the method and to investigate the benefits of the new procedure.
Properties of the new platform are defined as follows:
- the intradiscal pressure is increased continually, the physician can select an
increase rate, e.g. 10 PSI/minute
- the necessary flow of the contrast medium is automatically adjusted by the
system and also recoded together with the pressure for later review
- the patient gets a simple control panel with a button interface with the in-
struction to a) press the button as soon as he/she can feel the effect of injec-
tion of contrast medium and to b) press the button again if he/she is feeling
intolerable pain
- safety aspects:
◾ the system guarantees that the a maximum intradiscal pressure (i.e. 100
PSI according to the ISIS guidelines) or the preselected increase rate are
not exceeded and that the pressure is never negative
◾ the system does not inject more contrast medium per disc as has been
preselected; for routine cases, the maximum volume will be 3 ml accord-
ing to the ISIS guidelines
◾ at all times an emergency button assures the possibility that the system
returns to a safe state and that the case can be continued manually if
needed
◾ the relevant requirements as per RL-93-42-EWG have to be observed

C.4 Market background 211
The study aims in the second phase will be to show the a) feasibility of the pro-
posed measuring method and apparatus and b) the reproducibility of measurements
performed with the method. Our hypothesis is that a) the measuring method is
technically feasible and applicable in the clinical setting; b) the maximum tolerable
intradiscal pressure can be reproduced in multiple measurements with a standard
deviation that is on average less than 5 PSI.
C.4 Market background
No commercial system is available that has the required properties. A prototype
system has to be developed and built for this proof of concept study. Based on a
publication or patent submission an industrial partner can then be contacted for co-
operation and for further development of the technology and the method/procedure.
Two injection systems including pressure monitoring are currently commercially
available. Merit Medical (Merit Medical Systems, South Jordan, UT, USA) sells
the Intellisystem II monitor combined with the Intellisystem 25 syringe, originally
launched for angioplasty purposes allowing pressures up to 25 bar (approx. 350
PSI). Stryker (Stryker Corporation, Kalamazoo, MI, USA) has recently released
the Discmonitor device, a disposable syringe with integrated pressure and flow
monitor. The device was developed for provocative discography but is listed as
substantially equivalent to the Merit Medical system and is therefore also listed as
an angioplasty device.
C.5 Solution proposal
Ideally a prototype development would build on one of the commercially available
devices to avoid potential problems with the approval of the study. Those devices
have the proper mechanical structure, built in sensors and are approved for the
intended clinical procedure.
A prototype will therefore consist of a mechanical apparatus that accommodates
one of the commercial syringes. The apparatus will have a motor that can drive
the screw piston of the syringe. The motor will be controlled by an xPC real time
system running a control algorithm to precisely control the pressure measured via
the pressure sensor of the syringe. The real time system will furthermore read and
process the data from a simple control panel that records the patient reactions
to the induced pain. To complete the system a graphical user interface running
on a separate notebook computer will be provided that allows interaction with the

212 C A novel procedure for provocation discography
system. The control algorithms and the user interface will be developed and verified
with Matlab/Simulink (The MathWorks Inc, Natick, MA, USA).
C.6 Bench testing
During the development of the control algorithms a comprehensive model of a
disc will be tested in multiple configurations in software simulations to maximize
robustness of the algorithms. Before the system will be applied to patients it will
undergo extensive bench testing. To this end a laboratory model of a disc will
be built to actually test the behavior of a variety of possible morphologies and
flow/pressure relationships in the final configuration. Special attention will be
given to the safety functions of the system.
C.7 Study design
The study will be carried out at the University Hospital of Bern, Department of
Anesthesiology, Division of Pain Therapy. It is a prospective, observational clinical
trial.
C.8 Study methodology
C.8.1 Patient population
Ten patients with low back pain for at least 6 months will be studied. The patients
will be recruited at the Division of Pain Therapy by usual referral for evaluation
and treatment. Inclusion criteria: Patients scheduled for discography (independent
of the study), pain duration of at least 6 months. Sufficient knowledge of German,
French or Italian language. Exclusion criteria: Usual exclusion criteria for patients
undergoing discography in clinical setting. A written informed consent will be
obtained from all patients.
C.8.2 Study plan
Before the procedure, pain intensity using the visual analogue scale (VAS) will be
recorded (0 = no pain, 10 = worst pain imaginable). Furthermore, the patient will
draw on an anatomical map the area where pain is felt.

C.8 Study methodology 213
Figure C.1: Example of the intradiscal pressure time course during an experiment
in one disc.
Discography will be performed based on the ISIS practice standards for lumbar
disc stimulation and following the routine standards of our institution. The pressure
increase for pain provocation will not be done manually but with the automatic
system which guarantees a continuous increase of the intradiscal pressure at a
selectable rate.
All discs that can potentially be the cause of the patient’s clinical findings as well
as at least one unsuspicious control disc will be tested. The nucleus pulposus of the
discs will be injected with non-ionic contrast medium (Omnipaque 300) combined
with an antibiotic (Cefazoline 2 g or, if allergy is suspected, Clindamycine 600
mg) through a syringe with an integrated pressure transducer connected to the
automatic system as described above.
At first the intradiscal pressure increase rate is set to 5 PSI/minute. The opening
pressure (OP) is recorded by the physician via user interface. As soon as the patient
feels the injection pressure he/she presses the button on the user control panel. The
related pressure is recorded (P0) and the pressure increase is stopped; the system
will maintain a constant pressure. The physician then continues the procedure
via the user interface panel at a pressure increase rate of 20 PSI/minute up to a
maximum of 100 PSI. When the patient cannot tolerate the pain anymore he/she
again pushes the button. The related pressure is recorded (P1). Furthermore,
pain intensity by VAS is assessed and the patient draws he area of pain on an

214 C A novel procedure for provocation discography
anatomical map. The pressure is then reduced by 20 PSI and maintained constant.
If the pain is still not tolerated the pressure is manually decreased via user interface
until accepted by the patient. The patient will then be asked whether the pain
was discordant or concordant. After a waiting period of at least 2 minutes the
pressure increase procedure is repeated twice for pressures P2 and P3 for multiple
measurements per disc (Figure C.1). Pressure and flow will be recorded at least with
an interval of 1 second at all times during the procedure and stored electronically.
The procedure will be stopped when the defined maximum of contrast medium has
been injected or a pressure of 50 PSI above the opening pressure has been reached,
independent whether all measurements (P0-P3) have been collected or not. The
whole procedure is then repeated for preferably two but at least one control disc.
Modified ISIS criteria for categorizing a disc as probably positive are:
A. The patient feels the pain during pressure increase as intolerable and presses
the button.
B. The pain is concordant.
C. The pain intensity is at least 7/10 on the numerical rating scale (NRS, where
0 = no pain, 10 = worst pain imaginable).
D. The pain that is reproduced is produced at a pressure less than 50 PSI above
opening pressure.
E. Stimulation of adjacent discs provides controls such that
when only one adjacent disc can be stimulated,
1) that disc is painless, or
2) pain from that disc is not concordant and is produced at a pressure
grater than 50 PSI above opening pressure;
when two adjacent discs can be stimulated,
1) both discs are painless, or
2) one disc is painless and
3) if the other disc is painful, that pain is not concordant and is produced
at a pressure greater than 50 PSI above opening pressure.
C.8.3 Feasibility and applicability of the automatic system
To evaluate the performance of the novel automatic system the following data will
be analyzed:

C.8 Study methodology 215
Setpoint precision
The actual control precision of the preset pressure and pressure increase rate will
be calculated using the mean absolute deviation (MAD), defined as follows:
MADi = 1
Ni
Ni
∑j=1∣pmeasured(i, j) − preference(i, j)∣ (C.1)
being Ni = total number of measurements during observation period for subject
i.
Safety
Number of incidents will be counted that are relevant to the safety of the procedure:
- use of emergency button
- manual continuation of the procedure because of perceived unsafe or unsat-
isfactory performance (no emergencies)
- violation of pressure limits
Outcome
The capability to reproduce pain threshold measurements within a single disc will
be quantified by the average standard deviation of the P1, P2 and P3 pressure
levels found a) in the multiple discs assessed in one patient, b) in all suspected
discs of the study population, c) in all control discs of the study population and d)
in all discs.
C.8.4 Pressure pain threshold
We will assess the patient’s pain detection and pain tolerance threshold using a
pressure algometer, whose probe has a surface area of 1 cm2 (Somedic AB, Stock-
holm, Sweden). Pressure will be increased from 0 to max. 1200 kPa at a rate of
30 kPa/s. Pain detection threshold is defined as the pressure at which the sensa-
tion turns to pain. Pain tolerance threshold is defined as the point at which the
subject perceives the pain as intolerable. Before each session, the subjects will be
allowed to get accustomed to the procedure by performing several measurements
for training until they are familiar with it. The PPT will then be registered three
times at each site and the arithmetical means of these three measurements will be

216 C A novel procedure for provocation discography
used for data analysis. Three different sites will be measured: painful area of the
back, non-painful area of the back on the same side and the ipsilateral great toe.
C.8.5 Further assessments
All patients who are referred to our clinic, independent of the participation in a
study, are asked to fill in our standard questionnaires, the Beck Depression Inven-
tory BDI and the SF-36, before the first consultation. The BDI assesses possible
changes in mood and depressive tendencies associated with chronic pain, whereas
the SF-36 provides a more general insight in quality of life, considering basic activi-
ties of daily living, reductions in physical activities or restricted working capability.
Additionally, all patients are asked to draw the location of their pain on an anatom-
ical map, thereby indicating the “target pain” as well as radiating pain (if existent).
We will use this data for descriptive statistics in our study population.
C.9 Time schedule
The development and verification of the technology in the first phase of the study
will require a time period of 9 month. Estimated duration of phase two, clinical
experiments: 18 month. The procedure will be performed in one session. 1) Before
discography: collection of demographic and clinical data, BDI and SF-36 (as rou-
tinely performed), PPT test, assessment of pain area, VAS score. 2) Discography
with recordings of: pain quality, intensity on NRS, pressures OP, P0, P1, P2 and P3
and pain area on anatomical map for every painful disc separately. 3) 30 minutes
after discography: PPT test and VAS.
C.10 Data analysis
C.10.1 Main aim
The main goal of the study is to Demonstrate the feasibility and reproducibility
of the novel measuring procedure. Acceptable performance of the novel system
within the scope of this proof of concept will be based on the following minimum
requirements based on the inclusion of 10 patients:

C.10 Data analysis 217
Setpoint
- an average MAD of less than 5 PSI and not more than 10 PSI in one single
patient
Safety
- no use of the emergency button
- a maximum of two patients where the procedure has to be finished manually
(not counting those patients where the systems stops injecting because the
maximum amount of contrast medium has been reached)
- overall violation of pressure limits less than 30 seconds, but not more than 5
seconds in a single patient
Outcome
- the maximum tolerable intradiscal pressure can be reproduced in multiple
measurements with a standard deviation that is on average less than 5 PSI
As observational data we will present:
- the average of the P1-3 pressures will be correlated to the PPT findings
- the opening pressures (OP) and the P0 pressures will be correlated
C.10.2 Secondary aim
The secondary goal of the study is to determine the presence of central hypersen-
sitivity in patients. The patient’s PPT will be compared by the Student’s t-Test
to a historic control group from a previous study on healthy volunteers [50] which
showed a mean pressure pain tolerance threshold of 663 kPa and a standard devi-
ation of 149, measured at the foot. A recent study on whiplash patients [95] with
central sensitization showed mean values of 354 kPa and a standard deviation of
96, measured at the foot. Considering a difference of 300 kPa, assuming a standard
deviation of 150 and setting α = 0.05 and β = 0.8, a sample size of 6 subjects per
group would produce enough power to detect a difference between the groups, our
study is therefore powered enough to show this difference.

218 C A novel procedure for provocation discography
C.11 Ethical aspects
Patients would undergo discography anyway, independent of the participation in
the study. The use of the automatic injection system will not increase the risk
exposure, as the pressure increase will be smooth and controlled and less jerky as it
could be when performing the procedure manually. An emergency button and the
presence of additional personnel will guarantee a safe procedure at all times, even
when the system starts to malfunction. Pressure algometry has been widely used
by several research groups, including ours, e.g. [6, 50, 159]. No damage has been
observed yet, nor are we aware of any risk associated with this method.
C.12 Expected benefits
Chronic low back pain is an important medical and socio-economic problem, as it
causes huge suffering and costs to the society. The identification of the source of
pain remains an essential clinical problem, preventing the development of appro-
priate treatment modalities. If the hypotheses of this study are confirmed, a new
tool for the diagnosis of discogenic pain could be developed. Central hypersensi-
tivity is thought to be an important mechanism in chronic pain, but its role in
the determination of discogenic pain is still unknown. There is an urgent need to
clarify whether findings of animal research on central sensitization are applicable
in clinical pain conditions.
Bibliography
[1] Arzneimittel-Kompendium der Schweiz, 2009.
[2] A. E. Bossard, B. Guignard an, C. Coste, D. I. Sessler, C. Le-
brault, P. Alfonsi, D. Fletcher and M. Chauvin: Acute opioid toler-
ance: intraoperative remifentanil increases postoperative pain and morphine
requirement. Anesthesiology, 93:409–417, 2000.
[3] Anderson, K. J. and G. N. C. Kenny: Total Intravenous Anaesthesia
(TIVA) II: Pharmacodynamics of Intravenous Anaesthetics. The Royal Col-
lege of Anaesthetists Bulletin, 17:831–834, 2003.
[4] Angiolillo, D. J. and P. Capranzano: Pharmacology of emerging novel
platelet inhibitors. Am Heart J, 156:S10–15, 2008.
[5] Ansermino, J. M., P. Brooks, D. Rosen, C. A. Vandebeek and
C. Reichert: Spontaneous ventilation with remifentanil in children. Paedi-
atr Anaesth, 15:115–121, 2005.
[6] Arendt-Nielsen, L., S. Petersen-Felix and M. Fischer: The effect of
N-methyl-D-aspartate antagonist (ketamine) on single and repeated nocicep-
tive stimuli: a placebo-controlled experimental human study. Anesth Analg,
81:63–68, 1995.
[7] Arrowsmith, J. B., B. B. Gerstman, D. E. Fleischer and
S. B. Benjamin: Results from the American Society for Gastrointestinal
Endoscopy/U.S. Food and Drug Administration collaborative study on com-
plication rates and drug use during gastrointestinal endoscopy. Gastrointest
Endosc, 37:421–427, 1991.
[8] Asselborn, G., M. Yegles and R. Wennig: Suicide with remifentanil
and midazolam: a case report. Acta Clin Belg Suppl, pages 54–57, 2002.
[9] Astrom, K. J. and T. Hagglund: PID controllers: theory, design, and
tuning. ISA, Research Triangle Park, NC, 1995.
219

220 Bibliography
[10] Babenco, H. D., P. F. Conard and J. B. Gross: The Pharmacody-
namic Effect of a Remifentanil Bolus on Ventilatory Control. Anesthesiology,
92(2):393–398, 2000.
[11] Beck, A. T., C. H. Ward, M. Mendelson, J. Mock and J. Erbaugh:
An inventory for measuring depression. Arch Gen Psychiatry, 4:561–570,
1961.
[12] Bellville, J. W., B. J. Whipp, R. D. Kaufman, G. D. Swanson,
K. A. Aqleh and D. M. Wiberg: Central and peripheral chemoreflex loop
gain in normal and carotid body-resected subjects. J Appl Physiol, 46:843–853,
1979.
[13] Ben-Menachem, E.: Pregabalin pharmacology and its relevance to clinical
practice. Epilepsia, 45, 2004.
[14] Benumof, J. L., R. Dagg and R. Benumof: Critical hemoglobin desat-
uration will occur before return to an unparalyzed state following 1 mg/kg
intravenous succinylcholine. Anesthesiology, 87:979–982, 1997.
[15] Berenbaum, M. C.: What is synergy? Pharmacol Rev, 41:93–141, 1989.
[16] Berenbaum, M. C.: Direct search methods in the optimisation of cancer
chemotherapy regimens. Br J Cancer, 61:101–109, 1990.
[17] Berkenbosch, A., J. H. van Beek, C. N. Olievier, J. De Goede and
P. H. Quanjer: Central respiratory CO2 sensitivity at extreme hypocapnia.
Respir Physiol, 55:95–102, 1984.
[18] Bernet-Buettiker, V., M. J. Ugarte, B. Frey, M. I. Hug, O. Baen-
ziger and M. Weiss: Evaluation of a new combined transcutaneous mea-
surement of PCO2/pulse oximetry oxygen saturation ear sensor in newborn
patients. Pediatrics, 115(1):64–68, 2005.
[19] Bhananker, S. M., K. L. Posner, F. W. Cheney, R. A. Caplan,
L. A. Lee and K. B. Domino: Injury and liability associated with monitored
anesthesia care. Anesthesiology, 104(2):228–234, 2006.
[20] Bischoff, K. B. and R. B. Brown: Drug distribution in mammals. Chem-
ical Engineering Progress Symposium Series, 62(66):33–45, 1966.

Bibliography 221
[21] Bjorkman, S., D. R. Wada, D. R. Stanski and W. F. Ebling: Com-
parative physiological Pharmacokinetics of Fentanyl and Alfentanil in Rats
and Humans based on Parametric Single-Tissue Models. Journal of Pharma-
cokinetics and Biopharmaceutics, 22(5):381–410, 1994.
[22] Bogduk, N. and M. T. Modic: Lumbar discography. Spine, 21:402–404,
1996.
[23] Bogduk, N., W. Tynan and A. S. Wilson: The nerve supply to the
human lumbar intervertebral discs. J Anat, 132:39–56, 1981.
[24] Bonello, L., L. Camoin-Jau and S. Arques et al.: Adjusted clopidogrel
loading doses according to vasodilator-stimulated phosphoprotein phosphory-
lation index decrease rate of major adverse cardiovascular events in patients
with clopidogrel resistance: a multicenter randomized prospective study. J Am
Coll Cardiol, 51:1404–1411, 2008.
[25] Bouillon, T., J. Bruhn, L. Radu-Radulescu, C. Andresen, C. Co-
hane and S. Shafer: A Model of the Ventilatory Depressant Potency of
Remifentanil in the Non-Steady State. Anesthesiology, 99:779–787, 2003.
[26] Bouillon, T., J. Bruhn, L. Radu-Radulescu, C. Andresen, C. Co-
hane and S. Shafer: Mixed-effects modeling of the intrinsic ventilatory de-
pressant potency of propofol in the non-steady state. Anesthesiology, 100:240–
250, 2004.
[27] Bouillon, T., J. Bruhn, L. Radu-Radulescu, C. Andresen, T. J.
Shafer, C. Cohane and S. Shafer: Pharmacodynamic interaction be-
tween propofol and remifentanil regarding hypnosis, tolerance of laryngoscopy,
bispectral index, and electroencephalographic approximate entropy. Anesthe-
siology, 100:1353–1372, 2004.
[28] Bouillon, T., J. Bruhn, L. Radu-Radulescu, E. Bertaccini,
S. Park and S. Shafer: Non-steady state analysis of the pharmacokinetic
interaction between propofol and remifentanil. Anesthesiology, 97:1350–1362,
2002.
[29] Bouillon, T., A. Caruso, M. Luginbuehl, M. Morari, P.M. Schu-
macher and E. Zanderigo: A system for controlling administration of
anaesthesia. Patent granted, 2006. Assignee: Universitat Bern and ETH
Zurich. Priority date: 2006-06-21 (EP 20060102702). Publication number:
WO 2007147505.

222 Bibliography
[30] Bouillon, T., C. Schmidt, G. Garstka, D. Heimbach, D. Stafforst,
H. Schwilden and A. Hoeft: Pharmacokinetic-Pharmacodynamic Mod-
eling of the Respiratory Depressant Effect of Alfentanil. Anesthesiology,
91(1):144–155, 1999.
[31] Canet, J., J. Sanchis, A. Zegri, C. Llorente, D. Navajas and
P. Casan: Effects of halothane and isoflurane on ventilation and occlusion
pressure. Anesthesiology, 81:563–571, 1994.
[32] Cardinal, D. C. and R. J. Flower: The electronic aggregometer: a
novel device for assessing platelet behaviour in blood. J Pharmacol Methods,
3:1350–1358, 1980.
[33] Carragee, E. J., C. M. Tanner and B. Yang: False-positive findings on
lumbar discography. Reliability of subjective concordance assessment during
provocative disc injection. Spine, 24:2542–2547, 1999.
[34] Caruso, A., T. Bouillon, P. Schumacher, M. Luginbuehl and
M. Morari: Drug-induced respiratory depression: an integrated model of
drug effects on the hypercapnic and hypoxic drive. In Proc. IEEE EMBS
Annual Int Conf (EMBC07), pages 4259–4263, 2007.
[35] Caruso, A., T. Bouillon, P. Schumacher and M. Morari: On the
modeling of drug induced respiratory depression in the non-steady-state. In
Proc. IEEE EMBS Annual Int Conf, pages 5564–5568, 2008.
[36] Caruso, A., T. Bouillon, P. Schumacher, E. Zanderigo and
M. Morari: Control of drug administration during Monitored Anesthesia
Care. Special Issue on Drug Delivery Automation, IEEE Trans. Autom. Sci.
Eng., 6(2):256–264, 2009.
[37] Caruso, A. and M. Morari: Model predictive control for propofol sedation.
In WC 2009 IFMBE Proc, pages 923–926, 2009.
[38] Caruso, A., G. Sveticic, G. Scharbert, S. A. Kozek-Langenecker,
M. Curatolo and M. Morari: Pharmacodynamic modeling and opti-
mal drug regimen for antiplatelet therapy. In Proc. ISAP Annual Meeting
(ISAP09), 2009.
[39] Caruso, A., G. Sveticic, G. Scharbert, S. A. Kozek-Langenecker,
M. Curatolo and M. Morari: Pharmacodynamic interaction modeling for
optimal drug dosing in antithrombotic therapy. In Proc. ICDDT 2010, 2010.

Bibliography 223
[40] Cashman, J. N. and S. J. Dolin: Respiratory and haemodynamic effects
of acute postoperative pain management: evidence from published data. Br J
Anaesth, 93:212–223, 2004.
[41] Cattaneo, M. and A. Lecchi: Inhibition of the platelet P2Y12 receptor
for adenosine diphosphate potentiates the antiplatelet effect of prostacyclin. J
Thromb Haemost, 5:577–582, 2007.
[42] Charlton, J. E. (editor): Core Curriculum for Professional Education in
Pain. IASP Press, Seattle, 2005.
[43] Charnick, S. B., R. Kawai, J. R. Nedelman, M. Lemaire,
W. Niederberger and H. Sato: Perspectives in Pharmacokinetics. Phys-
iologically Based Pharmacokinetic Modeling as a Tool for Drug Development.
Journal of Pharmacokinetics and Biopharmaceutics, 23(2):217–29, 1995.
[44] Chiari, L., G. Avanzolini and M. Ursino: A Comprehensive Simulator of
the Human Respiratory System: Validation with Experimental and Simulated
Data. Ann Biomed Eng, 25:985–999, 1997.
[45] Coluzzi, F. and C. Mattia: Oxycodone. Pharmacological profile and clini-
cal data in chronic pain management. Minerva Anestesiol, 71:451–460, 2005.
[46] Combes, X., C. Cerf, D. Bouleau, P. Duvaldestin and G. Dhon-
neur: The effects of residual pain on oxygenation and breathing pattern dur-
ing morphine analgesia. Anesth Analg, 90:156–160, 2000.
[47] Cormack, R. S., D. J. C. Cunningham and J. B. L. Gee: The effect
of carbon dioxide on the respiratory response to want of oxygen in man. Q J
Exp Physiol, 42:303–319, 1957.
[48] Cote, C. J., D. A. Notterman, H. W. Karl, J. A. Weinberg and
C. McCloskey: Adverse sedation events in pediatrics: A critical incident
analysis of contributing factors. Pediatrics, 105:805–814, 2000.
[49] Crofford, L. J., M. C. Rowbotham, P. J. Mease, I. J. Russell,
R. H. Dworkin, A. E. Corbin, J. P. Young, L. K. LaMoreaux,
S. A. Martin and U. Sharma: Pregabalin for the treatment of fibromyal-
gia syndrome: results of a randomized, double-blind, placebo-controlled trial.
Arthritis Rheum, 52:1264–1273, 2005.

224 Bibliography
[50] Curatolo, M., S. Petersen-Felix and L. Arendt-Nielsen: Epidural
epinephrine and clonidine: segmental analgesia and effects on different pain
modalities. Anesthesiology, 87:785–794, 1997.
[51] Curatolo, M., T. Schnider, S. Petersen-Felix, S. Weiss,
C. Signer, P. Scaramozzino and A. Zbinden: A direct search procedure
to optimize combinations of epidural bupivacaine, fentanyl, and clonidine for
postoperative analgesia. Anesthesiology, 92:325–337, 2000.
[52] Curatolo, M. and G. Sveticic: Drug combinations in pain treatment: a
review of the published evidence and a method for finding the optimal combi-
nation. Best Pract Res Clin Anaesthesiol, 16:507–519, 2002.
[53] Czapla, M. A. and J. E. Zadina: Reduced suppression of CO2-induced
ventilatory stimulation by endomorphins relative to morphine. Brain Res,
1059(2):159–166, 2005.
[54] Dahan, A., J. Degoede, A. Berkenbosch and I. C. W. Olievier: The
influence of oxygen on the ventilatory response to carbon dioxide in man. J
Physiol, 428:485–499, 1990.
[55] Dahan, A., D. Nieuwenhuijs, E. Olofsen, E. Sarton, R. Romberg
and L. Tepperna: Response Surface Modeling of Alfentanil-Sevoflurane In-
teraction on Cardiorespiratory Control and Bispectral Index. Anesthesiology,
94:982–991, 2001.
[56] Dahan, A., R. Romberg, L. Teppema, E. Sarton, H. Bijl and
E. Olofsen: Simultaneous Measurement and Integrated Analysis of Analge-
sia and Respiration after an Intravenous Morphine Infusion. Anesthesiology,
101:1201–1209, 2004.
[57] Dahan, A., E. Sarton, M. van den Elsen, J. van Kleef, L. Teppema
and A. Berkenbosch: Ventilatory response to hypoxia in humans. Influ-
ences of subanesthetic desflurane. Anesthesiology, 85:60–68, 1996.
[58] de Gaetano, G.: Historical overview of the role of platelets in hemostasis
and thrombosis. Haematologica, 86:349–356, 2001.
[59] Derighetti, M.: Feedback Control in Anaesthesia. Dr. Tech. Sc. Thesis,
Swiss Federal Institue of Technology (ETH), Zurich, Switzerland, 1999.

Bibliography 225
[60] Deyo, R. A., D. Cherkin, D. Conrad and E. Volinn: Cost, controversy,
crisis: low back pain and the health of the public. Annual Review Of Public
Health, 12:141–156, 1991.
[61] Downs, J. B.: Has oxygen administration delayed appropriate respiratory
care? Fallacies regarding oxygen therapy. Respir Care, 48:611–620, 2003.
[62] Drake, L. M., S. C. Chen and D. K. Rex: Efficacy of bispectral moni-
toring as an adjunct to nurse-administered propofol sedation for colonoscopy:
a randomized controlled trial. Am J Gastroenterol, 101(9):2003–2007, 2006.
[63] Drummond, G. B. and G. R. Park: Arterial Oxygen-Saturation Before
Intubation of the Trachea - An Assessment of Oxygenation Techniques. Br J
Anaest, 56:987–993, 1984.
[64] Duffin, J.: Role of acid-base balance in the chemoreflex control of breathing.
J Appl Physiol, 99:2255–2265, 2005.
[65] Duranti, R., T. Pantaleo, F. Bellini, F. Bongianni and G. Scano:
Respiratory Responses Induced by the Activation of Somatic Nociceptive Af-
ferents in Humans. Journal of Applied Physiology, 71(6):2440–2448, 1991.
[66] Durbin, C. G.: Respiratory Therapists and Conscious Sedation. Respiratory
Care, 44(8), 1999.
[67] Dworkin, R. H., D. C. Turk and J. T. Farrar: Core outcome measures
for chronic pain clinical trials: Impact recommendations. Pain, 113:9–19,
2005.
[68] Eastwood, P. R., P. R. Platt, K. Shepherd, K. Maddison and D. R.
Hillman: Collapsibility of the upper airway at different concentrations of
propofol anesthesia. Anesthesiology, 103:470–477, 2005.
[69] Eger, E. I., W. M. Dolan, W. C. Stevens, R. D. Miller and W. L.
Way: Surgical Stimulation Antagonizes the Respiratory Depression Produced
by Forane. Anesthesiology, 36(6):544–549, 1972.
[70] Ellerkmann, R. K., V. M. Liermann, T. M. Alves, I. Wenningmann,
S. Kreuer, W. Wilhelm, H. Roepcke, A. Hoeft and J. Bruhn: Spec-
tral entropy and bispectral index as measures of the electroencephalographic
effects of sevoflurane. Anesthesiology, 101:1275–1282, 2004.

226 Bibliography
[71] Ellerkmann, R. K., M. Soehle, T. M. Alves, V. M. Liermann,
I. Wenningmann, H. Roepcke, S. Kreuer, A. Hoeft and J. Bruhn:
Spectral entropy and bispectral index as measures of the electroencephalo-
graphic effects of propofol. Anesth Analg, 102:1456–1462, 2006.
[72] Elsen, M. van den, A. Dahan, J. DeGoede, A. Berkenbosch and
J. van Kleef: Influences of Subanesthetic Isoflurane on Ventilatory Control
in Humans. Anesthesiology, 83:478–490, 1995.
[73] Elsen, M. van den, E. Sarton, L. Teppema, A. Berkenbosch and
A. Dahan: Influence of 0.1 minimum alveolar concentration of sevoflurane,
desflurane and isoflurane on dynamic ventilatory response to hypercapnia in
humans. Br J Anaesth, 80:174–182, 1998.
[74] Ernest, C. S., D. S. Small, S. Rohatagi, D. E. Salazar, L. Wal-
lentin, K. J. Winters and R. E. Wrishko: Population pharmacokinetics
and pharmacodynamics of prasugrel and clopidogrel in aspirin-treated patients
with stable coronary artery disease. J Pharmacokinet Pharmacodyn, 35:593–
618, 2008.
[75] Fisher, D. M.: The direct search procedure: a new approach to evaluating
clinical regimens. Anesthesiology, 92:301–303, 2000.
[76] Fitzgerald, R. S. and D. C. Parks: Effect of Hypoxia on Carotid
Chemoreceptor Response to Carbon Dioxide in Cats. Respiration Physiol-
ogy, 12:218–229, 1971.
[77] Frank, P. M.: Fault diagnosis in dynamic systems using analytical and
knowledge-based redundancy: a survey and some new results. Automatica,
26:459–474, 1990.
[78] Fraser, G. L. and R. R. Riker: Bispectral index monitoring in the inten-
sive care unit provides more signal than noise. Pharmacotherapy, 25:19S–27S,
2005.
[79] Frei, C. W.: Fault Tolerant Control Concepts Applied to Anesthesia.
Dr. Tech. Sc. Thesis, Swiss Federal Institue of Technology (ETH), Zurich,
Switzerland, 2000.
[80] Freynhagen, R., K. Strojek, T. Griesing, E. Whalen and
M. Balkenohl: Efficacy of pregabalin in neuropathic pain evaluated in

Bibliography 227
a 12-week, randomised, double-blind, multicentre, placebo-controlled trial of
flexible- and fixed-dose regimens. Pain, 115:254–263, 2005.
[81] Fuhrman, T. M., W. D. Pippin, L. A. Talmage and T. E. Reilley:
Evaluation of collateral circulation of the hand. J Clin Monit, 8:28–32, 1992.
[82] Gammaitoni, A. R., B. S. Galer, P. Lacouture, J. Domingos and
T. Schlagheck: Effectiveness and safety of new oxycodone/acetaminophen
formulations with reduced acetaminophen for the treatment of low back pain.
Pain Med, 4:21–30, 2003.
[83] Gentilini, A. L.: Feedback Control of Hypnosis and Analgesia in Humans.
Dr. Tech. Sc. Thesis, Swiss Federal Institue of Technology (ETH), Zurich,
Switzerland, 2001.
[84] Ghisi, D., A. Fanelli, M. Tosi, M. Nuzzi and G. Fanelli: Monitored
anesthesia care. Minerva Anestesiol, 71(9):533–538, 2005.
[85] Glass, P. S., D. Hardman, Y. Kamiyama, T. J. Quill, G. Marton,
K. H. Donn, C. M. Grosse and D. Hermann: Preliminary pharmacoki-
netics and pharmacodynamics of an ultra-short-acting opioid: remifentanil.
Anesth Analg, 77(5):1031–1040, 1993.
[86] Glynn, C. J., J. W. Lloyd and S. Folkhard: Ventilatory Response to
Intractable Pain. Pain, 11:201–211, 1981.
[87] Gordois, A., P. Scuffham, A. Shearer, A. Oglesby and J. A. To-
bian: The health care costs of diabetic peripheral neuropathy in the US. Di-
abetes Care, 26:1790–1795, 2003.
[88] Grodins, F. S., J. S. Gray, K. R. Schroeder, A. L. Norins and
R. W. Jones: Respiratory responses to CO2 inhalation; a theoretical study
of a nonlinear biological regulator. Journal of Applied Physiology, 7(3):283–
308, 1954.
[89] Grodins, F.S., J. Buell and A. J. Bart: Mathematical analysis and
digital simulation of the respiratory control system. Journal of Applied Phys-
iology, 22(2):260–276, 1967.
[90] Gross, J. B. et al.: Practice Guidelines for Sedation and Analgesia by Non-
Anesthesiologists. Anesthesiology, 84(2):459–471, 1996.

228 Bibliography
[91] Gurbel, P. and U. Tantry: Selecting optimal antiplatelet therapy based on
platelet function monitoring in patients with coronary artery disease. Treat-
ment Option Cardiovasc Med, 11:22–32, 2009.
[92] Guyton, A. C. and J. E. Hall: Textbook of medical physiology. W. B.
Saunders Company, Philadelphia, PA, 1999.
[93] Hale, M. E., C. Dvergsten and J. Gimbel: Efficacy and safety of oxy-
morphone extended release in chronic low back pain: results of a randomized,
double-blind, placebo- and active-controlled phase III study. J Pain, 6:21–28,
2005.
[94] Hartwich, V., P. Schumacher, A. Caruso and M. Luginbuehl: Dy-
namical Properties of a new Transcutaneous Carbon Dioxide Sensor. Anes-
thesiology, 111: A1469, 2009.
[95] Herren-Gerber, R., S. Weiss and L. Arendt-Nielsen: Modulation of
central hypersensitivity by nociceptive input in chronic pain after whiplash
injury. Pain Med, 5:366–376, 2004.
[96] Hetrick, D. M., A. M. Jarabek and C. C. Travis: Sensitivity analysis
for physiologically based pharmacokinetic models. Journal of Pharmacokinet-
ics and Biopharmaceutics, 19(1):1–20, 1991.
[97] Heuss, L. T., P. N. Chhajed, P. Schnieper, T. Hirt and
C. Beglinger: Combined Pulse Oximetry / Cutaneous Carbon Dioxide Ten-
sion Monitoring during Colonoscopies: Pilot Study with a Smart Ear Clip.
Digestion, 70:152158, 2004.
[98] Heuss, L. T., J. Drewe, P. Schnieper, C. B. Tapparelli, E. Pflimlin
and C. Beglinger: Patient-controlled versus Nurse-administered sedation
with propofol during colonoscopy. A prospective randomized trial. Am J Gas-
troenterol, 99:511–518, 2004.
[99] Heuss, L. T., F. Froehlich and C. Beglinger: Changing patterns of
sedation and monitoring practice during endoscopy: Results of a nation wide
survey in Switzerland. Endoscopy, 37:161–166, 2005.
[100] Heuss, L. T., P. Schnieper, J. Drewe, E. Pflimlin and C. Beglinger:
Risk stratification and safe administration of propofol by registered nurses
supervised by the gastroenterologist: a prospective observational study of more
than 2000 cases. Gastrointest Endosc, 57:664–671, 2003.

Bibliography 229
[101] Heuss, L. T., P. Schnieper, J. Drewe, E. Pflimlin and C .Beglinger:
Safety of propofol for conscious sedation during endoscopic procedures in high-
risk patients - A prospective, controlled study. Am J Gastroenterol, 98:1751–
1757, 2003.
[102] Heuss, L. T., P. Schnieper, E. Pflimlin and C. Beglinger: Nurse-
administered sedation with propofol under observation of the endoscopist: A
prospective observation study with more than 5000 patients. Gastrointest En-
dosc, 57:AB105, 2003.
[103] Holas, A., P. Krafft, M. Marcovic and F. Quehenberger: Remifen-
tanil, propofol or both for conscious sedation during eye surgery under regional
anaesthesia. Eur. J. Anaesthesiol., 16:741–748, 1999.
[104] Irwin, M. G., R. D. Jones, A. R. Visram and G. N. Kenny: Patient-
controlled alfentanil. Target-controlled infusion for postoperative analgesia.
Anaesthesia, 51:427–30, 1996.
[105] Jambor, C., C. F. Weber, K. Gerhardt, W. Dietrich, M. Spannagl,
B. Heindl and B. Zwissler: Whole blood multiple electrode aggregometry
is a reliable point-of-care test of aspirin-induced platelet dysfunction. Anesth
Analg, 109:25–31, 2009.
[106] Johansen, J. W.: Update on bispectral index monitoring. Best Pract Res
Clin Anaesthesiol, 20(1):81–99, 2006.
[107] Kalb, M. L., L. Potura, G. Scharbert and S. A. Kozek-
Langenecker: The effect of ex vivo anticoagulants on whole blood platelet
aggregation. Platelets, 20:7–11, 2009.
[108] Kanazi, G. E., R. W. Johnson and R. H. Dworkin: Treatment of
postherpetic neuralgia: an update. Drugs, 59:1113–1126, 2000.
[109] Kim, H. J., Y. M. Yoon and K. N. Park: The changes in electrolytes
and acid-base balance after artificially induced acute diarrhea by laxatives. J
Korean Med Sci, 9(5):388–393, 1994.
[110] King, S. B., S. C. Smith and J. W. Hirshfeld et al.: 2007 focused
update of the ACC/AHA/SCAI 2005 guideline update for percutaneous coro-
nary intervention: a report of the American College of Cardiology/American
Heart Association Task Force on Practice guidelines. J Am Coll Cardiol,
51:172–209, 2008.

230 Bibliography
[111] Klaveren, R. J. van and M. Demedts: A mathematical and physiological
evaluation of the different hypoxic response models in normal man. Respir
Physiol, 113:123–133, 1998.
[112] Knill, R. L., H. T. Kieraszewicz, B. G. Dogson and J. L. Clement:
Chemical regulation of ventilation during isoflurane sedation and anaesthesia
in humans. Can Anaesth Soc J, 30:607–614, 1983.
[113] Kocher, S., R. Rohling and A. Tschupp: Performance of a digital
PCO2/SpO2
ear sensor. J Clin Monit Comput, 18:75–79, 2004.
[114] Koehler, R. C., R. J. Traystman and J. M. Douglas: Influence of
reduced oxyhemoglobin affinity on cerebrovascular response to hypoxic hypoxia.
Am J Physiol, 251:H756–H763, 1986.
[115] Kvien, T. K. and K. Viktil: Pharmacotherapy for regional musculoskeletal
pain. Best Pract Res Clin Rheumatol, 17:137–150, 2003.
[116] La Spada, A. R., B. S. Skalhegg, R. Henderson, G. Schmer,
R. Pierce and W. Chandler: Brief report: fatal hemorrhage in a patient
with an acquired inhibitor of human thrombin. N Engl J Med, 333(8):494–497,
1995.
[117] Ladas, S. D., L. Aabakken and J. F. Rey et al.: Use of sedation for
routine diagnostic upper gastrointestinal endoscopy: A European Society of
Gastrointestinal Endoscopy survey of National Endoscopy Society members.
Digestion, 74:69–77, 2006.
[118] LeBlanc, J. M., J. F. Dasta and S. L. Kane-Gill: Role of the bispectral
index in sedation monitoring in the ICU. Ann Pharmacother, 40(3):490–500,
2006.
[119] Levine, M., J. P. Cleave and C. Dodds: Can periodic breathing have
advantages for oxygenation? Journal of Theoretical Biology, 172(4):355–368,
1995.
[120] Levine, M. N., G. Raskob, S. Landefeld and C. Kearon: Hemorrhagic
Complications of Anticoagulant Treatment. Chest, 119:108S–121S, 2001.
[121] Lim, T. A. and K. Inbasegaran: Predicted Effect Compartment Concen-
tration of Thiopental at Loss of Eyelash Reflex. Br J Anaesth, 86:422–424,
2001.

Bibliography 231
[122] Litman, R. S.: Conscious sedation with remifentanil during painful medical
procedures. J Pain Symptom Manage, 19:468–471, 2000.
[123] Lloyd, B. B., M. G. M. Jukes and D. J. C. Cunningham: The rela-
tion between alveolar oxygen pressure and the respiratory response to carbon
dioxide in man. Q J Exp Physiol, 43:214–227, 1958.
[124] Loeppky, J. A., E. R. Fletcher, R. C. Roach RC and U. C. Luft:
Relationship between whole blood base excess and CO2 content in vivo. Res-
piration Physiology, 94(1):109–120, 1993.
[125] Loscalzo, J. and A. I. Schafer: Thrombosis and hemorrhage. Lippincott
Williams & Wilkins, 2002.
[126] Ludden, T. M., W. R. Gillespie and W. J. Bachmann: Commentary
on Physiologically Based Pharmacokinetic Modeling as a Tool for Drug Devel-
opment. Journal of Pharmacokinetics and Biopharamceutics, 23(2):231–235,
1995.
[127] Luginbuehl, M., A. Gerber, T. W. Schnider, S. Petersen-Felix,
L. Arendt-Nielsen and M. Curatolo: Modulation of Remifentanil-
Induced Analgesia, Hyperalgesia, and Tolerance by Small-Dose Ketamine in
Humans. Anesth Analg, 96:726–732, 2003.
[128] Maeder, U. and M. Morari: Offset-free reference tracking for predictive
controllers. In Proc. IEEE Conf on Decision and Control, 2007.
[129] Magosso, E., M. Ursino and J. H. Van Oostrom: Opioid-Induced Res-
piratory Depression: A Mathematical Model for Fentanyl. IEEE Trans. Biom.
Eng., 51:1115–1128, 2004.
[130] Mahla, E., M. Antonino, U. Tantry and P. Gurbel: Point-of-care
platelet function analysis. J Am Coll Cardiol, 53(10):857–859, 2009.
[131] Manickam, N., X. Sun, K. W. Hakala, S. T. Weintraub and D. W.
Essex: Thiols in the αIIbβ3 integrin are necessary for platelet aggregation.
Br J Haematol, 142:457465, 2008.
[132] Marsh, B., M. White, N. Morton and G. N. C. Kenny: Pharmacoki-
netic model driven infusion of propofol in children. Br J Anaest, 67:41–48,
1991.

232 Bibliography
[133] McPherson, R. W., D. Eimerl and R. J. Traystman: Interaction
of hypoxia and hypercapnia on cerebral hemodynamics and brain electrical
activity in dogs. Am J Physiol, 253:H890–H897, 1987.
[134] McPherson, R. W., R. C. Koehler and R. J. Traystman: Hypoxia,
α2-adrenergic, and nitric oxide-dependent interactions on canine cerebral
blood flow. Am J Physiol, 266:H476–H482, 1994.
[135] Merskey, H. and N. Bogduk: Classification of chronic pain. Descriptions
of chronic pain syndromes and definitions of pain terms (2nd ed.). IASP
Press, Seattle, 1994.
[136] Meyer-Rosberg, K, A Kvarnstrom, E Kinnman, T Gordh, L O
Nordfors and A Kristofferson: Peripheral neuropathic pain–a multidi-
mensional burden for patients. Eur J Pain, 5:379–389, 2001.
[137] Mildh, L. H., H. Scheinin and O. A. Kirvela: The Concentration-Effect
Relationship of the Respiratory Depressant Effects of Alfentanil and Fentanyl.
Anesth Analg, 93:939–946, 2001.
[138] Miller, A. and J. Rabe-Jablonska: The effectiveness of antidepressants
in the treatment of chronic non-cancer pain - a review. Psychiatr Pol, 39:21–
32, 2005.
[139] Minto, C. F. et al.: Influence of Age and Gender on the Pharmacokinetics
and Pharmacodynamics of Remifentanil: I. Model Development. Anesthesi-
ology, 86(1):10–23, 1997.
[140] Minto, C. F., T. W. Schnider, T. G. Short, K. M. Gregg, A. Gen-
tilini and S. L. Shafer: Response surface model for anesthetic drug inter-
actions. Anesthesiology, 92:1603–1616, 2000.
[141] Mizushima, A., A. Nakamura, S. Katashima, Y. Kawauchi and
Y. Kamiyama: Clinical Evaluation of a New Combined Transcutaneous Car-
bon Dioxide Tension and Pulse Oximetry Sensor in Adult Patients Undergoing
Laparoscopic Surgery. Anesthesiology, 101:A563, 2004.
[142] Mohan, R. and J. Duffin: The effect of hypoxia on the ventilatory response
to carbon dioxide in man. Respir Physiol, 108:101–115, 1997.
[143] Moore, R. A. and H. J. McQuay: Prevalence of opioid adverse events in
chronic non-malignant pain: systematic review of randomised trials of oral
opioids. Arthritis Res Ther, 7:R1046–1051, 2005.

Bibliography 233
[144] Morgan., G. E., M. S. Mikhail and M. J. Murray: Clinical Anesthe-
siology. McGraw-Hill, 2002.
[145] Murugappa, S. and S. P. Kunapuli: The role of ADP receptors in platelet
function. Front Biosci, 11:1977–1986, 2006.
[146] Muske, K. R. and T. A. Badgwell: Disturbance models for offset-free
linear model predictive control. J Process Contr, 12:617–32, 2002.
[147] Nestorov, I. A., L. J. Aarons, P. A. Arundel and M. Rowland:
Lumping of Whole-Body Physiologically Based Pharmacokinetic Models. Jour-
nal of Pharmacokinetics and Biopharmaceutics, 26(1):21–46, 1998.
[148] Nielsen, M. and H. Smith: Studies on the regulation of respiration in acute
hypoxia. Acta Physiol Scand, 24:293–313, 1951.
[149] Nieuwenhuijs, D., E. Sarton, L. Teppema and A. Dahan: Propofol for
Monitored Anesthesia Care: Implications on Hypoxic Control of Cardiorespi-
ratory Responses. Anesthesiology, 92:46–54, 2000.
[150] Nieuwenhuijs, D. J., E. Olofsen, R. R. Romberg, E. Sarton,
D. Ward, F. Engbers, J. Vuyk, R. Mooren, L. J. Teppema and
A .Dahan: Response surface modeling of remifentanil-propofol interaction
on cardiorespiratory control and bispectral index. Anesthesiology, 98:312–w22,
2003.
[151] Nikles, C. J., M. Yelland, P. P. Glasziou and C. Del Mar: Do
individualized medication effectiveness tests (n-of-1 trials) change clinical de-
cisions about which drugs to use for osteoarthritis and chronic pain? Am J
Ther, 12:92–97, 2005.
[152] Novak, L. C.: ASA Updates its Position on Monitored Anesthesia Care.
American Society of Anesthesiologists Newsletter, 62(12), 1998.
[153] Nunn, J. F.: Nunn’s Applied Respiratory Physiology. Butterworth-
Heinemann, Stoneham (Massachussetts), 1993.
[154] Pannocchia, G. and J. B. Rawlings: Disturbance models for offset-free
model-predictive control. AIChE Journal, 49(2):426–437, 2003.
[155] Patrick, W., K. Webster, A. Puddy, R. Sanii and M. Younes: Res-
piratory response to CO2 in the hypocapnic range in awake humans. J Appl
Physiol, 79:2058–2068, 1995.

234 Bibliography
[156] Patrono, C., C. Baigent, J. Hirsh and G. Roth: Antiplatelet drugs:
American College of Chest Physicians Evidence-Based Clinical Practice
Guidelines (8th Edition). Chest, 133:199S233S, 2008.
[157] Pavlin, D. J., B. Coda, D. D. Shen, J. Tschanz, Q. Nguyen,
R. Schaffer, G. Donaldson and R. C. Jacobson amd C. R. Chap-
man: Effects of combining propofol and alfentanil on ventilation, analgesia,
sedation, and emesis in human volunteers. Anesthesiology, 84:23–37, 1996.
[158] Pellis, T., J. Bisera, W. Tang and M. H. Weil: Expanding automatic
external defibrillators to include automated detection of cardiac, respiratory,
and cardiorespiratory arrest. Critical Care Medicine, 30(4) Supplement: S176-
S178, 2002.
[159] Peng, B., W. Wu and S. Hou: The pathogenesis of discogenic low back
pain. J Bone Joint Surg Br, 87:62–67, 2005.
[160] Rebuck, A. S. and W. E. Woodley: Ventilatory effects of hypoxia and
their dependence on PCO2. J Appl Physiol, 38:16–19, 1975.
[161] Reder, R. F., B. Oshlack, J. B. Miotto, D. D. Benziger and R. F.
Kaiko: Steady-state bioavailability of controlled-release oxycodone in normal
subjects. Clin Ther, 18:95–105, 1996.
[162] Remy, C., E. Marret and F. Bonnet: Effects of acetaminophen on mor-
phine side-effects and consumption after major surgery: meta-analysis of ran-
domized controlled trials. Br J Anaesth, 94:505–513, 2005.
[163] Sa Rego, M. M., M. F. Watcha and P. F. White: The changing role of
Monitored Anesthesia Care in the ambulatory setting. Anesth Analg, 85:1020–
1036, 1997.
[164] Saarto, T. and P. J. Wiffen: Antidepressants for neuropathic pain.
Cochrane Database Syst Rev, page CD005454, 2005.
[165] Sachs, B. L., H. Vanharanta and M. A. Spivey: Dallas discogram
description. A new classification of CT/discography in low-back disorders.
Spine, 12:287–294, 1987.
[166] Sarton, E., A. Dahan, L. Teppema, A. Berkenbosch, M. Van Den
Elsen and J. Van Kleef: Influence of Acute Pain Induced by Activation
of Cutaneous Nociceptors on Ventilatory Control. Anesthesiology, 87(2):289–
296, 1997.

Bibliography 235
[167] Sarton, E., L. Teppema and A. Dahan: Sex differences in morphine-
induced ventilatory depression reside within the peripheral chemoreflex loop.
Anesthesiology, 7:59–66, 1999.
[168] Savoia, G., M. Loreto, E. Gravino, G. Canfora, A. Frangiosa,
P. Cortesano and F. Russo: Monitored anesthesia care and loco-regional
anesthesia. Vascular surgery use. Minerva Anestesiol, 71(9):539–542, 2005.
[169] Schnider, T. W., C. F. Minto, P. L. Gambus, C. Andresen, D. B.
Goodale, S. L. Shafer and E. Youngs: The Influence of Method of
Administration and Covariates on the Pharmacokinetics of Propofol in Adult
Volunteers. Anesthesiology, 88:1170–1182, 1998.
[170] Schumacher, P., A. Caruso, V. Hartwich, M. Luginbuehl and
T. Bouillon: Dynamic properties of a new transcutaneous CO2 sensor:
fast enough for early detection of apnea? Anesthesiology, 105:A477, 2006.
[171] Servin, F. S., J. C. Raeder, J. C. Merle, M. Wattwil, A. L. Hanson,
M. H. Lauwers, A. Aitkenhead, J. Marty, K. Reite, S. Martisson
and L. Wostyn: Remifentanil sedation compared with propofol during re-
gional anaesthesia. Acta Anaesthesiol Scand, 46:309–315, 2002.
[172] Shapiro, A., E. Zohar, R. Zaslansky, D. Hoppenstein, S. Shabat
and B. Fredman: The frequency and timing of respiratory depression in
1524 postoperative patients treated with systemic or neuraxial morphine. J
Clin Anesth, 17:537–542, 2005.
[173] Sheiner, L. B., D. R. Stanski, S. Vozeh, R. D. Miller and J. Ham:
Simultaneous Modeling of Pharmacokinetics and Pharmacodynamics: Appli-
cation to D-tubocurarine. Clin Pharmacol Ther, 25(3):358–371, 1979.
[174] Smith, W. D., R. C. Dutton and N. T. Smith: Measuring the perfor-
mance of anesthetic depth indicators. Anesthesiology, 84:38–51, 1996.
[175] Soto, R. G., E. S. Fu, H. Vila Jr and R. V. Miguel: Capnography
accurately detects apnea during monitored anesthesia care. Anesth Analg,
99:379–382, 2004.
[176] Spencer, J. L., E. Firouztale and R. B. Mellins: Computational Ex-
pressions for Blood Oxygen and Carbon Dioxide Concentration. Ann Biomed
Eng, 90(5):1329–1338, 1979.

236 Bibliography
[177] Srinivasan, S., F. Mir, J. S. Huang, F. T. Khasawneh, S. C. Lam
and G. C. Le Breton: The P2Y12 antagonists, 2-methylthioadenosine
5’-monophosphate triethylammonium salt and cangrelor (ARC69931MX),
can inhibit human platelet aggregation through a Gi-independent increase in
cAMP levels. J Biol Chem, 284:16108–16117, 2009.
[178] Stadler, K. S.: Modelling and Control in Anaesthesia from Design to Val-
idation. Dr. Tech. Sc. Thesis, Swiss Federal Institue of Technology (ETH),
Zurich, Switzerland, 2003.
[179] Stahl, S. M.: Anticonvulsants and the relief of chronic pain: pregabalin and
gabapentin as alpha(2)delta ligands at voltage-gated calcium channels. J Clin
Psychiatry, 65:596–597, 2004.
[180] Stoeckel, H., J. Schuttler, H.Magnussen and J. H. Hengstmann:
Plasma fentanyl concentrations and the occurrence of respiratory depression
in volunteers. Br J Anaesth, 54:1087–1095, 1982.
[181] Sveticic, G., A. Caruso, G. Scharbert, M. Curatolo, S. A. Kozek-
Langenecker and M. Morari: Determining optimal drug regimen for
antiplatelet therapy using a novel drug interaction model. In preparation, to
be submitted to Anesthesiology, 2009.
[182] Sveticic, G., A. Gentilini, U. Eichenberger, M. Luginbuhl and
M. Curatolo: Combinations of morphine with ketamine for patient-
controlled analgesia: a new optimization method. Anesthesiology, 98:1195–
1205, 2003.
[183] Sveticic, G., A. Gentilini, U. Eichenberger, E. Zanderigo, V. Sar-
tori, M. Luginbuhl and M. Curatolo: Combinations of bupivacaine,
fentanyl, and clonidine for lumbar epidural postoperative analgesia: a novel
optimization procedure. Anesthesiology, 101:1381–1393, 2004.
[184] Swanson, G. D. and J. W. Bellville: Hypoxic-hypercapnic interaction
in human respiratory control. J Appl Physiol, 36:480–7, 1974.
[185] Swanson, G. D. and J. W. Bellville: Step changes in end-tidal CO2:
methods and implications. J Appl Physiol, 39:377–385, 1975.
[186] Takahashi, E. and K. Doi: Destabilization of the respiratory control by
hypoxic ventilatory depressions: a model analysis. Japanese Journal of Phys-
iology, 43(5):599–612, 1993.

Bibliography 237
[187] Teppema, L. J., R. R. Romberg and A. Dahan: Antioxidants Re-
verse Reduction of the Human Hypoxic Ventilatory Response by Subanesthetic
Isoflurane. Anesthesiology, 102:747–753, 2005.
[188] The Stroke Prevention in Atrial Fibrillation Investigators:
Bleeding During Antithrombotic Therapy in Patients With Atrial Fibrillation.
Arch Intern Med, 156:409–416, 1996.
[189] Tonner, P. H., A. Paris and J. Scholz: Monitoring consciousness in
intensive care medicine. Best Pract Res Clin Anaesthesiol, 20(1):191–200,
2006.
[190] Tonner, P. H., C. Wei, B. Bein, N. Weiler, A. Paris and J. Scholz:
Comparison of two bispectral index algorithms in monitoring sedation in post-
operative intensive care patients. Crit Care Med, 33:580–584, 2005.
[191] Tremont-Lukats, I. W., C. Megeff and M. M. Backonja: Anticon-
vulsants for neuropathic pain syndromes: mechanisms of action and place in
therapy. Drugs, 60:1029–1052, 2000.
[192] Tschupp, A. and S. Fanconi: A combined ear sensor for pulse oximetry
and carbon dioxide tension monitoring: accuracy in critically ill children.
Anesth Analg, 96(1):82–84, 2003.
[193] Tucker, G. T.: Pharmacokinetic and Pharmacodynamic Models. Advances
in Pain Research and Therapy, 14:181–201, 1990.
[194] Ulatowski, J. A., E. Bucci, A. Razynska, R. J. Traystman and
R. C. Koehler: Cerebral blood flow during hypoxic hypoxia with plasma-
based hemoglobin at reduced hematocrit. Am J Physiol, 274:H1933–H1942,
1998.
[195] Ursino, M., E. Magosso and G. Avanzolini: An Integrated Model of
the Human Ventilatory Control System: The Response to Hypercapnia. Clin
Physiol, 21(4):447–464, 2001.
[196] Ursino, M., E. Magosso and G. Avanzolini: An Integrated Model of
the Human Ventilatory Control System: The Response to Hypoxia. Clinical
Physiology, 21(4):465–477, 2001.
[197] van Giezen, J. J. and R. G. Humphries: Preclinical and clinical studies
with selective reversible direct P2Y12 antagonists. Semin Thromb Hemost,
31:195–204, 2005.

238 Bibliography
[198] Vinik, A.: Use of antiepileptic drugs in the treatment of chronic painful
diabetic neuropathy. J Clin Endocrinol Metab, 90:4936–4945, 2005.
[199] Wagner, J. G.: Kinetics of pharmacological response. Journal of Theoreti-
cal Biology, 20:173–201, 1968.
[200] Wakeling, H. G., J. B. Zimmerman, S. Howell and P. S. A. Glass:
Targeting Effect Compartment or Central Compartment Concentration of
Propofol: What Predicts Loss of Consciousness? Anesthesiology, 90(1):92–
97, 1999.
[201] Ward, D. S. and S. Karan: Effects of pain and arousal on the control of
breathing. J Anesth, 16:216–221, 2002.
[202] Ware, J. E. J.: SF-36 Health Survey: manual and interpretation guide.
The Health Institute, New England Medical Center, Boston, 1993.
[203] Weil, J. V., E. Byrne-Quinn, I. E. Sodal, W. O. Friesen, B. Un-
derhill, G. F. Filley and R. F. Grover: Hypoxic ventilatory drive in
normal man. J Clin Invest, 49:1061–1072, 1970.
[204] Weinger, M. B.: Dangers of postoperative opioids. APSF Newsletter,
21:61–67, 2006.
[205] Weiss, M.: Modelling of Initial Distribution of Drugs Following Intravenous
Bolus Injection. European Journal of Clinical Pharmacology, 24:121–126,
1983.
[206] Yassen, A., E. Olofsen, R. Romberg, E. Sarton, L. Teppema,
M. Danhof and A. Dahan: Mechanism-based PK/PD Modeling of the
Respiratory Depressant Effect of Buprenorphine and Fentanyl in Healthy Vol-
unteers. Clin Pharmacol Ther, 81:50–58, 2007.
[207] Yasuda, N., S. H. Lockhart, E. I. Eger, R. B. Weiskopf, B. H.
Johnson, B. A. Freire and A. Fassoulaki: Kinetics of Desflurane,
Isoflurane and Halothane in Humans. Anesthesiology, 74:489–498, 1991.
[208] Zanderigo, E., V. Sartori, G. Sveticic, T. Bouillon, P. Schu-
macher, M. Morari and M. Curatolo: The well-being model: a new drug
interaction model for positive and negative effects. Anesthesiology, 104:742–
753, 2006.

Curriculum Vitae
Personal Data
Name Antonello Caruso
Date of Birth April 25, 1981
Place of Birth Milan, Italy
Nationality Italian
Marital Status Single
Education
1/2006 - 12/2009 PhD Student: Automatic Control Laboratory, ETH Zurich,
Switzerland.
Research areas: Modeling, control, and optimization for anes-
thesia pharmacology and personalized drug dosing.
Supervisor: Prof. Manfred Morari.
2005-2007 Postgraduate Diploma of Advanced Studies in Applied Statis-
tics, ETH Zurich, Switzerland.
2000-2005 Bachelor and Master in Biomedical Engineering: Politecnico di
Milano, Italy.
2003-2004 Visiting Erasmus student at Lulea University of Technology,
Sweden
1998-2000 International Baccalaureate Diploma Programme: United World
College of the Adriatic, Duino (TS), Italy.
1995-2008 High School: Liceo Scientifico Statale ”Vittorio Veneto”, Milan,
Italy.
Experience
1/2006 - 12/2009 ETH Zurich, Switzerland: Researcher at the Automatic
239

240 Curriculum Vitae
Control Laboratory: Creation of drug delivery technology IP
and commercialization via a licensing deal.
1/2006 - 12/2009 ETH Zurich, Switzerland: Teaching Assistant: Laboratory
experiments on control design, MatLab courses.
7/2002 - 9/2002 De Marchi Hospital, Milan, Italy: Internship at the Hos-
pital’s Biomedical Technology Laboratory.
Languages
Italian Native language
English International Baccalaureate (I.B.) bilingual diploma
Spanish Excellent
German Fair
Publications
Intellectual property
A. Caruso, T. Bouillon, M. Luginbuhl, M. Morari, P.M. Schumacher, E. Zan-
derigo, ”A system for controlling administration of anaesthesia,” Patent number:
WO 2007147505, Assignee: ETH Zurich and Bern University; June 2006.
Journal papers
A. Caruso, T. Bouillon, P.M. Schumacher, E. Zanderigo, M. Morari, ”Control
of drug administration during Monitored Anesthesia Care,” Special Issue on Drug
Delivery Automation, IEEE Transactions on Automation Science and Engineering
6(2), pp. 256-264, Apr 2009.
A. Konig, A. Caruso, M. Bolliger, L. Somaini, H. Vallery, M. Morari, R. Riener,
”Model-based heart rate control during Lokomat walking,” Special Issue on Reha-
bilitation via Bio-Cooperative Control of Biomechanics, Physiology and Presence,

241
IEEE Transactions on Neural Systems and Rehabilitation Engineering, submitted
for review.
G. Sveticic, A. Caruso, G. Scharbert, M. Curatolo, S.A. Kozek-Langenecker, M.
Morari, ”Pharmacodynamic interaction modelling and optimal drug regimen for
anticoagulation therapy,” Anesthesiology, in preparation.
International Conferences
A. Caruso, M. Morari, ”Model based closed-loop control of propofol sedation
using transcutaneous CO2 as target variable,”Anesthesiology 111:A1057; ASA An-
nual Meeting, New Orleans, Oct 2009.
V. Hartwich, P.M. Schumacher, A. Caruso, M. Luginbuhl, ”Dynamical properties
of a new transcutaneous carbon dioxide sensor,” Anesthesiology 111:A1469; ASA
Annual Meeting, New Orleans, Oct 2009.
A. Caruso, M. Morari, ”Model predictive control for propofol sedation,” IFMBE
Proceedings, vol. 25, pp. 923-926; World Congress on Medical Physics and Biomed-
ical Engineering, Munich, Sep 2009.
A. Caruso, P.M. Schumacher, M. Morari, T. Bouillon, ”Simultaneous modeling
of drug induced hypercarbia and hypoventilation in the nonsteady state,” Anesthe-
siology 109:A15; ASA Annual Meeting, Orlando, Oct 2008.
A. Caruso, P.M. Schumacher, M. Morari, ”A novel direct search method for
the optimization of multiple-drug regimens for pain treatment,” Anesthesiology
109:A1471; ASA Annual Meeting, Orlando, Oct 2008.
A. Caruso, T. Bouillon, P.M. Schumacher, M. Morari, ”On the modeling of drug
induced respiratory depression in the non-steady-state,” Conf Proc IEEE Eng Med
Biol Soc 2008, pp. 5564-5568; 30th IEEE EMBC, Vancouver, Aug 2008.
A. Caruso, P.M. Schumacher, M. Luginbuhl, M. Morari, T. Bouillon, ”A parsi-
monious model integrating drug effect on the hypercarbic and hypoxic ventilatory
drive,” Anesthesiology 107:A20; ASA Annual Meeting, San Francisco, Oct 2007.
D. Leibundgut, V. Hartwich, P.M. Schumacher, A. Caruso, G. Pestel, ”Inter ob-

242 Curriculum Vitae
server agreement of manually assessed differences in pulse pressure (dPP),” Anes-
thesiology 107:A455; ASA Annual Meeting, San Francisco, Oct 2007.
A. Caruso, M. Morari, T. Bouillon, M. Luginbuhl, P.M. Schumacher, ”TCI for
multiple drugs: the two dimensional user interface approach,” World Congress of
Total Intravenous Anaesthesia, Venice, Sep 2007.
A. Caruso, T. Bouillon, P.M. Schumacher, M. Luginbuhl, M. Morari, ”Drug-
induced respiratory depression: an integrated model of drug effects on the hyper-
capnic and hypoxic drive,” Conf Proc IEEE Eng Med Biol Soc 2007, pp. 4259-4263;
29th IEEE EMBS, Lyon, Aug 2007.
A. Caruso, T. Bouillon, E. Zanderigo, P.M. Schumacher, M. Luginbuhl, ”Closed
loop administration of remifentanil for monitored anesthesia care using PCO2 as
endpoint,” Anesthesiology 105: A1198; ASA Annual Meeting, Chicago, Oct 2006.
P.M. Schumacher, A. Caruso, V. Hartwich, M. Luginbuhl, T. Bouillon, ”Dy-
namic properties of a new transcutaneous CO2 sensor: fast enough for early de-
tection of apnea?,” Anesthesiology 105: A477; ASA Annual Meeting, Chicago, Oct
2006.
E. Zanderigo, A. Caruso, T. Bouillon, M. Luginbuhl, M. Morari, ”Pharmacody-
namic modelling of drug-induced ventilatory depression and automatic drug dosing
in conscious sedation,” Conf Proc IEEE Eng Med Biol Soc 2006, pp. 5029-5032;
28th IEEE EMBC, New York, Aug 2006.
Zurich, November 2009.