Embed Size (px)
Citation preview
April 29, 2015
IN-DEPTH RATIO ANALYSIS THROUGH FINANCIAL STATEMENT Introduction to Financial Management (FIN 254)
SECTION#20
Nymul Islam Sefat
Eman-E-Alam
Anindita Burhan Nady
Rifah Sanjida
Sheikh Mohammad Rabby (Rby)
Lecturer
School Of Business
North South University
Bashundhara R/A, Dhaka.
Subject: Submission of term paper.
Dear Sir. Sheikh,
We are pleased to submit herewith our term paper on In-depth Ratio Analysis through financial statement
as requirements for fulfillment of the course FIN254. This paper is a summary of our ideas and
knowledge learnt from the course. In presenting this report, we have put our level best effort to
include all the relevant information and the explanation to make this report informative, vivid
and comprehensive.
It was an erudite and fascinating experience for us to prepare this report. We are overwhelmed
with gratitude for succoring us to evolve our report writing skills. If further clarification
regarding this report is required, we will be available by any means.
If you have any questions or dilemmas regarding the contents of this paper; we would be grateful
to receive your advice. Thank you Sir for believing in us and giving us this stupendous
opportunity.
Sincerely,
EXECUTIVE SUMMARY
This report gives a vivid detailed portray of the Financial Statement Analysis and Auditing
Pattern of two leading food industries of Bangladesh Apex Food Limited and Fu-Wang Foods
Limited. Here detailed illustration of both the companies is analyzed and compared in a lucid
manner.
In the first section of this report a pin-point illustration of the emerging Food industry of
Bangladesh along with the existing position of Apex Food and Fu-Wang Foods within the
industry is elaborately disused. Therefore it also includes the both the company’s history along
with nature of their business, primary products.
In the second segment, the report represents the in-depth analysis of Financial Statement of Apex
Food Ltd. which includes Time Series Analysis of 5 years of relevant Liquidity, Activity, Debt,
Profitability and Market ratios. The analysis also includes Cross Sectional Analysis with Fu-
Wang Food Ltd. of the latest year, explanation, interpretation, comparison of ratio analysis and
so on.
The last module of the report will elaborately discuss the overall performance of Apex Food and
Fu-Wang Foods to provide more crystal clear picture of the company’s current market and
financial position.
APEX FOOD LIMITED is a company which specializes in producing and exporting shrimp to
more than 10 countries in the world. Bangladesh produces 2.4 percent of total produce of shrimp
in Asia and comes fourth which is higher than produce in countries like Japan, Korea and
Thailand. Apex Foods Ltd is one of the pioneers in shrimp industry and has the highest turnover
compared to its peers in the year 2012-13. They are committed to developing, producing and
marketing beverages. The company determine to deliver the best standard of production by
choosing good quality of raw materials and manufacturing all products in high hygienic rooms.
Furthermore, they have quality control in every process and provide training program for
employee’s hygienic in order to correspond to GMP system. They provide complete and
professional services, which include product package designing, flavour researching and
manufacturing. Customer satisfaction is our working guideline. Quality and Service is the
prerogative of marketing- is their working concept. They are committed to high quality and
excellent taste has gained them many loyal and satisfied customers. Trust is the basis of their
business and is achieved through honest and knowledgeable service.
LOCATIONS
Apex Food Limited is incorporated as a Private Limited Company in 1979 and converted into a
public limited company in 1981 with 100% export oriented value-added seafood processing
facility. The Company exported seafood especially shrimps to USA, EU countries, Australia
Japan and Russia. Present annual production capacity of the Company is 7,200 MT. The factory
is located at Shagarika Road, Fouzderhat Industrial Estate, Pahartali, and Chittagong. Apex
Foods Co. Ltd is the subsidiary of Apex Group Co. Ltd established in 1994 and under great
effort of all staffs, Apex Foods Co., Ltd. was granted with GMP. Head Office: Rupayan Golden
Age, 5th & 6th Floor, 99Gulshan Avenue, Gulshan,Dhaka-1212,Bangladesh and Factory: 51-
B(1) Shagarika Road. Fouzderhat Industrial Estate, Chittagong-4219.
NATURE OF THE BUSINESS
Apex Food Limited is a company which exports to multiple countries. Apex Foods Limited
plays a pivotal role in a country where shrimp and fish export are the third largest foreign
currency earner. These company is listed on the Dhaka Stock Exchange with a market
capitalization above US $500 million.
GENERAL PRODUCTS: Apex Foods is the manufacturer and distributor of yoghurt wafers,
corn snacks, candies, and etc. They also manufacture “candy toys” type, which most of products
are licensees of famous characters around the world.
LICENSED PRODUCTS: They have been working with well-known Japanese and other
licensors such as– Disney (Micky Mouse, Winnie the Pooh, Lilo& Stich, Ben Ten, and Toy
story)
IMPORTED PRODUCTS: In addition, they are trying to expand their market by importing many
products around the world such as Chocolate and Biscuit (Japan) Sanrio and Disney (Hong
Kong), Mints (Canada), Biscuit (France), Pastilles (Australia), and etc.
SUBSIDIARY COMPANY: Apex Group Co. Ltd- holding in subsidiary companies. Apex Toys
Co. Ltd. –manufactures plastic toys. Apex Foods Co. Ltd. –manufactures snack food such as
candy, wafer and corn snacks. Apex Marketing (Thai) Co. Ltd. – distributes toys and snack food
nationwide. Apex Plastic Co. Ltd. – custom mould maker, OEM manufacturer of plastic
industry. Apex Import & Export Co. Ltd. – imports & exports manufactured goods. M.T.R
Group Co. Ltd. Part. – distributes toys & snack foods to department stores & mini marts.
Here Apex Food Ltd is our preferred company and Fu-Wang Food Ltd. is our benchmark
company. The followings will show the Time Series Analysis of Apex Food Limited for the fiscal
year 2010-2014 & Cross Sectional Analysis between Apex and Fu-Wang Food Limited for the
year 2014. After thoroughly reviewing the annual reports, we have made it.
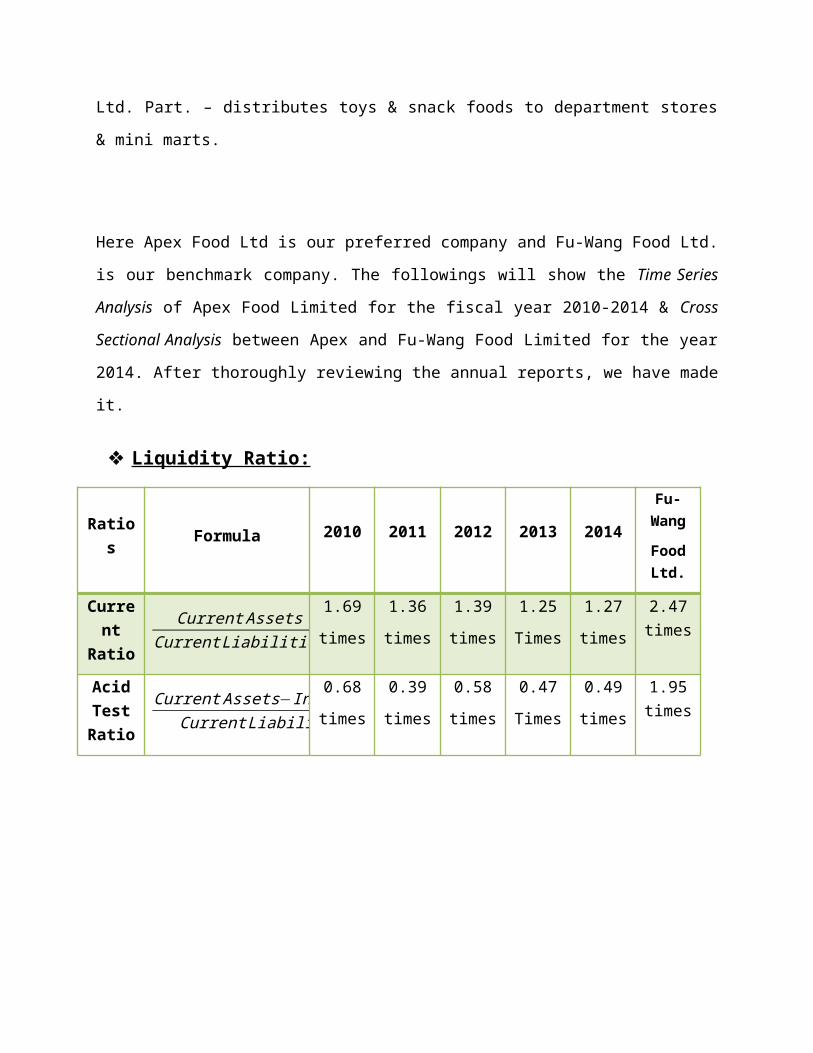
Liquidity Ratio:
Ratios Formula 2010 2011 2012 2013 2014
Fu-Wang
Food Ltd.
Current Ratio
Current AssetsCurrent Liabilities
1.69
times
1.36
times
1.39
times
1.25
Times
1.27
times
2.47 times
Acid Test Ratio
Current Assets−InventoryCurrent Liabilities
0.68
times
0.39
times
0.58
times
0.47
Times
0.49
times
1.95 times
2010 2011 2012 2013 20140
0.20.40.60.8
11.21.41.61.8
Current Ratio
2010 2011 2012 2013 20140
0.10.20.30.40.50.60.70.8
Quick Ratio
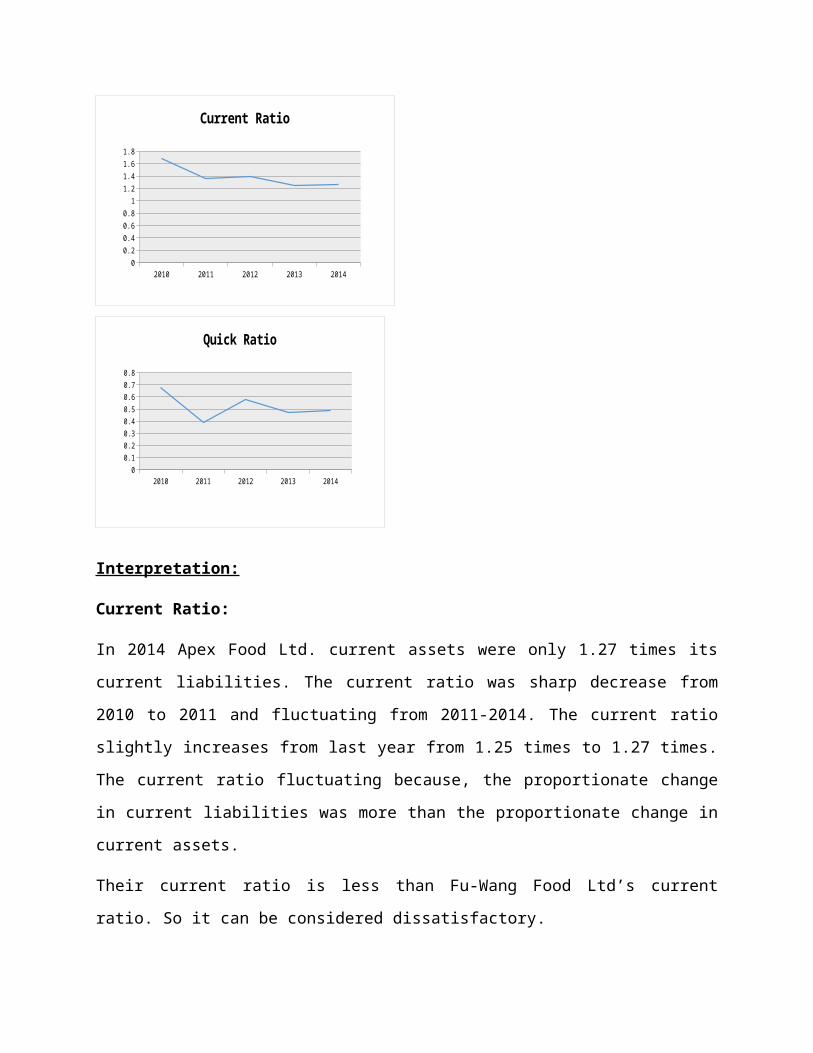
Interpretation:
Current Ratio:
In 2014 Apex Food Ltd. current assets were only 1.27 times its current liabilities. The current
ratio was sharp decrease from 2010 to 2011 and fluctuating from 2011-2014. The current ratio
slightly increases from last year from 1.25 times to 1.27 times. The current ratio fluctuating
because, the proportionate change in current liabilities was more than the proportionate
change in current assets.
Their current ratio is less than Fu-Wang Food Ltd’s current ratio. So it can be considered
dissatisfactory.
Acid Test Ratio:
In 2014, Apex’s current asset excluding inventory where 0.49 times of their current liability. The
acid test ratio was sharp decreased from 2010 to 2011 and again increases in 2012. The quick
ratio increased last year from 0.47 times to 0.49 times. The acid test ratio fluctuated because
the current assets excluding inventory decreased.
However, still their acid test very lower than their competitor Fu-Wang Food Ltd. So this
performance can be considered poor.
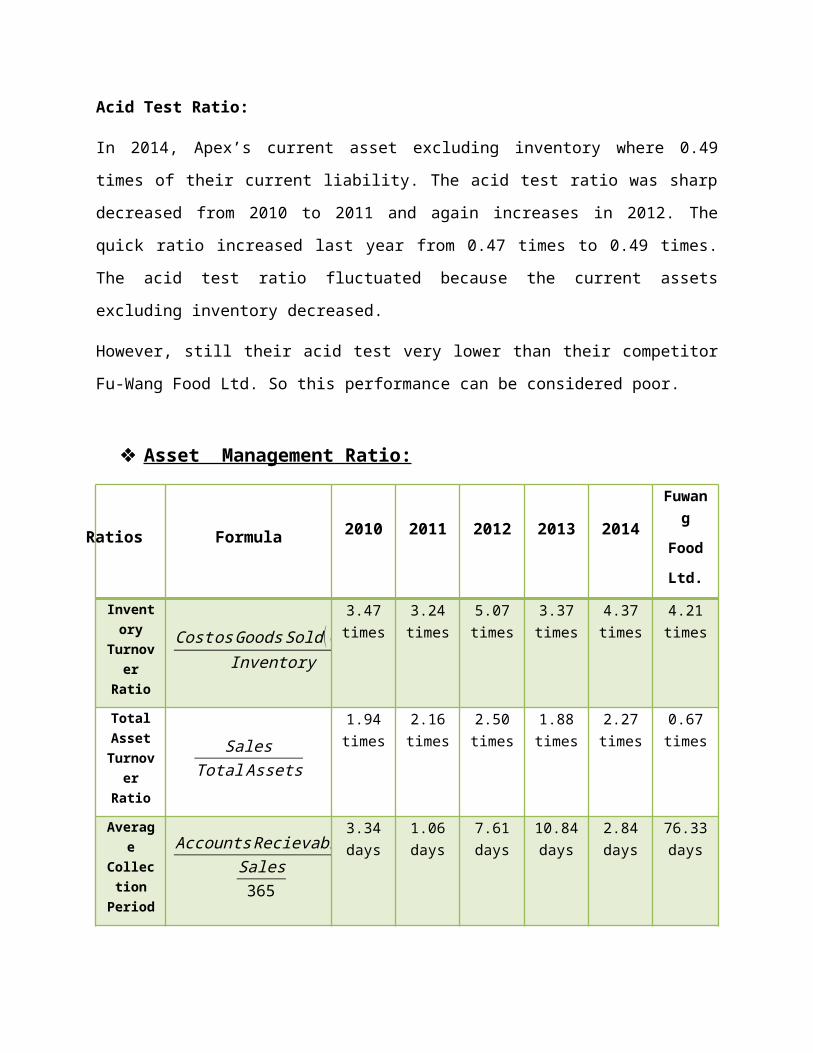
Asset Management Ratio:
Ratios Formula 2010 2011 2012 2013 2014
Fuwang
Food
Ltd.
Inventory Turnover
Ratio
Cost osGoods Sold (COGS )Inventory
3.47 times
3.24 times
5.07 times
3.37 times
4.37 times
4.21 times
Total Asset
Turnover Ratio
SalesTotal Assets
1.94 times
2.16 times
2.50 times
1.88 times
2.27 times
0.67 times
Average Collection
Period
Accounts RecievableSales365
3.34 days
1.06 days
7.61 days
10.84 days
2.84 days
76.33 days
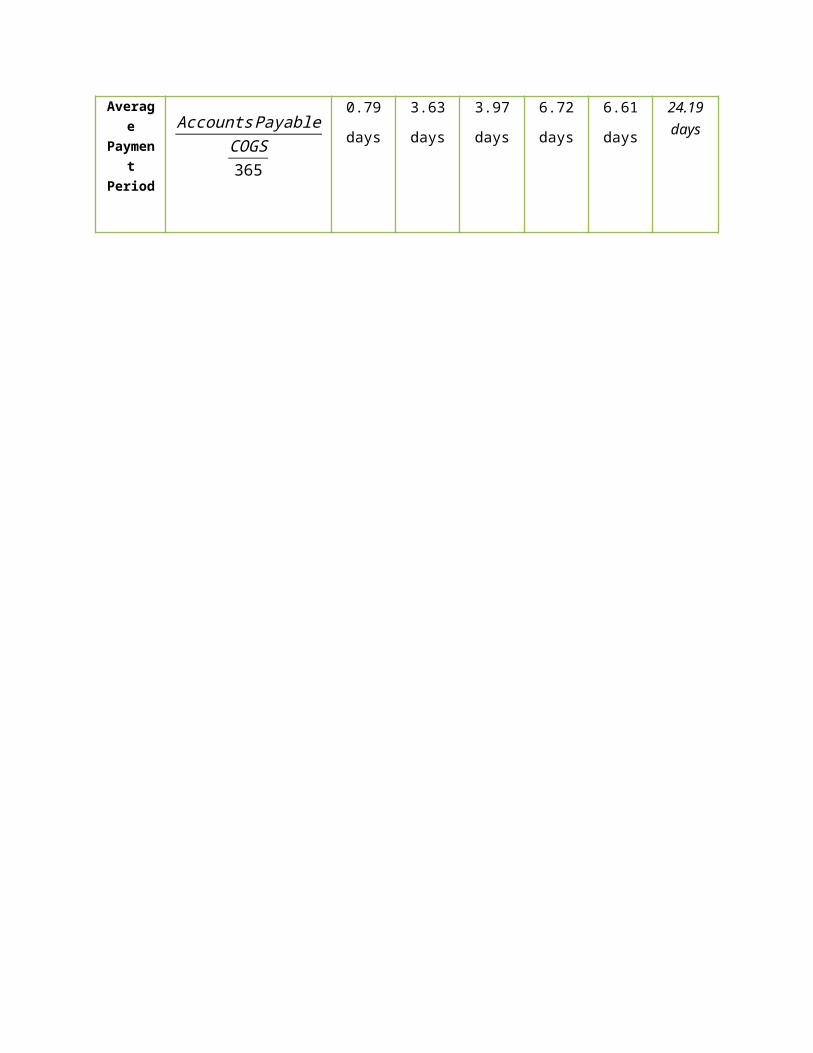
Average Payment
Period
Accounts PayableCOGS
365
0.79
days
3.63
days
3.97
days
6.72
days
6.61
days
24.19 days
2010 2011 2012 2013 20140
1
2
3
4
5
6
Inventory Turnover
2010 2011 2012 2013 20140
0.5
1
1.5
2
2.5
3
Total Asset Turnover
2010 2011 2012 2013 20140
2
4
6
8
10
12
Average collection Period
2010 2011 2012 2013 20140
1
2
3
4
5
6
7
8
Average Payment Period
Interpretation:
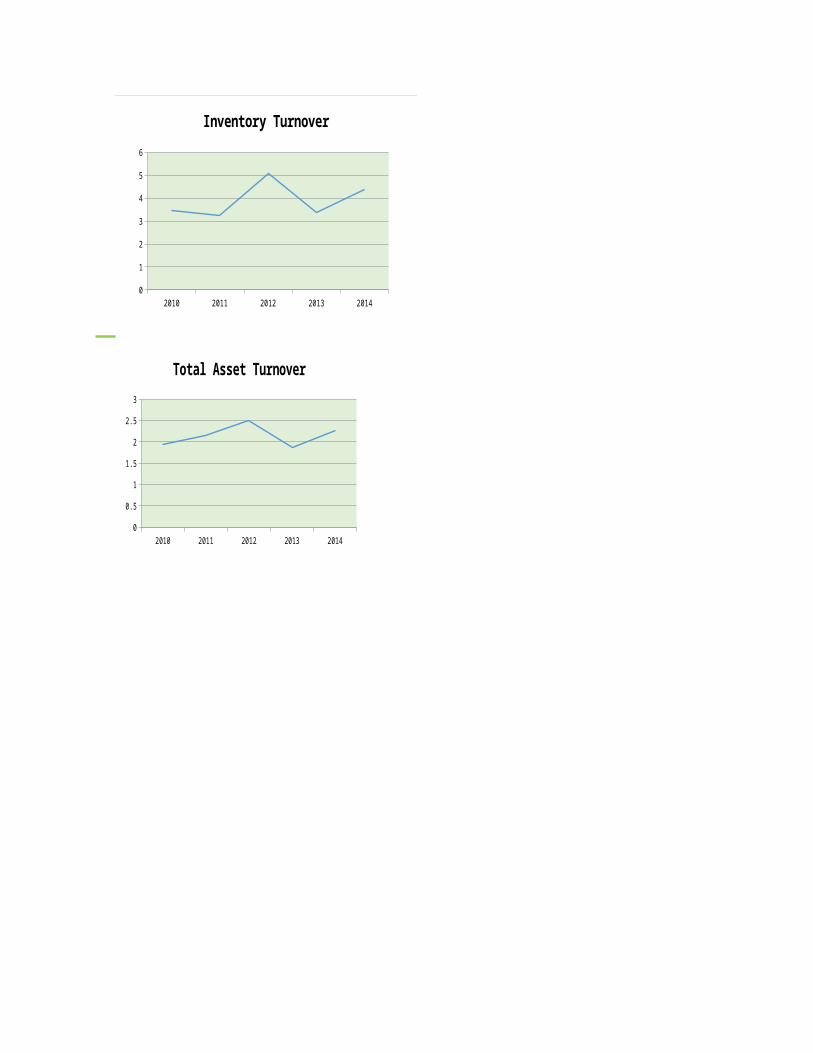
Inventory Turnover Ratio:
In 2014, the company had sold & restocked its inventory 4.37 times. The Inventory turnover
ratio has been fluctuated over the last 5 years. Comparing with 2013, this year it has increased
and also slightly higher than Fu-Wang Food Ltd Inventory turnover ratio. So after considering all
the factors it can be said that Apex Food ltd performance was satisfactory.
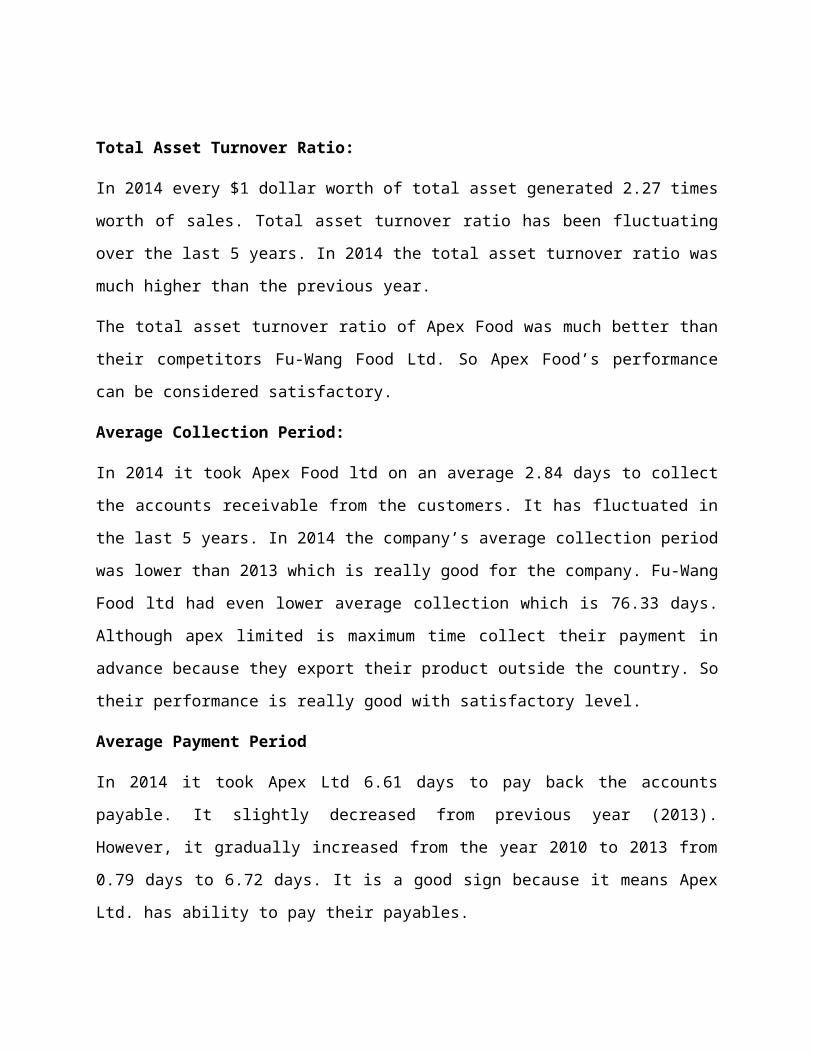
Total Asset Turnover Ratio:
In 2014 every $1 dollar worth of total asset generated 2.27 times worth of sales. Total asset
turnover ratio has been fluctuating over the last 5 years. In 2014 the total asset turnover ratio was
much higher than the previous year.
The total asset turnover ratio of Apex Food was much better than their competitors Fu-Wang
Food Ltd. So Apex Food’s performance can be considered satisfactory.
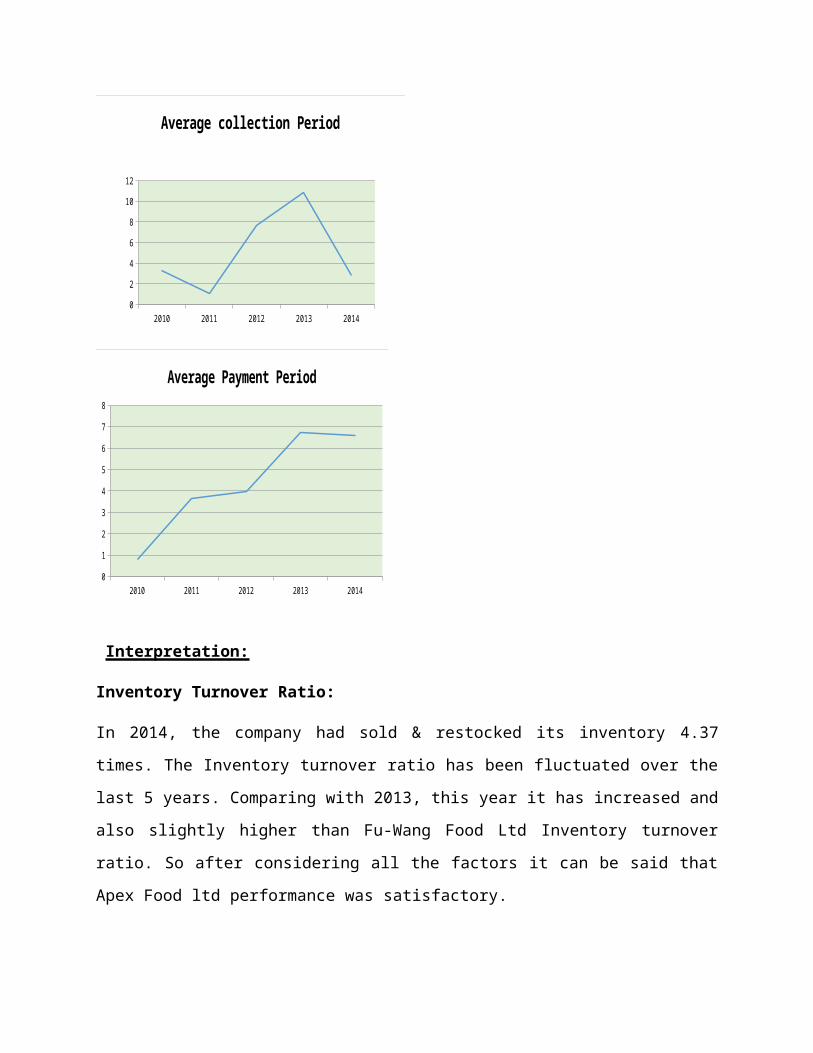
Average Collection Period:
In 2014 it took Apex Food ltd on an average 2.84 days to collect the accounts receivable from
the customers. It has fluctuated in the last 5 years. In 2014 the company’s average collection
period was lower than 2013 which is really good for the company. Fu-Wang Food ltd had even
lower average collection which is 76.33 days. Although apex limited is maximum time collect
their payment in advance because they export their product outside the country. So their
performance is really good with satisfactory level.
Average Payment Period
In 2014 it took Apex Ltd 6.61 days to pay back the accounts payable. It slightly decreased from
previous year (2013). However, it gradually increased from the year 2010 to 2013 from 0.79
days to 6.72 days. It is a good sign because it means Apex Ltd. has ability to pay their payables.
In 2014 the Fu-Wang Foods Ltd. average payment period was 24.19 days which is very higher
than Apex Ltd. Yes, it is good that Apex Ltd. have the capacity to pay their creditors but another
thing is Fu-Wang can make this duration without any violation their creditors.
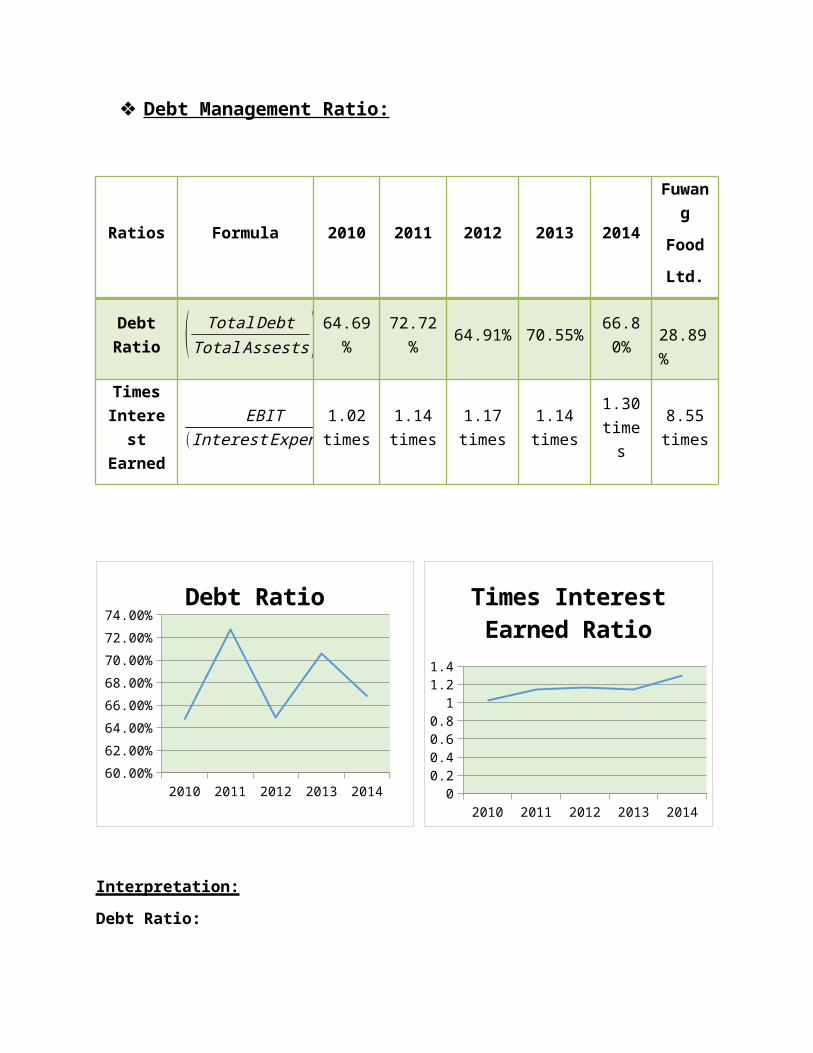
Debt Management Ratio:
Ratios Formula 2010 2011 2012 2013 2014
Fuwang
Food
Ltd.
Debt Ratio ( Total Debt
Total Assests ) 64.69% 72.72% 64.91% 70.55% 66.80%
28.89%
Times Interest Earned
EBIT( Interest Expense)
1.02 times
1.14 times
1.17 times
1.14 times
1.30 times
8.55 times
2010 2011 2012 2013 201460.00%
62.00%
64.00%
66.00%
68.00%
70.00%
72.00%
74.00%
Debt Ratio
2010 2011 2012 2013 20140
0.2
0.4
0.6
0.8
1
1.2
1.4
Times Interest Earned Ratio
Interpretation:
Debt Ratio:
In 2014, 66.8% of total asset of Apex Food Ltd. were financed by their total debt. The debt asset
ratio has been fluctuated over the last 5 years. Comparing with 2013 it has decreased slightly.
Proportionate change in total debt is slightly greater than proportionate change in total Asset.
However, it is not better than Fu-Wang Food ltd. Only 28.89% of Fu-Wang’s total asset was
financed by debt. Therefore, Apex’s performance is not satisfactory.
Times Interest Earned:
In 2014, the company earnings before income tax was 1.3 times higher than the interest expense.
It was almost same over the last 5 years Comparing with 2013 it has increased slightly. Apex’s
earnings before income tax have been increased over the last 5 years.
Fu-Wang’s times interest earned ratio was 8.55 times in the year 2014. So, Apex performance is
worse than Fu-Wang ltd.
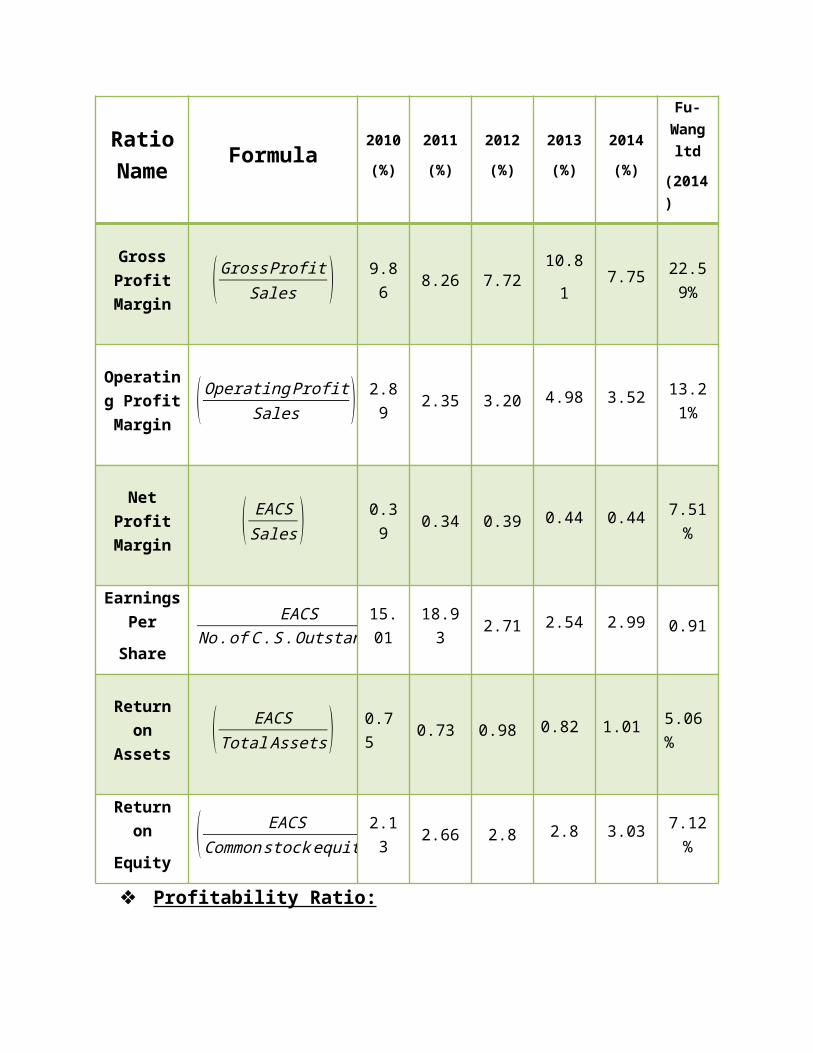
Ratio Name Formula
2010
(%)
2011
(%)
2012
(%)
2013
(%)
2014
(%)
Fu-Wang
ltd
(2014)
Gross Profit
Margin( Gross Profit
Sales ) 9.86 8.26 7.72 10.81 7.75 22.59%
Operating Profit
Margin(Operating Profit
Sales ) 2.89 2.35 3.20 4.98 3.52 13.21%
Net Profit Margin ( EACS
Sales ) 0.39 0.34 0.39 0.44 0.44 7.51%
Earnings Per
Share
EACSNo .of C .S .Outstanding 15.01 18.93 2.71 2.54 2.99 0.91
Return on Assets ( EACS
Total Assets ) 0.75 0.73 0.98 0.82 1.01 5.06%
Return on
Equity ( EACSCommon stock equity ) 2.13 2.66 2.8 2.8 3.03 7.12%
Profitability Ratio:
*EACS=Earnings Available for Common Stockholders
2010 2011 2012 2013 20140.00%
2.00%
4.00%
6.00%
8.00%
10.00%
12.00%
Gross Profit Margin Ratio
2010 2011 2012 2013 20140.00%
1.00%
2.00%
3.00%
4.00%
5.00%
6.00%
Operating Profit Margin
2010 2011 2012 2013 20140.00%0.05%0.10%0.15%0.20%0.25%0.30%0.35%0.40%0.45%0.50%
Net Profit Margin
2010 2011 2012 2013 201402468
101214161820
Earnings Per Share
2010 2011 2012 2013 20140.00%
0.20%
0.40%
0.60%
0.80%
1.00%
1.20%Return on Total Asset
2010 2011 2012 2013 20140
0.5
11.5
2
2.53
3.5
Return on Total Equity
Interpretation:
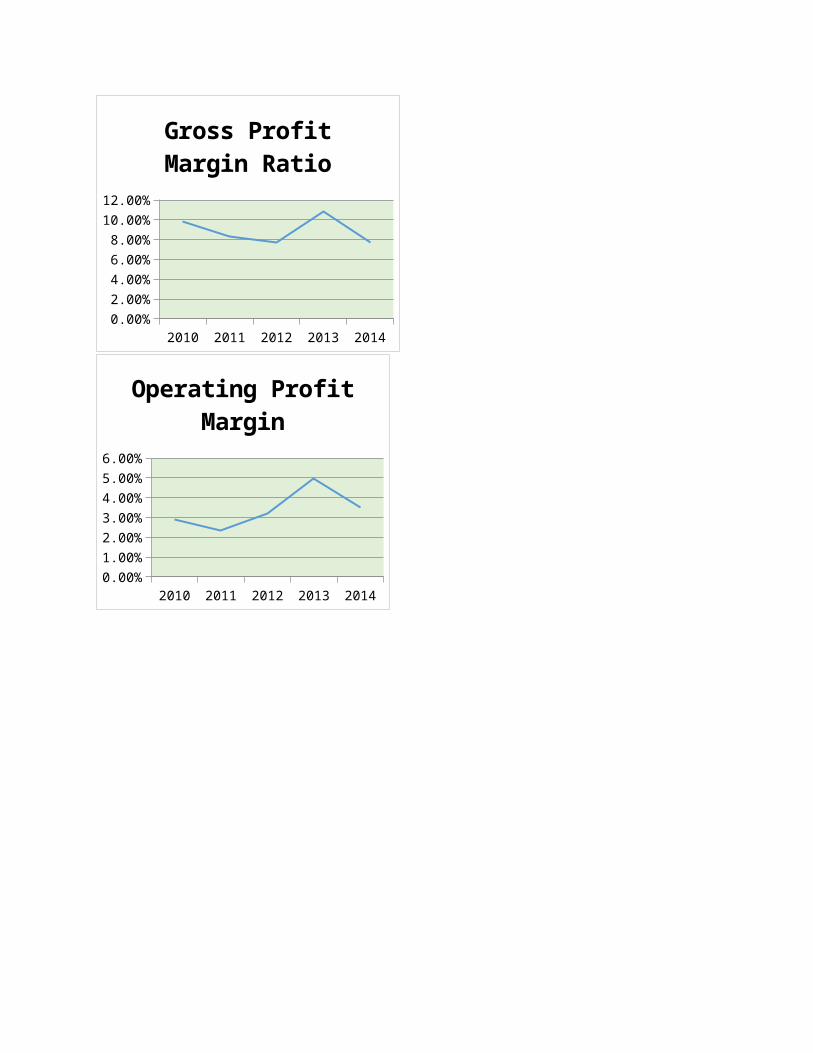
Gross Profit Margin:
From the view of time series analysis, Apex generates 9.86 Taka gross profits from every 100
Taka in 2010. But in 2011 and 2012, the ratio goes slightly down at respectively at 8.26 and 7.72
Taka because in these years the sale was not increased that much as the cost of goods sold
increased. In 2013 it sharply goes up at 10.81 which was a positive sign; but in 2014, it sharply
decreased at 7.7. In this time being, the company should be more concentrated to increase their
sales more and reduce the cost of goods.
From the view of cross sectional analysis with Fu-Wang Foods Ltd., Apex does not have a
pleasing gross profit. It differs more between these two companies.
Operating Profit Margin:
From the view of time series analysis, in 2010, Apex generates 2.89 Taka for every 100 Taka
of sale. It goes down in 2011 at 2.35, but from the end of the year it started goes up till 2012
and sharply increased in 2013 at 4.98 Taka as the operating profit increased from previous
years. In 2014, it again sharply decreased at 3.52 which was not a suitable measurement for
the company.
From the view of cross sectional analysis with Fu-Wang Foods, Apex Food’s performance
was not good and generates only 3.52Taka in recent year whereas Fu-Wang
generates13.21Taka for every 100 Taka of sales. From this measurement, Fu-Wang is more
profitable company then Apex.
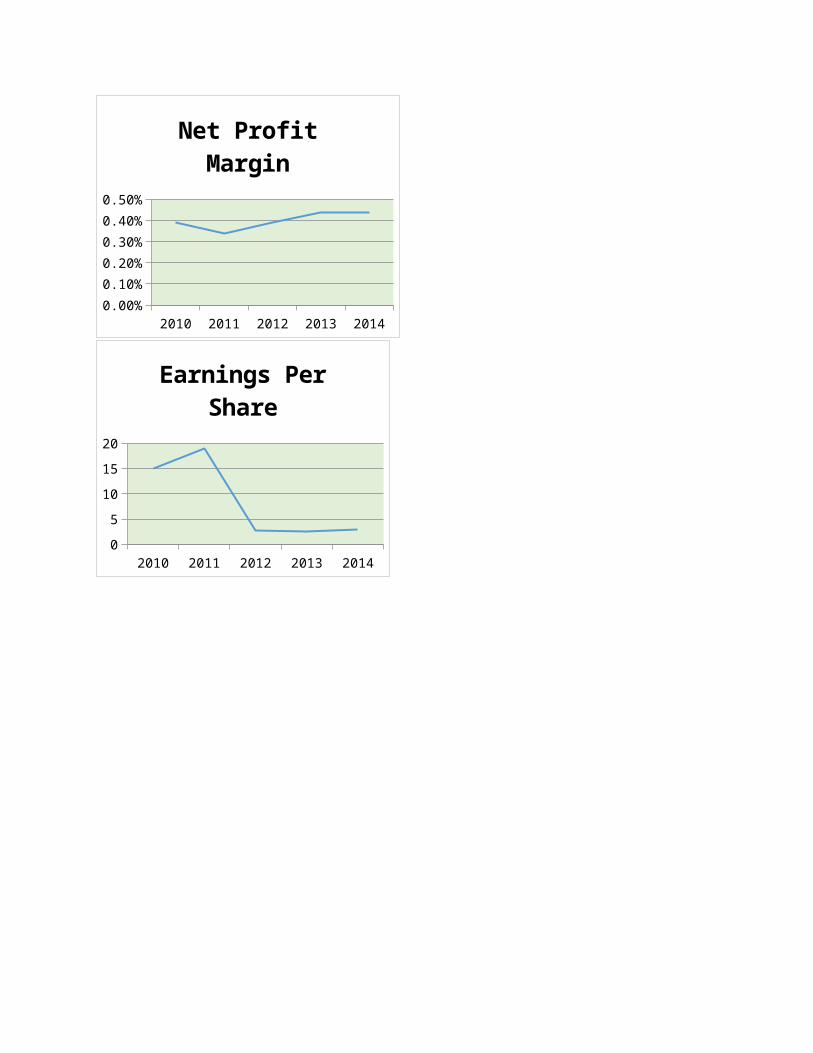
Net Profit Margin:
In time series analysis, Apex generates only 0.39 Taka from every 100 Taka of sales in 2010.
It continues to go down slightly in 2011 and began to rise slowly from 2012. In 2013 the rate
was 0.44 and was stable in 2014 as well.
In cross sectional analysis, Fu-Wang Food generates 7.51Taka in the recent year where the
Apex generates only 0.44 Taka which was not a satisfied outcome from the company then
Fu-Wang. As Apex Company has to export more of their goods, the interest and taxes are
comparatively higher than Fu-Wang.
Earnings Per Share:
In time series analysis, Apex had 15.01 Taka per share for their stockholders in 2010. But in
2011, it goes up at 18.93 Taka. But in 2012, it sharply goes down at 2.71 Taka as both the
earnings available for common stockholders and outstanding shares were increased. In 2013
and 2014, the EPS rate was stable at Taka 2.54 and 2.99 only.
In cross sectional analysis, Fu-Wang Food had a lower rate of EPS then Apex Food. In the
recent year for both the company, Fu-Wang had 0.91 Taka EPS whereas the Apex generated
2.99 Taka per Share which is comparatively higher then Fu-Wang and satisfying.
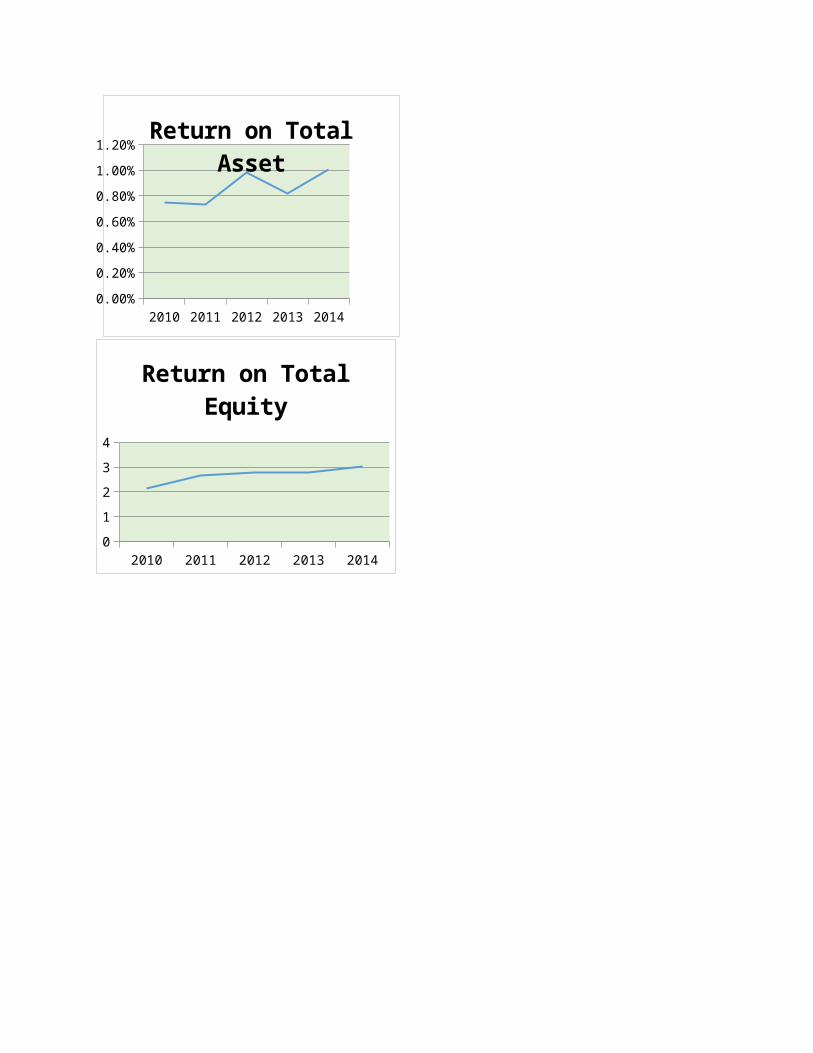
Return on Assets:
From the view of time series analysis, in 2010 Apex made 0.75 Taka profit from every 100
Taka worth of assets which is quite low for a company. In 2011, it was a little decreased and
sharply increased in 2012 at Taka 0.98. But in 2013, it slightly goes down at Taka 0.82 and
again in 2014 sharply increased at Taka 1.01. Comparatively it is quite low for a company ,
but the rate is rising, which is positive for the company.
In cross sectional analysis, Fu-Wang generated 5.06 Taka profit worth of every 100 Taka of
the assets whereas Apex did only Taka 1.01. From the comparison Fu-Wang is generating
well then Apex.
Return on Equity:
In time series analysis, Apex had 2.13 Taka profit worth of every 100 Taka of stockholders
equity in 2010. It slightly increased in the following years in 2011 to 2014. In 2012and 2013
it was stable at Taka 2.88 and increased at 3.03 Taka in 2014. The ratio should be more to
prove as a good company, but as the ratio is rising, it can be interpreted that it will have a
good impact on the company.
In cross sectional analysis, Fu-Wang had generated 7.12 Taka for every 100 Taka of
stockholders equity where Apex generated only Taka 3.03. In this view, Fu-Wang is more
profitable then Apex.
Market Ratio
Ratio name Formula 2010
BDT
2011
BDT
2012
BDT
2013
BDT
2014
BDT
Fuwang
Food
Ltd.
Price-Earnin
gs Ratio (P/E)
Market Price per ShareEPS 513.56 460.19 2.03 3.65 5.39
Market-to-
Book Ratio
Market Price per ShareBook Value per Share∗¿¿
144.18 135.18 66.05 94.47 105.67
2010 2011 2012 2013 20140
100
200
300
400
500
600
Price Earning Ratio
2010 2011 2012 2013 20140
20
40
60
80
100
120
140
160
Market Ratio
Price earning ratio
In 2014, the common share hold of this company were willing to pay TK.5.39 for each 1TK. of
reported earnings. In 2010 it was 513.56 which decreased at a very higher rate which is a worst
sign for the company.
Market to book ratio
In 2014,the company’s market value was 105.67 times the book value. It has decreased from
2010 to 2012, and from 2012 it is increasing which is a very good sign.
DUPONT SYSTEM OF ANALYSIS:The DuPont system of analysis is used to dissect the firm’s financial statements and to assess its
financial condition. It merges the income statement and balance sheet into two summary
measures of profitability.
Ratio Formula Calculation2014
Apex Food Ltd. Fu-Wang Food Ltd
Return on Asset(ROA)
Net profit margin * Total asset
turnover
0.44*2.27
7.51*0.673
1.01%
-
-
5.06%
In the given year, Apex Food ltd. had 1.01 Taka profit for every 100 Taka of total assets where
Fu-Wang had 5.06 Taka. So Fu-Wang Food Ltd. generates more profit then Apex. From DuPont
System, the ROA ratio can be calculate before the Profitability Ratios which is faster to
calculate.
MODIFIED DUPONT FORMULA

Ratio Formula Calculation2014
Apex Food Ltd. Fu-Wang Food Ltd.
Return on Equity (ROE) ROA * FLM 1.01 * 3.01
5.06 * 1.4063.03
-
-
7.12
In the given year, Apex generated 3.03 Taka profit from every worth of 100 Taka where Fu-
Wang generates 7.12 Taka. From this calculation, Fu-Wang is more profitable then Apex from
the comparison of their modified DuPont analysis.
Conclusion:
Apex and Fu-Wang both company are from food category, but their ratios differ from each other
quite more. In this report, the preferred company is Apex Food Ltd. and the benchmark company
is Fu-Wang Food Ltd. From the comparison in liquidity ratios, Fu-Wang holds more capability
to meet its obligation then Apex. In activity ratio, Apex has more capability to get their
receivables earlier then Fu-Wang and pay the payables later. But Fu-Wang also maintains their
payable in time. The inventory period is also has satisfactory result for both company. In dept
ratio, Fu-Wang has more acceptable performance then Apex Company. From profitability ratios,
Fu-Wang’s performance was comparatively more pleasant then Apex’s performances. However
Apex tried to raise its sales and profits in these years. As Apex is trying to rise its allover
performance where Fu-Wang is comparatively has more healthy performance. Overall from this
comparison, Apex company should improve more than their exiting outcome.
Bibliography
Apex Food Ltd. Financial Report. Retrieved from http://www.apexfoods.com/investors-
info/financial-reports
Empire-Capital (2013, December 26). Company Analysis on Apex Food Ltd.. Retrieved from
http://empire-capital.org/wp-content/uploads/2014/01/Apex-Foods-New.pdf
Investopdia. Ratio Analysis :Using Financial Ratios. Retrieved from http://www.investope
dia.com/university/ratio-analysis/using-ratios.asp
APPENDIX
2010-2014
2014