Embed Size (px)
Citation preview

For example, with directional drilling, (as it is referred to in the industry), rather than sinking multiple straight wells to access various sections of an oil pocket, a single drill site is selected, and directional holes are drilled which cut across the richest deposits. This method can yield 20 times the oil production at much lower cost and significantly reduced environmental impact.
Drilling for data insights in a medical practice is a lot like drilling for oil. Many practices rely on single ‘straight hole’ cuts of limited data and obtain limited insights as a result. Others have more robust data housed in separate systems that are either isolated or integrated in ways that make data sharing difficult. To get broader insights they must drill separate data holes straight into the pockets of richest information and then attempt to combine and aggregate everything together. It’s inefficient and costly at best, and more often impractical and not even attempted.
The medical practice internal environmental impacts can be costly as well. Drilling disparate data pockets often results in manual workarounds and interruptions – for example billers seeking coding data from providers or managers asking for detailed information from different locations or departments in order to compile a report.
In drilling (e.g. an oilwell), the difference between drilling a straight hole, and directing the drill to where it needs to go (yes, drilling a curved hole) is night and day as far as accuracy, efficient production, and reduced environmental impact.
“drill separate data holes straight into the pockets of richest information”
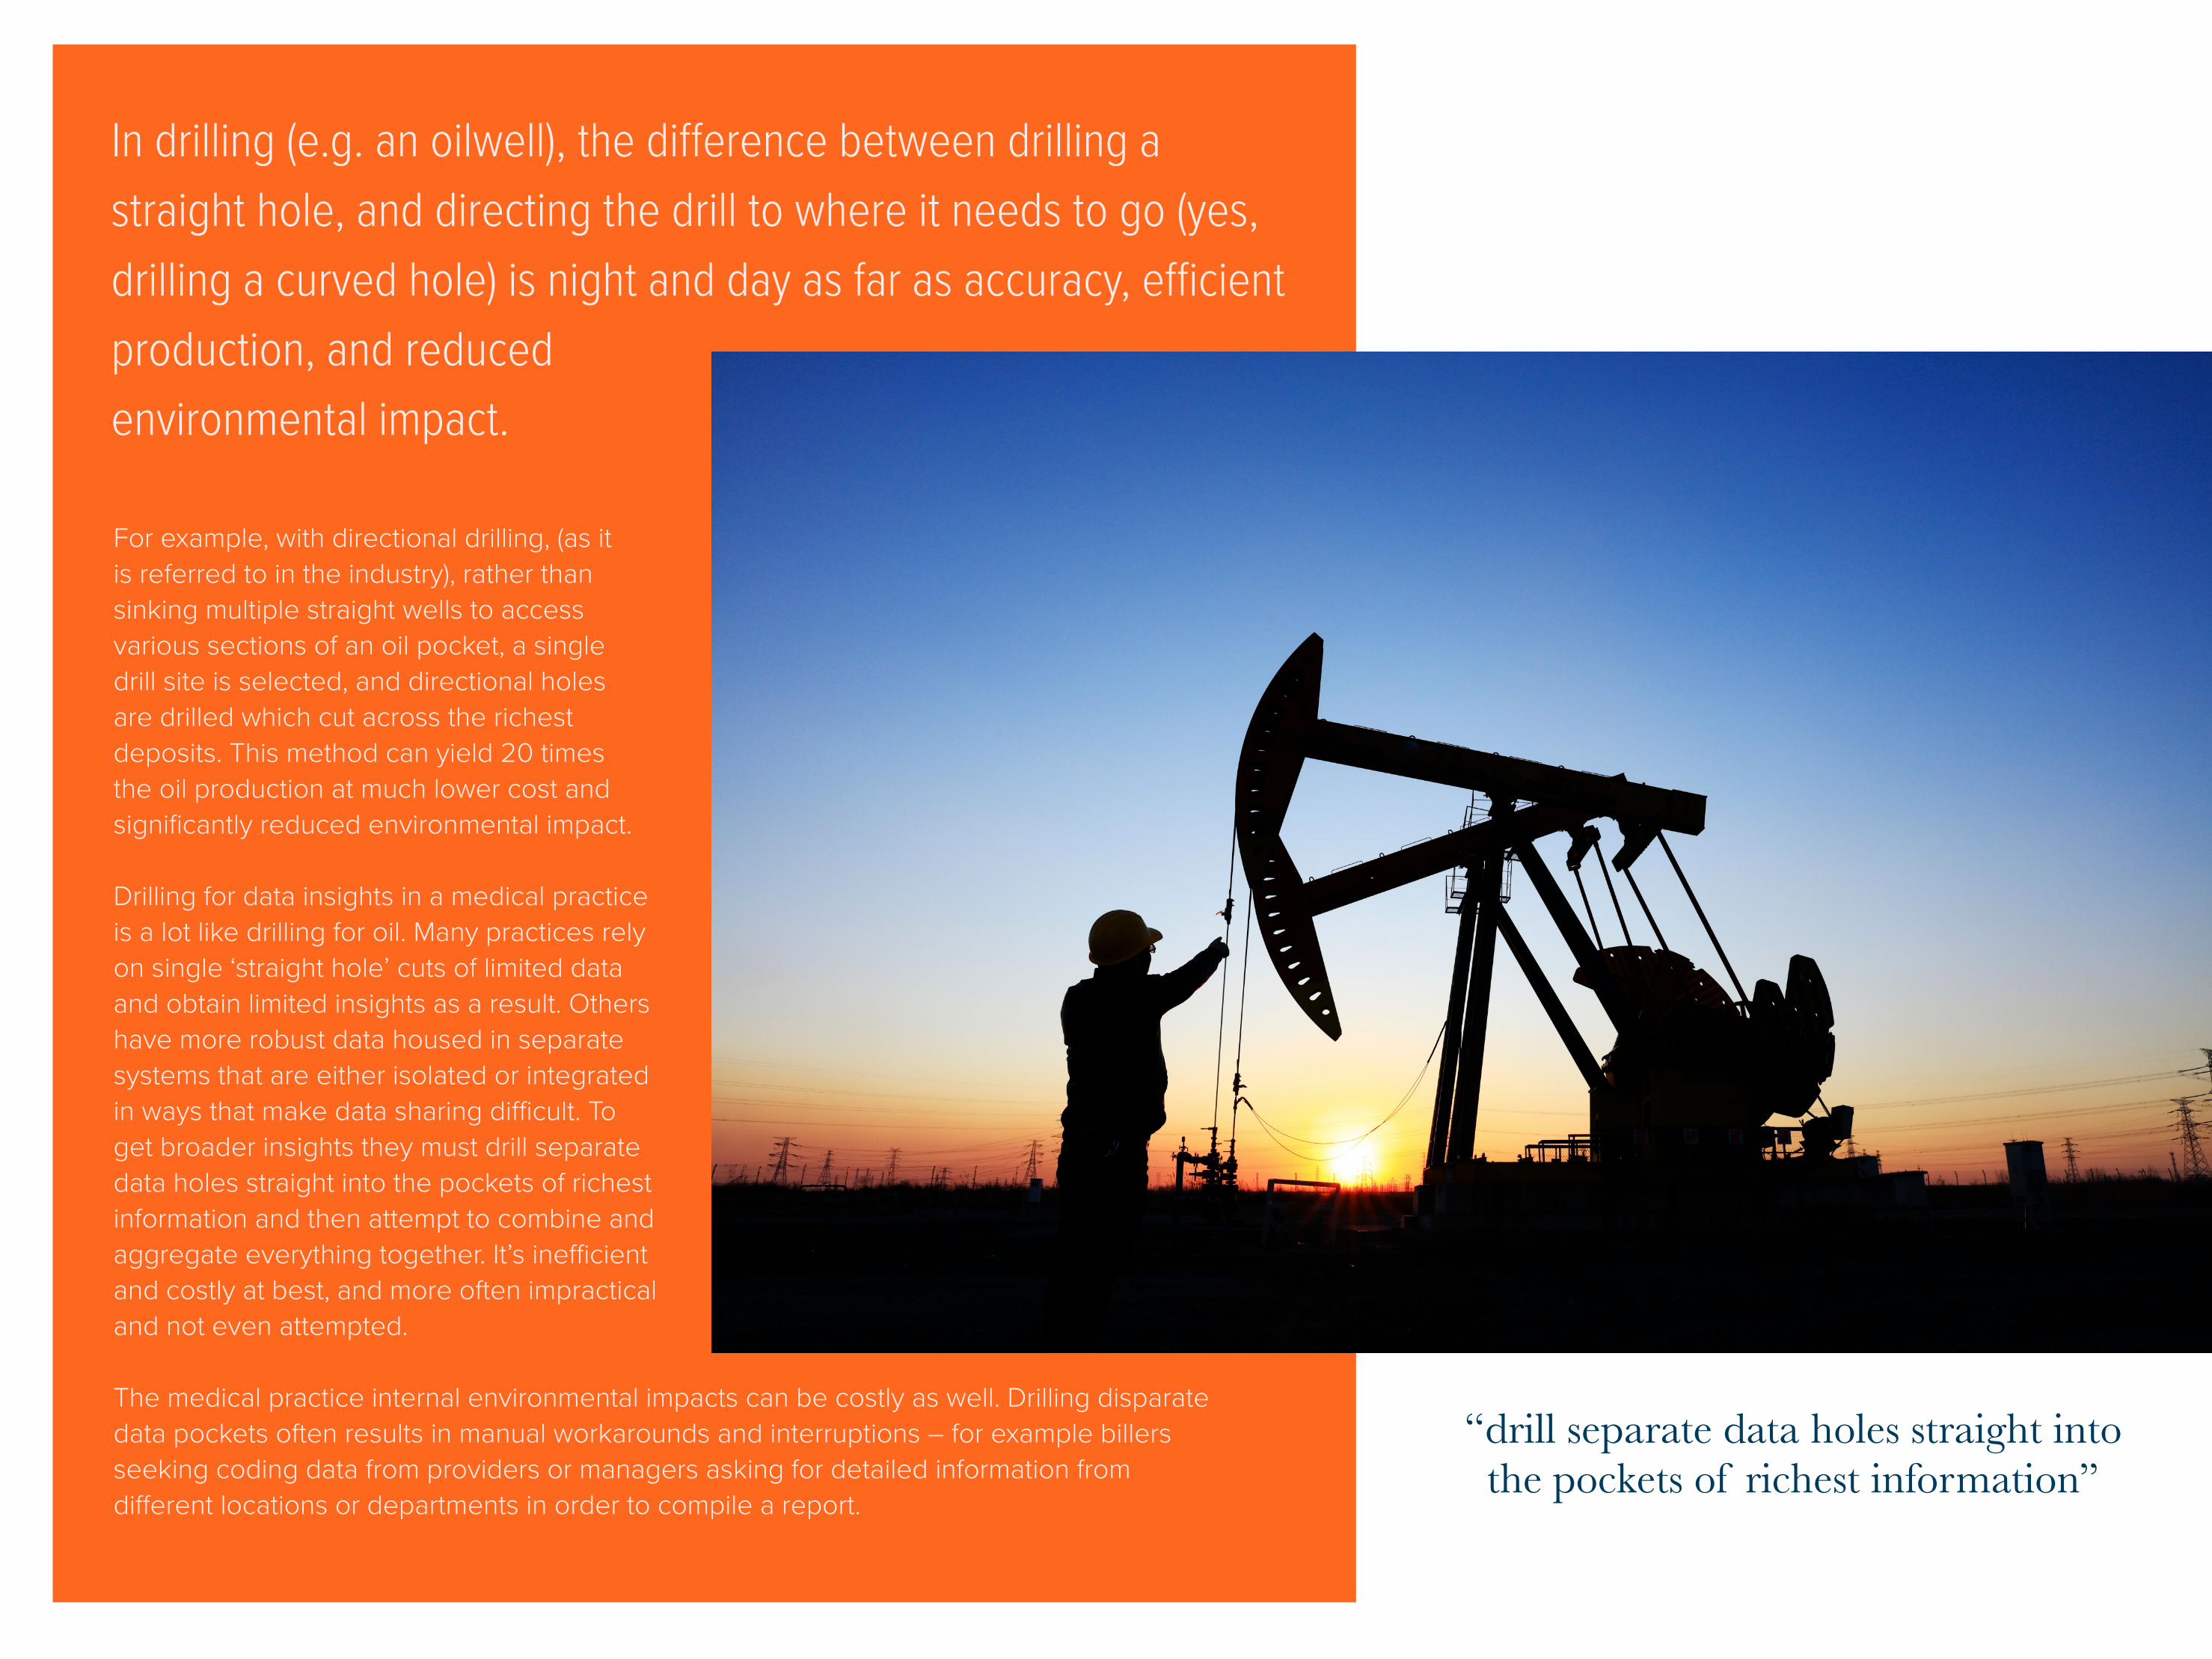
DIRECTIONAL DATA DRILLING
Successful directional drilling requires two key components:
THE BASICS
1
2
More sophisticated drill head technology that can bend and be controlled and guided, and
computerized sensing and guidance technology that can determine where the drill head is and where it needs to go and guide it accordingly.
GETTING STARTEDJumping into directional data drilling for your practice is a two-step process. The first step is to ensure you have the basics in
place and functioning to create a firm foundation for more sophisticated data analytics. The second step is to gradually open
up the full capabilities of the analytics engine by adding specific data cuts that will provide the most important insights for your practice.
Data scientists working at the highest levels of data analytics and artificial intelligence (AI) tell us that the greatest limiting factor in any project is not analytics or technology issues, but the quality of the underlying data. Complete, deep, clean, readily available data in the proper format is the fundamental starting point to gaining meaningful insights.
This principle holds true whether you are on the bleeding edge of AI or just trying to improve the quality of patient care and outcomes.
For a medical practice, the basics include the proper data platform, and baseline reporting and dashboards.processes into place accordingly.
Rather than merely hunker down and wait for the starting gun, take advantage of this time to put all the pieces in place so that you can come out of the gate charging, seaworthy and ready to rebuild. It could be the ideal opportunity to address that system, workflow, process or protocol that was always on the back burner that you knew could improve your service delivery, but never had the time to focus on.
FOUNDATION POINT ONEDATA PLATFORMData platform refers to all the infrastructure pieces that comprise the practice data system. The following characteristics are vital to building a robust data foundation that can scale as your analytics sophistication grows:
1
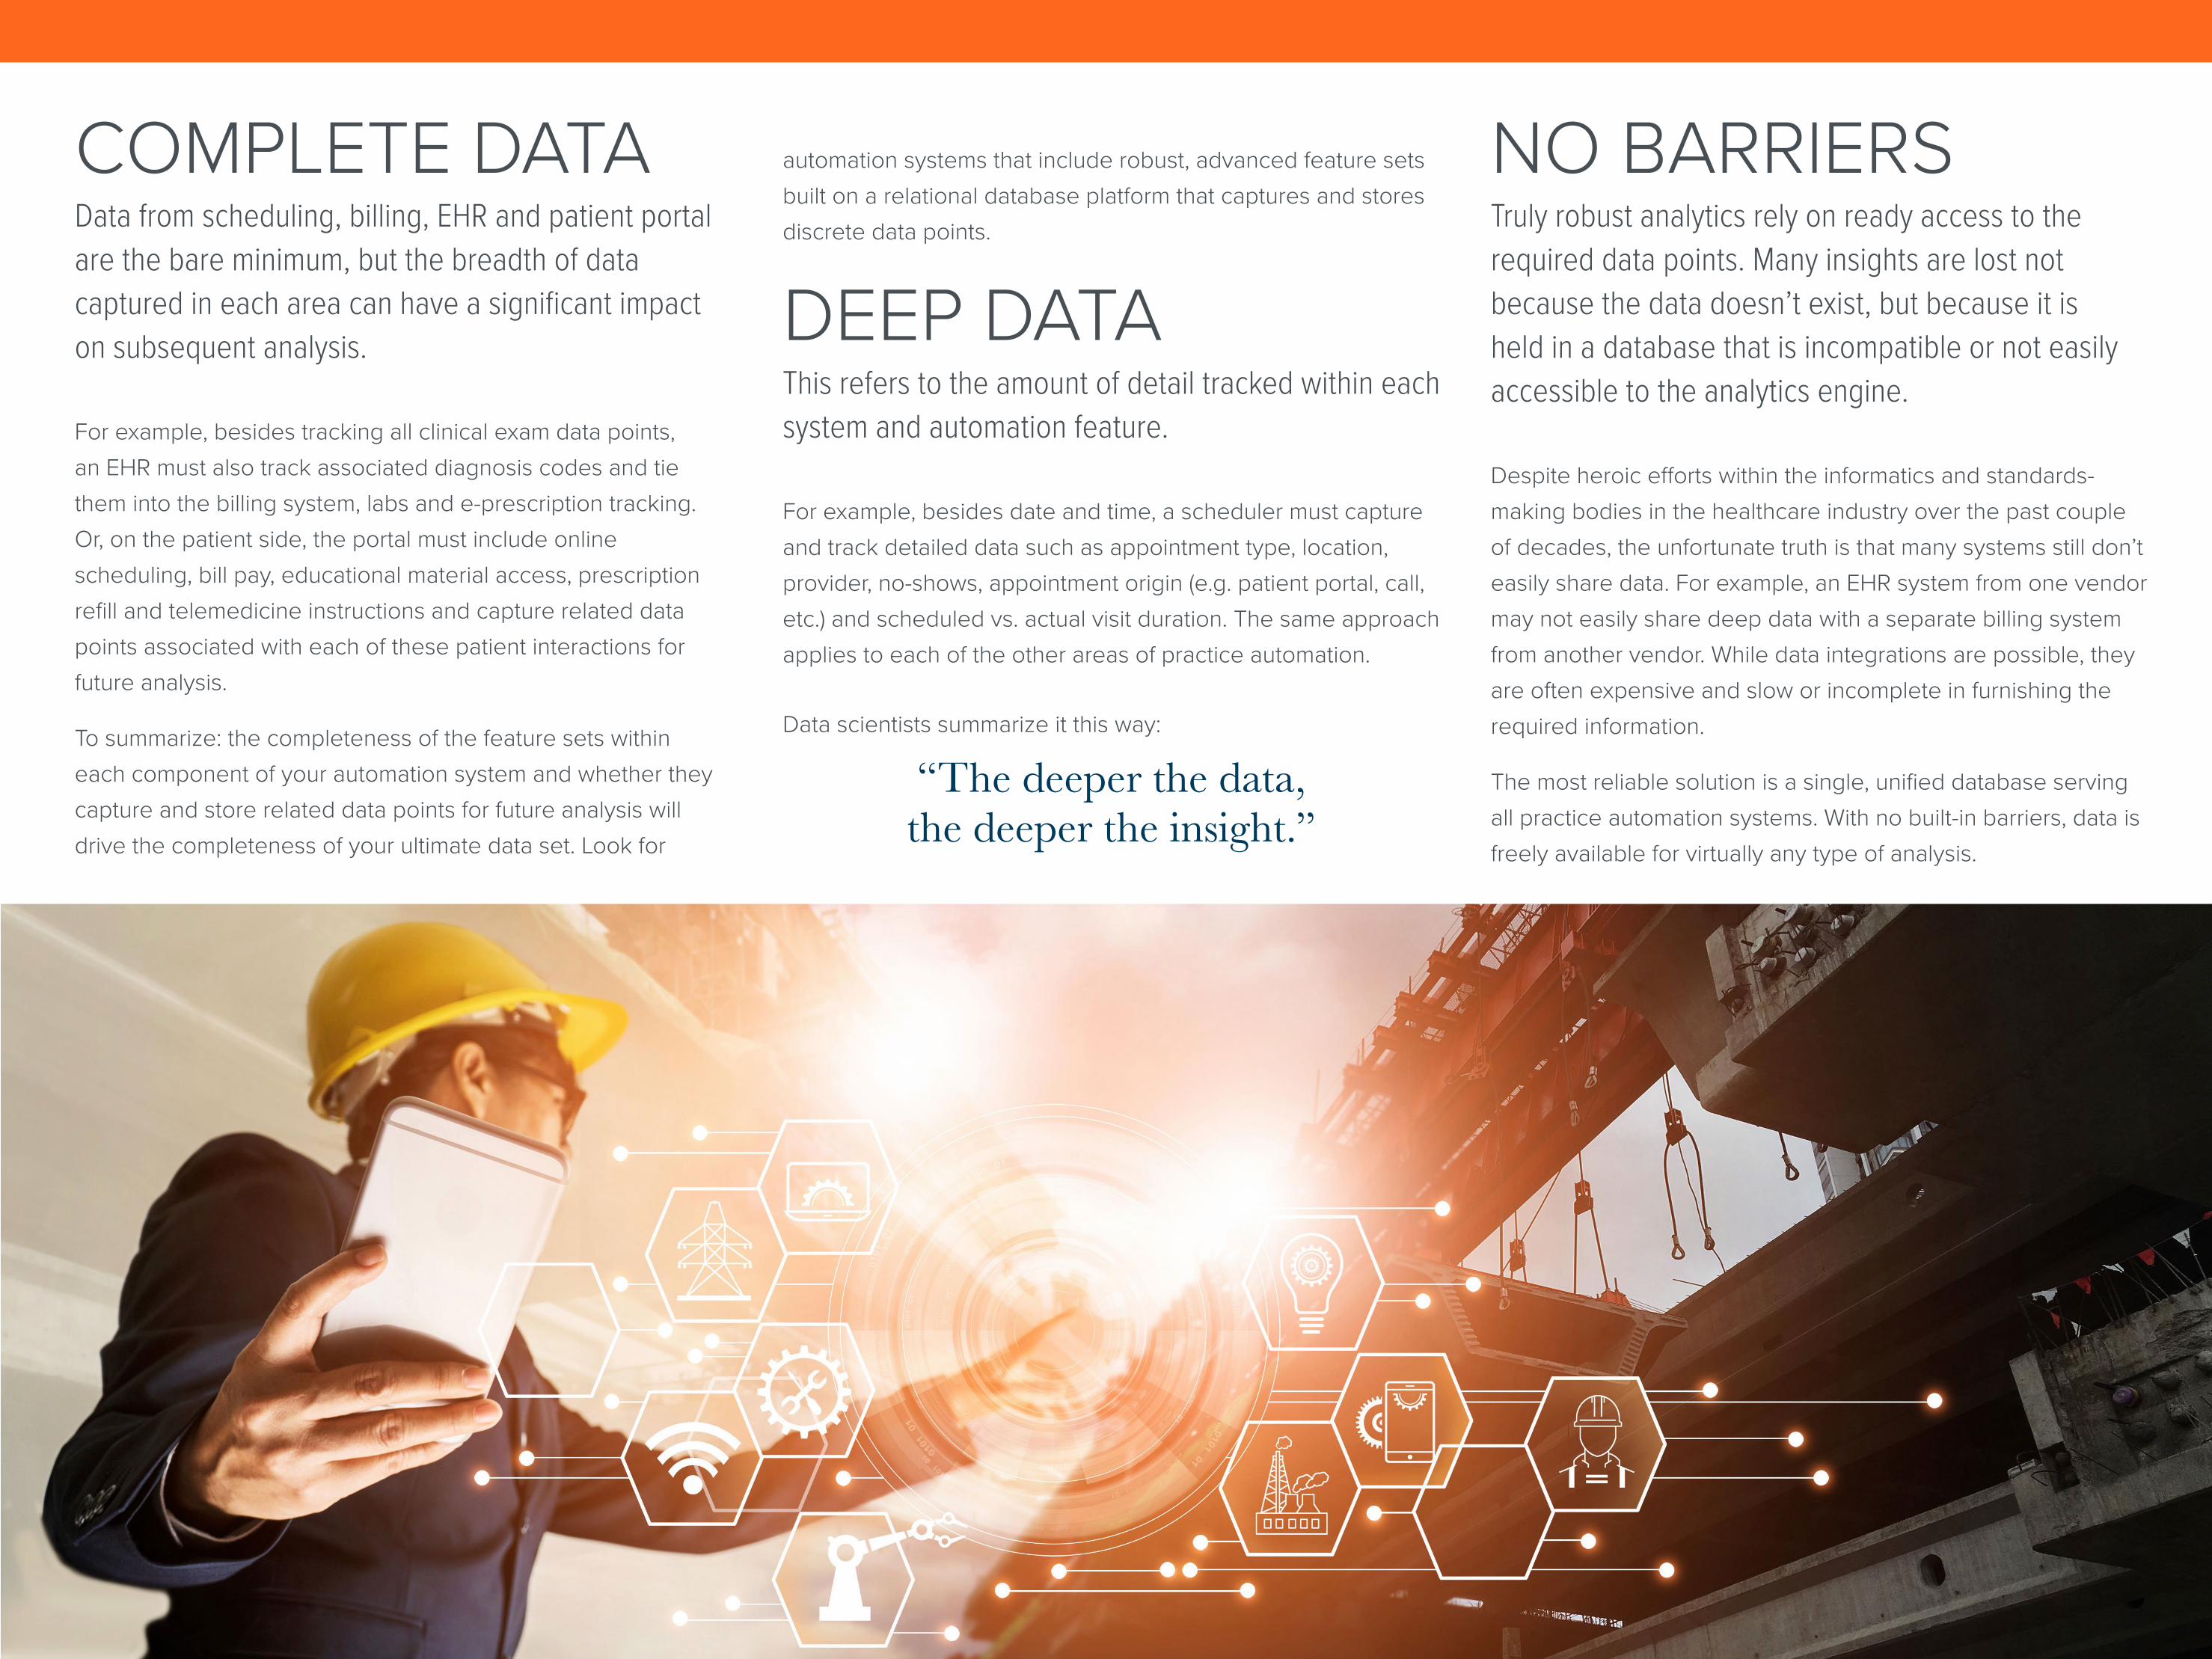
COMPLETE DATAData from scheduling, billing, EHR and patient portal are the bare minimum, but the breadth of data captured in each area can have a significant impact on subsequent analysis. For example, besides tracking all clinical exam data points, an EHR must also track associated diagnosis codes and tie them into the billing system, labs and e-prescription tracking. Or, on the patient side, the portal must include online scheduling, bill pay, educational material access, prescription refill and telemedicine instructions and capture related data points associated with each of these patient interactions for future analysis.
To summarize: the completeness of the feature sets within each component of your automation system and whether they capture and store related data points for future analysis will drive the completeness of your ultimate data set. Look for
automation systems that include robust, advanced feature sets built on a relational database platform that captures and stores discrete data points.
DEEP DATA This refers to the amount of detail tracked within each system and automation feature. For example, besides date and time, a scheduler must capture and track detailed data such as appointment type, location, provider, no-shows, appointment origin (e.g. patient portal, call, etc.) and scheduled vs. actual visit duration. The same approach applies to each of the other areas of practice automation.
Data scientists summarize it this way:
“The deeper the data, the deeper the insight.”
NO BARRIERS Truly robust analytics rely on ready access to the required data points. Many insights are lost not because the data doesn’t exist, but because it is held in a database that is incompatible or not easily accessible to the analytics engine. Despite heroic efforts within the informatics and standards-making bodies in the healthcare industry over the past couple of decades, the unfortunate truth is that many systems still don’t easily share data. For example, an EHR system from one vendor may not easily share deep data with a separate billing system from another vendor. While data integrations are possible, they are often expensive and slow or incomplete in furnishing the required information.
The most reliable solution is a single, unified database serving all practice automation systems. With no built-in barriers, data is freely available for virtually any type of analysis.
As you reopen, you will be flooded with requests for service. This is obviously a good thing, but for the next 90 days, your schedule will be the most valuable commodity in your practice. You must manage it flawlessly in order to mini A starting point is standardized, saved reports with visual dashboards that summarize key metrics for the practice, including:
Practice KPIs
Charges, payments, adjustments, encounters
Cash deposits
Top carriers, charges, payments and collection percentages
Provider-specific performance metrics
Overhead and expense summaries
These standardized reports should be reviewed on a regular basis (at least monthly – weekly is best) as part of the clinic management and decision-making process. Three additional standardized features facilitate ease of use and usefulness of the data:
Flexible templates with custom themes
Tabs that contain different cuts and reports that can be quickly accessed without cluttering the main dashboard
Dynamic dates set to update report views to the current or a specified timespan, eliminating the need to manually update date ranges each time a report is viewed
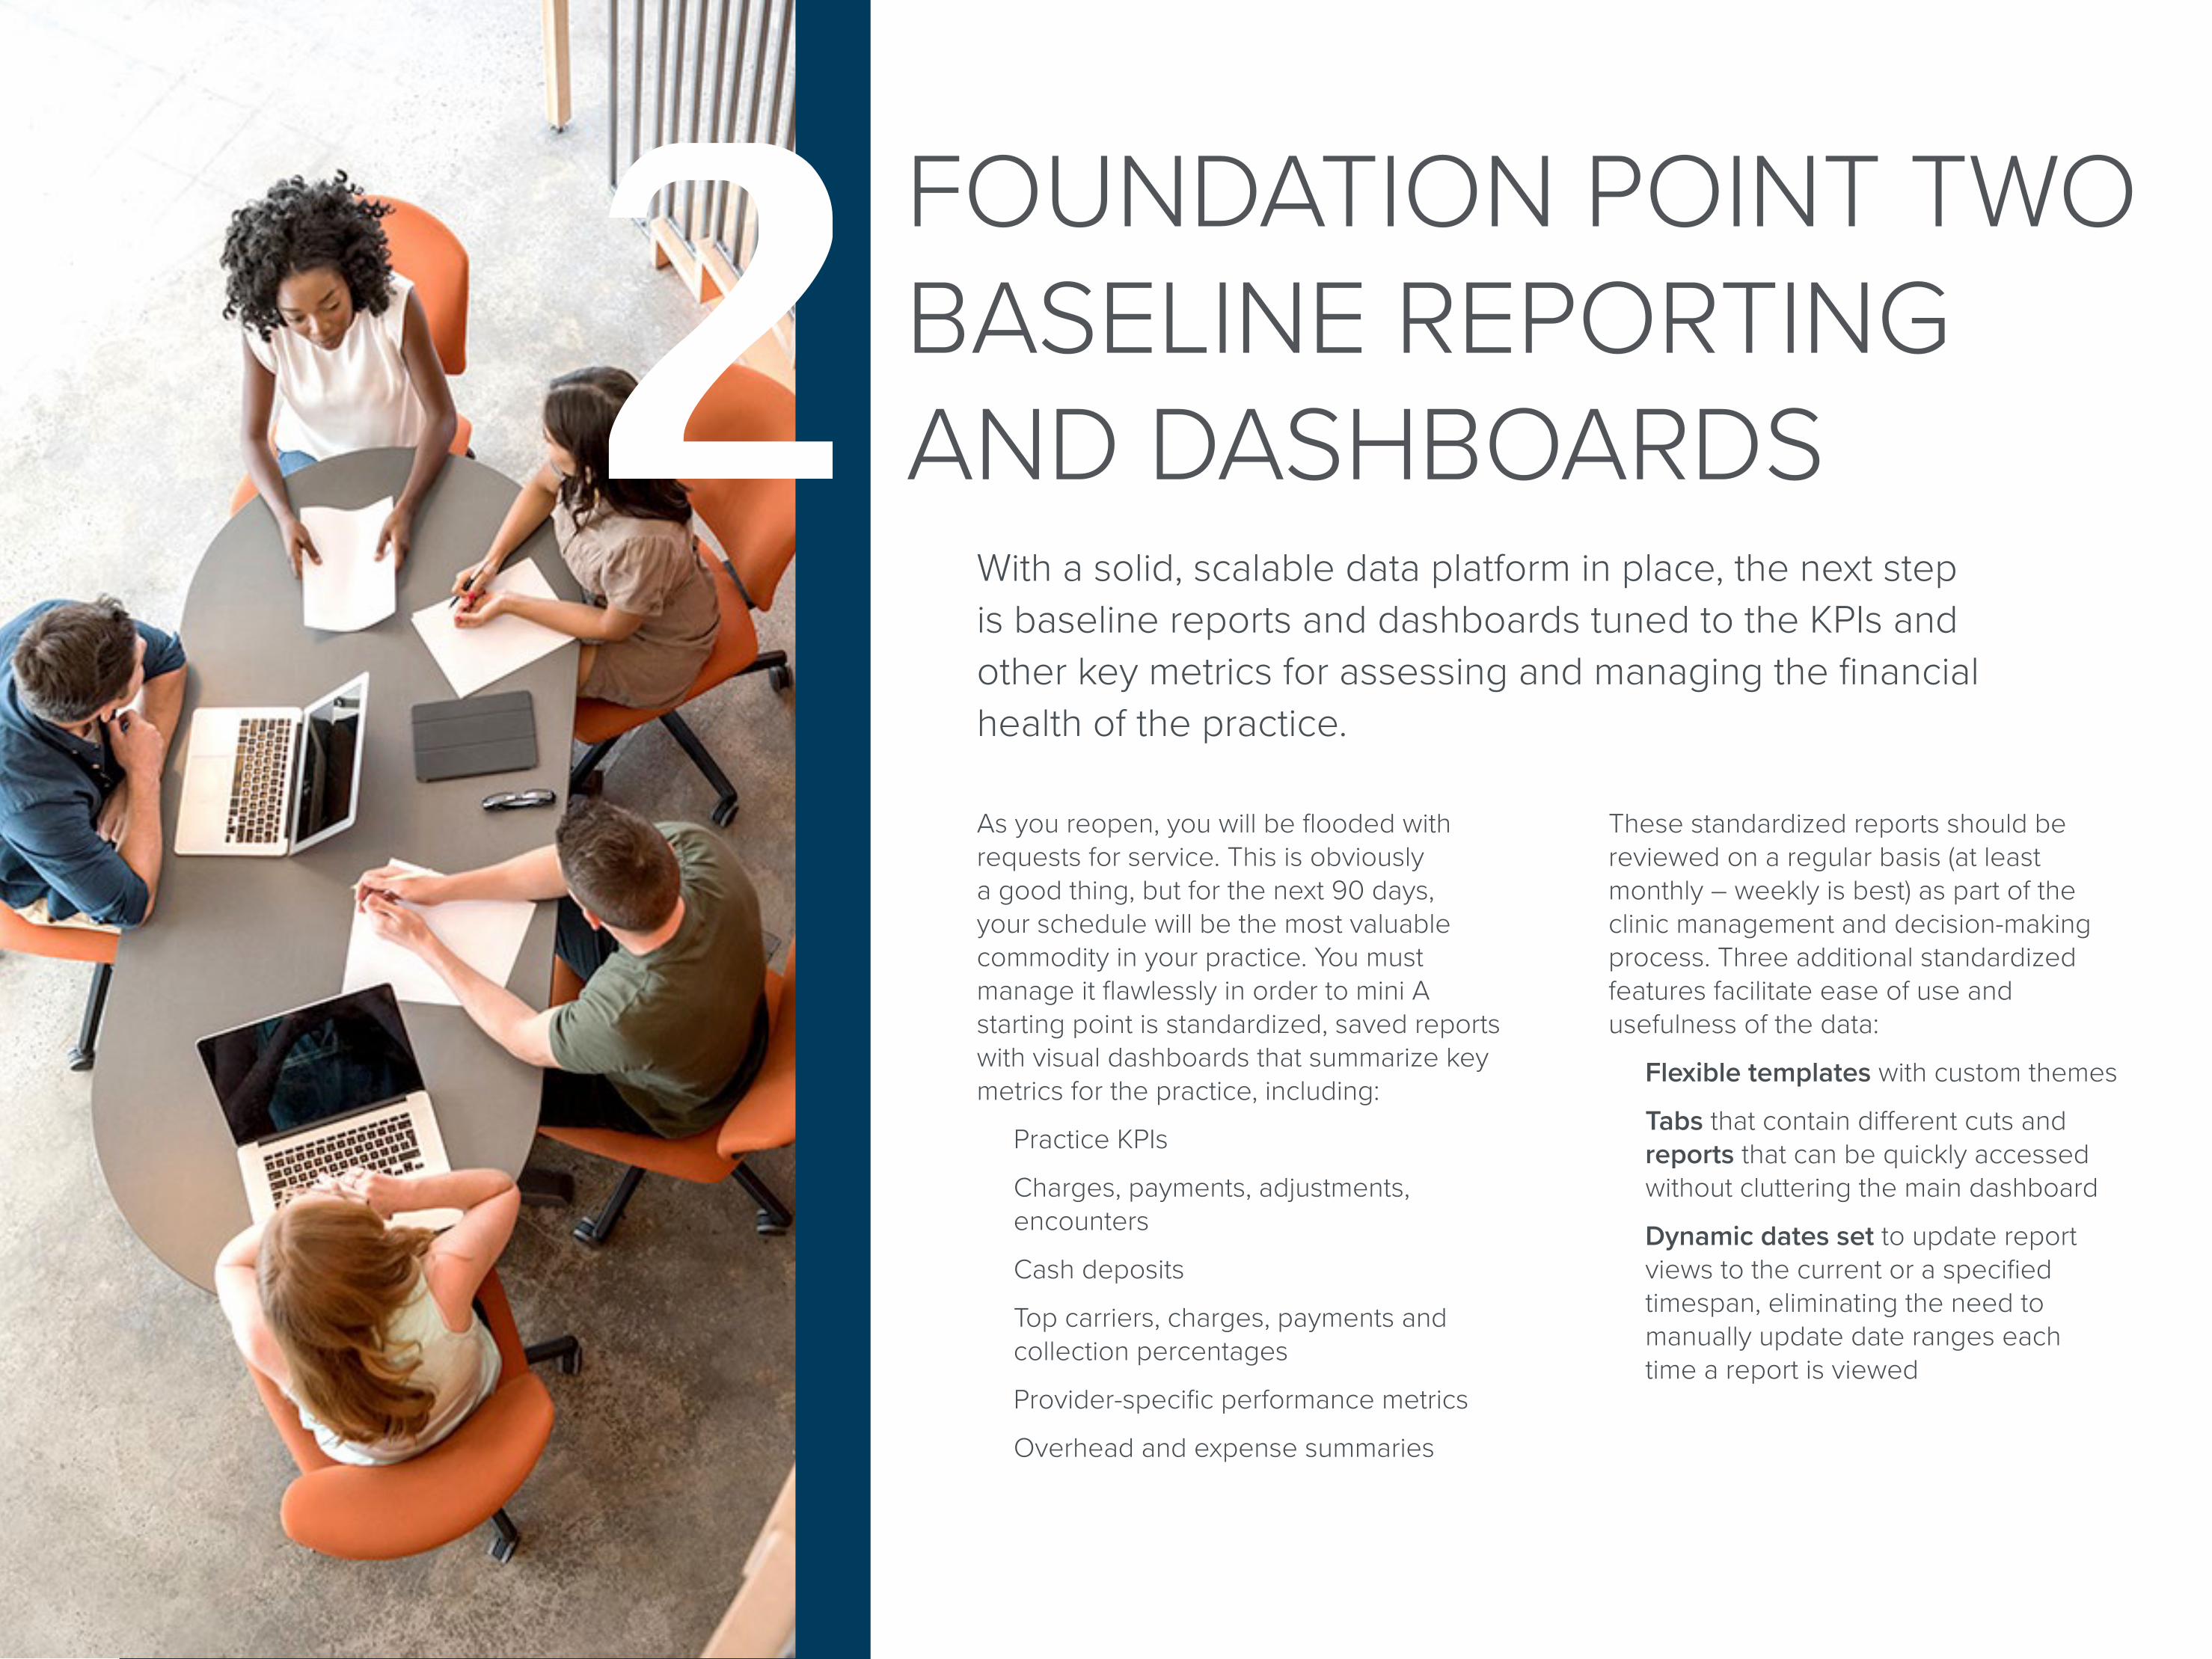
FOUNDATION POINT TWO BASELINE REPORTING AND DASHBOARDS
With a solid, scalable data platform in place, the next step is baseline reports and dashboards tuned to the KPIs and other key metrics for assessing and managing the financial health of the practice.
2
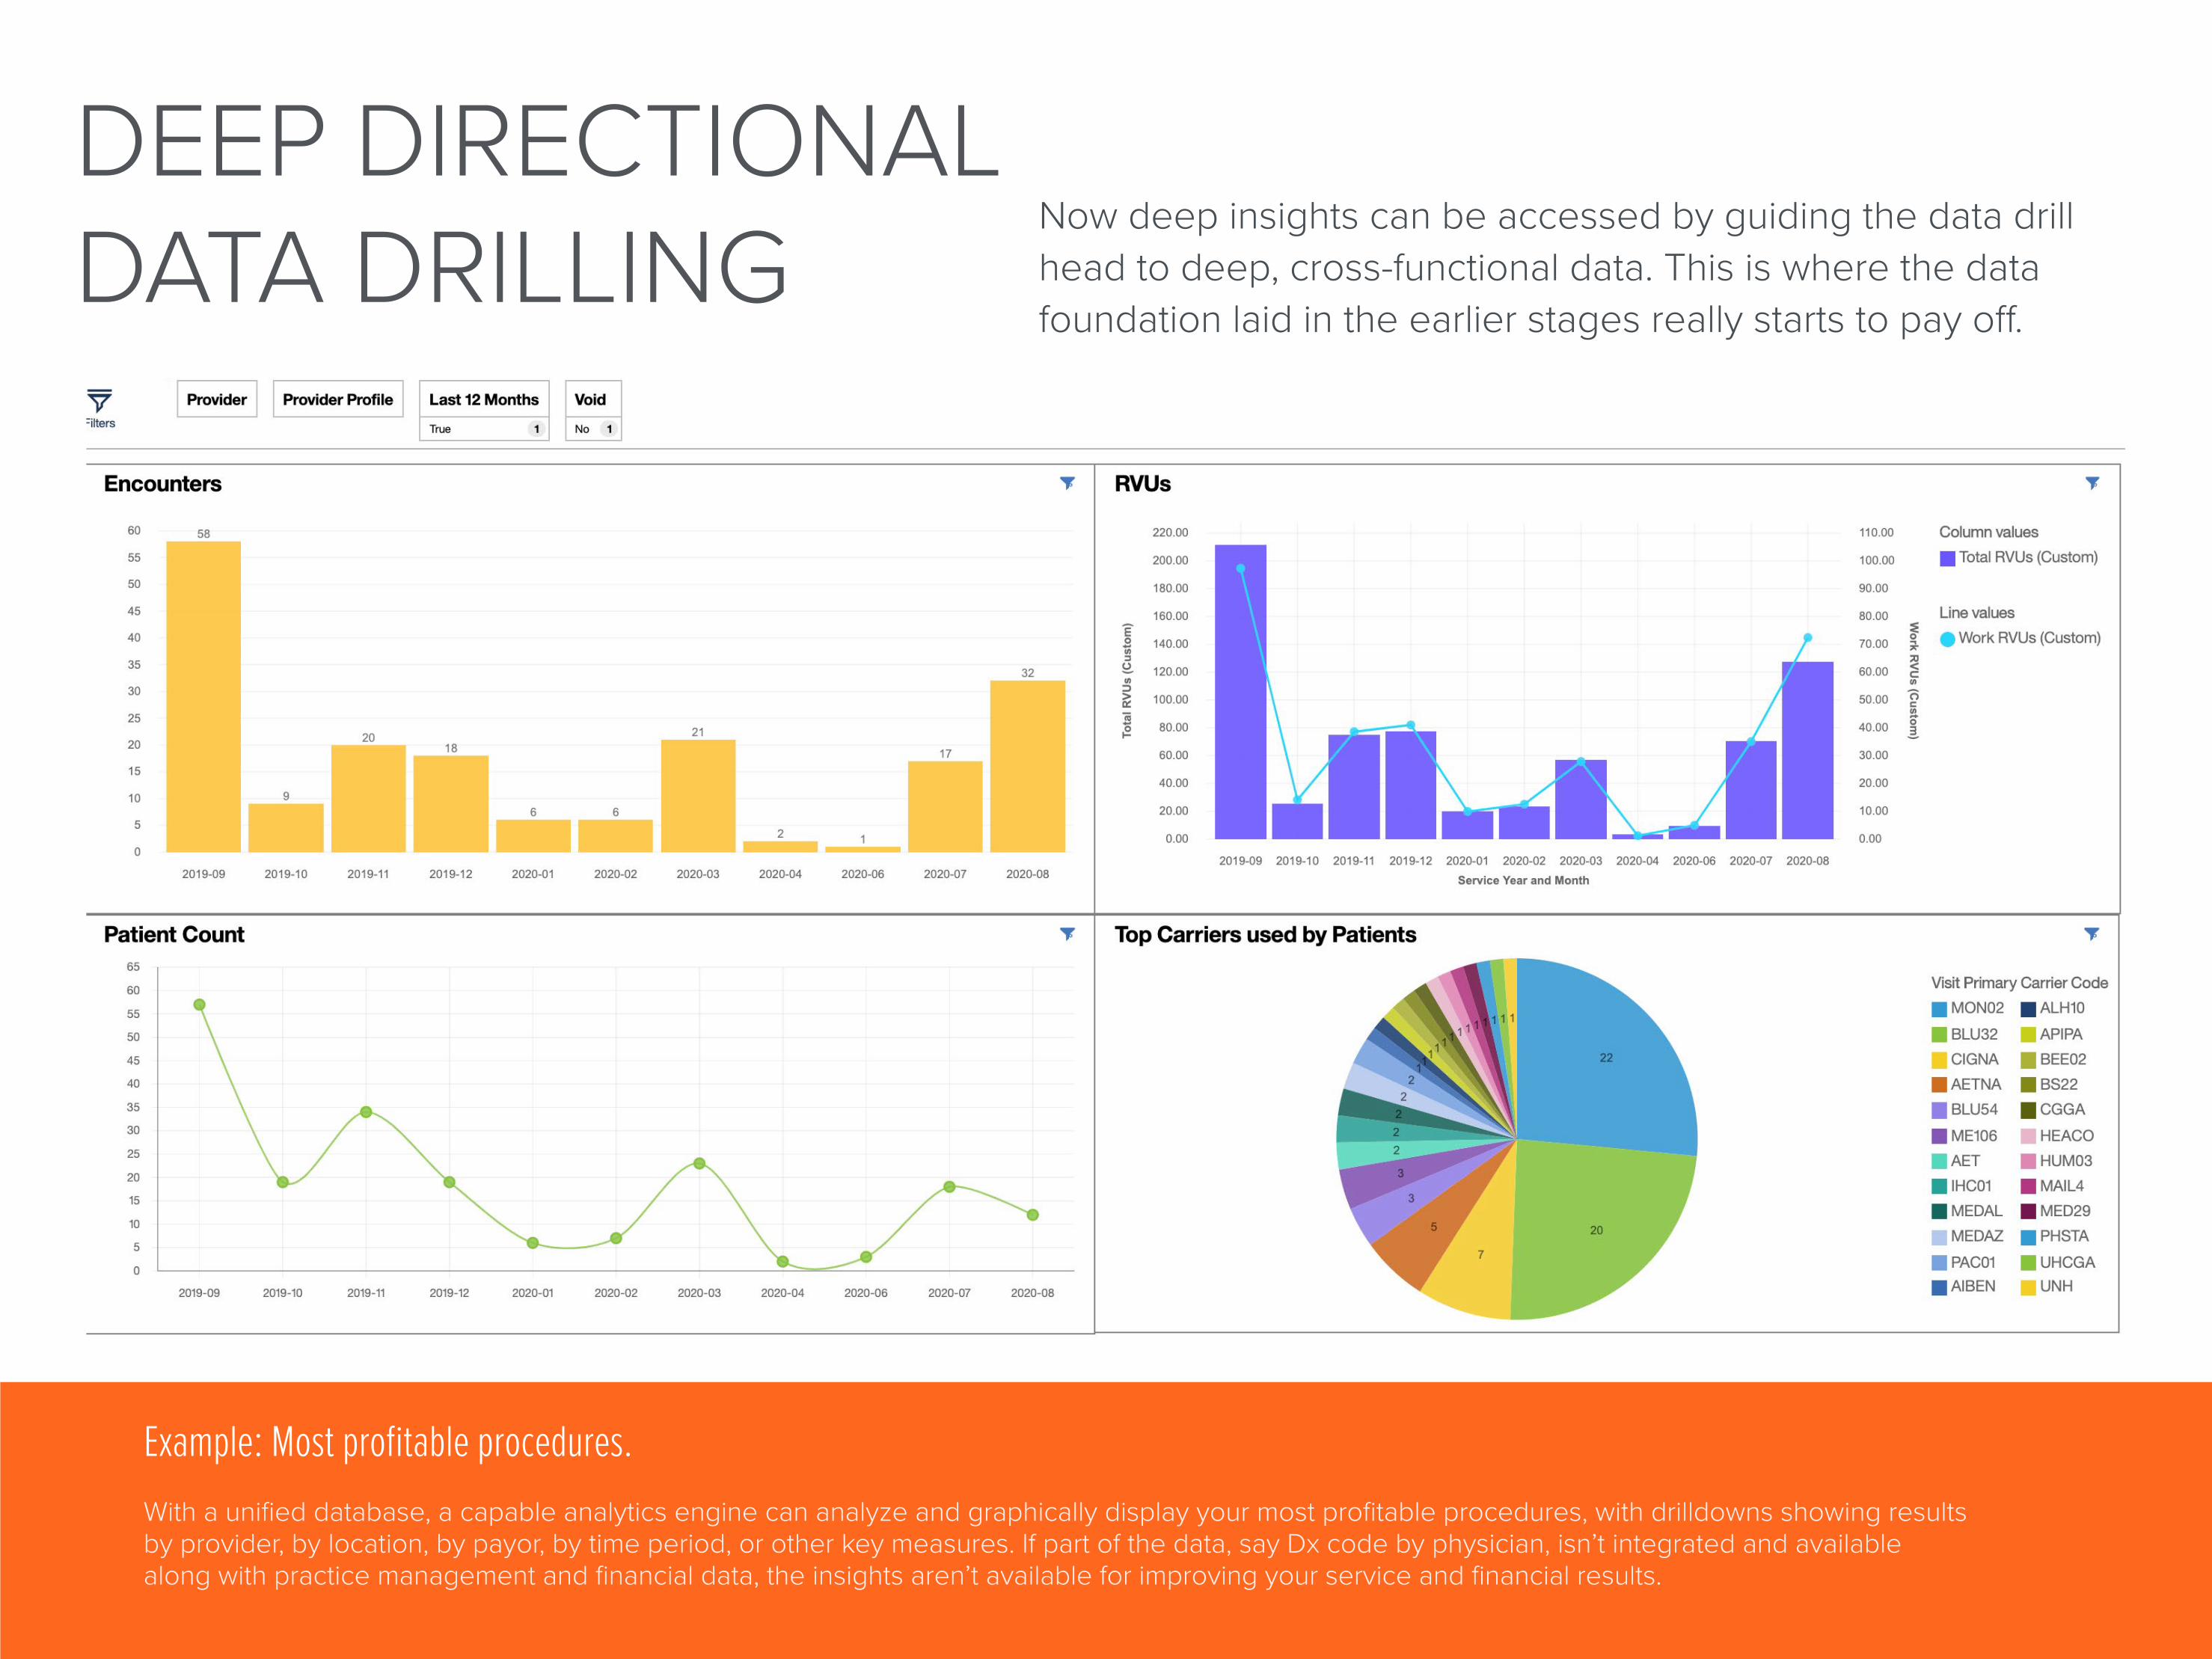
DEEP DIRECTIONAL DATA DRILLING
Now deep insights can be accessed by guiding the data drill head to deep, cross-functional data. This is where the data foundation laid in the earlier stages really starts to pay off.
Example: Most profitable procedures. With a unified database, a capable analytics engine can analyze and graphically display your most profitable procedures, with drilldowns showing results by provider, by location, by payor, by time period, or other key measures. If part of the data, say Dx code by physician, isn’t integrated and available along with practice management and financial data, the insights aren’t available for improving your service and financial results.
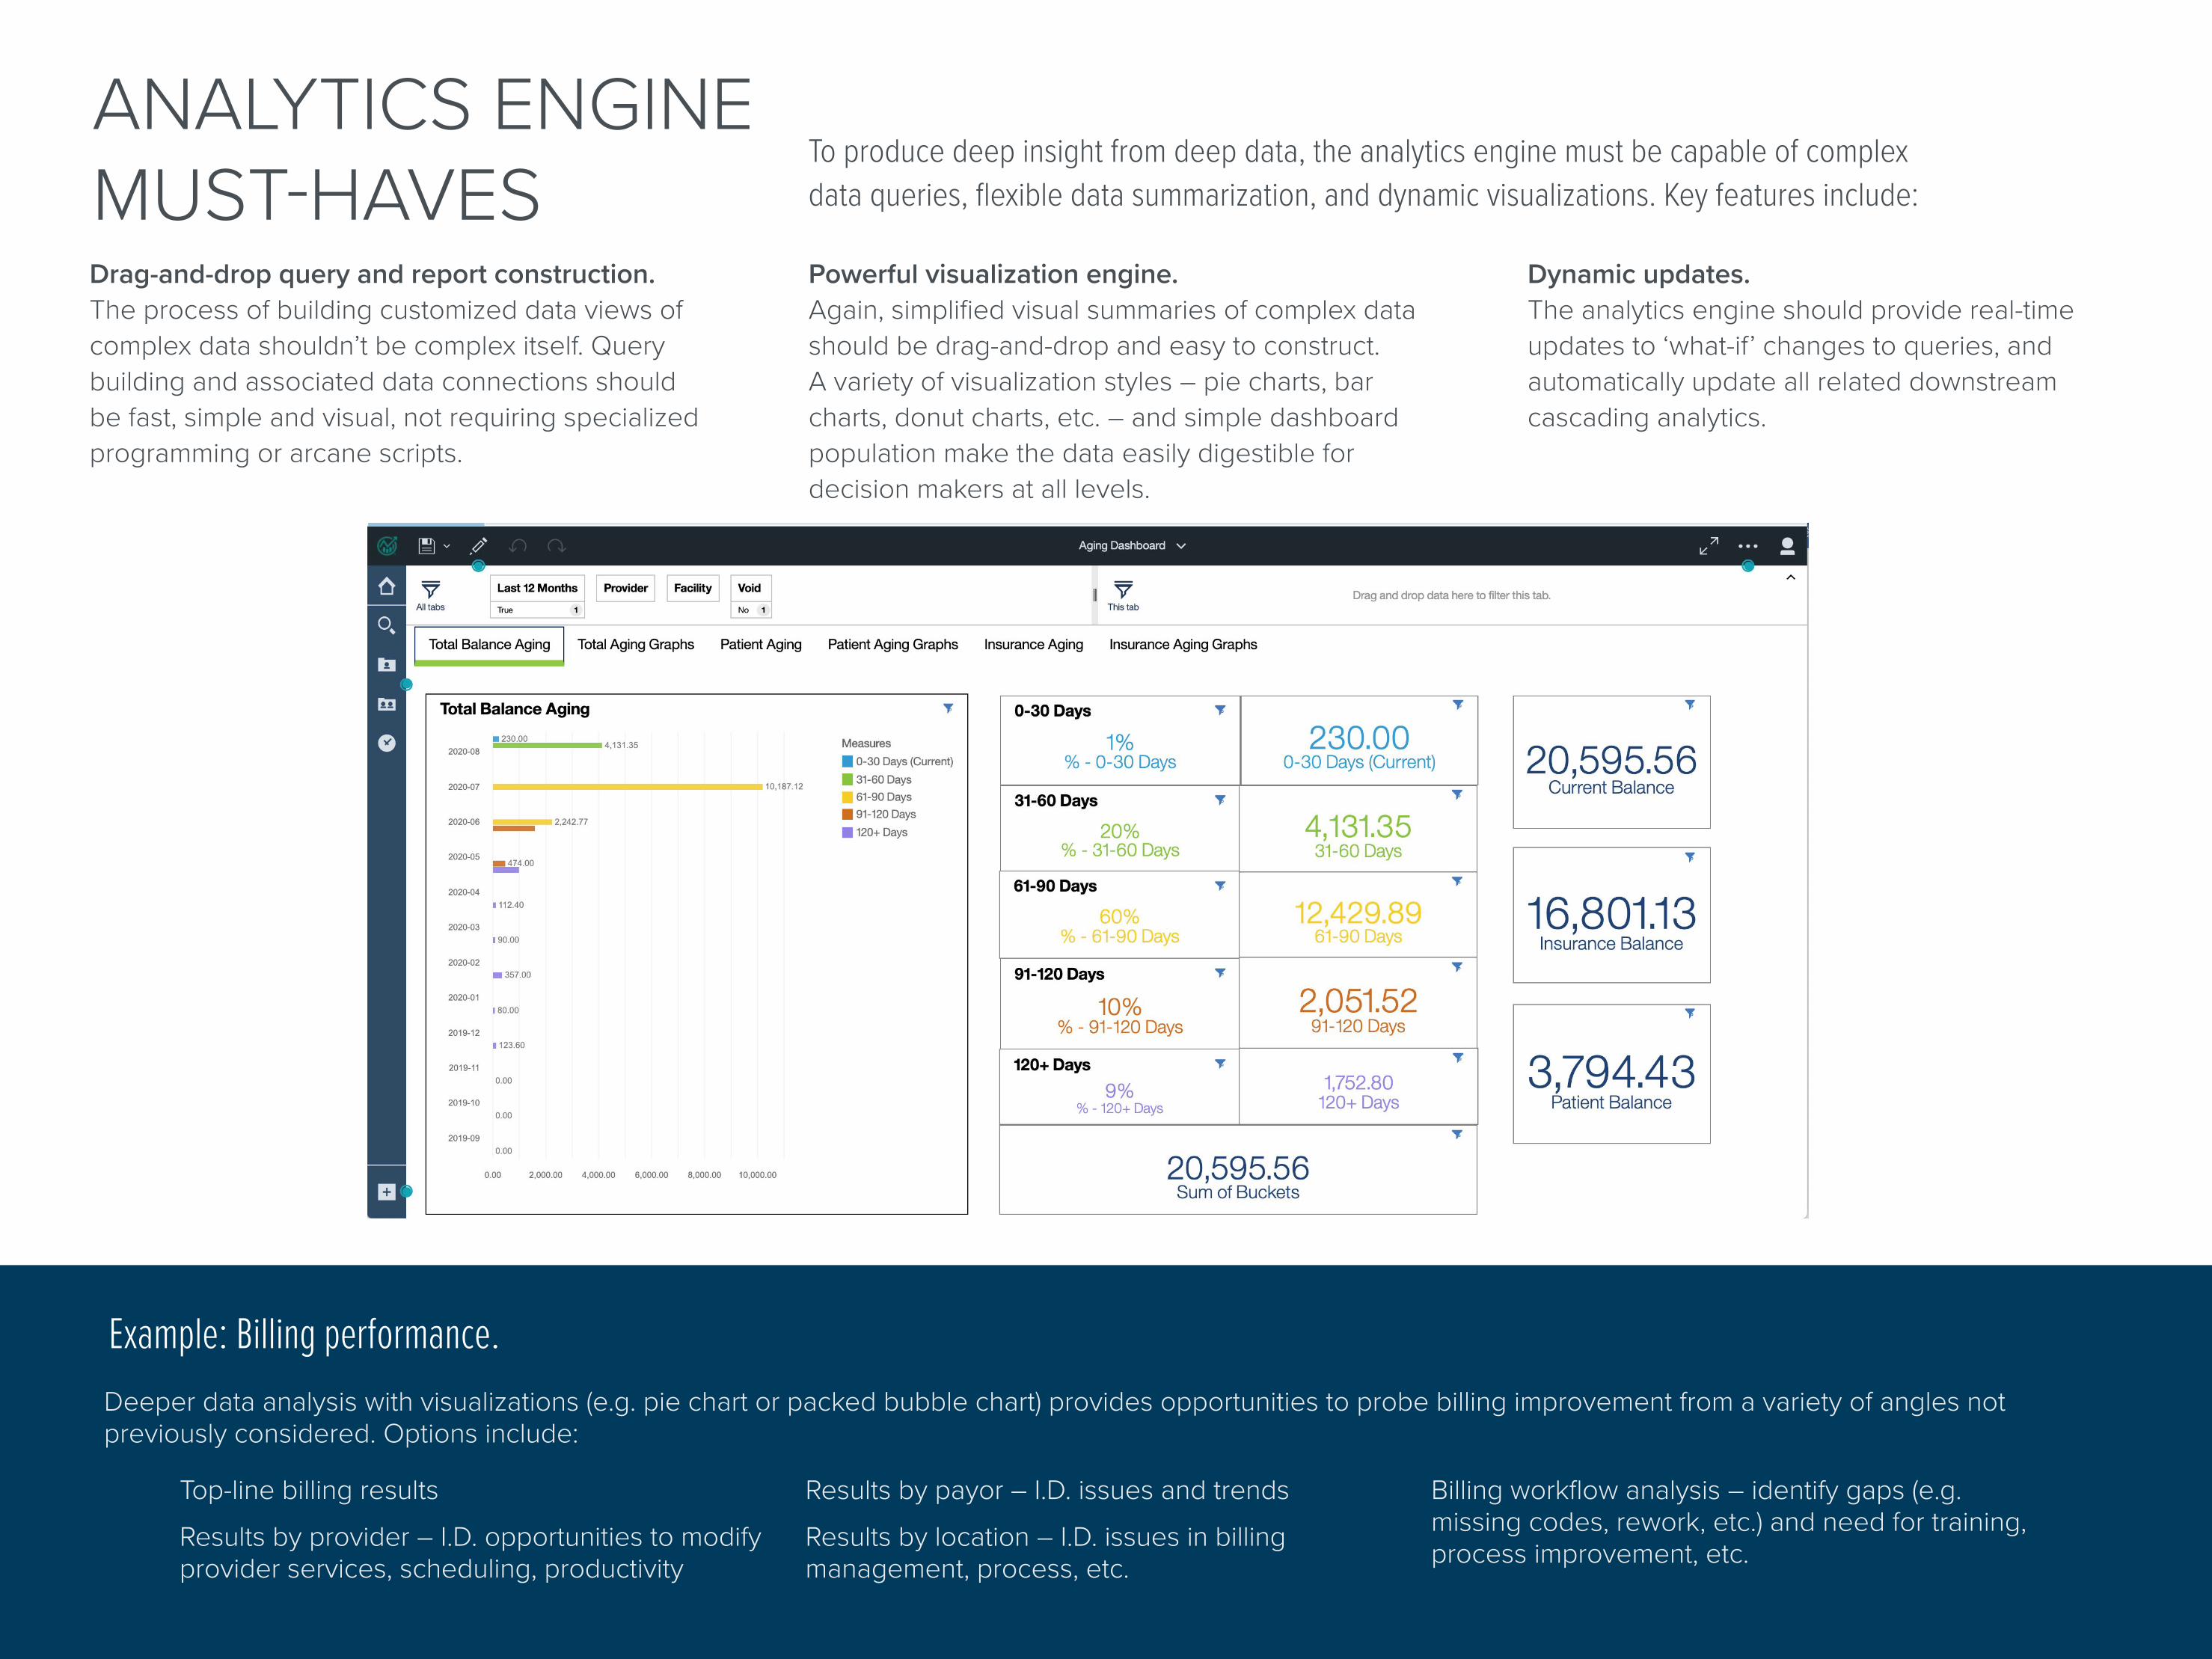
ANALYTICS ENGINE MUST-HAVES
To produce deep insight from deep data, the analytics engine must be capable of complex data queries, flexible data summarization, and dynamic visualizations. Key features include:
Drag-and-drop query and report construction. The process of building customized data views of complex data shouldn’t be complex itself. Query building and associated data connections should be fast, simple and visual, not requiring specialized programming or arcane scripts.
Powerful visualization engine. Again, simplified visual summaries of complex data should be drag-and-drop and easy to construct. A variety of visualization styles – pie charts, bar charts, donut charts, etc. – and simple dashboard population make the data easily digestible for decision makers at all levels.
Dynamic updates. The analytics engine should provide real-time updates to ‘what-if’ changes to queries, and automatically update all related downstream cascading analytics.
Example: Billing performance. Deeper data analysis with visualizations (e.g. pie chart or packed bubble chart) provides opportunities to probe billing improvement from a variety of angles not previously considered. Options include:
Top-line billing results
Results by provider – I.D. opportunities to modify provider services, scheduling, productivity
Results by payor – I.D. issues and trends
Results by location – I.D. issues in billing management, process, etc.
Billing workflow analysis – identify gaps (e.g. missing codes, rework, etc.) and need for training, process improvement, etc.

CASE STUDY 1: PHYSICIAN RVUSPractice ABC required a detailed RVU analysis for better practice financial management, improved physician compensation accuracy and clearer practice valuation for expansion plans they were considering.
However, collecting and analyzing the data for reliable RVU calculations became a challenging, manual process because of data incompatibility between internal systems.
Moving to a unified database and capable analytics engine, the practice was able to access physician work, financial, and expense data from separate
areas of the unified database to quickly and accurately calculate the three components and final rollup of RVUs, and then illustrate their potential impact. These queries were saved and rerun on demand to illustrate various ‘what-if’ scenarios, updated or modified as needed by location, provider, date range, etc.

CASE STUDY 2: TELEMEDICINE FOLLOW-UPSPractice XYZ is experimenting with telemedicine for follow-up visits after specific procedures in the office, where follow-ups don’t necessarily need to be done in-person.
Utilizing a capable analytics engine running on their unified database, they compare key indicators between in-office and telemedicine follow-up visits. Comparison points between the two include:
Percentage of no-shows (indicates which type of visit patients prefer)
Overhead cost (e.g. staff, supplies, etc.)
Reimbursement
Online scheduling usage by visit type (impact on scheduling staff)
Patient satisfaction (based on automated satisfaction surveys)
Outcomes (based on physician rating or other measure such as relapse rate, etc.)
Because the practice has access to all the necessary data, they have a complete picture of the tradeoffs including costs, reimbursement, patient satisfaction and outcomes.
SUMMARYDeep directional data drilling can yield game-changing insights for medical practices of all types. The good news is that this level of data sophistication is no longer the sole purview of large hospitals and healthcare systems.
Advanced medical practice automation systems coupled with powerful, simple-to-use analytics engines and built on unified databases offer independent practices of any size access to deep, data-driven insights at affordable price points.
No need to sit on the sidelines wondering what’s really going on inside the financial details of your practice. Updating the infrastructure and consistently pointing the data drill to the richest information may position you for 20X improvement in your decision making and practice financial management.
AdvancedInsight by AdvancedMD
AdvancedInsight is a leading-edge analytics engine that takes full advantage of the AdvancedMD unified database in order to provide the highest level of data analysis and visualization across all functions and locations in practices of all sizes and structures. The concepts and examples in this paper are indicative of the deep data drilling capability of AdvancedInsight.
Learn more about AdvancedInsight.
© 2022 AdvancedMD, Inc. All rights reserved.
advancedmd.com(800) 825-0224