Embed Size (px)
Citation preview

AM 67-15
IN-FLIGHT PHYSIOLOGICAL MONITORING OF STUDENT PILOTS
C. E. Melton, Ph. D.
Marlene Wicks
Approved by Released by
~~ J. RoBERT DILLE, M.D.
~AM) P. v. SIEGEL, M.D.
CHIEF, CIVIL AEROMEDICAL INSTITUTE FEDERAL Am SURGEON
August 1967
FEDERAL AVIATION ADMINISTRATION Office of Aviation Medicine

ACKNOWLEDGMENT
The authors would like to express their thanks to Mr. Paul Costiloe of the University of Oklahoma Medical Center Biostatistical Unit for his help with the data, to Mr. J. H. VanZant for his great patience and cooperation in his capacity as instructor on the project, to all the subjects for their willingness to serve under conditions that occasioned no little physical discomfort, and, finally, to all of the subjects' supervisors who exhibited great forbearance and understanding when their employees disappeared for many hours at a time.
Qualified requesters may obtain Aviation Medical Reports from Defense Documentation Center. The general public may purchase from Clearinghouse for Federal Scientific and
Technical Information, U.S. Dept. of Commerce, Springfield, Va. 22151

IN-FLIGHT PHYSIOLOGICAL MONITORING OF STUDENT PILOTS
I. Introduction. On an average day in the United States about
two light airplane accidents occur because of the inattention, negligence, forgetfulness, ignorance, ineptitude, or stupidity (natural or pharmacological) of the pilot.1 These ·accidents cause the deaths of an average of about two people per day. In a sense, ·all of these accidents can be attributed to training deficiencies. Either the pilot did not •absorb enough of his training, he was not presented with sufficient training, he forgot his tvaining, or he failed to reinforce his training through practice. The identification of such individuals early in their flying careers is a desirable goal.
Most studies carried out on st'!ldent pilots have emphasized their performance chavacteristics either in flight or in a laJboratory. Such studies have yielded n great ·amount of information about learning ·and how various factors affect it. However, as Smode, Hall and Meyer2 have pointed out, "Research on retention, ·as presently conceived, has reached an impasse. The same conclusions ·continue to be generated with very little additional substance added." Horowitz has dealt with anxiety ·as a deterrent to learning3 and has ~analyzed priv,a,te pilot training in terms of curriculum and instructor effectiveness4
•
He differentiates fear ·and anxiety on the basis that fear is a short term response to an identifiable threat whereas anxiety is a slowly building diffuse response. Horowitz concludes that anxiety adversely affects perception, cognitive functioning ·and motor responses and arisesprimarily in a student pilot from his uncertainties in a strange environment •and his ego involvement about how well he is performing.
Flight is ~assumed to be a stress to one degree or another in the physiological sense. While stress itself has never been adequately defined in objective terms, certain ·physiological consequences of "flight stress" are recognized. Predominant among these ··are increased heart rate, decreased skin resistance, increased pulmonary
1
ventilation, sweating, increased muscular tension, and elevated blood pressure. All of these functions are either sympathetically mediated or sympathetically affected and conform to the concept of "fight or flight." Thus, "stress of flight" might be thought of as the sum of all of the fear and anxiety-producing experiences that one undergoes.in flight. Flight stress is thought to be lessened by other factors; for example, fear and anxi~ty are reduced by experience and fa-tigue by physical conditioning.
Risk and responsibility 'apparently play a role in the ·amount of stress imposed on a pilot as judged from heart rate. Roman's studies on pilots in a two-place F-104B aircraft clearly showed that ·a change from passenger to pilot duties was accompanied by a consistent increase in heart rate5
• The increase was greater in proportion to the demands of the mission. In another st.ndy of Navy carrier pilots, Roman, Older and Jones6 found that heart rates of experienced combat pilots flying A4's on missions over South Vietnam showed peak heart rates at launch ·and recovery with the lowest values occurring during Mtual bombing runs. Other studies by Roman6 have shown that the slot man of the USAF Thunderbirds had a heart raJte higher than the average of the rest of the team (170 bpm vs. 139 bpm). High heart rates of pilots of the X-15 vehicle and the M-2 lifting body (170 and 188 bpm, respectively), as compared with pilots flying high-performance aircraft, are quoted by Roman5 •
It appears that there is a sizable and growing body of literature relative to the physiological responses of pilots operating machines so sophisticated that they are referred to as "vehicles" or "weapons systems" instead of airplanes. Not much is known, on the other hand, about the responses of the citizen, who may be near or at middle •age and more out of than in "condition." Such men, however, together with their younger and older colleagues of both sexes, make up that vast number of people who take up flying each
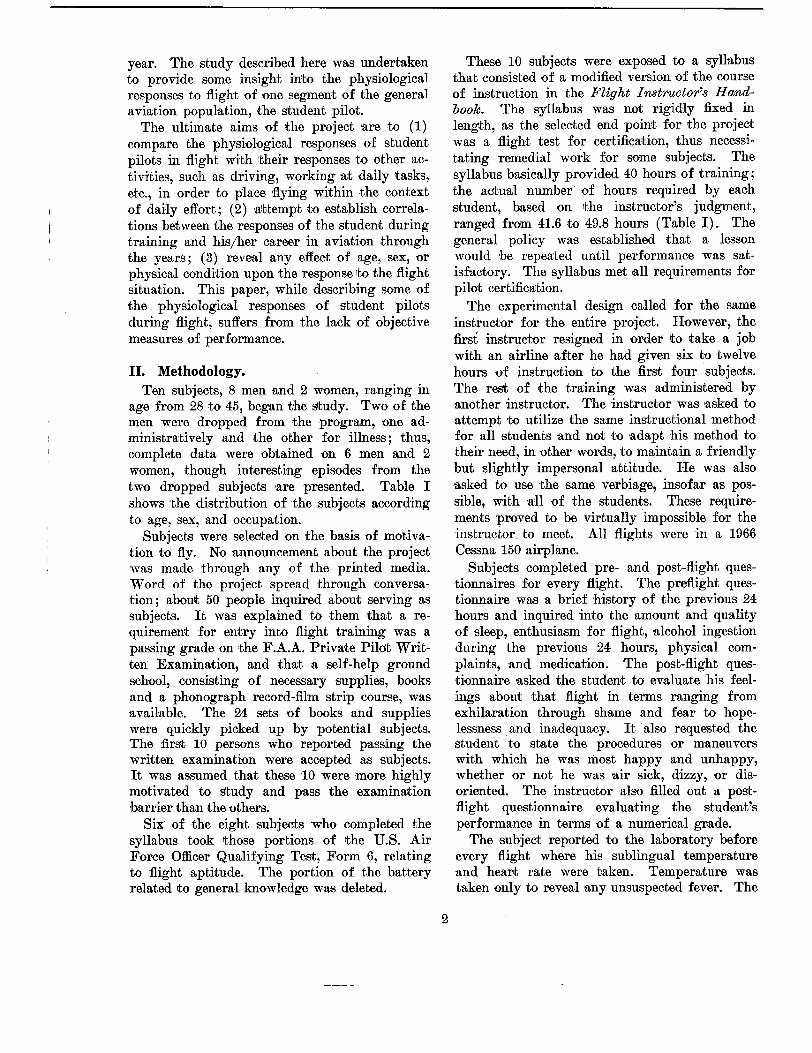
year. The study described here was undertaken to provide some insight into the physiological responses to flight of one segment of the general aviation population, the student pilot.
The ultimate aims of the project ·are to (1) compare the physiological responses of student pilots in flight with their responses to other activities, such as driving, working at daily tasks, etc., in order to place flying within the context of daily effort; (2) ·a!ttempt to establish correlations batween the responses of the student during training and hisjher career in aviation through the years; (3) reveal any effect of age, sex, or physical condition upon the response 1to the flight situation. This paper, while describing some of the physiological responses of student pilots during flight, suffers from the lack of objective measures of performance.
II. Methodology. Ten subjects, 8 men and 2 women, ranging in
age from 28 to 45, began the study. Two of the men were dropped from the program, one administratively and the other for illness; thus, complete data were obtained on 6 men and 2 women, though interesting episodes from the two dropped subjects ·are presented. Table I shows the distribution of the subjects according to age, sex, and occupation.
Subjects were selected on the basis of motivation to fly. No announcement about the project was made through any of the printed media. Word of the project spread through conversation ; ·abou1t 50 people inquired about serving as subjects. It was explained to them that a requirement for entry into flight training was a passing grade on the F.A.A. Private Pil(jt Written Examination, and that a self-help ground school, consisting of necessary supplies, books and a phonograph record-film strip course, was available. The 24 sets of books and supplies were quickly picked up by potential subjects. The first 10 persons who reported passing the written examination were accepted as subjects. It was assumed that these 10 were more highly motivated to study and pass the examination harrier than the others.
Six of the eight subjects who completed the syllabus took those portions of the U.S. Air Force Officer Qualifying Test; Form 6, relating to flight aptitude. The portion of the battery related to general knowledge was deleted.
2
These 10 subjects were exposed to a syllabus that consisted of a modified version of the course of instruction in ·the Flight Instructor's Handbook. The syllabus was not rigidly fixed in length, as the selected end point for the project was a flight test for certification, thus necessitating remedial work for some subjects. The syllabus basically provided 40 hours of training; the actual number of hours required by each student, based on the instructor's judgment, ranged from 41.6 to 49.8 hours (Table I). The general policy was established that a lesson would be repea:ted until performance was satisfactory. The syllabus met ;all requirements for pilot certification.
The experimental design called for the sam6 instructor for the entire project. However, the first instructor resigned in order to take a job with an airline after he had given six to twelve hours of instruction to the first four subjects. The rest of the training was administered by another instructor. The instructor was ·asked to attempt to utilize the same instructional method for all students and not to adapt his method to their need, in other words, to maintain a friendly but slightly impersonal a·ttitude. He was also asked to use the same verbiage, insofar as possible, with all of the students. These requirements proved to be virtually impossible for the instructor to meet. All flights were in a 1966 Cessna 150 airplane.
Subjects completed pre- and post-flight questionnaires for every flight. The preflight questionnaire was a brief history of the previous 24 hours and inquired into the amount and quality of sleep, enthusiasm for flight, ·alcohol ingestion during the previous 24 hours, physical complaints, and medication. The post-flight questionnaire ·asked the student to evaluate his feelings about that flight in terms ranging from exhilaration through shame ·and fear to hopelessness and inadequacy. It also requested the student to state the procedures or maneuvers with which he was most happy and unhappy, whether or not he was air sick, dizzy, or disoriented. The instructor also filled out a postflight questionnaire evaluating the student's performance in terms of a numerical grade.
The subject reported to the laboratory before every flight where his sublingual temperature and heart rate were taken. Temperature was taken only to reveal ·any unsuspected fever. The

~
TABLE I
DESCRIPTION OF SUBJECTS
Subject S611JfAge Occupation
A* M/37 Biochemist
B M/38 Altitude Chamber Technician
1 F/29 Biological Lab-oratory Tech.
2 M/36 Biological Lab. Tech.
3 M/37 Avionics Tech.
4 F/28 Office Mgr.
5t M/32 Physiologist
6* M/44 Physiologist
7 M/34 Eng. Tech.
8 M/45 Eng. Tech.
• Has since completed fiight training. •• Re-examination grade in parentheses.
Written Aptitude Ea:am. Grade Test Grade
% %
96 -82 35
72 25
68 (92)** 45
86 -
82 1
92 80
80 15
72
72 65
*** Cessna 150, power failure on final approach. Successful landing in wheat field. t Failed oral phase of flight test, passed on re-examination. * Failed simulated flight test, received 6 hours of dual and passed.
Hours To Com-pZete Course
Medically dropped
Administratively dropped
44.8
49.8
42.5
44.3
43.5
46.3
42.5
41.6
Hrs. FZown Incidents/ PiZot's
Since Course Acciden1 Certificate Since Oour e Grantea
- - -
- - -
20.8 - Yes
6.7 Forced Land- Yes ing***
11.0 - No
66.4 - Yes
6.0 - Yes
36.0 - Yes
0 ~ Yes
0 - No
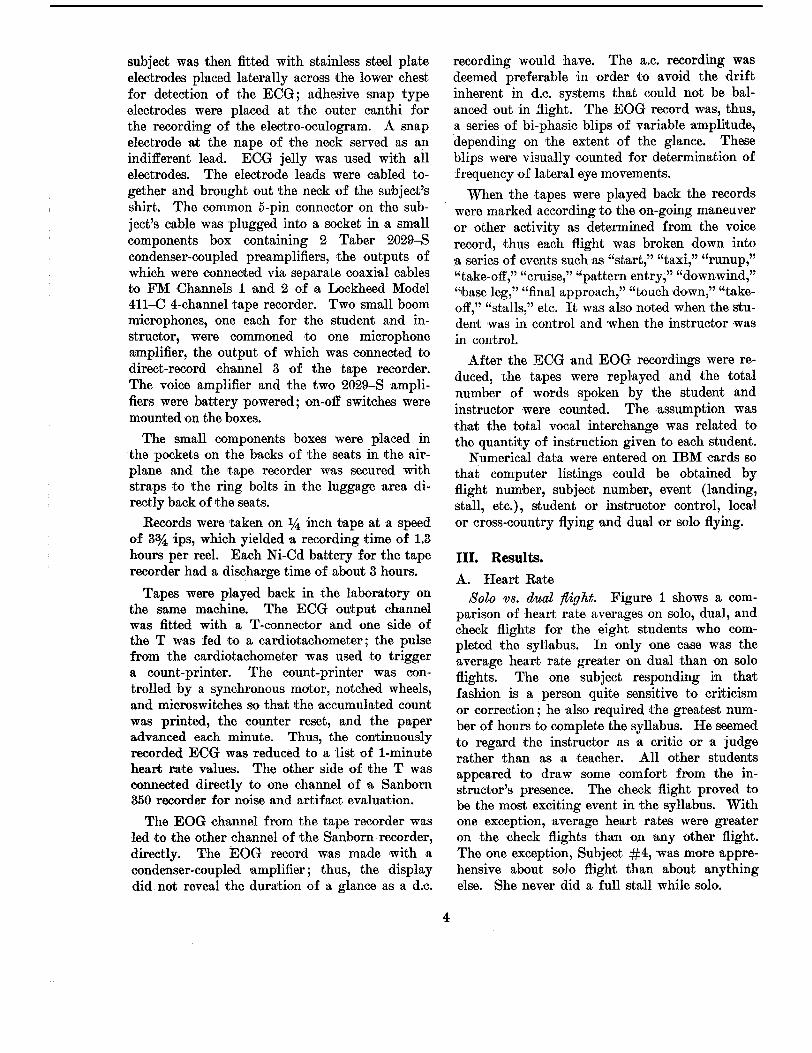
subject was then fitted with stainless steel plate electrodes placed laterally across the lower chest for detection of the ECG; adhesive snap type electrodes were placed at the outer canthi for the recording of the electro-oculogram. A snap electrode at the nape of the neck served as an indifferent lead. ECG jelly was used with all electrodes. The electrode leads were cabled together and brought out the neck of the subject's shirt. The common 5-pin connector on the subject's cable was plugged into a socket in a small components box containing 2 Taber 2029-S condenser-coupled preamplifiers, the outputs of which were connooted via separate coaxial cables to FM Channels 1 ·and 2 of a Lockheed Model 411-C 4-channel tape recorder. Two small boom microphones, one each for the student and instructor, were commoned to one microphone amplifier, the output of which was connected to direct-record channel 3 of the tape recorder. The voice amplifier and the two 2029-S amplifiers were battery powered; on-off switches were mounted on the boxes.
The small components boxes were placed in the pockets on the backs of the seats in the airplane and the tape recorder was secured with straps to the ring bolts in the luggage •area directly back of 1the seats.
Records were taken on 1.4 inch tape at a speed of 33,4 ips, which yielded a recording time of 1.3 hours per reel. Each Ni-Cd battery for the tape recorder had a discharge time of about 3 hours.
Tapes were played back in the laboratory on the same machine. The ECG output channel was fitted with a T -connector and one side of the T was :fed to a cardiotachometer; the pulse from the cardiotachometer was used to trigger a count-printer. The count-printer was controlled by a synchronous motor, notched wheels, and microswitches so that 1the accumulated count was printed, the counter reset, and the paper a.dvanced each minute. Thus, the continuously recorded ECG was reduced to a list of 1-minute heart rate values. The other side of the T was connected directly to one channel of •a Sanborn 350 recorder for noise and artifact evaluation.
The EOG channel from the tape recorder was led to the other channel of the Sanborn recorder, directly. The EOG record was made with a condenser-coupled •amplifier; thus, the display did not reveal the duration of a glance as a d.c.
4
recording would have. The a.c. recording was deemed preferable in order to avoid the drift inherent in d.c. systems that could not be balanced out in .3ight. The EOG record was, thus, a series of hi-phasic blips of variable amplitude, depending on the extent of the glance. These blips were visually counted for determinrution of frequency of lateral eye movements.
When the tapes were played back the records were marked according to the on-going maneuver or other activity as determined from the voice record, thus each flight was broken down into a series of events such as "sbart," "taxi," "runup," "take-off," "cruise," "pattern entry," "downwind," "base leg," "final approach," "touch down," "takeoff," "stalls," etc. It was also noted when the student was in control and when the instructor was in control.
After the ECG and EOG recordings were reduced, the tapes were replayed and the total number of words spoken by the student and instructor were counted. The assumption was that the total vocal interchange was related to the quantity of instruction given to each student.
Numerical data were entered on IBM cards so that computer listings could be obtained by flight number, subject number, event (landing, stall, etc.), student or instructor control, local or cross-country flying and dual or solo flying.
III. Results. A. Heart Rate
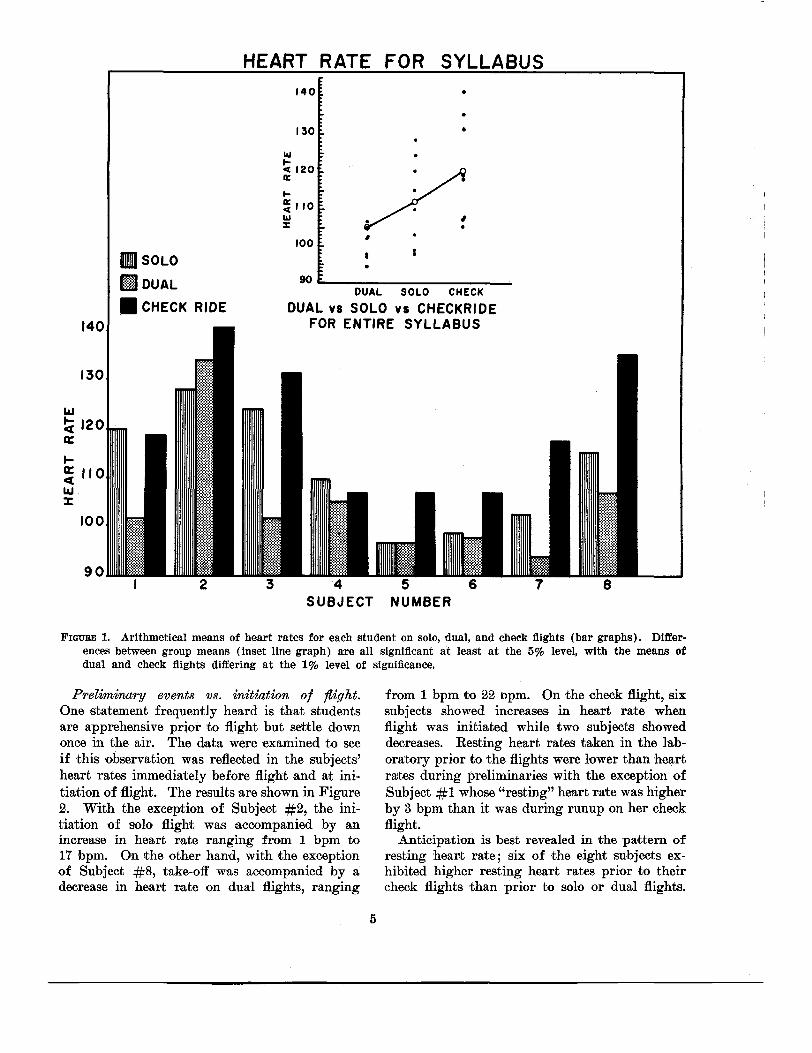
Solo vs. dual flight. Figure 1 shows a comparison of heart rate averages on solo, dual, and check flights for the eight students who completed the syllabus. In only one case was the average heart rate greater on dual than on solo flights. The one subject responding in that fashion is a person quite sensitive to criticism or correction; he also required the greatest number of hours to complete the syllabus. He seemed to regard the instructor as a critic or a judge rather than as a teacher. All other students appeared to draw some comfort from the instructor's presence. The check flight proved to be the most exciting event in the syllabus. With one exception, average heart rates were greater on the check flights than on ·any other flight. The one exception, Subject #4, was more apprehensive about solo flight than about anything else. She never did a full stall while solo.
HE RATE FOR SYLLABUS
1&.1 ....
140
130
"' 120 0::
1-
~ 110 1&.1 :z:
100 ,
II SOLO
II DUAL ~~----------------------DUAL SOLO CHECK
• CHECK RIDE 140
DUAL vs SOLO vs CHECKRIDE FOR ENTIRE SYLLABUS
130
~ 0::11 <( L&J ::1:
2 3 4 SUBJECT
5 NUMBER
6 7 8
FIGURE 1. Arithmetical means of heart rates for each student on solo, dual, and check flights (bar graphs). Differences between group means (inset line graph) are all significant at least at the 5% level, with the means of dual and check flights differing at the 1% level of significance.
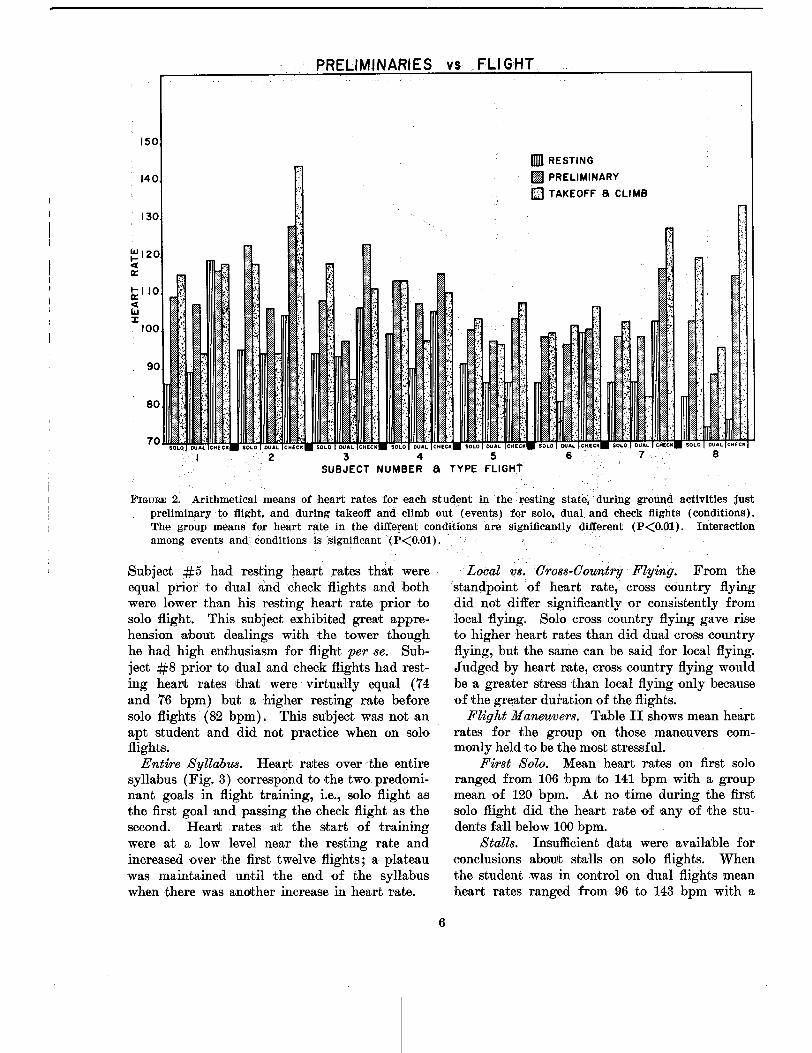
Preliminary events vs. initiation of flight. One statement frequently heard is that students are apprehensive prior !to flight but settle down once in the air. The data were examined to see if this observation was refleoted in the subjects' heart rates immediately before flight and at initiation of 'flight. The results are shown in Figure 2. With the exception of Subjoot #2, the initiation of solo flight was accompanied by an increase in heart rate ranging from 1 bpm to 17 bpm. On the other hand, with the exception of Subject #8, take-off was accompanied by a decrease in heart rate on dual flights, ranging
5
from 1 bpm to 22 bpm. On the check flight, six subjects showed increases in heart rate when flight was initiated while two subjects showed decreases. Resting heart rates taken in the laboratory prior to the flights were lower than heart rwtes during preliminaries with the exception of Subject #1 whose "resting" heart rate was higher by 3 bpm than it was during runup on her check flight.
Anticipation is best revealed in the pa;ttem of resting heart rate; six of the eight subjects exhibited higher resting heart rates prior to their check flights than prior to solo or dual flights.
ELIMINARIES vs FLIGHT
150
140
lr 110 ~ w ::1:
100
90
80
70
II RESTING
I) PRELIMINARY
[,) TAKEOFF a CLIMB
2 3 4 5 SUBJECT NUMBER a TYPE FLIGHT
FIGURE 2. Arithmetical means of heart rates for each student in the· resting state, during ground activities just preliminary to flight, and during takeoff and climb out (events) for solo, dual and check flights (conditions). The group means fo,r heart rate in the different conditions are significantly different (P<O.Ol). Interaction among events and. conditions is ·significant (P<O.Ol).
Subject #5 had resting heart rrutes that were equal prior to dual and check flights and both were lower than his resting heart rate prior to solo flight. This subject exhibited great apprehension about dealings with the tower though he had high enthusiasm for flight per se. Su.bject #8 prior to dual and check flights had resting heart rates that were virtually equal (74 and 76 bpm) but a higher resting rate before solo flights (82 bpm). This subject was not an apt student and did not practice when on solo flights.
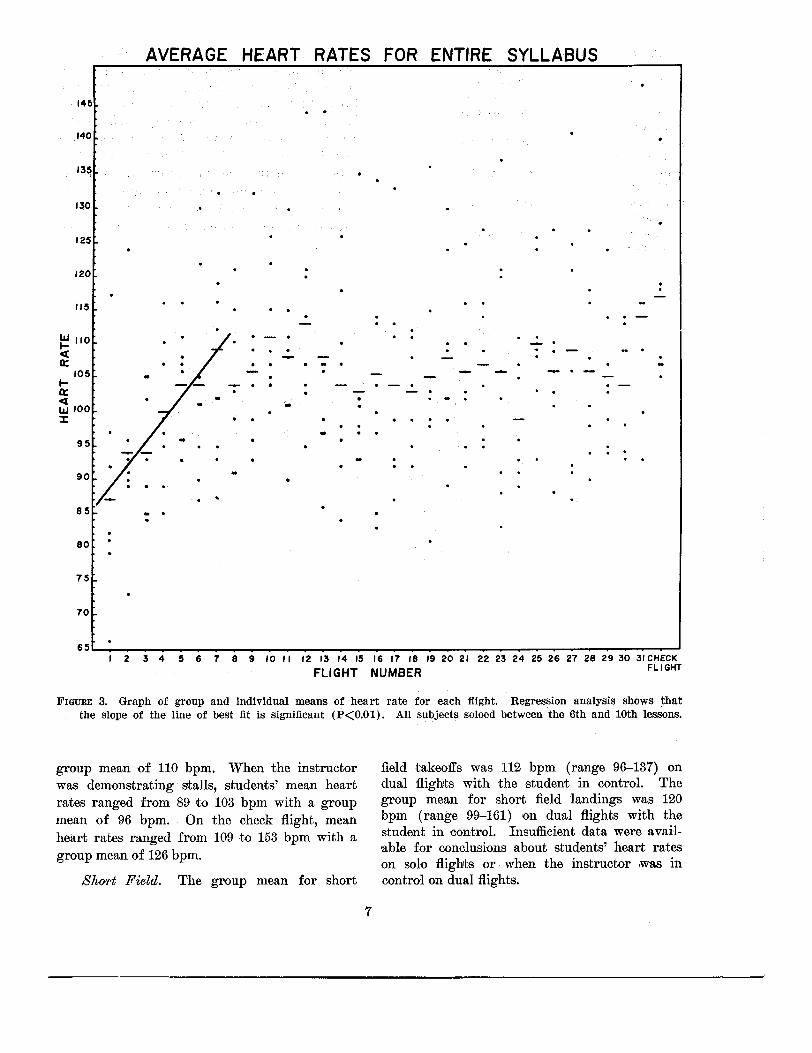
Entire Syllabus. Heart rrutes over ·the entire syllabus (Fig. 3) correspond to the two predominant goals in flight training, i.e., solo flight as the first goal and passing the check flight as the second. Heart rates ·at the start of training were at a low level near the resting rate and increased over the first twelve flights; a plateau was maintained until the end of the syllabus when there was another increase in heart rate.
6
Local vs. Oross-Oountry Flying. From the standpoint of heart rate, cross country flying did not differ significantly or consistently from local flying. Solo cross country flying gave rise to higher heart rates than did dual cross country flying, but the same can be said for local flying. Judged by heart rate, cross country flying would be a greater stress than local flying only because of the greater duration of the flights.
Flight Maneuvers. Table II shows mean heart rates for the group on those maneuvers commonly held to be the most stressful.
First Solo. Mean heart rates on first solo ranged from 106 bpm 1to 141 bpm with a group mean of 120 bpm. · At no time during the first solo flight did the heart rate of 'any of the students fall below 100 bpm.
Stalls. Insufficient data were available for conclusions about stalls on solo flights. When the student was in control on dual flights mean heart rates ranged from 96 to 143 bpm with a
AVERAGE HEART RATES FOR ENTIRE SYLLABUS
145
,140
135
130
125
120
115
LIJ 110 1-~ 0:
105 1-0: ~ LIJ 100 :I:
95
90
80
75
70
- . .
. . . - . . . .
- .. . •
. . .
. - .
-.
. .
I 2 3 4 5 6 7 8 9 10 II 12 13 14 15 16 17 18 19 20 21 22 23 24 25 26 27 28 29 30 31 CHECK
FLIGHT NUMBER FLIGHT
FIGURE 3. Graph of group and individual means of heart rate for each flight. Regression analysis shows that the slope of the line of best fit is significant (P<O.Ol). All subjects soloed between the 6th and lOth lessons.
group mean of 110 bpm. When the instructor was demonstrating stalls, students' mean heart rates ranged from 89 to 103 bpm with a group mean of 96 bpm. On the check flight, mean heart rates ranged from 109 to 153 bpm with •a group mean of 126 bpm.
Short Field. The group mean for short
7
field takeoffs was 112 bpm (range 96-137) on dual flights with the student in control. The group mean for short field landings was 120 bpm (range 99-161) on dual flights with the student in control. Insufficient data were avail·able for conclusions about students' heart rates on solo flights or when the instructor .was in control on dual flights.

TABLE II. Heart Rates During Various Events.
Maneuver
1st Solo
Stalls (Student)
Stalls (Instructor)
Stalls (Check)
Short Field Takeotis
Short Field Landings
Group Mean-bpm
120 (106-141)
110 ( 96-143)
96 ( 89-103)
126 (109-153)
112 ( 96-137)
120 ( 99-161)
Table III shows the event and condition (solo, dual, or check) during which the maximum and minimum heart rate during the syllabus occurred. Five subjects had maximum heart rates on short field landings, others on ordinary landings and one during stalls. Three of the maximums occurred on the· check flight, 3 on duals, and 2 on solos. All of the minimum heart rates were recorded on dual flights and all during fairly mild maneuvers; ~t is not known how low the simulated emergency was ca.rried nor into what kind of field.
TABLE III. Maximum and Minimum Heart Rates For Each Subject By Event.
Subject Mamimum Evtmt Min. Evtmt
1 156 Solo- 83 Dual Simulated Short Field Landings Emergency
2 174 Dual- 106 Dual Stalls Short Field Touch & Go with Hood On
3 149 Solo- 86 Takeoti-dual Short Field Landing
4 121 Dual- 88 Dual, Turns Short Field Landing
5 114 Check Flight- 51 Dual, Stalls-Short Field Landings
6 119 Landings, dual 71 Climbs, dual
7 127 Takeotis, & Stalls- 82 Glides-Ta1teotis Check Flight dual
8 166 Landings-Check Flight 77 Preliminaries dual
B. Eye Movement. The records of eye movements were charac
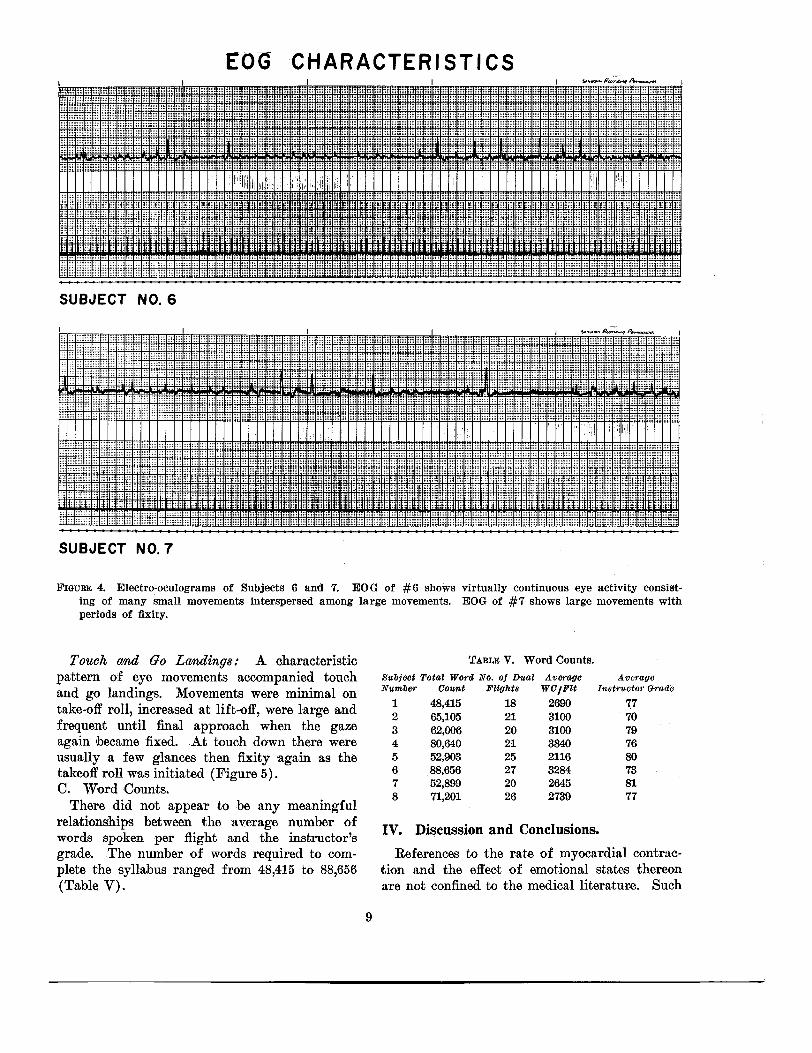
teristic for each subject, though in ·an undefinable way just as handwriting is characteristic for 'an individual. When the tapes were being played 'back an experienced observer could look at the record ·and identify the subject from whom it was taken. Segments of those records are shown for two subjects in Figure 4.
TABLE IV. Eye Movements (Movements Per Minute) On Local and Cross Country Flights
Table IV shows eye movement frequencies (movements ·per minute) on local and cross country flights. There is a slight, though consistent, tendency for the eye movement frequency to be higher yet on cross country than on local flights.
8
Subject
1
2 3
4
5
6
7
8
Average
Local
Solo Duaz
102.6
76.2
101.4
75.0 105.6
91.2
85.8
79.8
89.'i
98.4
69.6
96.0
78.0 91.2
85.2
86.4
79.8
85.6
Oross Country SoZo Duaz
118.2
78.6
126.0
89.4 105.6
120~6
91.2
81.6
101.4
110.4
90.6
108.0
95.4
76.2
82.8
100.2
61.8
90.7
EOG CHARACTERISTICS
SUBJECT NO. 6
SUBJECT NO.7
FIGURE 4. Electro-oculograms of Subjects 6 and 7. EOG of #6 shows virtually continuous eye activity consisting of many small movements interspersed among large movements. EOG of #7 shows large movements with periods of fixity.
Touch and Go Landing8: A characteristic pattern of eye movements accompanied touch and go landings. Movements were minimal on take-off roll, increased at lift-off, were large and frequent until final approach when the gaze again became fixed. At touch down there were usually a few glances then fixity again as the takeoff roll was initiated (Figure 5). C. Word Counts.
There did not appear to be any meaningful relationships between 'the average number of words spoken per flight and the instructor's grade. The number of words required to complete the syllabus ranged from 48,415 to 88,656 (Table V).
9
'1'ABLE V. Word Counts.
Subject Total Word No. of Dual Average Average Number Count FUghts WCJFlt Instructo1· Grade
1 48,415 18 2690 7.7 2 65,105 21 3100 70 3 62,006 20 3100 79 4 80,640 21 3840 76 5 52,903 25 2116 80 6 88,656 27 3284 73 7 52,899 20 2645 81 8 71,201 26 2739 77
IV. Discussion and Conclusions.
References to the rate of myocardial contraction and the effect of emotional states thereon are not confined to the medical literatur-e. Such

ECG a EOG IN TOUCH AND GO CIRCUIT
~ ' --++++++++-
: 1
'' ' . I,:
a-----OOWNWINo------+----- BASE ------t- FINAL -I (140) (138) (140)
i I I
--+-t-H-H-H-H-+'--+-__ , ___ ,_,!--'!--lf-+-1~-Hc-Hi· I
.J ';
-+ ' I . !
t--FINAL--+- _,.___TAKEOFF---+- -f-CLIMBOUT-+- CROSSWIND-I (I40) TOUC~OOWN (l 38) LIFt-OFF (I40) (l 38)
(138) (140)
FIGURE 5. Pattern of eye movements during one touch-and-go circuit of the airport.
statements -as "my heart leaped into my mouth," "My heart goes out to " reveal an ancient belief that the heart is the seat of emotion, wisdom and courage. There are 72 references to the heart in the Book of Proverbs.
While there :are certain dangers inherent in drawing conclusions about total body functions from one measurement, the pulse rate proba:bly gives the best moment-to-moment assessment of emotional state that can be conveniently recorded continuously in flight. It would be highly desirable to have records of skin resistance and blood pressure simultaneously with heart rate, but -. such measurements were not within the 'technical capability of th.is facility at the time.
10
Horowitz points out that •anxiety is commonly accompanied by -a slowing of heart rate. In this study, it appears fairly clear tthat there is an ·admixture of emotional responses so that "fear" and "anxiety" cannot be clearly differentiated. Heart rate builds over the length of the syllabus in increments corresponding to the two major tests of ability, the first solo flight ·and the check flight. These are readily identifiable obstacles with which the student is preoccupied. They are easily and frequently identified by the student; yet, none of the students ever expressed fear of any physical harm. Their most common expression of fear was connected with failure. It is entirely possible that the

heart rates observed in this study reflect a constructive tenseness, also mentioned by Horowitz3 •
Something. akin to, if not identical with, the heart rate increases that Roman 5 observed to occur when control was passed from one pilot to the other wa;s observed in this project, also. Heart rates ·were generally lowest on dual flights when the instructor was in control. When control was passed to the student, a heart rate increase occurred. When 1the student was completely responsible for the conduct of the flight, heart rates were higher yet.
Those events in the syllabus giving rise to the highest heart rates ~all involved low airspeed. Five of the eight subjects had their maximum heart rates during short field procedures. This is reminiscent of Roman's6 findings on carrier combat pilots, who showed maximum heart rates on launch and recovery, both being essentially "short field" procedures. The other three subjects had maximum heart rates on stalls (1) and normal landings (2).
With regard to the absolute level of heart rates recorded, it would appear that the private pilot training curriculum is about as stressful as combat flying6
, X-157 and lifting body flying5,
low altitude flying in high performance jets5,
and, indeed, orbi,bal flight8 •9 • Heart mtes of subjects in this study approached or exceeded those of pilots in the above mentioned more dangerous flights. For these student pilots the amount of ego investment is probably as great and, proportionately, the task looms just as large as orbital flight does for an astronaut. Certainly thoughts of flight almost completely preoccupy the student pilot. He reports frequent dreams of flying, he makes many "social" calls at the laboratory when the wea;ther is bad just to talk flying with other students who gather there, he spends a great deal of time listening to the tower on •the radio monitor. By his own admission, flight dominates his life. Throughout this project not once did a student forget to report for a flight. This training was given without cost to these students. One wonders how much more the financial burden would add to the emotional investment of regular student pilots.
Fear of crashing does not apparently seem to be a major factor. One incident illustrates this contention. The instruotor had frequently stated that airspeed should be controlled with pitch attitude and altitude should be controlled with
11
power adjustments. One student on his 12th flight notec;l that his airspeed was lO mph too low on final approach. He forthwith pointed the nose of the airplane at the ground and held it there. The instructor immedia,tely admonished the student about the inadvisability of his action and attempted 'to seize control. However, the student was the stronger of the two. Providentially, a soft drink bottle (12 oz. size) came forward from the baggage compartment, together with coats and debris, and struck the student on the back of the head. The instructor at that moment prevailed and pulled out of the dive; by his account, the airspeed wa;s past Vne. The airplane zoomed up and over a power line and the instructor made a normal landing on the runway. The student's heart rate changed only 10 beats per minute during the episode. It is not known, unfortunately, what the instructor's pulse rate was.
For most students, one unnerving factor does not involve flight per se but is, simply, use of the radio transmitter. Fear of misunderstanding and consequent failure to comply with •the tower's instructions bothers most students greatly. A common student complaint is tha;t they cannot understand the tower. When questioned closely, it develops that there is no problem of loudness or clarity of the tower's transmissions, but rather that the instructions do not "sink in." Such events are viewed purely as arising from the emotional state engendered by the flight situation. Visits to the tower appeared to do more than anything else to alleviate "mike fright;" however, understanding of the tower's transmissions did not improve until the syllabus was about halfway completed.
Eye movement~ and word counts proved to be not very revef),ling measurements. Eye movements tended to be somewhat more frequent when the student was in control of the airplane than when the instructor was flying and, likewise, eye movements tended to be more frequent on crosscountry than on local flights. There did not appear to be any correlation between eye movements and instructor's grade.
Instructor's grade 'likewise tends to be useless. It appears that his appraisal is largely impressionistic. The Air Force Officer Qualifying Test apparently gives little insight into the future performance of these private pilots; neither did scores on the written examination have much
value as predictors. Four of the subjects failed all or portions of the flight test. Subject 5 scored 92 on the written ex.amination, yet failed the oral phase of his flight test; subject 6 scored 80 on the written examination and failed the
flight portion of his check; subject 8 made 72 on the written examination and failed both oral and flight phases of his check; subject 3 scored 86 on the written examination and failed both oral and flight phases of his check.
REFERENCES
1. CAB Summary General Aviation Accident Reports, July-December 1966. Figures exclude helicopter, parachute, balloon, glider, and accidents to ground personnel.
2. SMODE, ALFRED J., HALL, EuGENE R., and MEYER, DoNALD S., "An Assessment of Research Relevant to Pilot Training," AMRL-TR-66-196. Aerospace Medical Research Laboratories, Aerospace Medical Division, Air Force Systems Command, Wright-Patterson Air Force Base, Ohio.
3. HOROWITZ, MILTON W., "An Analysis of Anxiety as it Affects Flight Training," A study sponsored by the Link Foundation, Suite M-10, Eastside Airline Terminal, 645 First Avenue, New York, New York.
4 .. HoROWITZ, MILTON W., "The Instructor Flunks A Test." Flying, September 1964.
5. RoMAN, JAMES, "Risk and Responsibility as Factors Affecting Heart Rate in Test Pilots-The Flight
12
Research Program II." Aerosp. Med. 36 : 518-532, 1965.
6. ROMAN, JAMES, OLDER, HARRY and JONES, L., JR., "Flight Research Program: VII. Monitoring of Navy Carrier Pilots in Aerosp. Med. 38:133-139, 1966.
WALTON Medical
Combat."·
1-: RowEN, B. "Biomedical Monitoring of the X-15 Program" AFFTC-TN-61-4, May 1961.
8. BERRY, C. A., MINNEBs, H. A., McCuTcHEON, E. P., and PoLLARD, R. A. "Aeromedical Analysis" in "Results of the Third United States Manned Orbital Flight," NASA SP-12, October 1963.
9. CATTERSON, A. D., McCuTCHEON, E. P., MINNEBs, H. A., and Por.LARD, R. A., "IV-Mission Results. 18. Aeromedical Observations" in "Project Mercury Summary including Results of the Fourth Manned Orbital Flight," May 1963.