Embed Size (px)
Citation preview

COMMITMENT & INTEGRITY DRIVE RESULTS
In Flux: A Case Study of a Vapor Intrusion Site Transitioning from an Active to a Passive System
Lisa J. Campe, MPH, LSP | Lisa M. McIntosh, MS, DABT | Nicholas Kutil
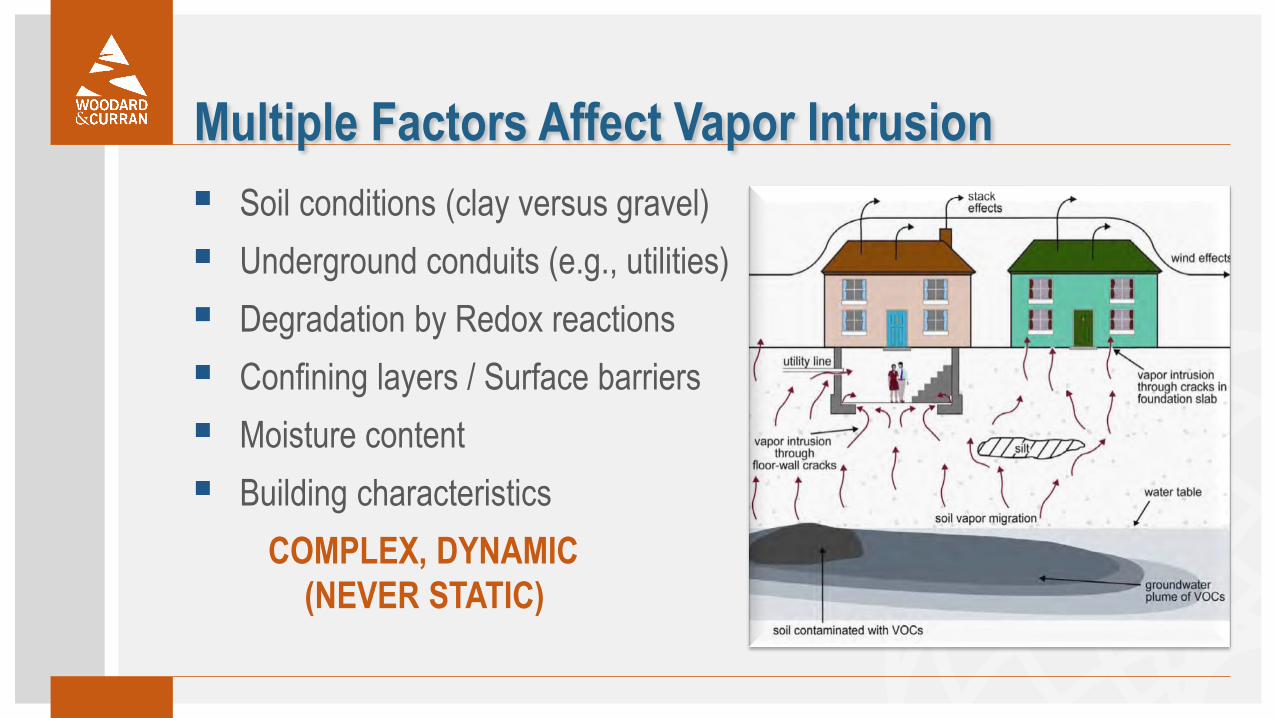
Multiple Factors Affect Vapor Intrusion Soil conditions (clay versus gravel) Underground conduits (e.g., utilities) Degradation by Redox reactions Confining layers / Surface barriers Moisture content Building characteristics
COMPLEX, DYNAMIC (NEVER STATIC)

Former Manufacturing Facility Historical badge manufacturer, operated at
site from mid-1800s to mid-1980s Discharges of VOCs, metals to stream and
to sludge pits (permitted discharges) Various entities occupied during 1980s-2000s Bought by developer in early 2000s
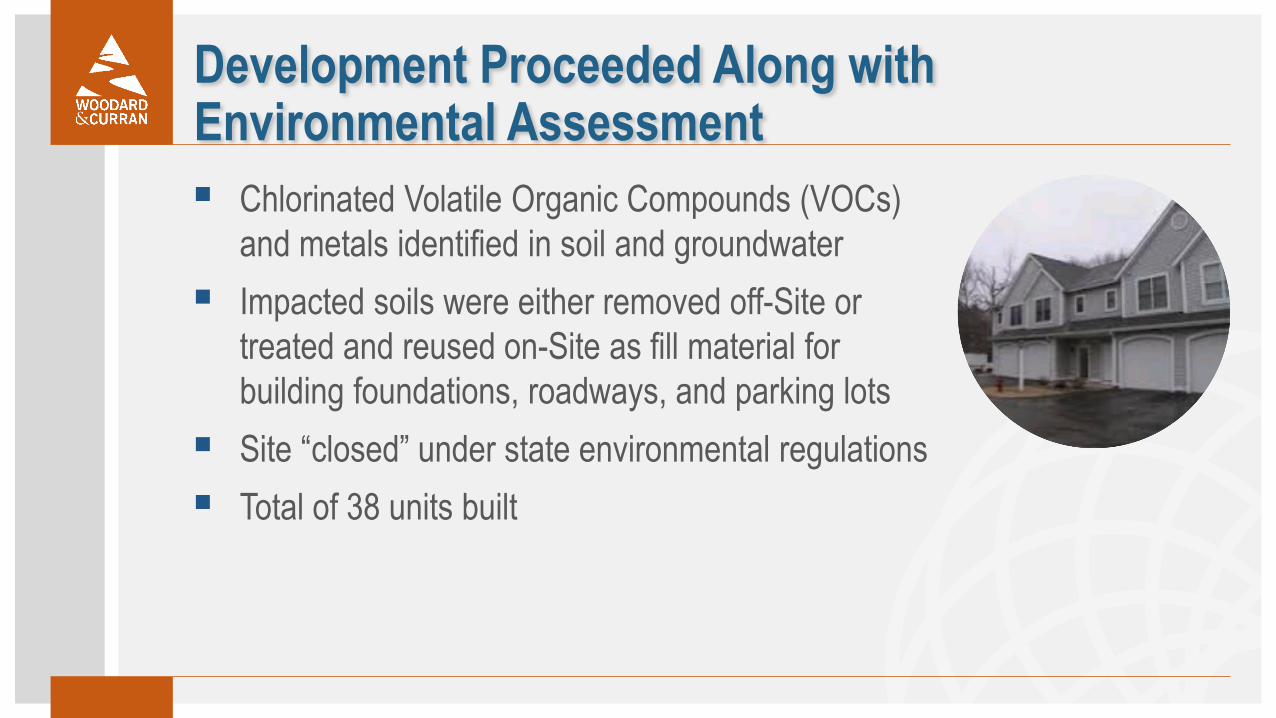
Development Proceeded Along with Environmental Assessment Chlorinated Volatile Organic Compounds (VOCs)
and metals identified in soil and groundwater Impacted soils were either removed off-Site or
treated and reused on-Site as fill material for building foundations, roadways, and parking lots
Site “closed” under state environmental regulations Total of 38 units built
Regulatory Transition Developer issued NOV and, as part of required testing,
groundwater concentrations >50,000 mg/L and indoor air impacts found
State requires more indoor air testing; developer says no due to financial constraints.
State takes over assessment, collects additional data State issues notice of responsibility to original factory owner.

Picking up the Pieces… Woodard & Curran took over assessment in 2012
Review of the multitude of existing data Identification of data gaps Negotiation of access Collection of soil gas, sub-slab soil gas, indoor air and groundwater samples Scoping and implementation of Initial Response Actions

Refined Conceptual Site Model With exception of one area, groundwater VOC
concentrations are relatively low. NO vapor intrusion issue in area with highest groundwater impacts!
Soil VOCs apparent cause of vapor intrusion Movement of VOC-contaminated soil during redevelopment
dispersed contaminants from the once-confined lagoons to across a large portion of the site.

Site Features
Plan

Addressing the Problem and Looking Towards Closure Complete VI Pathway Exists in 15 units – primarily, TCE Installation of active SSDS with fans and alarms Post-SSDS vacuum and indoor air monitoring Based on monitoring results for IA and SG, began passive
pilot test program Have performed 3-4 passive pilot tests thus far Groundwater source addressed via bioaugmentation injections
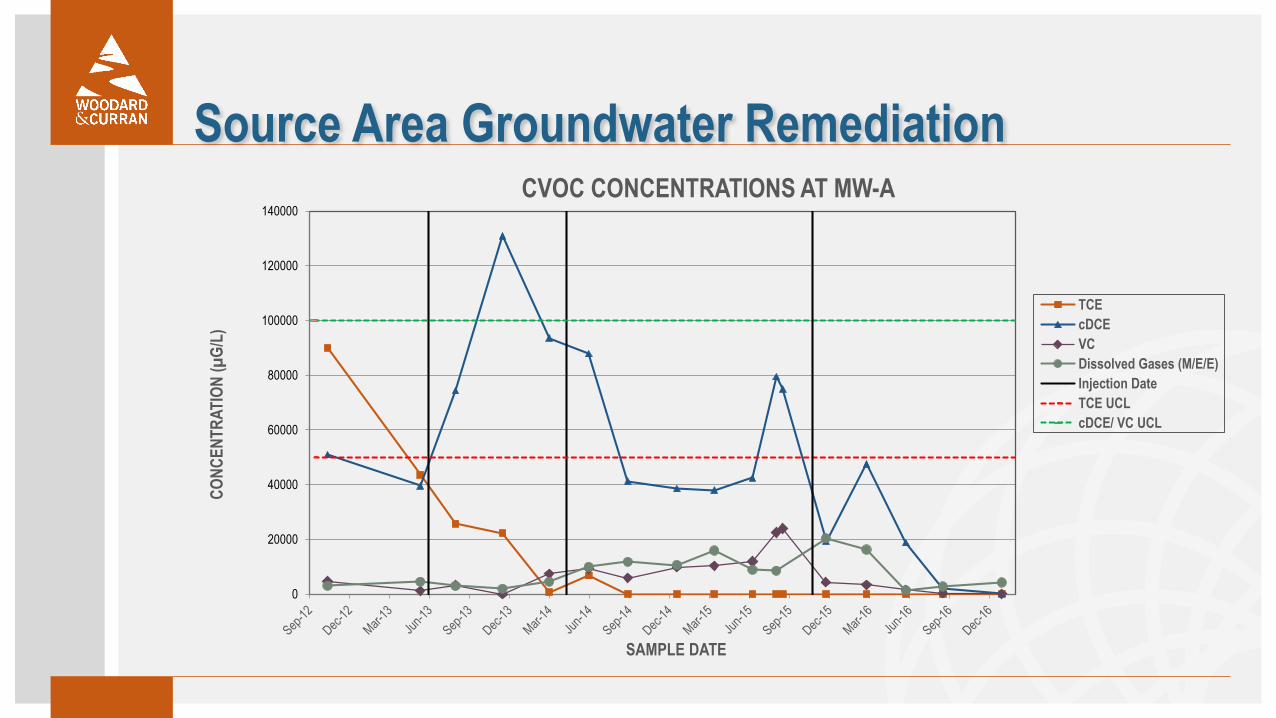
Source Area Groundwater Remediation
0
20000
40000
60000
80000
100000
120000
140000CO
NCEN
TRAT
ION
(µG/
L)
SAMPLE DATE
CVOC CONCENTRATIONS AT MW-A
TCEcDCEVCDissolved Gases (M/E/E)Injection DateTCE UCLcDCE/ VC UCL
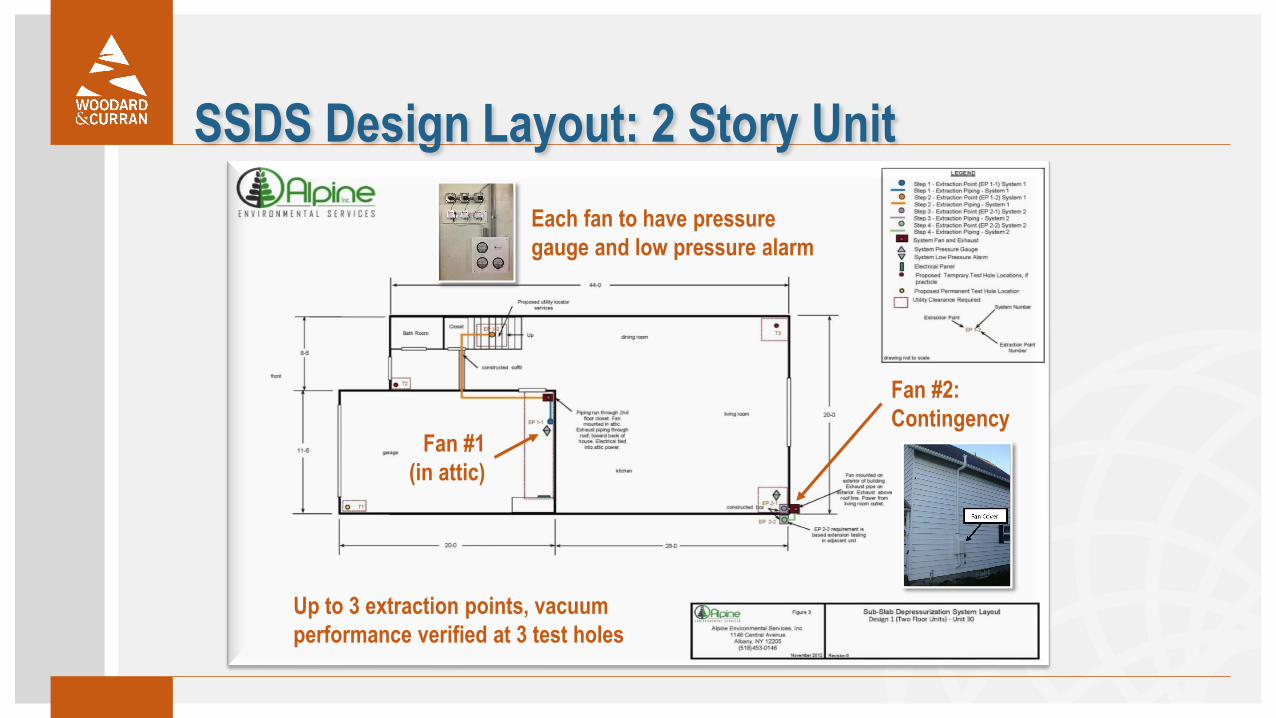
SSDS Design Layout: 2 Story Unit
Fan #1(in attic)
Fan #2:Contingency
Each fan to have pressure gauge and low pressure alarm
Up to 3 extraction points, vacuumperformance verified at 3 test holes

Pre- and Post-
Mitigation Results for
TCE in Indoor Air

Pre- and Post- SSDS Indoor Air Concentrations: TCE
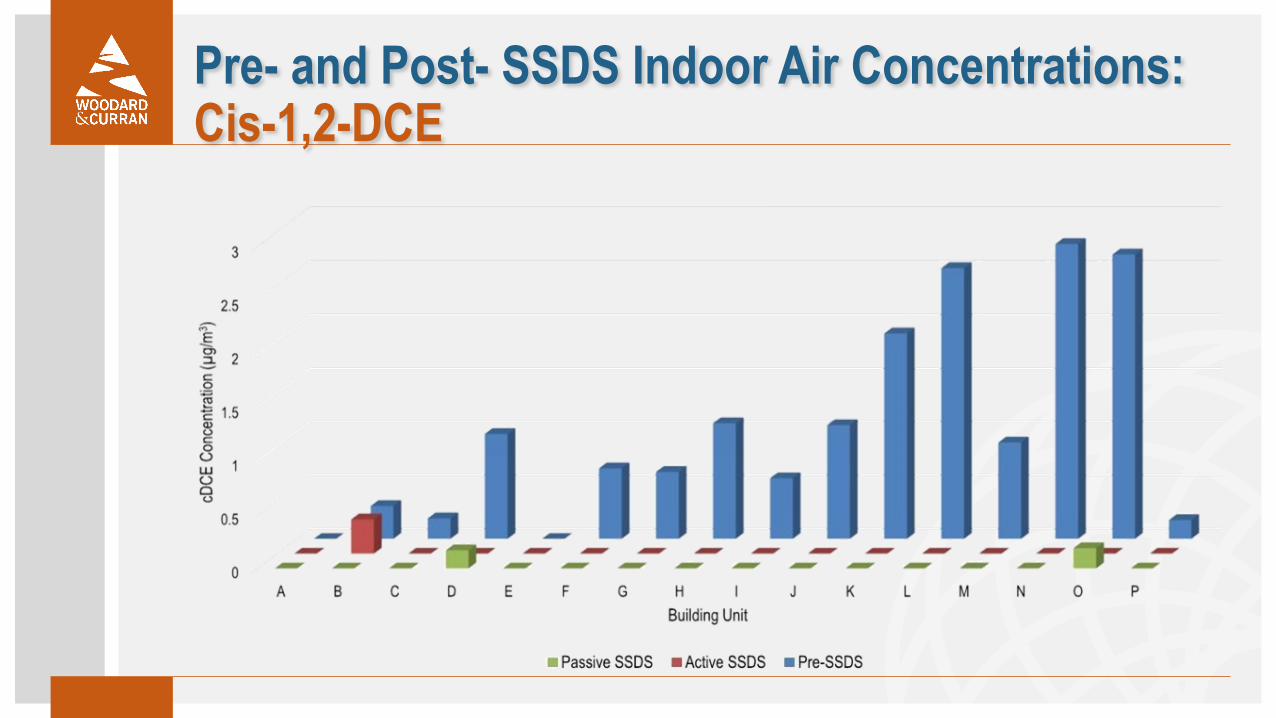
Pre- and Post- SSDS Indoor Air Concentrations: Cis-1,2-DCE

Pre- and Post- SSDS Indoor Air Concentrations: PCE
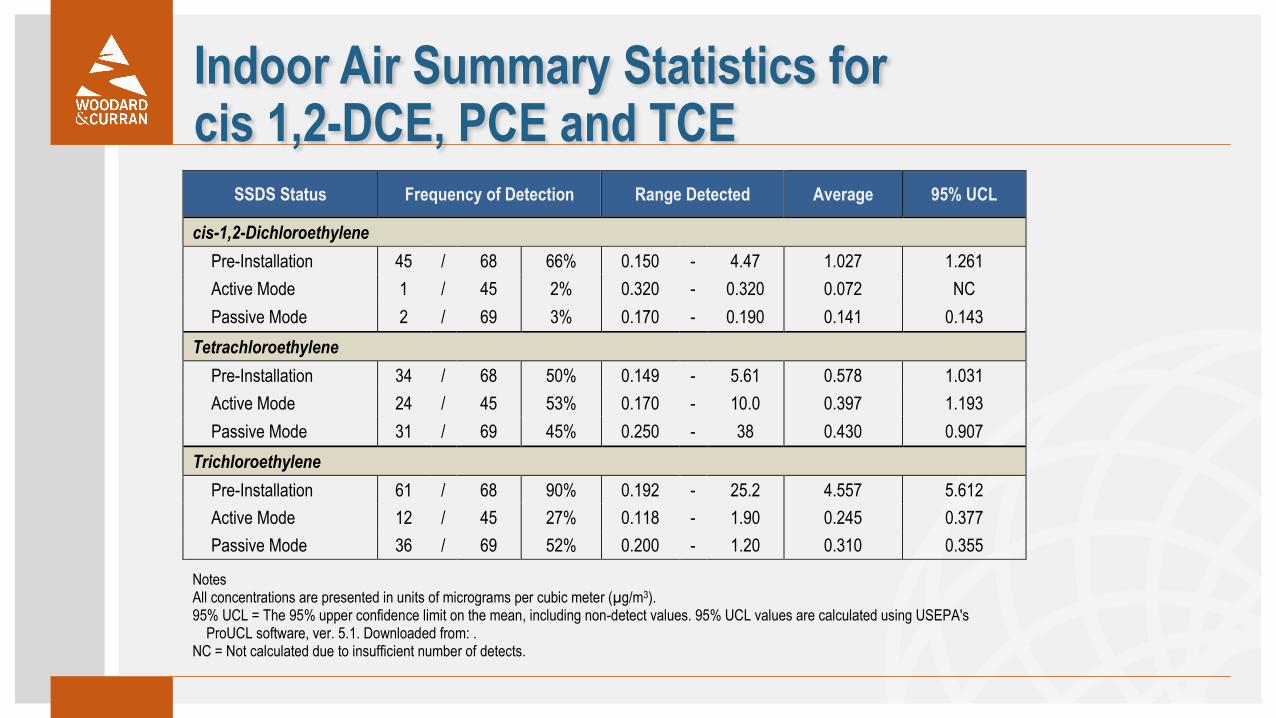
Indoor Air Summary Statistics for cis 1,2-DCE, PCE and TCE
SSDS Status Frequency of Detection Range Detected Average 95% UCL
cis-1,2-Dichloroethylene Pre-Installation 45 / 68 66% 0.150 - 4.47 1.027 1.261 Active Mode 1 / 45 2% 0.320 - 0.320 0.072 NC Passive Mode 2 / 69 3% 0.170 - 0.190 0.141 0.143
Tetrachloroethylene Pre-Installation 34 / 68 50% 0.149 - 5.61 0.578 1.031 Active Mode 24 / 45 53% 0.170 - 10.0 0.397 1.193 Passive Mode 31 / 69 45% 0.250 - 38 0.430 0.907
Trichloroethylene Pre-Installation 61 / 68 90% 0.192 - 25.2 4.557 5.612 Active Mode 12 / 45 27% 0.118 - 1.90 0.245 0.377 Passive Mode 36 / 69 52% 0.200 - 1.20 0.310 0.355
Notes All concentrations are presented in units of micrograms per cubic meter (µg/m3). 95% UCL = The 95% upper confidence limit on the mean, including non-detect values. 95% UCL values are calculated using USEPA's
ProUCL software, ver. 5.1. Downloaded from: . NC = Not calculated due to insufficient number of detects.

1,2-DCE, PCE and TCE Concentrations in Soil GasMaximum TCE Concentration
(µg/m3)Maximum PCE Concentration
(µg/m3)Maximum cis-1,2-DCE Concentration
(µg/m3)
Pre-SSDS1 Post-SSDS2 Pre-SSDS1 Post-SSDS2 Pre-SSDS1 Post-SSDS2
Unit 6 32.7 3.1 <16.9 44 <9.9 0.62Unit 7 5,330 0.71 27.8 <0.68 1,570 <0.4Unit 8 1,100 110 31.3 49 115 1.7
Unit 173 1,210 300 74.2 31 98.8 13Unit 183 170 23 15 25 6.2 0.86Unit 22 4,660 7.2 230 36 2,250 2Unit 24 3,430 200 215 8.5 1,660 45Unit 25 1,860 NS 616 NS 428 NSUnit 28 11,200 210 151 26 5,030 49Unit 29 195 9.7 10.6 0.73 84.3 4.3Unit 30 5,330 240 237 26 2,070 73Unit 324 789 110 <34 39 341 21Unit 33 12,400 67 20.3 34 6,890 0.94


Statistics Across Units TCE and c-1,2-DCE Primary COPCs
Installation of SSDS provided significant reduction in concentrations in both indoor air and sub slab soil vapor
High level of consistency between active and passive. PCE
Poor correlation with subsurface data Did not see significant reduction in concentrations post SSDS Active SSDS results higher than passive overall
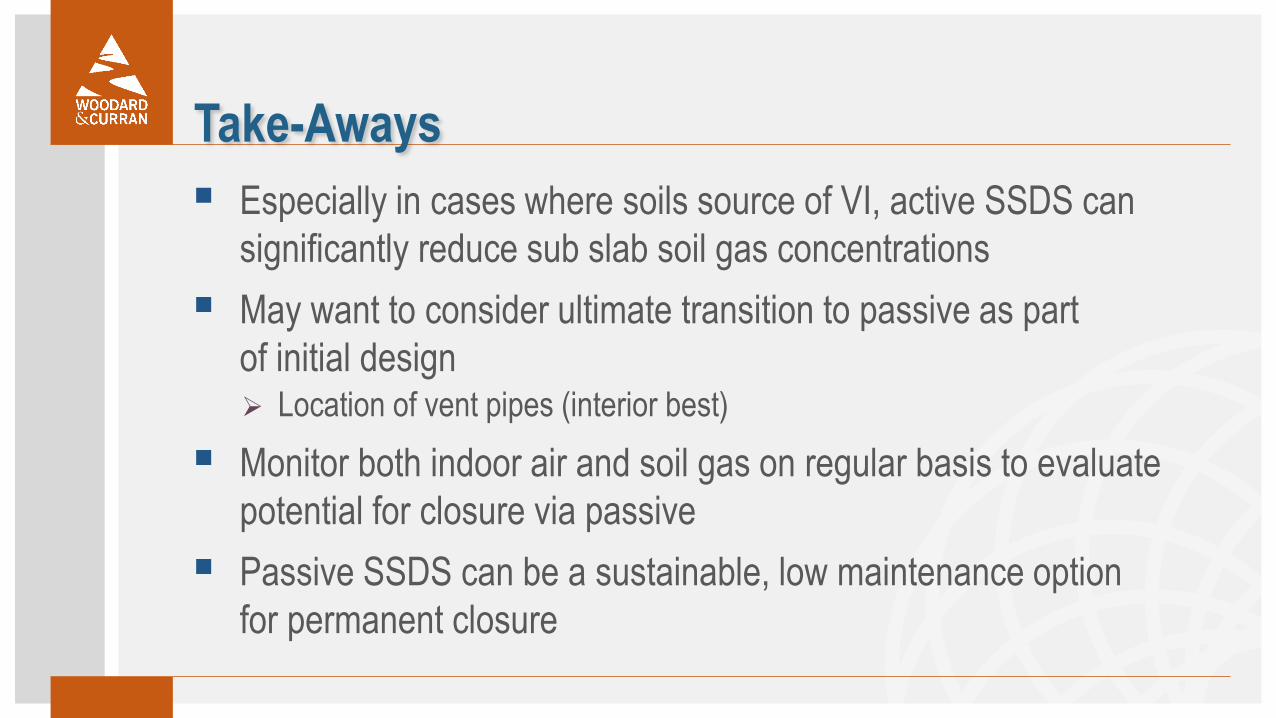
Take-Aways Especially in cases where soils source of VI, active SSDS can
significantly reduce sub slab soil gas concentrations May want to consider ultimate transition to passive as part
of initial design Location of vent pipes (interior best)
Monitor both indoor air and soil gas on regular basis to evaluate potential for closure via passive
Passive SSDS can be a sustainable, low maintenance option for permanent closure
COMMITMENT & INTEGRITY DRIVE RESULTS
Questions / Comments