Embed Size (px)
Citation preview

Welcome
to In house Training ProgramIn-house Training Program
On “Supply Chain Management for Global Competitiveness”“Supply Chain Management for Global Competitiveness”
AtAt Indian Institute of Corporate Affairs
Manesar, Gurgoan By
SANJAY DWIVEDI , Chief Executive Consultant
K.K. PAREEK, Consultant–ERP & IT Services
3 E MANAGEMENTCONSULTANTS www.3emc.net 1
20th year of value added Business to Business consultancy

CUSTOMER’S VIEW OF COMPANY’S CONTRIBUTION
A B CCUSTOMER PROCESS FOR SUPPLY CHAIN MANAGEMENT
COMPANY PROCESSES
A
COMPANY PROCESSES
Scope of Materials Management p g
3 E MANAGEMENTCONSULTANTS
TRADITIONAL VIEW OF COMPANY’S CONTRIBUTION

Four Factors for Product and Service Up-gradation
• QualityQuality • Cost• Delivery • Responsiveness
3 E MANAGEMENTCONSULTANTS www.3emc.net 3

Three Factors For Sustainability of Upgradation / Improvement
Repeatability MeasurabilityMeasurabilityTractability
3 E MANAGEMENTCONSULTANTS www.3emc.net 4

In Bound + In Process + Out Bound
Supply Chain Management
3 E MANAGEMENTCONSULTANTS www.3emc.net 5

SUPPLY CHAIN MANAGEMENT
Value ChainValue ChainSupply side- raw materials, inbound logisticsand production processesand production processesDemand side- outbound logistics, marketing
d land sales.
3 E MANAGEMENTCONSULTANTS

WHAT IS SUPPLY CHAIN MANAGEMENT
" Is the strategic management of activities involved in the acquisition and conversion of materials to finished products delivered to the customers"
SupplierManagement
CustomerManagement
Material Flow
Information FlowInformation Flow
Schedule /Resources Conversion Stock
Deployment Delivery
3 E MANAGEMENTCONSULTANTS
Leads to Business Process Integration
Supply chain is the system by which organizationspp y y y gsource, make and deliver their products or servicesaccording to market demand.Supply chain management operations and decisions are ultimately triggered by demand signals at the ultimate
l lconsumer level. Supply chain as defined by experienced practitioners extends from suppliers’ suppliers to customers’extends from suppliers suppliers to customers customers.
3 E MANAGEMENTCONSULTANTS
SUPPLY CHAIN INCLUDESSUPPLY CHAIN INCLUDES
INFORMATION FLOWS
MATERIAL FLOWSMATERIAL FLOWS
FINANCIAL FLOWS
3 E MANAGEMENTCONSULTANTS

SUPPLY CHAIN MANAGEMENT IS FACILITATED BY
PROCESSES
STRUCTURESTRUCTURE
TECHNOLOGY
3 E MANAGEMENTCONSULTANTS
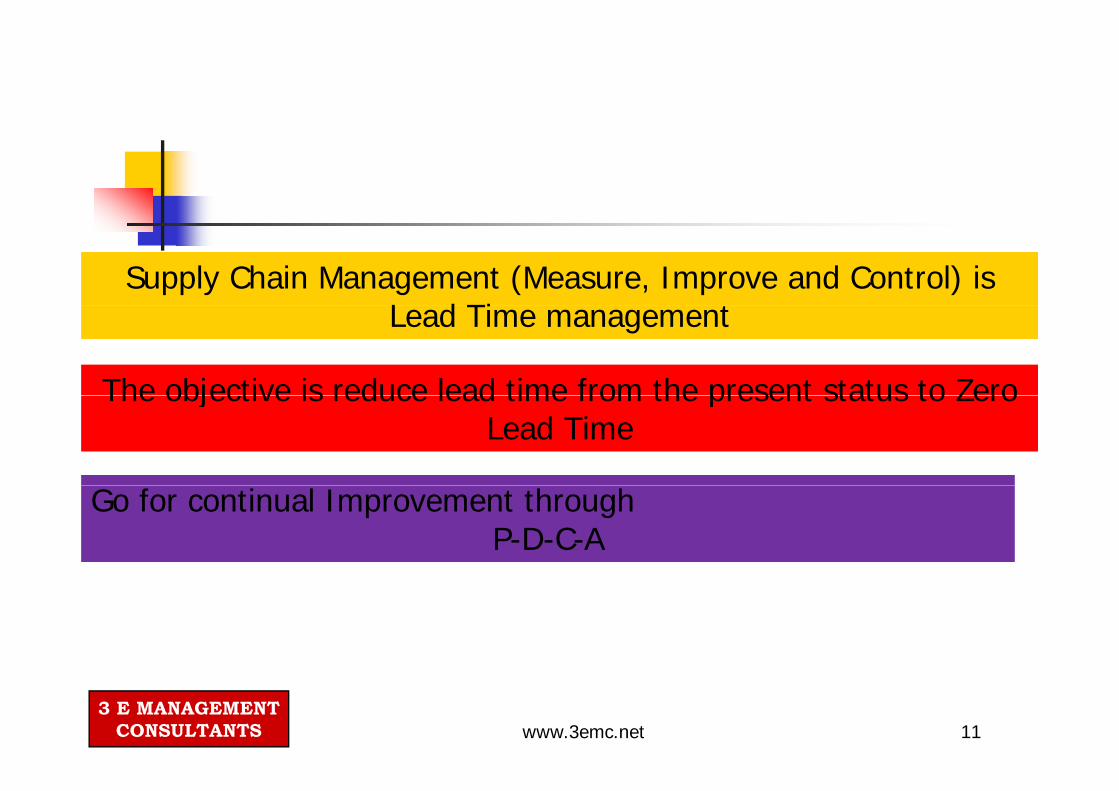
Supply Chain Management (Measure, Improve and Control) is L d Ti tLead Time management
The objective is reduce lead time from the present status to ZeroThe objective is reduce lead time from the present status to Zero Lead Time
Go for continual Improvement through P-D-C-A
3 E MANAGEMENTCONSULTANTS www.3emc.net 11
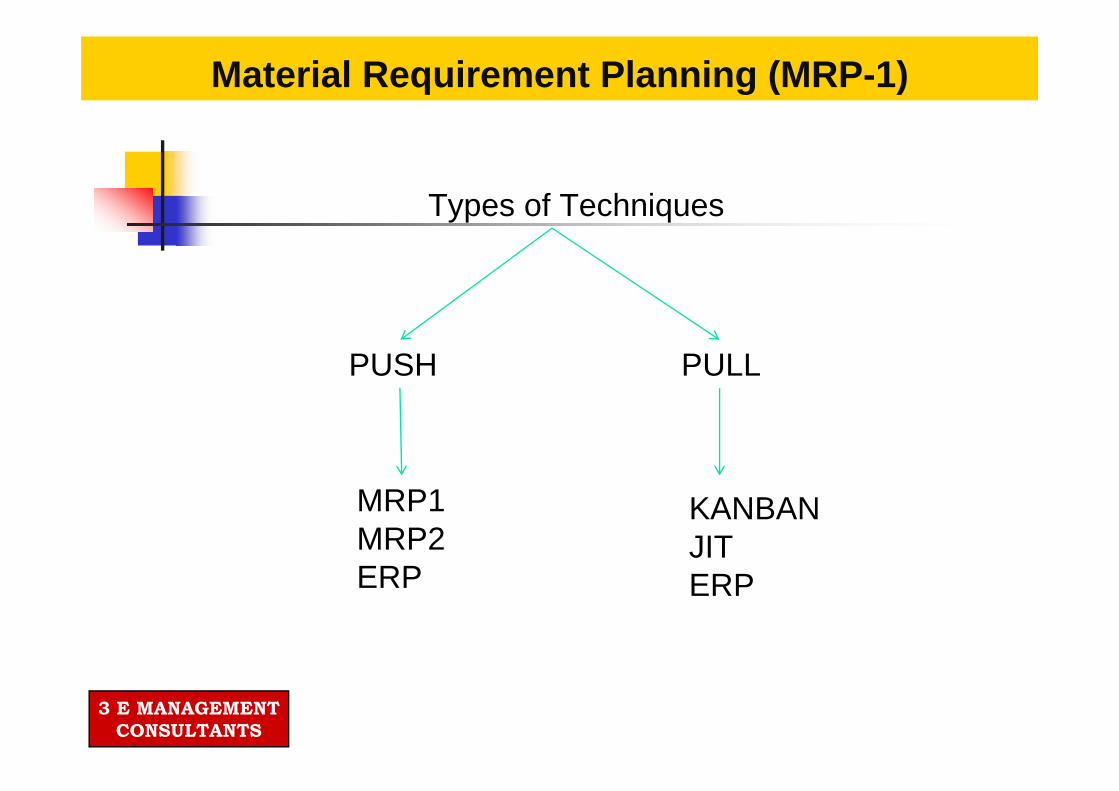
Material Requirement Planning (MRP-1)
Types of Techniquesypes o ec ques
PUSH PULL
MRP1MRP2ERP
KANBANJITERPERP ERP
3 E MANAGEMENTCONSULTANTS
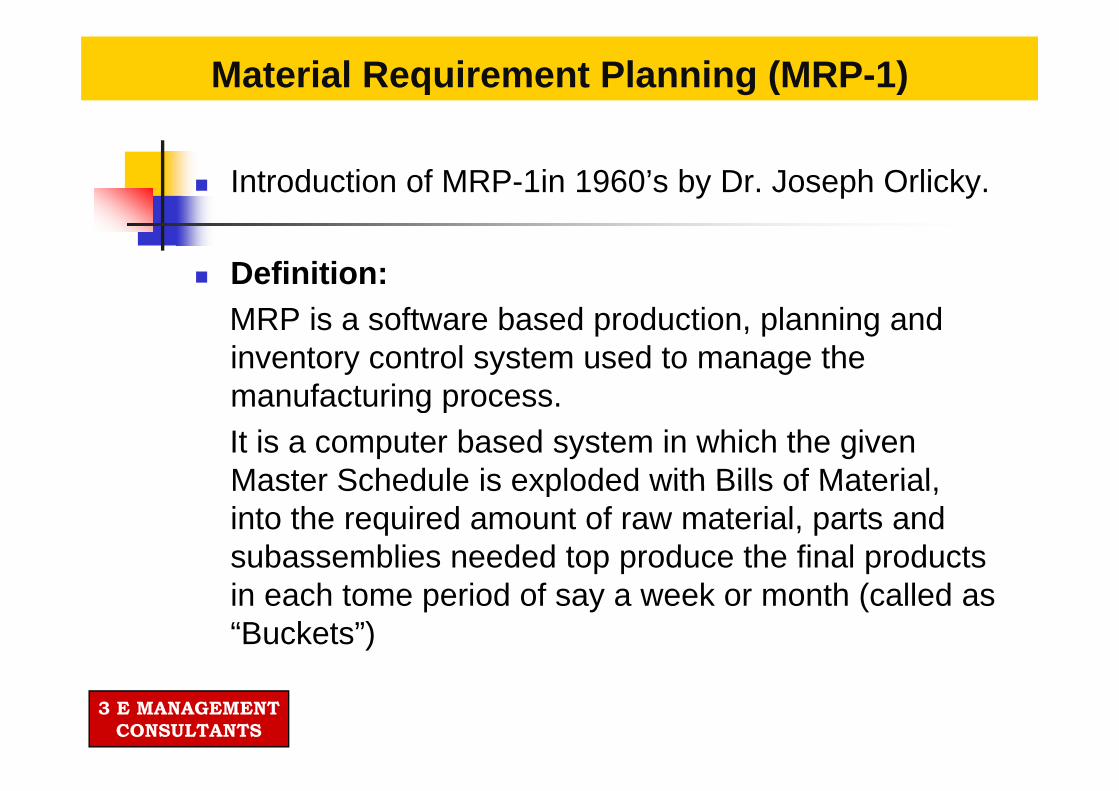
Material Requirement Planning (MRP-1)
Introduction of MRP-1in 1960’s by Dr. Joseph Orlicky.
Definition:MRP is a software based production, planning and inventory control system used to manage the manufacturing processmanufacturing process.It is a computer based system in which the given Master Schedule is exploded with Bills of MaterialMaster Schedule is exploded with Bills of Material, into the required amount of raw material, parts and subassemblies needed top produce the final products in each tome period of say a week or month (called as “Buckets”)
3 E MANAGEMENTCONSULTANTS

Key Elements Of MRP 1
Demand Forecasting:-Demand Forecasting:It is the quantity demanded per year or per unit time which indirectly helps in knowing quantity to be supplied.
Master Production Schedule (MPS):-MPS is a series of time phased quantities for each item that a company manufactures. It gives the details of the products to be manufactured over the given space of timeproducts to be manufactured over the given space of time.
3 E MANAGEMENTCONSULTANTS

Manufacturing Resource Planning (MRP II)
It is defined as a method for the effective planning of all resources of a manufacturing company. Ideally its g p y yaddresses operational planning in units, financial planning in dollars, and has a simulation capability to
“ h t if” ti d t i f l danswer “what-if” questions and extension of closed-loop MRP.
3 E MANAGEMENTCONSULTANTS

MRP-I• Manufacturing-Centric/Push Mgt.g g• Master production schedule• Final production schedule•Inventory managementInventory management• Bills of Materials•Gross Requirement Generation• Net Requirement Generation• Net Requirement Generation• Recorder point Calculation• Automatic Replenishment
MRP II• Capacity Requirement planning• Production Controloduct o Co t o• Marketing Interface• Accounting Interface• Financial InterfaceFinancial Interface• Personnel Interface• Supplier Interface• Customer Interface
3 E MANAGEMENTCONSULTANTS
• Customer Interface

Operating Environment
GovernmentGo e e t- Regulation- SafetySafety
Economy- Effects demandEffects demand- Shortage and surpluses
Competition is now globalCompetition is now global- Reduced costs of transportation- Communications reduced costs and increased- Communications, reduced costs and increased
speed
3 E MANAGEMENTCONSULTANTS

Operating Environment (Continued…)
Customers Demand- Lower Prices- Improved Quality- Reduced Lead Time- Improved pre-sale and after-sale service- Product and volume flexibilityProduct and volume flexibility
3 E MANAGEMENTCONSULTANTS
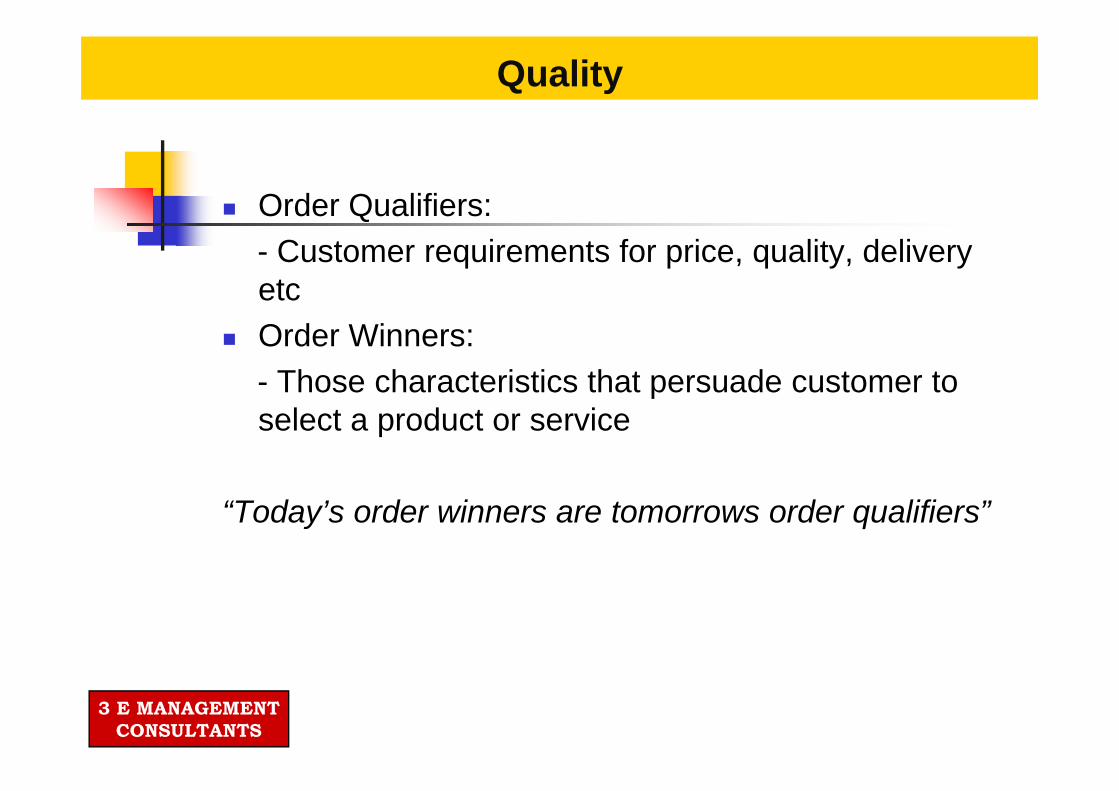
Quality
Order Qualifiers:O de Qua e s- Customer requirements for price, quality, delivery etcOrder Winners:- Those characteristics that persuade customer to pselect a product or service
“Today’s order winners are tomorrows order qualifiers”
3 E MANAGEMENTCONSULTANTS
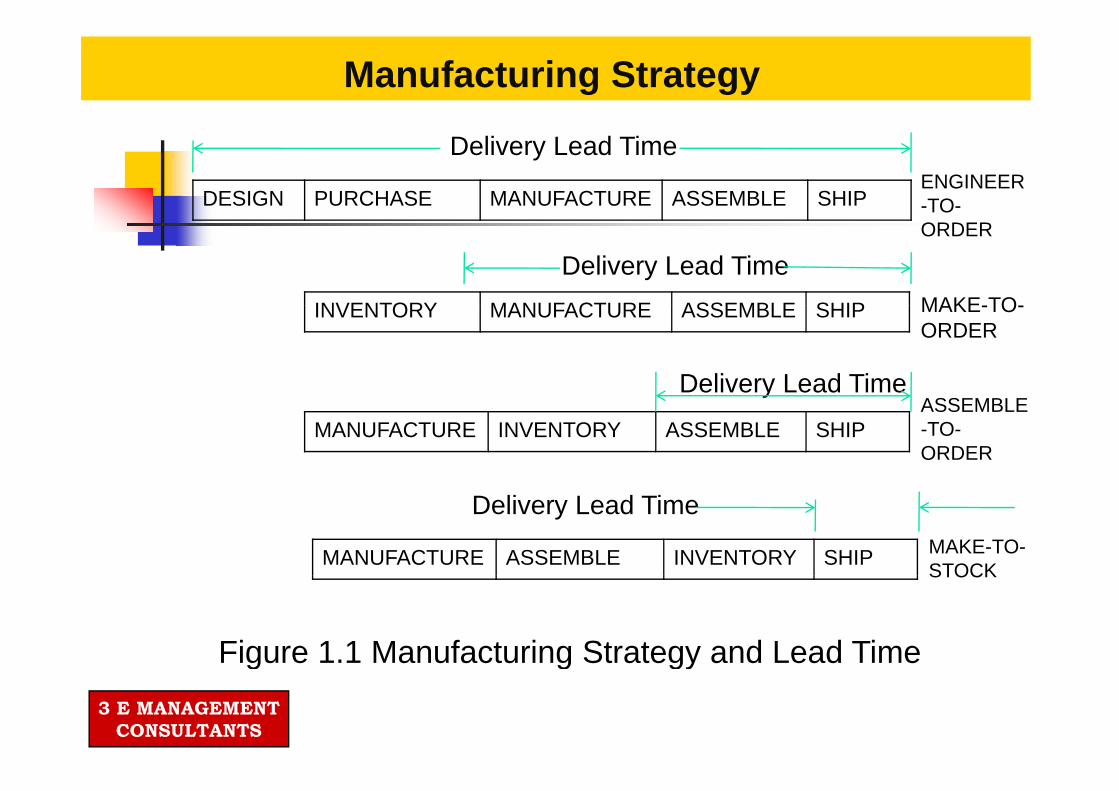
Manufacturing Strategy
DESIGN PURCHASE MANUFACTURE ASSEMBLE SHIPENGINEER-TO-
Delivery Lead Time
ORDER
INVENTORY MANUFACTURE ASSEMBLE SHIP
Delivery Lead TimeMAKE-TO-INVENTORY MANUFACTURE ASSEMBLE SHIP
Delivery Lead Time
MAKE-TO-ORDER
MANUFACTURE INVENTORY ASSEMBLE SHIP
yASSEMBLE-TO-ORDER
MANUFACTURE ASSEMBLE INVENTORY SHIP
Delivery Lead TimeMAKE-TO-STOCKSTOCK
Figure 1.1 Manufacturing Strategy and Lead Time3 E MANAGEMENT
CONSULTANTS
g g gy

Engineer-to-Order
Manufacture does not start until the order is receivedCustom DesignUnique ProductsLong Lead TimeInventory purchased after order is received
3 E MANAGEMENTCONSULTANTS

Make-to-Order
Manufacture does not start until the order is receivedOften uses standard componentsOften uses standard componentsLittle design timeLead Time is reducedLead Time is reducedInventory held as raw materials
3 E MANAGEMENTCONSULTANTS

Assemble-to-Order
Manufacture Inventories standard componentsNo Design time requiredo es g t e equ edAssembly only requiredShorter Lead TimeShorter Lead TimeInventory held as standard components
3 E MANAGEMENTCONSULTANTS

Make-to-Stock
Manufacture produces the goods in anticipation of p g pcustomer demandLittle customer involvement with DesignAssembly only requiredShortest Lead TimeInventory held as finished goods
3 E MANAGEMENTCONSULTANTS

The Supply Chain ConceptSupply-production-distribution system pp y p y
SU
CUS
MANUFACTUREPPLI
DISTRIBUTIONSYSTEM
STOMI
ER
MER
PhysicalSupply
Manufacturing, Planning and C t l
Physical Distribution
Control
DOMINANT FLOW OF PRODUCTS AND SERVICESDOMINANT FLOW OF PRODUCTS AND SERVICES
DOMINANT FLOW OF DEMAND AND DESIGN INFORMATION
3 E MANAGEMENTCONSULTANTS
The Supply Chain Concept
Includes all activities and processes to supply a product or service to the customerLinks many companiesHas a number of supplier/customer relationshipsMay contain intermediaries such as: wholesalers, warehouses and retailers
3 E MANAGEMENTCONSULTANTS

Historical and Current Perspective
In the past there well defined and rigid boundaries between organizationsgJIT viewed suppliers as partners- mutual analysis for cost reductiony- mutual product design- greatly reduced inventorygreatly reduced inventory- improved communications (Internet, EDI)
3 E MANAGEMENTCONSULTANTS
Growth of Supply Chain Concept
Integrated systems (ERP) and the sharing of informationGlobal competition and supplyFlexible Designs – reduced product life cyclesg p yJIT approach to interorganizational relationsSubcontracting or outsourcing workSubcontracting or outsourcing work
3 E MANAGEMENTCONSULTANTS
Current Supply Chain Concept
Manage the flow of materialsShare information through the internetS a e o at o t oug t e te etTransfer funds electronicallyRecover, recycle or reuse materialsRecover, recycle or reuse materials
3 E MANAGEMENTCONSULTANTS
Conflicts in Traditional Systems
Company main objectives1 Best customer service1. Best customer service2. Lowest production costs3 Lowest inventory investment3. Lowest inventory investment4. Lowest distribution costs
3 E MANAGEMENTCONSULTANTS

Conflicts in Traditional SystemsFUNCTION OBJECTIVE IMPLICATIONFUNCTION OBJECTIVE IMPLICATIONMarketing High Revenues
High Product High CustomerS ig
Availability
Production Low Production
ServiceLow
Production Low ProductionCostHigh-Level
Many Disruptions to Production
FewProduction Long ProductionRuns
Few
Runs
Finance Low Investment Highand CostFewer Fixed CostLow Inventories
HighInventories
Low
3 E MANAGEMENTCONSULTANTS
Low Inventories
Conflicting Objectives

Manufacturing Planning and Control
Planning and Controlling the flow of materials through the manufacturing process through:g p g- Production Planning- Implementation and Controlp- Inventory Management
3 E MANAGEMENTCONSULTANTS

Process Specifications
Recorded on a Route SheetDescribe how the product is madeDescribe how the product is made- Operations required to make the product- Sequence of operationsSequence of operations- Equipment and accessories required- Standard time to perform each operation- Standard time to perform each operation
3 E MANAGEMENTCONSULTANTS
3 E MANAGEMENTCONSULTANTS www.3emc.net 34

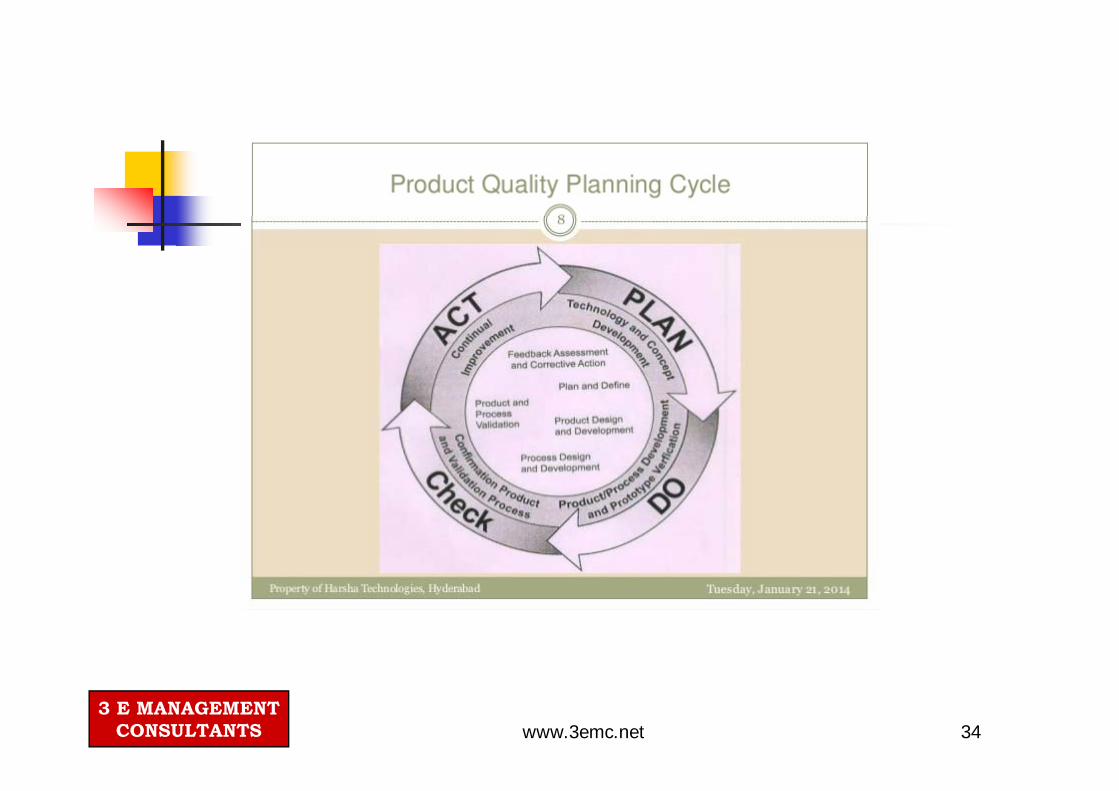
Production Part Approval Process
3 E MANAGEMENTCONSULTANTS www.3emc.net 35

Genichi Taguchi
TAGUCHI’STAGUCHI’S QUALITY
LOSSLOSSFUNCTION

INTRODUCTION
Taguchi Methods is a statistical methods developed g plargely by GENICHI TAGUCHI to improve quality of manufactured goods.The philosophy of off-line quality control.Innovations in the design of experiments.
3 E MANAGEMENTCONSULTANTS
Taguchi Loss Function Definition
Taguchi defines Quality as “the loss imparted by the product to society from the time the product is shipped ”product to society from the time the product is shipped.LOSS = Cost to operate, Failure to function, maintenance and repair cost, customer satisfaction, poor design.p , , p gProduct to be produced “being within specification”
3 E MANAGEMENTCONSULTANTS

Taguchi’s Vs Traditional Approach
Taguch’s Traditional
When a product moves from its Target
There is Good or Bad Products only as per moves from its Target
will cause the loss even if the product
Products only as per Limits
plies or not within Limits
3 E MANAGEMENTCONSULTANTS

Taguchi’s Quadratic Quality Loss Function
Quality Loss Occurs when a product’sQuality Loss Occurs when a product s deviates from target or nominal value.D i ti G th L iDeviation Grows, then Loss increases.Taguchi’s U-shaped loss Function Curve.g p
3 E MANAGEMENTCONSULTANTS

Taguchi’s U-shaped loss Function Curve.
Taguchi loss Fn
Scrap or Rework Cost.
Loss
LTL NominalMeasured characteristic
UTL3 E MANAGEMENT
CONSULTANTS
LTL Nominal UTL

Formula to find Taguchi’s Loss FnTaguchi uses Quadratic Equation to determine loss Curve
L (x) = k (x-N)²Where L (x) = Loss Function,( ) ,k = C/d² = Constant of proportionality, where C – Loss
associated with specification limitpd-Deviation of specification From target value
x = Quality Features of selected product,x Quality Features of selected product,N = Nominal Value of the product and
(x-N) = Tolerance(x N) Tolerance
3 E MANAGEMENTCONSULTANTS
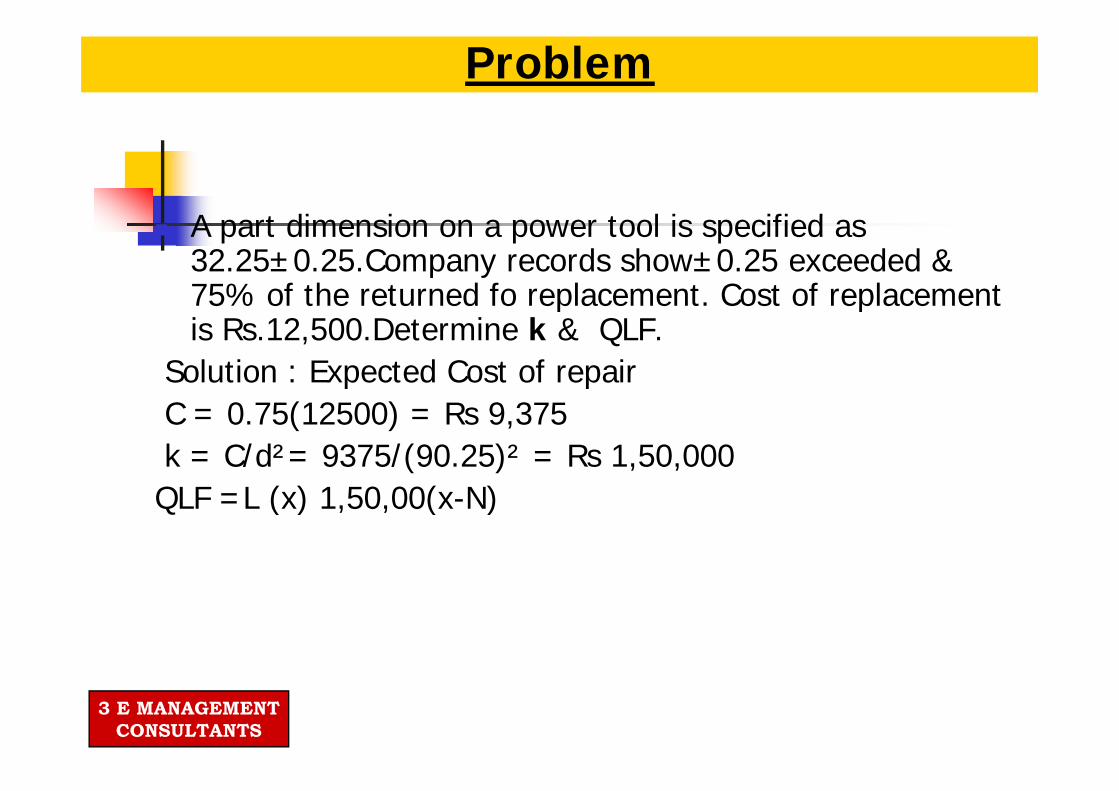
Problem
A t di i t l i ifi dA part dimension on a power tool is specified as 32.25±0.25.Company records show±0.25 exceeded & 75% of the returned fo replacement. Cost of replacement 5% o t e etu ed o ep ace e t Cost o ep ace e tis Rs.12,500.Determine k & QLF.
Solution : Expected Cost of repairC = 0.75(12500) = Rs 9,375k = C/d²= 9375/(90.25)² = Rs 1,50,000Q ( ) 0 00( )QLF =L (x) 1,50,00(x-N)
3 E MANAGEMENTCONSULTANTS

Ideal Supply Chain Management
What youthink it is
What it really is What itshould be
What itcould be
think it is
3 E MANAGEMENTCONSULTANTS 44www.3emc.net

Lead Time Improvement Tools and Techniques
MeasurementSupplier Rating and ImprovementSupplier Rating and Improvement Quality Plan Advance Production Quality Plan (APQP)Advance Production Quality Plan (APQP)Part Production Approval ProcessPl i t l ( B Ch t G t Ch t Mil StPlanning tool ( Bar Chart, Grant Chart, Mile Stone Chart)Critical Path MathCritical Path Math Performance/Project/Program Evaluation Review Techniques (PERT)Techniques (PERT)
3 E MANAGEMENTCONSULTANTS www.3emc.net 45

46www.3emc.net

KAI ZENKAI ZEN
Change + good = improvement
3 E MANAGEMENTCONSULTANTS 47www.3emc.net

KAIZEN INSTRUMENTS
5STOTAL PRODUCTIVE MAINTENANCETOTAL PRODUCTIVE MAINTENANCE KANBANVISIBLE MANAGEMENT ( Visual Control )VISIBLE MANAGEMENT ( Visual Control )PROCESS ORIENTED MANAGEMENTCROSS- FUNCTIONAL MANAGEMENT/ QUALITY CIRCLECROSS FUNCTIONAL MANAGEMENT/ QUALITY CIRCLE JUST –IN- TIME MANAGEMENTSTATISTICAL PROCESS CONTROLPDCA CYCLE
3 E MANAGEMENTCONSULTANTS
WORKPLACE MANAGEMENT SYSTEM
49www.3emc.net

OBJECTIVES
DESIGN A SYSTEM FOR ORGANIZING WORK PLACE IN ORDER TO RECOVER
LOSS OF INVENTORYLOSS OF MOVEMENT / ENERGYLOSS OF MOVEMENT / ENERGYLOSS OF TIMELOSS OF SPACELOSS OF SPACELOSS OF QUALITYLOSS OF SAFE CONDITIONLOSS OF PRODUCTION
3 E MANAGEMENTCONSULTANTS 50www.3emc.net

WORK PLACE MANAGEMENT 5S
1S SEIRI ORGANIZATION
2S SEITON ORDERLINESS
3S SEISO CLEANLINESS
4S SEIKETSU STANDARDIZATION
5S SHITSUKE DISCIPLINE
3 E MANAGEMENTCONSULTANTS 51www.3emc.net
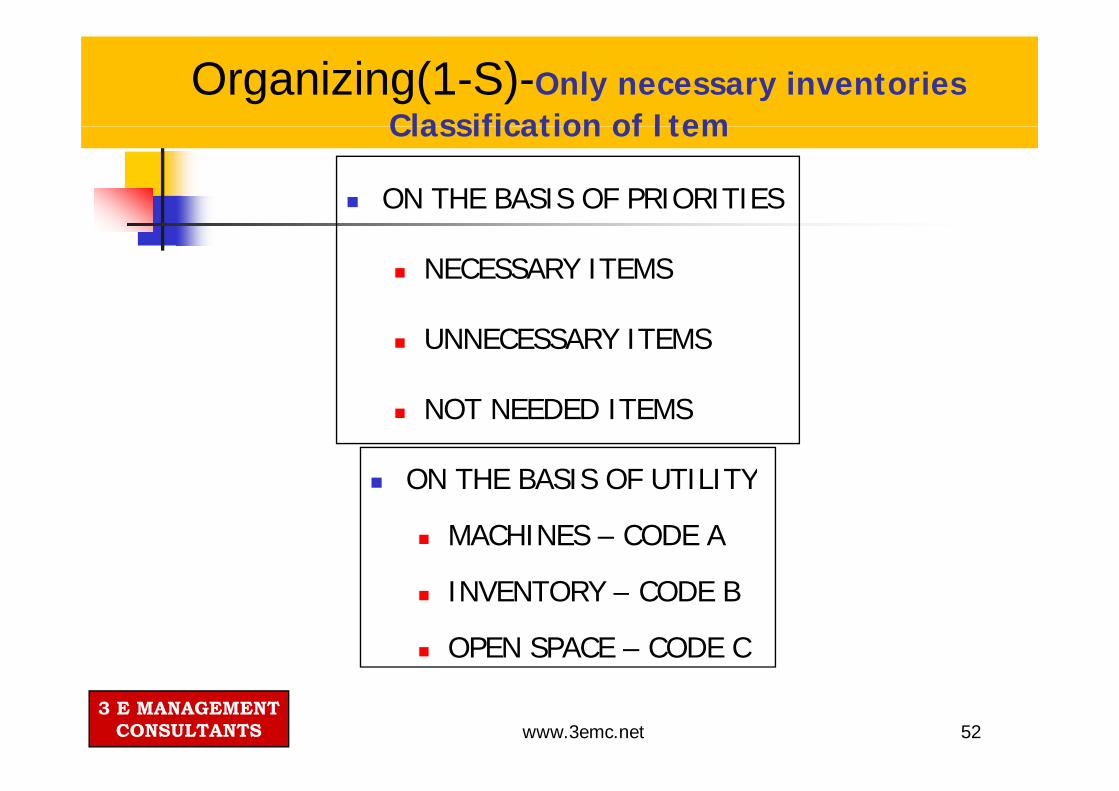
Organizing(1-S)-Only necessary inventoriesClassification of ItemClassification of Item
ON THE BASIS OF PRIORITIES
NECESSARY ITEMS
UNNECESSARY ITEMS
NOT NEEDED ITEMS
ON THE BASIS OF UTILITYON THE BASIS OF UTILITY
MACHINES – CODE A
INVENTORY – CODE B
OPEN SPACE – CODE C
3 E MANAGEMENTCONSULTANTS 52www.3emc.net
PAINTING STRATEGY
WALKING AREA ( WALK WAYS )
WORKING AREA ( OPERATION AREA )WORKING AREA ( OPERATION AREA )
3 E MANAGEMENTCONSULTANTS 53www.3emc.net

CLEANLINESS ( 3-S) WORK -STATUS BASED
CONSTRUCTORY BASEDINTERNAL CLEANLINESSEXTERNAL CLENLINESS
CLEANLINESSCLEANLINESS
WHERE CLEANLINESS IS TO BE MAINTAINED?
WHAT IS TO BE CLEANED?
WHO WILL CLEAN?
HOW TO CLEAN?
FREQUENCY OF CLEANINGFREQUENCY OF CLEANING
DURATION FOR CLEANING
TOOLS AND MATERIALS REQUIRED3 E MANAGEMENT
CONSULTANTS 54www.3emc.net
TOOLS AND MATERIALS REQUIRED
APPROACH BASED
INSTANT MAINTENANCE ( Routine )
REQUIRED MAINTENANCE( PreventiveREQUIRED MAINTENANCE( Preventive
Leading to TPM to be measured in OEE
3 E MANAGEMENTCONSULTANTS 55www.3emc.net

PILLARS OF TPM
3 E MANAGEMENTCONSULTANTS www.3emc.net 56
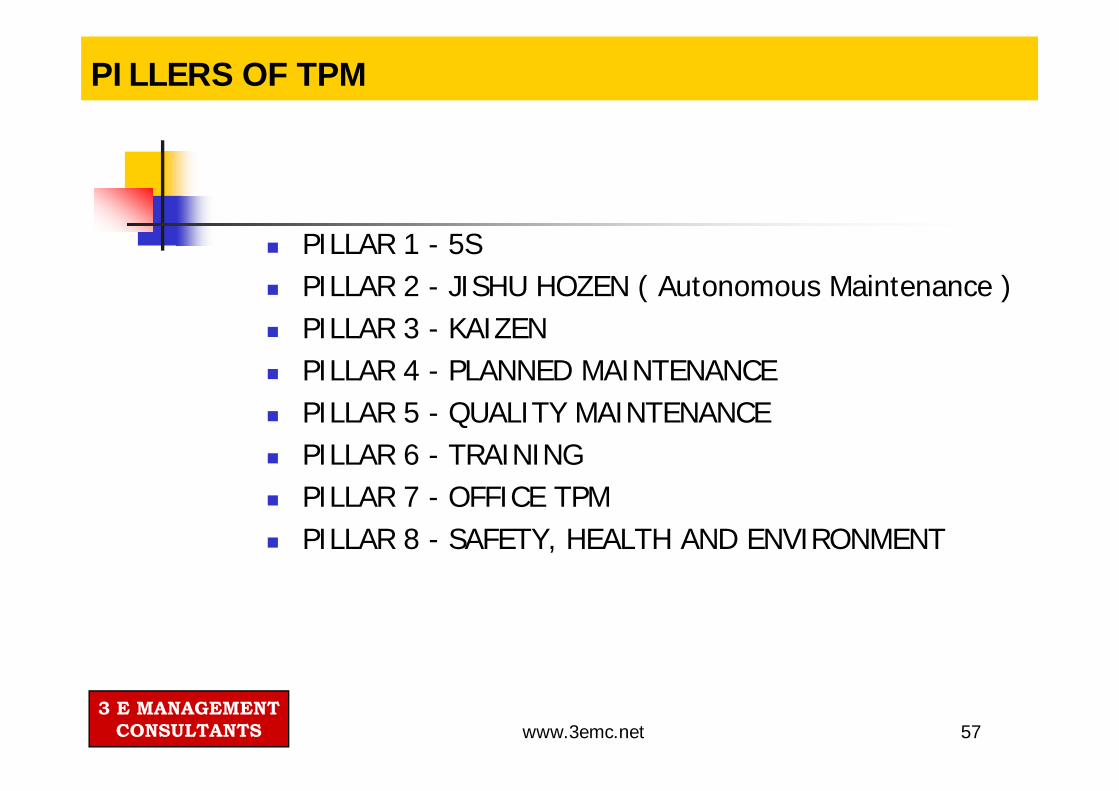
PILLERS OF TPM
PILLAR 1 - 5S PILLAR 2 - JISHU HOZEN ( Autonomous Maintenance ) PILLAR 3 - KAIZEN PILLAR 4 - PLANNED MAINTENANCE PILLAR 5 - QUALITY MAINTENANCE PILLAR 6 - TRAINING
O CPILLAR 7 - OFFICE TPM PILLAR 8 - SAFETY, HEALTH AND ENVIRONMENT
3 E MANAGEMENTCONSULTANTS www.3emc.net 57
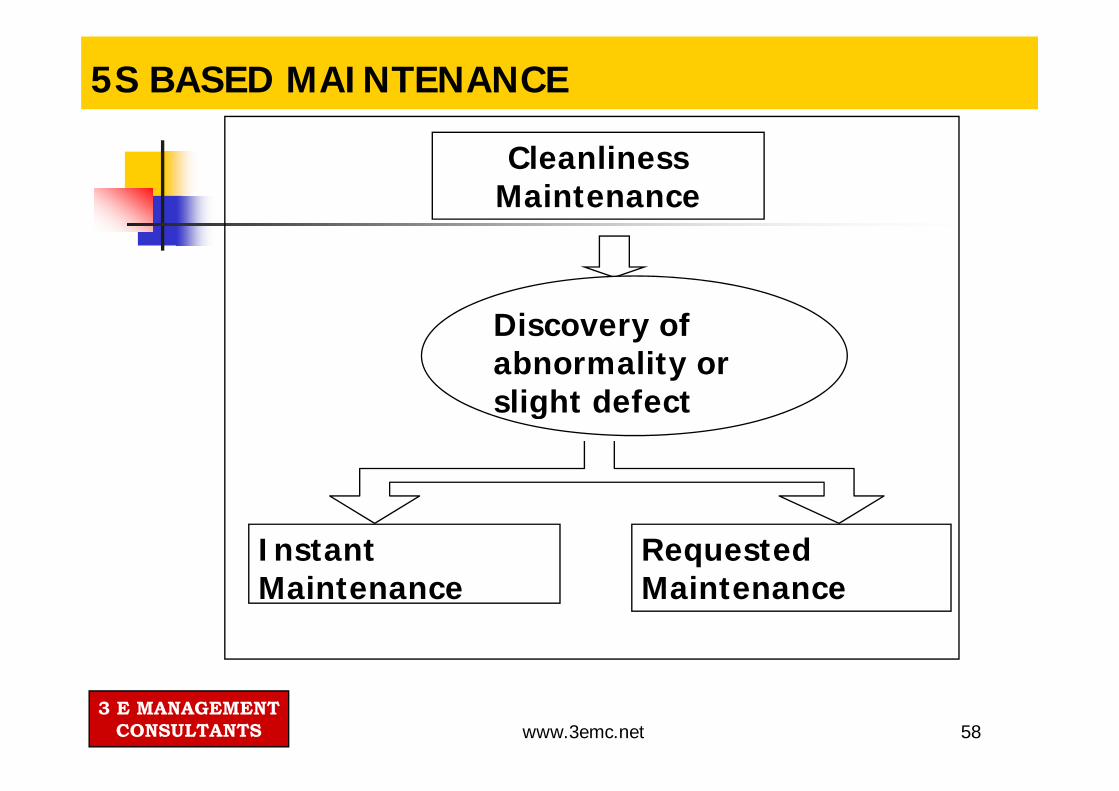
5S BASED MAINTENANCE
Cleanliness Maintenance
Discovery of abnormality or slight defectslight defect
Instant i
Requested iMaintenance Maintenance
3 E MANAGEMENTCONSULTANTS www.3emc.net 58

TYPES OF MAINTENANCE
Maintenance PreventionDesigning or selecting equipment that will run with minimal maintenance and is easy to service when necessary. Predictive MaintenanceD t i i th lif t f hi tDetermining the life expectancy of machine parts or components in order to replace them at their optimum times. Corrective MaintenanceImproving the performance of existing equipment or alteringImproving the performance of existing equipment or altering equipment to changing manufacturing needs. Preventive MaintenanceScheduling and planning maintenance activities so that smoothScheduling and planning maintenance activities so that smooth operation of equipment may continue. Autonomous MaintenanceInvolving production employees in all aspects of the machine g p p y pmaintenance process.
3 E MANAGEMENTCONSULTANTS www.3emc.net 59
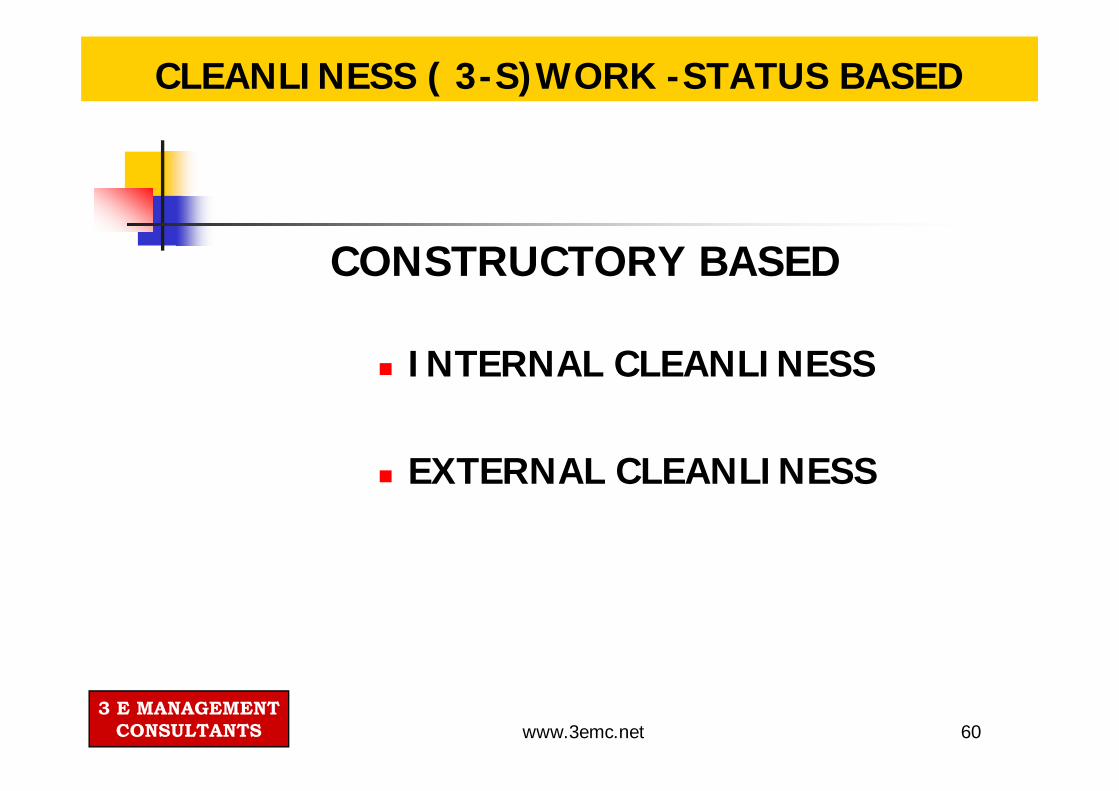
CLEANLINESS ( 3-S)WORK -STATUS BASED
CONSTRUCTORY BASED
INTERNAL CLEANLINESS
EXTERNAL CLEANLINESS
3 E MANAGEMENTCONSULTANTS www.3emc.net 60

PILLAR 2 - JISHU HOZEN ( Autonomous Maintenance )( Autonomous Maintenance )
To develop operators to take care of small maintenancetasks.tasks.To make free skilled maintenance people to spend time onmore value added activity and technical repairs.The operators are responsible for upkeep of theirequipment to prevent it from deteriorating.
3 E MANAGEMENTCONSULTANTS www.3emc.net 61
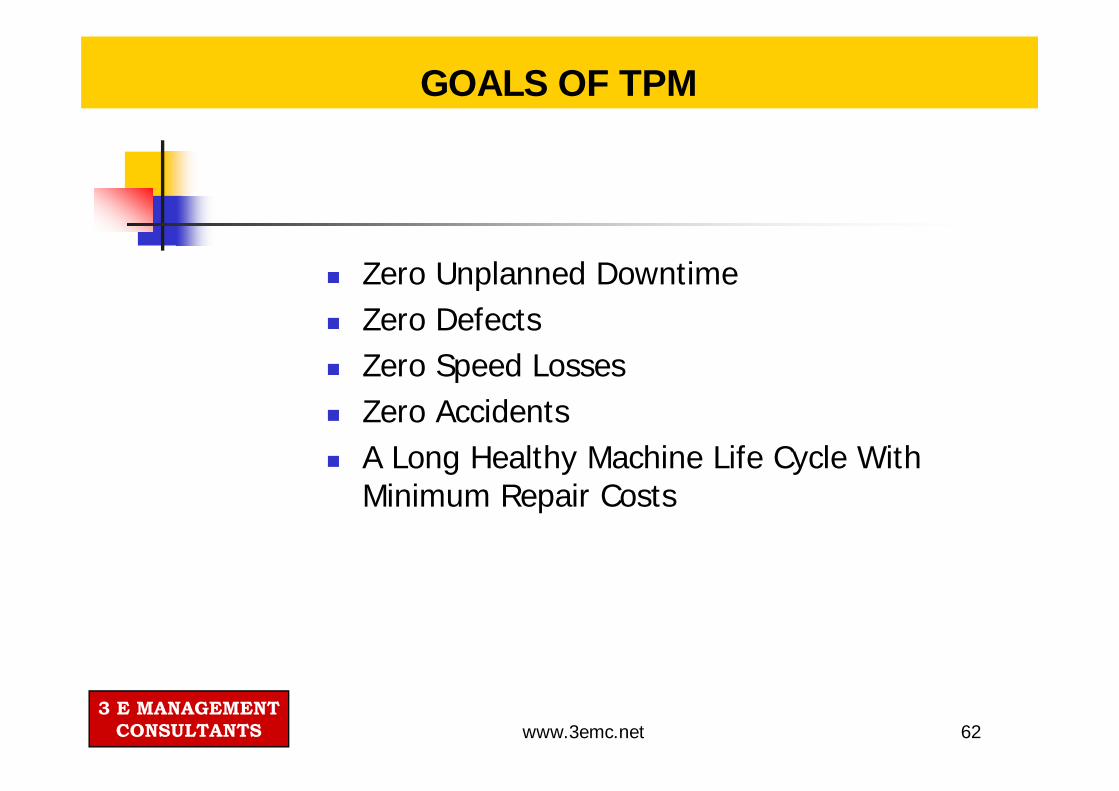
GOALS OF TPM
Zero Unplanned Downtime Zero Defects Zero Speed Losses Zero Accidents A Long Healthy Machine Life Cycle With Mi i R i C tMinimum Repair Costs
3 E MANAGEMENTCONSULTANTS www.3emc.net 62
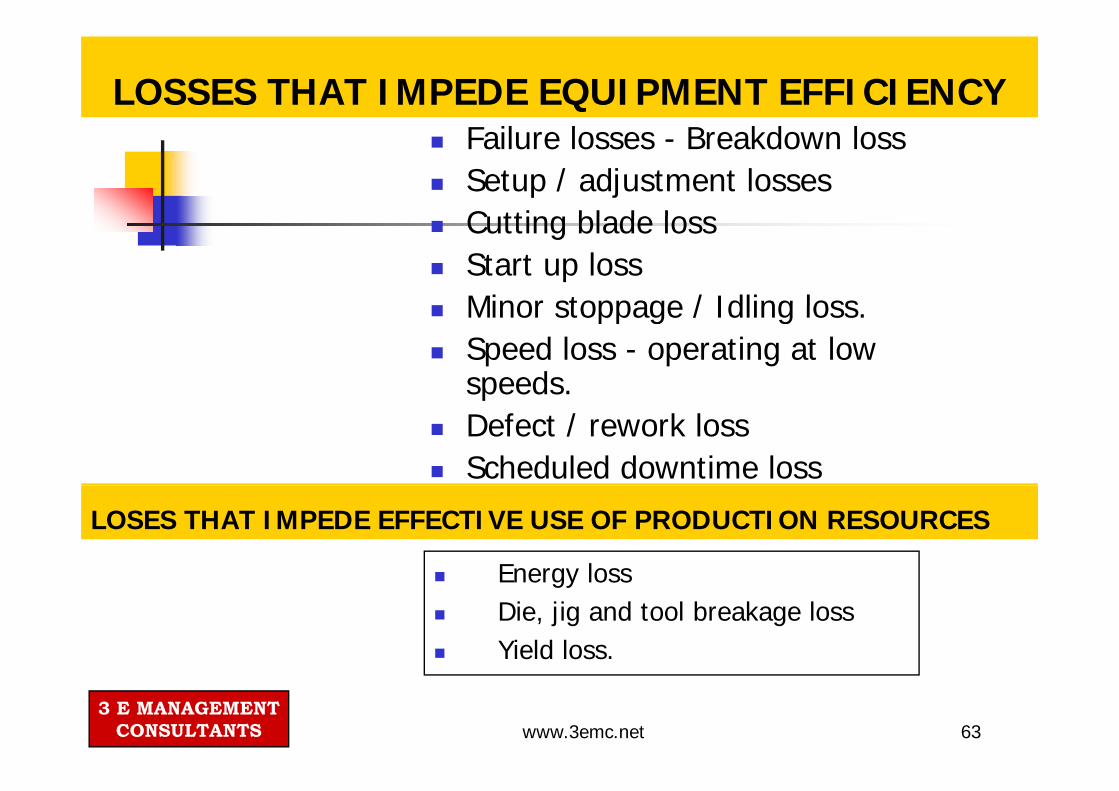
LOSSES THAT IMPEDE EQUIPMENT EFFICIENCYF il l B kd lFailure losses - Breakdown loss Setup / adjustment losses Cutting blade lossCutting blade loss Start up loss Minor stoppage / Idling lossMinor stoppage / Idling loss. Speed loss - operating at low speeds. pDefect / rework loss Scheduled downtime loss
LOSES THAT IMPEDE EFFECTIVE USE OF PRODUCTION RESOURCES
Energy lossEnergy loss Die, jig and tool breakage loss Yield loss.
3 E MANAGEMENTCONSULTANTS www.3emc.net 63
Kanban Systems
The first kanban system was applied by Taiichi Ohnoin Toyota around 1953 to:Toyota around 1953 to:Reduce inventory and production cycle timeI d ti itImprove productivity
3 E MANAGEMENTCONSULTANTS www.3emc.net 64

Kanban Control System
• Kanban card indicates standard quantity of production
• Derived from two-bin inventory system• Derived from two-bin inventory system• Kanban maintains discipline of pull
production
3 E MANAGEMENTCONSULTANTS www.3emc.net 65

Kanban Control System
Once implemented, a Kanban system acts a control system rather than a scheduling systemrather than a scheduling system
It implements a repetitive schedule embedded in the systemp p y
This schedule can be generated by a scheduling algorithm
Simulation can be used to determine the number of kanbans, queue size, etc.
3 E MANAGEMENTCONSULTANTS 66www.3emc.net
Basic Preconditions for Kanban Systems
Repetitive production in small lots• Repetitive production in small lots• Balanced manufacturing system g y
(capacity balancing model)
3 E MANAGEMENTCONSULTANTS www.3emc.net 67
Kanban provides a number of benefits.
Reduce inventory and product obsolescence.Reduces waste and scrapProvides flexibility in productionIncreases OutputpReduces Total Cost
3 E MANAGEMENTCONSULTANTS www.3emc.net 68

69www.3emc.net

Synonyms for JIT
Continuous flow manufacturing Zero inventoryKeep moving material manufactureKeep moving material manufactureTime bases competitiveness pSynchronous manufacturing
3 E MANAGEMENTCONSULTANTS

JIT Stages
JIT techniques are classified into Two stages:
Stage 1: The stage 1 techniques are concerned with preparing the plant for flow, flexibility, short lead time and high quality. They may be said to be the prerequisites for JIT.
Stage 2: The stage 2 set of techniques generally build on stageStage 2: The stage 2 set of techniques generally build on stage 1 set, and comprise those techniques allows operations to run in JIT manner, that is with short (Zero?) lead time and little (Z ?) t(Zero?) waste.
3 E MANAGEMENTCONSULTANTS

JIT Stage 1:
Maintenance Quality (TQM)
Maintenance (TPM)Design
Focus
Prepare the plant for flexibility, Low Cost, Short ,Lead Time and High Quality
People Preparation
Setup Time Red tion
Layout and
Small Machines PreparationReductionand
GTMachines
3 E MANAGEMENTCONSULTANTS
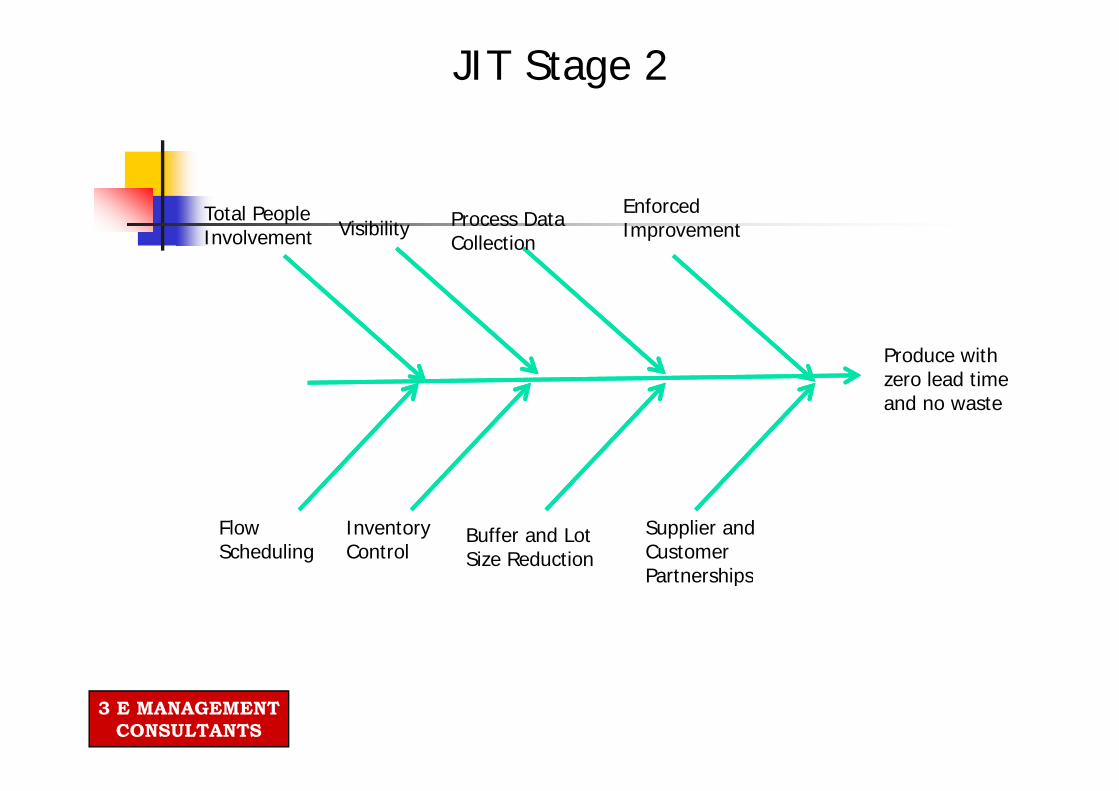
JIT Stage 2
Enforced Process DataTotal People
ImprovementProcess Data Collection
VisibilityTotal People Involvement
Produce with zero lead time
dand no waste
Supplier and Customer Partnerships
Buffer and Lot Size Reduction
Inventory Control
Flow Scheduling
Partnerships
3 E MANAGEMENTCONSULTANTS

JIT Stage 1: Design
Effect Causes Sub CauseEase of manufacturing with control quality speed
Parts Reduction 1. GT Data Base2. Modular Specs.control quality speed 2. Modular Specs.3. Value Eng
Communication 1. Design as operators2. Location of design office2. Location of design office3. Feedback meetings
Option Reduction 1. Pareto2. Value Eng.
Design for manufacturing 1. Manufacture Vs. The customer2. EMI3. Option AS Late AS POSS4 Capability awareness4. Capability awareness5. Concurrent Engineering
Supplier Involvement 1. Open Specification2. Early consulting2. Early consulting3. Trust4. Supplier as experts5. Inter shop floor visits
3 E MANAGEMENTCONSULTANTS

JIT Stage 1: MaintenanceEffect Causes Sub CauseEffect Causes Sub Cause
Maintenance tool, Equipment available
People 1. Operator Responsibility: cleanliness aircraft style checkEquipment available
when needed with Low cost
cleanliness aircraft style check use of senses simple tasks
2. Maintenance staff: standard procedure improvement operator p p ptraining more complex task
Data 1. Visible charts : on machine, on shop floorshop floor
2. MIS: Inventory history, maintenance cycles
Support 1 Condition monitoring: failure typeSupport 1. Condition monitoring: failure type awareness
2. Fast response MTTR: Lights, sound tool location trolleyssound tool location, trolleys response time monitoring
3. Maintenance shifts: Bottleneck awareness “8-4-8-4” cycle
3 E MANAGEMENTCONSULTANTS
awareness 8 4 8 4 cycle
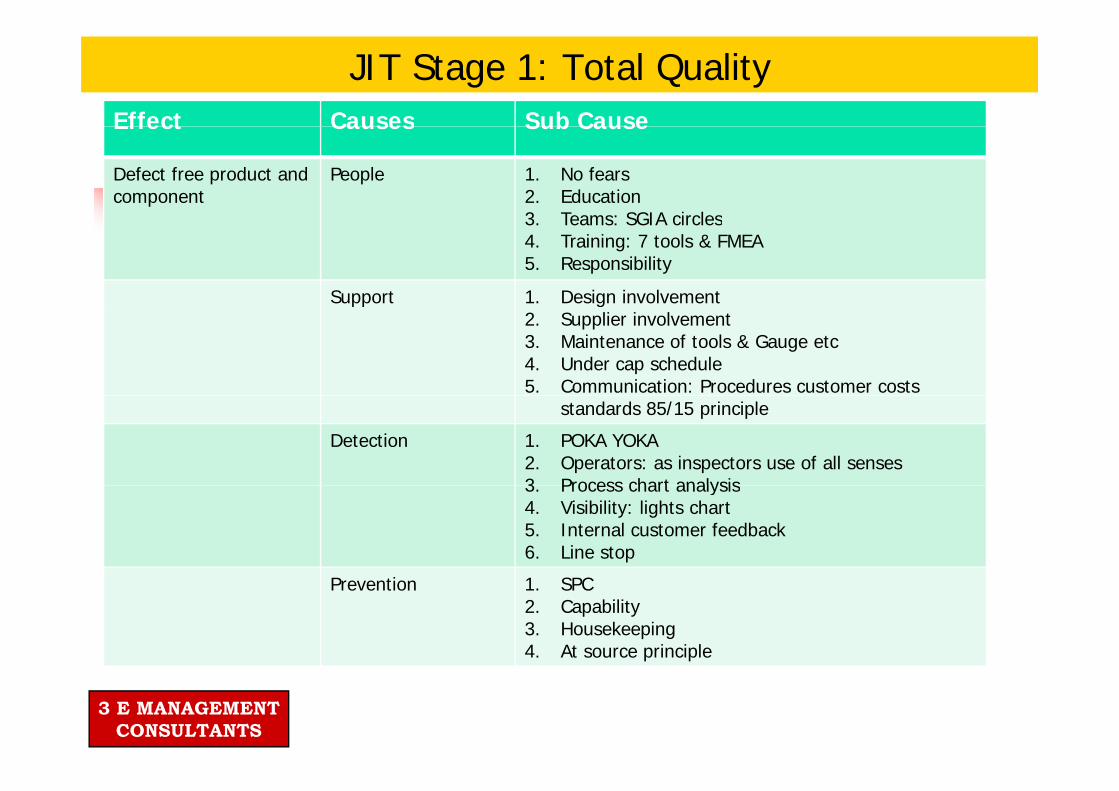
JIT Stage 1: Total QualityEffect Causes Sub CauseEffect Causes Sub Cause
Defect free product and component
People 1. No fears2. Education3 Teams: SGIA circles3. Teams: SGIA circles4. Training: 7 tools & FMEA5. Responsibility
Support 1. Design involvementpp g2. Supplier involvement3. Maintenance of tools & Gauge etc4. Under cap schedule5. Communication: Procedures customer costs
standards 85/15 principle
Detection 1. POKA YOKA2. Operators: as inspectors use of all senses3 Process chart analysis3. Process chart analysis4. Visibility: lights chart5. Internal customer feedback6. Line stop
Prevention 1. SPC2. Capability3. Housekeeping4. At source principle
3 E MANAGEMENTCONSULTANTS

JIT Stage 1: Small Machine
Effect Causes Sub Cause
Flexibility cost Self 1 Simplify: mat hand processFlexibility cost,layout, cash flow, latest tech
Self development machine
1. Simplify: mat hand process2. At ITS worst when new: poka yoka
devices, Quality capable, low cost automation combined operationsautomation, combined operations
Small Machine 1. Demand speed2. Flexible layout: move machine, move
l b thpeople, move both3. Permanently set up: non bottlenecks,
idleness no problem4 Suck cost principle4. Suck cost principle
Old Machine 1. Permanently set up: non bottlenecks, idleness no problem
2 S k t i i l2. Suck cost principle
3 E MANAGEMENTCONSULTANTS

JIT Stage 1: LayoutEffect Causes Sub CauseEffect Causes Sub CauseFlow Facilitation with minimum waste
Housekeeping 1. Time allowed2. Operator ownership3. Incentives, bonus, awards4. Cleanliness5. Orderliness6. Tidiness
Support 1 Machine n wheelsSupport 1. Machine n wheels2. Human movable containers3. Gravity feeds4. Line side delivery5 Multi access points5. Multi access points6. Small machine
Improvement 1. Flow length monitoring2. Process chart analysis3 W h k h3. Waste check sheets4. Dynamic Layouts
Shape 1. U shape communication pfa2. Cells & GT: shojinka close by quality2. Cells & GT: shojinka close by quality
Place 1. Quality of life at work place: lighting, carpets, noise, ergonomics
2. Autonomous work place3 Operators Participation
3 E MANAGEMENTCONSULTANTS
3. Operators Participation
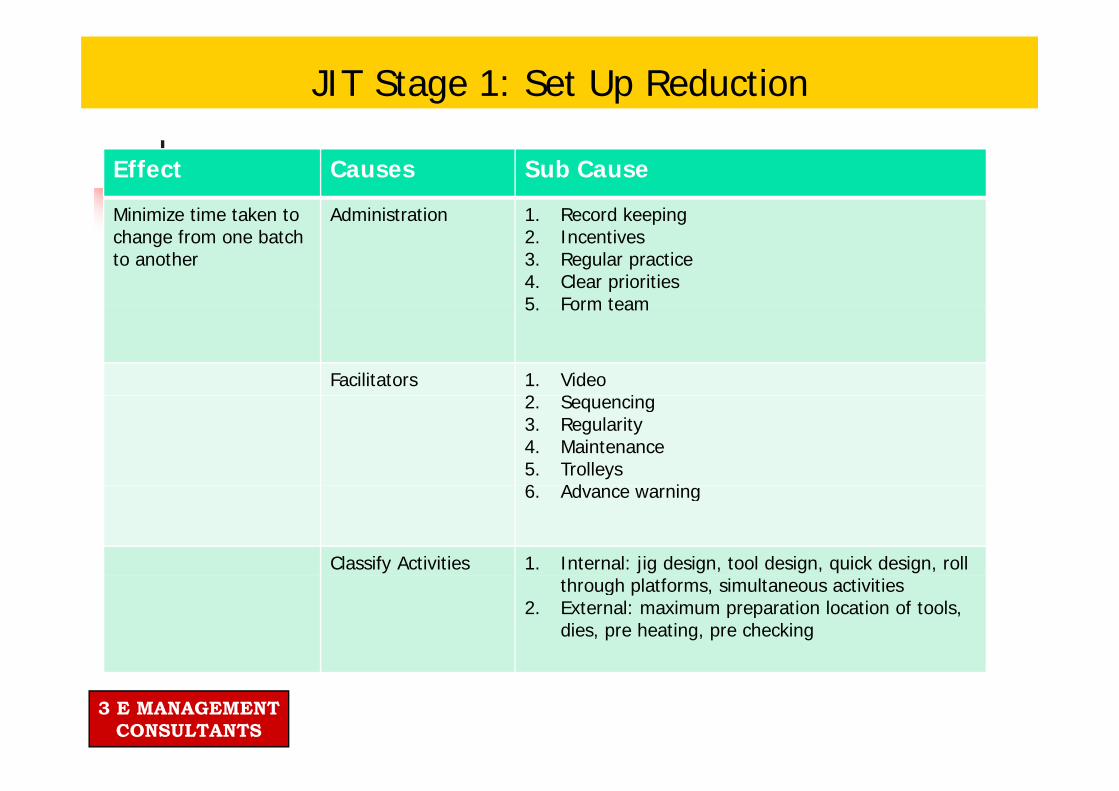
JIT Stage 1: Set Up Reduction
Effect Causes Sub Cause
Minimize time taken to Administration 1 Record keepingMinimize time taken to change from one batch to another
Administration 1. Record keeping2. Incentives3. Regular practice4. Clear priorities5 Form team5. Form team
Facilitators 1. Video2 S i2. Sequencing3. Regularity4. Maintenance5. Trolleys6 Ad i6. Advance warning
Classify Activities 1. Internal: jig design, tool design, quick design, roll through platforms, simultaneous activities
2. External: maximum preparation location of tools, dies, pre heating, pre checking
3 E MANAGEMENTCONSULTANTS
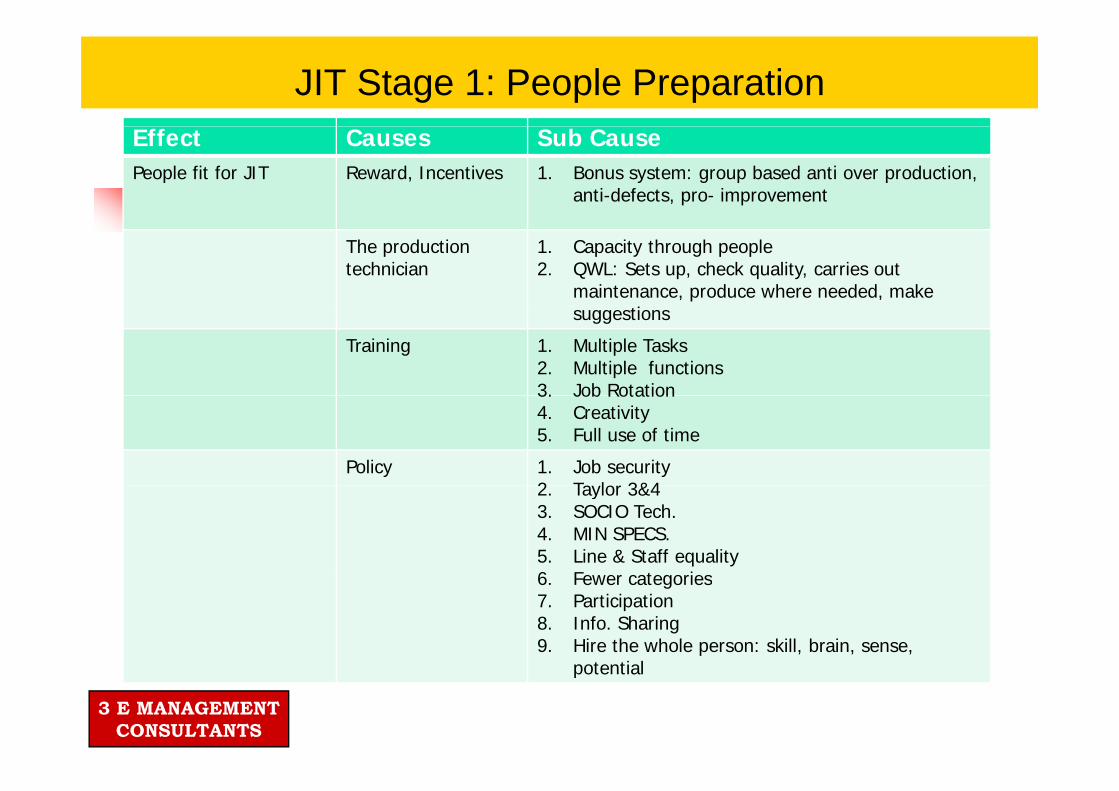
JIT Stage 1: People PreparationEffect Causes Sub CausePeople fit for JIT Reward, Incentives 1. Bonus system: group based anti over production,
anti-defects, pro- improvement
The production technician
1. Capacity through people2. QWL: Sets up, check quality, carries out
maintenance, produce where needed, make suggestions
Training 1. Multiple Tasks2. Multiple functions3. Job Rotation3. Job Rotation4. Creativity5. Full use of time
Policy 1. Job security2 Taylor 3&42. Taylor 3&43. SOCIO Tech. 4. MIN SPECS.5. Line & Staff equality6 Fewer categories6. Fewer categories7. Participation8. Info. Sharing9. Hire the whole person: skill, brain, sense,
potential
3 E MANAGEMENTCONSULTANTS
potential

JIT Stage 2:
1. People Involvement2 Visibility2. Visibility3. Process data collection4. Improvementp5. Flow scheduling6. Lot size and buffer reduction7. Inventory Control8. Suppliers
3 E MANAGEMENTCONSULTANTS
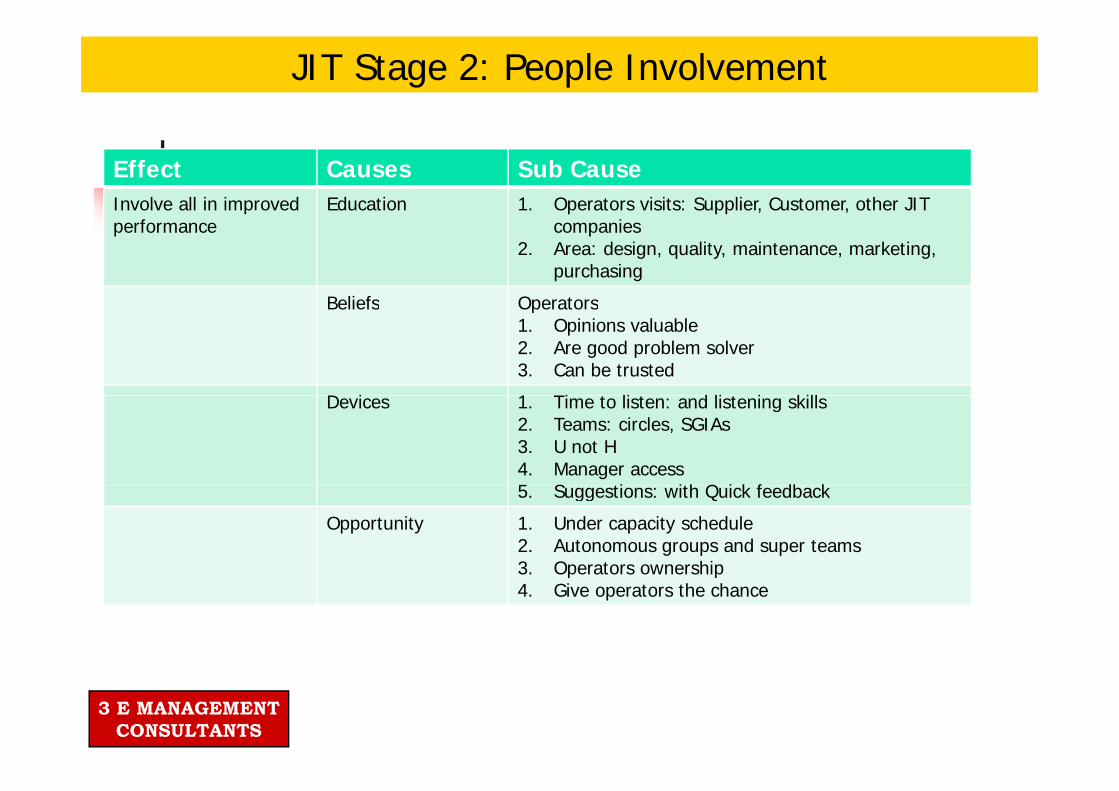
JIT Stage 2: People Involvement
Effect Causes Sub CauseInvolve all in improved Education 1. Operators visits: Supplier, Customer, other JIT performance companies
2. Area: design, quality, maintenance, marketing, purchasing
Beliefs OperatorsBeliefs Operators1. Opinions valuable2. Are good problem solver3. Can be trusted
D i 1 Ti t li t d li t i killDevices 1. Time to listen: and listening skills2. Teams: circles, SGIAs3. U not H4. Manager access5 S ti ith Q i k f db k5. Suggestions: with Quick feedback
Opportunity 1. Under capacity schedule2. Autonomous groups and super teams3. Operators ownershipp p4. Give operators the chance
3 E MANAGEMENTCONSULTANTS

JIT Stage 2: Visibility
Effect Causes Sub CauseMake progress and Quality 1. Light & soundproblem clear 2. Defect display: by operators, by type
3. Problem Pareto & Fishbone4. SPC Charts
Schedule 1 Painter stock locationsSchedule 1. Painter stock locations2. KANBAN3. Electronic counts4. Bottleneck Tags
Oth A 1 C fOther Area 1. Company performance2. ANDON Boards3. Delay Clocks4. Visible skill chart5 O t t ib ti di l5. Operator contribution display6. Daily Communication7. Office Locations
3 E MANAGEMENTCONSULTANTS

JIT Stage 2:Process Data Collection
Effect Causes Sub CauseCollect and use data Inventory & 1. BAR codingCollect and use data as it happens
Inventory & Scheduling
1. BAR coding2. Delay Clocks3. Automatic counting
Machine 1. Automatic Condition monitoring2 R H di2. Run Hour recording3. Status Display: tools, Strokes
Quality 1. Operator performance: acknowledge and unacknowledged defectsunacknowledged defects
2. POKA YOKA: automatic stop warning3. ON shop floor SPC
3 E MANAGEMENTCONSULTANTS
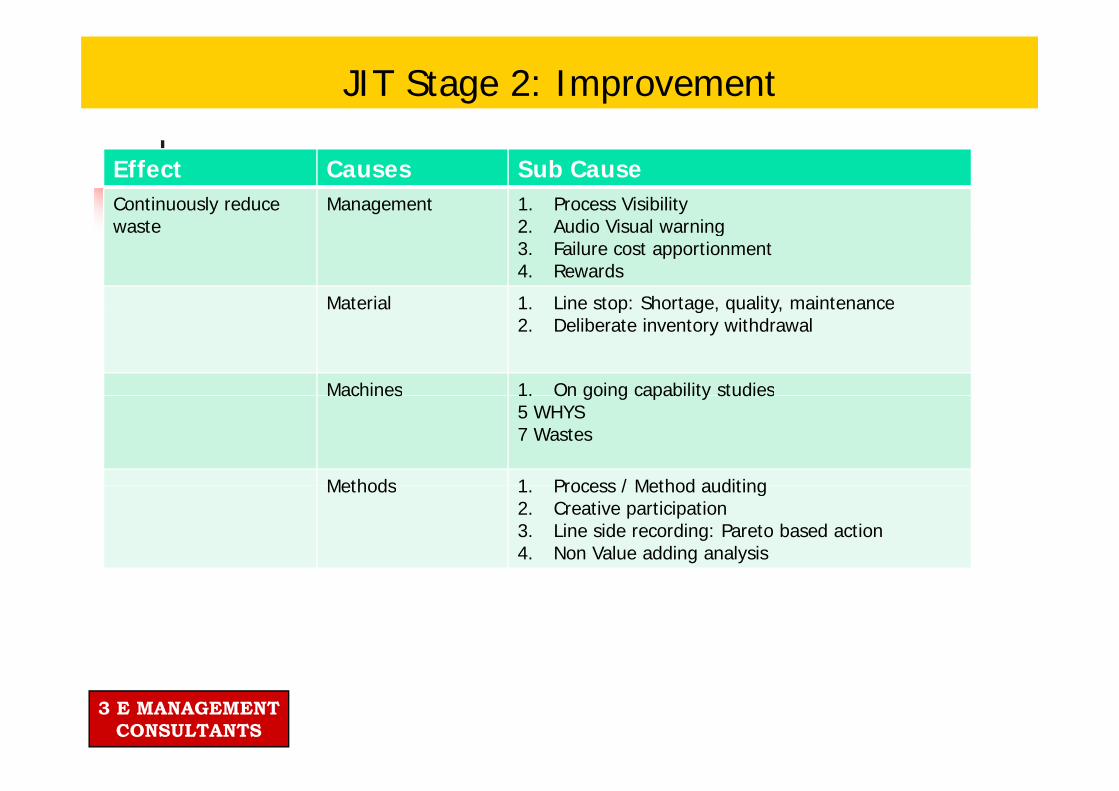
JIT Stage 2: Improvement
Effect Causes Sub CauseContinuously reduce Management 1. Process Visibilitywaste 2. Audio Visual warning
3. Failure cost apportionment4. Rewards
Material 1 Line stop: Shortage quality maintenanceMaterial 1. Line stop: Shortage, quality, maintenance2. Deliberate inventory withdrawal
Machines 1. On going capability studiesMachines 1. On going capability studies5 WHYS7 Wastes
Methods 1 Process / Method auditingMethods 1. Process / Method auditing2. Creative participation3. Line side recording: Pareto based action4. Non Value adding analysis
3 E MANAGEMENTCONSULTANTS

JIT Stage 2: Flow Scheduling
Effect Causes Sub CauseKeep inventory moving Pull System 1 KANBAN: internal external square card priorityKeep inventory moving at rates of demand
Pull System 1. KANBAN: internal, external, square card, priority, electronic ping pong
Regularity 1. Same time every day2. Linearity
Schedule D l t
1. Mixed model2 U d it h d lDevelopment 2. Under capacity schedule3. INPUT/OUTPUT control4. Constant sequence5. Bottleneck capacity control6 F d i ibilit6. Forward visibility7. Some every day8. Schedule stability9. ADD value late
3 E MANAGEMENTCONSULTANTS

JIT Stage 2: Lot size & Buffer reduction
Effect Causes Sub Cause
Minimize lot size and buffers
Buffers 1. Holding cost awareness2. Schedule accuracy, feedback loop3. Non bottleneck, buffer elimination4. Awareness of linkage: with maintenance, quality,
supplier variability, lead times & multi locations
Lot size 1 Linkage with setup times: graphed recalculatedLot size 1. Linkage with setup times: graphed, recalculated run times
2. Non bottleneck transfer lot size3. Bottleneck constraints: greater throughput
3 E MANAGEMENTCONSULTANTS

JIT Stage 2: Inventory control
Effect Causes Sub CauseControl inventory for Flow preparation 1. Cycle countingControl inventory for flow
Flow preparation 1. Cycle counting2. Record accuracy3. Bottleneck links4. Visibility5. Window deliveries5. Window deliveries6. MRP7. Reduction BOM levels8. Standardized container
Fl it i & 1 I t/ t t t lFlow monitoring & Control
1. Input/output control2. Buffer monitoring3. Four wall inventory4. Back flushing5 Bottleneck throughput5. Bottleneck throughput
3 E MANAGEMENTCONSULTANTS

JIT Stage 2: SuppliersEffect Causes Sub CausePartnership on cost, quality, reliability and long term profit
Cost Reduction 1. Open specs.2. Cooperation on future design3. Fewer suppliersp pp4. Supplier Pareto5. Cutting lead times
Delivery 1. Periodic reconciliation2. Less checking standard containers3. Delivery time window4. KANBAN5. Line side delivery
Quality 1. Site visits2 E2. Easy access3. Joint team4. Supplier responsibility5. Product identification
Reliability 1 Longer term contractsReliability 1. Longer term contracts2. Sole suppliers3. Blanket orders4. Schedule stability5. Cut buffers
Information 1. EDI2. 2 way problem notification3. Schedule visibility4. 2 way visits5 C b d
3 E MANAGEMENTCONSULTANTS
5. Common bar code

Elements of JIT
Pull production conceptFlexible resourcesFlexible resourcesCellular manufacturingKanban production controlSmall-lot productionQuick setupsHigh qualityHigh qualitySupplier networks
3 E MANAGEMENTCONSULTANTS 90www.3emc.net
91www.3emc.net

Six sigma
Six Sigma is a Management technique that aims to develop and deliver near perfect products and servicesdevelop and deliver near perfect products and services.Six Sigma is a quality system based on measurements of how well an organization meets customer requirements.g q
Six Sigma is a Measure for QualitySix Sigma is a Measure for Quality
-- Process For Continuous ImprovementProcess For Continuous Improvement
-- Enabler for Culture ChangeEnabler for Culture Change
3 E MANAGEMENTCONSULTANTS 92

How Six Sigma works?
Traditional approach towards Problem solving:A h th bl di tlApproach the problem directlyTry to identify a solution
Six Sigma:Root Cause analysis to identify the factors impacting the problemValidating them using statistical tools Finding solutions for the significant causesFinding solutions for the significant causes
3 E MANAGEMENTCONSULTANTS 93

D-M-A-I-C
1. Define: Customer expectations of the process?2. Measure : What is the frequency of defects?3. Analyze: Why, when, and where do defects occur?4. Improve: How can we fix the process?5. Control: How can we make the process stay fixed?
3 E MANAGEMENTCONSULTANTS
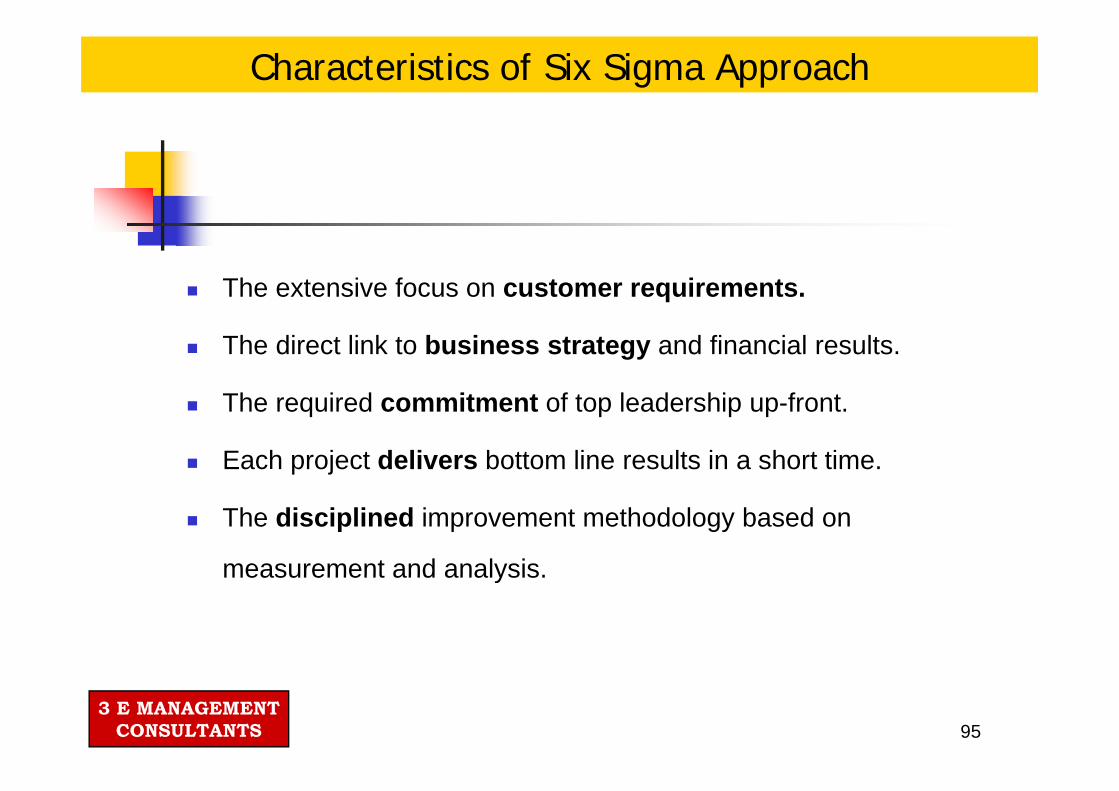
Characteristics of Six Sigma Approach
The extensive focus on customer requirements.
The direct link to business strategy and financial results.
Th i d it t f t l d hi f tThe required commitment of top leadership up-front.
Each project delivers bottom line results in a short time.
The disciplined improvement methodology based on
measurement and analysis.measurement and analysis.
3 E MANAGEMENTCONSULTANTS 95

Statistical Measure of Six Sigmadpmo (Number of defects discovered/ Opportunities for error) * 1 000 000
σ (Sigma) rating Defect rate On-time at-quality
dpmo = (Number of defects discovered/ Opportunities for error) * 1,000,000
( g ) g q yrate
0 93.32% 6.68%
1 69.15% 30.85%
2 30.85% 69.15%
3 6.68% 93.32%
4 62% 99 38% 4 .62% 99.38%
5 .23% 99.77%
% % 6 .034% 99.966%
3 E MANAGEMENTCONSULTANTS 96

Basic definition
Process: this refers to some unique combination of machine, tools methods materials and people engaged in productiontools, methods, materials and people engaged in production
Capability: this word is used in the sense of an ability, based on tested performance, to achieve measurable results
Inherent capability: this refers to the product uniformityInherent capability: this refers to the product uniformity resulting from a process which is in a state of statistical control, i.e., in the absence of time-to-time drift or other assignable
f i ti I t t d ibilit icauses of variation. Instantaneous reproducibility is a synonym.
3 E MANAGEMENTCONSULTANTS

Process capability index and product outside specification limit
Process capability index (Cp)
Total product outside two sided specification limits
0.5 13.36%
0.67 4.55%
1.00 0.3%
1.33 64 PPM
1.63 1 PPM
2.00 02.00 0
3 E MANAGEMENTCONSULTANTS

System Approach for Sustainable Upgradation/ Improvement
3 E MANAGEMENTCONSULTANTS www.3emc.net 99
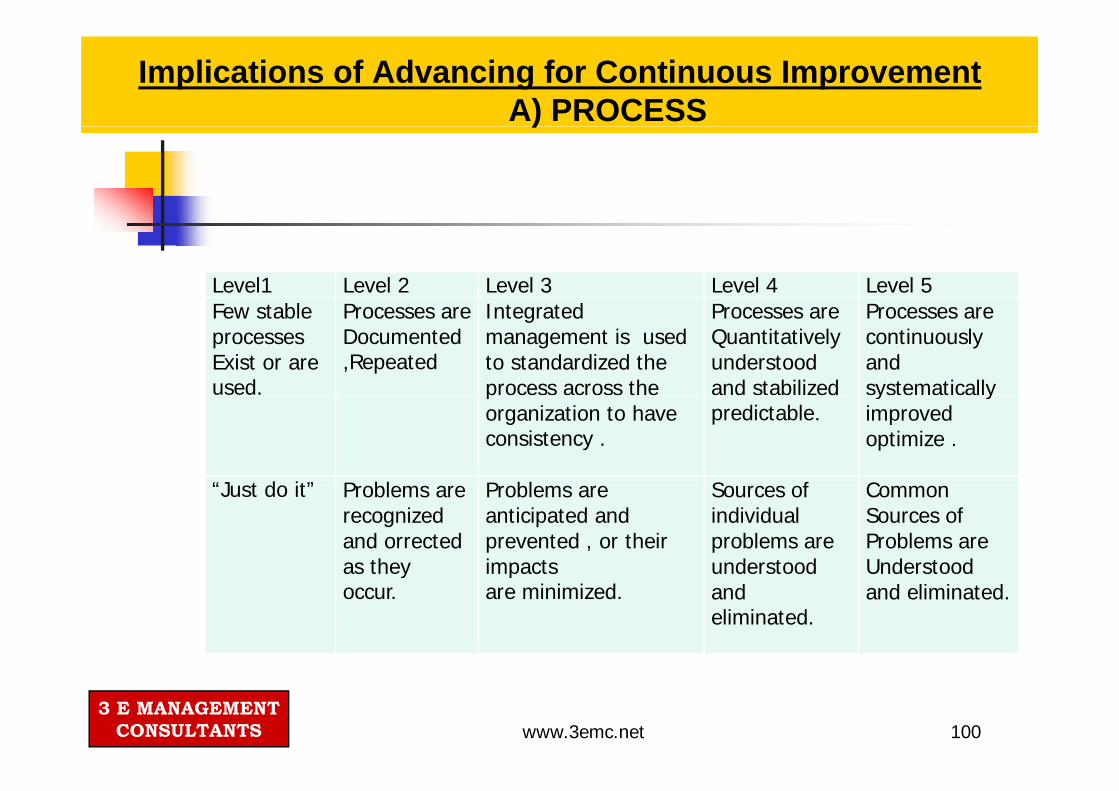
Implications of Advancing for Continuous ImprovementA) PROCESS )
Level1 Level 2 Level 3 Level 4 Level 5F t bl P I t t d P PFew stable processes Exist or areused.
Processes are Documented ,Repeated
Integrated management is used to standardized the process across the
Processes areQuantitatively understood and stabilized
Processes arecontinuously and systematically p
organization to have consistency .
predictable.y y
improved optimize .
“Just do it” P oblems a e P oblems a e So ces of Common“Just do it” Problems arerecognized and orrectedas they
Problems areanticipated and prevented , or their impacts
Sources of individual problems are understood
CommonSources of Problems are Understood y
occur.p
are minimized. and eliminated.
and eliminated.
3 E MANAGEMENTCONSULTANTS www.3emc.net 100

Implications of Advancing for Continuous ImprovementB) People) p
Level1 Level 2 Level 3 Level 4 Level 5Level1 Level 2 Level 3 Level 4 Level 5Successdepends onindividualheroics.
Successdepends onindividuals;management
Area groupswork together,perhaps as an integrated
Strong sense of teamwork exists within each project.
Strong sense ofteamworkexists acrosstheheroics. management
systemsupports.
integratedproduct team
each project. theorganization.
“Fire fighting” is a way of life.
Commitmentsare under-
Training is planned and
Everyone is involved ina way of life. are under
stood and managed
planned and provided according to roles.
involved in processimprovement.
Relationships People areRelationships between department are uncoordinated, perhaps even
People are trained in coordination, interpersonal relation ship.perhaps even
adversarial .relation ship.
3 E MANAGEMENTCONSULTANTS www.3emc.net 101

Implications of Advancing for Continuous Improvementc)Technology) gy
Introduction
of new
Technology
Supports
New technologies
are
New
technologies
New
technologiesof new
technology is
risky.
Supports
Established ,
stable
are
evaluated
on a
technologies
are evaluated
on a
technologies
are
proactively
activities. qualitative basis. quantitative
basis.
pursued and
deployed.
3 E MANAGEMENTCONSULTANTS www.3emc.net 102
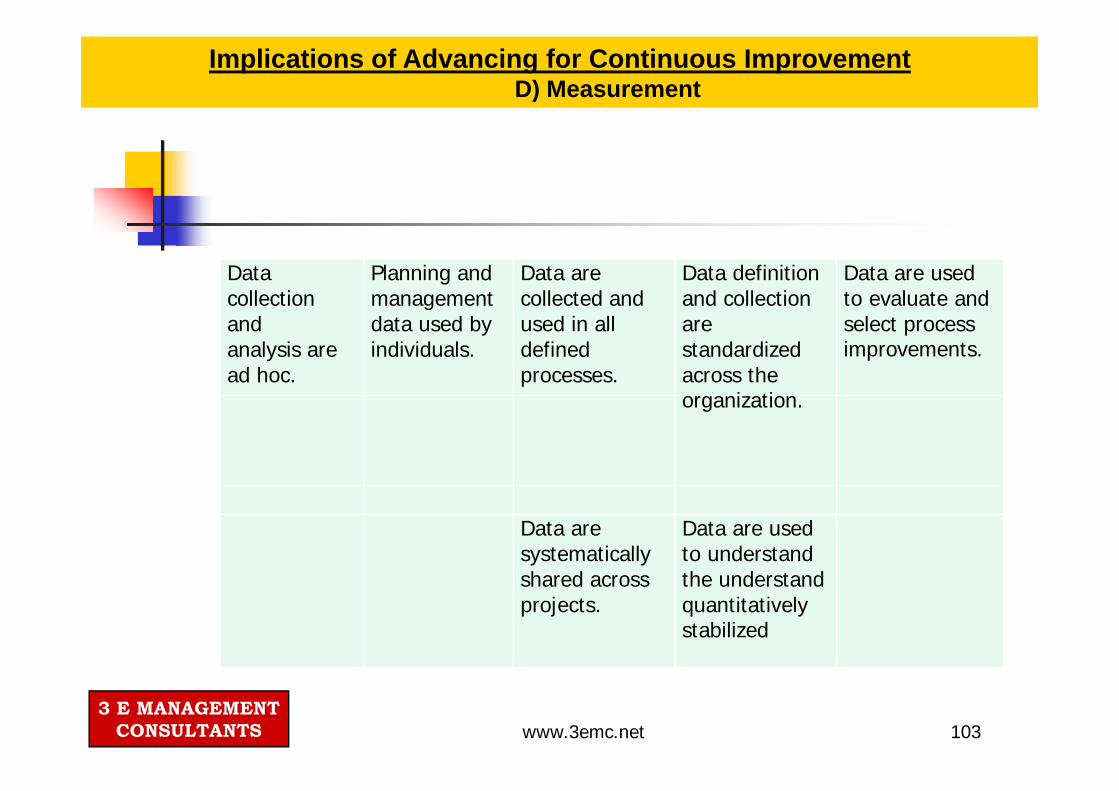
Implications of Advancing for Continuous ImprovementD) Measurement
Data collection
Planning andmanagement
Data arecollected and
Data definition and collection
Data are used to evaluate and co ect o
andanalysis aread hoc.
a age e tdata used byindividuals.
co ected a dused in alldefined processes.
a d co ect oare standardized across the o gani ation
to e a uate a dselect process improvements.
organization.
Data are systematicallyshared across
Data are used to understandthe understandshared across
projects.the understandquantitativelystabilized
3 E MANAGEMENTCONSULTANTS www.3emc.net 103
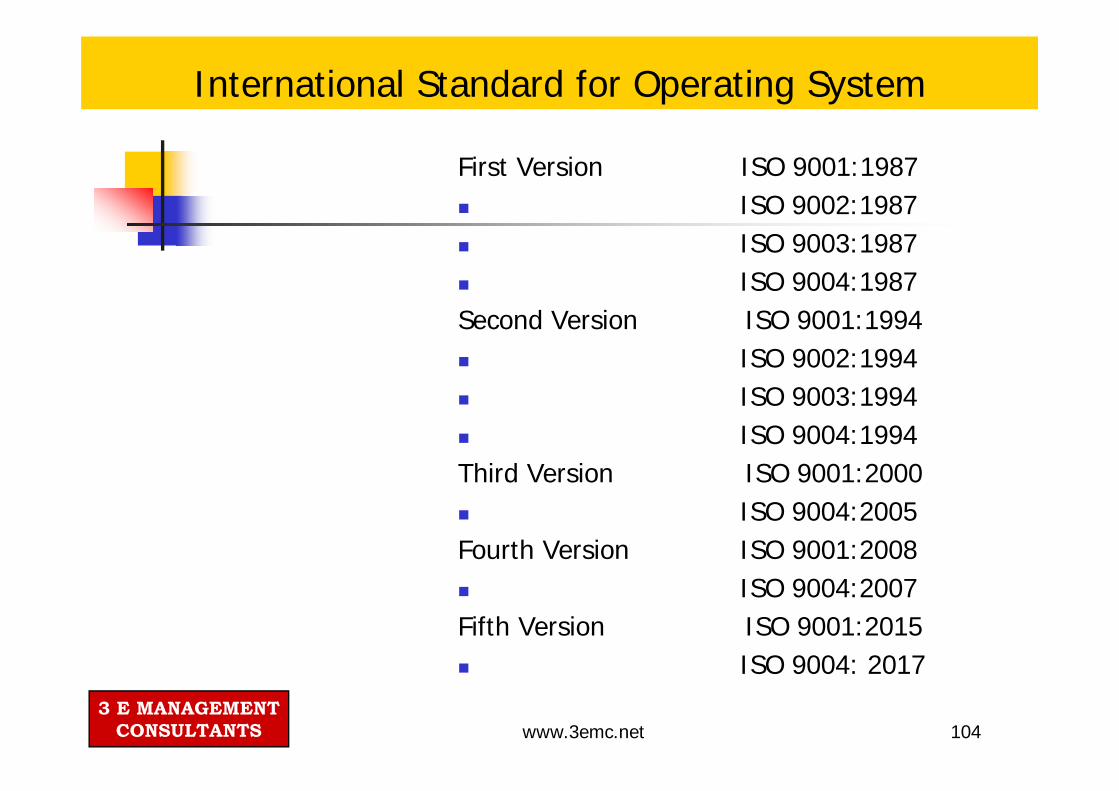
International Standard for Operating System
First Version ISO 9001:1987ISO 9002:1987ISO 9003:1987ISO 9004:1987
Second Version ISO 9001:1994ISO 9002:1994ISO 9003:1994ISO 9003:1994ISO 9004:1994
Third Version ISO 9001:2000ISO 9004:2005
Fourth Version ISO 9001:2008ISO 9004:2007
Fifth Version ISO 9001:2015ISO 9004: 2017
3 E MANAGEMENTCONSULTANTS
ISO 9004: 2017
www.3emc.net 104

Top 10 countries for ISO 9001 certificates (2010)[31]
Rank Country No. of certificates
1 China 297,037
2 Italy 138,892
3 Russian Federation 62,265
4 Spain 59,854
5 Japan 59,287
6 Germany 50,583
7 United Kingdom 44,849
8 India 33,250
9 United States 25,101
10 Korea, Republic of 24,778
3 E MANAGEMENTCONSULTANTS www.3emc.net 105

Session VII: Strategic Role of Technology-ERP
What is ERP?S it f i t t d li tiSuite of integrated applicationsAddresses most of functions in an OrganizationData redundancy – Enter onceData redundancy Enter onceBest of breed business practicesBuilt in controls
3 E MANAGEMENTCONSULTANTS

ERP Vs non ERP Solutions
Tier 1 / Tier 2 ERPs cover most SCM functionsI d S ifi SCM l iIndustry Specific SCM solutionsChoice depends on specificsMay start with ERP if no specific reasons forpoint solutionI t ti i dIntegrations required
3 E MANAGEMENTCONSULTANTS

What to look for
Supply SideSourcing, Procurement, Inbound Logistics
Warehousing, Inventory ManagementConversion (Manufacturing)Demand SideDemand Side
CRM, Sales, Outbound Logistics,Transportation managementp g
3 E MANAGEMENTCONSULTANTS

What to look for
Planning & SchedulingManufacturing SchedulingCapacity PlanningDistribution PlanningMRPMPS
3 E MANAGEMENTCONSULTANTS

TOP ERP Vendors
Top 101 SAP 6 Lawson2 Oracle 7 QADQ3 Microsoft 8 SAGE4 Infor 9 IFS5 Epicor 10 Consona Corp.
Top 100 Microsoft Excel Worksheet
3 E MANAGEMENTCONSULTANTS
Top 15 SCM Vendors
Following is report showing top 15 SCMli i d d fapplication vendors and features
provided
Adobe Acrobat Document
No wonder they are mostly top ERP vendorsNo wonder they are mostly top ERP vendorsCourtesy : Business-software.com
3 E MANAGEMENTCONSULTANTS
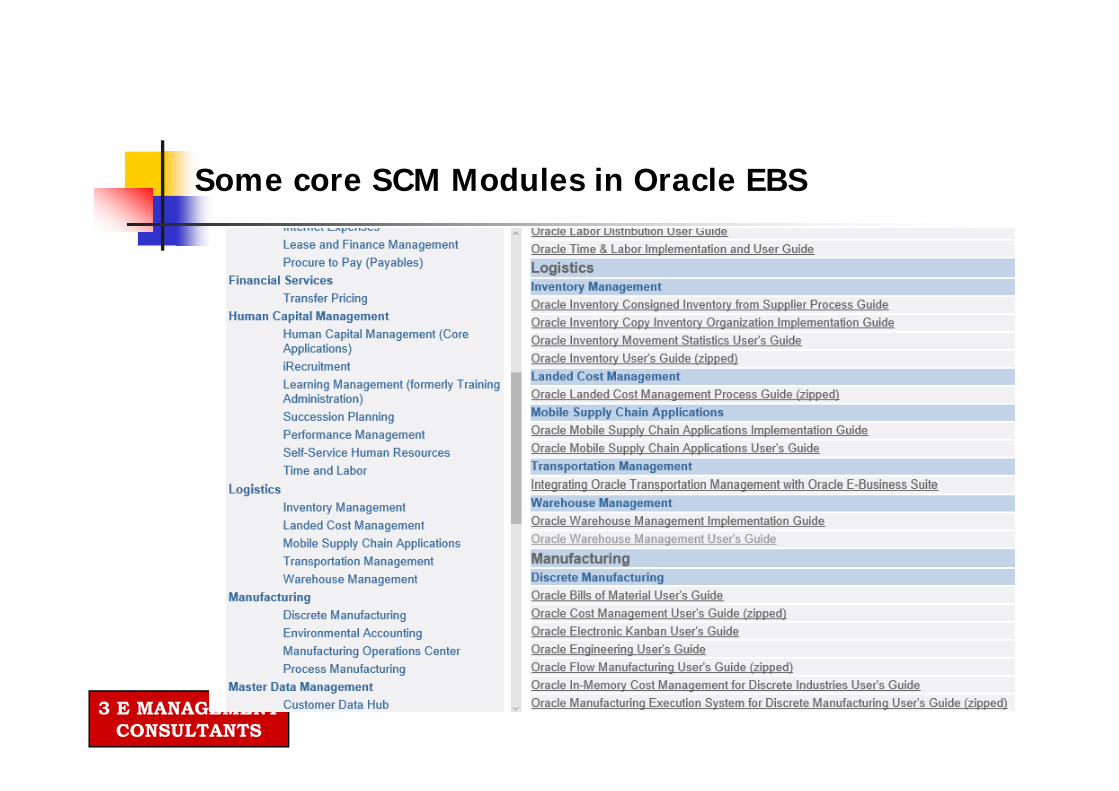
Some core SCM Modules in Oracle EBS
3 E MANAGEMENTCONSULTANTS

Some core SCM Modules in Oracle EBS
3 E MANAGEMENTCONSULTANTS
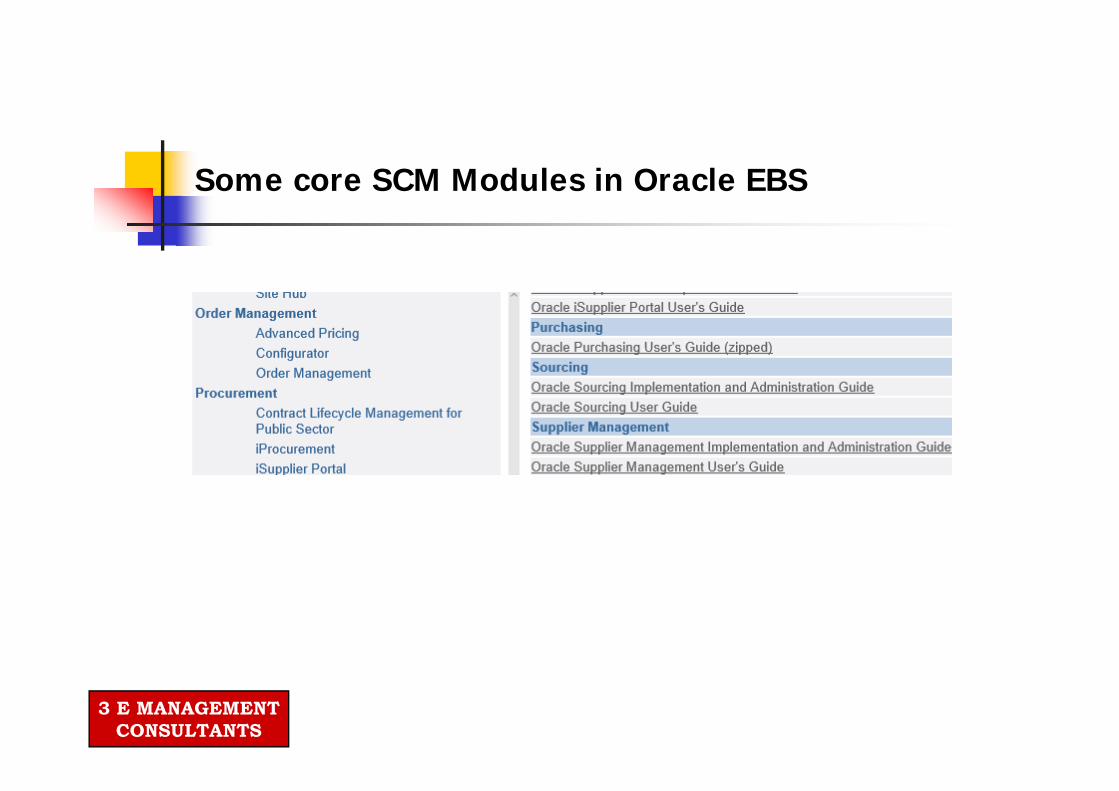
Some core SCM Modules in Oracle EBS
3 E MANAGEMENTCONSULTANTS

Some core SCM Modules in Oracle EBS
3 E MANAGEMENTCONSULTANTS
Sample Data Sheet of Oracle Inventory in EBS
This slide includes the datasheet of OracleInventory This briefly describes the moduleInventory. This briefly describes the modulefunctionalities.
Adobe Acrobat Document
3 E MANAGEMENTCONSULTANTS

On -Line Off the Session SupportQueries are invited atQueries are invited at
[email protected] www.3emc.netwww.3emc.net
3E MANAGEMENT CONSULTANTS SF-36 , ANSALS FORTUNE ARCADE
Sector 18 , Noida .Ph- 0120- 4320978
ThanksThanks for
participative session p p
3 E MANAGEMENTCONSULTANTS 117