Embed Size (px)
Citation preview
THE EFFECT OF OXYGEN-ENRICHED AIR ON THE PERFORMANCE AND
EXHAUST EMISSIONS OF INTERNAL COMBUSTION ENGINES
by
VARADARAJA SETTY, B.E.
A THESIS
IN
MECHANICAL ENGINEERING
Submitted to the Graduate Faculty of Texas Tech University in
Partial Fulfillment of the Requirements for
the Degree of
MASTER OF SCIENCE
IN
MECHANICAL ENGINEERING
Approved
Accepted
May, 1993

ACKNOWLEDGEMENTS
I am deeply indebted to my advisors Dr. Timothy T. Maxwell and Mr. Jesse
C. Jones for their superb technical advice, understanding, and patience in helping me
to solve \'arious problems during the course of this work. I am equally indebted to
Dr. Raghu Narayan for his support and active involvement in this project.
I would like to thank Mr. Don Boone whose selfless effort and past experience
helped me to expedite the completion of this work. I thank Mr. Patrick Nixon,
Mr.Christopher Boyce, and Mrs. Carmen Hernandez for their ideas and timely
assistance. I also thank Mr. Norman L. Jackson, Mr. Lloyd Lacy, and Mr. John P.
Bridge for their help during the experimental work.
I am highly grateful to my parents Mr. Narayan Setty and Mrs. Gangamma
Narayan Setty for their loving support and constant exhortation as well as other family
members who provided encouragement and prayer. Finally, I would like to thank my
roommates and friends for their help and support during this project.
11
TABLE OF CONTENTS
ACKNOWLEDGEMENTS
ABSTRACT
LIST OF TABLES
LIST OF FIGURES
CHAPTER
I. INTRODUCTION
The Future of Automobile
Factors Influencing the Formation of Exhaust Emissions
The Importance of Oxygen Enrichment
II.
ill.
IV.
LITERATURE SURVEY
OBJECTIVES
Project Objectives
Thesis Objectives
TEST EQUIPMENT
General Plan
Modified Test Engine
Fuel Injection System
The Injector
Injector Control Mechanism
Water Dynamometer
Air Flowmeter
111
11
v
Vl
Vlll
1
1
1
4
7
13
16
16
16
17
17
18
22
22
22
26
27
Mass Flowmeter for Compressed Natural Gas 27
Oxygen Sensor 30
Exhaust Gas Analyzer 32
Data Acquisition System 32
V. TEST PROCEDURE 33
Calibration 33
Preliminary Tests 39
Gasoline Tests 39
Compressed Natural Gas Tests 41
VI. TEST RESULTS 42
Brake-horsepower 42
Exhaust Gas Temperatures 46
Brake Specific Fuel Consumption and Fuel Conversion Efficiency 46
Volumetric Efficiency 57
Exhaust Emissions 60
Tests Results with Gas Separator 60
VII. CONCLUSIONS 71
Conclusions 71
Suggestions for Future Research 72
REFERENCES 73
APPENDIX
A. BASIC COMPUTATIONS 75
B. THEORETICAL AIR CALCULATION 77
IV
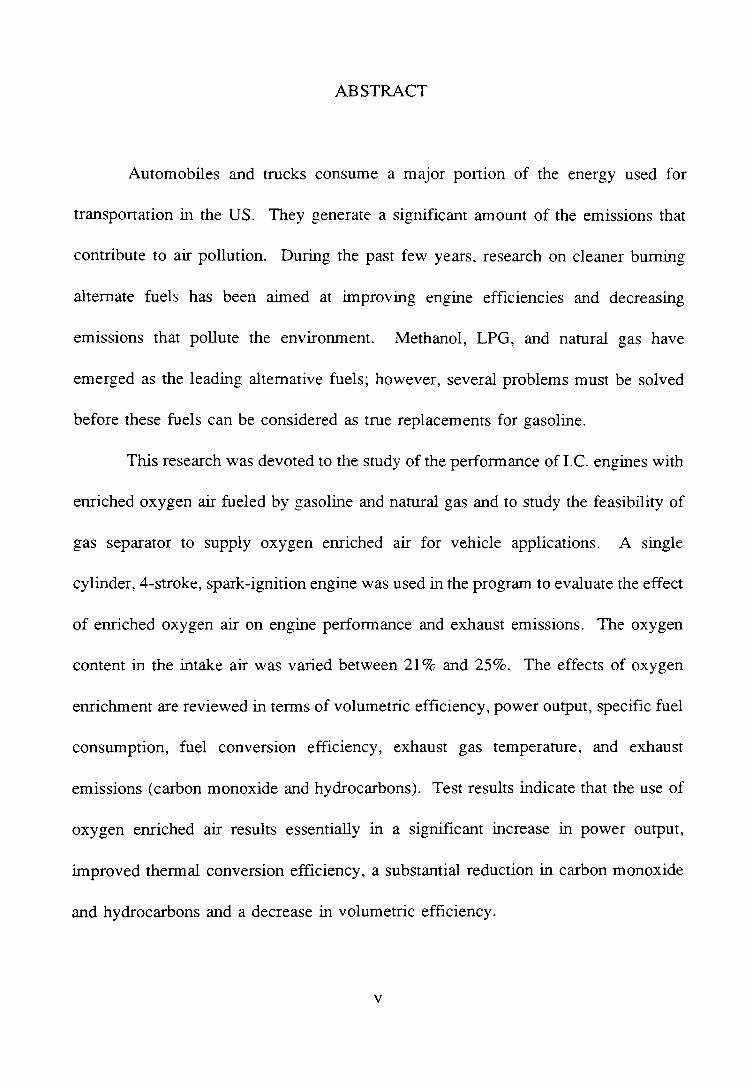
ABSTRACT
Automobiles and trucks consume a major portion of the energy used for
transportation in the US. They generate a significant amount of the emissions that
contribute to air pollution. During the past few years, research on cleaner burning
alternate fuels has been aimed at improving engine efficiencies and decreasing
emissions that pollute the environment. Methanol, LPG, and natural gas have
emerged as the leading alternative fuels; however, several problems must be solved
before these fuels can be considered as true replacements for gasoline.
This research was devoted to the study of the performance of I. C. engines with
enriched oxygen air fueled by gasoline and natural gas and to study the feasibility of
gas separator to supply oxygen enriched air for vehicle applications. A single
cylinder, 4-stroke, spark-ignition engine was used in the program to evaluate the effect
of enriched oxygen air on engine performance and exhaust emissions. The oxygen
content in the intake air was varied between 21% and 25%. The effects of oxygen
enrichment are reviewed in terms of volumetric efficiency, power output, specific fuel
consumption, fuel conversion efficiency, exhaust gas temperature, and exhaust
emissions (carbon monoxide and hydrocarbons). Test results indicate that the use of
oxygen enriched air results essentially in a significant increase in power output,
improved thermal conversion efficiency, a substantial reduction in carbon monoxide
and hydrocarbons and a decrease in volumetric efficiency.
v
LIST OF TABLES
1.1 Total Annual U.S. Emissions from Artificial Sources 2
1.2 Total Exhaust Emissions per kg. Fuel Burned in S.I. Engines 2
1..3 Hydrocarbon Composition of S.I. Engine Exhaust, Percent of Total HC 9
.f.1 Test Engine Specification 20
5.1 Test Conditions 40
6.1 Percentage Increase in Power with Oxygen Enrichment for Gasoline 45
6.2 Percentage Increase in Power with Oxygen Enrichment for CNG 45
6 . .3 Increase in Exhaust Temperatures with Oxygen Enrichment 49 for Gasoline
6.4 Increase in Exhaust Temperature with Oxygen Enrichment for CNG 49
6.5 Brake Specific Fuel Consumption with Oxygen Enrichment for Gasoline 56
6.6 Brake Specific Fuel Consumption with Oxygen Enrichment For CNG 56
6.7 Percentage Reduction in CO with Oxygen Enrichment for Gasoline 65
6.8 Percentage Reduction in HC with Oxygen Enrichment for Gasoline 65
6.9 Percentage Reduction in CO with Oxygen Enrichment for CNG 66
6.10 Percentage Reduction in HC with Oxygen Enrichment for CNG 66
6.11 Power Output with 0 2 Enriched Air Supplied by Separator for Gasoline 68
Vl
6.12 Power output with 0 2 Enriched Air Supplied by Separator for CNG 68
6.13 Reduction in CO with 0 2 Enriched Air Supplied by Separator 69 for Gasoline
6.1-+ Reduction in HC with 0 2 Enriched Air Supplied by Separator for Gasoline 69
6.15 Reduction in CO with 0 2 Enriched Air Supplied by Separator for CNG 70
6.16 Reduction in HC with 0 2 Enriched Air Supplied by Separator for CNG 70
Vll
LIST OF FIGURES
1.1. Summary of HC, CO, and NO Pollutant Formation Mechanism in a Spark -Ignition Engines 3
1.2. Schematic of Complete SI Engine HC Formation and Oxidation Mechanism within the Cylinder and Exhaust System 8
1.3. Schematic Drawing of a Membrane Gas Separator 12
4.1. Overall Experimental Set-up 19
4.2. Sectional View of an Injector 23
4.3. Fuel Injection and Control Mechanism For Gasoline 24
4.4. Fuel Injection and Control Mechanism for CNG 25
4.5. Sectional View of the Typical Water Dynamometer 28
4.6. The General Construction of Laminar Flowmeter 29
4.7. A Cross-Section Drawing of an Oxygen Sensor 31
5.1. Calibration Curve for Water Dynamometer 34
5.2. Calibration Curve For an Air Flowmeter 35
5.3. Calibration Curve for GM Map Sensor 36
5.4. Calibration Curve for Honda Gasoline Injector 37
5.5. Calibration Curve for Servojet Injector 38
6.1. Engine Speed versus Power Output for Gasoline 41
6.2. Engine Speed versus Power Output for CNG 44
6.3. Engine Speed versus Exhaust Temperature For Gasoline 47
6.4. Engine Speed versus Exhaust Temperature For CNG 48
Vlll
6.5. Engine Speed versus Fuel Consumption In Lb/hr for Gasoline 50
6.6. Engine Speed versus Fuel Consumption In Lb/hr for CNG 51
6.7. Engine Speed versus BSFC for Gasoline 52
6.8. Engine Speed versus BSFC for CNG 53
6.9. Engine Speed versus Thermal Conversion Efficiency for Gasoline 54
6.10. Engine Speed versus Thermal Conversion Efficiency for CNG 55
6.11. Engine Speed versus Volumetric Efficiency for Gasoline 58
6.12. Engine Speed versus Volumetric Efficiency for CNG 59
6.13. Engine Speed versus Percentage of CO for Gasoline 61
6.14. Engine Speed versus Percentage of CO for CNG 62
6.15. Engine Speed versus Percentage of HC for Gasoline 63
6.16. Engine Speed versus Percentage of HC for CNG 64
IX
CHAPTER I
INTRODUCTION
The Future of the Automobile
The future of the automobile, which accounts for over half of all energy[1]
used for transportation in developed countries, is of great concern since automobiles
generate a significant amount of the emissions that contribute to air pollution. During
the last ten years significant changes have occurred in automobile design due to
energy and air pollution concerns. The result of these changes has been a move to
lighter, cleaner fuel burning cars with improved aerodynamics, and smaller and more
fuel efficient engines that provide higher specific output. Studies continue to be
aimed at improving engine efficiencies and decreasing vehicle emissions.
The principal vehicle exhaust gas pollutants are hydrocarbons (HC), carbon
monoxide (CO), and oxides of nitrogen (NOx), which contribute to the formation of
smog as well as to acid rain. Although auto tailpipe emissions have decreased by
approximately 95% in CO and HC, and 60-70% in NOx since 1970, total vehicle
emissions have increased because of an increase in the number of vehicles on the road
and, the number of miles driven. The future of the automotive industry depends
heavily on the satisfactory reduction of exhaust emissions. Table 1.1 [2] gives the
total percentage of annual US emissions from transportation and highway vehicles.
1
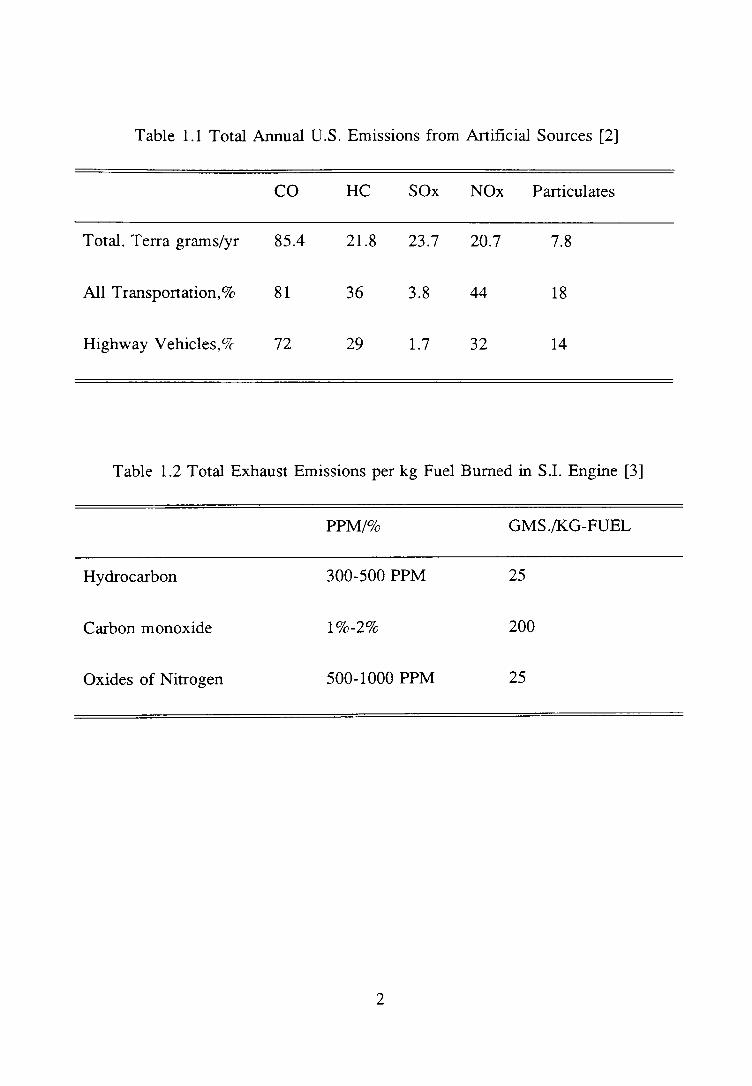
Table 1.1 Total Annual U.S. Emissions from Artificial Sources [2]
co HC SOx NOx Particulates
Total. Terra grams/yr 85.4 21.8 23.7 20.7 7.8
All Transportation,% 81 36 3.8 44 18
Highway Vehicles, o/c 72 29 1.7 32 14
Table 1.2 Total Exhaust Emissions per kg Fuel Burned in S.I. Engine [3]
PPM/%
Hydrocarbon 300-500 PPM
Carbon monoxide 1%-2%
Oxides of Nitrogen 500-1000 PPM
2
GMS./KG-FUEL
25
200
25
Oil layers absor C
(a) Compression
As burned gases cool, flrst NO chemistry, then CO chemistry freezes
(c) Expansion
wall into bulk gas
tflow of HC from crevices; some HC burns
CO present at high temperature and if fuel · h
A arne
(b) Combustion
(d) Exhaust
source of HC if combustion incomplete
Piston scrapes HC off walls
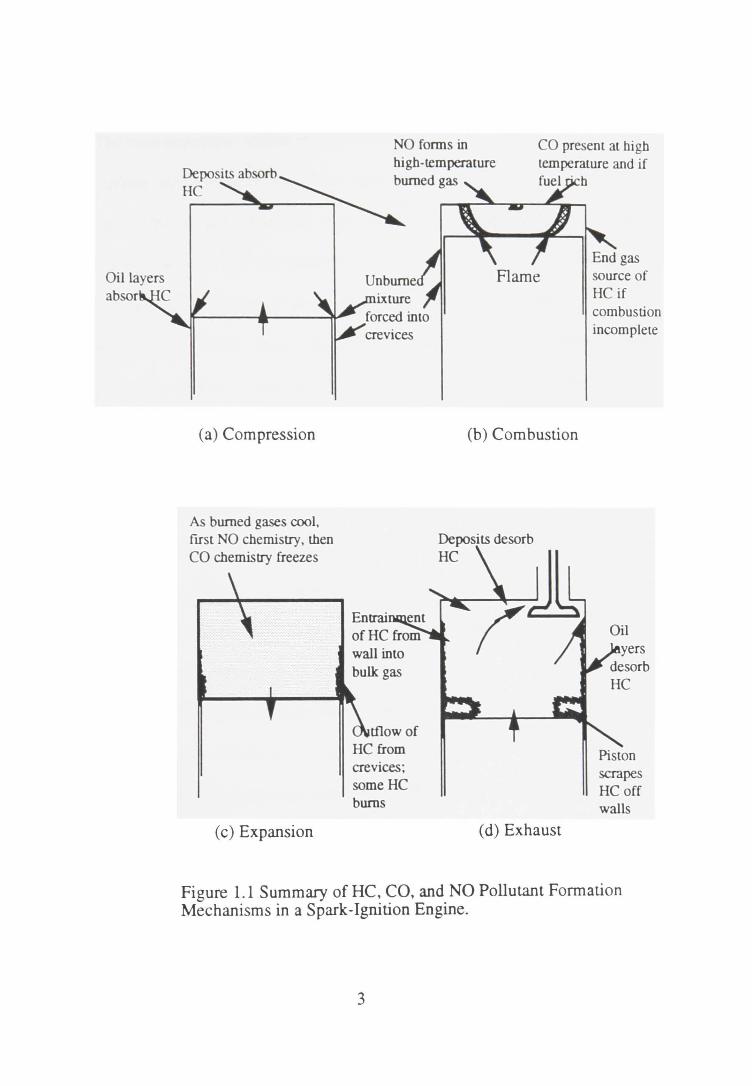
Figure 1.1 Summary of HC, CO, and NO Pollutant Formation Mechanisms in a Spark-Ignition Engine.
3
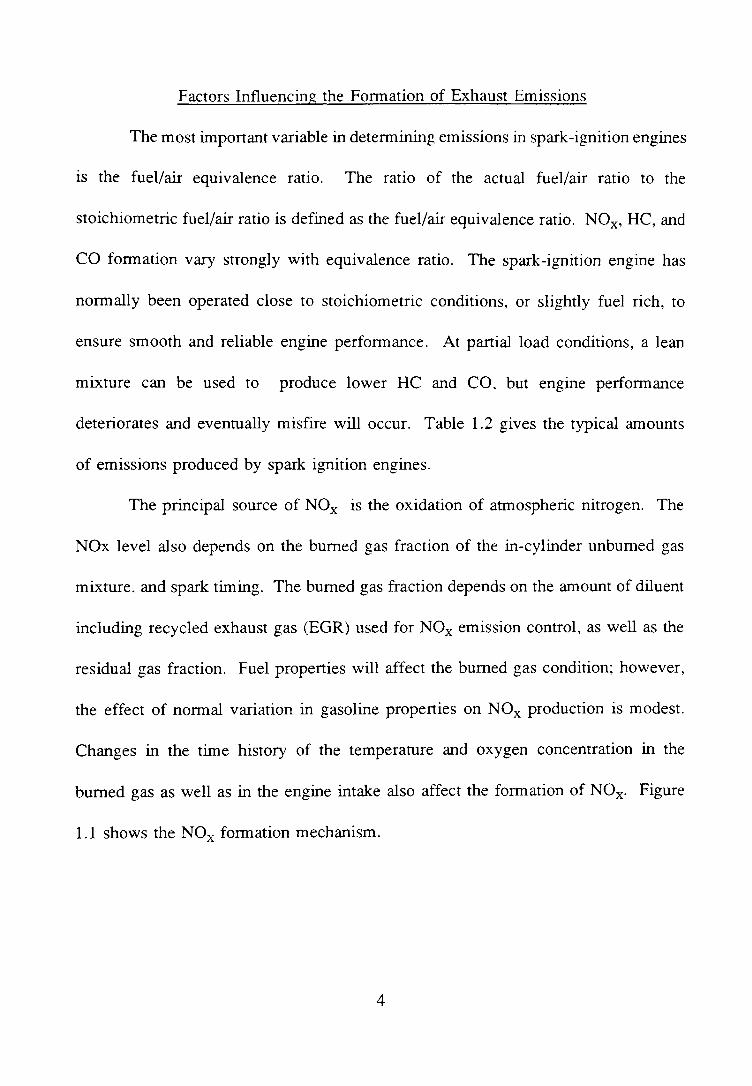
Factors Influencing the Formation of Exhaust Emissions
The most important variable in determining emissions in spark-ignition engines
IS the fuel/air equivalence ratio. The ratio of the actual fuel/air ratio to the
stoichiometric fuel/air ratio is defined as the fuel/air equivalence ratio. NOx, HC, and
CO formation vary strongly with equivalence ratio. The spark-ignition engine has
normally been operated close to stoichiometric conditions, or slightly fuel rich, to
ensure smooth and reliable engine performance. At partial load conditions, a lean
mixture can be used to produce lower HC and CO, but engine performance
deteriorates and eventually misfire will occur. Table 1.2 gives the typical amounts
of emissions produced by spark ignition engines.
The principal source of NOx is the oxidation of atmospheric nitrogen. The
NOx level also depends on the burned gas fraction of the in-cylinder unburned gas
mixture. and spark timing. The burned gas fraction depends on the amount of diluent
including recycled exhaust gas (EGR) used for NOx emission control, as well as the
residual gas fraction. Fuel properties will affect the burned gas condition; however,
the effect of normal variation in gasoline properties on NOx production is modest.
Changes in the time history of the temperature and oxygen concentration in the
burned gas as well as in the engine intake also affect the formation of NOx. Figure
1.1 shows the NOx formation mechanism.
4
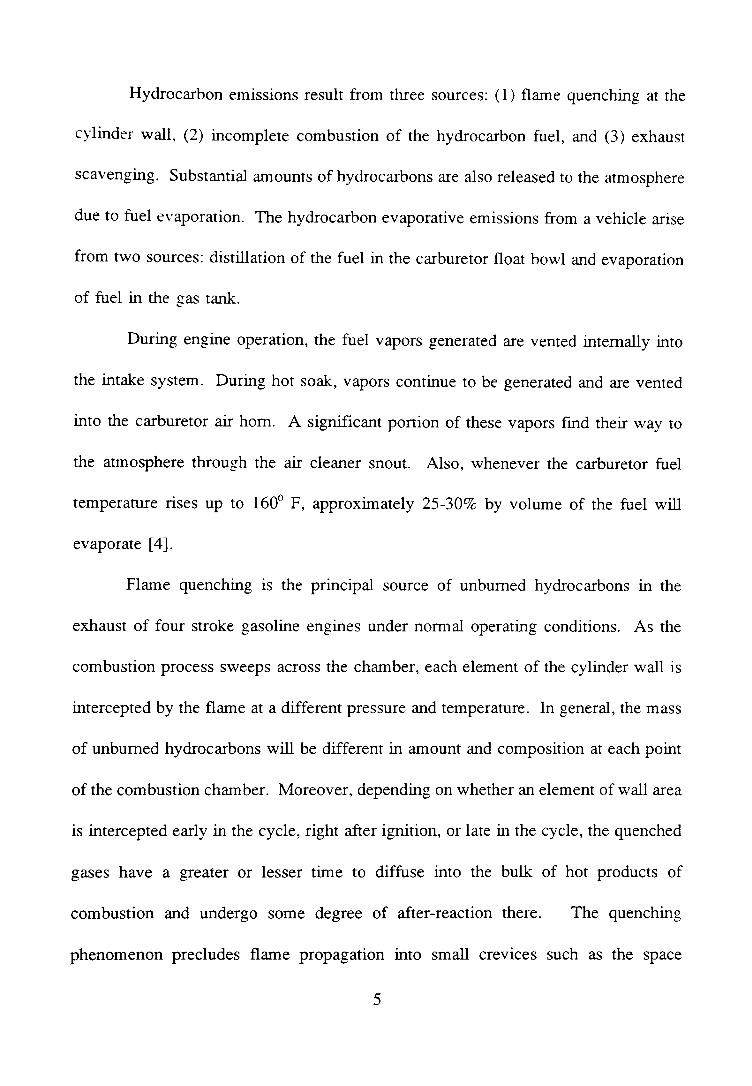
Hydrocarbon emissions result from three sources: ( 1) flame quenching at the
cylinder wall, (2) incomplete combustion of the hydrocarbon fuel, and (3) exhaust
scavenging. Substantial amounts of hydrocarbons are also released to the atmosphere
due to fuel evaporation. The hydrocarbon evaporative emissions from a vehicle arise
from two sources: distillation of the fuel in the carburetor float bowl and evaporation
of fuel in the gas tank.
During engine operation, the fuel vapors generated are vented internally into
the intake system. During hot soak, vapors continue to be generated and are vented
into the carburetor air hom. A significant portion of these vapors fmd their way to
the atmosphere through the air cleaner snout. Also, whenever the carburetor fuel
temperature rises up to 160° F, approximately 25-30% by volume of the fuel will
evaporate [ 4].
Flame quenching is the principal source of unburned hydrocarbons in the
exhaust of four stroke gasoline engines under normal operating conditions. As the
combustion process sweeps across the chamber, each element of the cylinder wall is
intercepted by the flame at a different pressure and temperature. In general, the mass
of unburned hydrocarbons will be different in amount and composition at each point
of the combustion chamber. Moreover, depending on whether an element of wall area
is intercepted early in the cycle, right after ignition, or late in the cycle, the quenched
gases have a greater or lesser time to diffuse into the bulk of hot products of
combustion and undergo some degree of after-reaction there. The quenching
phenomenon precludes flame propagation into small crevices such as the space
5
between the uppermost piston ring and the top of the piston, the region around the
spark plug ceramic, and crevices left by imperfectly fitted head gaskets. This
unburned fuel in these crevices will be swept by the piston during the exhaust stroke
and will contribute to exhaust emissions level.
Incomplete combustion is the second major cause of hydrocarbon formation.
Under engine operating conditions where mixtures are extremely rich or lean, or
where exhaust gas dilution is excessive, incomplete flame propagation may occur in
some cycle. During transient engine operation, especially during warm-up and
deceleration, it is possible that mixtures which are too rich or too lean to burn
completely may fmd their way into the cylinder. When incomplete flame propagation
occurs, the resulting hydrocarbon emissions will be very high.
Factors which promote incomplete flame propagation and misfires include:
1. Poor condition of the ignition system,
2. Low charge temperature,
3. Gaseous air/fuel ratio in the cylinder at and postignition,
is too rich or too lean,
4. Poor charge homogeneity, and
5. Large exhaust residual quantity.
In two-stroke gasoline engines, a third source of hydrocarbon emission comes
from scavenging the cylinder with the air/fuel mixture, part of which blows through
the cylinder directly into the exhaust and escapes the combustion process completely.
Hydrocarbon emissions from this type of engine may be several times larger than
6
those from naturally aspirated 4-stroke engmes. Supercharged 4-stroke gasoline
engines may have some hydrocarbon emissions from this source also.
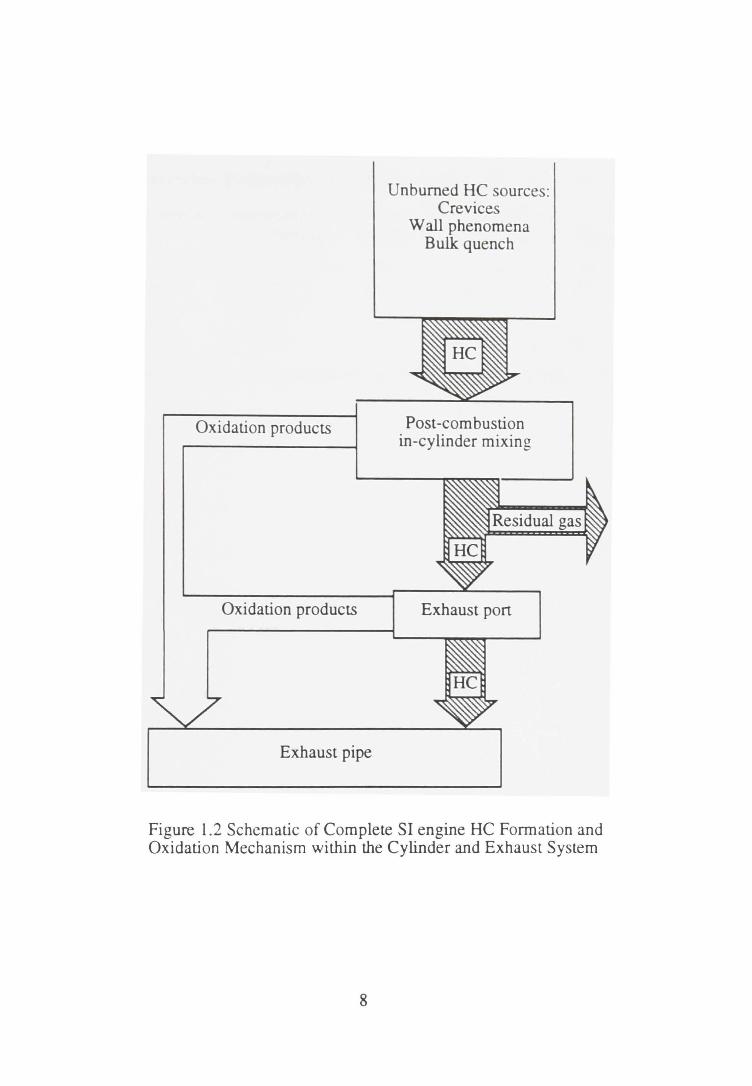
Total hydrocarbon emission level is a useful measure of combustion
inefficiency. but it is not necessarily a significant index of pollutant emission. Table
1.3 [5] shows the average hydrocarbon composition of spark-ignition engine exhaust.
The presence of oxygen influences the oxidation of HC; the higher the percentage of
oxygen the better the oxidation. Figure 1.2 [5] shows the HC formation and oxidation
mechanism within the cylinder and exhaust system.
Carbon monoxide is an intermediate product of the combustion of hydrocarbon
fuels. Hence incomplete oxidation results in an increase in CO. When the mixture
is richer than chemically correct, substantial amounts of CO appear in the exhaust.
It is found that a change of only a small change in equivalence ratio leads to change
upto 1% in exhaust C0[4]. Figure 1.1 shows the mechanism of CO formation.
The Importance of Oxygen Enrichment
It is very important that the contribution of vehicle exhaust emissions to the
atmosphere be reduced. There are three possible ways of doing this: ( 1) by reducing
gasoline consumption (2) by using of alternate fuels such as methanol, ethanoL natural
gas, or LPG, and (3) by enriching the intake air with oxygen.
It would be difficult to reduce or eliminate gasoline consumption because of
its advantages over alternate fuels, such as simplicity in handling, storing.and ease of
transportation. Other problems associated with the use of alternate fuel rather than
7
Oxidation products
Oxidation products
Exhaust pipe
Unburned HC sources: Crevices
Wall phenomena Bulk quench
Post -combustion in-cylinder mixing
Exhaust port
Figure 1.2 Schematic of Complete SI engine HC Formation and Oxidation Mechanism within the Cylinder and Exhaust System
8
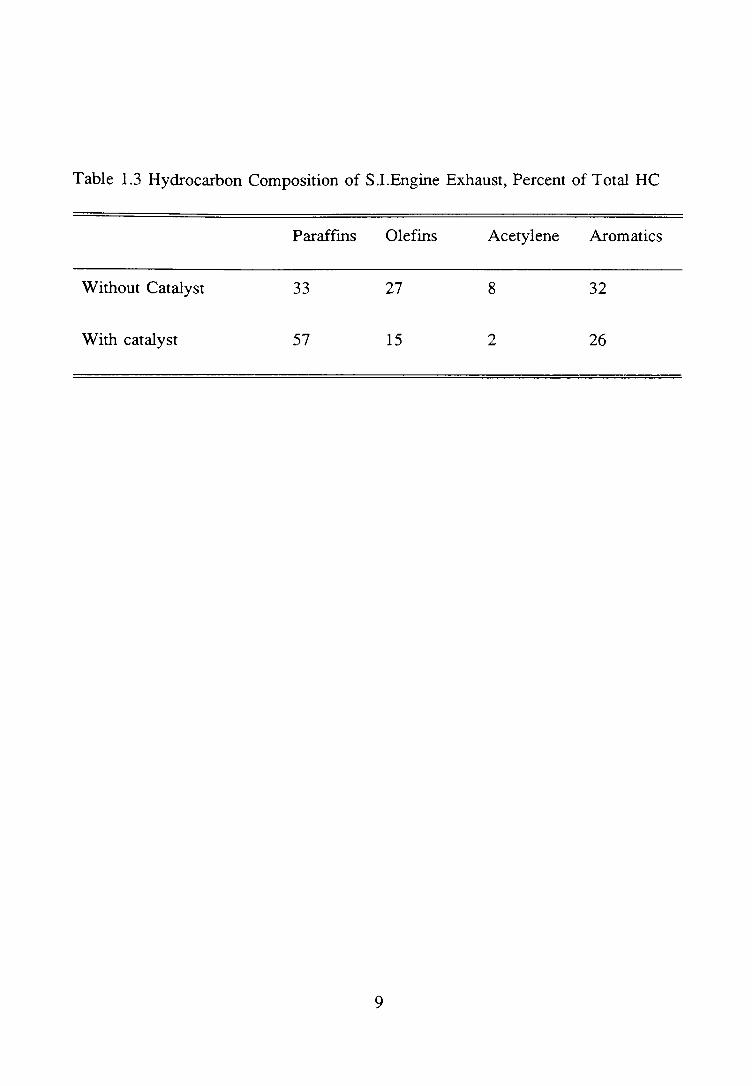
Table 1.3 Hydrocarbon Composition of S.I.Engine Exhaust, Percent of Total HC
Without Catalyst
With catalyst
Paraffms
33
57
9
Ole fins
27
15
Acetylene
8
2
Aromatics
32
26
gasoline are ( 1) some materials used in gasoline distribution systems are not
compatible with alternate fuels, and (:2) present production facilities for alternate fuels
cannot meet a significantly increased demand. Although the use of alternate fuels can
be cost effective and generate comparatively less exhaust emissions, the problem of
meeting ultra-low emissions is not solved completely.
Exhaust emissions, such as HC and CO can be reduced further by usmg
enriched oxygen in the intake air of the engine. Theoretically, oxygen enrichment
should have two major effects on combustion: (1) increase flame temperature, and (2)
increase flame propagation velocity. These effects should increase power output,
reduce the formation of HC and CO, and increase the formation of NOx. The
increase in power output and reduction in HC and CO can be attributed to a higher
combustion rate, whereas an increase in NOx formation is due to the combined effect
of higher combustion temperature and higher oxygen fraction.
The practical viability of oxygen enrichment for internal combustion engines
depends on the availability of a simple compact mechanical system driven by the
engine itself. Apart from the traditional cryogenic method of extracting oxygen, there
are three different methods for non-cryogenic separation of oxygen from atmospheric
arr:
1. Membrane diffusion,
2. Molecular sieves, and
3. Oxygen absorption techniques.
10
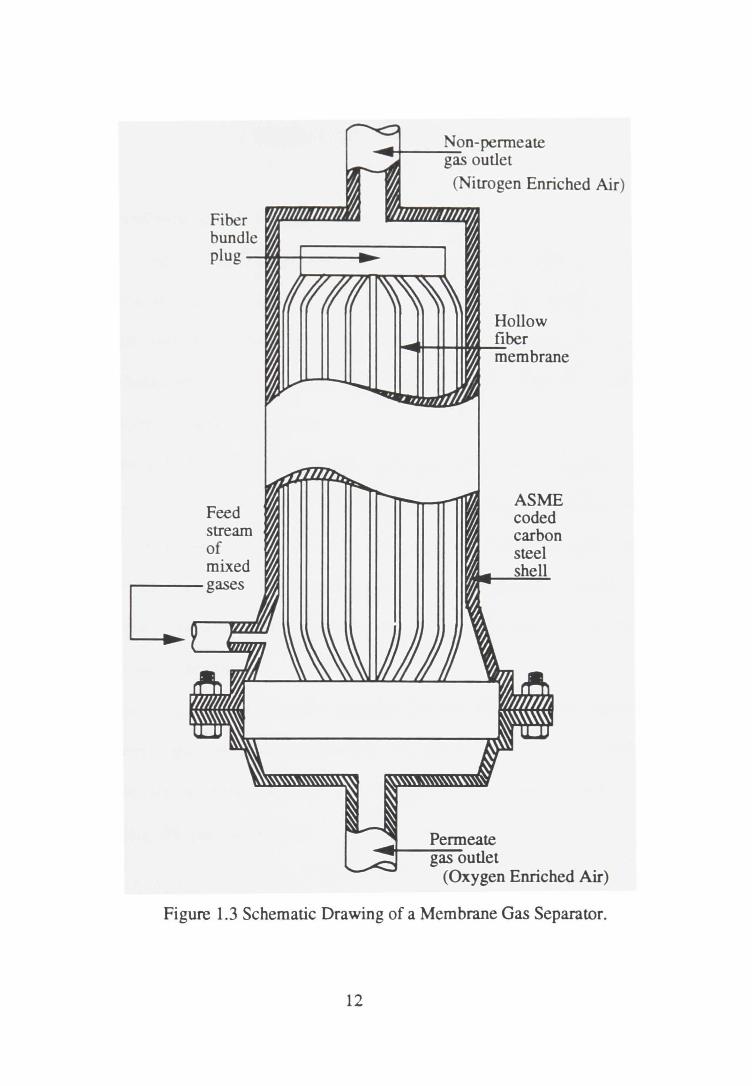
Figure 1.3 [6] shows the principle of operation of a membrane polymeric gas
separator. One example of this consists of minute hollow fiber tubes made up in
bundles and encapsulated in a high pressure steel shell. The bundles contain
thousands of fiber tubes which are sealed at one end and encased in an epoxy tube
sheet at the other. Recent developments in membrane separation technology have
enabled to the development of more sophisticated membrane gas separator designs
that result in high performance efficiencies. The feed stream (air) flows either
through the inside or outside of the hollow fibers at some suitable pressure Ph. The
opposite side of the fiber is maintained at some lower pressure, P1• A fraction of the
feed, known as the "stage cut", is allowed to permeate through the membrane to the
low pressure side. The feed stream is thereby separated into two streams: (a) an
oxygen enriched air stream, and (b) an unpermeated (nitrogen enriched air) stream.
The magnitude of the stage cut will depend on the feed flow rate. the membrane area,
and the pressure ratio r=PJP1•
Such a membrane gas separator is considered to be a potential system for
supplying oxygen enriched air for internal combustion engines because of the
simplicity of the separation as well as being energy-efficient. In essence the required
process equipment is simple, compact, and relatively easy to operate and control.
11
Fiber bundle plug
Feed stream of mixed
Non-permeate ~+----gas outlet
(Nitrogen Enriched Air)
Hollow fiber
~lt-t+-+tMt-....;m~em brane
Permeate gas outlet
(Oxygen Enriched Air)
Figure 1.3 Schematic Drawing of a Membrane Gas Separator.
12
CHAPTER II
LITERATURE SURVEY
Several projects have been initiated in the last forty-five years by a number of
automobile companies and educational institutions to study the effect of oxygen
enrichment for automotive applications. Both liquid fuels (gasoline and diesel) and
gaseous fuels (natural gas) have been studied, but on a very limited scale. These
projects include those initiated by the aviation industry using oxygen for power
boosting during the second world war.
Karim and Ward [7] studied the effect of the partial pressure of oxygen in the
intake charge of D.I. diesel engines. Reductions in smoke and ignition delay were
observed by enriching the intake air of the engine with up to 50% oxygen. The
cylinder pressure was observed to increase with oxygen concentration, while the rate
of pressure rise reaching a maximum at about 38% oxygen and tended to level out at
much higher concentrations.
Kodata et al. [8] investigated the formation of a fuel droplet in a high pressure
gaseous environment simulating the condition existing in the cylinder of a diesel
engme. The results showed that the mass of soot formed varied with oxygen
concentration in the gaseous mixture.
13
It was observed that there was no soot formed at oxygen concentrations lower
than about 6CJc in N 2-02 mixtures and from this point increasing the oxygen
concentration caused the soot to increase to a maximum value. The oxygen
concentration at the maximum value was about 17(;(. After passing the maximum
value, soot decreases with further increases in the oxygen concentration.
Tsunemoto and Ishitani [9] studied the effect of intake dilution with EGR in
DI and turbocharged diesel engines. Their results indicated that decreasing oxygen
concentration with EGR led to a reduction of NOx and BMEP and to an increase in
smoke.
Plee et al. [10] carried out experiments involving both enrichment and dilution
of the charge in DI diesel engines operating at different loads and speeds. Smoke and
CO were found to increase with N 2 addition and decrease with 0 2 addition, whereas
NOx exhibited opposite trends.
Yu and Shahed [11] investigated the effect of intake charge oxygen
concentration using different diluents (EGR, C02 and N2). Their results showed that
dilution is effective in reducing NOx emissions at the expense of increasing smoke.
Carbon dioxide proved to be most effective in reducing NOx emissions, followed by
EGR and nitrogen, respectively.
Research carried out by Quader and \Vartinbee [12] at the General Motors
Research Laboratories revealed that adding oxygen to the intake up to 32% by volume
increased NOx emissions, decreased HC and CO emissions, decreased volumetric
efficiency, decreased combustion duration, and permitted leaner engine operation. A
14
specially modified single-cylinder CFR engine and exhaust analysis apparatus were
used in their study. Oxygen from a high pressure cylinder was added to the intake
air in a surge tank located ahead of the intake valve. Commercially available 99.5%
pure oxygen was used.
Similarly, several research projects have been conducted using natural gas as
fuel. B. Detancq and J. Williams [13] have studied the effect of oxygen enrichment
in the intake of an engine fueled by natural gas at Ecole Polytechnic de Montreal. A
single-cylinder Ricardo E6.T engine was used for this study. An electric
dynamometer was used for torque measurement. Oxygen and natural gas were
supplied to the engine from a high pressure cylinder and the local utilities pipeline
respectively. The mixing box for oxygen and air fed a homogeneous mixture to the
natural gas carburetion unit. Natural gas at 15 psig was expanded through two
pressure regulators down to ambient pressure upstream of the mixing unit. The results
indicated that oxygen enrichment could be used to increase the power output of SI
engines fueled by natural gas to levels equal to, or higher to the output achieved by
air/gasoline mixture.
15
CHAPTER III
OBJECTIVES
Project Objectives
The overall objective of this research was to determine the performance and
emissions of internal combustion engines fueled by gasoline and natural gas when
operating at various levels of oxygen enriched intake air. The effect of oxygen
enriched operation on gaseous emissions such as carbon monoxide and hydrocarbons
was of particular interest as well as perlormance increases that offset the loss due to
the introduction of natural gas in intake manifold.
Thesis Objectives
The objectives of this thesis are:
1. to build the required experimental setup. make the necessary engme
modifications, and investigate the advantages and disadvantages of oxygen enriched
air on the perlormance of I. C. engines; and
2. to examine the feasibility of gas separator to supply oxygen-enriched air for
vehicle applications.
16
CHAPTER IV
TEST EQUIPMENT
General Plan
In the early stages of the project planning, the following equipment was
identified as being required to set up the experiment:
1. A test engine that was a good representation of present day internal
combustion engine technology that could be used conveniently for the test with
minimum modification;
2. A dynamometer to measure the torque developed by the engine;
3. An efficient exhaust gas analyzer to measure the exhaust em1sswns;
accurately;
4. Injectors to inject gasoline and compressed natural gas;
5. An electronic control mechanism to control the timing and duration of the
fuel injection;
6. A fuel system to store and to transfer gasoline (25 - 30 psi) and natural gas
(60 - 150 psi);
7. An efficient data acquisition system to record all important experimental
data;
8. An oxygen sensor and feed back system to maintain a correct air/fuel ratio:
9. An engine cooling system;
10. A flow meter to measure the air flowrate to the engine; and
17
11. A Hall effect sensor (magnetic pickup) to monitor exhaust valve closing
to time the fuel injection.
The engine had to be modified to accommodate the fuel injector, the Hall effect
device, thermocouples (K-type), and pressure sensors to measure the inlet and
manifold pressures.
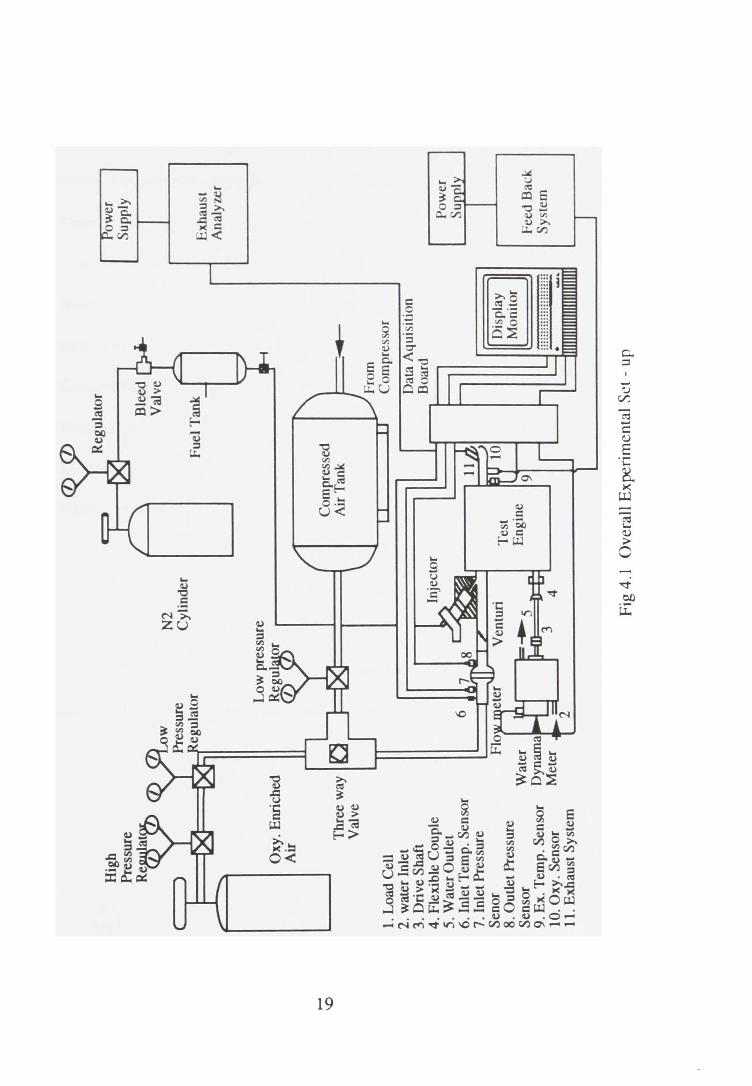
The complete experimental setup used is shown in Figure 4.1. To reduce
complexity and modification time, it was decided that a single-cylinder engine would
be used. A four-stroke, two-valve, air cooled, spark ignition, 250cc, Honda engine,
which was available in the engine laboratory, was used in this research. A list of
general specifications for this engine are given in Table 3.1.
Modified Test Engine
The engine was modified to inject the fuel as close as possible to the engine
inlet port. Originally, this engine was carbureted. The carburetor was removed, and
a new manifold system was fabricated. An adapter was fabricated and attached to the
intake manifold using a J.B. weld. A hole was drilled in the adapter at a 45 degree
angle and the injector was installed in this hole to inject the fuel close to the engine
inlet port. A butterfly valve was installed in the manifold upstream of the injector.
Fuel injected at the time of exhaust valve closing. A hole was drilled in the exhaust
side of the engine head and a magnetic pickup (Hall effect sensor) was installed just
above the exhaust valve. A magnetic strip was placed on the top of the exhaust valve
stem to allow the magnetic pickup to sense the closing of the exhaust valve.
18
,_.
\.0
Oxy
. E
nric
hed
Air
1. L
oad
Cel
l 2.
wat
er I
nlet
3.
Dri
ve S
haft
Thr
ee w
ay
Val
ve
4. F
lexi
ble
Cou
ple
5. W
ater
Out
let
6. I
nlet
Tem
p. S
enso
r 7.
Inl
et P
ress
ure
Sen
or
8. O
utle
t Pre
ssur
e S
enso
r 9.
Ex.
Tem
p. S
enso
r 10
. Oxy
. S
enso
r 11
. Exh
aust
Sys
tem
N2
Cyl
inde
r
Com
pres
sed
Air
Tan
k
Tes
t E
ngin
e
:4
--
Fro
m
Com
pres
sor
Dat
a A
quis
itio
n B
oard
Dis
play
M
onit
or
Fig
4.1
O
vera
ll E
xper
imen
tal S
d-
up
Exh
aust
A
naly
zer
Fee
d B
ack
Sys
tem
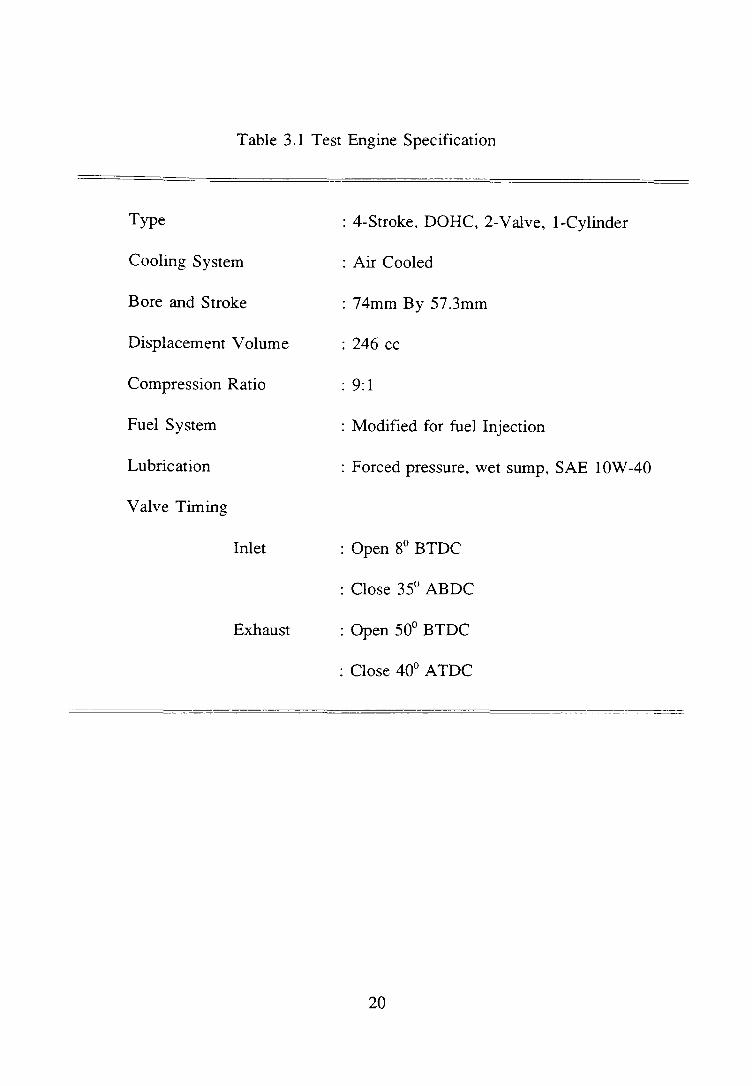
Table 3.1 Test Engine Specification
Type
Cooling System
Bore and Stroke
Displacement Volume
Compression Ratio
Fuel System
Lubrication
Valve Timing
: 4-Stroke, DOHC, 2-Valve, !-Cylinder
:Air Cooled
: 74mm By 57.3mm
: 246 cc
: 9:1
: Modified for fuel Injection
: Forced pressure, wet sump, SAE 1 OW -40
Inlet : Open 8° BTDC
Exhaust
: Close 35° ABDC
: Open 50° BTDC
: Close 40° ATDC
20
Measurement of exhaust temperature, emissions, and oxygen in the exhaust
was necessary. The measurement of the oxygen level in the exhaust was necessary
to maintain an accurate air/fuel ratio. A thermocouple was placed in the exhaust duct
close to the exhaust port. An oxygen sensor and gas analyzer probes were placed in
the exhaust duct downstream of the thermocouple. The tip of the gas analyzer probe
was positioned to face the exhaust emissions flow.
The air flow rate into the engine was measured to calculate volumetric
efficiencv. Inlet pressure. manifold pressure, and inlet temperature were also
recorded. A Meriam air flow meter was installed at the inlet of the engine to measure
the air flowrate. GM MAP (Manifold Absolute Pressure) sensors were placed at the
inlet and outlet of the air flow meter to record the inlet and intake manifold pressures,
respectively. A hole was drilled at the inlet of the air flow meter and a temperature
sensor was installed to measure inlet temperature.
A cradle was fabricated to mount the Honda test engine and bolting it to the
test stand. For all tests, the starter motor provided on the test stand was used for
cranking with power supplied by a battery. The wiring circuits were completed to
make the ignition and starting systems fully functional. A personnel protection system
was built around the engine to ensure the safety of the staff involved in the test.
21
Fuel Injection System
A steel tank with adequate capacity to provide enough gasoline to run the
engine at wide open throttle for the duration of the test. Stainless steel 1/4 inch
tubing was used to supply the fuel to the injector. A nitrogen cylinder was used to
pressurize the fuel tank to 25 psi and this pressure was maintained throughout the
experiment by a pressure regulator. It was necessary to pressurize the fuel tank to get
the proper atomization of the fuel to have a uniform air/fuel mixture.
The Injector
A Honda and servojet electronic injectors were used for injection of gasoline
and compressed natural gas, respectively. The gasoline injector was mounted on the
manifold at an angle of 45 degrees and close to the inlet of the engine. The reason
for using fuel injection in lieu of the carburetor suggested in the engine was to
provide the necessary control over fuel metering. A sectional view of the injector is
shown in Figure 4.2. [5]
Injector Control Mechanism
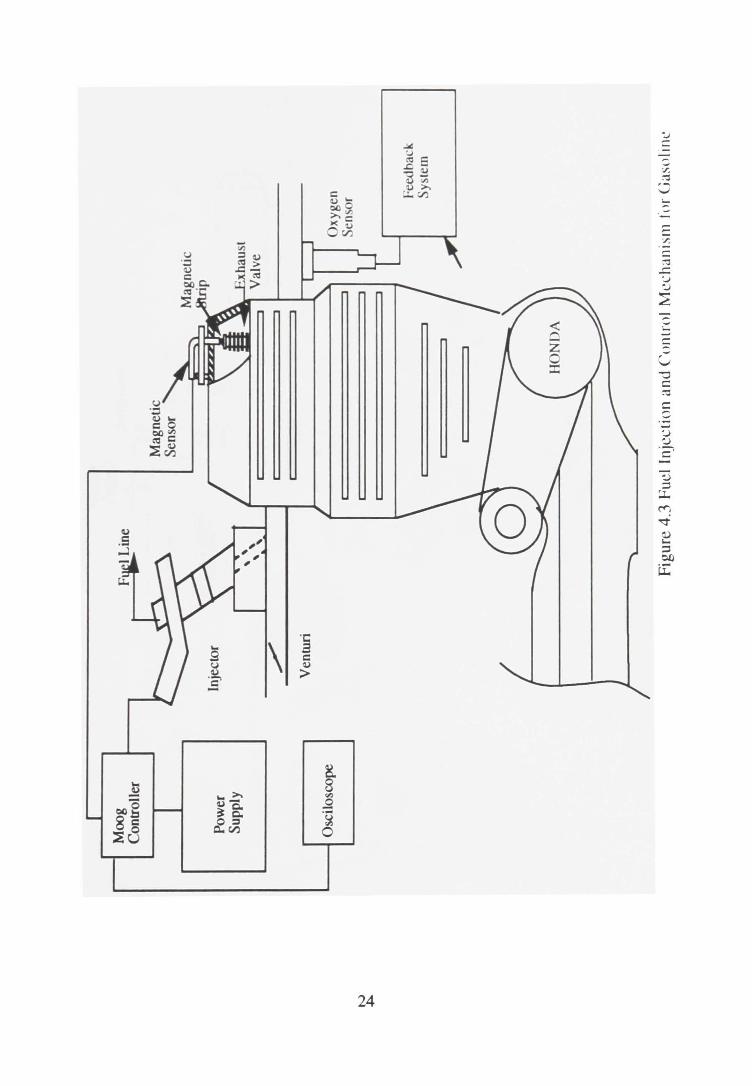
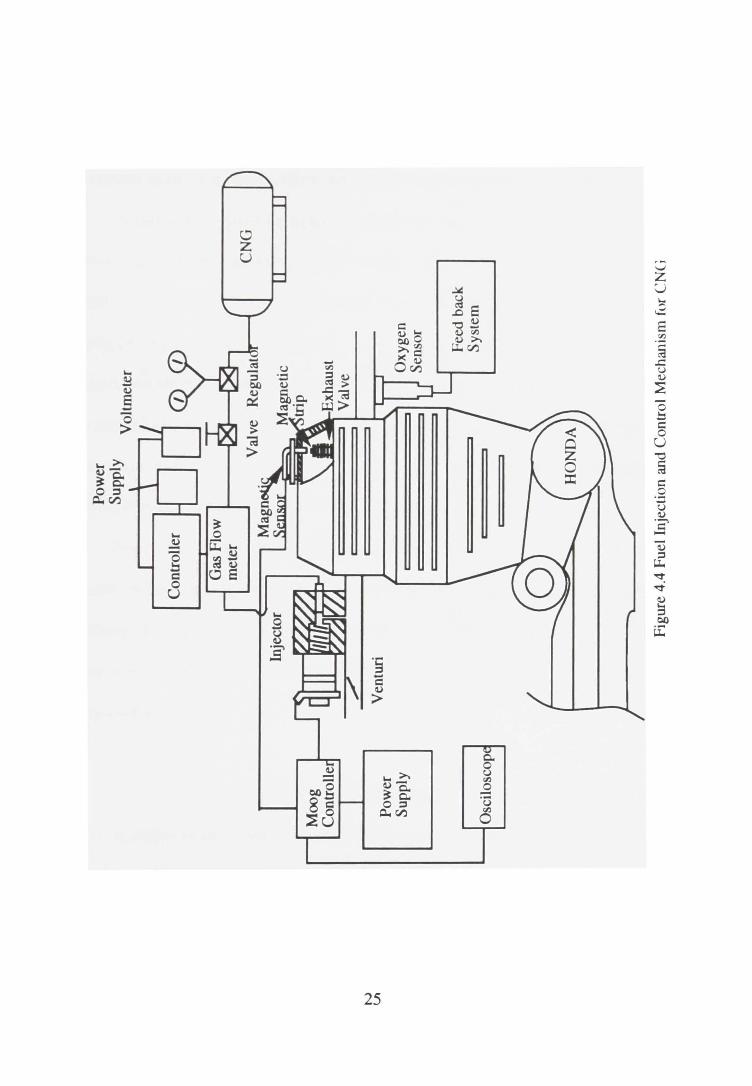
In order to control the timing and duration of the fuel injection, an injector
control mechanism was used. Figures 4.3 and 4.4 show schematic diagrams of the
injector control mechanism for gasoline and natural gas, respectively. An injector
controller supplied by Moog Controls, Inc., was used to switch the injector on and off
and to control the duration of injection. This Moog controller provided adjustments
22
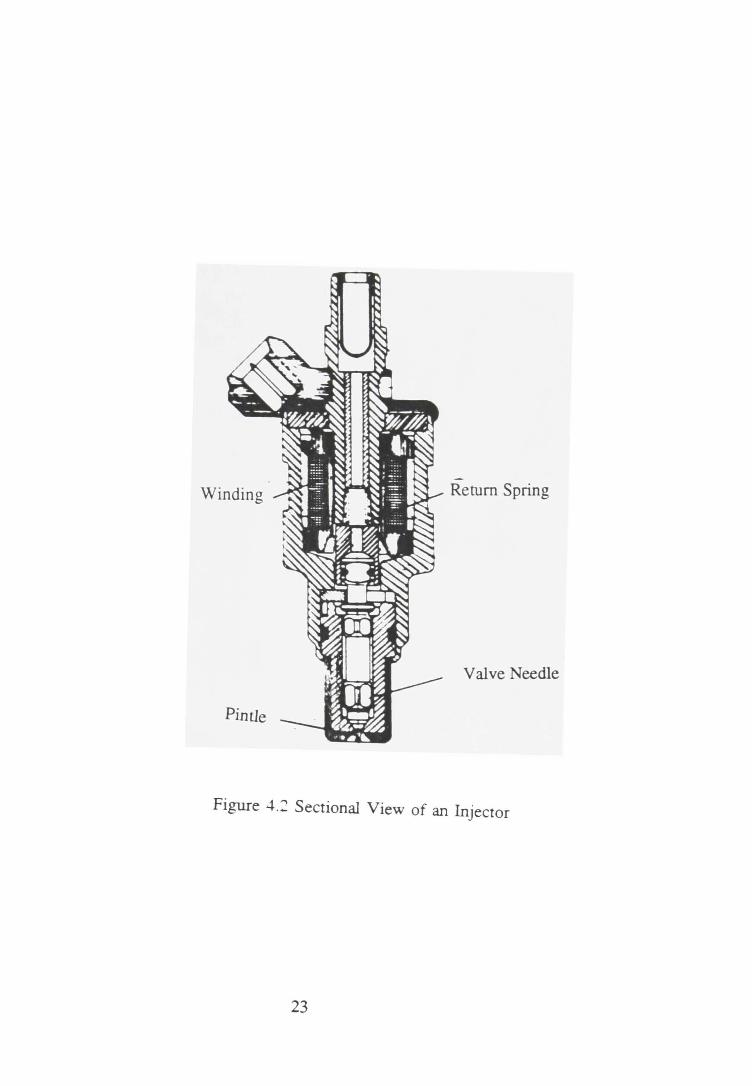
Winding Return Spring
Valve Needle
Pintle
Figure -+.~ Sectional View of an Injector
23
~
Pow
er
Sup
ply
• I
Osc
ilos
cope
Mag
neti
c S
enso
r
Oxy
gen
Sen
sor fe
edb
ack
Sy
stem
Fig
ure
4.3
Fue
l In
ject
ion
and
Co
ntr
ol
Mec
hani
sm f
or G
asol
ine
N
l..ll
Pow
er
Sup
ply
Osc
ilos
cop
Con
trol
ler
Gas
Flo
w
Pow
er
Sup
ply
Fee
d ba
ck
Sys
tem
Fig
ure
4.4
Fue
l In
ject
ion
and
Con
trol
Mec
hani
sm f
or C
NG
for "injection delay" and "injection width." The injection delay is the time period
after receiving a pulse by the controller and the moment when the controller triggers
the injector open. Injection width is the time the injector remains open (pulse width).
A Hall effect sensor (magnetic pickup) was used to sense the closing of the
exhaust valve during operation of the engine. This sensor was coupled with the
injector control mechanism so that the fuel injection could be timed to coincide with
opening of the inlet valve. To ensure correct injection timing, a small magnet was
placed at the tip of the exhaust valve stem. The magnetic sensor (Hall effect sensor)
was positioned close to the exhaust valve so that the sensor picked up a magnetic
pulse every time the magnet came in contact with it. This sensor was connected to
the Moog controller, which in tum controlled the injector.
For every closing of the exhaust valve (40° ATDC), the Hall effect sensor
signalled the Moog controller. Upon receiving the signal from the Hall effect sensor,
the Moog controller triggered the injector open and fuel was injected. The duration
of the injection was controlled by adjusting the pulse width knob provided on the
Moog controller.
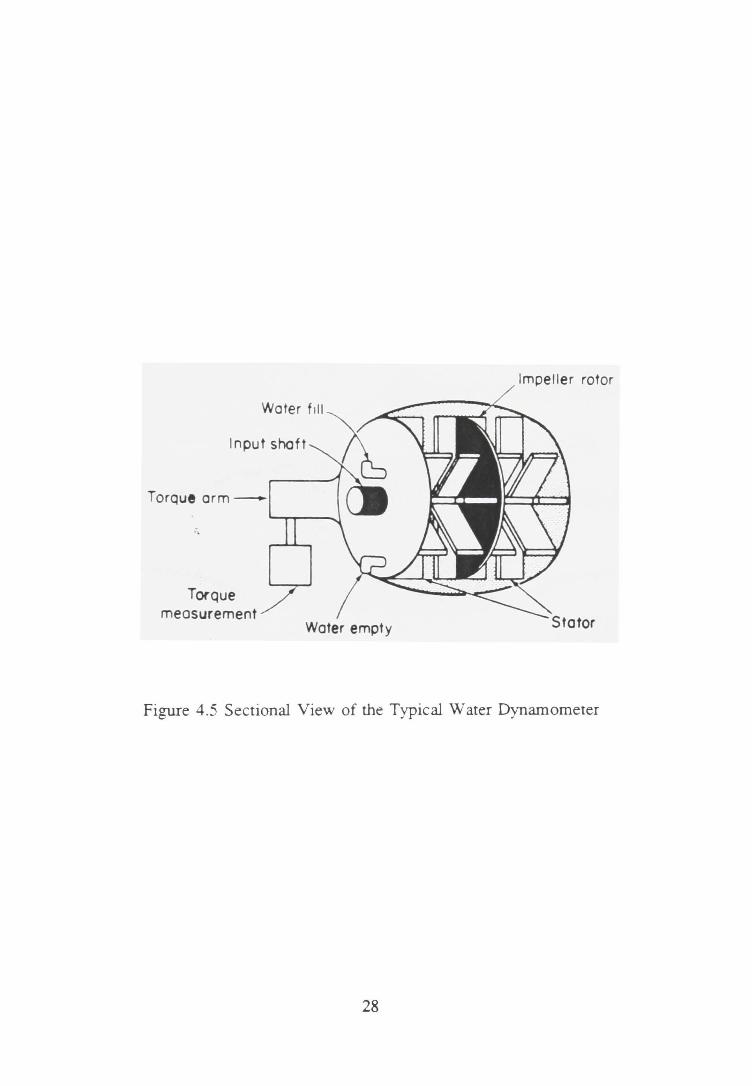
Water Dynamometer
A model D-1 01 water dynamometer was used to measure the torque output of
the engine. This dynamometer consists of a rotor and a stator, both encased in single
housing. The housing is filled with water to load the engine. The dynamometer
blades resist fluid flow through the rotor based on the level of water in the housing.
26
The stator also acts as the brake housing. The water inlet was controlled by a gate
valve which was used to control the amount of water for power absorption. The rotor
was flanged to the drive shaft of the engine and is free to turn within the stator. The
torque was measured by means of strain-gage elements (load cell) which were bonded
to the transmission shaft. Figure 4.5 shows a cut-away of a typical water
dynamometer.
Air Flowmeter
A Meriam laminar flowmeter, Model 50MC2, was used to measure the inlet
air flow rate. This flow meter was coupled directly to the inlet manifold of the test
engine by means of a short piece of hose. The differential pressure across the laminar
flowmeter was measured by using two GM MAP pressure sensors which were located
at the inlet and outlet of the flowmeter, respectively. Figure 4.6 [14] shows the
general construction of laminar flowmeter.
Mass Flowmeter for Natural gas
A MKS, Type 558A, mass flowmeter was used to measure natural gas
consumption by the engine. The MKS flow meter is a laminar flow device whose
precise indication of mass flow is achieved through the use of a range-controlling,
changeable bypass and paralleling sensor tube. Upon entering the flowmeter, the gas
stream is divided into two parallel paths: the first is directed through the sensor tube
and the second through the changeable bypass. The two paths rejoin to pass through
27
Water f ill
Input shaft
Torque arm-
Torque measurement
Water empty
Impeller rotor
Figure 4.5 Sectional View of the Typical Water Dynamometer
28
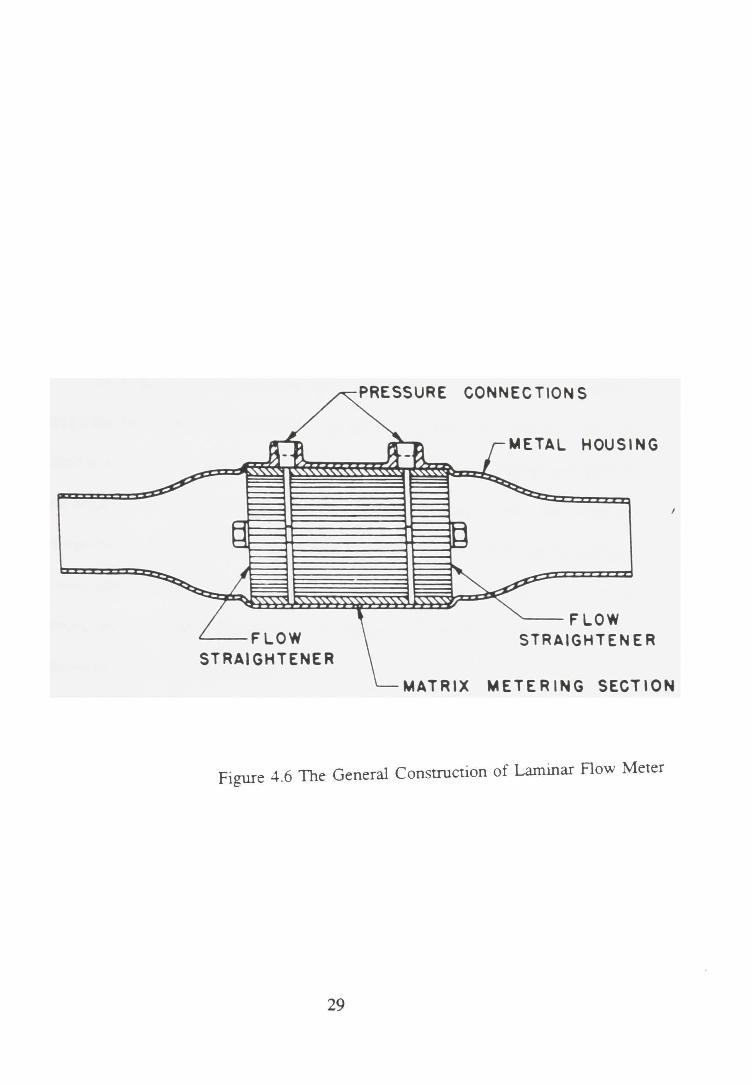
'---FLOW STRAIGHTENER
CONNEC TlON S
'----FLOW STRAIGHTENER
METERING SECTION
Figure 4.6 The General Construction of Laminar Flow Meter
29
the control valve before exiting the instrument. In this mass flowmeter, resistance
heaters are wound on the sensor tube and form the active legs of bridge circuits.
Their temperatures are established such that a voltage change on the sensor winding
is a linear function of a flow change. This signal is then amplified to provide 0-5
VDC output. This output voltage is calibrated to the flow rate of the natural gas.
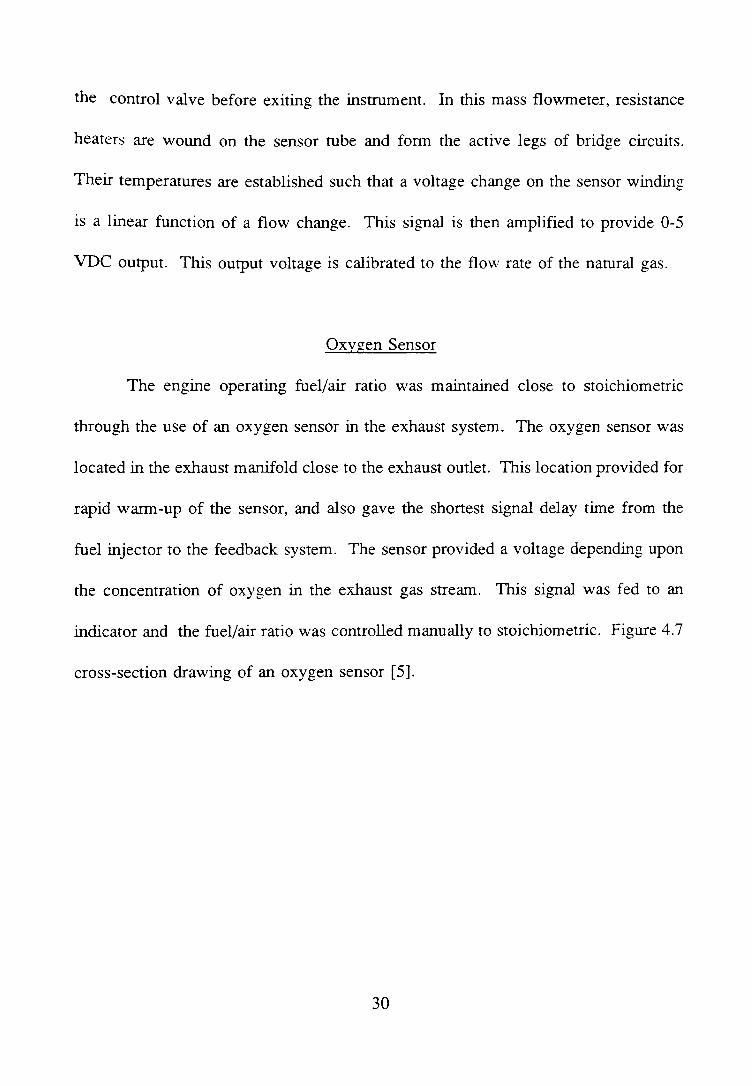
Oxygen Sensor
The engme operating fuel/air ratio was maintained close to stoichiometric
through the use of an oxygen sensor in the exhaust system. The oxygen sensor was
located in the exhaust manifold close to the exhaust outlet. This location provided for
rapid warm-up of the sensor, and also gave the shortest signal delay time from the
fuel injector to the feedback system. The sensor provided a voltage depending upon
the concentration of oxygen in the exhaust gas stream. This signal was fed to an
indicator and the fuel/air ratio was controlled manually to stoichiometric. Figure 4.7
cross-section drawing of an oxygen sensor [5].
30
Posttt~ electncal tennmal
Shell (ncgat•~
electrical tenn1naJ)
Sensor Body
EJNnst manifold
Insulator
Graphite seal and contact
Figure 4.7 A Cross-Section Drawing of an Oxygen Sensor
31
Exhaust Gas Analyzer
The Horiba Mexa-Ge automotive emission analyzer was used to measure the
levels of CO and HC in the exhaust of the test engine. A cylindrical tube, l/2 inch
in diameter was welded to the exhaust manifold to hold the measuring probe. The
cylindrical tube was positioned in such way that the probe could be inserted into the
middle of the exhaust gas stream. This was necessary for accurate measurement. CO
and HC emissions were recorded in terms of percentage and PPM, respectively, from
the digital display of the analyzer.
Data Acquisition System
Rapid data acquisition was necessary to record the test results. To accomplish
this an IBM XT with two Metrabyte data acquisition boards was used. All the
thermocouples. pressure sensors, and strain gage elements (load cell) were connected
to the data acquisition board.
32
CHAPTER V
TEST PROCEDURE
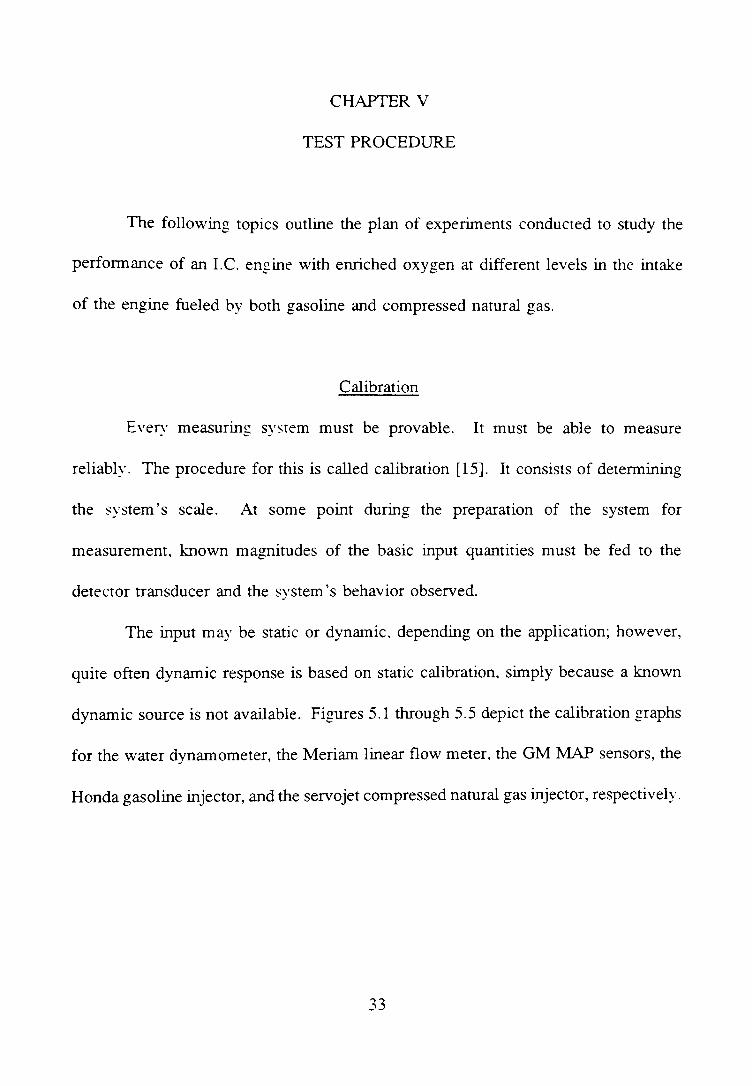
The following topics outline the plan of experiments conducted to study the
performance of an I.C. engine with enriched oxygen at different levels in the intake
of the engine fueled by both gasoline and compressed natural gas.
Calibration
Everv measurmg svstem must be provable. It must be able to measure
reliabh·. The procedure for this is called calibration [15]. It consists of determining
the system's scale. At some point during the preparation of the system for
measurement, known magnitudes of the basic input quantities must be fed to the
detector transducer and the system's behavior observed.
The input may be static or dynamic. depending on the application; however,
quite often dynamic response is based on static calibration, simply because a known
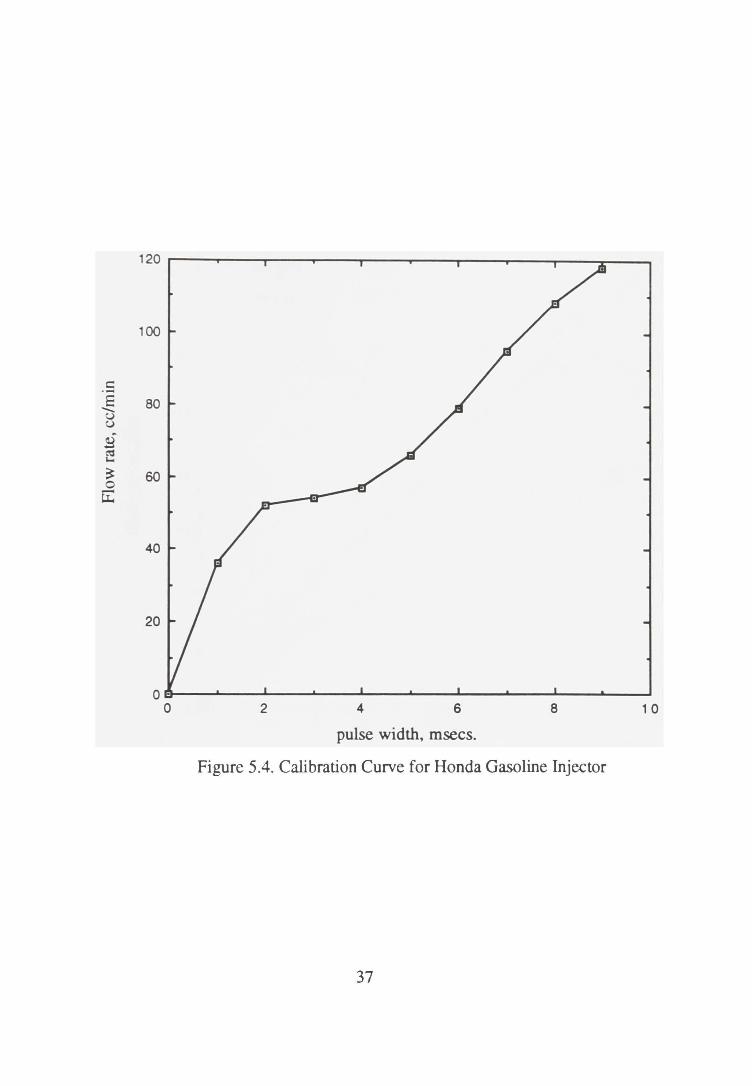
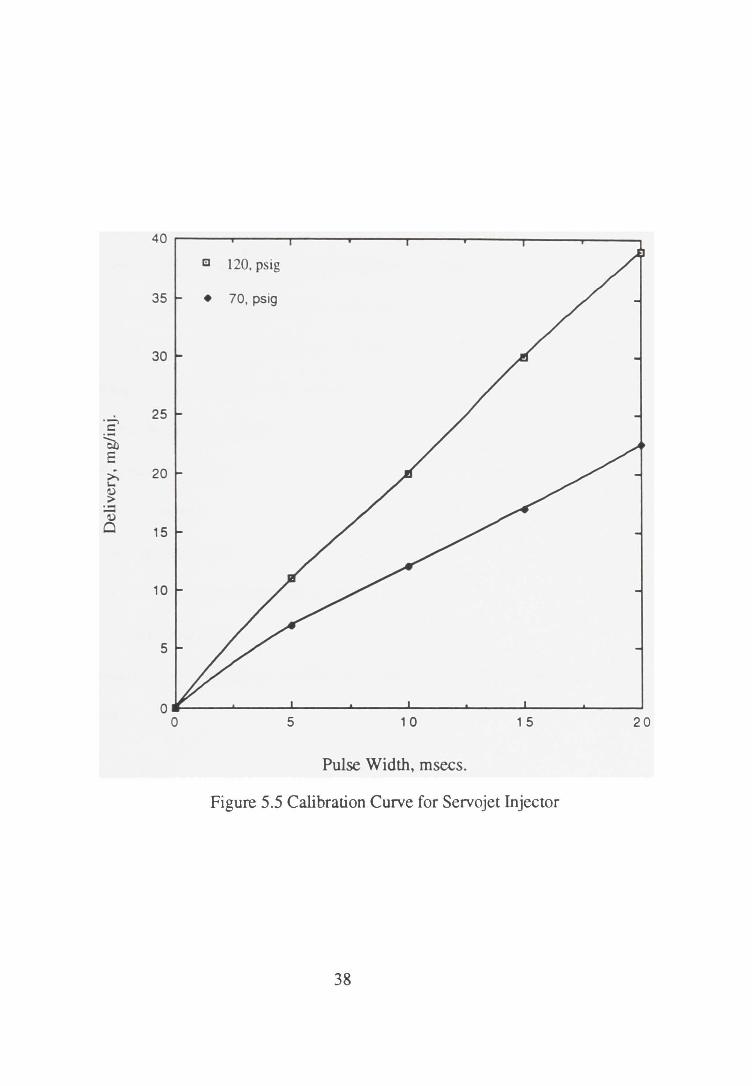
dynamic source is not available. Figures 5.1 through 5.5 depict the calibration graphs
for the water dynamometer, the Meriam linear flow meter, the GM MAP sensors, the
Honda gasoline injector, and the servojet compressed natural gas injector, respectively.
33
.:::: I
.D
a) ::s 8" 0
E-
50
40
30
20
10
0 ~----~----~----~----~----~--~~--~~--~ 0 2 4
Output, volts
6
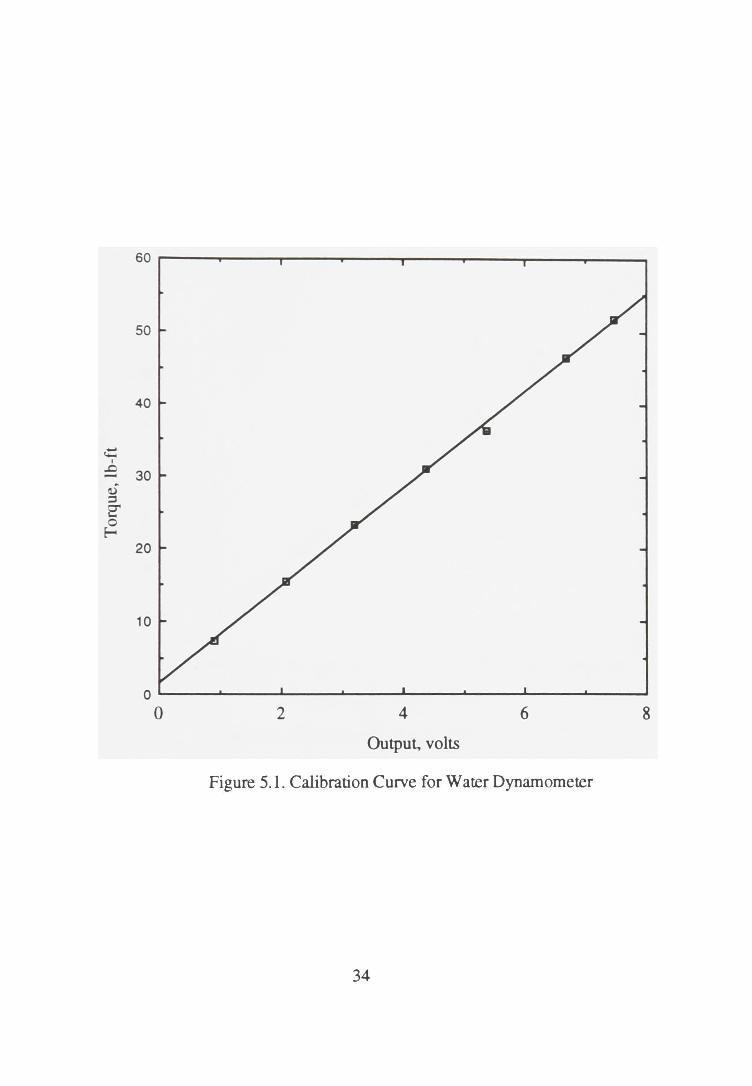
Figure 5.1. Calibration Curve for Water Dynamometer
34
8
18
16
14
12
~ u 10 £ ~
""' ~ 8 0 ...... u..
6
4
2
0 0 2 3 4 5 6 7 8 9
Pressue drop, inches of water
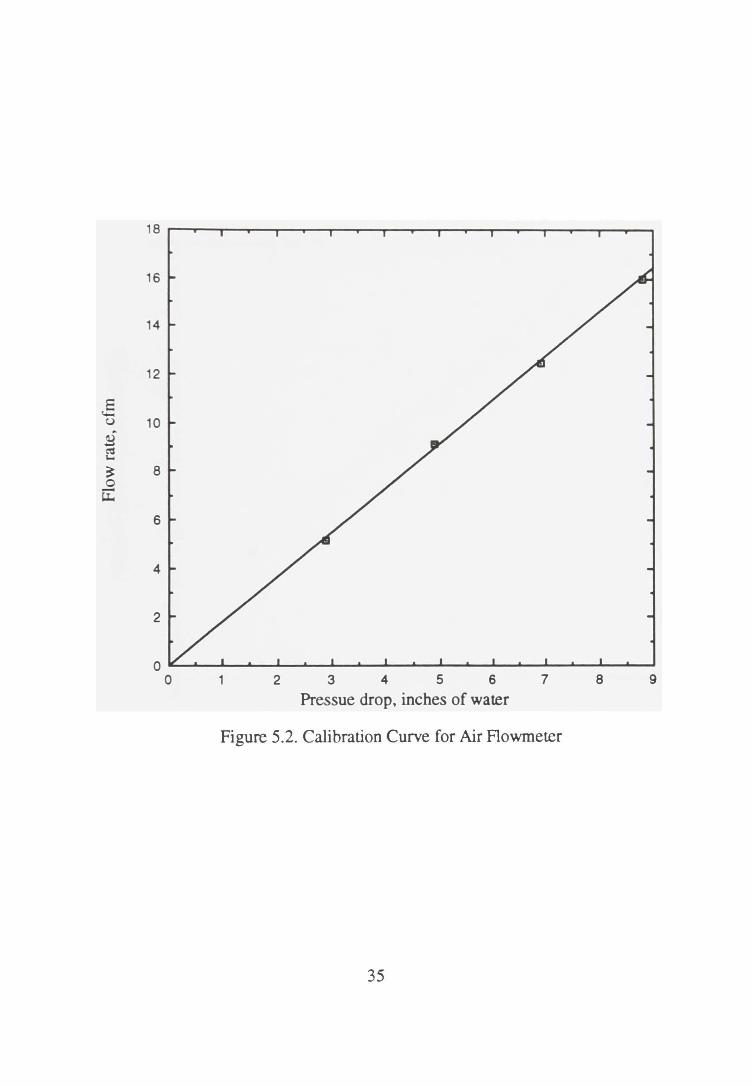
Figure 5.2. Calibration Curve for Air Aowmeter
35
25
Ol)
l: <.o....
20 0 Vl ~ ..c u c ·-e 15 =' Vl Vl e 0.
B 10 =' -0
Vl .0
< 5
0 ~--_. ____ ~ __ _. ____ ~ __ _. ____ ~--~----~--~--~
0 2 3 4 5
Output, Volts
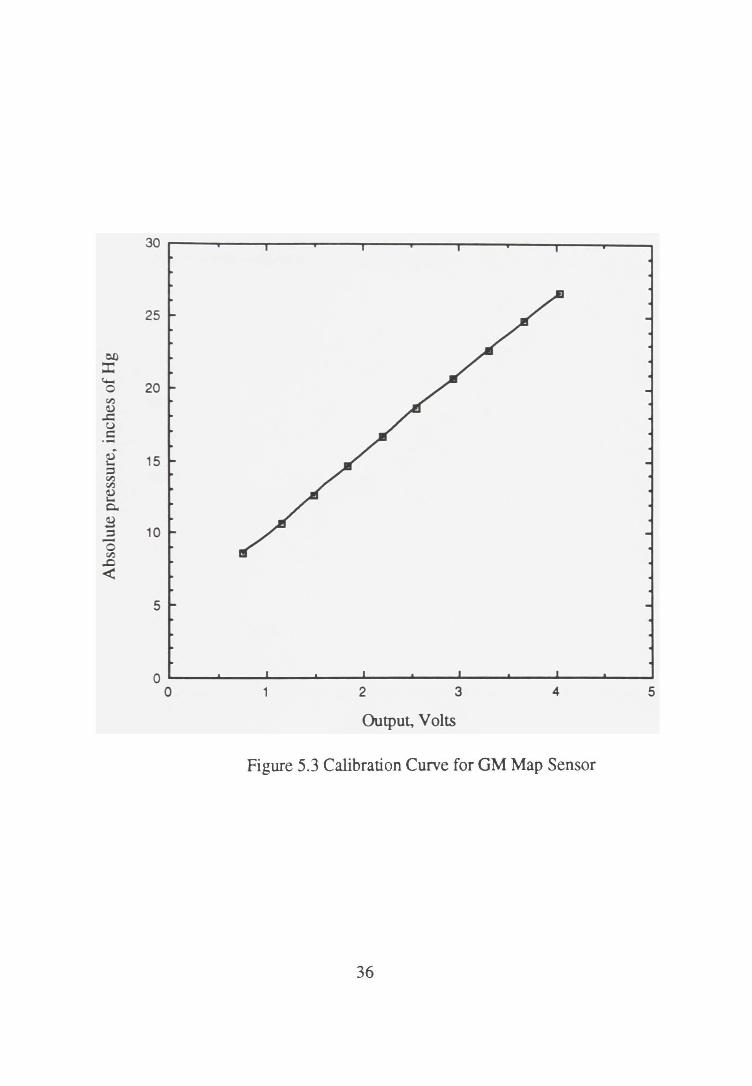
Figure 5.3 Calibration Curve for GM Map Sensor
36
.s E 80 0 u
£ CIS """ ~ 60 0 u:
40
pulse width, msecs.
Figure 5.4. Calibration Curve for Honda Gasoline Injector
37
40 r---~~---.----~----~----~----~----~----~
Ill 120, psig
35 • 70, psig
30
25 '2 ~ E ...... 20 '-
~ :.::l
11)
0 15
10
5
0------L-----~----~----~--~~--~----~----~ 0 5 10 1 5 20
Pulse Width, msecs.
Figure 5.5 Calibration Curve for Servojet Injector
38
Preliminary Tests
To ensure the correct performance of the system and the normal function of
the test engine, it was initially operated for a few hours using both gasoline and
compressed natural gas with normal air. During this initial run, the performance of
the system was carefully observed. Malfunctioning of components and leakage in air,
water, and fuel lines were corrected before the actual tests were initiated. Table 5.1
shows the conditions during the evaluation of the tests.
During the preliminary tests at wide open throttle, the following parameters
were monitored at various speeds :
1. the power output,
2. torque output,
3. fuel consumption,
4. inlet and exhaust temperatures, and
5. exhaust emissions
Variable speeds were obtained by loading the engine with the water flow rate in the
dynamometer.
Gasoline Tests
The outlet pressure of the low pressure regulators from compressed air tank
and oxygen enriched cylinder were maintained at 5 inches of water. At this pressure
the air flow rate was sufficient to run the engine at wide open throttle. The pressure
in the gasoline tank was maintained at 25 psi. The engine was cranked using the
39
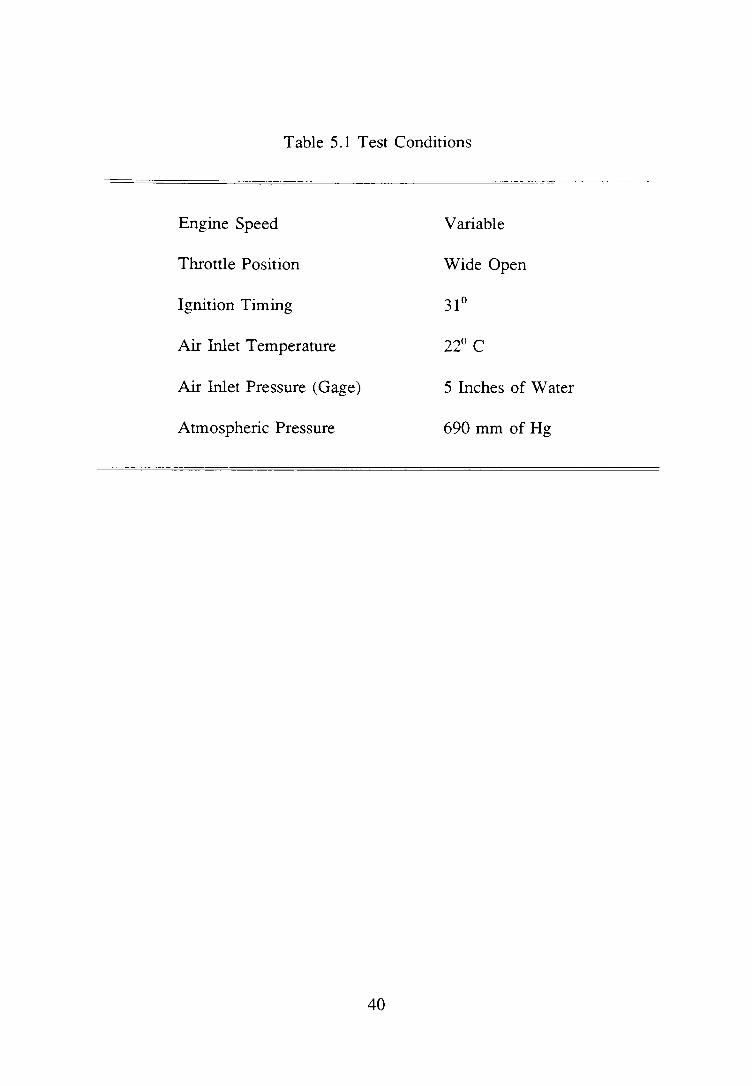
Table 5.1 Test Conditions
Engine Speed
Throttle Position
Ignition Timing
Air Inlet Temperature
Air Inlet Pressure (Gage)
Atmospheric Pressure
40
Variable
Wide Open
31°
22° c
5 Inches of Water
690 mm of Hg
starter motor provided on the engine stand powered by a battery. The tests were
carried out at wide open throttle at various speeds by adjusting the load on the
engine. The measured data such as power output, torque, and speed were
compared with analytically calculated results. The fuel consumption and exhaust
emissions were compared with standard data available for S.I. engines fueled by
gasoline. The tests were repeated several times under similar conditions and the
repeatability was found to be within 5 percent.
Compressed Natural Gas Tests
The gasoline injector was replaced by a servojet injector which was specially
designed for natural gas injection. By trail and error, the CNG inlet pressure to the
injector required to crank the engine was found to be approximately 10 psi, and the
pressure required to run the engine at a wide open throttle varied from 40-7 5 psi. The
measured data agreed with analytically calculated results and available standard data.
The repeatability was again found to be within 5 percent.
41
CHAPTER VI
TEST RESULTS
In this chapter, the results of experiments conducted to study the effect of
oxygen enrichment on the performance and emissions of internal combustion engines
fueled by gasoline and natural gas are presented. After studying and evaluating the
performance and emissions of the engine with normal air (21% Oxygen), of
experiments were conducted to assess the effects of oxygen enrichment in the intake.
The oxygen concentration was varied between 23% and 25%. All the data were
obtained at the wide open throttle position at various engine speeds. The analysis of
results obtained revealed that the engine performance was improved and significant
reductions in exhaust emissions such as CO and HC were observed with oxygen
enrichment in the intake.
Brake-Horsepower
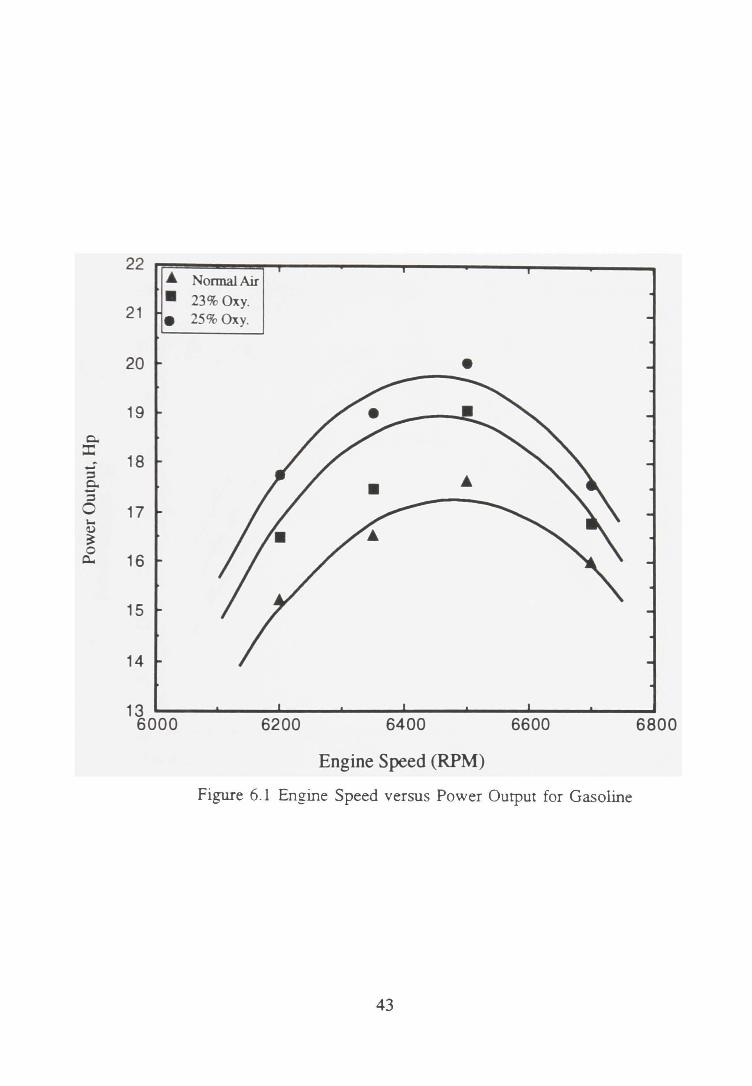
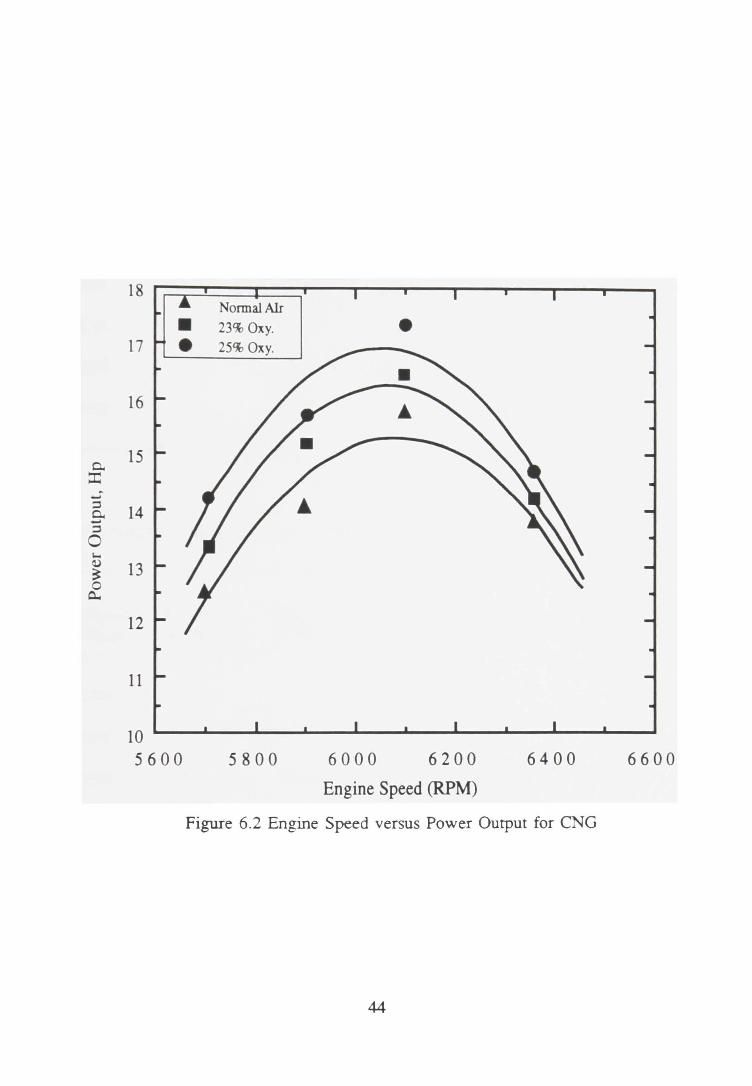
Figures 6.1 and 6.2 show the effect of oxygen enrichment on the power output
of the engine at different levels of oxygen in the intake air fueled by gasoline and
natural gas, respectively. It can be seen that the power output increased with
increased percentage of oxygen. Tables 6.1 and 6.2 give the percentage increase in
the power output for gasoline and natural gas, respectively. An increase in power
output of 5%-17% for oxygen enriched air/gasoline mixtures and 2%-16% for oxygen
enriched air/natural gas mixtures was observed. It is also noticed that power output
42
6200
•
6400
Engine Speed (RPM)
6600
Figure 6.1 Engine Speed versus Power Output for Gasoline
43
6800
Normal Air • 23%0xy. • 17 • 25% Oxy.
16
0. 15
:I: .J' ::I
14 0. ~
::I 0 ~ a) 13 ~ 0
0..
12
11
10 ----~--~------~--~~--._--~--~------~ 5600 5800 6000 6200 6400 6600
Engine Speed (RPM)
Figure 6.2 Engine Speed versus Power Output for CNG
44
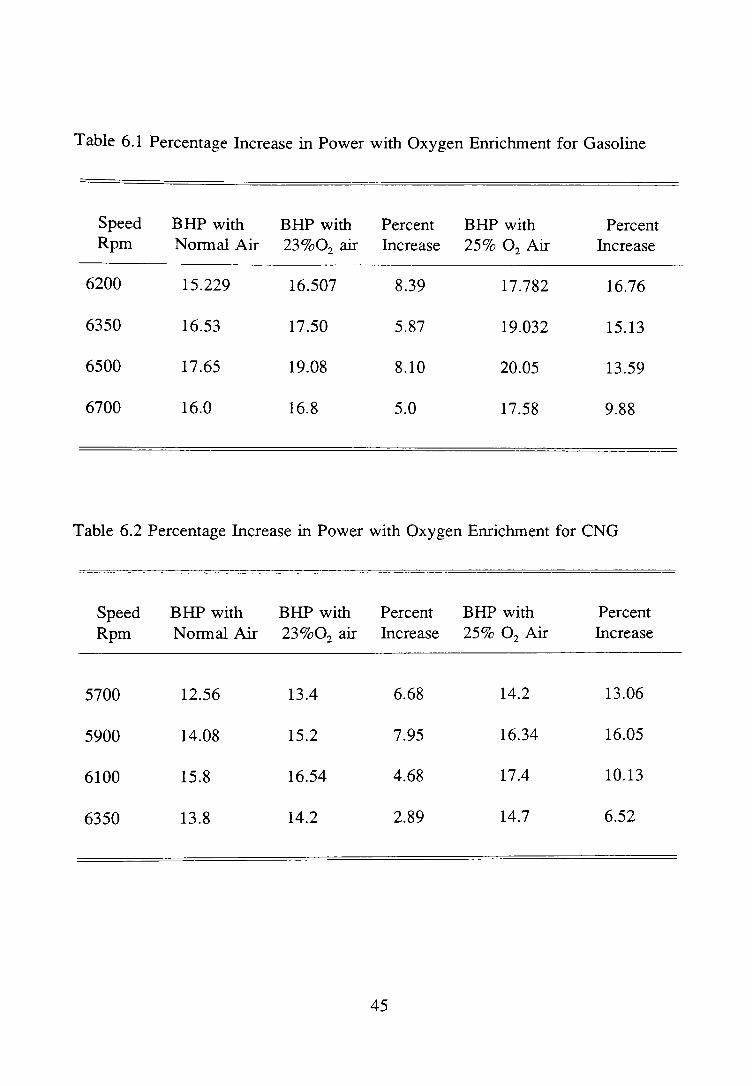
Table 6.1 Percentage Increase in Power with Oxygen Enrichment for Gasoline
Speed BHP with BHP with Percent BHP with Percent Rpm Normal Air 23%02 air Increase 25% 0 2 Air Increase
6200 15.229 16.507 8.39 17.782 16.76
6350 16.53 17.50 5.87 19.032 15.13
6500 17.65 19.08 8.10 20.05 13.59
6700 16.0 16.8 5.0 17.58 9.88
Table 6.2 Percentage Increase in Power with Oxygen Enrichment for CNG
Speed BHP with BHP with Percent BHP with Rpm Normal Air 23%02 air Increase 25% 0 2 Air
5700 12.56 13.4 6.68 14.2
5900 14.08 15.2 7.95 16.34
6100 15.8 16.54 4.68 17.4
6350 13.8 14.2 2.89 14.7
45
Percent Increase
13.06
16.05
10.13
6.52
with '25% oxygen enriched air/natural gas mixtures equal to power output with
air/gasoline mixtures. The increase in power output can he attributed to improvement
in fuel combustion.
Exhaust Temperature
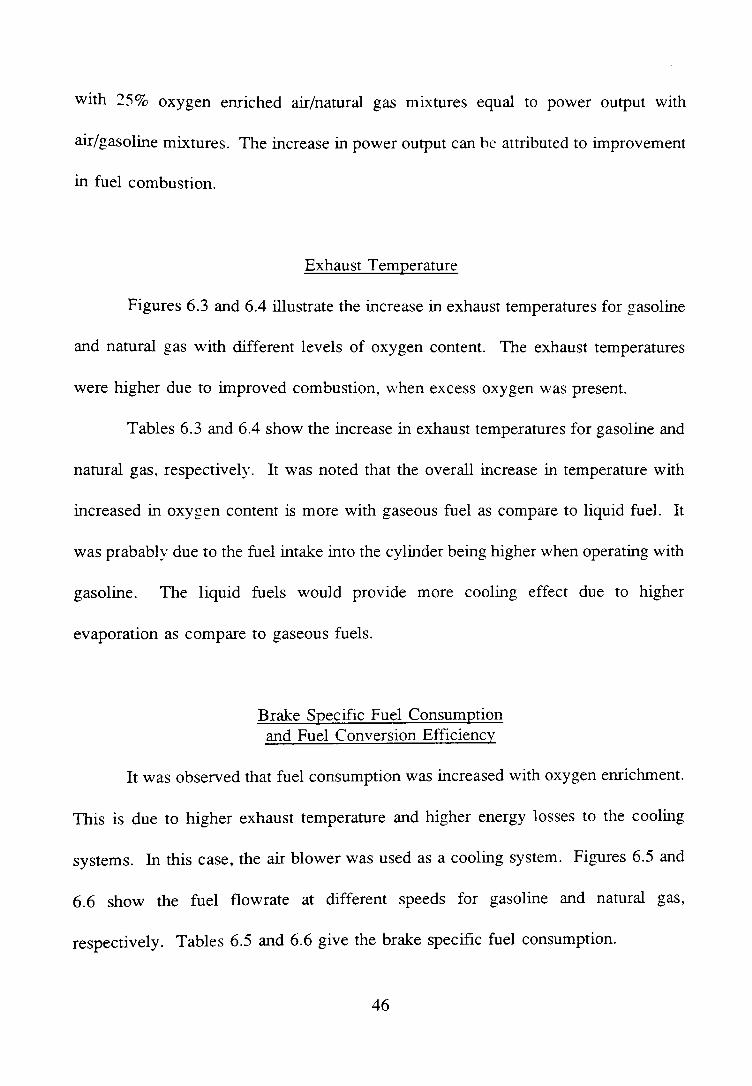
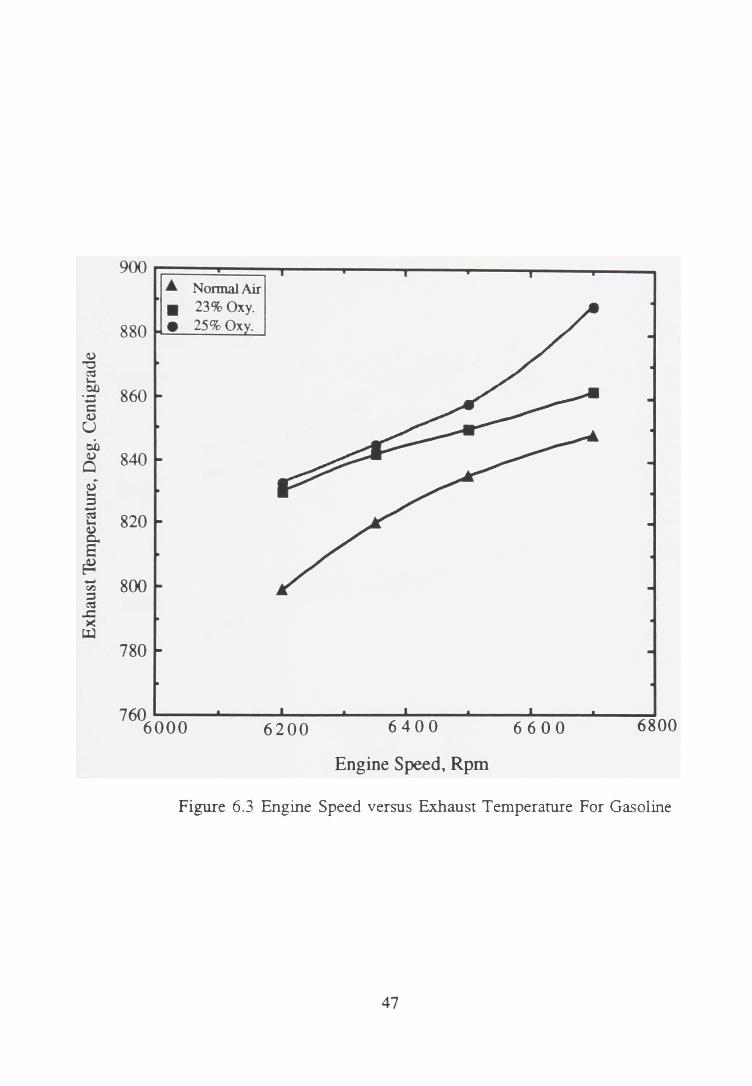
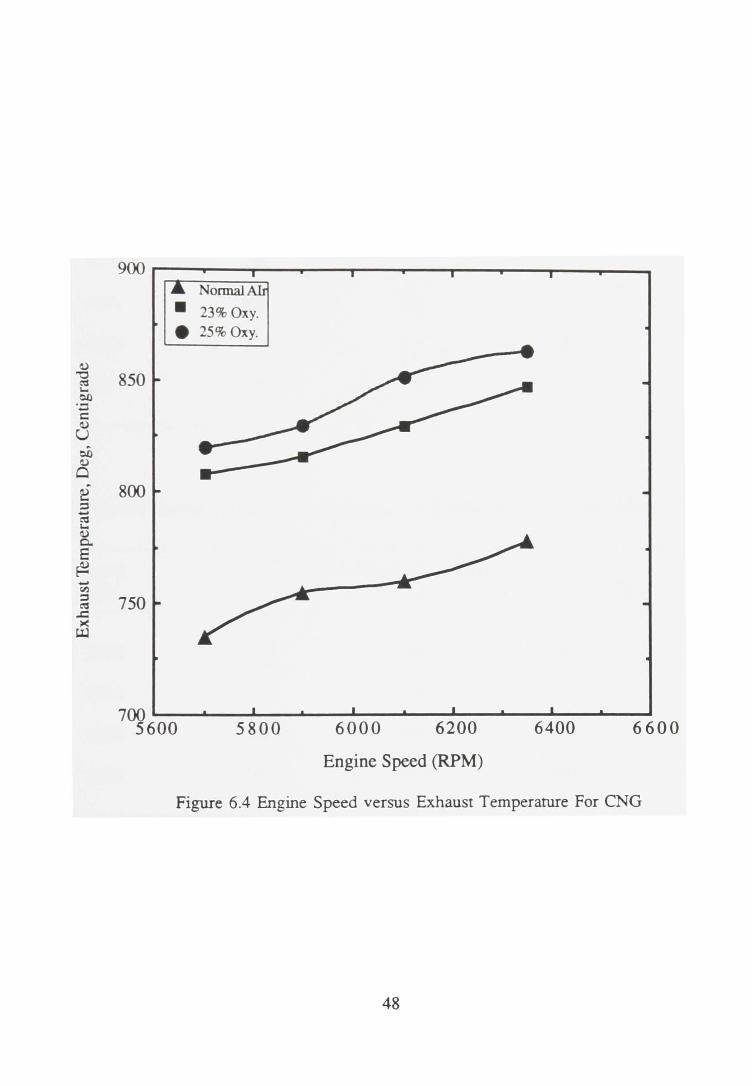
Figures 6.3 and 6.4 illustrate the increase in exhaust temperatures for gasoline
and natural gas with different levels of oxygen content. The exhaust temperatures
were higher due to improved combustion, when excess oxygen was present.
Tables 6.3 and 6.4 show the increase in exhaust temperatures for gasoline and
natural gas, respectively. It was noted that the overall increase in temperature with
increased in oxygen content is more with gaseous fuel as compare to liquid fuel. It
was prabably due to the fuel intake into the cylinder being higher when operating with
gasoline. The liquid fuels would provide more cooling effect due to higher
evaporation as compare to gaseous fuels.
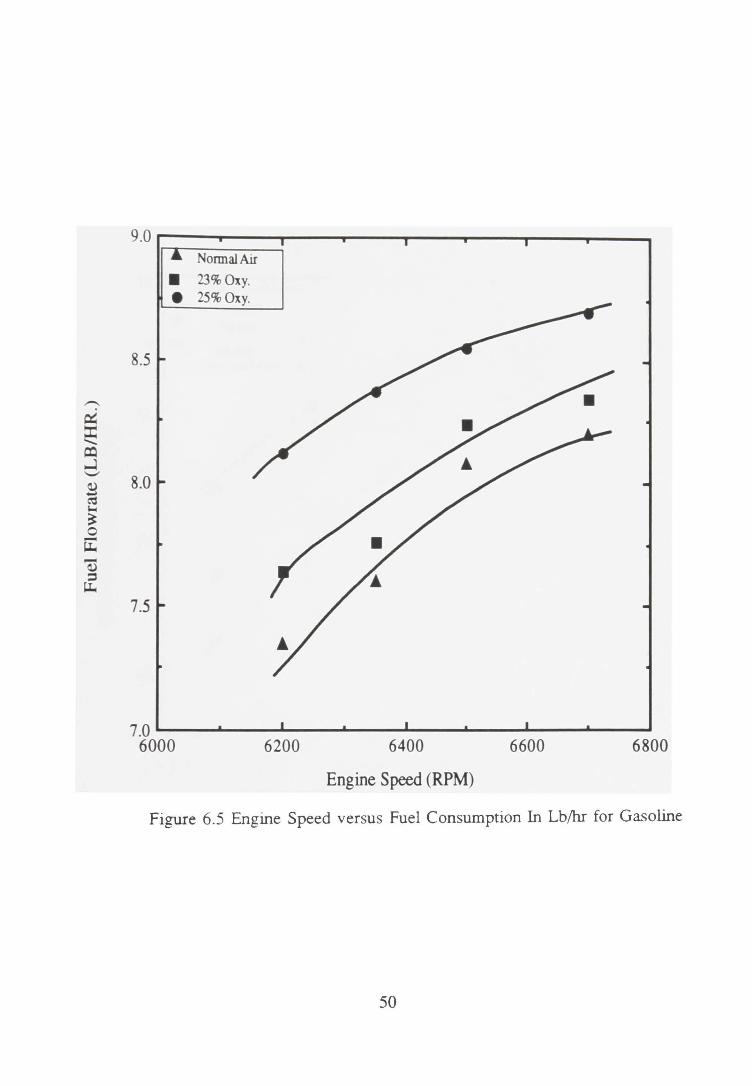
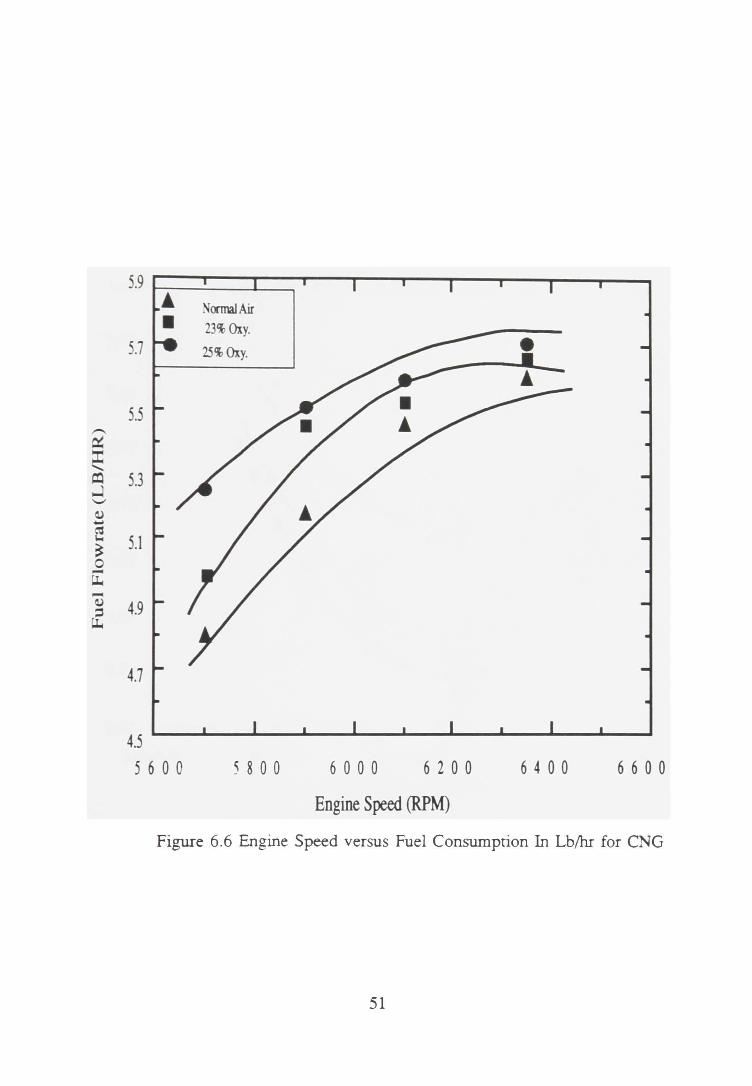
Brake Specific Fuel Consumption and Fuel Conversion Efficiency
It was observed that fuel consumption was increased with oxygen enrichment.
This is due to higher exhaust temperature and higher energy losses to the cooling
systems. In this case, the air blower was used as a cooling system. Figures 6.5 and
6.6 show the fuel flowrate at different speeds for gasoline and natural gas,
respectively. Tables 6.5 and 6.6 give the brake specific fuel consumption.
46
900
• Normal Air
• 23%0xy .
880 • 25% Ox .
0 "0 ~ ~
00 860 ·-..... c 0 u 00 0 840 0
~ ..... ~ 820 ~ 0 0.. s ~ ..... 800 c:l.)
::s ~ .c
>< ~
780
7606000 6200 6400 6600 6800
Engine Speed, Rpm
Figure 6.3 Engine Speed versus Exhaust Temperature For Gasoline
47
900
• • d)
"'0 850 ~ 1-o 0.0 ·;: c: d)
u ~
0.0 d)
0 ~ 800 ~
:l ..... ~ 1-o d) 0. E ~ ..... V)
:l 750 ~ ..c: ><
U.l
700~--~--~--~---L--_.--~------~~----~ 5600 5800 6000 6200 6400 6600
Engine Speed (RPM)
Figure 6.4 Engine Speed versus Exhaust Temperature For CNG
48
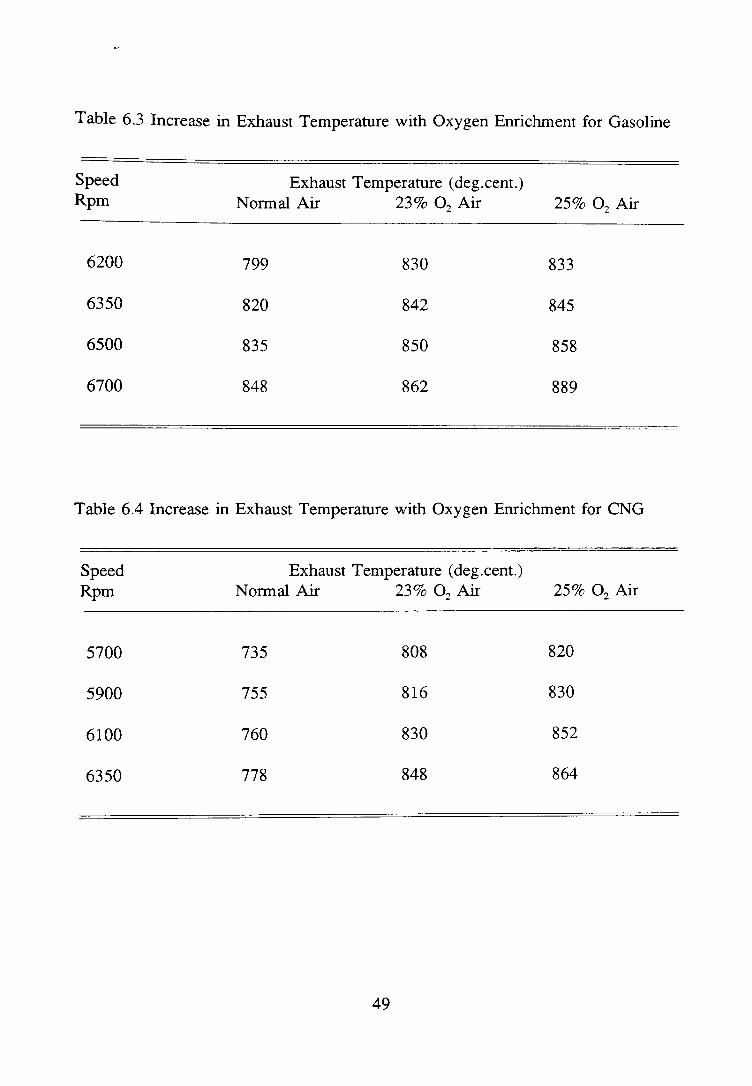
Table 6.3 Increase in Exhaust Temperature with Oxygen Enrichment for Gasoline
Speed Rpm
6200
6350
6500
6700
Exhaust Temperature (deg.cent.) Normal Air 23% 0 2 Air
799 830
820 842
835 850
848 862
25% 0 2 Air
833
845
858
889
Table 6.4 Increase in Exhaust Temperature with Oxygen Enrichment for CNG
Speed Rpm
5700
5900
6100
6350
Exhaust Temperature (deg.cent.) Normal Air 23% 0 2 Air
735 808
755 816
760 830
778 848
49
25% 0 2 Air
820
830
852
864
--~ ~ ~ ....J ...._,
~ ~ ~
~ 0 -~ -0) ::s ~
Normal Air
• 23%0xy . • 25%0xy.
8.5
8.0
7.5
6200 6400
Engine Speed (RPM)
6600 6800
Figure 6.5 Engine Speed versus Fuel Consumption In Lb/hr for Gasoline
50
,-... ~ X ........ ~ .J --~ ... e ~ 0 -u.. -~ ::s u..
5.7
5.5
5.3
5.1
4.9
4.7
4.5 5 6 0 0
Nocma!Air 23% Oxy.
25% Oxy.
5 8 0 0 6 0 0 0 6 2 0 0 6 4 0 0 6 6 0 0
Engine Speed (RPM)
Figure 6.6 Engine Speed versus Fuel Consumption In Lb/hr for CNG
51
...-~ :I:
I
0..
~ ~ ..J ..._, u ~ en ~
0.50
• 0.49 • 0.48
0.47
0.46
0.45
0.44
0.43
0.42
6000
Normal Air 23% Oxy. 25% Oxy.
• 6 2 0 0 6 4 0 0 6 6 0 0 6 8 0 0
Engine Speed (RPM)
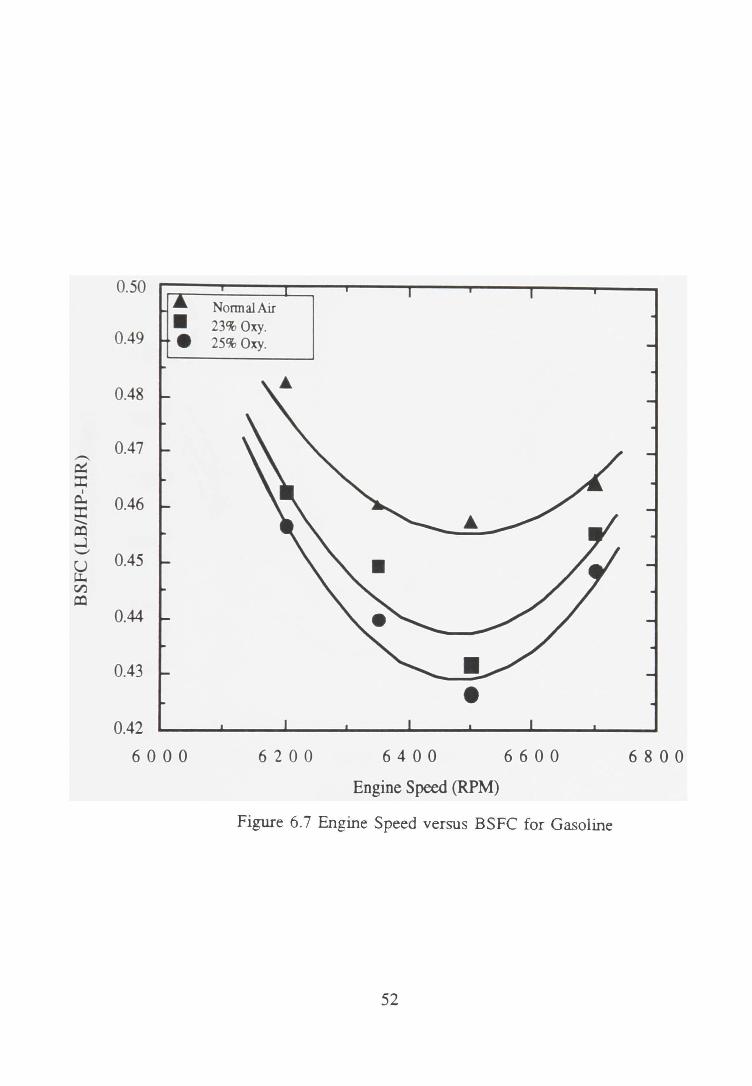
Figure 6.7 Engine Speed versus BSFC for Gasoline
52
,.-._
" X I
~ ~ ~ ~
u u.-Cl)
~
0.42
0.40
0.38
0.36
0.34
0.32
0.30 5600
Noona!Air 23%0xy. 25%0xy.
5800
• 6000 6200 6400
Engine Speed (rpm)
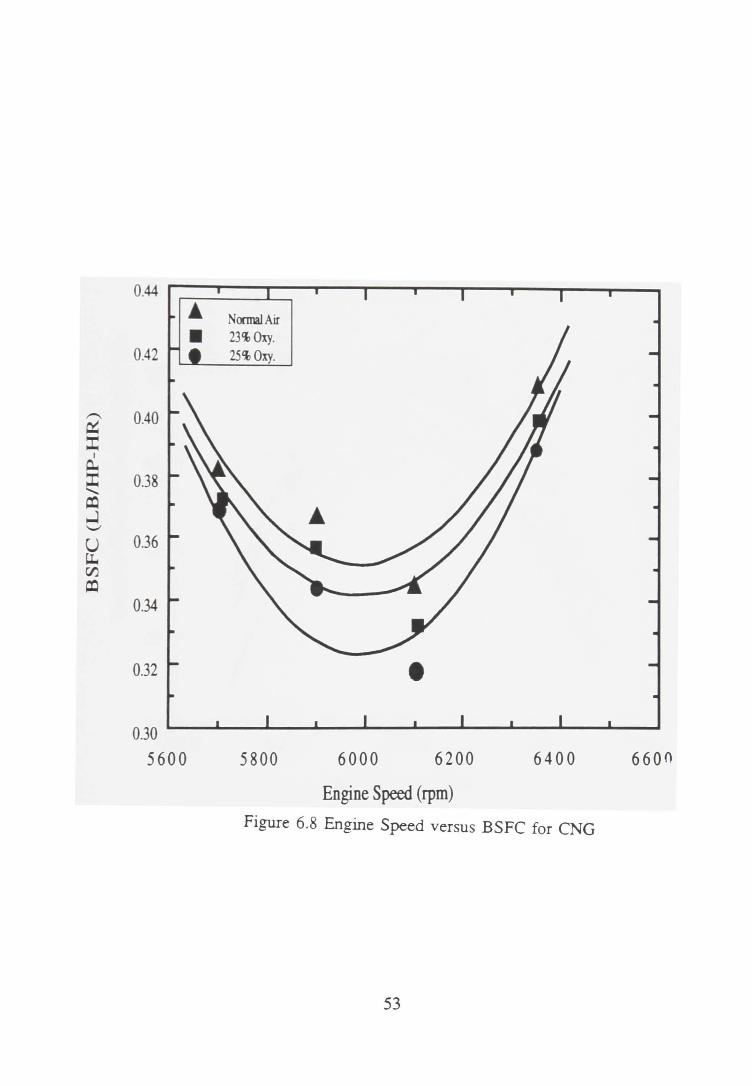
Figure 6.8 Engine Speed versus BSFC for CNG
53
6600
34 .. Normal Air ,.-..._ • 23% Oxy. ~ • 25% Oxy. '-' ;;..., 32 u c: Q.) ·-u ~ tlJ c: 30 0 ·-Cl.)
"" Q.)
> c: 0 u 28 ~ § Q.)
~ 26
24 L_ __ ~ __ _L __ _. __ ~~--~--~--~----
6000 6200 6400 6600 6800
Engine Speed (RPM)
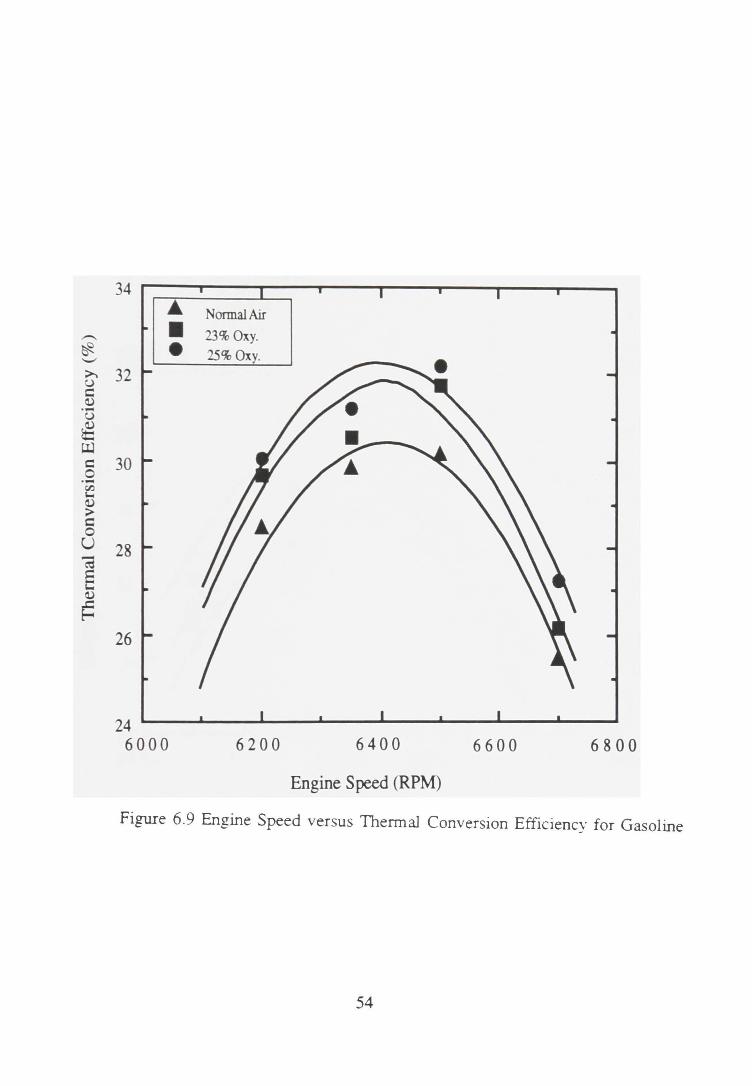
Figure 6.9 Engine Speed versus Thermal Conversion Efficiency for Gasoline
54
40
~ Normal Air
• 23%0xy .
38 • 25%0xy.
-- • ~ '-' >. C,) 36 c: ~ ·-C,)
s r.I.l c: 34 0 ·-Cl)
""' ~ > c: 0 32 u ca § ~
~ 30
28 ~--~--~--~--~--~--~--~---L--~--~
5600 5800 6000 6200 6400 6600
Engine Speed (RPM)
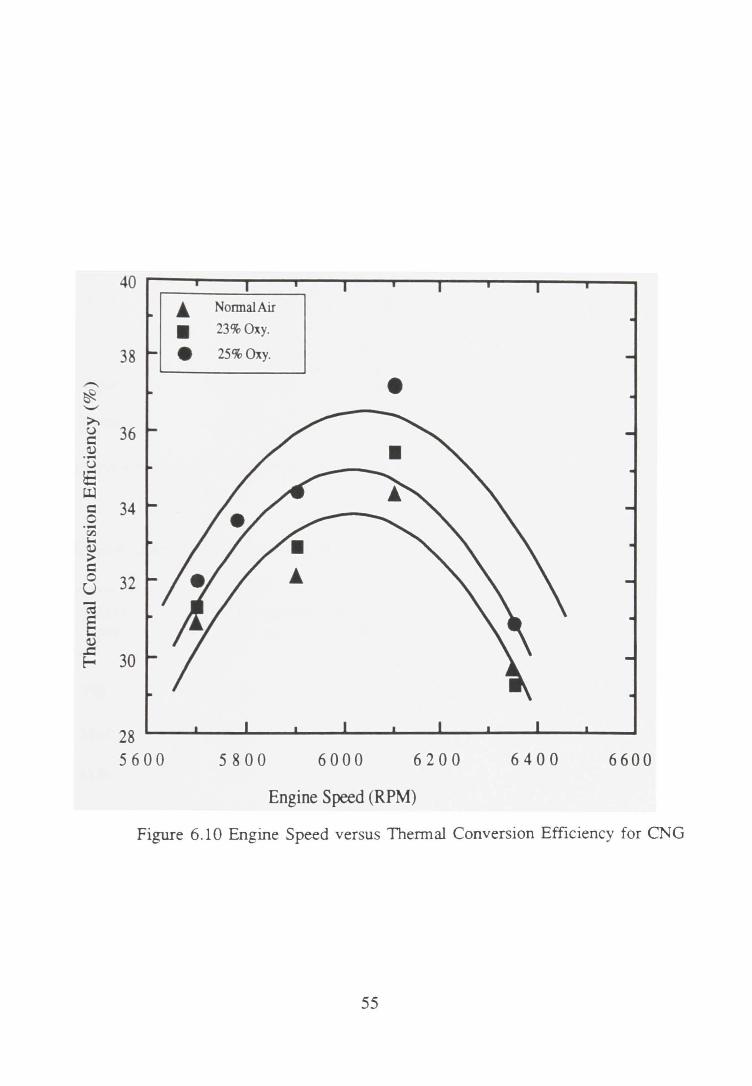
Figure 6.10 Engine Speed versus Thermal Conversion Efficiency for CNG
55
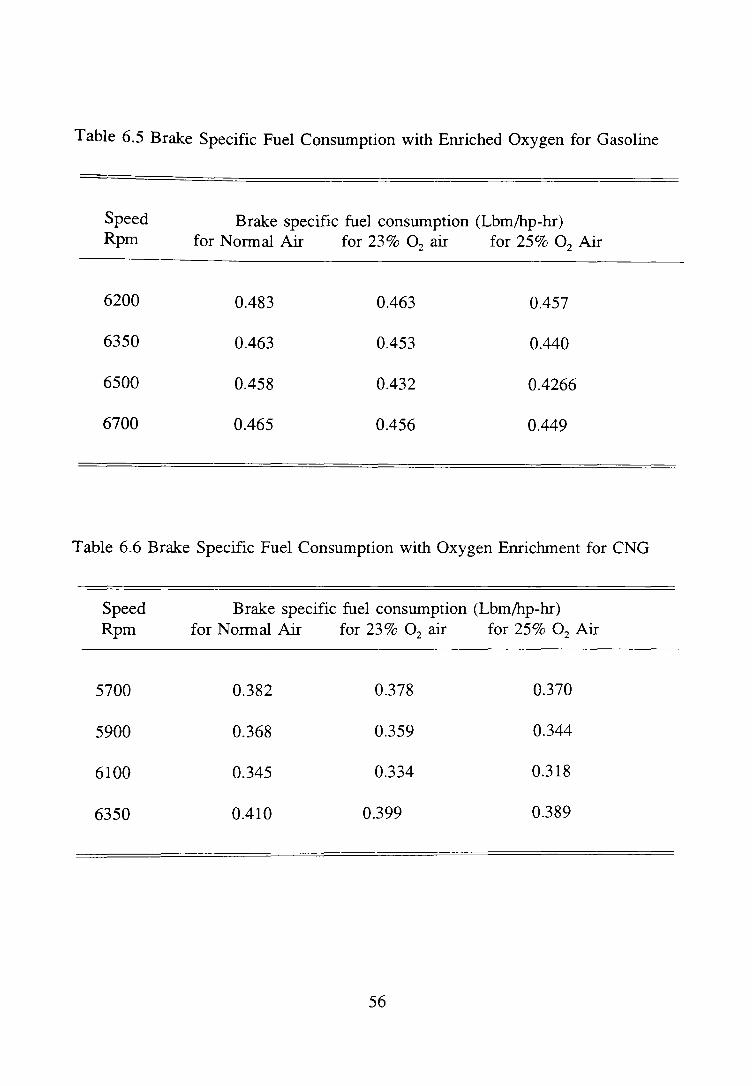
Table 6.5 Brake Specific Fuel Consumption with Enriched Oxygen for Gasoline
Speed Rpm
6200
6350
6500
6700
Brake specific fuel consumption (Lbm/hp-hr) for Normal Air for 23% 0 2 air for 25% 0 2 Air
0.483 0.463 0.457
0.463 0.453 0.440
0.458 0.432 0.4266
0.465 0.456 0.449
Table 6.6 Brake Specific Fuel Consumption with Oxygen Enrichment for CNG
Speed Rpm
5700
5900
6100
6350
Brake specific fuel consumption (Lbm/hp-hr) for Normal Air for 23% 0 2 air for 25% 0 2 Air
0.382 0.378 0.370
0.368 0.359 0.344
0.345 0.334 0.318
0.410 0.399 0.389
56
Although the fuel flowrate increased with increased oxygen percentage, the brake
specific fuel consumption (BSFC) decreased with increased oxygen emichment, which
in tum gave the higher thermal conversion efficiency. This is attributed to increased
combustion with increased oxygen in the intake air. Figures 6.7 through 6.10 show
the plots of B SFC and fuel conversion efficiency for gasoline and natural gas.
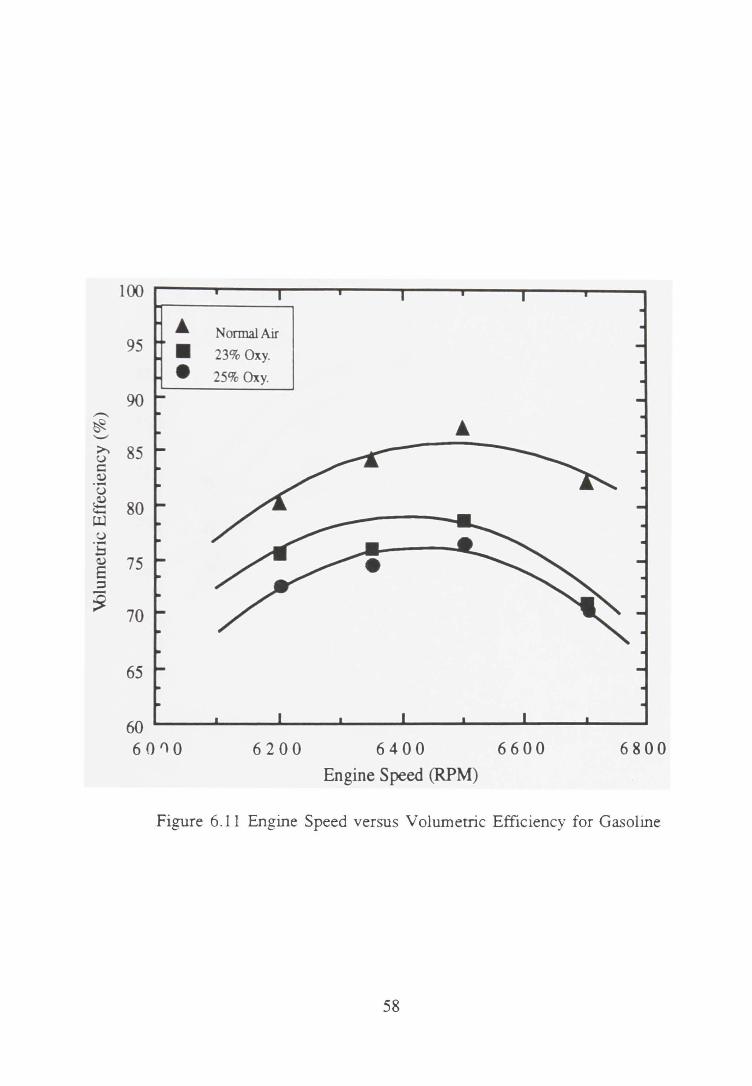
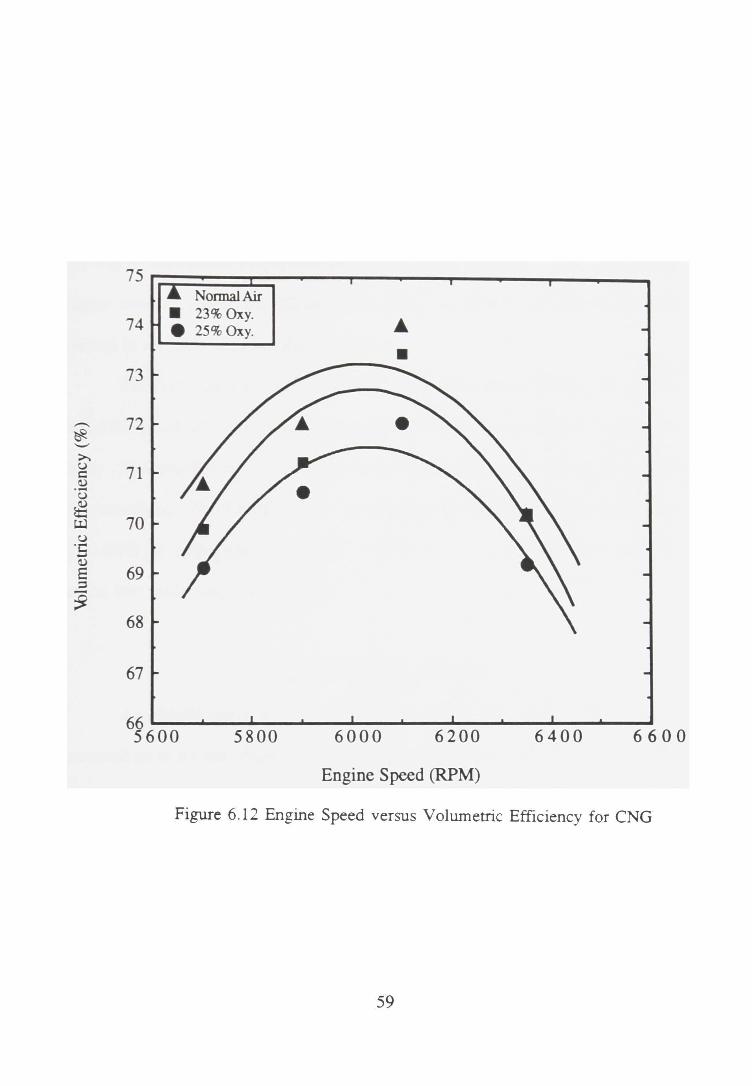
Volumetric Efficiency
Introducing additional oxygen in the intake charge of the engine reduced the
volumetric efficiency considerably. The reason is that the density of the entering air
decreased due the hotter inlet port and combustion chamber walls. Theoretical
calculations show that the amount of air required for combustion is decreased by 9%-
190C with oxygen emiclunent. Theoretical calculation of air requirement for complete
combustion of one kg. of fuel is shown in Appendix B. A reduction in volumetric
efficiency is about 9%-11% for gasoline and 1%-2% for natural gas was experienced.
Figures 6.11 and 6.12 show volumetric efficiencies for gasoline and natural gas,
respectively.
57
100
• Normal Air 95 • 23% Oxy .
• 25% Oxy.
90 ....-_
~ ...._, >. 85 u c ~ ·-u ~ ~ 80 UJ u ·-b ~ 75 a = -~ 70
65
60 ~--_. ____ _. ____ ~--------------------------60')0 6200 6400 6600 6800
Engine Speed (RPM)
Figure 6.11 Engine Speed versus Volumetric Efficiency for Gasoline
58
75 Normal Air
• 23% Oxy. • 74 e 25%0xy.
• 73
-- 72 ~ .._.. >. u 71 c:: 0 ·-u
~ 70 tJ.)
u ·c: .... 0 E 69 :l
:9 68
67
5800 6000 6200 6400 6600
Engine Speed (RPM)
Figure 6.12 Engine Speed versus Volumetric Efficiency for CNG
59
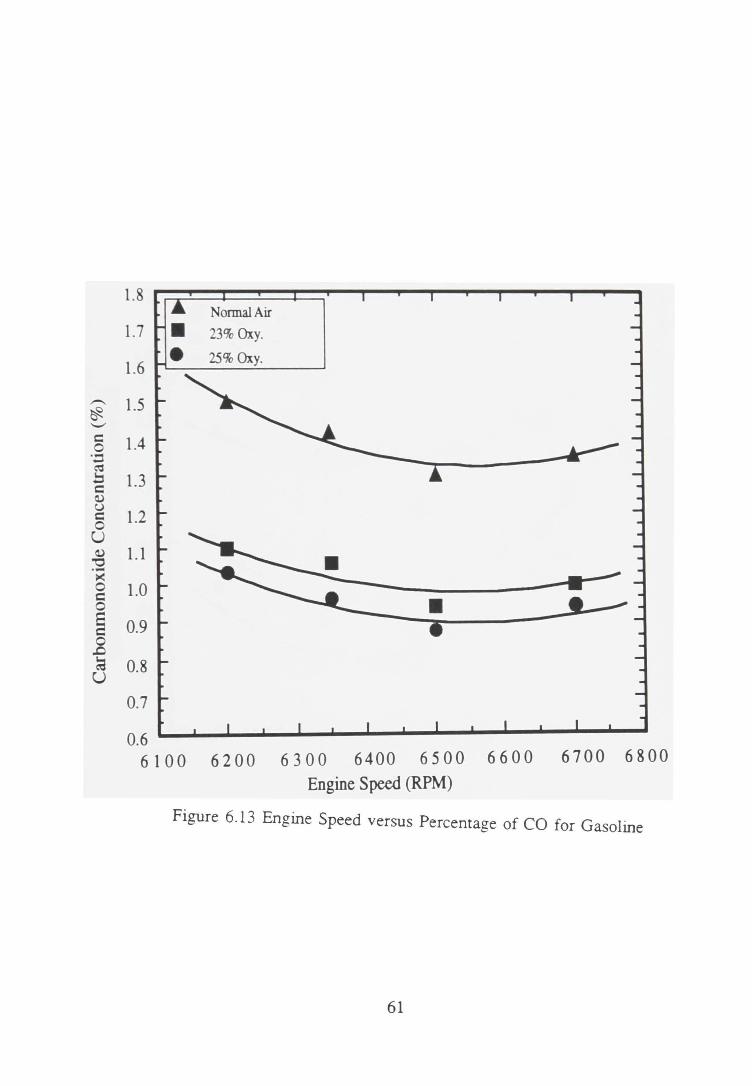
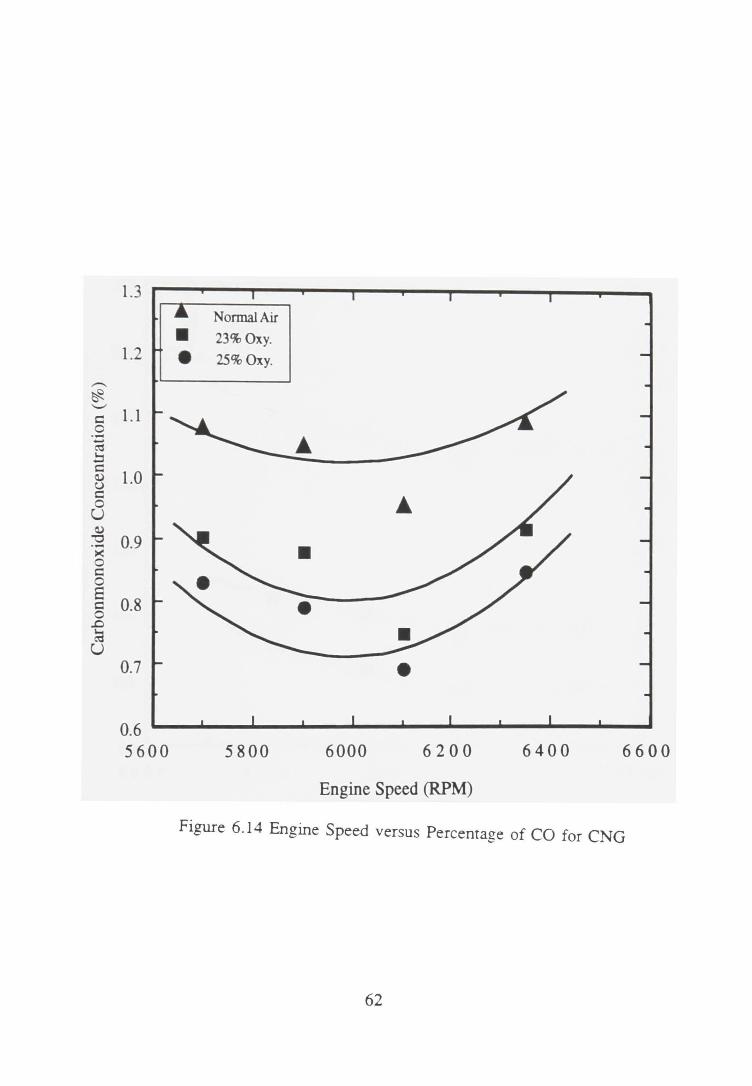
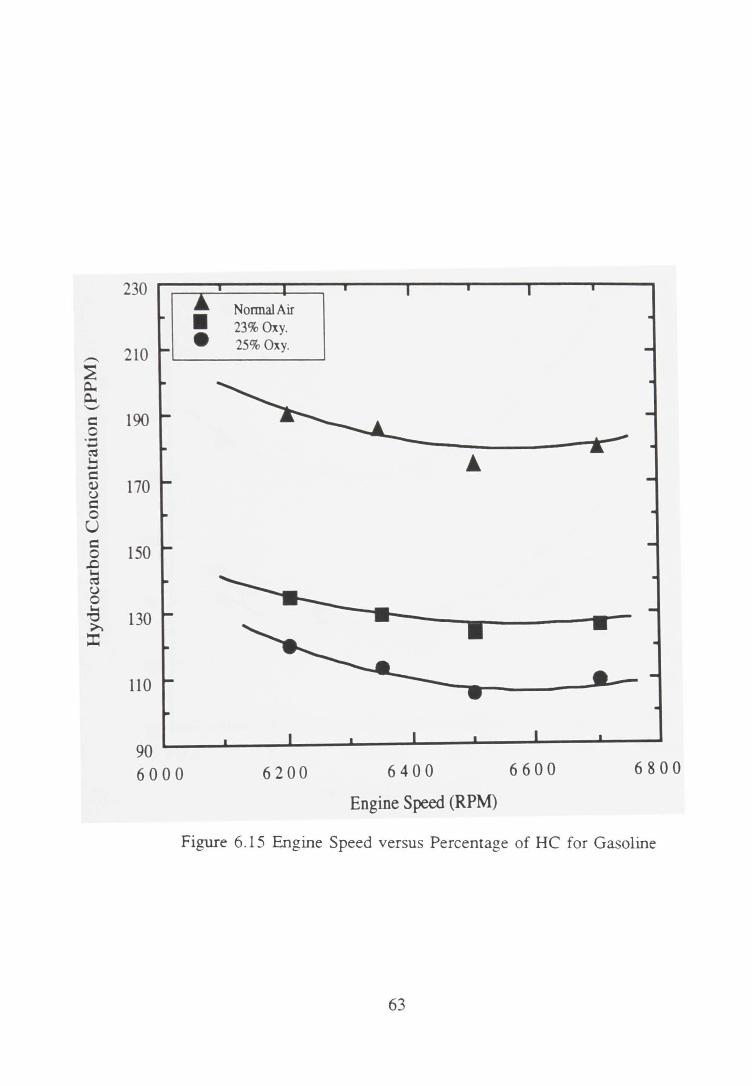
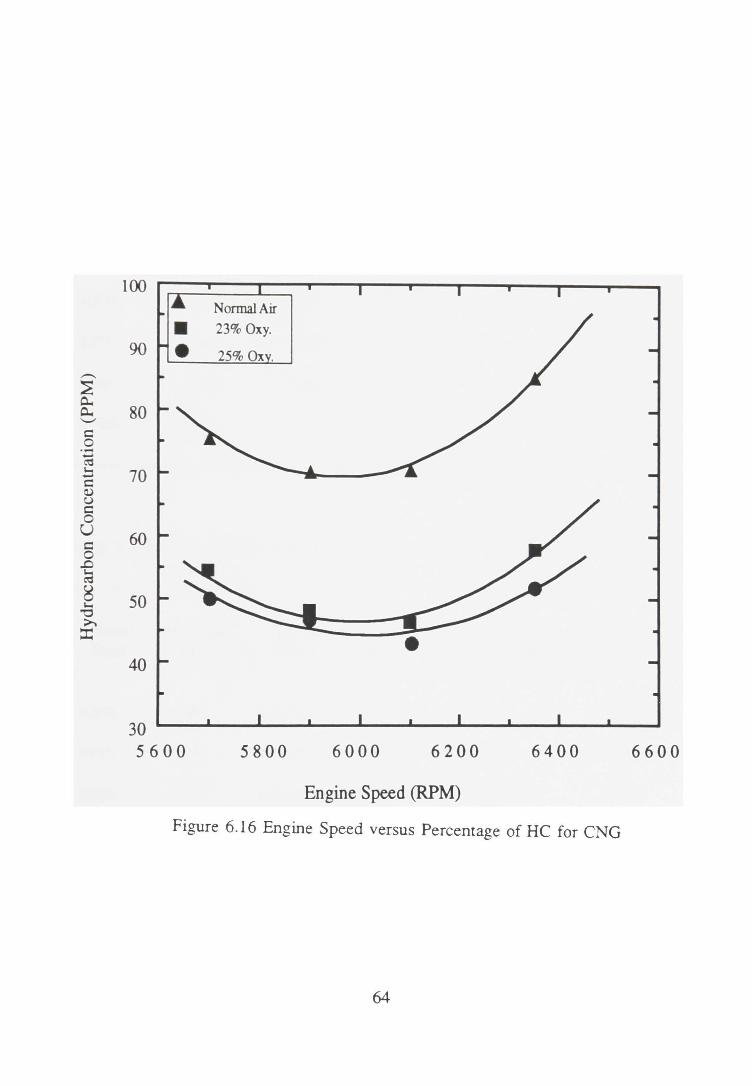
Exhaust Emissions
The effect of oxygen enrichment on exhaust gas emissions is shown in Figures
6.13 through 6.1b. The drop in both CO and HC emissions with excess oxygen in the
intake charge was expected. This can be attributed to the increased combustion with
the higher combustion temperature and higher oxygen fraction. In the presence of
higher oxygen content, the CO oxidized to C02 and HC reacted with oxygen and
burned in the latter stages of the combustion.
Tables 6.5 through 6.8 give the percentage reduction in CO and HC at 23%
and 25lff of oxygen in the intake charge for both gasoline and natural gas used as
fuels. The reduction in CO was approximately 24%-32% for gasoline and 16%-27%
for natural gas. The reduction in HC was approximately 29%-40% for gasoline and
26o/c-38% for natural gas. The highest reduction in exhaust emissions was observed
at the best performance of the engine.
Test Results with Gas Separator
An attempt was made to use the membrane gas separator to supply oxygen
enriched air to the test engine. Up to 50% pure oxygen enriched air was supplied by
the gas separator. This enriched air was mixed with atmospheric air to increase the
percentage of oxygen in the intake charge. The fmal oxygen percentage was varied
between 22% and 23%. The results obtained is shown in the Tables 6.11 through
6.16. Although the power increase is meager, the reduction in CO and HC is close
60
1.8 Normal Air
1.7 • 23% Oxy .
1.6 • 25% Oxy.
,-.., 1.5 ~ '-" c 1.4 0 ·~ ~ b 1.3 c 0) u
1.2 c 0 u 0) 1.1 "0 ·->< 0 1.0 • c 0
§ 0 ~
~ u
6200 6300 6400 6500 6600 6700 6800
Engine Speed (RPM)
Figure 6.13 Engine Speed versus Percentage of CO for Gasoline
61
1.3
• 1.2 • 25%0xy .
........ ~ '-" c 1.1 0 ·-...... ~ !:I c
1.0 d) u c 0 u d)
'"0 0.9 ·->< 0 c 0 8
0.8 c 0 .0 a u
0.7 • 5800 6000 6200 6400 6600
Engine Speed (RPM)
Figure 6.14 Engine Speed versus Percentage of CO for CNG
62
..-. ~ ~ ~ .._ c 0 ·-..... ~ """ ..... c d) u c 0 u c 0 .D ~ u 0
-i3 ~
:I:
230
210
190
170
150
130
110
90 6000
• Normal Air 23% Oxy . • 25% Oxy.
6200 6400 6600 6800
Engine Speed (RPM)
Figure 6.15 Engine Speed versus Percentage of HC for Gasoline
63
......... ~ 0.. 0.. ..._, c 0 ·-..... Cd tl c a,) u c 0 u c 0 .0 ~ g '""' "0 >.
::I:
100
90
80
70
60
50
40
30 5600
Normal Air 23% Oxy.
25% Ox .
5800 6000 6200 6400
Engine Speed (RPM)
Figure 6.16 Engine Speed versus Percentage of HC for CNG
64
6600
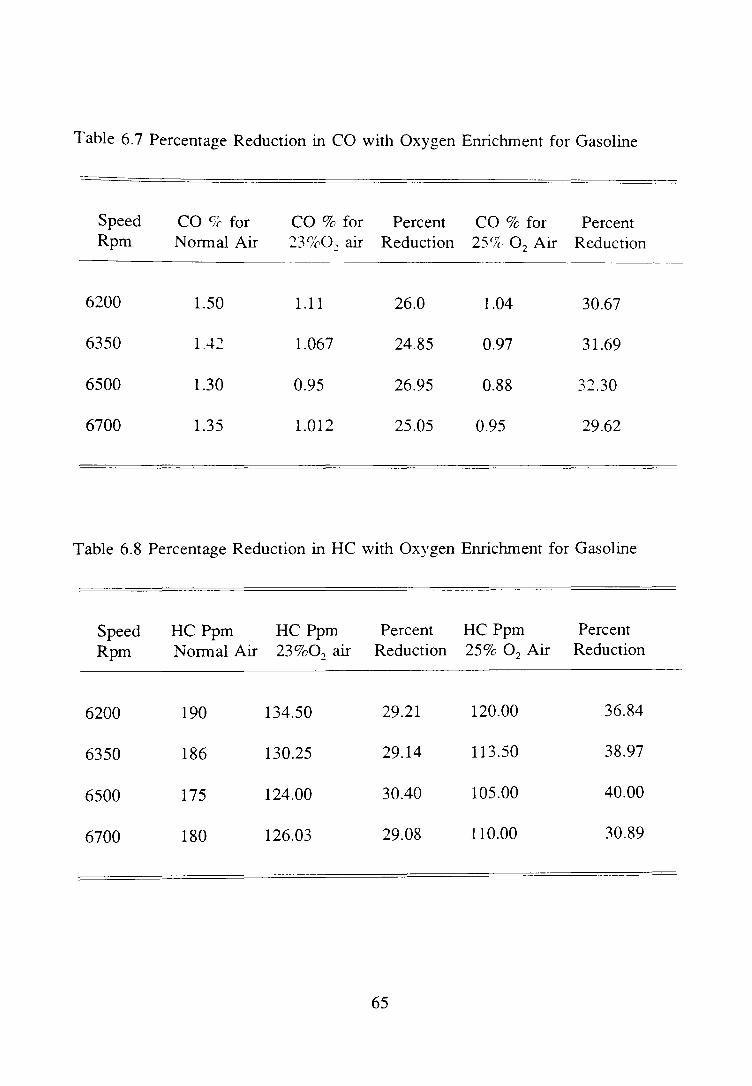
Table 6.7 Percentage Reduction in CO with Oxygen Enrichment for Gasoline
Speed Rpm
6200
6350
6500
6700
CO <J( for Normal Air
1.50
1.42
1.30
1.35
CO % for Percent CO % for Percent ::?J(7r0, air Reduction 25(7c 0 2 Air Reduction
1.11 26.0 1.04 30.67
1.067 24.85 0.97 31.69
0.95 26.95 0.88 32.30
1.012 25.05 0.95 29.62
Table 6.8 Percentage Reduction in HC with Oxygen Enrichment for Gasoline
Speed Rpm
6200
6350
6500
6700
HC Ppm HC Ppm Normal Air 23%02 air
190 134.50
186 130.25
175 124.00
180 126.03
Percent Reduction
29.21
29.14
30.40
29.08
65
HCPpm 25% 0 2 Air
120.00
113.50
105.00
110.00
Percent Reduction
36.84
38.97
40.00
30.89
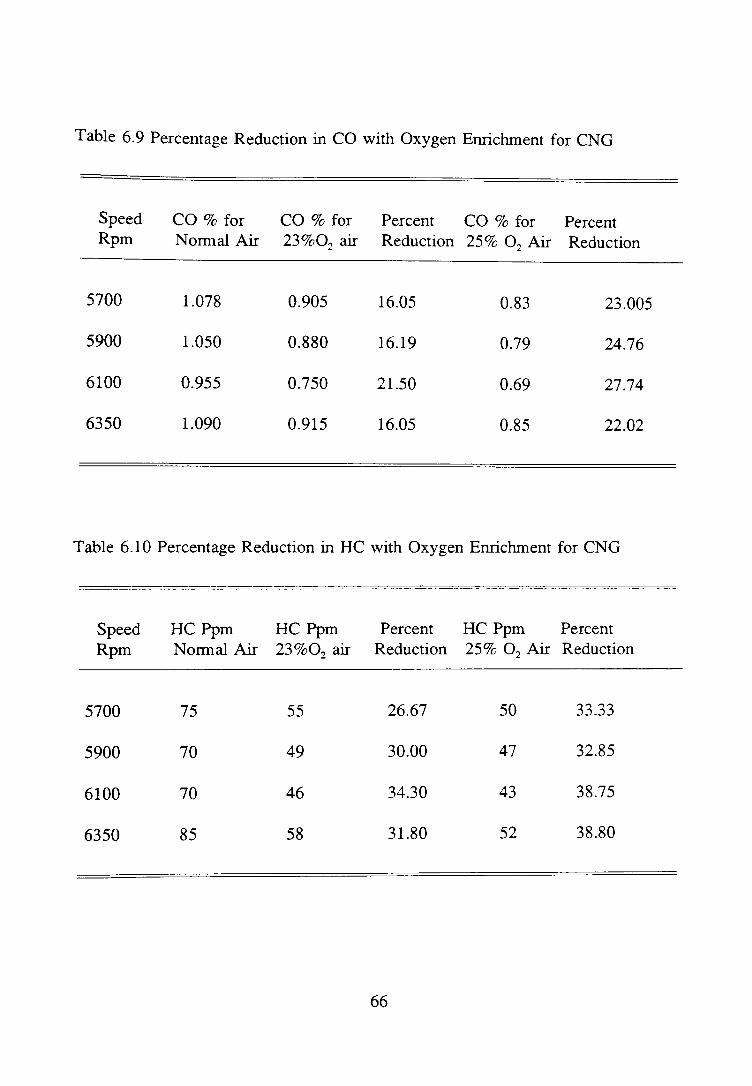
Table 6.9 Percentage Reduction in CO with Oxygen Enrichment for CNG
Speed Rpm
5700
5900
6100
6350
CO% for Normal Air
1.078
1.050
0.955
1.090
CO% for 23%02 air
0.905
0.880
0.750
0.915
Percent CO % for Reduction 25% 0 2 Air
16.05 0.83
16.19 0.79
21.50 0.69
16.05 0.85
Percent Reduction
23.005
24.76
27.74
22.02
Table 6.10 Percentage Reduction in HC with Oxygen Enrichment for CNG
Speed Rpm
5700
5900
6100
6350
HC Ppm HC Ppm Normal Air 23%02 air
75 55
70 49
70 46
85 58
Percent Reduction
26.67
30.00
34.30
31.80
66
HC Ppm Percent 25% 0 2 Air Reduction
50 33.33
47 32.85
43 38.75
52 38.80
to reduction in CO and HC at 23o/r oxygen. This is due to variation in percentage of
oxygen in the intake for every working cycle of the engine.
The increase in power output due to oxygen enriched air can be utilized to run
the air compressor to feed air through the gas separator at some higher pressure. The
Advances in membrane separation technology permit upto 98% of the feed air to be
recovered at higher oxygen content than in ambient air. Approximately 21 - 26
SCFM of air is required as feed to the membrane gas separator to obtain 20 - 25
SCFM of 23o/c oxygen enriched air. Twenty- 25 SCFM 23% of oxygen enriched air
was required to run the test engine used in this research project at wide open throttle.
In addition to increased in power output at 23% oxygen enriched air, additional 1 HP
is needed to compress 21 - 26 SCFM of air at 50 psi. This estimation is based on
approximate design parameters of an air compressor.
67
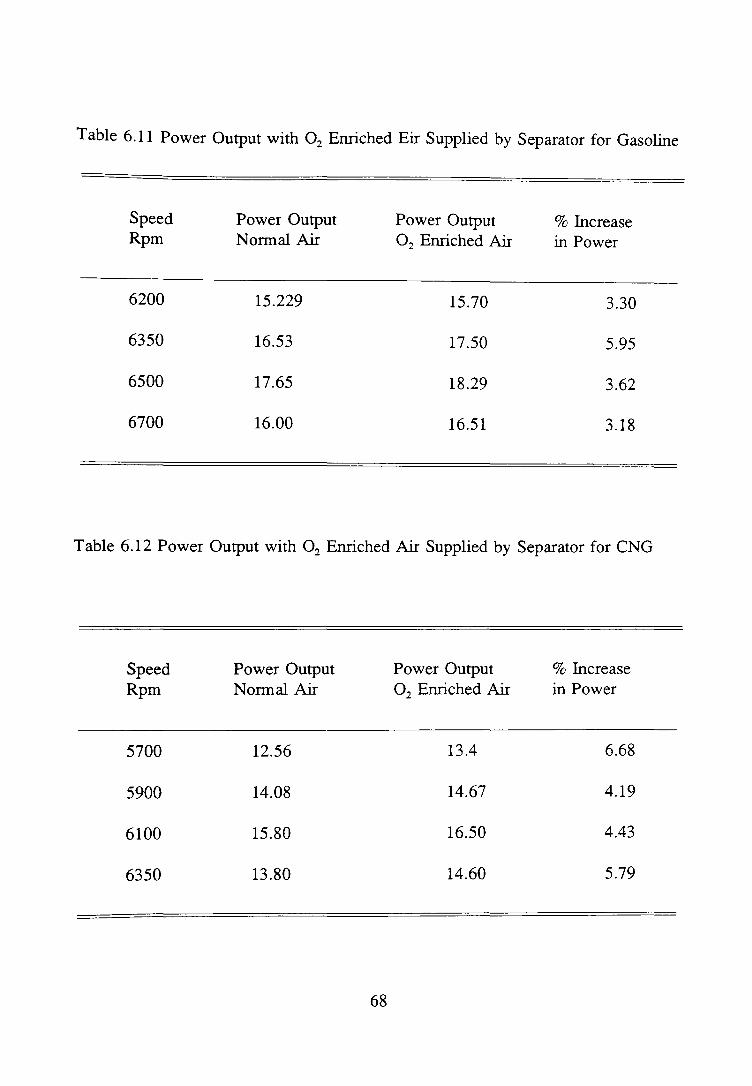
Table 6.11 Power Output with 0 2 Enriched Eir Supplied by Separator for Gasoline
Speed Rpm
6200
6350
6500
6700
Power Output Normal Air
15.229
16.53
17.65
16.00
Power Output 0 2 Enriched Air
15.70
17.50
18.29
16.51
%Increase in Power
3.30
5.95
3.62
3.18
Table 6.12 Power Output with 0 2 Enriched Air Supplied by Separator for CNG
Speed Rpm
5700
5900
6100
6350
Power Output Normal Air
12.56
14.08
15.80
13.80
68
Power Output 0 2 Enriched Air
13.4
14.67
16.50
14.60
%Increase in Power
6.68
4.19
4.43
5.79
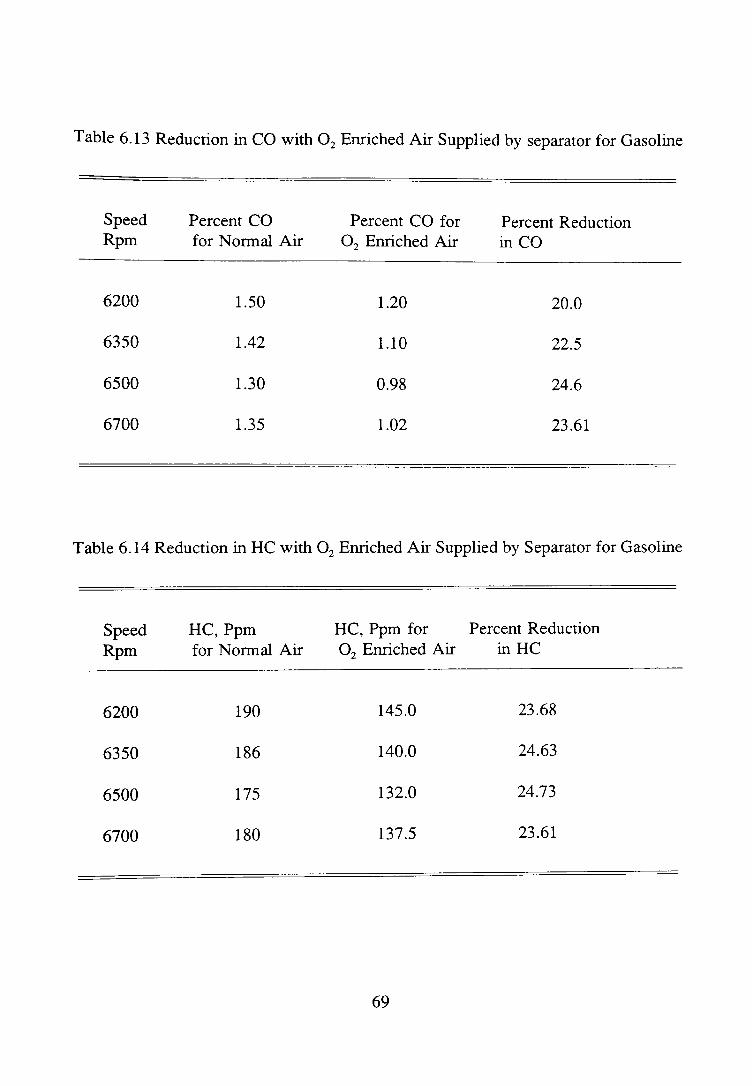
Table 6.13 Reduction in CO with 0 2 Enriched Air Supplied by separator for Gasoline
Speed Rpm
6200
6350
6500
6700
Percent CO for Normal Air
1.50
1.42
1.30
1.35
Percent CO for 0 2 Enriched Air
1.20
1.10
0.98
1.02
Percent Reduction in co
20.0
22.5
24.6
23.61
Table 6.14 Reduction in HC with 0 2 Enriched Air Supplied by Separator for Gasoline
Speed Rpm
6200
6350
6500
6700
HC, Ppm for Normal Air
190
186
175
180
HC, Ppm for 0 2 Enriched Air
145.0
140.0
132.0
137.5
69
Percent Reduction in HC
23.68
24.63
24.73
23.61
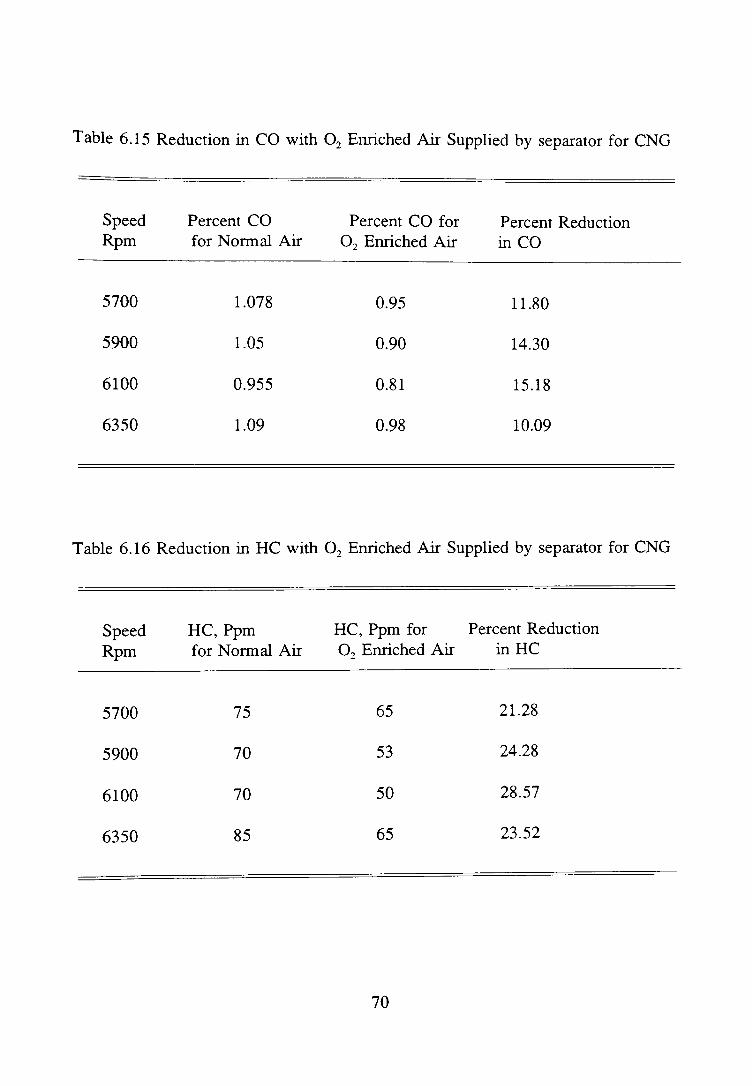
Table 6.15 Reduction in CO with 0 2 Enriched Air Supplied by separator for CNG
Speed Rpm
5700
5900
6100
6350
Percent CO for Normal Air
1.078
1.05
0.955
1.09
Percent CO for 0 2 Enriched Air
0.95
0.90
0.81
0.98
Percent Reduction in co
11.80
14.30
15.18
10.09
Table 6.16 Reduction in HC with 0 2 Enriched Air Supplied by separator for CNG
Speed Rpm
5700
5900
6100
6350
HC, Ppm for Normal Air
75
70
70
85
HC, Ppm for 0 2 Enriched Air
65
53
50
65
70
Percent Reduction in HC
21.28
24.28
28.57
23.52
CHAPTER VII
CONCLUSIONS
Conclusions
This research was undertaken to test the performance and emissions of a spark
ignition engine fueled by both liquid and gaseous fuel using oxygen enriched air. An
attempt was made to examine the practicability of using a membrane gas separator to
supply oxygen enriched air. The results of oxygen enrichment experiments lead to
the following conclusions:
1. An increased in engine power output. The use of natural gas in S.I. engines
results m reduced volumetric efficiency due to displacement of air in the intake
manifold. The results from the experiment indicate that oxygen enrichment can be
used to increase the power output of an engine fueled by natural gas to levels equal
to or higher than that achieved using air/gasoline mixtures. The increase in power
output may also be utilized to provide the some of the benefits of a supercharger or
turbocharger at higher altitudes.
2. Substantial reduction in CO and HC were achieved. This is one of the most
important benefits of the oxygen enriclunent .
3. An improvement in thermal conversion efficiency.
4. Increased exhaust temperatures, reduced combustion noise, constant fuel
economy, and decreased volumetric efficiency were also observed.
5. In addition to the above effects, the formation of NOx should also increase
71
with increased oxygen percentage. This is because the NOx formation is
increased at higher temperatures. This could possibly be offset by increased EGR.
\Vith current and future developments in the area of air separation technology and
development of ceramics for automotive engines, it should be possible to use oxygen
enrichment in the near future.
Suggestions for Future Research
In this study. the effect of oxygen enrichment was not tested for compression
ignition engines. Similar tests can be conducted to test the performance of
compression ignition engines as well as multi cylinder engines. It is suggested that
the testing of oxygen enrichment with low grade fuels may yield useful information
for possible use in automobiles. Further research can be carried out with gas
separators. Depending on the success in the laboratory, the device could be installed
in a vehicle and tested.
72
1.
4.
5.
6.
7.
8.
9.
10.
11.
REFERENCES
Jamil Ghojel and John C. Hillard, "Effect of Oxygen Enrichment on the Performance and Emissions of l.D.I Diesel engines," Paper# 830245, Society of Automotive Engineers, 1983.
"Marks Standard Hand-Book for Mechanical Engineers," McGraw-Hill Publishing Company. New York, 1992.
C.F. Taylor, "The Internal Combustion Engines in Theory and Practice," Vol. II, The M.I.T. Press, Massachusetts, 1979.
D.J. Patterson, :1\.A. Henein, "Emissions from Combustion Engines and Their Control," Ann Arbor Science Publishers Inc. Ann Arbor, 1972.
John B. Heywood, "Internal-Combustion Engine Fundamentals," McGraw-Hill Publishing Company, New York, 1988.
Thorbjorn Johannessen, "Operational Experince with Nitrogen Generation Through Membrane Seperation," Maritime Projections, Oslo, Norway, 1986.
G.A. Karim and G. Ward," The examination of the Combustion Process in a C.I. Engines by Changing the Partial Pressure of Oxygen in the Intake Charge," Paper# 680767, Society of Automotive Engineers, 1968.
T.Kadota and H. Hiroyasu, " Soot Formation by a Combustion of a Fuel Droplet in High Pressuere Gaseous Environments," Journal of Combustion and Flame, Vol. 29, 67-75, 1977.
H. Tsunemoto and Hironi, " The Role of Oxygen in the Intake and Exhaust on Emissions, and Smoke and BMEP of a Diesel Engine with EGR system," Paper # 800030, Society of Automotive Engineers, 1980.
S.L. Plee and T. Ahmed," Efeects of Flame Temperature and Air-Fuel Mixing on Emission of Particulate Carbon from a Divided-Chamber Diesel Engine," G.M. Symposium, Michigan, 1987.
R.C. Yu and S.M. Shahed, " Effects of Injection Timing and Exhaust Gas Recirculation on Emissins from a D.I.Diesel Engine," Paper# 811234, Society
73
of Automotive Engineers, 1981.
12. A.A. Quader and Wartenbee, "Exhaust Emissions and Performance of a Spark Ignition Engine Using Oxygen Enriched Intake Air," Fuels and Lubricants Department, General Motors Laboratories, Warren, Michigan, 1978.
13. B. Detuncq and J. Williams, " Performance of a Spark Ignitioon Engine Fueled by Natural Gas Using Oxygen Enriched Air," International Fuels and Lubricants Meeting Exposition, Portland, Oregon, 1988.
14. " Instructional Manual for Meriam Laminar Flowmeter."
15. Edger E. Ambrosius, " Mechanical Measurement and Instrumentation," McGraw-Hill Book Publishing Company, New York, 1963.
74
APPENDIX A: BASIC COMPUTATIONS
The following set of equations were used to calculate the ensuing parameters.
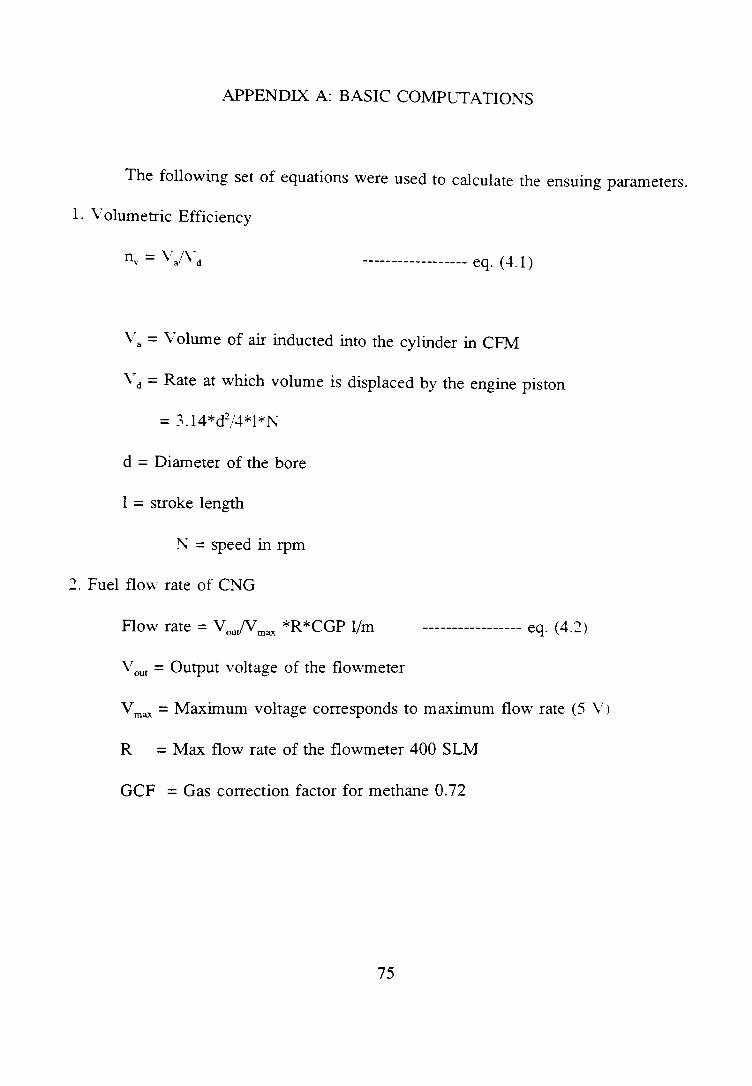
1. Volumetric Efficiency
------------------ eq. ( ·-l.l)
Va = Volume of air inducted into the cylinder in CFM
V d = Rate at which volume is displaced by the engine piston
d = Diameter of the bore
1 = stroke length
!\ = speed in rpm
2. Fuel flow rate of CNG
Flow rate = V ou/V max *R *CGP l/m ----------------- eq. ( 4.2)
V = Output voltage of the flowmeter out
V =Maximum voltaae corresponds to maximum flow rate (5 V) max o
R = Max flow rate of the flowmeter 400 SLM
GCF = Gas correction factor for methane 0.72
75
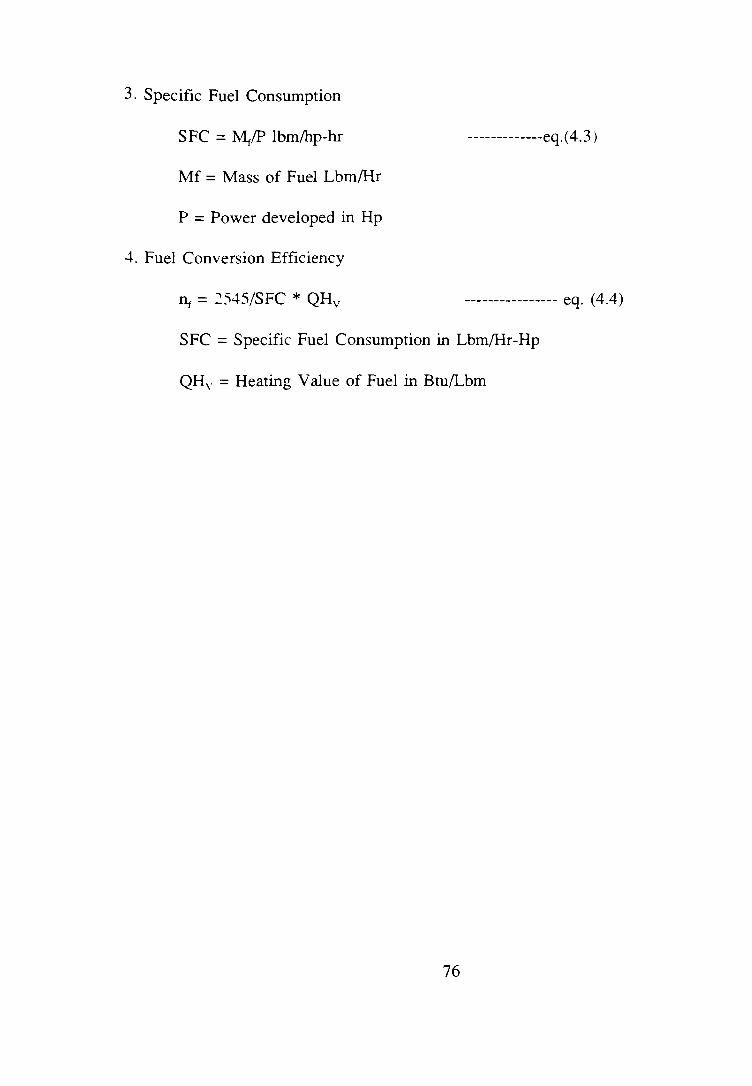
3. Specific Fuel Consumption
SFC = ~/P lbm/hp-hr
Mf = Mass of Fuel Lbm/Hr
P = Power developed in Hp
-+. Fuel Conversion Efficiency
11t = 2545/SFC * QHv
-------------eq.(4.3)
---------------- eq. ( 4.4)
SFC = Specific Fuel Consumption in Lbm/Hr-Hp
QH\. = Heating Value of Fuel in Btu/Lbm
76
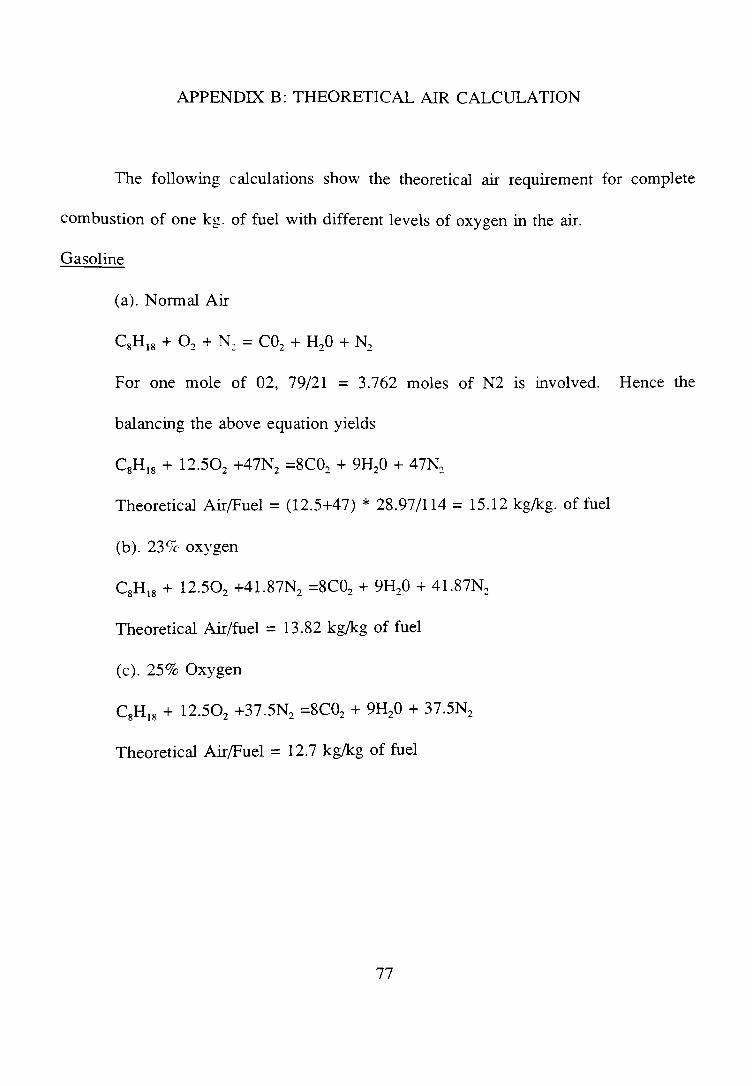
APPENDIX B: THEORETICAL AIR CALCULATION
The following calculations show the theoretical air requirement for complete
combustion of one kg. of fuel with different levels of oxygen in the air.
Gasoline
(a). Normal Air
C8H18 + 0 2 + N 2 = C02 + H20 + N2
For one mole of 02, 79/21 = 3.762 moles of N2 1s involved. Hence the
balancing the above equation yields
C8H18 + 12.502 +47N2 =8C02 + 9H20 + 47N2
Theoretical Air/Fuel= (12.5+47) * 28.97/114 = 15.12 kg/kg. of fuel
(b). 23o/c oxygen
C8H18 + 12.502 +41.87N2 =8C02 + 9H20 + 41.87N2
Theoretical Air/fuel = 13.82 kg/kg of fuel
(c). 25% Oxygen
C8H18 + 12.502 +37.5N2 =8C02 + 9H20 + 37.5N2
Theoretical Air/Fuel = 12.7 kg/kg of fuel
77
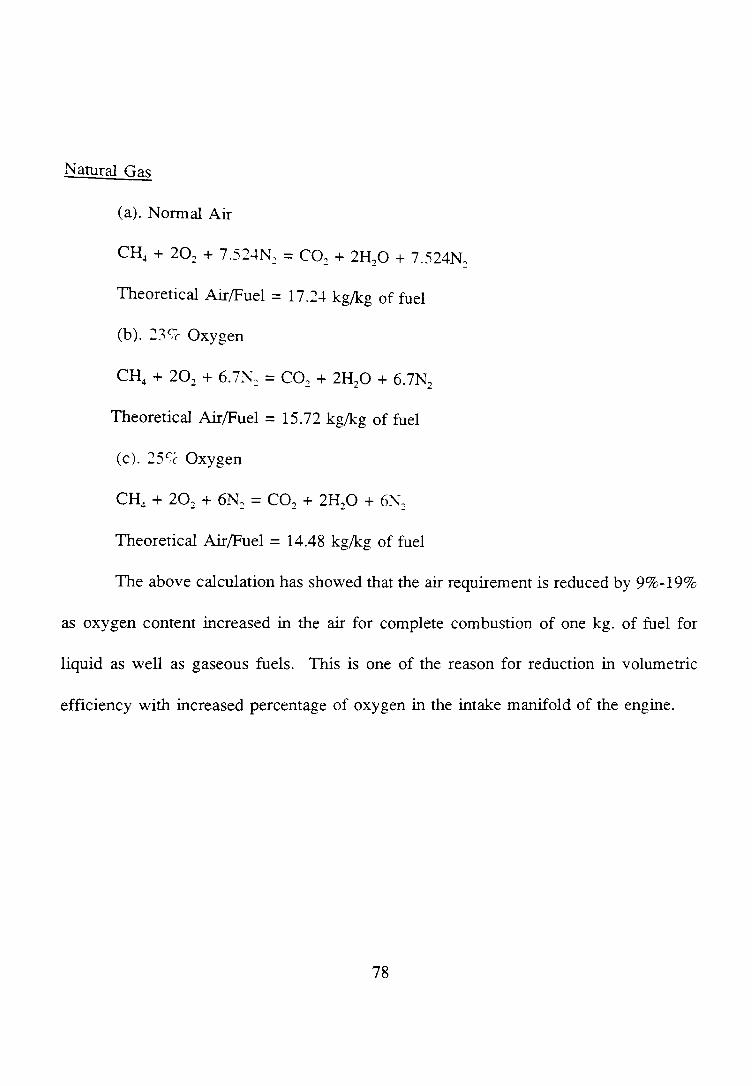
Natural Gas
(a). Normal Air
CH4 + 202 + 7.524N: = C02 + 2H20 + 7.524N2
Theoretical Air/Fuel = 17.24 kg/kg of fuel
(b). 23!ic Oxygen
CH4 + 202 + 6.71\: = C02 + 2H20 + 6.7N2
Theoretical Air/Fuel = 15.72 kg/kg of fuel
(c). 25l!C Oxygen
CH4 + 202 + 6N2 = C02 + 2H20 + 6N2
Theoretical Air/Fuel = 14.48 kg/kg of fuel
The above calculation has showed that the air requirement is reduced by 9%-19%
as oxygen content increased in the air for complete combustion of one kg. of fuel for
liquid as well as gaseous fuels. This is one of the reason for reduction in volumetric
efficiency with increased percentage of oxygen in the intake manifold of the engine.
78