Embed Size (px)
Citation preview
A QUEEN’S UNIVERSITY IRC ARCHIVE DOCUMENT Originally published by the IRC Press in 1988 in the School of Industrial Relations Research Essay Series No. 16
Union Organizing Activity in Ontario, 1970-1986
Dan Keon
Industrial Relations Centre (IRC) School of Policy Studies Queen’s University Kingston, ON K7L 3N6
Tel: 613-533-6628 Fax: 613-533-6812 Email: [email protected] Visit us at: irc.queensu.ca
ISBN: 0-88886-183-4 ©1988 Queen’s University IRC Printed and bound in Canada
Industrial Relations Centre Queen's University Kingston, Ontario Canada K7L 3N6
Canadian Cataloguing in Publication Data
Keon, Daniel John, 1955- Union organizing activity in Ontario, 1970-1986
(School of Industrial Relations research essay series; 16)
Bibliography: p. ISBN 0-88886-183-4
1. Trade-unions - Ontario - Organizing - History. I. Queen's University (Kingston, Ont.). Industrial Relations Centre. II. Title. III. Series.
HD6490.07K43 1987 331.88'09713 C88-093063-2
1
TABLE OF CONTENTS FOREWORD ................................................................................................................................................ 2
ABSTRACT .................................................................................................................................................. 3
INTRODUCTION ........................................................................................................................................ 4
CHAPTER ONE: The Canadian Labour Movement in the 1980s ............................................................... 6
CHAPTER TWO: Union Organizing Activity in Ontario, 1970-1986 ....................................................... 15
Certifications ........................................................................................................................................... 18
Decertifications ....................................................................................................................................... 23
Certification Elections ............................................................................................................................ 25
Certifications and Total Union Membership in Ontario ......................................................................... 27
Certifications: Industry Distribution ....................................................................................................... 29
Certifications: Union Distribution .......................................................................................................... 35
Certifications: Bargaining Unit Size ....................................................................................................... 36
Certifications: Occupation and Status Distribution................................................................................. 38
SUMMARY AND CONCLUSION............................................................................................................ 45
BIBLIOGRAPHY ....................................................................................................................................... 47
2
FOREWORD
The Industrial Relations Centre is pleased to include this study, Union Organizing Activity in Ontario, 1970-1986 in its publication series School of Industrial. Relations Research Essay Series. The series is intended to give wider circulation to selected student research essays, chosen for both their academic merit and their interest to industrial relations practitioners and policy makers.
A substantial research essay is a major requirement of the Master's Program in Industrial Relations at Queen's. The essay may be an evaluation of a policy oriented issue; a limited empirical project; or a critical analysis of theory, policy, or the related literature in a particular area of industrial relations.
The author of the essay, Dan Keon, graduated from the School of Industrial Relations in October 1987.
I would like to express my appreciation to the author for granting permission to publish this excellent study.
D.D. Carter, Director Industrial Relations Centre and School of Industrial Relations Queen's University February 1988
3
ABSTRACT
The Canadian labour movement entered the 1980s in a state of great uncertainty. Following almost forty years of steady uninterrupted growth the union movement in Canada experienced in the early 1980s losses in the total number of union members. Although these losses in the absolute number of union members were recouped in the mid-1980s, the proportion of nonagricultural paid workers who are union members dropped from 1983 to 1986 to a level that had been achieved in the mid-1970s. This important indicator of union strength seemed to confirm much speculation about the stagnation or perhaps decline of the union movement in Canada.
Another critical indicator of the condition of the labour movement in Canada is the level and composition of new organizing activity that is conducted. In order to be vibrant and to maintain past levels of strength the union movement must successfully recruit new members into the union fold. The purpose of this study is to examine the labour movement's performance in this critical work in Ontario, the province of Canada with the largest number of union members.
The method of analysis in this study is statistical. Aggregate data on the number of certifications and decertifications granted by the Ontario Labour Relations Board in the years 1970-1986 has been compiled into series tables. These tables are the primary source for analyzing the union movement's organizing activity in Ontario in the past two decades. They also provide a new perspective from which to assess the condition of the Canadian labour movement in the 1980s.
4
INTRODUCTION
The state of the Canadian labour movement in the 1980s is more uncertain than it has been since the 1940s. For nearly four decades following World War II the labour movement in Canada posted regular gains in both the total number of union members and in union density - the proportion of non-agricultural paid workers who are union members. In Canada union density rose from 16.3 per cent in 1940 to an all-time high of 40 per cent in 1983. In these four decades Canadian workers watched their unions become firmly integrated into Canadian society. By the beginning of the 1980s, however, there were signs of stagnation and even decline in the union movement in Canada. In the period 1982-83 total union membership fell by more than 50,000, from 3,617,000 in 1982 to 3,563,000 in 1983. This was the first time in four decades that the total number of union members in the country declined, and it dropped by 1.5 per cent (Kumar 1986, 96). This loss in total union membership was recouped in the period 198386, but union density continued to decline in these years from 40 per cent in 1983 to 37.7 per cent in 1986. The union density figures very clearly underscore the reverse in union fortunes in the 1980s.
In order for unions to be vibrant in the 1980s and to maintain the level of strength that had been achieved in the 1970s, most union observers agree that new union organizing is imperative. New organizing activity will be one method by which the labour movement may offset the losses in union membership in the 1980s which were a consequence of a difficult and changing economic environment, growing employer resistance to unionism, the apathy toward unions of many new entrants to the labour market, and perhaps also of changes in public policy. The labour movement must replenish the union fold by organizing some of the large sector of unorganized workers in Canada if it to regain and maintain its previous level of strength. This study will examine the performance of the labour movement in organizing new workers in Ontario.
The purpose of this study is to examine union organizing activity in Ontario in the years 1970 to 1986, as measured by the aggregate statistics for certifications granted by the Ontario Labour Relations Board (OLRB). This study also will survey the aggregate statistics for decertifications granted by the OLRB in the years 1970-86. A provincial focus has been selected over a national because it allows for a much more detailed investigation of the trends in this important area of union organizing activity. Many of the most interesting and significant statistics on the composition of the certifications granted in Ontario are not available for Canada as a whole because the collection of statistics on certifications and decertifications varies from province to province, and as a result the data is not strictly comparable. Ontario serves as a good case study of union organizing activity in Canada because it is the province with the largest number of union members. For example, in 1984 approximately one-third of the total number of union members in Canada lived in Ontario.
The parameters of the study were dictated by the data available from sources published by the Ontario Labour Relations Board and the Ontario Department (Ministry) of Labour. Both of these government agencies have published since the 1960s in their annual reports a variety of statistics about the number and composition of certifications and decertifications granted by the OLRB. The most complete set of statistics on certifications and decertifications in Ontario is for the period 1970-86, and hence the time parameters of the study. For this study the statistics published in these annual reports were collected and compiled into series tables for analysis of aggregate trends in certification and
5
decertification activity in Ontario. The tables are the primary source for examining union organizing activity in Ontario in the past two decades.
The organization of the paper is as follows. Chapter one reviews some of the current trends in the Canadian labour movement, and examines the "crisis" of the union movement in the 1980s. It also serves as a general background for chapter two and its detailed statistical analysis of certification and decertification activity in Ontario from 1970 to 1986. A brief third chapter summarizes the main themes of the study, and relates some conclusions about union organizing activity in Ontario in the past two decades to the current "crisis" in the Canadian labour movement.
6
CHAPTER ONE: The Canadian Labour Movement in the 1980s
The Canadian labour movement in the 1980s has been characterized by scholars, public commentators and union activists alike as being in a state of crisis and transition. If one phrase were able to summarize the expected direction the majority of commentators believe Canadian unions face in the 1980s it would be that the movement has entered the "era of uncertainty". The Canadian labour movement has entered the 1980s in a weakened state and at this time its future course is difficult to chart. In a recent interview (July 1987) Michael Link a lawyer associated with the Canadian Brotherhood of Railway Transport and General Workers (CBRTGW) surmised that: "Canadian labor is going through its most tumultuous period since the Great Depression" (Macleans 13 July 1987, 28). Similarly John Crispo, a professor of industrial relations and public policy at the University of Toronto, commented in the same article of July 1987 that: "In the past 20 years the position of labor (in Canada) has deteriorated fairly significantly, and in many respects the labor movement is in a shambles" (Macleans 13 July 1987, 31). Shirley Carr, president of the Canadian Labour Congress, and the individual who has been the chief spokesperson for the Canadian labour movement in the 1980s, observed in the summer of 1987 that: "There is no question that there is a right-wing antiunion swing coming up from the United States. In some instances, we are at the stage we were 30 years ago - fighting to hold onto what we have won since then or fighting to hold onto the union at all" (Macleans 13 July 1987, 30).
Throughout the 1980s Canadian publications from coast to coast carried reports and predictions of the decreasing strength of Canada's union movement. In many of the reports an uncertain or even ominous tone was struck in the speculations about organized labour's ability to recoup its short-term losses and forge ahead in the future. For example, Wilfred List, industrial relations writer with the Globe and Mail, in September 1983 wrote: "The challenges the trade union movement faces are the most formidable since the organizing campaigns of the 1930s and early 40s when unions battled their way to recognition across a wide sector of industry. But there is no sign unions have yet found a solution for the problems that beset them and that lie ahead" (Globe and Mail 3 September 1983, 4). Indeed, in Canadian journalism and scholarly writings about industrial relations in the 1980s no consensus or uniformity of viewpoint developed about how the Canadian labour movement would emerge from the tough times of the 1980s. The pressures impinging on the Canadian industrial relations system in the 1980s appeared to be flowing in many directions, and commentators were unsure which pressures would predominate and determine the future direction of the labour movement in Canada. Jack Weldon, a McGill University economics professor specializing in labour issues, in August 1983 offered this opinion: "I would not at all be surprised to see big changes in labor institutions over the next few years.... The unions are going to have to get out and hustle. They're going to have to do a lot more thinking about the structures of industry and about productivity" (Montreal Gazette 27 August 1983, A4). On the other hand, John Kervin, a sociologist at the University of Toronto's Centre for Industrial Relations, in 1983 expected a high degree of continuity in the future direction of the labour movement in Canada. Kervin predicted union fortunes in Canada would follow a U-shaped course in the 1980s, sliding into a trough during the recession of 1982-83, and rising again in the later years of the decade in response to the upswing in the economy and the renewed demands of workers for job security and protection against arbitrary action by employers (Globe and Mail 3 September 1983, 4). In a somewhat similar vein, Noah Meltz, director of the University of Toronto's Centre for Industrial Relations, suggested that the hardships of the 1982-83 recession may prompt an ever more highly educated workforce to take some form of collective action for future
7
protection when the economy rebounds (Globe and Mail 3 September 1983, 4). Whatever their predictions, commentators agreed that the 1980s were a major test of the Canadian labour movement's ability to adapt in times of adversity.
The sense of crisis enveloping the Canadian labour movement in part eminated from south of the border where dramatic changes also were occurring in the industrial relations system. Students of industrial relations familar with recent American literature in the field - with titles such as The Transformation of American Industrial Relations (1986) and Unions in Transition (1986)- are well aware that the industrial relations system and the labour movement in the United States are considered by many scholars to also be at a turning point, a crossroads, in the 1980s. However, although both the American and Canadian industrial relations systems appear now to be in a state of transition, few commentators familar with the two systems would suggest the alterations occurring in the Canadian system, and the "crisis" now facing the Canadian labour movement, are strictly comparable to the alterations which are underway in the American system and the "crisis" facing organized labour in the United States in the 1980s. The crises facing organized labour in North America in the 1980s, more than anything else, may underscore the fact that Canadian and American industrial relations systems are on divergent paths of development. It is worthwhile, then, before setting out the characteristics of the changed internal and external environment which is the "crisis" facing Canadian trade unions in the 1980s, to spend a few moments outlining the diverging paths of organized labour in Canada and the United States, and the different crossroads they are at. The nature of the Canadian labour movement's current difficulties in this way will be made clearer.
In their book The Transformation of American Industrial Relations (1986) authors Thomas Kochan, Harry Katz and Robert McKersie described clearly how fundamental is the alteration in American industrial relations that they believe is currently underway. The central argument of their book, and of many other writings that view American industrial relations in a state of transition, is that in the years from approximately the mid-1960s to the present, the system of collective bargaining which was firmly established during the New Deal era of Franklin D. Roosevelt's presidency, and made more secure during the period of union growth in the 1950s, has steadily been eroded. In the ensuing years union density has been declining from a peak in 1955, and the non-union sector of the American labour force has grown and continues to be burgeoning. The initiative for change in the American industrial relations system came from American employers who, it would appear, had never completely accepted the principles of collective bargaining and continually sought alternatives to the system (Kochan, Katz and McKersie 1986, 29-46). The economic down-turn of the late 1970s and 1980s facilitated these employers' efforts to find non-union alternatives to the collective bargaining system. Collective bargaining, with its twin characteristics of incremental wage increases and a seniority system, was the central feature of the American industrial relations system established during the New Deal era. The crisis and challenge American unions face in the 1980s is to retain these principal characteristics of the collective bargaining system against many employers' aggressive attacks on the union system, and in an economic environment that has pressured unions to accept pay concessions and work-rule modifications (Kochan, Katz and McKersie 1986, 144).
It was in the mid-1950s that American managers started to devise strategies for "union avoidance". Basically these strategies took one of two forms. First, there was the practice in American industry of shifting operations away from unionized sites to new plants in low labour-cost regions, particularly the south and subelt states. Many of these states were particularly attractive because of their “right to work”
8
legislation which drastically undermined the principle of union security (Struthers, Huxley and Kettler 1986, 131). In combination with, or as a substitute for, the shift in operations to non-unionized sites, American managers since the 1950s also have aggressively implemented alternative human resource management policies intended to make union membership redundant, or at least less attractive to employees. The critical components of the union-avoidance management policies are comparative wages with similar unionized operations, strong benefits, and a work environment that goes far in meeting the personal needs of employees. These employee needs might include a sense of participation or belonging to the firm, appreciation of employee contributions and access to promotions, and an attractive and pleasant workplace. The impact of these human resource-based union-avoidance programs may be difficult to gauge, but some authors claim that their success is attested to by the declining union density in the United States since 1965 (Trowbridge 1986, 415-416). American unions in some sectors of the economy, it would appear, in the 1980s face severe competition from the non-union sector within the United States for the allegiance of workers.
Paul Weiler in an article in the Harvard Law Review(1983) provided another convincing argument to account for the decline in union density in the United States. The focus of Weiler’s article is the legal regime governing the union certification procedure and the regulation of unfair labour practices in the United States. The objectionable practice in the certification procedure is the protracted representation election campaign in which both the employer and the union supporters participate following the submission by the union of a petition for represenation rights and certification. The campaigns may last several months. It is during these campaigns for support for union certification that employers exert pressure to subvert the union drive (Weiler 1983, 1769-70). Since the 1940s a number of coercive and illegal tactics by employers have been witnessed in the United States, and it is significant that the numbers have steadily increased in the past twenty-five years. The most common tactic used by employers has been the discriminatory discharge of key union-supporting employees during the representation campaigns. Employees who were entitled to reinstatement because of discriminatory dismissal numbered 10,000 in 1980, and this was a 1000% increase over 1957 (Weiler 1983, 1780-81). The removal of key union-supporting employees at a critical time in the union campaign can effectively undermine a particular union drive; but perhaps more important it can have a "chilling effect" on future worker interest in union representation. The procedure which allows for a protracted representation campaign has created, in Weiler's words, "a setting that elicits employer coercision of employee choice" (Weiler 1983, 1770). These particular features of the American legal regime have had a considerable negative impact on the nation's trade union movement, and have contributed to the transformation of the collective bargaining system in the United States in the 1970s and 1980s.
The scenario of American unions in decline and of the American industrial relations system in transition or in a process of transformation, which has been described by Kochan, Katz and McKersie, and Weiler, among others, is of critical interest to Canadian unionists and students of the Canadian industrial relations system. The American industrial relations scene traditionally has been the backround against which the emerging trends in Canadian industrial relations have been investigated. As Christopher Huxley, David Kettler and James Struthers have observed: "In its labour relations as in many things, Canada has often been considered, since the Second World War, little more than an appendage to the United States. Patterns of union organization, collective bargaining, and labour law appear essentially similar in both countries, and, indeed, many of the unions and large employers are the same. The American have provided models, and, often, the leadership" (Struthers, Huxley and Kettler 1986, 113). This viewpoint, however, as the
9
three authors stress, today is no longer particularly relevant nor widely held: in the 1980s there is a consensus forming around the view that the course of the Canadian labour movement is no longer mimicking that of the American union movement. The paths of union development in Canada and the United States have diverged; and the most significant characteristic of this divergence is that the Canadian union movement is not in a similar state of decline as the American labour movement.
A few statistics will tell the story very well. In the United States union density has declined from 33% in 1955 to 18% in 1985, and industrial relations scholar Richard Freeman has speculated that if present trends continue it will decline to about 13% in the year 2000 (Lipset 1986, xvi)(See Table I). One critical component of the decline in union density, as Paul Weiler has demonstrated, has been the increased inability of unions to win certifications elections. In 1947 the union win rate was 74.6%. This declined in 1954 to 65.6%, to 60.8% in 1965, to 56.1% in 1970, to 49.6% in 1975, and to 46.4% in 1984 (Lipset 1986, xvi). Even more damaging to union fortunes in the United States has been the increased success rate of decertification elections. The absolute number of decertifications contests increased from an annual rate of about 300 in the 1960s, to 500 in the mid-1970s, to about 900 in the mid-1980s. In the mid-1980s American unions were losing more than 75% of these contests (Lipset 1986, xvi).
In contrast, Canadian unions since 1965 have outpreformed American unions on various levels of union activity, including union density, membership growth and certification outcomes. Union density in Canada has increased from 22% in 1943 to over 40% in 1983, with a significant decline to 37.7% in 1986; and the proportion of workers covered by collective agreements has increased from 33% in 1943, to 58% in 1983 (Kumar 1986, 95). By way of comparison, in 1963 union density in both Canada and the United States was about 30%; however in 1984 in Canada union density has increased to 39%, while in the same period in the United States it has declined to less than 20% (See Table I). Moreover, Canadian unions have been much more successful than American unions in increasing membership, and in winning certificaion contests. In a variety of ways, then, the Canadian union movement has outperformed the American union movement since the 1960s.
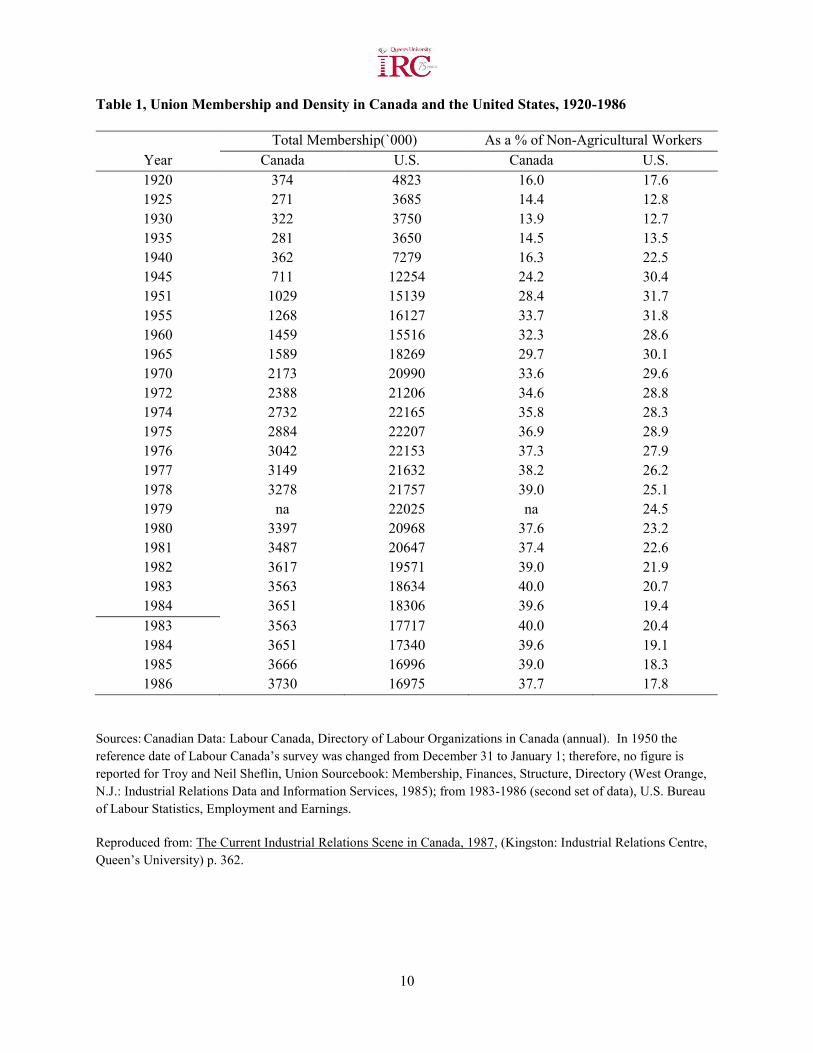
10
Table 1, Union Membership and Density in Canada and the United States, 1920-1986
Total Membership(`000) As a % of Non-Agricultural Workers Year Canada U.S. Canada U.S. 1920 374 4823 16.0 17.6 1925 271 3685 14.4 12.8 1930 322 3750 13.9 12.7 1935 281 3650 14.5 13.5 1940 362 7279 16.3 22.5 1945 711 12254 24.2 30.4 1951 1029 15139 28.4 31.7 1955 1268 16127 33.7 31.8 1960 1459 15516 32.3 28.6 1965 1589 18269 29.7 30.1 1970 2173 20990 33.6 29.6 1972 2388 21206 34.6 28.8 1974 2732 22165 35.8 28.3 1975 2884 22207 36.9 28.9 1976 3042 22153 37.3 27.9 1977 3149 21632 38.2 26.2 1978 3278 21757 39.0 25.1 1979 na 22025 na 24.5 1980 3397 20968 37.6 23.2 1981 3487 20647 37.4 22.6 1982 3617 19571 39.0 21.9 1983 3563 18634 40.0 20.7 1984 3651 18306 39.6 19.4 1983 3563 17717 40.0 20.4 1984 3651 17340 39.6 19.1 1985 3666 16996 39.0 18.3 1986 3730 16975 37.7 17.8
Sources: Canadian Data: Labour Canada, Directory of Labour Organizations in Canada (annual). In 1950 the reference date of Labour Canada’s survey was changed from December 31 to January 1; therefore, no figure is reported for Troy and Neil Sheflin, Union Sourcebook: Membership, Finances, Structure, Directory (West Orange, N.J.: Industrial Relations Data and Information Services, 1985); from 1983-1986 (second set of data), U.S. Bureau of Labour Statistics, Employment and Earnings.
Reproduced from: The Current Industrial Relations Scene in Canada, 1987, (Kingston: Industrial Relations Centre, Queen’s University) p. 362.
11
In comparison to the United States, then, the Canadian labour movement appears to be strong, secure and sure of its position in Canada in the 1980s. The most significant area of divergence between the Canadian and American courses of union development has been the absence in Canada of a wide-spread and successful employer initiated attack on the system of collective bargaining. There has been little research into the subject of the union-avoidance strategies of Canadian managers, but it is widely believed by scholars that these strategies, with a number noteworthy exceptions, have not had as significant an impact on the union movement in Canada as they have had in the United States (Lipset 1986, 451). It is not known if Canadian managers have been as interested in union-avoidance of the sort that has been popular in the United States; or if for some reason they have been more unwilling, reluctant, or unable to implement these strategies in their workplaces. One inhibiting factor, as Weiler correctly pointed out, is the more generous support given by the labour law regimes in the eleven Canadian jurisdictions, when compared to the United States, to union development and security.
The question arises: why has the legal framework and the administration of labour law in Canada continued in recent years to be relatively more supportive to the union movement, while in the United States the labour law regime has impeded union growth and contributed to the decline in union density? Most scholars believe a fundamental difference in the union situations in Canada and the United States is to be found in their respective political environments: to state it simply, the labour movement in Canada has had more political power than the labour movement in the United States, and it has had this power through its vehicle the New Democratic Party (NDP) (Struther, Huxley and Kettler 1986, 131). Although the NDP has not won an election federally and has only won election on occasion in three western provinces, the party has had a significant impact on Canadian political life when viewed in relation to American politics (Van Loon and Whittington 1976, 260-268). In brief, the NDP has managed to pull both the Liberals and Progressive Conservatives closer to the center of the Canadian political spectrum on labour and social welfare issues, and the NDP has contributed to a political climate in which insensitivity or outright hostility to the labour movement will not go unnoticed or unchallenged in Parliament. The role the NDP has played in Canadian politics has been of tremendous benefit to the labour movement in the country. In the United States there is no counterpart to the NDP.
Another difference in the environments in which the Canadian and American labour movements exist is the absence of a Canadian equivalent to the American south and sunbelt states with their "right to work" laws. Employers cannot as easily shift their operations within Canada to non-unionized sites, all other economic considerations being equal. As a result the union movement in Canada does not face a challenge of the same magnitude from the non-union sector as is the case in the United States. For a variety of reasons, then, the most critical set of external and internal factors which have contributed to the decline of union density in the United States are not duplicated in Canada.
However, all is not bright on the union horizon in Canada. Elizabeth Shilton Lennon, in an article about the tremendous obstacles faced by those who would organized Canadian bank workers, has correctly observed that a closer investigation of the Canadian labour movement produces less optimistic responses than arise from a simple comparison of the Canadian and American labour movements. As she writes:
On deeper analysis... Canadian (union) growth patterns give cause for concern. Although the percentage of union membership doubled between 1942 and 1978, it was almost as high in 1958 as
12
it is today (1980). Furthermore, although there have been significant increases in union membership over the last ten years, a large proportion of this increase is attributable to public sector employees who entered the union fold because of changes in legislative policy. The public sector has its own history and often its own legislative regime, and the fact the public employees are now unionized in large numbers is no cause for optimism about the health of the system in general. Finally, union membership is very unevenly distributed throughout the economy; while almost three-quarters of construction workers, for example, are unionized, the figure for workers in finance, insurance and real estate is only 1.4 percent (Shilton Lennon 1980, 178).
The two phenomenon Shilton Lennon observed in Canada were stagnation in the union movement as it entered the 1980s; and second, the failure of the union movement to penetrate what are now the growing sectors of the labour market. Both of these phenomenon raise questions about the future of the labour movement in Canada. In regard to the first issue, the evidence makes clear that the most difficult period for Canadian unions in the past forty years occurred in the 1980s, a consequence of a long and deep recession in the Canadian economy. Beginning in the late 1970s there was a slowdown in most major sectors of the Canadian economy. There were further more serious declines in the early 1980s creating the longest and deepest recession of the post-World War II period. An observer in 1982 described the economic outlook at the time in this way:
Gloom and uncertainty characterize Canada's current economic environment -- a very troubled and turbulent climate for industrial relations. The economy is in the grips of a severe recession -- probably the worst since the depression of the 1930s. Interest rates are in a holding pattern at record high levels. Inflation is still in the double-digit, range. Unemployment has jumped to almost 10 per cent of the labour force following a sharp downturn in employment growth and an escalating number of layoffs and plant closures (Current Scene 1982, 3).
The impact on the labour movement of these recessionary trends in the Canadian economy was evident in declining union membership figures in the 1980s. Table I sets out the figures for union density in Canada, and it clearly illustrates the decline in union strength during these recession years. More important than this, the table also points out that the union movement has not recouped its losses in terms of union density since the recession of 1981-82. Beginning in 1983 there were four years of economic recovery in Canada, with significant gains being made in real output, employment, income, and investment (Current Scene 1986, 3). Union density, however, actually declined in these years from 40 per cent in 1983 to 37.7 per cent in 1986. It would appear that many of the people who found employment after the recession did not go to union jobs. Economic indicators projecting the late 1980s suggest that there will be continued high unemployment and slow economic growth (Current Scene 1986, 8-11). This is not the sort of environment in which the union movement can expect to quickly regain its losses of the early 1980s and further increase its numbers.
Another problem facing the Canadian labour movement in the 1980$ is the increased international competition facing Canada's traditionally union-strong heavy industries. This situation will mean further declines in these union strongholds. In general, the Canadian economy is undergoing a period of transition in which heavy "smoke-stack" industries are declining, and service and high-technology industries are ascending. These newer, rapidly growing industries have attracted many new entrants to the labour market - white-collar workers, women, teenagers, part-time workers - who traditionally have
13
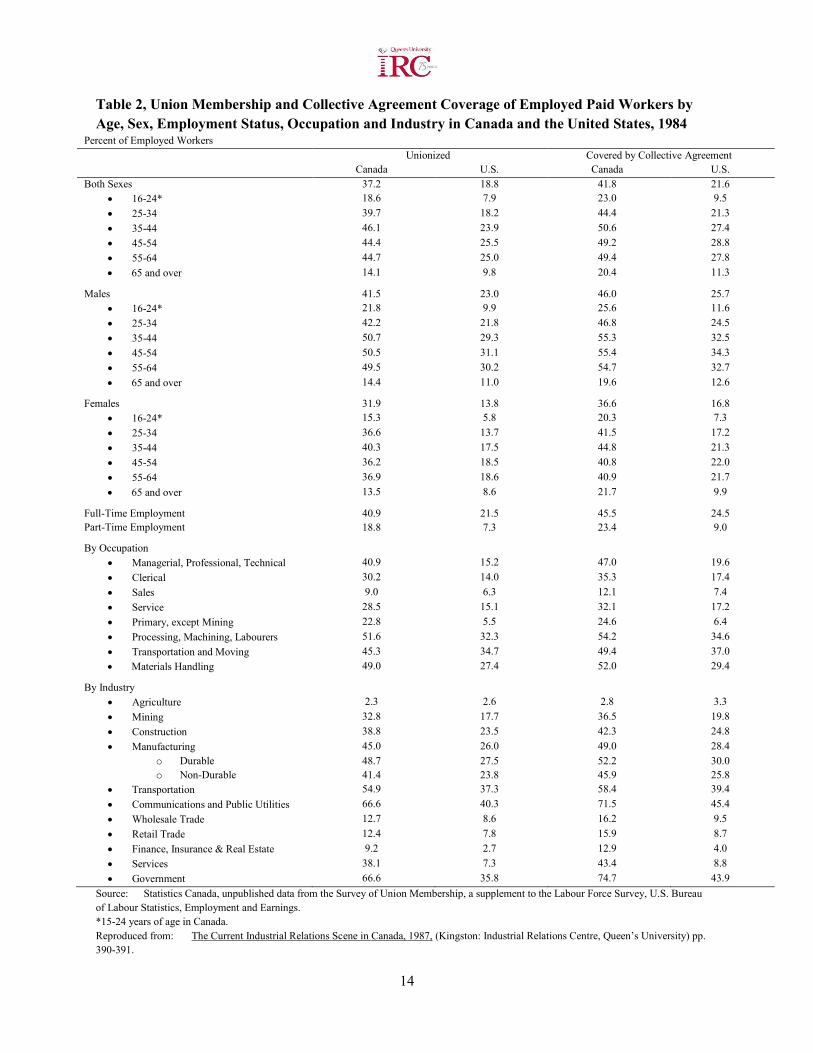
been difficult to organize. Table II sets out union density figures for a number of occupation and industry groups in Canada and in the United States. While the table confirms the much greater strength of the union movement in Canada, compared to the United States, it also illustrates very clearly the low level of unionization in the white-collar and service sectors in both countries. The occupation groups of clerical, sales and service employees in Canada have union density levels well below the national average of 39.6 per cent for the year of the survey, 1984. Similarly the industry groups of wholesale trade, retail trade, and finance/insurance/real estate employees have levels of unionization much lower than the national average. Table II also makes clear that levels of unionization are much lower for women than for men. The trouble for the labour movement is that the areas of growth in the labour market are in these sectors of low unionization and not in the areas of traditional union strength. Given these labour market indicators the growth prospects for Canadian unions are at best uncertain (Kumar 1986, 95-6; Current Scene 1986, 1-4).
The legal status of various union-related issues in Canada is similarly uncertain. There is at this time a great deal of speculation about the possible negative impact of the Charter of Rights and Freedoms on such fundamental union issues as the compulsory check-off of union dues, union political activities, and the right to strike for public service workers and other workers whose services are designated as being essential (Carter 1987, 8-9). There also is a great deal of concern about how unions and unionized workers would be affected by a broader free trade agreement between Canada and the United States, and by government initiatives to privatize certain government functions, and the deregulation of other industries (Carter 1987, 7). The informed opinion is that movements in public policy in these directions will adversely affect unions in Canada. In sum, unions in Canada in the 1980s find themselves facing a changed labour market with many new entrants who historically have been difficult to organize; an economy in transition, in which the traditional sectors of union strength are in decline; and an uncertain future in terms of public policy decisions on labour issues, and the legal status of some union-related issues. It is not surprising, then, that union activists like CLC president Shirley Carr on many occassions have expressed concerns about the tremendous challenges facing the labour movement in Canada in the 1980s.
Against this very broad backround this study will introduce and analyze new statistical data on union certification activity in Ontario. An analysis of union certification data may provide some insight into the recent developments and changes in the Canadian labour movement. If, as many of the most perceptive commentators in Canada believe, the Canadian union movement is in a period of transition and crisis, there may be in a study of union certification activity in Ontario several clues to the future direction of the labour movement in Ontario, and perhaps in all of Canada. Critical to the future strength of the labour movement in Canada is the organization of previously unorganized groups of workers, especially those workers whose ranks are growing rapidly in relation to other members of the workforce - white-collar workers, women, youth, and part-time workers. This study will investigate the Ontario labour movement's performance in this critical work.
14
Table 2, Union Membership and Collective Agreement Coverage of Employed Paid Workers by Age, Sex, Employment Status, Occupation and Industry in Canada and the United States, 1984
Percent of Employed Workers Unionized Covered by Collective Agreement Canada U.S. Canada U.S. Both Sexes 37.2 18.8 41.8 21.6
16-24* 18.6 7.9 23.0 9.5 25-34 39.7 18.2 44.4 21.3 35-44 46.1 23.9 50.6 27.4 45-54 44.4 25.5 49.2 28.8 55-64 44.7 25.0 49.4 27.8 65 and over 14.1 9.8 20.4 11.3
Males 41.5 23.0 46.0 25.7 16-24* 21.8 9.9 25.6 11.6 25-34 42.2 21.8 46.8 24.5 35-44 50.7 29.3 55.3 32.5 45-54 50.5 31.1 55.4 34.3 55-64 49.5 30.2 54.7 32.7 65 and over 14.4 11.0 19.6 12.6
Females 31.9 13.8 36.6 16.8 16-24* 15.3 5.8 20.3 7.3 25-34 36.6 13.7 41.5 17.2 35-44 40.3 17.5 44.8 21.3 45-54 36.2 18.5 40.8 22.0 55-64 36.9 18.6 40.9 21.7 65 and over 13.5 8.6 21.7 9.9
Full-Time Employment 40.9 21.5 45.5 24.5 Part-Time Employment 18.8 7.3 23.4 9.0
By Occupation Managerial, Professional, Technical 40.9 15.2 47.0 19.6 Clerical 30.2 14.0 35.3 17.4 Sales 9.0 6.3 12.1 7.4 Service 28.5 15.1 32.1 17.2 Primary, except Mining 22.8 5.5 24.6 6.4 Processing, Machining, Labourers 51.6 32.3 54.2 34.6 Transportation and Moving 45.3 34.7 49.4 37.0 Materials Handling 49.0 27.4 52.0 29.4
By Industry Agriculture 2.3 2.6 2.8 3.3 Mining 32.8 17.7 36.5 19.8 Construction 38.8 23.5 42.3 24.8 Manufacturing 45.0 26.0 49.0 28.4
o Durable 48.7 27.5 52.2 30.0 o Non-Durable 41.4 23.8 45.9 25.8
Transportation 54.9 37.3 58.4 39.4 Communications and Public Utilities 66.6 40.3 71.5 45.4 Wholesale Trade 12.7 8.6 16.2 9.5 Retail Trade 12.4 7.8 15.9 8.7 Finance, Insurance & Real Estate 9.2 2.7 12.9 4.0 Services 38.1 7.3 43.4 8.8 Government 66.6 35.8 74.7 43.9
Source: Statistics Canada, unpublished data from the Survey of Union Membership, a supplement to the Labour Force Survey, U.S. Bureau of Labour Statistics, Employment and Earnings. *15-24 years of age in Canada. Reproduced from: The Current Industrial Relations Scene in Canada, 1987, (Kingston: Industrial Relations Centre, Queen’s University) pp. 390-391.
15
CHAPTER TWO: Union Organizing Activity in Ontario, 1970-1986
In Canada the method by which a union acquires bargaining rights for a unit of employees is known as the certification procedure. The legislation in the eleven Canadian jurisdictions provides that a union may make application to the appropriate labour board, and if it can establish its representative character and meet a variety of other requirements, it is entitled to receive a certificate giving the union exclusive authority to represent employees in the bargaining unit. The legislation also obliges the employer to bargain exclusively with the certified union (Arthurs, Carter and Glasbeek 1984, 188). The legislation enables trade unions to acquire bargaining rights through organizing activity and recognition by the labour board, and not by employer recognition which often was achieved only by strike action.
In Ontario a trade union will receive outright certification without a vote if the Ontario Labour Relations Board (OLRB) is satisfied that more than 55 per cent of the employees in the bargaining unit are members of the trade union. Evidence of membership in the trade union is judged to be the voluntary signing of a trade union membership card by the employee and the payment of a small initiation fee of one dollar (Arthurs, Carter and Glasbeek 1984, 189). In other cases where the trade union is unable to sign up as members more than 55 per cent of the employees in the bargaining unit, the Ontario Labour Relations Board will direct that a representation vote be taken if it is satisfied that the trade union has signed up as members not less than 45 per cent of the employees in the bargaining unit (Section 7.-(2) Ontario Labour Relations Act 1984, 7). Section 7.-(3) of the Ontario Labour Relations Act states: "If on the taking of a representation vote more than 50 per cent of the ballots are cast in favour of the trade union ... the Board shall certify the trade union as the bargaining agent of the employees in the bargaining unit" (Section 7.-(3) Ontario Labour Relations Act 1984, 7). Certification which is achieved by either of the above mentioned methods enables the trade union to represent the employees of the bargaining unit in negotiations; to meet the employer and request that he bargain in good faith; to take steps to compel the employer to bargain in good faith if he refuses to do so; to request conciliation services; and to engage in lawful strike activity (Sack and Levinson 1973, 38).
The number of certifications granted by the Ontario Labour Relations Board in the period since 1970 is a good measure of the labour movement's organizing performance during the past decade and a half. It is, however, not a perfect measure. It should be noted that in Ontario a union may acquire bargaining rights by "voluntary recognition agreements". In these agreements the employer voluntarily recognizes the trade union as the exclusive bargaining agent of his employees' bargaining unit. In such instances the union acquires bargaining rights without certification under the Ontario Labour Relations Act (Sack and Levinson 1973, 38). As a result of this procedure, statistical data on the number and composition of employees who are unionized in Ontario in this manner is unavailable to this study, and therefore absent from the general discussion of union organizing activity in Ontario. Nevertheless the detailed statistical analysis of certification activity in Ontario which follows below provides very clear evidence of the labour movement's performance in organizing workers in Ontario in the 1970s and 1980s, and also presents a good general perspective on union membership growth patterns in these two decades.
The second component of this statistical study related to union organizing activity deals with the termination of bargaining rights in Ontario in the period since the 1970s. A distinction must be made here between a displacement of one union by another and a decertification. A displacement involves the
16
termination of a union's bargaining rights upon the making of a successful application for certification of bargaining rights by another union (Arthurs, Carter and Glasbeek 1984, 207). Since the unionized status of the affected employees in the bargaining unit remains unchanged in the vast majority of cases, there is no loss or gain to the aggregate union membership in Ontario. For this reason, the cases of termination of bargaining rights of this sort are not included in the statistical data in this study. This study is concerned only with decertifications. In Ontario a decertification is the declaration by the Ontario Labour Relations Board that the bargaining agent no longer has the support of the majority of the employees in the bargaining unit; and, the effect of this declaration is to terminate the union's bargaining rights and to end any collective agreement the union has made in respect of that bargaining unit (Arthurs, Carter and Glasbeek 1984, 206). The most common procedure for obtaining a declaration of termination of bargaining rights in Ontario requires that an application be made to the Labour Relations Board by some member of the bargaining unit. The Board then shall ascertain the number of employees in the bargaining unit at the time the application was made who have voluntarily signified in writing at such time that they no longer wish to be represented by the trade union. If the number of employees who have signified in writing a wish to terminate the union's bargaining rights is not less than 45 per cent of the employees in the bargaining unit, the Board shall order a representation vote to determine if a majority of employees desire that the right of the trade union to bargain on their behalf be terminated (Section 57.-(3) Ontario Labour Relations Act 1984, 35). If the results of the representation vote indicate that more than 50 per cent of the ballots cast are against the union, the Board will declare that the union no longer represents the employees in the bargaining unit (Section 57.-(4) Ontario Labour Relations Act 1984, 35). A union may have its bargaining rights terminated on a variety of other grounds such as: fraud; failure to bargain; union or employer succession; revocation of the certificate on grounds such as abandonment; and, by collateral rulings of the Board in other proceedings, among others (Sack and Levinson 1973, 165). The interest here in decertifications is in the absolute loss to aggregate union membership in Ontario that results from them.
17
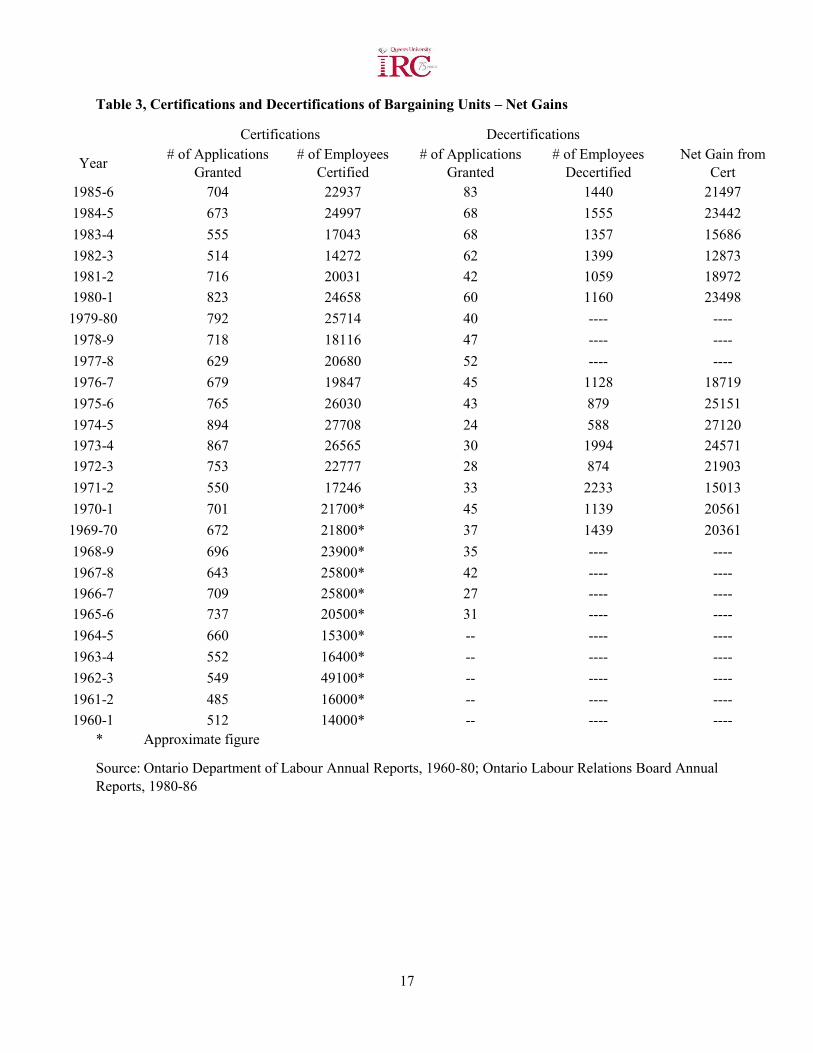
Table 3, Certifications and Decertifications of Bargaining Units – Net Gains
Certifications Decertifications
Year # of Applications Granted
# of Employees Certified
# of Applications Granted
# of Employees Decertified
Net Gain from Cert
1985-6 704 22937 83 1440 21497 1984-5 673 24997 68 1555 23442 1983-4 555 17043 68 1357 15686 1982-3 514 14272 62 1399 12873 1981-2 716 20031 42 1059 18972 1980-1 823 24658 60 1160 23498 1979-80 792 25714 40 ---- ---- 1978-9 718 18116 47 ---- ---- 1977-8 629 20680 52 ---- ---- 1976-7 679 19847 45 1128 18719 1975-6 765 26030 43 879 25151 1974-5 894 27708 24 588 27120 1973-4 867 26565 30 1994 24571 1972-3 753 22777 28 874 21903 1971-2 550 17246 33 2233 15013 1970-1 701 21700* 45 1139 20561 1969-70 672 21800* 37 1439 20361 1968-9 696 23900* 35 ---- ---- 1967-8 643 25800* 42 ---- ---- 1966-7 709 25800* 27 ---- ---- 1965-6 737 20500* 31 ---- ---- 1964-5 660 15300* -- ---- ---- 1963-4 552 16400* -- ---- ---- 1962-3 549 49100* -- ---- ---- 1961-2 485 16000* -- ---- ---- 1960-1 512 14000* -- ---- ----
* Approximate figure
Source: Ontario Department of Labour Annual Reports, 1960-80; Ontario Labour Relations Board Annual Reports, 1980-86
18
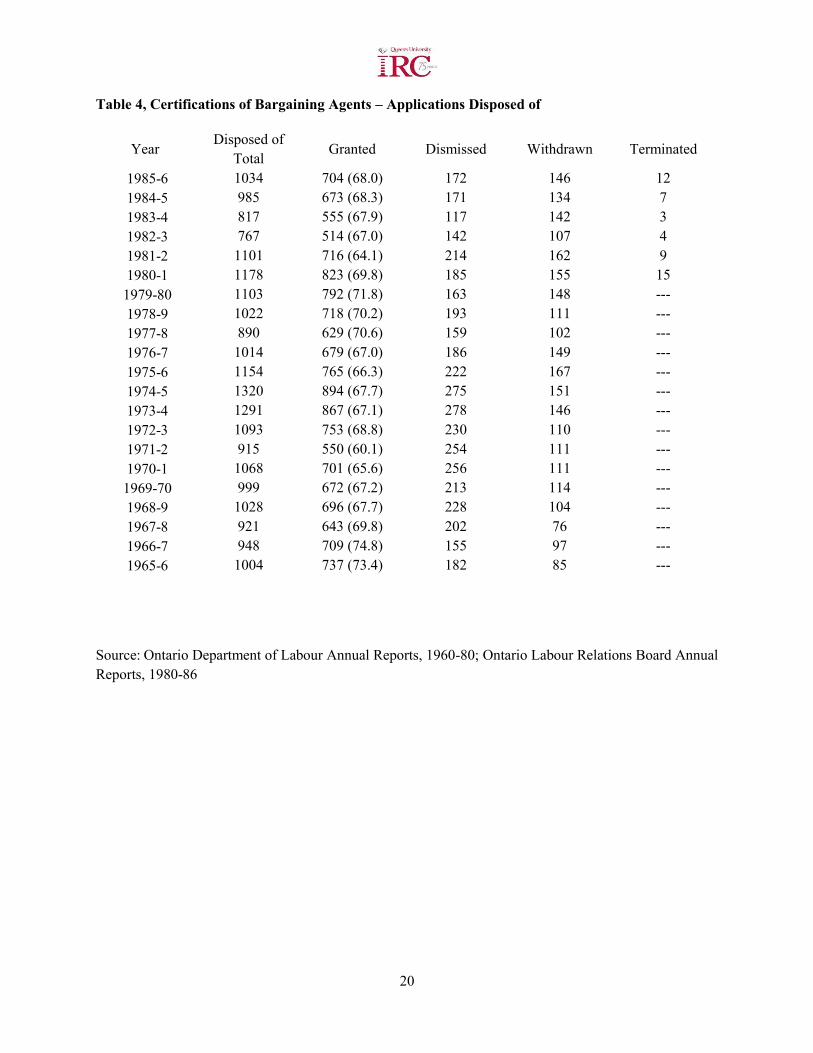
Certifications
A quick survey of the data presented in Table III indicates that the absolute number of certifications granted by the Ontario Labour Relations Board is down in the period since fiscal year 1981-82, and the decline is particularly dramatic when viewed against the peak years of union organizing activity in fiscal years 1972-76 and 1978-81. The impact of the recession of 198284 on the labour movement in Ontario is evident in the especially sharp drop in the number of certifications granted in these years. The decline is brought into its sharpest relief by considering that in fiscal year 1980-81 there were 823 certifications granted in Ontario and 24,658 employees certified; and two years later in fiscal year 1982-83 the numbers had fallen to 514 certifications granted and 14,272 employees certified. If five-year averages of the number of certifications granted are considered the decline in union organizing activity in the 1980s is further underscored. The annual average number of certifications granted for the five year periods of fiscal years are: 632.4 for 1981-86; 728.2 for 1976-81; 765.8 for 1971-76; 684.2 for 1966-71; and 596.6 for 1961-66. The annual average number of certifications granted in the period 1981-86 is lower than the annual average in any five year period since the early 1960s. This data also may be expressed as percentage change figures for the average annual number of certifications granted from one five-year period to the next: the percentage change from fiscal period 1961-66 to 1966-71 is 12.8%; for the period 1966-71 to 1971-76 it is 10.65%; for 1971-76 to 1976-81 the figure is -5.16%; and for the period 1976-81 to 1981-86 the percentage change is -15.14%. These percentage change figures for the annual average number of certifications granted point out a significant state of decline in the labour movement's organizing activity in Ontario in the 1980s.
The same pattern emerges in the statistics for the annual average number of employees certified in these five year fiscal periods. The annual average number of employees certified in these years are: 19,856 for fiscal years 1981-86; 21,803 for 1976-81; 24,065 for 1971-76; 23,800 for 1966-71; and 23,460 for 1961-66. In terms of the annual average number of employees certified, the labour movement's organizing activities in the period 1981-86 are at the lowest point in the past 25 years (note that the number of employees certified in fiscal year 1962-63 is unusually high and forces up the annual average for the period 1961-66). The slowdown and decline in union organizing activity, as the statistices make clear, is very real.
However, the data also clearly indicates that the organizing activities of the union movement in Ontario have not been devasted in the 1980s. When the recession years of 1982-83 are isolated from the years 1983-86 the overall picture of union organizing activity in the 1980s is less discouraging to the labour movement. The last two years for which statistics are available, 1984-86, show a definite resurgence in union organizing activity comparable in absolute numbers to the period 1976-79, and to the years before 1972. This resurgence in the mid-1980s would suggest that the trough into which union organizing activity slipped in the early 1980s was the result of adverse cyclical changes in the Canadian economy and not indicative of profound structural changes in the Ontario labour movement. Similar cyclical dips in union organizing activity also can be seen in the periods 1976-79 and 1971-72.
Table IV shows the percentage of certification applications granted to the number of applications filed, and this data also indicates something of the strength and stability of the labour movement's organizing
19
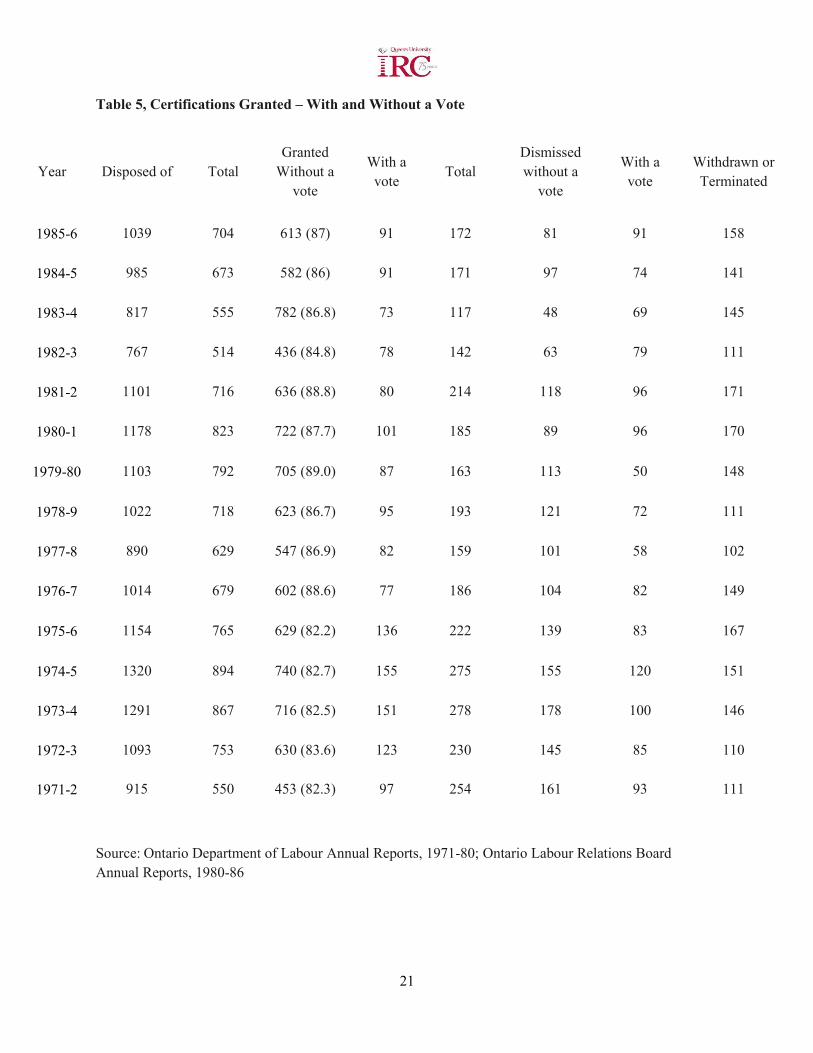
activities in the 1980s. In the period fiscal years 1981-86, 67% of the applications filed with the Ontario Labour Relations Board were granted certification. For the other five year periods the figures are: 69.8% for 1976-81; 66% for 1971-76; 69% for 1966-71. What these figures suggest is that the organizing activity of the Ontario labour movement is still sure-footed in the areas in which it is involved. The actual number of applications for certification which are filed with the Labour Relations Board has declined in the 1980s, but the labour movement has continued to win approximately the same percentage of the applications filed as it did in the past two decades. The annual average of 67% for the period 1981-86 compares favourably with the annual averages for the other five year periods since 1966. Similarly the data contained in Table V - which presents a breakdown of applications certified and dismissed, with or without a vote - confirms the healthy state of union certification activity in Ontario. As is indicated in the table's column named Certifications-Granted-Without a Vote, the labour movement continued to have an automatic certification rate in the period 1976-86 of between 86% and 89%. The one exception was fiscal year 1982-83 when the level was 84.8%. It is also worth noting that the levels for the period 1976-86 were approximately 6% higher than the levels in the early 1970s. An automatic certification, which is granted when more than 55% of the bargaining unit has been signed up as union members, is a clear sign of a well-conducted and highly successful union organizing campaign. It is good news to the labour movement that it is still achieving almost 90% of its new certifications in this manner. In sum, the union movement has not suffered a decline in its success rate in regard to applications filed with the Board, or in the level of automatic certifications. The statistics on new certifications in the 1980s are somewhat troublesome to the Ontario labour movement, but on close investigation they do not show its organizing activities to be in a state of steady uninterrupted decline.
20
Table 4, Certifications of Bargaining Agents – Applications Disposed of
Year Disposed of
Total Granted Dismissed Withdrawn Terminated
1985-6 1034 704 (68.0) 172 146 12 1984-5 985 673 (68.3) 171 134 7 1983-4 817 555 (67.9) 117 142 3 1982-3 767 514 (67.0) 142 107 4 1981-2 1101 716 (64.1) 214 162 9 1980-1 1178 823 (69.8) 185 155 15
1979-80 1103 792 (71.8) 163 148 --- 1978-9 1022 718 (70.2) 193 111 --- 1977-8 890 629 (70.6) 159 102 --- 1976-7 1014 679 (67.0) 186 149 --- 1975-6 1154 765 (66.3) 222 167 --- 1974-5 1320 894 (67.7) 275 151 --- 1973-4 1291 867 (67.1) 278 146 --- 1972-3 1093 753 (68.8) 230 110 --- 1971-2 915 550 (60.1) 254 111 --- 1970-1 1068 701 (65.6) 256 111 ---
1969-70 999 672 (67.2) 213 114 --- 1968-9 1028 696 (67.7) 228 104 --- 1967-8 921 643 (69.8) 202 76 --- 1966-7 948 709 (74.8) 155 97 --- 1965-6 1004 737 (73.4) 182 85 ---
Source: Ontario Department of Labour Annual Reports, 1960-80; Ontario Labour Relations Board Annual Reports, 1980-86
21
Table 5, Certifications Granted – With and Without a Vote
Year Disposed of Total Granted
Without a vote
With a vote
Total Dismissed without a
vote
With a vote
Withdrawn or Terminated
1985-6 1039 704 613 (87) 91 172 81 91 158
1984-5 985 673 582 (86) 91 171 97 74 141
1983-4 817 555 782 (86.8) 73 117 48 69 145
1982-3 767 514 436 (84.8) 78 142 63 79 111
1981-2 1101 716 636 (88.8) 80 214 118 96 171
1980-1 1178 823 722 (87.7) 101 185 89 96 170
1979-80 1103 792 705 (89.0) 87 163 113 50 148
1978-9 1022 718 623 (86.7) 95 193 121 72 111
1977-8 890 629 547 (86.9) 82 159 101 58 102
1976-7 1014 679 602 (88.6) 77 186 104 82 149
1975-6 1154 765 629 (82.2) 136 222 139 83 167
1974-5 1320 894 740 (82.7) 155 275 155 120 151
1973-4 1291 867 716 (82.5) 151 278 178 100 146
1972-3 1093 753 630 (83.6) 123 230 145 85 110
1971-2 915 550 453 (82.3) 97 254 161 93 111
Source: Ontario Department of Labour Annual Reports, 1971-80; Ontario Labour Relations Board Annual Reports, 1980-86
22
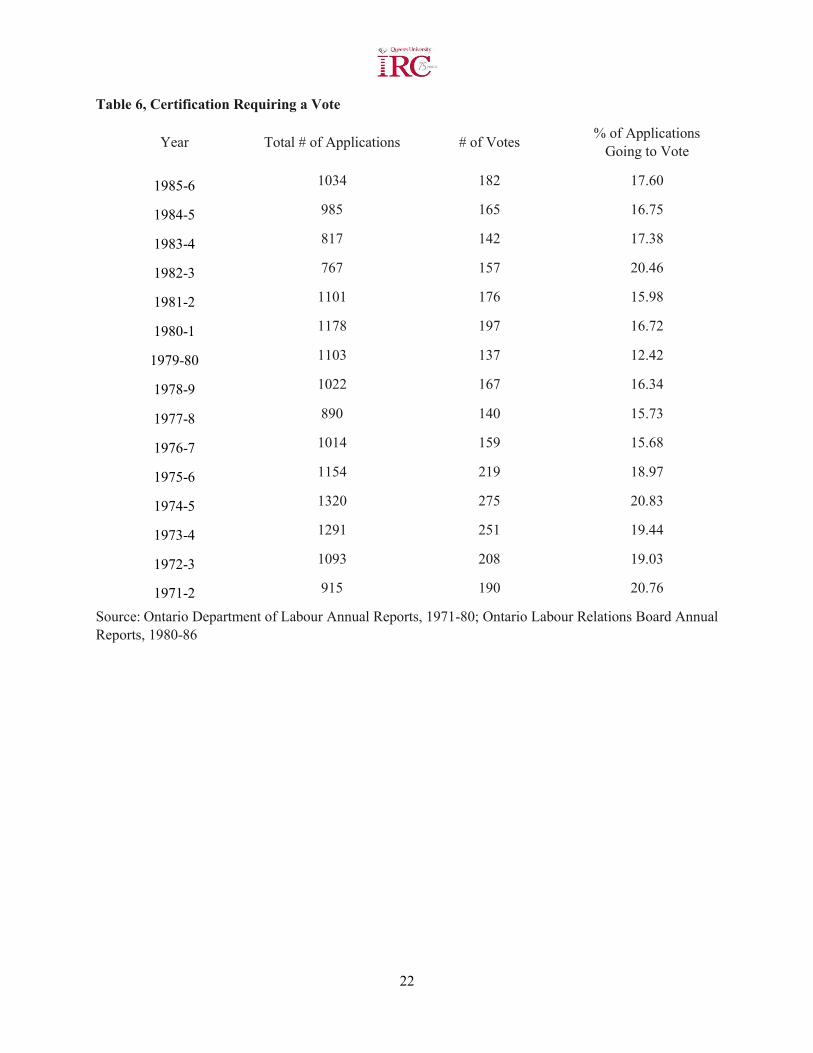
Table 6, Certification Requiring a Vote
Year Total # of Applications # of Votes % of Applications Going to Vote
1985-6 1034 182 17.60
1984-5 985 165 16.75
1983-4 817 142 17.38
1982-3 767 157 20.46
1981-2 1101 176 15.98
1980-1 1178 197 16.72
1979-80 1103 137 12.42
1978-9 1022 167 16.34
1977-8 890 140 15.73
1976-7 1014 159 15.68
1975-6 1154 219 18.97
1974-5 1320 275 20.83
1973-4 1291 251 19.44
1972-3 1093 208 19.03
1971-2 915 190 20.76
Source: Ontario Department of Labour Annual Reports, 1971-80; Ontario Labour Relations Board Annual Reports, 1980-86
23
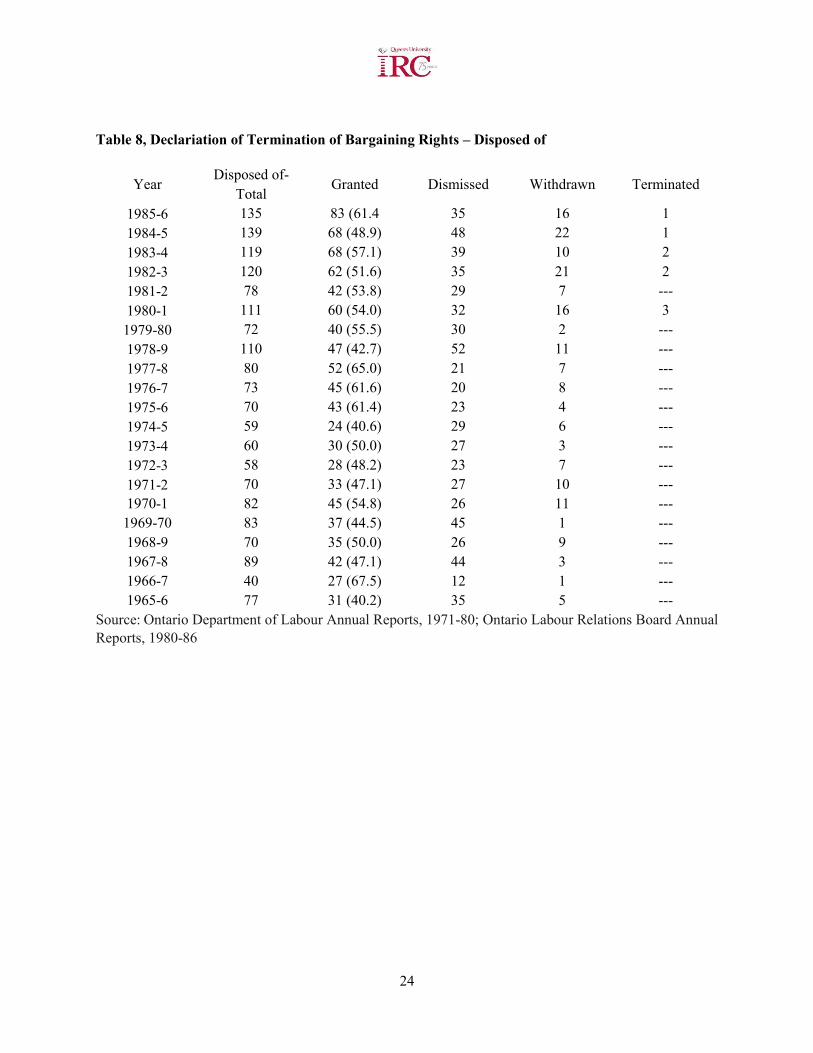
Decertifications
The trends occurring in the number of decertifications granted in Ontario in the 1980s also must be troubling to the province's union movement. Table III presents data on the number of decertifications granted in Ontario in the years 1969-86, and also on the number of employees decertified in these fiscal years. It is immediately apparent from the table that there has been a substantial increase in the 1980s in the number of bargaining units decertified. In the 1980s, with the exception of fiscal year 1981-82, there were 60 or more decertifications granted in the province every year. In the years prior to 1980 there was only one year, 1977-78, when there were more than 47 decertifications granted. Table III also makes clear, where the data is available, that the numbers of employees annually decertified is rapidly increasing in the 1980s, although the figures are only beginning to match some of the levels hit in the early 1970s. Another important index is the number of decertification applications filed with the Ontario Labour Relations Board. Table VIII sets out the number of applications to the Board in the fiscal years 1965-86, and the manner in which they were disposed. Here the figures are more dramatic in their suggestion that in the 1980s there is a more substantial and growing challenge to existing unions, as measured by decertification applications, than in any previous decade. The annual average number of decertification applications disposed of by the Board for the fiscal period 1981-86 was 118.2, and 54.56% of these applications were granted decertification. The figures for the period 1976-81 are an annual average of 89.2 applications disposed of, and 55.76% were granted; for the period 1971-76 there was an annual average of 63.4 applications disposed of, and 49.46% were granted; and the figures for the period 1966-71 are an annual average of 72.8 applications disposed of, and 52.78% were granted. While the percentage of decertification applications that are granted has held constant at between approximately 50 and 55 per cent, the number of applications filed with the Board has climbed steadily in the past 20 years, with the largest increases occurring in the 1980s.
Even in the 1980s the number of employees involved in successful decertification applications is small in relation to total union membership in Ontario, and even in relation to the number of newly certified employees each year. Nevertheless, as Table III illustrates, the loss of union members through decertifications erodes the net gains to the union movement achieved through certifications. More serious than this, the increasing number of decertifications granted in the 1980s may be a sort of inspiration to other persons who would seek to terminate their union's bargaining rights; and it may also dissuade the unorganized workers in the province from making the decision to join a union. Even more than a decline in the union success rate in certification elections, an increase in the number of successful decertification applications points to a growing loss of faith by Ontario workers in the union movement.
24
Table 8, Declariation of Termination of Bargaining Rights – Disposed of
Year Disposed of-
Total Granted Dismissed Withdrawn Terminated
1985-6 135 83 (61.4 35 16 1 1984-5 139 68 (48.9) 48 22 1 1983-4 119 68 (57.1) 39 10 2 1982-3 120 62 (51.6) 35 21 2 1981-2 78 42 (53.8) 29 7 --- 1980-1 111 60 (54.0) 32 16 3
1979-80 72 40 (55.5) 30 2 --- 1978-9 110 47 (42.7) 52 11 --- 1977-8 80 52 (65.0) 21 7 --- 1976-7 73 45 (61.6) 20 8 --- 1975-6 70 43 (61.4) 23 4 --- 1974-5 59 24 (40.6) 29 6 --- 1973-4 60 30 (50.0) 27 3 --- 1972-3 58 28 (48.2) 23 7 --- 1971-2 70 33 (47.1) 27 10 --- 1970-1 82 45 (54.8) 26 11 ---
1969-70 83 37 (44.5) 45 1 --- 1968-9 70 35 (50.0) 26 9 --- 1967-8 89 42 (47.1) 44 3 --- 1966-7 40 27 (67.5) 12 1 --- 1965-6 77 31 (40.2) 35 5 ---
Source: Ontario Department of Labour Annual Reports, 1971-80; Ontario Labour Relations Board Annual Reports, 1980-86
25
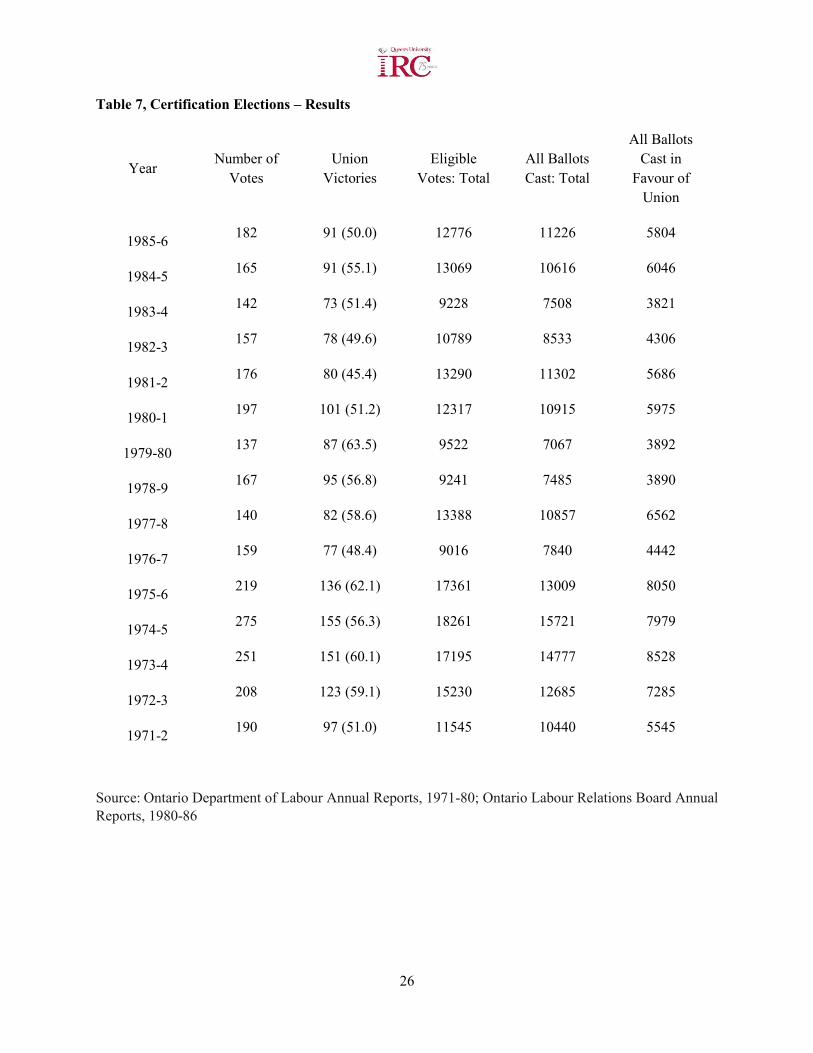
Certification Elections
Further evidence of the stability of the organizing activities of the labour movement in the 1980s is to be found in statistics on the union success rate in certification elections. The first matter of concern in this regard is the number of certification applications which require a representation vote. The Ontario Labour Relations Board will direct that a representation vote be taken if the union has signed up as members less than 55 per cent, and not less than 45 per cent, of the employees in the bargaining unit. Table VI presents data relating the number of representation votes to the number of applications filed. Significantly, the table shows that the number of applications filed with the Board requiring a representation vote has increased only somewhat in the 1980s from the level of the late 1970s, and that the level in the 1980s is still well below the level of the early 1970s. The annual average number of representation votes for the five year fiscal periods for which data is available are: 164.4 for 1981-86; 160 for 1976-81; and 228.6 for 1971-76. This data also may be expressed in terms of the annual average percentage of votes requiring a representation vote. For the five year fiscal period 1981-86 the average is 17.63%; for the years 1976-81 the average is 15.37%; and the figure is 19.8% for the years 1971-76. What these figures indicate is that the union movement in the 1980s continues, as it had in the 1970s, to achieve a very high level of outright certification without a vote among the applications it files with the Board. The union movement is not being forced in the 1980s to fight, in the form of representation votes, a higher per centage of the applications it files with the Board. The critical organizing strategy for obtaining certification by signing up employees in the bargaining unit as union members is not failing, and, indeed, it appears to be as effective in the 1980s as it was in the 1970s.
However, the union success rate in the representation elections which were taken in the years 1971-86 is much less encouraging to the Ontario labour movement. Table VII presents the results of representation votes taken in these years, and the trend which emerges is one of decline in the union success rate in these votes. In the period 1971-76 the union movement was winning 57.72% of the representation votes. This figure dropped to 55% for the years 1976-81, and slid considerably further in the period 1981-86 to 50.3%. The annual average numbers of union victories in representation elections for these years are: 82.6 for 1981-86; 88.4 for 1976-81; and 132.4 for 1971-76. These figures are not a bright spot on the union horizon in Ontario. The decline in the union success rate in representation elections may be a signal of a growing disillusionment or loss of faith in the union movement because of its inability to shield some of its membership from the worst effects of the turndown in the economy. It was perhaps concerns like the decline in the union success rate in representation votes that caused Jeff Rose, president of the Canada's largest union, CUPE, to warn of a crisis of faith that endangers the Canadian union movement. "Our members doubt our effectiveness, our relevance", Rose said in November 1983 (The Montreal Gazette 16 November 1983, B1). On the other hand, the statistics on the union success rate in certification votes may reflect a growing, and increasingly more aggressive, employer resistance to unions at their workplace, a phenomenon often very difficult to document. Whatever the fundamental process at work here, the results of the certification elections in Ontario since 1971 point out that a growing number of unorganized workers in the province reject the option of unionization when it is presented to them.
26
Table 7, Certification Elections – Results
Year Number of
Votes Union
Victories Eligible
Votes: Total All Ballots Cast: Total
All Ballots Cast in
Favour of Union
1985-6 182 91 (50.0) 12776 11226 5804
1984-5 165 91 (55.1) 13069 10616 6046
1983-4 142 73 (51.4) 9228 7508 3821
1982-3 157 78 (49.6) 10789 8533 4306
1981-2 176 80 (45.4) 13290 11302 5686
1980-1 197 101 (51.2) 12317 10915 5975
1979-80 137 87 (63.5) 9522 7067 3892
1978-9 167 95 (56.8) 9241 7485 3890
1977-8 140 82 (58.6) 13388 10857 6562
1976-7 159 77 (48.4) 9016 7840 4442
1975-6 219 136 (62.1) 17361 13009 8050
1974-5 275 155 (56.3) 18261 15721 7979
1973-4 251 151 (60.1) 17195 14777 8528
1972-3 208 123 (59.1) 15230 12685 7285
1971-2 190 97 (51.0) 11545 10440 5545
Source: Ontario Department of Labour Annual Reports, 1971-80; Ontario Labour Relations Board Annual Reports, 1980-86
27
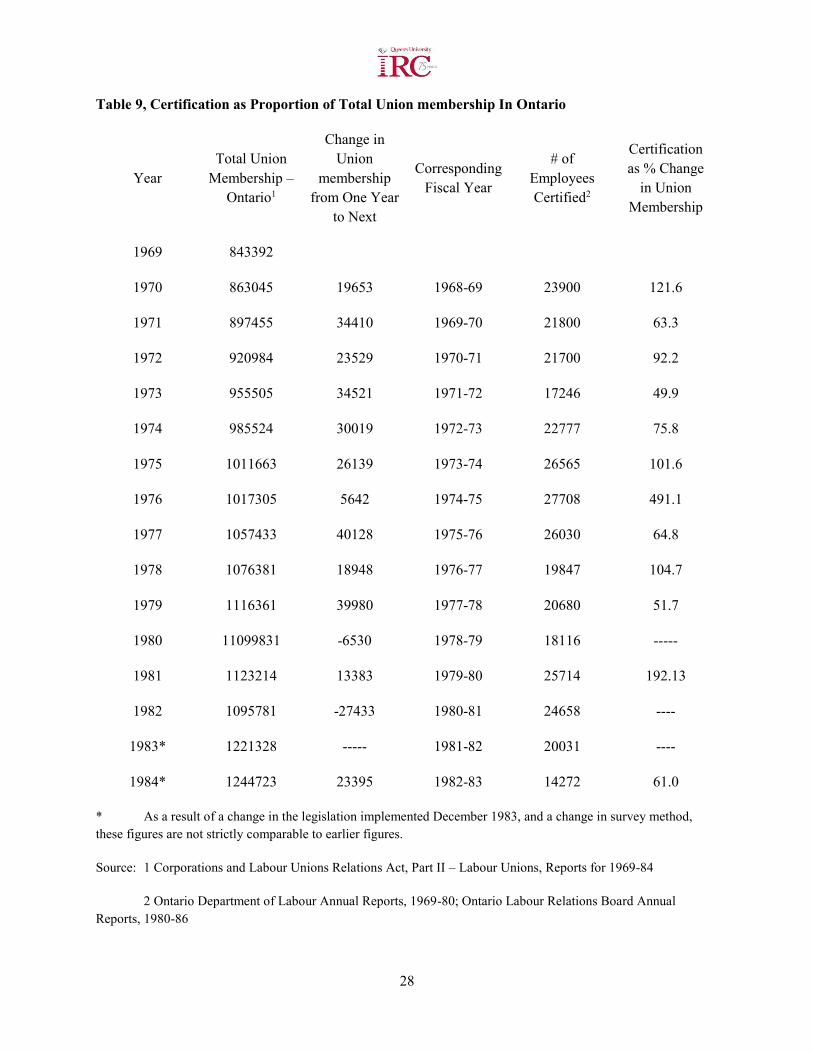
Certifications and Total Union Membership in Ontario
It is difficult to relate in a precise and meaningful way the aggregate data on the annual numbers of certifications granted in Ontario to data of a more general nature on the aggregate union membership in the province. One factor which makes this a difficult task is the absence of a good series of statistics on aggregate union membership in the province. The statistics on union density in Canada which are published annually in the Directory of Labour Organizations in Canada, and are widely accepted as the authoritative source on union density in the country, unfortunately do not contain a provincial breakdown of union membership. The statistics are only for Canada as a whole. The only available statistics on union membership in Ontario are contained in the annual report of the Corporations and Labour Unions Returns Act (CALURA); and regrettably CALURA collects statistics only about labour unions of 100 members or more. A great many smaller unions of less than 100 members are as a result of this survey method excluded from CALURA statistics. CALURA statistics to 1984 also exclude a number of labour associations containing membership groups such as the police, teachers, and nurses. In most instances these association members would be regarded as traditional union members, however, they are not represented in the CALURA surveys. It should be noted, then, that statistics quoted from CALURA sources underestimate actual union membership in the province.
Table IX juxtaposes data on union membership in Ontario, and the absolute change in the number of union members from one year to the next, with the annual number of certified employees in the province. There are a few interesting observations to be made about the data. First, it is apparent that new certifications since 1969 have been a major contribution to the growth of total union membership in Ontario. In every year since 1969, for which data is available, certifications have constituted at least 50 per cent of the increase in total union membership from one year to the next. Moreover, it should be noted that certifications made contributions to total union membership even in years when total union membership in the province declined because of layoffs of unionized workers and a general slowdown in the economy (see 1979-80 and 1981-82). What these figures indicate is that the labour movement's organizing activity, as measured by the annual number of new certifications, is a stable and reliable source of union membership growth. Union organizing activities are not falling behind in terms of the strength of their contribution to the growth of total union membership in the province.
28
Table 9, Certification as Proportion of Total Union membership In Ontario
Year Total Union
Membership – Ontario1
Change in Union
membership from One Year
to Next
Corresponding Fiscal Year
# of Employees Certified2
Certification as % Change
in Union Membership
1969 843392
1970 863045 19653 1968-69 23900 121.6
1971 897455 34410 1969-70 21800 63.3
1972 920984 23529 1970-71 21700 92.2
1973 955505 34521 1971-72 17246 49.9
1974 985524 30019 1972-73 22777 75.8
1975 1011663 26139 1973-74 26565 101.6
1976 1017305 5642 1974-75 27708 491.1
1977 1057433 40128 1975-76 26030 64.8
1978 1076381 18948 1976-77 19847 104.7
1979 1116361 39980 1977-78 20680 51.7
1980 11099831 -6530 1978-79 18116 -----
1981 1123214 13383 1979-80 25714 192.13
1982 1095781 -27433 1980-81 24658 ----
1983* 1221328 ----- 1981-82 20031 ----
1984* 1244723 23395 1982-83 14272 61.0
* As a result of a change in the legislation implemented December 1983, and a change in survey method, these figures are not strictly comparable to earlier figures.
Source: 1 Corporations and Labour Unions Relations Act, Part II – Labour Unions, Reports for 1969-84
2 Ontario Department of Labour Annual Reports, 1969-80; Ontario Labour Relations Board Annual Reports, 1980-86
29
One additional item not directly related to certification results but nonetheless worth noting at this time is the total expenditure of unions in Canada for organizing new members. The available data is for Canada and does not contain separate data for the province of Ontario, but nevertheless it underscores the tremendous resources unions in Canada, including Ontario, direct to recruiting and organizing new members. The Corporations and Labour Unions Returns Act (CALURA) Report for 1984 for the first time included in its statement of income and expenditures of all reporting labour organizations a total for organizing expenses. According to the Report the following figures represent the expenditures in 1984 on organizing activities: international unions - $4,782,000; national unions - $4,691,000; and government employee's organizations - $782,000. The total for all union organizing expenses in Canada in 1984 was $10,255,000. This figure for total organizing expenses was 2.1% of the total union expenditures for operations in Canada of $485,426,000 in 1984 (Corporations and Labour Unions Returns Act, Report for 1984, Part II - Labour Unions, Table 47, 86). It must be stressed that the figure for organizing expenses is separate from and does not include union expenditures on salaries, or office and administration costs; yet the union's organizing activities benefit from the established union bureaucracy. Union bureaucracy accounted for more than 70% of total union expenditures for operations in Canada in 1984. The CALURA statistics, then, underestimate the resources unions in Canada direct to organizing activity. The evidence, however, does support the view that unions in Canada have set a high priority on organizing new members, and have committed vast resources to that goal.
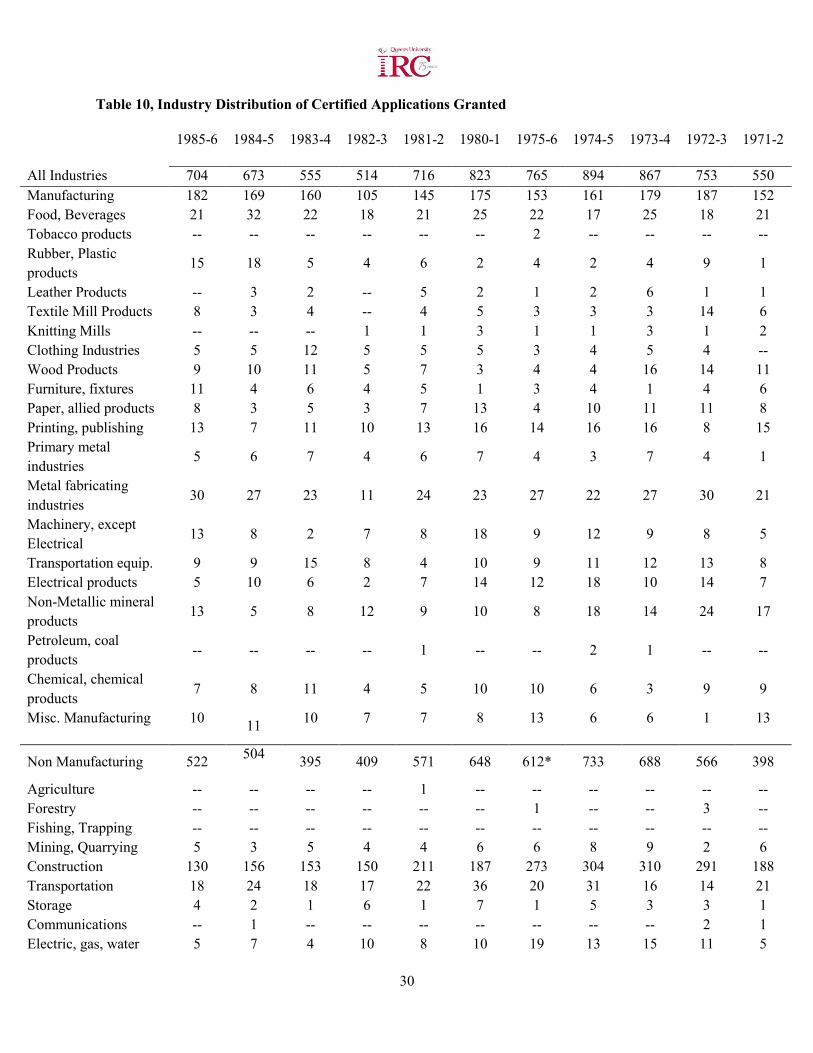
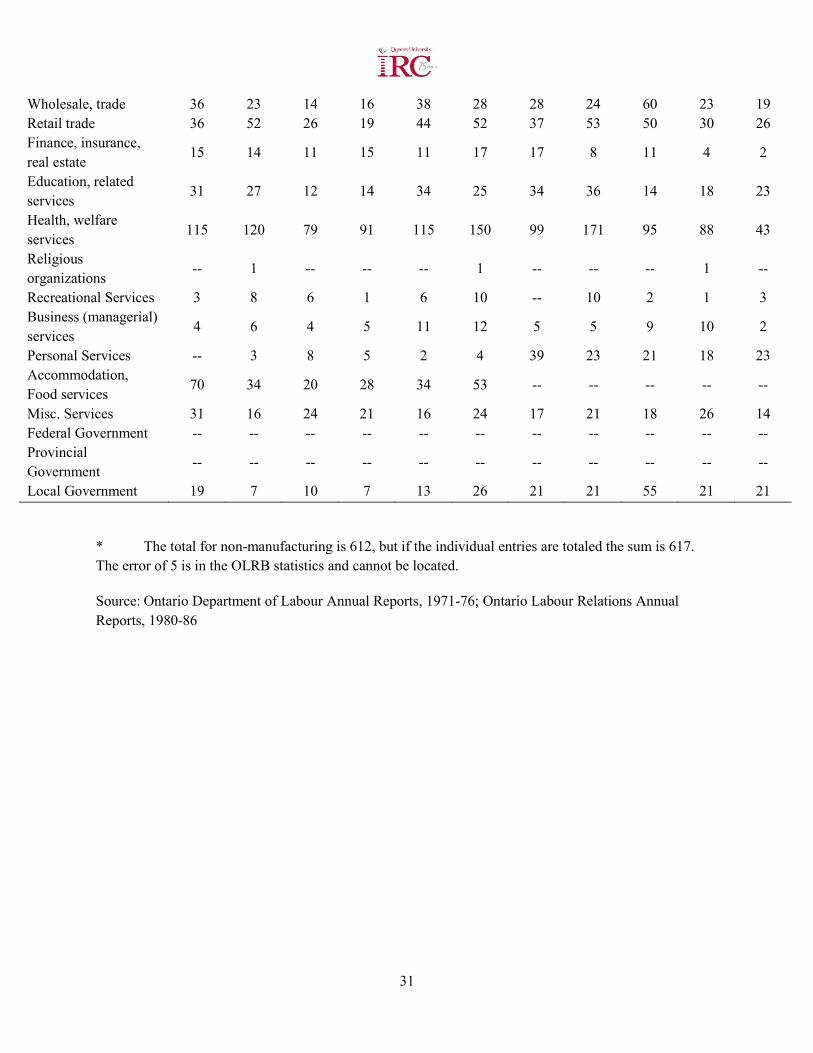
Certifications: Industry Distribution
Information about the composition of the bargaining units which are certified is very difficult to obtain from existing sources of collected data. There are, however, some statistical records on the industry, union, and bargaining unit size of the successful certifications applications in Ontario for various years during the decades of the 1970s and 1980s. What these various statistical records point out is the remarkable continuity in the composition of the certified bargaining units. Table X presents data from the Ontario Labour Relations Board annual reports on the industry distribution of successful certification applications. One of the most significant items in this data is the proportion of certifications in the manufacturing and non-manufacturing sectors. Listed below are the percentage figures of certifications in the non-manufacturing sector.
30
Table 10, Industry Distribution of Certified Applications Granted
1985-6 1984-5 1983-4 1982-3 1981-2 1980-1 1975-6 1974-5 1973-4 1972-3 1971-2
All Industries 704 673 555 514 716 823 765 894 867 753 550 Manufacturing 182 169 160 105 145 175 153 161 179 187 152 Food, Beverages 21 32 22 18 21 25 22 17 25 18 21 Tobacco products -- -- -- -- -- -- 2 -- -- -- -- Rubber, Plastic products
15 18 5 4 6 2 4 2 4 9 1
Leather Products -- 3 2 -- 5 2 1 2 6 1 1 Textile Mill Products 8 3 4 -- 4 5 3 3 3 14 6 Knitting Mills -- -- -- 1 1 3 1 1 3 1 2 Clothing Industries 5 5 12 5 5 5 3 4 5 4 -- Wood Products 9 10 11 5 7 3 4 4 16 14 11 Furniture, fixtures 11 4 6 4 5 1 3 4 1 4 6 Paper, allied products 8 3 5 3 7 13 4 10 11 11 8 Printing, publishing 13 7 11 10 13 16 14 16 16 8 15 Primary metal industries
5 6 7 4 6 7 4 3 7 4 1
Metal fabricating industries
30 27 23 11 24 23 27 22 27 30 21
Machinery, except Electrical
13 8 2 7 8 18 9 12 9 8 5
Transportation equip. 9 9 15 8 4 10 9 11 12 13 8 Electrical products 5 10 6 2 7 14 12 18 10 14 7 Non-Metallic mineral products
13 5 8 12 9 10 8 18 14 24 17
Petroleum, coal products -- -- -- -- 1 -- -- 2 1 -- --
Chemical, chemical products
7 8 11 4 5 10 10 6 3 9 9
Misc. Manufacturing 10 11 10 7 7 8 13 6 6 1 13
Non Manufacturing 522 504 395 409 571 648 612* 733 688 566 398
Agriculture -- -- -- -- 1 -- -- -- -- -- -- Forestry -- -- -- -- -- -- 1 -- -- 3 -- Fishing, Trapping -- -- -- -- -- -- -- -- -- -- -- Mining, Quarrying 5 3 5 4 4 6 6 8 9 2 6 Construction 130 156 153 150 211 187 273 304 310 291 188 Transportation 18 24 18 17 22 36 20 31 16 14 21 Storage 4 2 1 6 1 7 1 5 3 3 1 Communications -- 1 -- -- -- -- -- -- -- 2 1 Electric, gas, water 5 7 4 10 8 10 19 13 15 11 5
31
Wholesale, trade 36 23 14 16 38 28 28 24 60 23 19 Retail trade 36 52 26 19 44 52 37 53 50 30 26 Finance, insurance, real estate
15 14 11 15 11 17 17 8 11 4 2
Education, related services
31 27 12 14 34 25 34 36 14 18 23
Health, welfare services
115 120 79 91 115 150 99 171 95 88 43
Religious organizations
-- 1 -- -- -- 1 -- -- -- 1 --
Recreational Services 3 8 6 1 6 10 -- 10 2 1 3 Business (managerial) services
4 6 4 5 11 12 5 5 9 10 2
Personal Services -- 3 8 5 2 4 39 23 21 18 23 Accommodation, Food services 70 34 20 28 34 53 -- -- -- -- --
Misc. Services 31 16 24 21 16 24 17 21 18 26 14 Federal Government -- -- -- -- -- -- -- -- -- -- -- Provincial Government -- -- -- -- -- -- -- -- -- -- --
Local Government 19 7 10 7 13 26 21 21 55 21 21
* The total for non-manufacturing is 612, but if the individual entries are totaled the sum is 617. The error of 5 is in the OLRB statistics and cannot be located.
Source: Ontario Department of Labour Annual Reports, 1971-76; Ontario Labour Relations Annual Reports, 1980-86
32
Although there has been since 1983-84 a notable decline in the proportion of certifications in the non-manufacturing sector, in general the proportion for this sector has fluctuated in the range between 74 and 80 per cent. The overwhelming concentration of certifications in the non-manufacturing sector is to the advantage of the labour movement because it is this sector of the Canadian economy which is growing most rapidly. It is here where the greatest potential for future organizing exists; and the labour movement would be prudent to concentrate its resources in these sectors of employment. The most important source of potential union organization growth is in the non-manufacturing sectors of banking, trust companies, insurance companies, department stores, the wholesale trade, small hotels, among others (Kumar 1986, 143). One reason these non-manufacturing white-collar and service fields remain such great sources of organizing potential is that they also are the sectors of the Canadian economy in most need of organizing. For example, according to statistics collected by the authors of The Current Industrial Relations Scene in Canada 1986, in 1985 only 39% of office employees, 16% of sales employees, and 3% of employees in finance in Canada were covered by collective agreements. The coverage for all employees in Canada in 1985 was 57% (Current Scene 1986, 61-64). Union membership in these white-collar and service employment sectors is even lower than the collective bargaining coverage. The foothold the union movement has in organizing the non-manufacturing sector may in the future be used to kick the door open further to bring in more of these white-collar/service sector workers into the union fold.
Among the other interesting items displayed in the Table X are the very slight increases in the 1980s over the 1970s in the number of certifications granted in the clothing industries, wood products, furniture fixtures, and primary metal industries. A more statistically significant increase is found in the finance, insurance and real estate sector, although certifications in this sector even with the increases during the 1980s amounted to no more than two per cent of the total number of new certifications. While gains in these employment fields remains statistically small, any increase in organizing activity in an area of such tremendous organizing potential is encouraging to the labour movement. The increases in the number of certifications granted in finance, insurance and real estate reflect the importance the labour movement places on organizing these fast growing sectors of the Canadian economy.
There also were signs of decline in organizing activity in some sectors of the Canadian economy. Small decreases in the number of certifications granted occurred in printing and publishing, mining and quarrying, and local government. A larger decline occurred in the electric, gas and water sector, and a truly substantial decrease can be seen in the construction industry. In the period 1971-76 there were an annual average of 273.2 in certifications the construction industry. By the years 1981-86 the annual average had dropped to 160. However, in most other sectors of industry the figures for new certifications are relatively constant throughout the two periods 1971-76 and 198086.
Perhaps the most significant feature about Table X is that it shows a concentration of new certifications in the traditionally highly unionized sectors of the economy: construction; health and welfare services; education; and metal fabricating industries. In the 1980s there have been notable increases in the traditional non-union sectors of finance, insurance and real estate, and accommodation and food services (a category for which there are no entries in the years 1971-76); and the retail trade continues to fluctuate between approximately 20 and 50 new annual certifications. However, in general, these traditional non-union sectors continue to make small contributions to the annual total number of new certifications. The union movement has not penetrated many new sectors of industry, or expanded its activity in the traditional non-union sectors of industry, by its organizing campaigns in the 1980s.
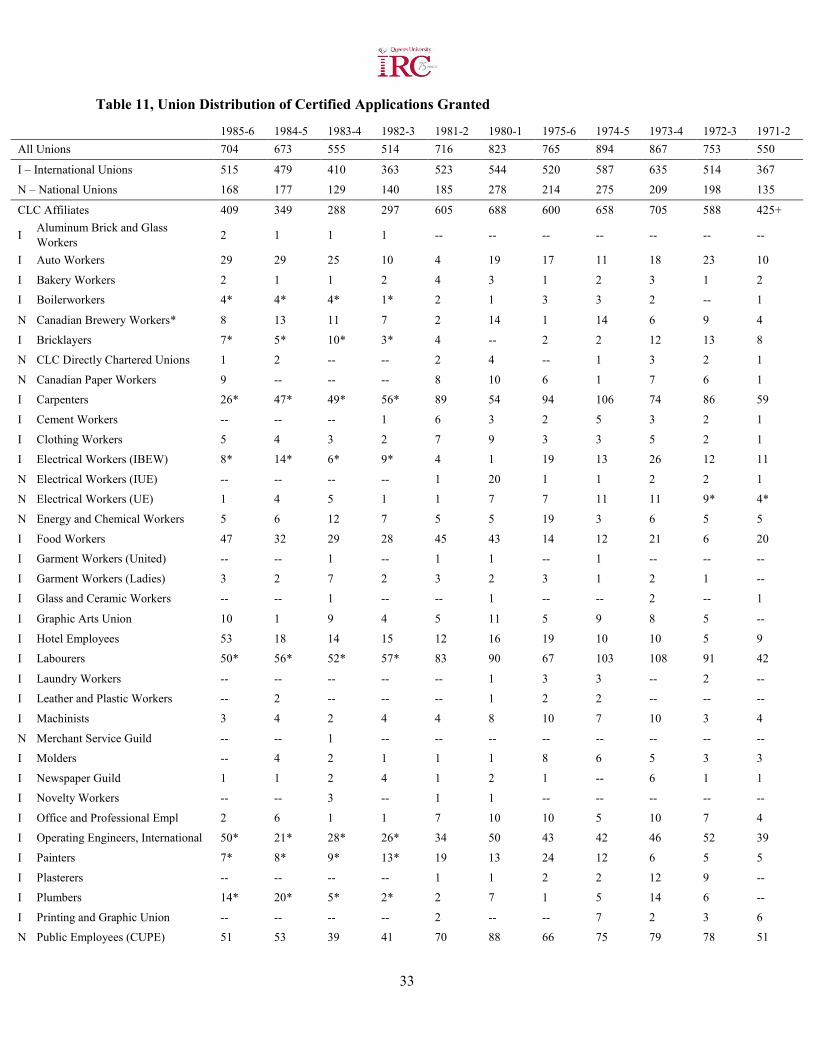
33
Table 11, Union Distribution of Certified Applications Granted
1985-6 1984-5 1983-4 1982-3 1981-2 1980-1 1975-6 1974-5 1973-4 1972-3 1971-2 All Unions 704 673 555 514 716 823 765 894 867 753 550
I – International Unions 515 479 410 363 523 544 520 587 635 514 367
N – National Unions 168 177 129 140 185 278 214 275 209 198 135
CLC Affiliates 409 349 288 297 605 688 600 658 705 588 425+
I Aluminum Brick and Glass Workers 2 1 1 1 -- -- -- -- -- -- --
I Auto Workers 29 29 25 10 4 19 17 11 18 23 10
I Bakery Workers 2 1 1 2 4 3 1 2 3 1 2 I Boilerworkers 4* 4* 4* 1* 2 1 3 3 2 -- 1
N Canadian Brewery Workers* 8 13 11 7 2 14 1 14 6 9 4
I Bricklayers 7* 5* 10* 3* 4 -- 2 2 12 13 8
N CLC Directly Chartered Unions 1 2 -- -- 2 4 -- 1 3 2 1
N Canadian Paper Workers 9 -- -- -- 8 10 6 1 7 6 1 I Carpenters 26* 47* 49* 56* 89 54 94 106 74 86 59
I Cement Workers -- -- -- 1 6 3 2 5 3 2 1
I Clothing Workers 5 4 3 2 7 9 3 3 5 2 1 I Electrical Workers (IBEW) 8* 14* 6* 9* 4 1 19 13 26 12 11
N Electrical Workers (IUE) -- -- -- -- 1 20 1 1 2 2 1 N Electrical Workers (UE) 1 4 5 1 1 7 7 11 11 9* 4*
N Energy and Chemical Workers 5 6 12 7 5 5 19 3 6 5 5
I Food Workers 47 32 29 28 45 43 14 12 21 6 20 I Garment Workers (United) -- -- 1 -- 1 1 -- 1 -- -- --
I Garment Workers (Ladies) 3 2 7 2 3 2 3 1 2 1 --
I Glass and Ceramic Workers -- -- 1 -- -- 1 -- -- 2 -- 1
I Graphic Arts Union 10 1 9 4 5 11 5 9 8 5 --
I Hotel Employees 53 18 14 15 12 16 19 10 10 5 9 I Labourers 50* 56* 52* 57* 83 90 67 103 108 91 42
I Laundry Workers -- -- -- -- -- 1 3 3 -- 2 -- I Leather and Plastic Workers -- 2 -- -- -- 1 2 2 -- -- --
I Machinists 3 4 2 4 4 8 10 7 10 3 4
N Merchant Service Guild -- -- 1 -- -- -- -- -- -- -- -- I Molders -- 4 2 1 1 1 8 6 5 3 3
I Newspaper Guild 1 1 2 4 1 2 1 -- 6 1 1 I Novelty Workers -- -- 3 -- 1 1 -- -- -- -- --
I Office and Professional Empl 2 6 1 1 7 10 10 5 10 7 4
I Operating Engineers, International 50* 21* 28* 26* 34 50 43 42 46 52 39
I Painters 7* 8* 9* 13* 19 13 24 12 6 5 5
I Plasterers -- -- -- -- 1 1 2 2 12 9 -- I Plumbers 14* 20* 5* 2* 2 7 1 5 14 6 --
I Printing and Graphic Union -- -- -- -- 2 -- -- 7 2 3 6 N Public Employees (CUPE) 51 53 39 41 70 88 66 75 79 78 51
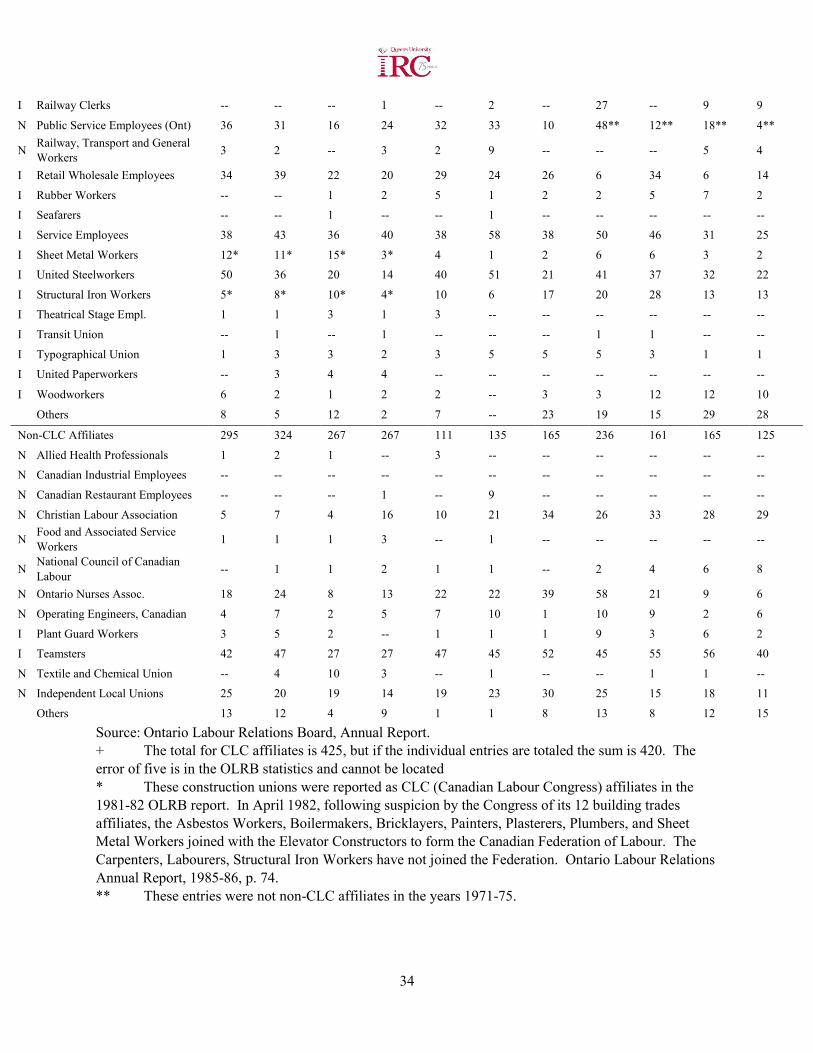
34
I Railway Clerks -- -- -- 1 -- 2 -- 27 -- 9 9
N Public Service Employees (Ont) 36 31 16 24 32 33 10 48** 12** 18** 4**
N Railway, Transport and General Workers 3 2 -- 3 2 9 -- -- -- 5 4
I Retail Wholesale Employees 34 39 22 20 29 24 26 6 34 6 14
I Rubber Workers -- -- 1 2 5 1 2 2 5 7 2 I Seafarers -- -- 1 -- -- 1 -- -- -- -- --
I Service Employees 38 43 36 40 38 58 38 50 46 31 25
I Sheet Metal Workers 12* 11* 15* 3* 4 1 2 6 6 3 2 I United Steelworkers 50 36 20 14 40 51 21 41 37 32 22
I Structural Iron Workers 5* 8* 10* 4* 10 6 17 20 28 13 13 I Theatrical Stage Empl. 1 1 3 1 3 -- -- -- -- -- --
I Transit Union -- 1 -- 1 -- -- -- 1 1 -- --
I Typographical Union 1 3 3 2 3 5 5 5 3 1 1 I United Paperworkers -- 3 4 4 -- -- -- -- -- -- --
I Woodworkers 6 2 1 2 2 -- 3 3 12 12 10
Others 8 5 12 2 7 -- 23 19 15 29 28
Non-CLC Affiliates 295 324 267 267 111 135 165 236 161 165 125
N Allied Health Professionals 1 2 1 -- 3 -- -- -- -- -- -- N Canadian Industrial Employees -- -- -- -- -- -- -- -- -- -- --
N Canadian Restaurant Employees -- -- -- 1 -- 9 -- -- -- -- --
N Christian Labour Association 5 7 4 16 10 21 34 26 33 28 29
N Food and Associated Service Workers 1 1 1 3 -- 1 -- -- -- -- --
N National Council of Canadian Labour -- 1 1 2 1 1 -- 2 4 6 8
N Ontario Nurses Assoc. 18 24 8 13 22 22 39 58 21 9 6
N Operating Engineers, Canadian 4 7 2 5 7 10 1 10 9 2 6
I Plant Guard Workers 3 5 2 -- 1 1 1 9 3 6 2 I Teamsters 42 47 27 27 47 45 52 45 55 56 40
N Textile and Chemical Union -- 4 10 3 -- 1 -- -- 1 1 -- N Independent Local Unions 25 20 19 14 19 23 30 25 15 18 11
Others 13 12 4 9 1 1 8 13 8 12 15
Source: Ontario Labour Relations Board, Annual Report. + The total for CLC affiliates is 425, but if the individual entries are totaled the sum is 420. The error of five is in the OLRB statistics and cannot be located * These construction unions were reported as CLC (Canadian Labour Congress) affiliates in the 1981-82 OLRB report. In April 1982, following suspicion by the Congress of its 12 building trades affiliates, the Asbestos Workers, Boilermakers, Bricklayers, Painters, Plasterers, Plumbers, and Sheet Metal Workers joined with the Elevator Constructors to form the Canadian Federation of Labour. The Carpenters, Labourers, Structural Iron Workers have not joined the Federation. Ontario Labour Relations Annual Report, 1985-86, p. 74. ** These entries were not non-CLC affiliates in the years 1971-75.
35
Certifications: Union Distribution
Table XI which presents a breakdown of certifications granted by union affiliation, as categorized by the OLRB annual report, in the years 1971-76 and 1980-86, does not alter the picture of relative stability and continuity in the union movement's organizing activities which emerged in Table X, the industry distribution. The unions which were most successful in organizing new bargaining units in the first half of the 1970s continued in the 1980s to be the most important union organizers. In both decades, for which data is available, the major contributions to the total number of new certifications came from the Auto Workers; Carpenters; Labourers; Operating Engineers, International; United Steelworkers; CUPE; Ontario Nurses Association; and the Teamsters. The consistency of the contributions to new certifications of these large established unions reflects their greater financial resources and ability to organize workers.
The importance of the role played in organizing activity by these and other large unions may be illustrated in another way. The authors of The Current Industrial Relations Scene in Canada 1986 have compiled a list of the thirty largest unions in Canada (Current Scene 1986, 298-300). This list may be applied to Table XI to determine the contributions of these thirty largest unions in Canada to new certifications in Ontario. The figures below represent the percentage of certifications granted to the thirty largest unions in Canada out of the total number granted in the fiscal year.
This data makes clear that new organizing activity has been dominated in the 1970s and 1980s by the largest unions in Canada; and if there is a trend it is to further dominance of the organizing activity in Ontario by the bigger unions.
Another of the interesting and significant items in Table XI is the breakdown for international and national unions. It is apparent from the table that international unions continued throughout the 1970s and 1980s to make a large majority of the contributions to organizing activity in Ontario. Below are the percentage figures for the number of certifications granted to international unions out of the total number granted in the fiscal year.
There has been a great deal of discussion in the 1980s about the decline of international unions in Canada, or the "Canadianization" of the labour movement. In terms of the proportion of the total labour movement in Canada international unions have been losing ground to national unions. In January 1986 membership in national unions in Canada was 2.13 million, or 57% of the total union membership in Canada. Membership in international unions was 1.46 million, or 39% of the national total (Current Scene 1986, 58). Over the past two decades the decline in the proportion of international union members to the total union membership in Canada has been steady and quite dramatic. In 1966 membership in international unions was 70.2% of the national total. In 1971 this figure had dropped to 62.0%. The figure for 1976 was 49.6%; and in 1981 it was 44.7% (Current Scene 1986, 291). The growth of public sector unions in Canada in the 1960s and 1970s contributed greatly to the decline in the proportion of international unions to total union membership in the country. However, in spite of both their declining membership and their declining significance to the labour movement in Canada, international unions have maintained in the 1970s and 1980s very high levels of organizing activity. This is one area in which they have not lost ground fast to the national unions. Organizing activity in Ontario in the 1980s, in this sense, has yet to be "Canadianized".
36
Among the other changes occurring from the 1970s to the 1980s in the union distribution of the new certifications were small increases in the organizing activity of the Auto Workers; Brewery Workers; Plumbers; Retail Wholesale Employees; and the Public Service Employees of Ontario. Larger gains in organizing activity were achieved by the Food Workers and Hotel Employees, making both groups in the 1980s major contributors to the total number of new certifications. There were decreases in the organizing activity of a number of construction and heavy manufacturing groups: Carpenters; Electrical Workers, IBEW and UE; Labourers; Machinists; Molders; Structural Iron Workers; and Woodworkers. The organizing activity of the Christian Labour Association also was down in the 1980s. Nevertheless, the OLRB's statistics indicate that there were no dramatic surges or rapid declines in union organizing activity by the specified union groups. The one dramatic change in the composition of the new certifications was the decline after 1982 of the proportion of CLC affiliates to non-CLC affiliates. However, this change is to be attributed to the suspension by the CLC of twelve building trades. Otherwise, it was business as usual for the major unions contributing to new certifications in Ontario.
Certifications: Bargaining Unit Size
A third index of the continuity in the union movement's organizing activities from the 1970s to the 1980s is contained in Table XII, which provides a breakdown of new certifications by bargaining unit size. The figures in the table describe the percentage of the total number of new certifications in the fiscal year contained in each of the bargaining unit categories. Once again, there is more continuity, in this case in the period 197586, than there is significant change. One discernible trend is the steady decline in the percentage of new certifications in the bargaining unit size 2-9 employees. There is simultaneous increase, although of smaller dimensions, in bargaining unit sizes 20-39 and 40-99. In the other categories there is an erratic pattern within identifiable bounds. The figures for the percentage of employees certified in each fiscal year follow a similar erratic pattern from year to year within the identifiable bounds of the category. Over the ten year period covered by the table the proportion of employees certified has remained relatively constant in each of the categories. What Table XII suggests, especially when viewed in conjunction with Tables X and XI, is that there has been little innovation or change in the pattern of results in union organizing activity in the period from 1970 to 1986. "Continuity and stability" is a phrase that describes much better than "change and innovation" the results of union organizing activity in these two decades.
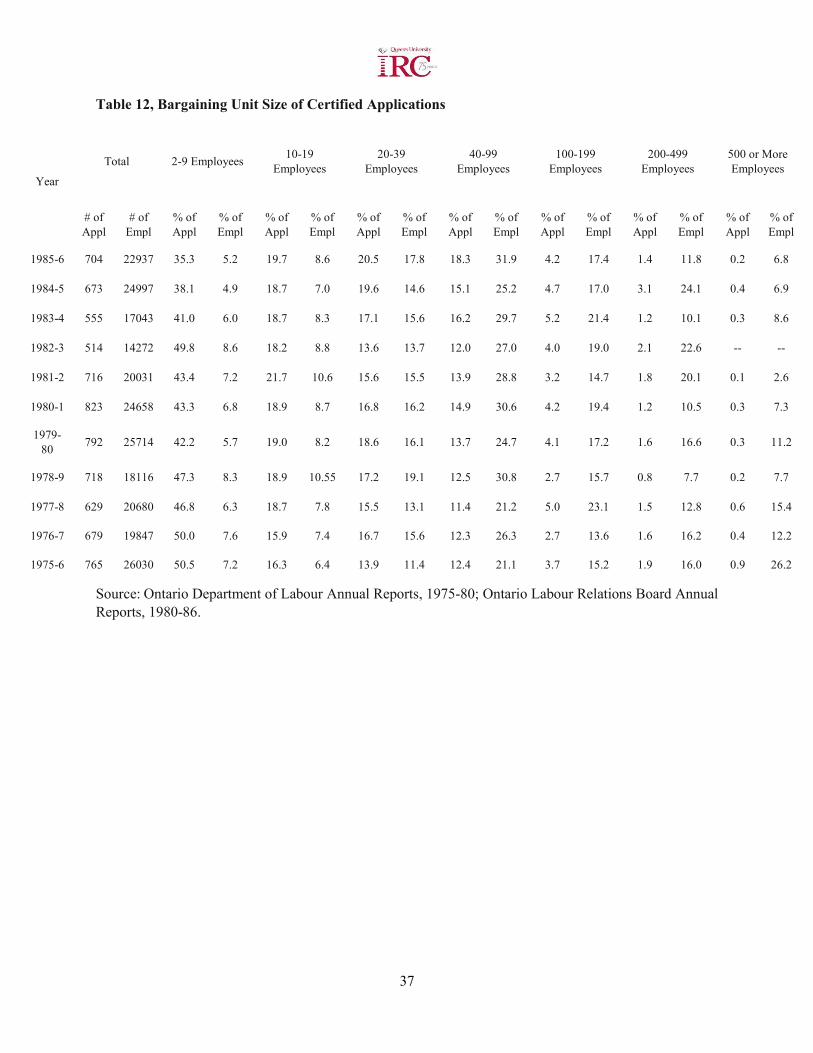
37
Table 12, Bargaining Unit Size of Certified Applications
Year
Total 2-9 Employees 10-19 Employees
20-39 Employees
40-99 Employees
100-199 Employees
200-499 Employees
500 or More Employees
# of Appl
# of Empl
% of Appl
% of Empl
% of Appl
% of Empl
% of Appl
% of Empl
% of Appl
% of Empl
% of Appl
% of Empl
% of Appl
% of Empl
% of Appl
% of Empl
1985-6 704 22937 35.3 5.2 19.7 8.6 20.5 17.8 18.3 31.9 4.2 17.4 1.4 11.8 0.2 6.8
1984-5 673 24997 38.1 4.9 18.7 7.0 19.6 14.6 15.1 25.2 4.7 17.0 3.1 24.1 0.4 6.9
1983-4 555 17043 41.0 6.0 18.7 8.3 17.1 15.6 16.2 29.7 5.2 21.4 1.2 10.1 0.3 8.6
1982-3 514 14272 49.8 8.6 18.2 8.8 13.6 13.7 12.0 27.0 4.0 19.0 2.1 22.6 -- --
1981-2 716 20031 43.4 7.2 21.7 10.6 15.6 15.5 13.9 28.8 3.2 14.7 1.8 20.1 0.1 2.6
1980-1 823 24658 43.3 6.8 18.9 8.7 16.8 16.2 14.9 30.6 4.2 19.4 1.2 10.5 0.3 7.3
1979-80 792 25714 42.2 5.7 19.0 8.2 18.6 16.1 13.7 24.7 4.1 17.2 1.6 16.6 0.3 11.2
1978-9 718 18116 47.3 8.3 18.9 10.55 17.2 19.1 12.5 30.8 2.7 15.7 0.8 7.7 0.2 7.7
1977-8 629 20680 46.8 6.3 18.7 7.8 15.5 13.1 11.4 21.2 5.0 23.1 1.5 12.8 0.6 15.4
1976-7 679 19847 50.0 7.6 15.9 7.4 16.7 15.6 12.3 26.3 2.7 13.6 1.6 16.2 0.4 12.2
1975-6 765 26030 50.5 7.2 16.3 6.4 13.9 11.4 12.4 21.1 3.7 15.2 1.9 16.0 0.9 26.2
Source: Ontario Department of Labour Annual Reports, 1975-80; Ontario Labour Relations Board Annual Reports, 1980-86.
38
Certifications: Occupation and Status Distribution
The last set of statistics to be considered in this study present a sort of snapshot of certification activity by employment status and occupation in the province of Ontario in the fiscal year 1985-86. The tables are the first of their kind compiled by the Ontario Labour Relations Board and published in their annual report. Tables XIII and XIV present the employment status of employees in bargaining units certified according to an industry and union breakdown respectively. Tables XV and XVI present the occupational groups in bargaining units certified according to industry and union breakdown respectively. The two most salient points which emerge from these four tables for the single fiscal year 1985-86 is the heavy concentration of employees certified in the traditionally highly unionized sectors of full-time, and production and related employment; and the very modest gains which were made in this fiscal year in the traditional non-union sectors of part-time employment, and professional, office/clerical/technical, and sales employment. Tables XIII and XIV, although inadequate because of the high number of employees whose status is not known, clearly underscores the dominance of full-time employees in the total number of workers certified. Of those workers whose status is known, 16.1 per cent were part-time employees. This figure may be considered quite encouraging to the union movement, but it nonetheless suggests that the labour movement has not yet completely resolved the problems involved in organizing part-time workers. Similarly, Tables XV and XVI point out that only 13.9 per cent of certified employees were in the burgeoning sectors of office/clerical/technical, professional, and sales employment. It should be noted that many service sector jobs, such as in present a sort of snapshot of certification activity by employment status and occupation in the province of Ontario in the fiscal year 1985-86. The tables are the first of their kind compiled by the Ontario Labour Relations Board and published in their annual report. Tables XIII and XIV present the employment status of employees in bargaining units certified according to an industry and union breakdown respectively. Tables XV and XVI present the occupational groups in bargaining units certified according to industry and union breakdown respectively. The two most salient points which emerge from these four tables for the single fiscal year 1985-86 is the heavy concentration of employees certified in the traditionally highly unionized sectors of full-time, and production and related employment; and the very modest gains which were made in this fiscal year in the traditional non-union sectors of part-time employment, and professional, office/clerical/technical, and sales employment. Tables XIII and XIV, although inadequate because of the high number of employees whose status is not known, clearly underscores the dominance of full-time employees in the total number of workers certified. Of those workers whose status is known, 16.1 per cent were part-time employees. This figure may be considered quite encouraging to the union movement, but it nonetheless suggests that the labour movement has not yet completely resolved the problems involved in organizing part-time workers. Similarly, Tables XV and XVI point out that only 13.9 per cent of certified employees were in the burgeoning sectors of office/clerical/technical, professional, and sales employment. It should be noted that many service sector jobs, such as in accommodation and food services, are listed under Production and Related employment. Nevertheless, the figure of 13.9 per cent is a poor showing in sectors of the economy which are growing so rapidly in relation to manufacturing and other production related industries. It is not possible to extrapolate too far with data for a single fiscal year, but these four tables covering various aspects of the composition of the bargaining units certified in 1985-86 point to the labour movement's failure to fully penetrate the sectors of part-time, white-collar, and professional employment, sectors that are critical to the union movement's future in the province of Ontario.
39
Table 13, Employment Status of Employees in Bargaining Units Certified by Industry, Fiscal Year 1985-86
Industry All Units Full-time Part-time Full-time & Part-time
All Employees No Exclusion Specified
Number Empls Number Empls Number Empls Number Empls Number Empls All Industries 771 22937 246 8631 -- -- 72 2,110 388 10,537 Manufacturing 189 8816 94 4204 -- -- 16 828 77 3,967
Food, beverages 22 856 13 599 -- -- 2 44 7 213 Rubber, plastic
products 24 1031 5 310 -- -- 3 190 6 531
Textile mill products 8 384 5 326 -- -- — — 3 58 Clothing Industries 5 639 3 419 -- -- — — 2 220
Wood Products 9 405 6 193 -- -- — — 3 212 Furniture, fixtures 11 428 4 199 -- -- 1 38 6 191
Paper, allied products 8 418 5 312 -- -- 1 36 2 70 Printing, publishing 16 1315 13 336 -- -- — — 3 979
Primary metal industries 5 290 2 110 -- -- 2 154 1 26
Metal Fabricating industries 31 1208 7 232 -- -- 2 34 22 942
Machinery, except electrical 13 236 7 178 -- -- 1 24 5 34
Transportation equipment 9 487 5 336 -- -- 1 41 3 110
Electrical products 5 201 2 63 -- -- 1 14 2 124 Non-metallic mineral
products 16 440 9 267 1 2 — — 6 171
Chemical Products 7 193 5 158 -- -- — — 2 35 Miscellaneous manufacturing 10 285 3 166 1 15 2 53 4 51
Non-Manufacturing 582 14121 152 4427 63 1642 56 1,482 311 6,570 Mining, quarrying 5 243 1 148 -- -- — — 4 95
Transportation 19 797 6 47 3 19 — — 10 731 Storage 4 52 1 22 -- -- — — 3 30
Electric, gas, water 5 41 3 28 -- -- — — 2 13 Wholesale trade 40 825 18 409 4 17 3 179 15 220
Retail trade 45 1263 20 513 4 52 10 272 11 426 Finance, insurance 4 18 1 3 1 3 — — 2 12
Real estate 13 87 4 41 1 4 1 16 7 26 Education, related
services 34 1411 9 211 9 668 8 86 8 446
Health, welfare services 137 4071 44 1644 25 589 23 628 45 1,210
Recreational services 4 87 2 79 1 3 — — 1 5 Management services 4 94 1 9 -- -- — — 3 85 Accommodation, food
services 76 2963 18 826 9 178 5 139 44 1,820
Other services 34 907 13 331 2 12 — — 19 564 Local government 25 382 10 111 4 97 5 127 6 47
Construction 133 880 1 5 -- -- 1 35 131 840 Source: Ontario Labour Relations Board Annual Report 1985-86
40
Table 14, Employment Status of Employees in Bargaining Units Certified by Union Fiscal Year 1985-86
Industry All Units Full-time Part-time Full-time & Part-time All Employees No
Exclusion Specified
Number Empls Number Empls Number Empls Number Empls Number Empls
All Unions 77 22937 246 8631 65 1659 72 2110 388 10537
CLC 460 18,006 176 1,175 41 738 62 1,867 181 8,226 Aluminum Brick and
Glass Wkrs 2 66 2 66 — — — — -
Auto Workers 28 1,446 8 624 1 3 2 155 17 664 Bakery and Tobacco
Workers 2 213 1 141 — — — — 1 72
Brewery and Soft Drink Workers 4 116 1 38 — — 1 17 2 61
Canadian Brewery Workers
8 102 6 66 — — 2 36 — -
Canadian Paperworkers 10 1,108 4 99 2 5 1 36 3 968
Canadian Public Employees (COPE) 59 2,133 23 1,070 7 83 12 413 17 567
CLC Directly Chartered 1 4 — — — — -- — 1 4
Clothing and Textile Workers 5 320 5 320 — — — — — -
Electrical Workers (UE) 1 39 1 39 — — — — — -
Energy and Chemical Workers 6 142 4 100 — — 1 20 1 22
Food and Commercial Workers
60 1,698 25 638 7 118 9 231 19 711
Graphic Communication Union 10 439 8 367 — — — — 2 72
Hotel Employees 56 2,237 12 544 5 103 3 47 36 1,543
Ladies Garment Workers 3 408 3 408 — — — — — -
Machinists 3 94 1 48 — — — — 2 46 Newspaper Guild 1 146 1 146 — — — — — -
Office and Professional Empls 2 20 1 6 — — — — 1 14
Ontario Public Service Empls
47 961 20 428 6 95 10 112 11 326
Postal Workers 2 83 — — — — — — 2 83
Railway, Transport and General Workers 3 57 2 34 — — — — 1 23
Retail Wholesale Employees
41 2,020 16 711 3 19 7 225 15 1,065
41
Service Employees International 42 1,241 10 264 7 261 6 116 19 600
Technical Engineers 1 14 — — — — 1 14 — - Theatrical Stage
Employees 1 5 — — — — — — 1 5
Typographical Union 2 44 2 44 — — — — — - United Steelworkers 53 2,601 15 783 3 51 6 407 29 1,360
United Textile Workers ' 1 20 — ' — — — — 1 20
Woodworkers 6 229 5 191 — — 1 38 — — Non-CLC 311 4,931 70 1,456 24 921 10 243 207 2,311
Allied Health Professionals 1 46 — — — — 1 46 — -
Asbestos Workers 1 2 — — — — — — 1 2
Boilermakers 4 99 2 36 — — — — 2 63
Bricklayers International 7 36 — — — — — — 7 36
Carpenters 26 500 4 198 — — 2 34 20 268
Canadian Operating Engineers 4 116 — — 1 15 — — 3 101
Canadian Steelworkers 2 18 1 11 1 7 — — — —
Christian Labour Association 6 155 2 47 1 20 — — 3 88
Electrical Workers (IBEW) 8 79 4 37 — — — — 4 42
Food and Service Workers 1 69 — — — — 1 69 — -
Independent Local Union 25 582 9 136 3 185 2 37 11 224
International Operating Engineers 52 505 4 35 1 22 1 35 46 413
Labourers 53 610 6 259 1 4 1 16 45 331
Ontario Nurses Association 24 288 6 71 78 100 — — 10 117
Ontario Secondary School Teachers 6 694 — — 5 541 — — 1 153
Painters 7 50 — — — — — — 7 50
Plant Guard Workers 3 22 1 18 1 2 1 2 — -
Plumbers 14 75 — — — — 1 4 13 71
Sheet Metal Workers 12 44 — — — — — — 12 44
Structural Iron Workers 5 69 1 25 — — — — 4 44
Teamsters 46 734 27 461 2 25 — — 17 248
Textile Processors 4 138 3 122 — — — — 1 16
Source: Ontario Labour Relations Board Annual Report 1985-86
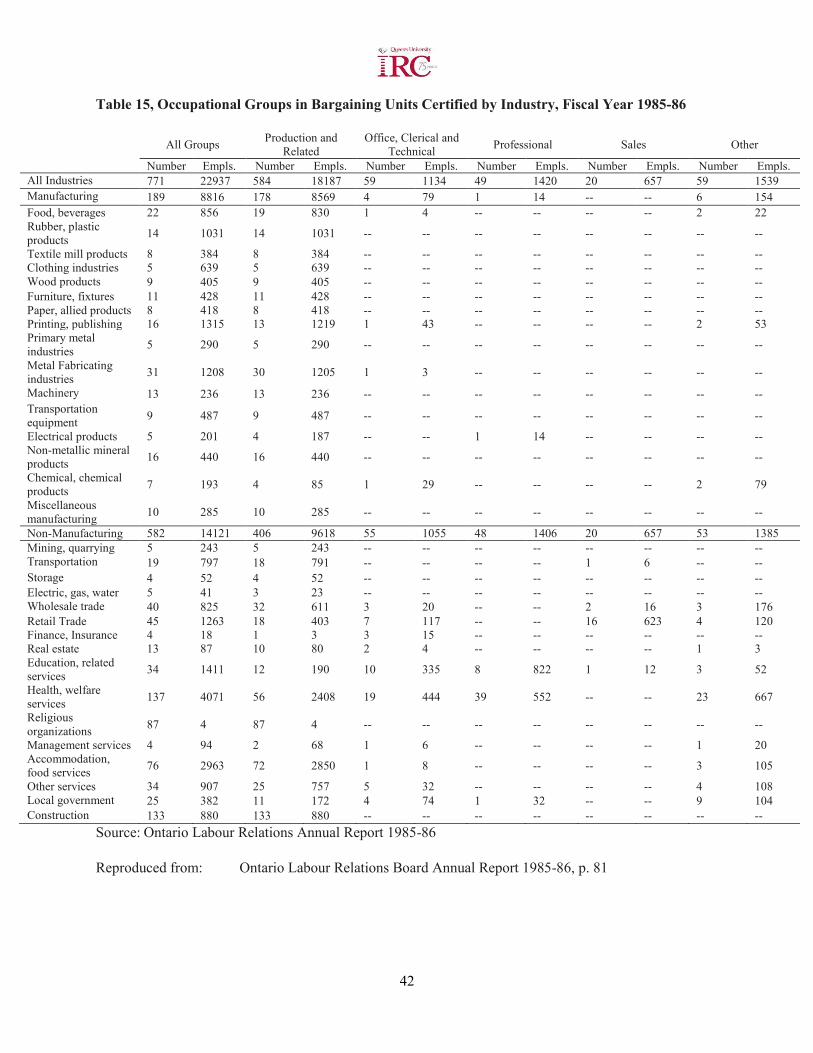
42
Table 15, Occupational Groups in Bargaining Units Certified by Industry, Fiscal Year 1985-86
All Groups Production and Related
Office, Clerical and Technical Professional Sales Other
Number Empls. Number Empls. Number Empls. Number Empls. Number Empls. Number Empls. All Industries 771 22937 584 18187 59 1134 49 1420 20 657 59 1539 Manufacturing 189 8816 178 8569 4 79 1 14 -- -- 6 154 Food, beverages 22 856 19 830 1 4 -- -- -- -- 2 22 Rubber, plastic products 14 1031 14 1031 -- -- -- -- -- -- -- --
Textile mill products 8 384 8 384 -- -- -- -- -- -- -- -- Clothing industries 5 639 5 639 -- -- -- -- -- -- -- -- Wood products 9 405 9 405 -- -- -- -- -- -- -- -- Furniture, fixtures 11 428 11 428 -- -- -- -- -- -- -- -- Paper, allied products 8 418 8 418 -- -- -- -- -- -- -- -- Printing, publishing 16 1315 13 1219 1 43 -- -- -- -- 2 53 Primary metal industries 5 290 5 290 -- -- -- -- -- -- -- --
Metal Fabricating industries 31 1208 30 1205 1 3 -- -- -- -- -- --
Machinery 13 236 13 236 -- -- -- -- -- -- -- -- Transportation equipment 9 487 9 487 -- -- -- -- -- -- -- --
Electrical products 5 201 4 187 -- -- 1 14 -- -- -- -- Non-metallic mineral products 16 440 16 440 -- -- -- -- -- -- -- --
Chemical, chemical products 7 193 4 85 1 29 -- -- -- -- 2 79
Miscellaneous manufacturing 10 285 10 285 -- -- -- -- -- -- -- --
Non-Manufacturing 582 14121 406 9618 55 1055 48 1406 20 657 53 1385 Mining, quarrying 5 243 5 243 -- -- -- -- -- -- -- -- Transportation 19 797 18 791 -- -- -- -- 1 6 -- -- Storage 4 52 4 52 -- -- -- -- -- -- -- -- Electric, gas, water 5 41 3 23 -- -- -- -- -- -- -- -- Wholesale trade 40 825 32 611 3 20 -- -- 2 16 3 176 Retail Trade 45 1263 18 403 7 117 -- -- 16 623 4 120 Finance, Insurance 4 18 1 3 3 15 -- -- -- -- -- -- Real estate 13 87 10 80 2 4 -- -- -- -- 1 3 Education, related services 34 1411 12 190 10 335 8 822 1 12 3 52
Health, welfare services 137 4071 56 2408 19 444 39 552 -- -- 23 667
Religious organizations 87 4 87 4 -- -- -- -- -- -- -- --
Management services 4 94 2 68 1 6 -- -- -- -- 1 20 Accommodation, food services 76 2963 72 2850 1 8 -- -- -- -- 3 105
Other services 34 907 25 757 5 32 -- -- -- -- 4 108 Local government 25 382 11 172 4 74 1 32 -- -- 9 104 Construction 133 880 133 880 -- -- -- -- -- -- -- --
Source: Ontario Labour Relations Annual Report 1985-86
Reproduced from: Ontario Labour Relations Board Annual Report 1985-86, p. 81
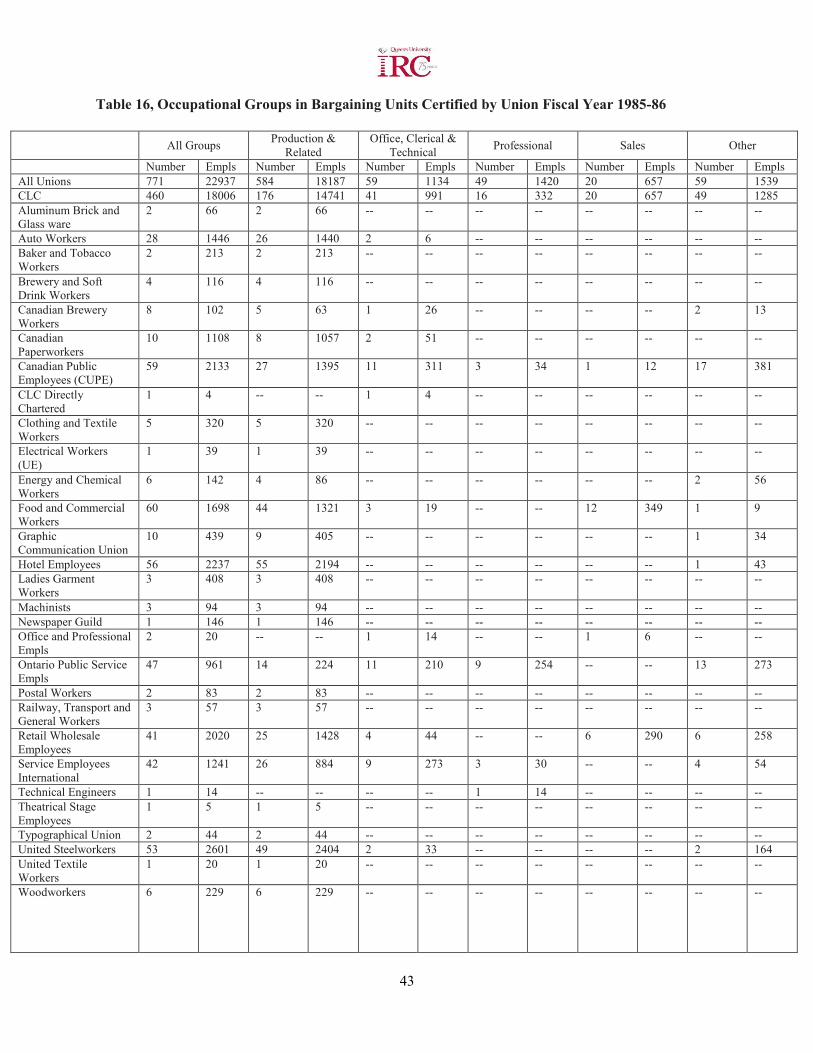
43
Table 16, Occupational Groups in Bargaining Units Certified by Union Fiscal Year 1985-86
All Groups Production & Related
Office, Clerical & Technical Professional Sales Other
Number Empls Number Empls Number Empls Number Empls Number Empls Number Empls All Unions 771 22937 584 18187 59 1134 49 1420 20 657 59 1539 CLC 460 18006 176 14741 41 991 16 332 20 657 49 1285 Aluminum Brick and Glass ware
2 66 2 66 -- -- -- -- -- -- -- --
Auto Workers 28 1446 26 1440 2 6 -- -- -- -- -- -- Baker and Tobacco Workers
2 213 2 213 -- -- -- -- -- -- -- --
Brewery and Soft Drink Workers
4 116 4 116 -- -- -- -- -- -- -- --
Canadian Brewery Workers
8 102 5 63 1 26 -- -- -- -- 2 13
Canadian Paperworkers
10 1108 8 1057 2 51 -- -- -- -- -- --
Canadian Public Employees (CUPE)
59 2133 27 1395 11 311 3 34 1 12 17 381
CLC Directly Chartered
1 4 -- -- 1 4 -- -- -- -- -- --
Clothing and Textile Workers
5 320 5 320 -- -- -- -- -- -- -- --
Electrical Workers (UE)
1 39 1 39 -- -- -- -- -- -- -- --
Energy and Chemical Workers
6 142 4 86 -- -- -- -- -- -- 2 56
Food and Commercial Workers
60 1698 44 1321 3 19 -- -- 12 349 1 9
Graphic Communication Union
10 439 9 405 -- -- -- -- -- -- 1 34
Hotel Employees 56 2237 55 2194 -- -- -- -- -- -- 1 43 Ladies Garment Workers
3 408 3 408 -- -- -- -- -- -- -- --
Machinists 3 94 3 94 -- -- -- -- -- -- -- -- Newspaper Guild 1 146 1 146 -- -- -- -- -- -- -- -- Office and Professional Empls
2 20 -- -- 1 14 -- -- 1 6 -- --
Ontario Public Service Empls
47 961 14 224 11 210 9 254 -- -- 13 273
Postal Workers 2 83 2 83 -- -- -- -- -- -- -- -- Railway, Transport and General Workers
3 57 3 57 -- -- -- -- -- -- -- --
Retail Wholesale Employees
41 2020 25 1428 4 44 -- -- 6 290 6 258
Service Employees International
42 1241 26 884 9 273 3 30 -- -- 4 54
Technical Engineers 1 14 -- -- -- -- 1 14 -- -- -- -- Theatrical Stage Employees
1 5 1 5 -- -- -- -- -- -- -- --
Typographical Union 2 44 2 44 -- -- -- -- -- -- -- -- United Steelworkers 53 2601 49 2404 2 33 -- -- -- -- 2 164 United Textile Workers
1 20 1 20 -- -- -- -- -- -- -- --
Woodworkers 6 229 6 229 -- -- -- -- -- -- -- --
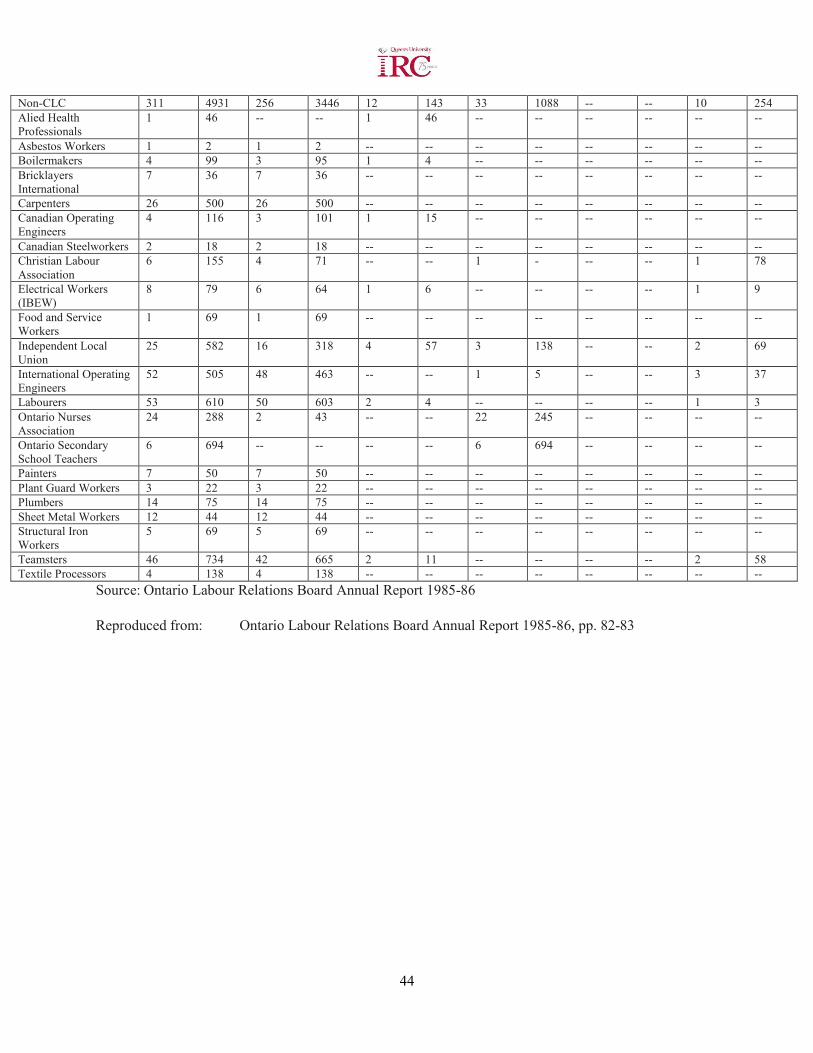
44
Non-CLC 311 4931 256 3446 12 143 33 1088 -- -- 10 254 Alied Health Professionals
1 46 -- -- 1 46 -- -- -- -- -- --
Asbestos Workers 1 2 1 2 -- -- -- -- -- -- -- -- Boilermakers 4 99 3 95 1 4 -- -- -- -- -- -- Bricklayers International
7 36 7 36 -- -- -- -- -- -- -- --
Carpenters 26 500 26 500 -- -- -- -- -- -- -- -- Canadian Operating Engineers
4 116 3 101 1 15 -- -- -- -- -- --
Canadian Steelworkers 2 18 2 18 -- -- -- -- -- -- -- -- Christian Labour Association
6 155 4 71 -- -- 1 - -- -- 1 78
Electrical Workers (IBEW)
8 79 6 64 1 6 -- -- -- -- 1 9
Food and Service Workers
1 69 1 69 -- -- -- -- -- -- -- --
Independent Local Union
25 582 16 318 4 57 3 138 -- -- 2 69
International Operating Engineers
52 505 48 463 -- -- 1 5 -- -- 3 37
Labourers 53 610 50 603 2 4 -- -- -- -- 1 3 Ontario Nurses Association
24 288 2 43 -- -- 22 245 -- -- -- --
Ontario Secondary School Teachers
6 694 -- -- -- -- 6 694 -- -- -- --
Painters 7 50 7 50 -- -- -- -- -- -- -- -- Plant Guard Workers 3 22 3 22 -- -- -- -- -- -- -- -- Plumbers 14 75 14 75 -- -- -- -- -- -- -- -- Sheet Metal Workers 12 44 12 44 -- -- -- -- -- -- -- -- Structural Iron Workers
5 69 5 69 -- -- -- -- -- -- -- --
Teamsters 46 734 42 665 2 11 -- -- -- -- 2 58 Textile Processors 4 138 4 138 -- -- -- -- -- -- -- --
Source: Ontario Labour Relations Board Annual Report 1985-86
Reproduced from: Ontario Labour Relations Board Annual Report 1985-86, pp. 82-83
45
SUMMARY AND CONCLUSION
The introduction to this paper set out a very broad context for examining union organizing activity in Ontario, as measured by various statistical data on certifications in the province. It was suggested that an analysis of statistics on certifications and decertifications in Ontario might provide a useful perspective for viewing and assessing the current "crisis" in the Canadian labour movement, and for determining the future prospects for unions in Canada. It is now time to return for a moment to these broader issues, and draw from the data on certifications a few general conclusions about the state of union organizing activity in Ontario.
The many tables of statistics on certifications and decertifications in Ontario contained in this paper present a somewhat contradictory view of union organizing activity in the province. On the surface there appears to be much evidence to support the view that the labour movement in Ontario, and perhaps in all of Canada, is in a state of "crisis". Overall the statistics tell the story of union activity in Ontario in decline in the 1980s. The five year annual average number of certifications granted in the 1980s are at a. twenty year low, as are the five year annual average number of employees certified. Similarly the union success rate in certification votes has slid in the 1980s from the peak period (according to available statistics) of the early 1970s. The trends in decertifications are even more discouraging to the labour movement. Throughout the 1970s and 1980s there virtually has been a steady and uninterrupted increase in both the number of decertifications filed with the Ontario Labour Relations Board, and, more important, in the number of applications granted. To further darken the outlook for the future of unions in Ontario, statistics contained in Tables X to XVI - which provide breakdowns by industry, union, occupation and employee status for bargaining units and employees certified - indicate that the labour movement has made only very small gains in organizing traditionally non-union sectors of industry, such as white-collar, part-time, office/clerical, sales, and professional employment. It appears that the labour movement has been unable to effectively penetrate those non-manufacturing sectors of the labour force in which the bulk of the increase in jobs has occurred. Each of these indicators of union organizing activity in Ontario bode ill for the labour movement in the province. They also confirm speculation about stagnation and decline in this important area of union activity in Ontario.
Below the surface, however, there are two items to encourage the labour movement in the midst of these other gloomy indicators of union organizing activity in Ontario. The first is the rebound in the number of certifications granted in the years 1984-86. From 1982 to 1986 the number of certifications granted in Ontario rose by 36 per cent, to a level comparable to the 1970s. What this trend suggests is that the labour movement will return to its previous level of organizing activity in Ontario as the Canadian economy recovers from the longest and deepest recession of the post-World War II period. It is important to stress that the decline in union organizing activity in the 1980s coincided with a decline in the Canadian economy. The Canadian economy is now in its fourth year of recovery from the recession of 1981-82, and significantly union organizing in Ontario also has experienced an upturn (Current Scene 1986, 3). It would appear from the evidence of the recent rebound in union organizing activity in Ontario that the troubles faced in the 1980s in this area by the labour movement were of a cyclical and not a structural nature. The labour movement simply suffered losses in organizing activity as a result of the downturn in the Canadian economy in the 1970s and 1980s; and there is evidence to suggest it will recoup its losses in the period of economic recovery. The situation in Ontario is in marked contrast to the union organizing
46
activity in the United States described by Seymour Martin Lipset. In Lipset's analysis there is evidence to show that the number of certifications granted in the United States has declined steadily in the past thirty years regardless of fluctuations in the American economy (Lipset 1986, xvi). In the United States clearly there are structural problems in the labour movement. In Ontario the problems in union organizing in the 1980s appear more cyclical in nature.
The second item of encouragement to the labour movement is the overall stability in its organizing activities in the 1980s. Above, reference was made to Tables X to XVI to illustrate the labour movement's failure to make inroads in organizing traditional non-union sectors of industry and new labour market entrants such as white-collar, part-time, and professional employees. To return to these tables, it is also true that they point out a high degree of continuity in the labour movement's organizing activities according to distributions by industry, union, bargaining unit size, occupation, and employee status. While this is an indication of a lack of innovation in the union movement's organizing strategies, it also is a sign that there has been no breakdown of the basic institutional framework of union organizing in Ontario. In the 1980s there was a decline in all sectors of union organizing in Ontario; but it is significant that no sector -as defined by an industry or union distribution-was entirely wiped out or even badly weakened in relation to the other sectors of union organizing activity. It is difficult to single out any sector of union organizing activity as being a more serious casualty than the others in the general decline in organizing activity in the 1980s. On the contrary, there was a high degree of stability and continuity in the composition of certifications granted in the 1970s and 1980s. What this result suggests is that the union movement's organizing activities have not been fundamentally altered in the 1980s. This is good news to the unions, for although there has been in the 1980s a loss of momentum in organizing activity, the relatively successful institutional framework for organizing new members which was in place in the 1970s has not been broken-down, as perhaps many observers have believed. This overall stability and reliability in the labour movement's organizing activity is to the labour movement a hopeful sign. It does not guarantee a bright and prosperous future for unions in Ontario - to achieve that the labour movement must be more innovative in organizing new members; but it at least suggests that one important institutional mechanism for increasing total union membership in the province remains firmly in place.
The challenge facing the union movement in the "crisis" years of the 1980s is to maintain and strive to increase its total membership and its union density level. It will require innovation and renewed initiative by the labour movement to confront and overcome a difficult and changing economic environment, the apathy of many new labour market entrants, new more sophisticated employer resistance strategies, and an uncertain future for some industrial relations legal and public policy issues. Some indicators of the strength of the union movement in Canada, like the statistics on declining union density, suggest that the labour movement has not been completely successful in meeting the challenges of the 1980s, and may face further decline. As another indicator of the performance of the union movement in the 1980s, the statistics on certifications and decertifications in Ontario present a more hopeful picture of the future for the union movement in Canada. In general the statistics underscore the stability and vigor of the labour movement's organizing activities in Ontario. Although hard hit by the recession of 1981-82, the organizing activities of the union movement rebounded after 1984 to levels comparable to the generally more prosperous decade of the 1970s. Throughout the 1970s and 1980s, as Table IX illustrates, union organizing as measured by certifications granted continued to make very significant contributions to the year-to-year change in total union membership in Ontario. This situation bodes well for the labour movement, which if it is to continue to expand its membership must more aggressively and successfully organize the unorganized work force. The statistics on union organizing in Ontario suggest it has a solid foundation on which to further build up its organizing activities.
47
BIBLIOGRAPHY
Anderson, Hugh. 1983. "Tough times are putting unions on the spot". The Montreal Gazette. 27 August 1983.
Anderson, John C. and Gunderson, Morley. 1982. Union-Management Relations in Canada. Don Mills, Canada: Addison-Wesley Publishers.
Arthurs, H.W., Carter, D.D., and Glasbeek, H.J. 1984. Labour Law and Industrial Relations in Canada. 2nd Edition. Scarborough, Ontario: Butterworths and Co.
Bain, George Sayers. 1978. Union Growth and Public Policy in Canada. Ottawa: Labour Canada.
Carter, Donald D. 1987. "The Comparative Effects of U.S. and Canadian Labour Laws and Labour Environment in the North American Competitive Context - The Canadian View". Cleveland, Ohio: Paper presented to Canada/U.S. Law Institute Conference on Competition and Dispute Resolution in the North American Context. 4 April 1987.
Corelli, Rae. 1987. "Labor's Fight to Survive". Maclean's: Canada's Weekly Newsmagazine. 13 July 1987, pp. 28-31.
Corporations and Labour Unions Returns Act Annual Reports. 19681984. Ottawa: Ministry of Industry, Trade and Commerce.
Current Industrial Relations Scene in Canada 1983. Ed. By W.D.Wood and Pradeep Kumar. Kingston: Industrial Relations Centre, Queen's University.
Current Industrial Relations Scene in Canada 1986. Ed. by Pradeep Kumar, Mary Lou Coates and David Arrowsmith. Kingston: Industrial Relations Centre, Queen's University.
Eaton, J.K. 1976. Union Growth in Canada in the Sixties. Ottawa: Labour Canada.
Government of Ontario. 1986. Labour Relations Act. Ottawa: Queen's Printer for Ontario.
Kochan, Thomas, Katz, Harry and McKersie, Robert. 1986. The Transformation of American Industrial Relations. New York: Basic Books.
Kumar, Pradeep. 1986. "Union Growth in Canada: Retrospect and Prospect" in W. Craig Riddell, Ed., Canadian Labour Relations. Toronto: University of Toronto Press.
Larson, Peter E. 1986. "Fighting for Labour". Canadian Business Review. Volume 13, No. 4, Winter 1986, pp.8-12.
Lipset, Seymour Martin. 1986. Unions in Transition. San Francisco: ICS Press.
List, Wilfred. 1983. "Unions are in doldrums with stagnant economy". The Globe and Mail. 3 September 1983, p.4.
48
Ontario Department (Ministry) of Labour Annual Reports. 1960-1980.
Ontario Labour Relations Annual Reports. 1980-1986.
Robinson, Jennifer. "Crisis of faith endangers unions, says new CUPE boss". The Montreal Gazette. 16 November 1983, p.Bl.
Sack, Jeffrey and Levinson, Martin. 1973. Ontario Labour Relations Board Practice. Toronto: Butterworths and Co.
Shilton Lennon, Elizabeth. 1980. "Organizing the Unorganized: Unionization in the Chartered Banks of Canada". Osgoode Hall Law Journal. Volume 18, No. 2, August 1980.
Struthers, James, Huxley, Christopher and Kettler, David. 1986. "Is Canada's Experience 'Especially Instructive'?" in Seymour Martin Lipset, Ed., Unions in Transition. San Francisco: ICS Press.
Trowbridge, Alexander B. 1986."A Management Look at Labor Relations" in Seymour Martin Lipset, Ed., Unions in Transition. San Francisco: ICS Press.
Van Loon, Richard and Whittington. 1976. The Canadian Political System. 2nd Edition. Toronto: McGraw-Hill Ryerson Ltd.
Weiler, Paul. 1983. "Promises to Keep: Securing Workers' Rights Under the NRLA". Harvard Law Review. Volume 96, No. 8, June 1983.
Industrial Relations Centre (IRC)
Queen’s University Kingston, ON K7L 3N6
irc.queensu.ca