Embed Size (px)
Citation preview
Savills Commercial Research Retail 2017
savills.co.uk/research
Retail Revolutions The Rise of the Community Shopping Centre
In partnership with
02 | Spotlight: Retail Revolutions
SU
MM
AR
Y
Retail is dead and it’s all about the internet. It must be true as I’ve read it in the newspaper! This is the dominant narrative and one that has been broadly accepted, without further questioning or scrutiny, by a largely London based well-heeled set of middle aged non-shopping property investors. Certain commentators feel that beyond a handful of prime regional shopping centres that everything else is secondary and should be avoided at all costs.
Politicians have discovered that educated urban elites are not in touch with the way that real people feel and act. Could the same be true of the property industry?
Ellandi wanted to examine real shopping patterns to discover if retail property really is an endangered species in an online world or if shops still had relevance to how people live their everyday lives. To do so we undertook a survey of 7,800 people across 25 shopping centres from St Austell to Aberdeen and Enniskillen to Great Yarmouth.
We asked Savills Research to analyse the shopper behaviour from the consumer survey and consider these in the context of trends in the wider market. The research is supported with data that examines retailer estates, the number of openings /
closures, and the provision profiles of shopping centre locations across the UK. Given the death of the high street narrative, these figures are surprisingly positive.
Their examination of retailer turnover and operating costs by location suggests that retailers have a clear understanding of where and how they make money.
The conclusions provide interesting insight. The data highlights that the retail industry is evolving to meet the demands and needs of the UK population. People increasingly demand convenience, value for money and entertainment but they are willing to fulfil these needs in different places and at different times.
This Savills Research publication highlights the polarisation of shopping patterns; with powerful destination centres that are visited occasionally and functional local shopping that fits around busy everyday life. These patterns are reflected across a wide geography and across socio-economic groups.
It seems that local retail space is in fact increasingly relevant, fulfilling an important need for everyday shopping essentials. We hope this paper is enlightening and allow a better understanding of the evolution in retail patterns.
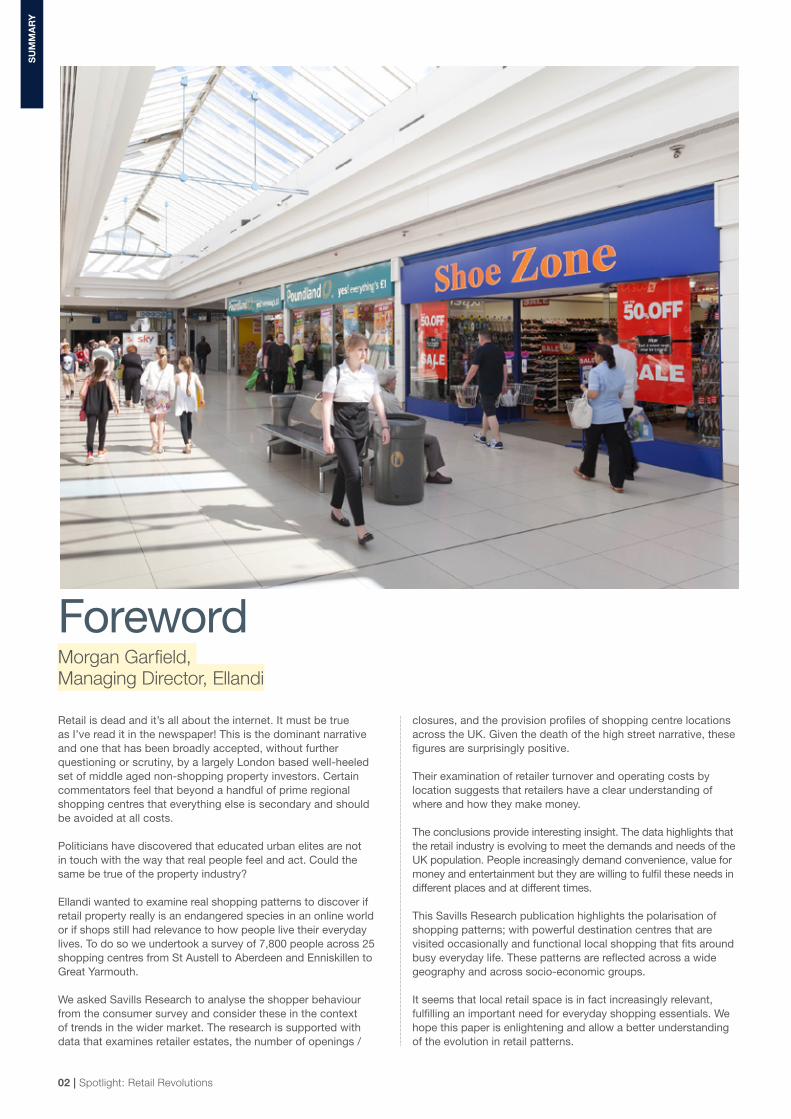
Foreword Morgan Garfield, Managing Director, Ellandi
savills.co.uk/research | 03
Non-prime high streets and shopping centres have been talked down for the last decade, but the reality shows that they are as relevant today as they always have been. Places to shop for every day goods, socialise and be part of the civic environment.
Modern lifestyles, the economic environment and significant advances in technology have collectively altered consumer behaviour and shopping habits in the UK. The subsectors that benefit most from these emerging trends are Online, Value and Convenience retail.
Community shopping centres are an important asset class in their own right and there is good reason to believe that their offer, tuned to the local shopper, is more defensive than other kinds of retail location, given further challenges anticipated in consumer spending and the wider economy.
In this latest research, Savills have looked at the consumer perspective of the importance of local shopping journeys, with particular reference to Community shopping centres. We have analysed exit surveys from across Ellandi’s portfolio of shopping centres, to identify what it is that is driving these shopping trips.
Our research looks at how retailers whose shops are closely aligned with shopping centre locations, have evolved their portfolios with changing consumer preferences. We see how store numbers have grown significantly, or consolidated less dramatically in many sectors than was expected immediately following the Global Financial Crisis.
Our consumer insights show:■ Travel is short (79% within 20 minutes)■ Frequency is high (78% at least weekly); higher than regional malls, major high streets or online purchases■ Dwell is surprisingly long (44% over 1hr)■ Basket spend averages £36.60 per visit■ Demographic profile shows that the offer suits the needs of all consumer groups■ Convenience key driver of visits (65%), yet highest basket spend is for other retail categories■ F&B is not the ‘holy grail’ for all classes of shopping centre
Our retailer insights show:■ Key sector brands have an average of 57% of their portfolio in the secondary market, with many core brands having +200 stores■ The need for many retailers to have large portfolios inevitably means a strong reliance on more Secondary and Community shopping centre locations.■ Lower occupational costs mean stronger retailer affordability, profitability and sustainability
We also explore what makes a successful local shopping centre. A strong fit with the catchment is fundamental for any retail location, irrespective of their offer or catchment size. However, this is particularly pertinent to Community shopping centres. As these schemes draw from a very local catchment, meeting the functional, Convenience and Value needs of the everyday shopper is paramount.
Locations that have evolved supply to meet the cyclical and structural changes of the last decade should be the most adept at coping with future challenges. Furthermore, good management of local shopping schemes with a strong fit to catchment can see a marked improvement in footfall, void rates and retailer affordability.
SUMMARY
■ Shopping journeys are polarised between occasional destination shopping trips and essential, convenience based local shopping trips.
■ Locations that support a higher proportion of ‘needs based’ journeys account for the highest proportion of consumer spend and are the backbone to retailing in the UK, yet the importance of these places is often underestimated.
■ Community shopping centres support these local consumer shopping trips. They serve a local catchment, have visitor frequency above that of other retail centres, and have longer dwell times and higher basket spend than might be expected.
■ The growth in the Convenience and Value/Discount markets in recent years is closely aligned with the offer in Community shopping centres, where a good fit to the specific needs of the catchment is essential. This includes offering a range of Fashion and Comparison Goods where the brand fits the catchment and scheme profile.
■ Where the tenant mix is well aligned to the needs of the local consumer, Community shopping centres candemonstrate compelling performance metrics, includingstrong footfall, low void rates, high renewal rates and better retailer effort ratios than found in other shopping centre sectors.
Headlines
04 | Spotlight: Retail Revolutions
CO
NS
UM
ER
S
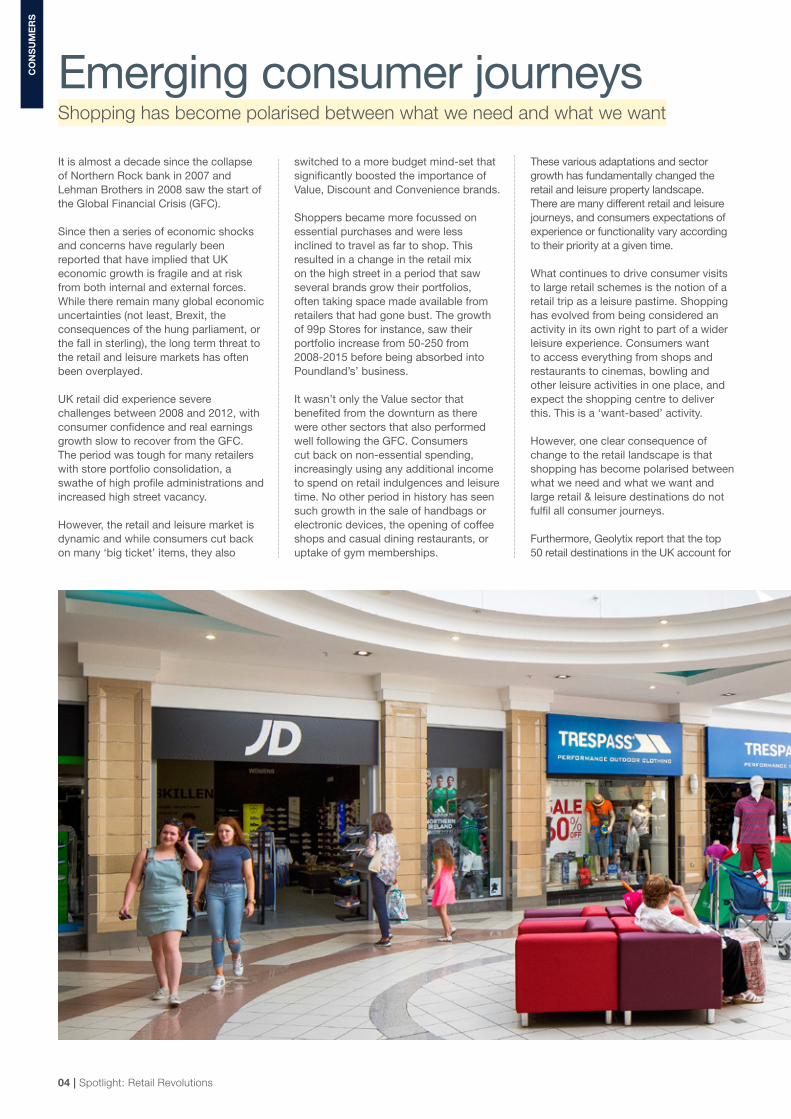
Emerging consumer journeys Shopping has become polarised between what we need and what we want
It is almost a decade since the collapse of Northern Rock bank in 2007 and Lehman Brothers in 2008 saw the start of the Global Financial Crisis (GFC).
Since then a series of economic shocks and concerns have regularly been reported that have implied that UK economic growth is fragile and at risk from both internal and external forces. While there remain many global economic uncertainties (not least, Brexit, the consequences of the hung parliament, or the fall in sterling), the long term threat to the retail and leisure markets has often been overplayed.
UK retail did experience severe challenges between 2008 and 2012, with consumer confidence and real earnings growth slow to recover from the GFC. The period was tough for many retailers with store portfolio consolidation, a swathe of high profile administrations and increased high street vacancy.
However, the retail and leisure market is dynamic and while consumers cut back on many ‘big ticket’ items, they also
switched to a more budget mind-set that significantly boosted the importance of Value, Discount and Convenience brands.
Shoppers became more focussed on essential purchases and were less inclined to travel as far to shop. This resulted in a change in the retail mix on the high street in a period that saw several brands grow their portfolios, often taking space made available from retailers that had gone bust. The growth of 99p Stores for instance, saw their portfolio increase from 50-250 from 2008-2015 before being absorbed into Poundland’s’ business.
It wasn’t only the Value sector that benefited from the downturn as there were other sectors that also performed well following the GFC. Consumers cut back on non-essential spending, increasingly using any additional income to spend on retail indulgences and leisure time. No other period in history has seen such growth in the sale of handbags or electronic devices, the opening of coffee shops and casual dining restaurants, or uptake of gym memberships.
These various adaptations and sector growth has fundamentally changed the retail and leisure property landscape.There are many different retail and leisure journeys, and consumers expectations of experience or functionality vary according to their priority at a given time.
What continues to drive consumer visits to large retail schemes is the notion of a retail trip as a leisure pastime. Shopping has evolved from being considered an activity in its own right to part of a wider leisure experience. Consumers want to access everything from shops and restaurants to cinemas, bowling and other leisure activities in one place, and expect the shopping centre to deliver this. This is a ‘want-based’ activity.
However, one clear consequence of change to the retail landscape is that shopping has become polarised between what we need and what we want and large retail & leisure destinations do not fulfil all consumer journeys.
Furthermore, Geolytix report that the top 50 retail destinations in the UK account for
savills.co.uk/research | 05
“Destination schemes provide high profile less frequent retail experiences, but most shopping trips take place much closer to home”
Tom Whittington, Savills Research
only 13% of Convenience and Comparison Goods expenditure spent in store. What happens to the other 87%?
While destination schemes provide high profile but infrequent retail experiences, most shopping trips take place much closer to home; 78% of consumers visit a local shopping offer more than once a week. This is a ‘needs-based’ shopping trip.
For everyday shopping trips, consumers are time poor, convenience is key, goods purchased are typically essential and bought frequently, with ‘value’ being important both in terms of price point and service experience.
There is clearly a strong relationship with grocery stores and retail services; the rise of the Convenience grocery market in recent years shows how consumers are less willing to travel to large schemes and are more inclined to shop locally more frequently.
However, convenience shopping trips account for more than just grocery goods.
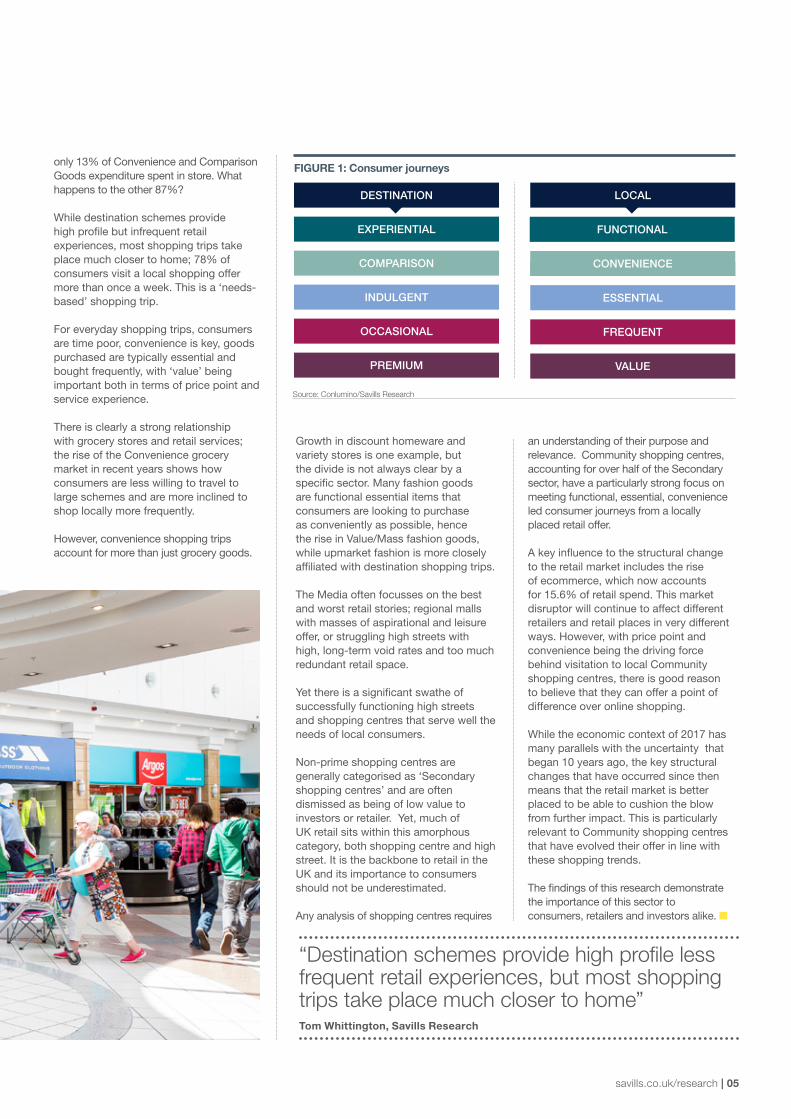
FIGURE 1: Consumer journeys
Source: Conlumino/Savills Research
DESTINATION
EXPERIENTIAL
COMPARISON
INDULGENT ESSENTIAL
OCCASIONAL
PREMIUM
FREQUENT
VALUE
CONVENIENCE
FUNCTIONAL
Growth in discount homeware and variety stores is one example, but the divide is not always clear by a specific sector. Many fashion goods are functional essential items that consumers are looking to purchase as conveniently as possible, hence the rise in Value/Mass fashion goods, while upmarket fashion is more closely affiliated with destination shopping trips.
The Media often focusses on the best and worst retail stories; regional malls with masses of aspirational and leisure offer, or struggling high streets with high, long-term void rates and too much redundant retail space.
Yet there is a significant swathe of successfully functioning high streets and shopping centres that serve well the needs of local consumers.
Non-prime shopping centres are generally categorised as ‘Secondary shopping centres’ and are often dismissed as being of low value to investors or retailer. Yet, much of UK retail sits within this amorphous category, both shopping centre and high street. It is the backbone to retail in the UK and its importance to consumers should not be underestimated.
Any analysis of shopping centres requires
an understanding of their purpose and relevance. Community shopping centres, accounting for over half of the Secondary sector, have a particularly strong focus on meeting functional, essential, convenience led consumer journeys from a locally placed retail offer.
A key influence to the structural change to the retail market includes the rise of ecommerce, which now accounts for 15.6% of retail spend. This market disruptor will continue to affect different retailers and retail places in very different ways. However, with price point and convenience being the driving force behind visitation to local Community shopping centres, there is good reason to believe that they can offer a point of difference over online shopping.
While the economic context of 2017 has many parallels with the uncertainty that began 10 years ago, the key structural changes that have occurred since then means that the retail market is better placed to be able to cushion the blow from further impact. This is particularly relevant to Community shopping centres that have evolved their offer in line with these shopping trends.
The findings of this research demonstrate the importance of this sector to consumers, retailers and investors alike. ■
DESTINATION LOCAL
Consumer insightsWe examine the nature of local shopping trips
Shoppers of all ages and demographics across the UK are using local shopping centres to fulfil a wide range of retail and service needs, including more than just grocery goods.
Analysis of our latest survey into the nature of these local shopping trips has provided several insights into the importance of this sector. The national exit survey of 7,800 shoppers, undertaken across Ellandi’s Community shopping centre portfolio, gives us an accurate account of what is driving these visits.
Local shopping centres often gain more regular visitation from the communities they serve than larger retail destinations. Yet dwell times and basket spend are surprisingly high.
Furthermore, there is increasing evidence that community shopping places can co-exist more readily with ecommerce than larger comparison shopping retail destinations. This is because local shopping centres can provide a key point of difference in the ‘here-and-now’ consumer culture we have grown accustomed to, in terms of availability, convenience, accessibility, service and price point.
Travel, frequency and dwellThe key distinction of functional, convenient retail places is that they serve a local population, with journey
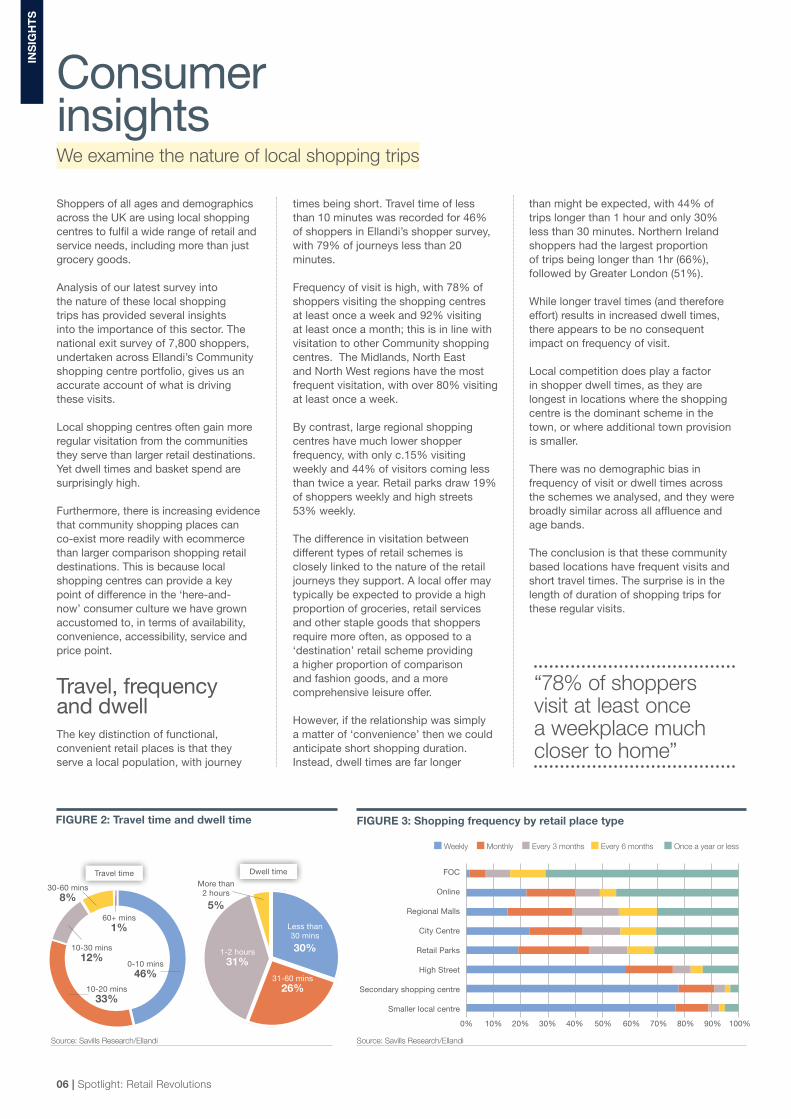
times being short. Travel time of less than 10 minutes was recorded for 46% of shoppers in Ellandi’s shopper survey, with 79% of journeys less than 20 minutes.
Frequency of visit is high, with 78% of shoppers visiting the shopping centres at least once a week and 92% visiting at least once a month; this is in line with visitation to other Community shopping centres. The Midlands, North East and North West regions have the most frequent visitation, with over 80% visiting at least once a week.
By contrast, large regional shopping centres have much lower shopper frequency, with only c.15% visiting weekly and 44% of visitors coming less than twice a year. Retail parks draw 19% of shoppers weekly and high streets 53% weekly.
The difference in visitation between different types of retail schemes is closely linked to the nature of the retail journeys they support. A local offer may typically be expected to provide a high proportion of groceries, retail services and other staple goods that shoppers require more often, as opposed to a ‘destination’ retail scheme providing a higher proportion of comparison and fashion goods, and a more comprehensive leisure offer.
However, if the relationship was simply a matter of ‘convenience’ then we could anticipate short shopping duration. Instead, dwell times are far longer
than might be expected, with 44% of trips longer than 1 hour and only 30% less than 30 minutes. Northern Ireland shoppers had the largest proportion of trips being longer than 1hr (66%), followed by Greater London (51%).
While longer travel times (and therefore effort) results in increased dwell times, there appears to be no consequent impact on frequency of visit.
Local competition does play a factor in shopper dwell times, as they are longest in locations where the shopping centre is the dominant scheme in the town, or where additional town provision is smaller.
There was no demographic bias in frequency of visit or dwell times across the schemes we analysed, and they were broadly similar across all affluence and age bands.
The conclusion is that these community based locations have frequent visits and short travel times. The surprise is in the length of duration of shopping trips for these regular visits.
06 | Spotlight: Retail Revolutions
INS
IGH
TS
Source: Savills Research/Ellandi Source: Savills Research/Ellandi
Dwell timeTravel time
1-2 hours31%
31-60 mins26%
0-10 mins46%
10-20 mins33%
10-30 mins12%
30-60 mins8%
60+ mins1%
FIGURE 2: Travel time and dwell time FIGURE 3: Shopping frequency by retail place type
Less than 30 mins
30%
More than 2 hours
5%
FOC
Online
Regional Malls
City Centre
Retail Parks
High Street
Secondary shopping centre
Smaller local centre
0% 10% 20% 30% 40% 50% 60% 70% 80% 90% 100%
■ Weekly ■ Monthly ■ Every 3 months ■ Every 6 months ■ Once a year or less
“78% of shoppers visit at least once a weekplace much closer to home”
savills.co.uk/research | 07
How much are people spending?Further indication that Community shopping centres provide an important functional shopping experience, can be seen in the conversion rates and spend profiles.
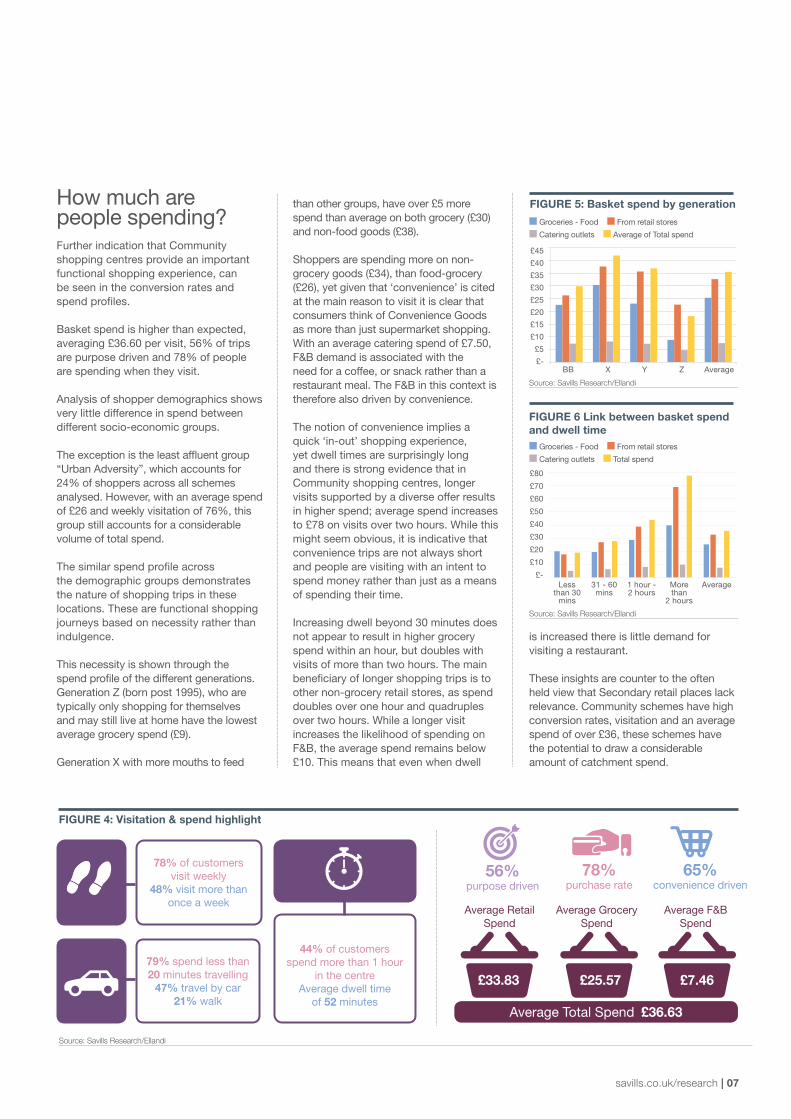
Basket spend is higher than expected, averaging £36.60 per visit, 56% of trips are purpose driven and 78% of people are spending when they visit.
Analysis of shopper demographics shows very little difference in spend between different socio-economic groups.
The exception is the least affluent group “Urban Adversity”, which accounts for 24% of shoppers across all schemes analysed. However, with an average spend of £26 and weekly visitation of 76%, this group still accounts for a considerable volume of total spend.
The similar spend profile across the demographic groups demonstrates the nature of shopping trips in these locations. These are functional shopping journeys based on necessity rather than indulgence.
This necessity is shown through the spend profile of the different generations. Generation Z (born post 1995), who are typically only shopping for themselves and may still live at home have the lowest average grocery spend (£9).
Generation X with more mouths to feed
than other groups, have over £5 more spend than average on both grocery (£30) and non-food goods (£38).
Shoppers are spending more on non-grocery goods (£34), than food-grocery (£26), yet given that ‘convenience’ is cited at the main reason to visit it is clear that consumers think of Convenience Goods as more than just supermarket shopping. With an average catering spend of £7.50, F&B demand is associated with the need for a coffee, or snack rather than a restaurant meal. The F&B in this context is therefore also driven by convenience.
The notion of convenience implies a quick ‘in-out’ shopping experience, yet dwell times are surprisingly long and there is strong evidence that in Community shopping centres, longer visits supported by a diverse offer results in higher spend; average spend increases to £78 on visits over two hours. While this might seem obvious, it is indicative that convenience trips are not always short and people are visiting with an intent to spend money rather than just as a means of spending their time.
Increasing dwell beyond 30 minutes does not appear to result in higher grocery spend within an hour, but doubles with visits of more than two hours. The main beneficiary of longer shopping trips is to other non-grocery retail stores, as spend doubles over one hour and quadruples over two hours. While a longer visit increases the likelihood of spending on F&B, the average spend remains below £10. This means that even when dwell
Source: Savills Research/Ellandi
FIGURE 6 Link between basket spend and dwell time
Source: Savills Research/Ellandi
Source: Savills Research/Ellandi
FIGURE 5: Basket spend by generation
■ Groceries - Food ■ From retail stores
■ Catering outlets ■ Average of Total spend
■ Groceries - Food ■ From retail stores
■ Catering outlets ■ Total spend
£80
£70
£60
£50
£40
£30
£20
£10
£-
£45
£40
£35
£30
£25
£20
£15
£10
£5
£-BB
Less than 30
mins
31 - 60 mins
1 hour - 2 hours
More than
2 hours
Average
X Y Z Average
FIGURE 4: Visitation & spend highlight
78% of customers visit weekly
48% visit more than once a week
Average Total Spend £36.63
79% spend less than 20 minutes travelling
47% travel by car 21% walk
£33.83 £25.57 £7.46
56% purpose driven
78% purchase rate
65% convenience driven
44% of customers spend more than 1 hour
in the centreAverage dwell time
of 52 minutes
is increased there is little demand for visiting a restaurant.
These insights are counter to the often held view that Secondary retail places lack relevance. Community schemes have high conversion rates, visitation and an average spend of over £36, these schemes have the potential to draw a considerable amount of catchment spend.
Average Retail Spend
Average Grocery Spend
Average F&B Spend
08 | Spotlight: Retail Revolutions
INS
IGH
TS
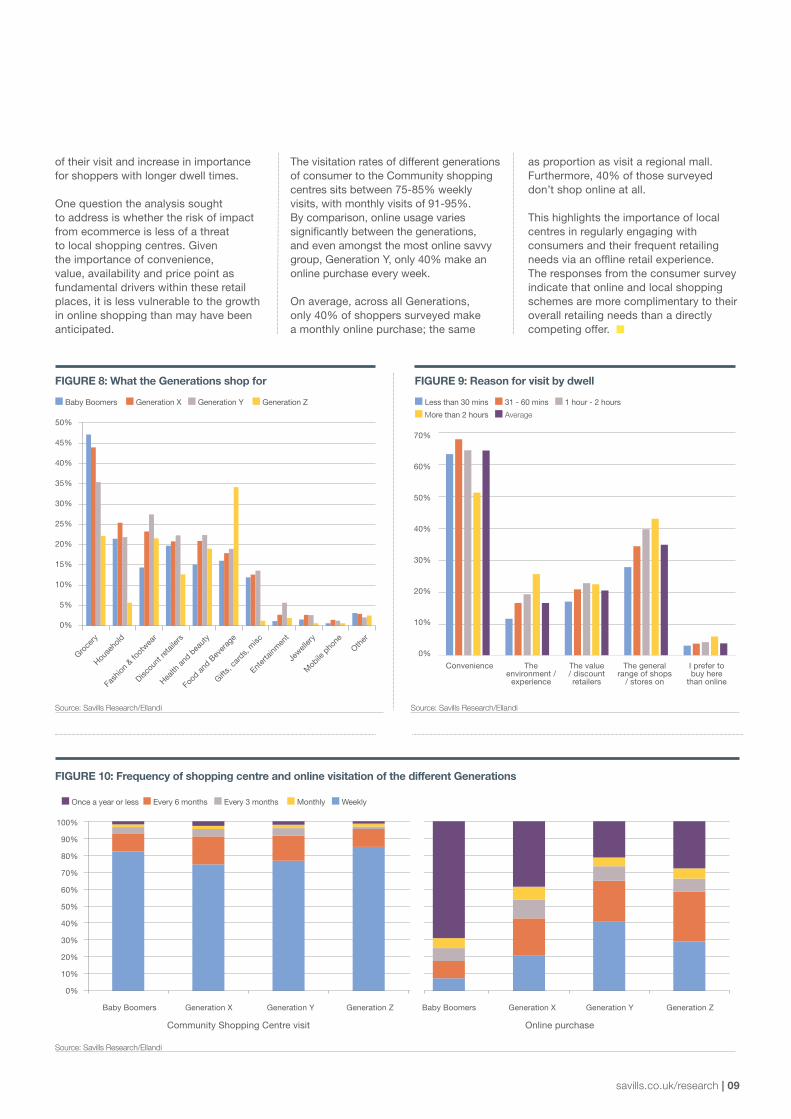
What are people buying?
Convenience is by far the primary reason that shoppers visit Community shopping centres, with 65% stating this as a key driver. This explains the short travel times observed, frequency of visit and the importance of grocery purchases that are made in 46% of visits.
The range of shops on offer is also a key reason people choose to visit a centre and has a direct influence on dwell time. For people shopping less than 30 minutes the range of stores was only considered important to 28% of shoppers, but this increased to 43% for shoppers dwelling for more than 2 hours.
This demonstrates that a diverse offer can help to extend shopper visits.The range of goods purchased reinforces that Convenience shopping is much more than just making a grocery trip.
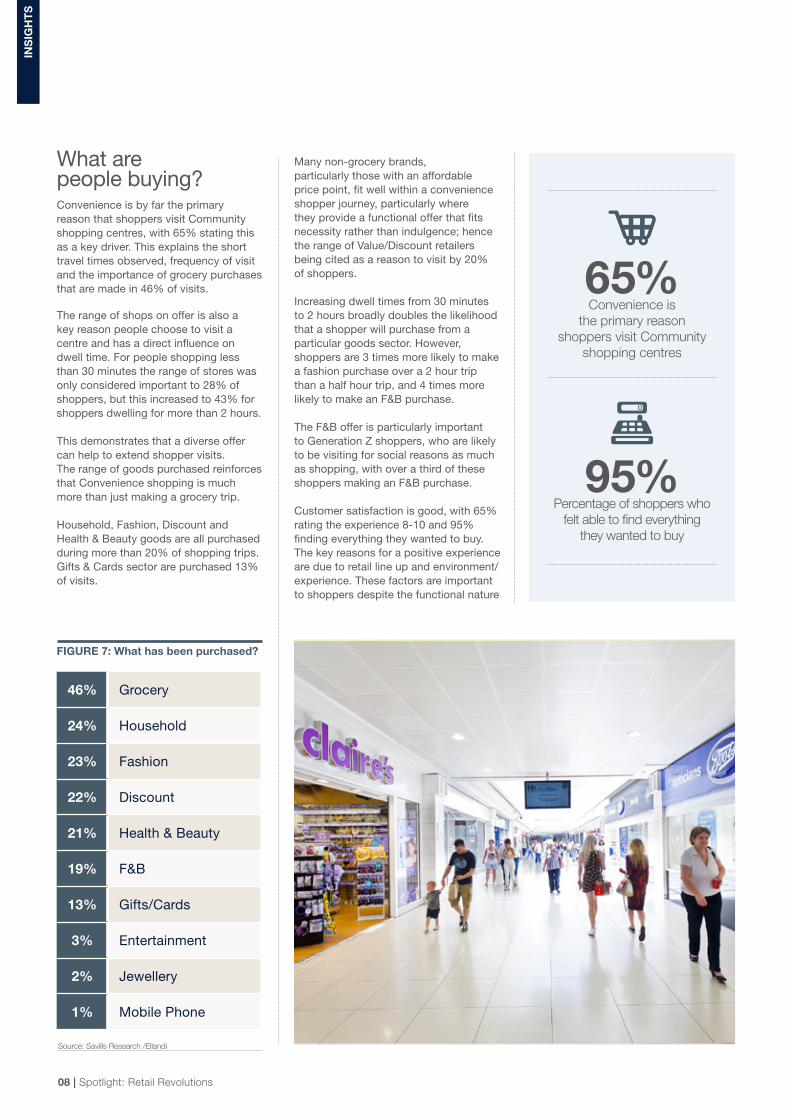
Household, Fashion, Discount and Health & Beauty goods are all purchased during more than 20% of shopping trips. Gifts & Cards sector are purchased 13% of visits.
Many non-grocery brands, particularly those with an affordable price point, fit well within a convenience shopper journey, particularly where they provide a functional offer that fits necessity rather than indulgence; hence the range of Value/Discount retailers being cited as a reason to visit by 20% of shoppers.
Increasing dwell times from 30 minutes to 2 hours broadly doubles the likelihood that a shopper will purchase from a particular goods sector. However, shoppers are 3 times more likely to make a fashion purchase over a 2 hour trip than a half hour trip, and 4 times more likely to make an F&B purchase.
The F&B offer is particularly important to Generation Z shoppers, who are likely to be visiting for social reasons as much as shopping, with over a third of these shoppers making an F&B purchase.
Customer satisfaction is good, with 65% rating the experience 8-10 and 95% finding everything they wanted to buy. The key reasons for a positive experience are due to retail line up and environment/experience. These factors are important to shoppers despite the functional nature
Source: Savills Research /Ellandi
FIGURE 7: What has been purchased?
65%Convenience is
the primary reason shoppers visit Community
shopping centres
95%Percentage of shoppers who
felt able to find everything they wanted to buy
46% Grocery
24% Household
23% Fashion
22% Discount
21% Health & Beauty
19% F&B
13% Gifts/Cards
3% Entertainment
2% Jewellery
1% Mobile Phone
Baby Boomers Generation X Generation XGeneration Y Generation YGeneration Z Generation ZBaby Boomers
Community Shopping Centre visit Online purchase
savills.co.uk/research | 09
of their visit and increase in importance for shoppers with longer dwell times.
One question the analysis sought to address is whether the risk of impact from ecommerce is less of a threat to local shopping centres. Given the importance of convenience, value, availability and price point as fundamental drivers within these retail places, it is less vulnerable to the growth in online shopping than may have been anticipated.
The visitation rates of different generations of consumer to the Community shopping centres sits between 75-85% weekly visits, with monthly visits of 91-95%. By comparison, online usage varies significantly between the generations, and even amongst the most online savvy group, Generation Y, only 40% make an online purchase every week.
On average, across all Generations, only 40% of shoppers surveyed make a monthly online purchase; the same
as proportion as visit a regional mall.Furthermore, 40% of those surveyed don’t shop online at all.
This highlights the importance of local centres in regularly engaging with consumers and their frequent retailing needs via an offline retail experience.The responses from the consumer survey indicate that online and local shopping schemes are more complimentary to their overall retailing needs than a directly competing offer. ■
FIGURE 10: Frequency of shopping centre and online visitation of the different Generations
FIGURE 8: What the Generations shop for FIGURE 9: Reason for visit by dwell
Source: Savills Research/Ellandi
Source: Savills Research/Ellandi
Source: Savills Research/Ellandi
■ Baby Boomers ■ Generation X ■ Generation Y ■ Generation Z ■ Less than 30 mins ■ 31 - 60 mins ■ 1 hour - 2 hours
■ More than 2 hours ■ Average50%
45%
40%
35%
30%
25%
20%
15%
10%
5%
0%
70%
60%
50%
40%
30%
20%
10%
0%
100%
90%
80%
70%
60%
50%
40%
30%
20%
10%
0%
Groce
ry
House
hold
Fash
ion &
foot
wear
Discou
nt re
taile
rs
Health
and
bea
uty
Food
and
Bev
erag
e
Gifts,
card
s, m
isc
Enter
tainm
ent
Jewell
ery
Mob
ile p
hone
Other
Convenience The environment /
experience
The value / discount retailers
The general range of shops
/ stores on
I prefer to buy here
than online
■ Once a year or less ■ Every 6 months ■ Every 3 months ■ Monthly ■ Weekly
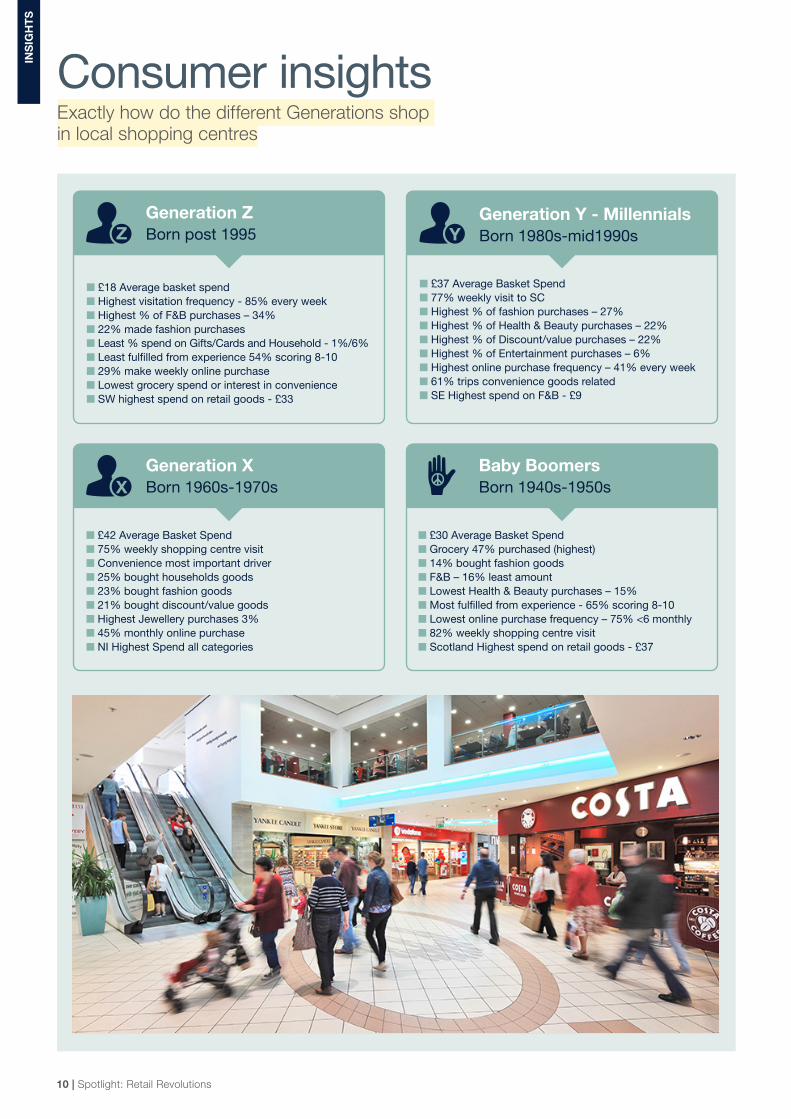
■ £18 Average basket spend■ Highest visitation frequency - 85% every week■ Highest % of F&B purchases – 34%■ 22% made fashion purchases■ Least % spend on Gifts/Cards and Household - 1%/6%■ Least fulfilled from experience 54% scoring 8-10■ 29% make weekly online purchase■ Lowest grocery spend or interest in convenience■ SW highest spend on retail goods - £33
■ £37 Average Basket Spend■ 77% weekly visit to SC■ Highest % of fashion purchases – 27%■ Highest % of Health & Beauty purchases – 22%■ Highest % of Discount/value purchases – 22%■ Highest % of Entertainment purchases – 6%■ Highest online purchase frequency – 41% every week■ 61% trips convenience goods related■ SE Highest spend on F&B - £9
■ £42 Average Basket Spend■ 75% weekly shopping centre visit■ Convenience most important driver■ 25% bought households goods■ 23% bought fashion goods■ 21% bought discount/value goods■ Highest Jewellery purchases 3%■ 45% monthly online purchase■ NI Highest Spend all categories
■ £30 Average Basket Spend■ Grocery 47% purchased (highest)■ 14% bought fashion goods■ F&B – 16% least amount■ Lowest Health & Beauty purchases – 15%■ Most fulfilled from experience - 65% scoring 8-10■ Lowest online purchase frequency – 75% <6 monthly■ 82% weekly shopping centre visit■ Scotland Highest spend on retail goods - £37
X
Generation ZBorn post 1995
Generation XBorn 1960s-1970s
Baby BoomersBorn 1940s-1950s
Generation Y - MillennialsBorn 1980s-mid1990sYZ
10 | Spotlight: Retail Revolutions
INS
IGH
TS
Consumer insightsExactly how do the different Generations shop in local shopping centres
Generation Y - Millennials
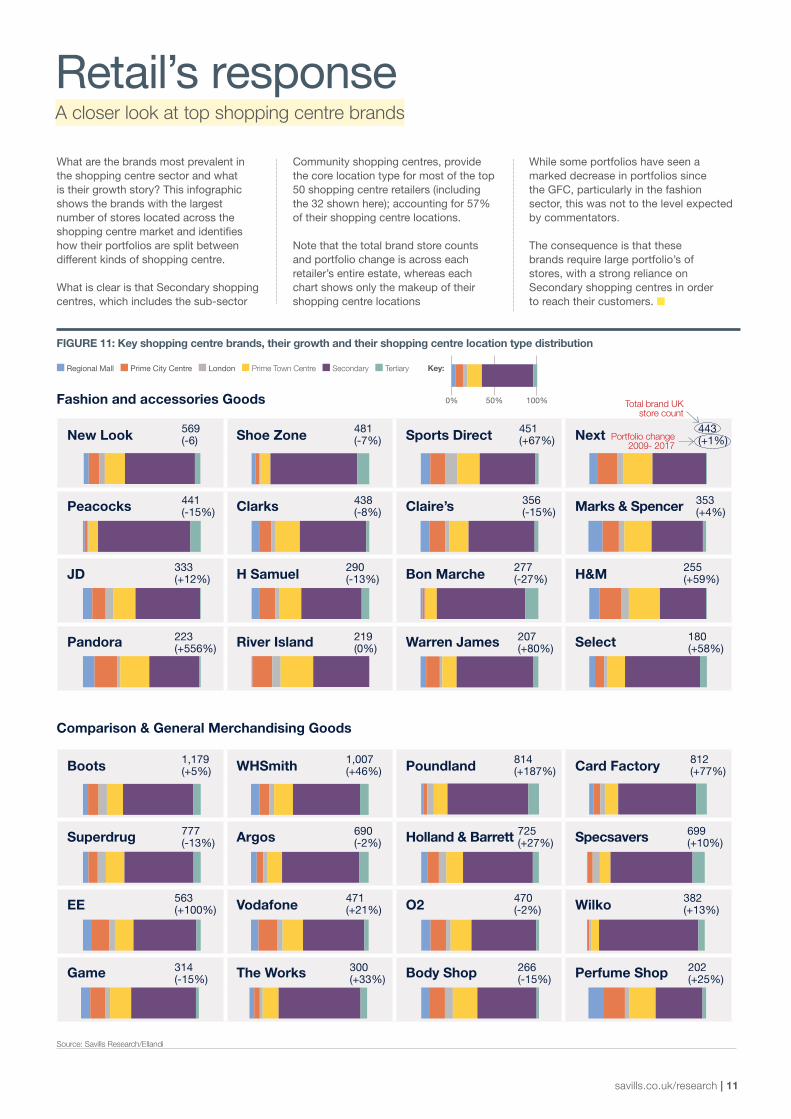
What are the brands most prevalent in the shopping centre sector and what is their growth story? This infographic shows the brands with the largest number of stores located across the shopping centre market and identifies how their portfolios are split between different kinds of shopping centre.
What is clear is that Secondary shopping centres, which includes the sub-sector
Community shopping centres, provide the core location type for most of the top 50 shopping centre retailers (including the 32 shown here); accounting for 57% of their shopping centre locations.
Note that the total brand store counts and portfolio change is across each retailer’s entire estate, whereas each chart shows only the makeup of their shopping centre locations
savills.co.uk/research | 11
While some portfolios have seen a marked decrease in portfolios since the GFC, particularly in the fashion sector, this was not to the level expected by commentators.
The consequence is that these brands require large portfolio’s of stores, with a strong reliance on Secondary shopping centres in order to reach their customers. ■
Retail’s response A closer look at top shopping centre brands
FIGURE 11: Key shopping centre brands, their growth and their shopping centre location type distribution
Source: Savills Research/Ellandi
Fashion and accessories Goods
Comparison & General Merchandising Goods
■ Regional Mall ■ Prime City Centre ■ London ■ Prime Town Centre ■ Secondary ■ Tertiary Key:
0% 50% 100%
New Look Shoe Zone Sports Direct Next
Peacocks Clarks Claire’s Marks & Spencer
JD H Samuel Bon Marche H&M
Pandora River Island Warren James Select
569(-6)
441(-15%)
333(+12%)
223(+556%)
219(0%)
207(+80%)
180(+58%)
290(-13%)
277(-27%)
255(+59%)
438(-8%)
356(-15%)
353(+4%)
481(-7%)
451(+67%)
443(+1%)
Boots WHSmith Poundland Card Factory
Superdrug Argos Holland & Barrett Specsavers
EE Vodafone O2 Wilko
Game The Works Body Shop Perfume Shop
1,179(+5%)
777(-13%)
563(+100%)
314(-15%)
300(+33%)
266(-15%)
202(+25%)
471(+21%)
470(-2%)
382(+13%)
690(-2%)
725(+27%)
699(+10%)
1,007(+46%)
814(+187%)
812(+77%)
Total brand UK store count
Portfolio change 2009- 2017
12 | Spotlight: Retail Revolutions
The challenges of the last decade affected many retail brands in different ways. While there have been a raft of failures, there were a significant number of opportunists too.
Responding to a drive for smaller baskets and more localised spending habits, the biggest supermarket brands increased their Convenience offer by 1,600 stores 2009-2016.
During the same period, by responding to demand for a more sensitive price point, the Value and Discount goods sector has increased by over 5,000 stores. In fact, Value retail goods and services have accounted for 87% of all brands store growth since 2009.
Convenience no longer refers to grocery alone. Any brands that provide an affordable, essential and increasingly local offer can fall under the umbrella of Convenience.
One specific sector that falls into this category is Value Fashion. Supermarkets
RE
TAIL
Retail’s response The role of convenience and value continues to evolve in the retail place
realised this trend even prior to the GFC, successfully shaking up the sector to sell affordable fashion goods that would support less affluent shoppers, as well as wealthier but prudent shoppers looking for cheap essential clothing that may then allow more indulgent fashion purchases to be made elsewhere.
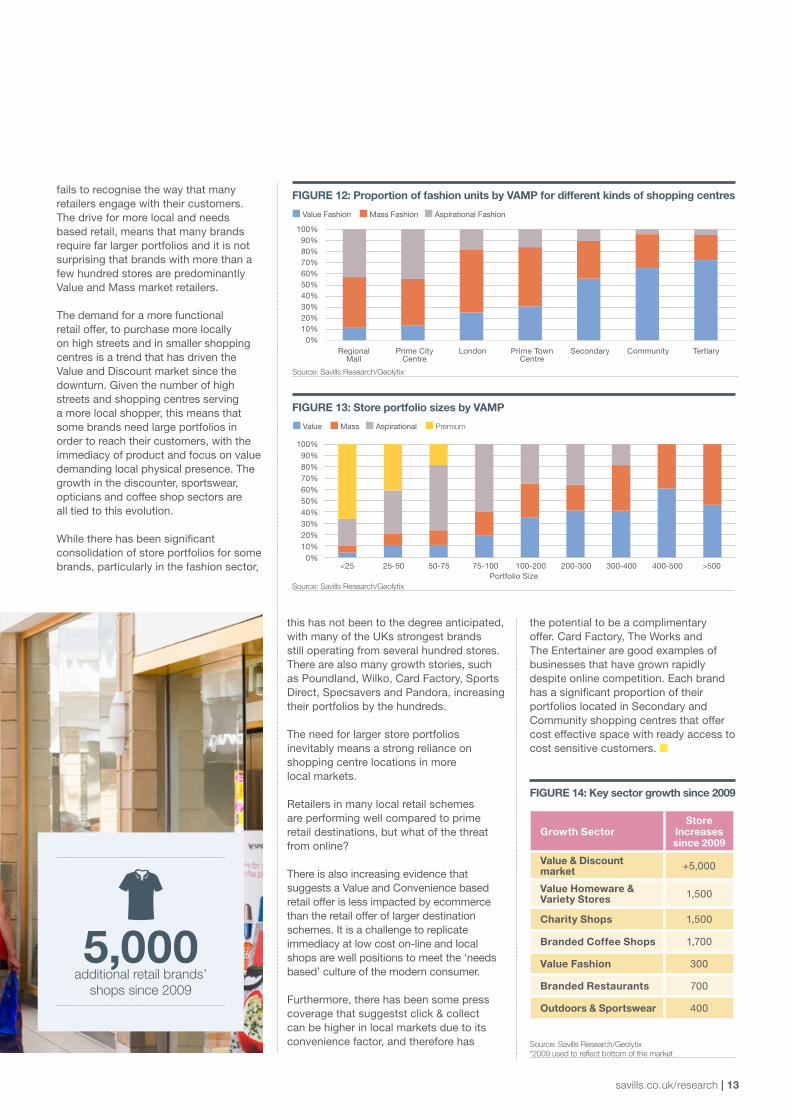
The merging of Convenience and Value has ultimately altered the retail landscape beyond recognition. It has also made a clearer distinction of how many store locations different brands need in order to reach their customers and in turn the kind of locations they need to trade from.Aspirational fashion, which is not a Convenience or Value based purchase, is the main stay of the regional mall, or prime city centre destinations, accounting for around 42% of retail brands in those
locations, while Value Fashion accounts for less than 15%. In both Secondary and Community shopping centres however, Aspirational Fashion falls to below 10%, while Value Fashion increases to 55%/65%, respectively.
The type of fashion goods sold is different and so is the reliance on fashion as the most significant sector represented. In regional malls and major city centres, fashion accounts for 40% of tenants, whereas this is only 18% in Community shopping centres.
It has often been suggested that post GFC and the arrival of ecommerce, all brands require portfolios of less than 80 stores. While possibly true for Premium brands due to their offer being experiential and destination driven, this
“The need for larger store portfolios inevitably means a strong reliance on shopping centre locations in more secondary markets”
savills.co.uk/research | 13
fails to recognise the way that many retailers engage with their customers. The drive for more local and needs based retail, means that many brands require far larger portfolios and it is not surprising that brands with more than a few hundred stores are predominantly Value and Mass market retailers.
The demand for a more functional retail offer, to purchase more locally on high streets and in smaller shopping centres is a trend that has driven the Value and Discount market since the downturn. Given the number of high streets and shopping centres serving a more local shopper, this means that some brands need large portfolios in order to reach their customers, with the immediacy of product and focus on value demanding local physical presence. The growth in the discounter, sportswear, opticians and coffee shop sectors are all tied to this evolution.
While there has been significant consolidation of store portfolios for some brands, particularly in the fashion sector,
Source: Savills Research/Geolytix
this has not been to the degree anticipated, with many of the UKs strongest brands still operating from several hundred stores. There are also many growth stories, such as Poundland, Wilko, Card Factory, Sports Direct, Specsavers and Pandora, increasing their portfolios by the hundreds.
The need for larger store portfolios inevitably means a strong reliance on shopping centre locations in more local markets.
Retailers in many local retail schemes are performing well compared to prime retail destinations, but what of the threat from online?
There is also increasing evidence that suggests a Value and Convenience based retail offer is less impacted by ecommerce than the retail offer of larger destination schemes. It is a challenge to replicate immediacy at low cost on-line and local shops are well positions to meet the ‘needs based’ culture of the modern consumer.
Furthermore, there has been some press coverage that suggestst click & collect can be higher in local markets due to its convenience factor, and therefore has
the potential to be a complimentary offer. Card Factory, The Works and The Entertainer are good examples of businesses that have grown rapidly despite online competition. Each brand has a significant proportion of their portfolios located in Secondary and Community shopping centres that offer cost effective space with ready access to cost sensitive customers. ■
FIGURE 13: Store portfolio sizes by VAMP
FIGURE 14: Key sector growth since 2009
5,000 additional retail brands’
shops since 2009
Source: Savills Research/Geolytix
FIGURE 12: Proportion of fashion units by VAMP for different kinds of shopping centres
100%90%80%70%60%50%40%30%20%10%
0%
100%90%80%70%60%50%40%30%20%10%
0%
■ Value Fashion ■ Mass Fashion ■ Aspirational Fashion
RegionalMall
Prime CityCentre
London Prime TownCentre
Secondary Community Tertiary
■ Value ■ Mass ■ Aspirational ■ Premium
<25 25-50 50-75 75-100 100-200 200-300 300-400 400-500 >500Portfolio Size
Growth SectorStore
Increases since 2009
Value & Discount market +5,000
Value Homeware & Variety Stores 1,500
Charity Shops 1,500
Branded Coffee Shops 1,700
Value Fashion 300
Branded Restaurants 700
Outdoors & Sportswear 400
Source: Savills Research/Geolytix *2009 used to reflect bottom of the market
14 | Spotlight: Retail Revolutions
It would be remiss to suggest that it has been plain sailing for retailers and ignore the challenges that have affected many high streets and shopping centres across the UK over the last decade.
High void rates, the rise of ecommerce and changing levels of consumer spending are all issues that can affect even the most successful retail places.
However, too often commentary on these issues masks the fact that many retail places work hard to successfully meet the needs of the consumer, or that even where high voids persist, occupied space might still be performing well.
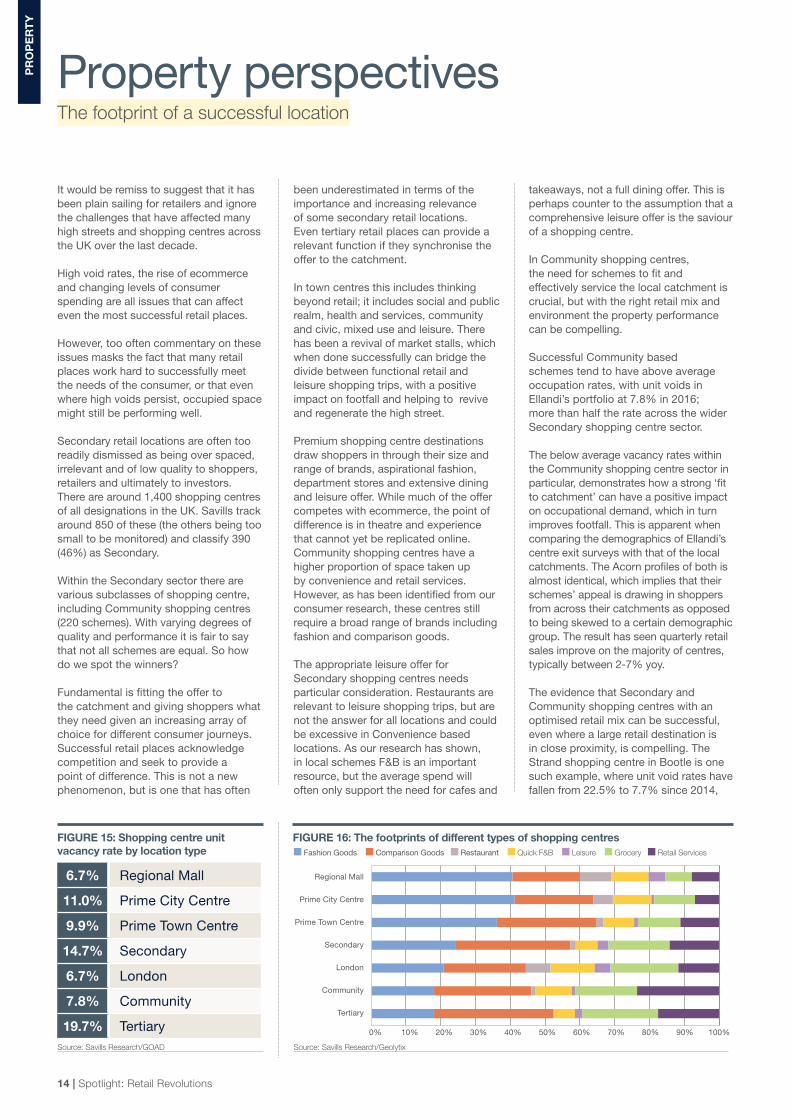
Secondary retail locations are often too readily dismissed as being over spaced, irrelevant and of low quality to shoppers, retailers and ultimately to investors. There are around 1,400 shopping centres of all designations in the UK. Savills track around 850 of these (the others being too small to be monitored) and classify 390 (46%) as Secondary.
Within the Secondary sector there are various subclasses of shopping centre, including Community shopping centres (220 schemes). With varying degrees of quality and performance it is fair to say that not all schemes are equal. So how do we spot the winners?
Fundamental is fitting the offer to the catchment and giving shoppers what they need given an increasing array of choice for different consumer journeys. Successful retail places acknowledge competition and seek to provide a point of difference. This is not a new phenomenon, but is one that has often
PR
OP
ER
TY
Property perspectivesThe footprint of a successful location
been underestimated in terms of the importance and increasing relevance of some secondary retail locations. Even tertiary retail places can provide a relevant function if they synchronise the offer to the catchment.
In town centres this includes thinking beyond retail; it includes social and public realm, health and services, community and civic, mixed use and leisure. There has been a revival of market stalls, which when done successfully can bridge the divide between functional retail and leisure shopping trips, with a positive impact on footfall and helping to revive and regenerate the high street.
Premium shopping centre destinations draw shoppers in through their size and range of brands, aspirational fashion, department stores and extensive dining and leisure offer. While much of the offer competes with ecommerce, the point of difference is in theatre and experience that cannot yet be replicated online.Community shopping centres have a higher proportion of space taken up by convenience and retail services. However, as has been identified from our consumer research, these centres still require a broad range of brands including fashion and comparison goods.
The appropriate leisure offer for Secondary shopping centres needs particular consideration. Restaurants are relevant to leisure shopping trips, but are not the answer for all locations and could be excessive in Convenience based locations. As our research has shown, in local schemes F&B is an important resource, but the average spend will often only support the need for cafes and
takeaways, not a full dining offer. This is perhaps counter to the assumption that a comprehensive leisure offer is the saviour of a shopping centre.
In Community shopping centres, the need for schemes to fit and effectively service the local catchment is crucial, but with the right retail mix and environment the property performance can be compelling.
Successful Community based schemes tend to have above average occupation rates, with unit voids in Ellandi’s portfolio at 7.8% in 2016; more than half the rate across the wider Secondary shopping centre sector.
The below average vacancy rates within the Community shopping centre sector in particular, demonstrates how a strong ‘fit to catchment’ can have a positive impact on occupational demand, which in turn improves footfall. This is apparent when comparing the demographics of Ellandi’s centre exit surveys with that of the local catchments. The Acorn profiles of both is almost identical, which implies that their schemes’ appeal is drawing in shoppers from across their catchments as opposed to being skewed to a certain demographic group. The result has seen quarterly retail sales improve on the majority of centres, typically between 2-7% yoy.
The evidence that Secondary and Community shopping centres with an optimised retail mix can be successful, even where a large retail destination is in close proximity, is compelling. The Strand shopping centre in Bootle is one such example, where unit void rates have fallen from 22.5% to 7.7% since 2014,
Source: Savills Research/GOAD Source: Savills Research/Geolytix
FIGURE 15: Shopping centre unit vacancy rate by location type
FIGURE 16: The footprints of different types of shopping centres
6.7% Regional Mall
11.0% Prime City Centre
9.9% Prime Town Centre
14.7% Secondary
6.7% London
7.8% Community
19.7% Tertiary
Regional Mall
Prime City Centre
Prime Town Centre
Secondary
London
Community
Tertiary
■ Fashion Goods ■ Comparison Goods ■ Restaurant ■ Quick F&B ■ Leisure ■ Grocery ■ Retail Services
0% 10% 20% 30% 40% 50% 60% 70% 80% 90% 100%

savills.co.uk/research | 15
and annual footfall has improved 8% yoy, despite being within 4 miles from Liverpool city centre.
These improvements demonstrate the advantages of both investing and actively managing shopping centres, with a strong strategy to ensure the needs of both retailer and consumer are being met.
Tenant profitability is key to sustainable shopping centres and with many rental levels having been rebased, rents in Community shopping centres are advantageous for retailers. While sales densities do not tend to reach the levels of more premium retail destinations, the favourable costs can compensate for this and lead to strong margin and store contribution. Clearly, strong occupational performance provides income security to investors.
Our analysis of shopping centre effort ratios, a measure than looks at total occupational costs as a proportion of turnover, shows that local Community shopping centres can outperform the wider Secondary shopping centre market in many retail sectors.
There has been considerable restructuring of the retail market since the GFC. Retailers have consolidated or grown their portfolios to improve operational efficiency and successful schemes and high streets have become more in tune with what brands consumers want, where they want them.
Further evolution of space is inevitable, not least because the role of ecommerce is still being worked out. There is certainly potential for online shopping to better
support a local offer and there have been reports that Click & Collect is higher in locations closer to where people live.
In the present political and economic climate there is a great deal of uncertainty and no one can yet predict how the long term impact on retail. Yet, for shopping centres and high streets that have already adapted their retail and leisure offer to meet consumer and retailer needs, and reduced occupancy costs to affordable levels, there is good reason to believe that
they are well placed to continue to be relevant, successful locations, despite persisting challenges to economic and consumer sentiment.
This is especially pertinent to Community shopping centre schemes, where the key focus is on Convenience and Value. These factors are central to every day consumer journeys, and if shoppers tighten their spending in the years ahead it is likely that this will only serve to increase their reliance on the affordable retail offer in their own communities. ■
Source: Savills Research/CACI
Source: Savills Research
Source: Savills Research
FIGURE 17: Community Shopping Centre and Secondary Shopping Centre retailer effort ratios, by sector
FIGURE 18: Fit to catchment (Ellandi portfolio)
FIGURE 19: Shopping Centre Locations
100%90%80%70%60%50%40%30%20%10%
0%
■ Affluent Achievers ■ Rising Prosperity ■ Comfortable Communities ■ Financially Stretched ■ Urban Adversity
■ Community shopping centres
Catchment Profile Shopper Profile
Regional Mall
Prime City Centre
Prime Town Centre
London
Secondary
Tertiary
0 50 100 150 200 250 300 350 400
20%18%16%14%12%10%
8%6%4%2%0%
■ Community Shopping Centre Average ■ Secondary Shopping Centre Average
Mixe
d clot
hing
Depar
tmen
t sto
re
Foot
wear
Jewell
ery
Groce
ry
Health
and
Bea
uty
Homew
ares
Fast
Foo
d /
Take
away
Cafés
Resta
uran
ts
Sportin
g Goo
ds
Electri
cals
Discou
nter
s
14.5
9.67.9
15.416.5
12.2
14.9
4.55.8
13.113.315
17.6
11.9
1614.6
18.9
10.69
7.8
10.3
5.8
9.211
14
16.5
16 | Spotlight: Retail Revolutions
SPOTLIGHT ON COMMUNITY SHOPPING CENTRES
What are they?Community shopping centres are locally dominant retail locations which focus on delivering affordable and convenient retailing. They are typically in town centre locations and provide a range of civic amenities and essential services that go beyond retail.
The mix of uses and range of shops, with a strong emphasis on Convenience and Value goods, encourages high frequency visits and access to retail that is accessible and convenient, fitting into busy everyday lives for millions of people.
This research highlights that this local needs based shopping also generates surprisingly high basket spend at an average £36 per visit. Community shopping centres compete less with other shopping centre destinations, rather they feed off an immediate catchment within a 20 minute drive time.
The core proposition of a Community shopping centre is offering immediacy and value to local people. This purpose based shopping is ingrained across geography and socio-economic groups and highlighted by the fact that 78% of shoppers visit at least one a week and that 95% are satisfied customers who found what they came for.
Different to Secondary The purpose and function of a Community shopping centre is very different to that of a larger Secondary shopping centres that rely upon attracting comparison shoppers from a far greater catchment. Secondary schemes rely upon a broader range of retailers and have to offer a higher degree of ‘experience.’ The shopper has typically travelled further and their shopping trip is based on “want” not “need.”
Scope of the MarketThere are c.220 Community shopping centres nationally. It is a relatively liquid market, from 2011 to 2015 there were 128 Community shopping centre trades with an aggregate value of £3.9bn.
The majority of Community shopping centre are privately owned. Ellandi are the largest manager in the sector with New River being the only REIT with a large Community shopping centre portfolio.
What are the key benefits to investors?Community shopping centres offer high yields, in absolute terms and by comparison to prime shopping centres, with a yield spread of c.400bps. They are also considerably cheaper on a capital value £sq ft basis.
Most rents have been rebased and are now low, by historic standards. They are affordable to retailers who generate strong effort ratios in good Community locations. The 2017 business rates revaluation reduced rateable value for most Community shopping centres further reducing occupational costs for retailers.
Occupancy figures are typically strong. Ellandi’s stabilised assets operate at 95% economic occupancy rate, comparable to prime centres.
Collectively, these factors contribute to strong and sustainable rental income flows that can offer higher yields than other mainstream property asset classes. As operating assets, Community shopping centres offer scope to add rental and capital value through active asset management, bringing with it sustainability of income for the investor.
Tom WhittingtonDirectorSavills [email protected]+44 (0) 161 244 7779
Andrew BuckleyDirectorEllandi [email protected]+44 (0) 203 6969 754
ELLANDI RESEARCH
SAVILLS RESEARCH
SAVILLS RETAIL & LEISURESavills Retail & Leisure is a multi-national, cross-sector offering covering all facets of a client’s retail needs. With our network of offices, and a strong foundation of research and insight, we have unparalleled market knowledge to put landlords, developers and retailers at an advantage. From in-town to out of town, and a comprehensive approach to high street, shopping centres and central London, our team is the most dynamic in the market and offers a truly holistic service to clients. Our retail team is part of Savills plc, a global real estate services provider listed on the London Stock Exchange. Savills operates from over 700 owned and associate offices, employing more than 30,000 people in over 60 countries throughout the Americas, the UK, Europe, Asia Pacific, Africa and the Middle East, offering a broad range of specialist advisory, management and transactional services to clients all over the world. Savills Commercial Research produces industry and sector reports for all those concerned with commercial property. Our publications and bespoke consultancy services offer practical guidance to create competitive advantage and help clients make well informed real estate decisions and realise business goals. In addition to our thought leadership publications our Retail Research specialists provide consultancy to a wide range of retailer, investor, developer and landlord clients.
Savills.co.uk/research | @savills