Embed Size (px)
Citation preview

In Search of the Holy Grail of PMU Applications for Visualization and Prediction of Cascading Outages
Steve LeeMay 10, 2007NASPI Meeting, Carson, California

2© 2007 Electric Power Research Institute, Inc. All rights reserved.
Outline
• Prior EPRI results in search of the Holy Grail– structural degradation– system stress indices
• Hierarchical visualization for operators and engineers • Proposed research project with PMU and EMS data with
utility participation• Where is the meat?

3© 2007 Electric Power Research Institute, Inc. All rights reserved.
Prior EPRI research results on structural degradation, deterministic and probabilistic system stress indices
• Lots of Data but still in search of …• Holy Grail – Extract succinct information - Diagnose and Advise• The goal is not massive or impressive visualization• But a “Predictive” Vulnerability Index that measures the risk of
cascading outages• Broader situational awareness about the most dangerous threats
(contingencies)• Factors leading to cascading outages:
– Structural Degradation• Scheduled and unscheduled outages
– System Stresses• Load level• MVA flows, MW losses, MVAR losses

4© 2007 Electric Power Research Institute, Inc. All rights reserved.
Vulnerability Indices Research
• Structural Degradation: Cut-sets (Interface, Circular)– Continuous computation and monitoring
• System Stress Indices: – Measured:
• Load levels, • MVA power flows (across cut-sets), system MW losses, system MVAR losses• voltages, • reserves (spinning & quick-start, dynamic & static reactive)• Frequency (oscillations)
– Computed: • Thermal margins, • voltage stability margins, • transient stability margins
• Vulnerability Index: – Composite Index of All Above– Capability of Triggering Alarms for Operators/Engineers– Should have a probabilistic element to be sensitive and predictive

5© 2007 Electric Power Research Institute, Inc. All rights reserved.
Testing the Strength of a Holely Fabric
Pulling in the West-East Direction for Vulnerability to Higher W-E Transfer
Scheduled and forced line outages are like cuts on the fabric

6© 2007 Electric Power Research Institute, Inc. All rights reserved.
Testing the Strength of a Holely Fabric
Pulling in the West-East Direction for Vulnerability to Higher W-E Transfer

7© 2007 Electric Power Research Institute, Inc. All rights reserved.
Testing the Strength of a Holely Fabric
Pulling at a location of the fabric tests vulnerability to Higher net export or import in a local area

8© 2007 Electric Power Research Institute, Inc. All rights reserved.
EPRI has developed software to determine Minimum Cut Set
Source Sink
Minimum Cut
500+5001200+800
1500+1500
X+Y Actual flow + remaining capacity
Incremental Max Transfer = 4300 = 800+500+1500+1500Total actual flow = 4700 = 500+1200+1500+1500
Total capacity = 9000 = 1000+2000+3000+3000
Line 1Line 2
Line 4
1500+1500
Line 3
Product 1013203 -Transmission Outage Screening using Network Flow Model, Version 1.0

9© 2007 Electric Power Research Institute, Inc. All rights reserved.
Stress Indicator
Time
Maximum Flow Capacity of A Minimum Cut-Set
Total Actual Flows in the Cut-Set
Given this amount of optimistic spare capacity, what is the probability of cascading?
Safe Zone
Probability ofCascading
Product 1010701 –Mitigating Cascading Outages on Power Systems: Recent Research Approaches and Emerging Methods
EPRI’s research in Cut-Sets is a key to know the structural integrity or degradation of the power grid

10© 2007 Electric Power Research Institute, Inc. All rights reserved.
Probability of Available Capacity Less than or Equal to X
0.000000000001
0.000000000010
0.000000000100
0.000000001000
0.000000010000
0.000000100000
0.000001000000
0.000010000000
0.000100000000
0.001000000000
0.010000000000
0.100000000000
1.000000000000
0 1000 2000 3000 4000 5000 6000 7000 8000 9000 10000
MW
Cum
ulat
ive
Prob
abili
tyProbabilistic Stress Indicator
Classical LOLP of 1 day in 10 years = 1/260/10 = 0.00038
True Risk Curve
When total flow approaches 4500 MW, the Probability of Cascading jumps by a
factor of 100
Knowing Cut-Sets enable probability of cascading failures to be computed and monitored

11© 2007 Electric Power Research Institute, Inc. All rights reserved.
EPRI Technology Innovation Project: Predicting Cascading Outages (ongoing)
• “Smart logic” was used to divide a power system network into a number of groups (clusters) that are connected with other groups by “critical” lines (a circular cut-set), starting from generator sources
• If one or more of these “critical” lines is/are outaged, it can start cascading effect
• It takes ~ 1 min. to determine the “critical” circular cut-sets in an Eastern Interconnection case with 35,000 buses
• An algorithm can identify all initiating N-1 line outages which will result in “automatic” tripping of “overload protection relays” in multiple tiers, which then result in system collapse.
• Future work will identify critical circular cut-sets starting from load centers

12© 2007 Electric Power Research Institute, Inc. All rights reserved.
Implications
• For each State Estimator case, spend 1 minute of computer time to identify most dangerous threats
• EPRI project on Fast Fault Screening determined top 20 most severe fault locations for transient stability
• EPRI project on Potential Cascading Circuits (PCC) determined:– all sets of N-k contingencies that cascade after
an initiating N-1, with probability not much smaller than an N-1 or N-2 contingency
– rank them according to order of likelihood (even without knowing the outage rates)
– Compute these indices of likelihoods and plot them over time (from SE to SE case) to warn operators

13© 2007 Electric Power Research Institute, Inc. All rights reserved.
Reactive Power Flow is a Precursor
Time Period = 15 minutes
Precursors are valuable for warning operators with enough time to
take corrective actions
MW
MVAR
MVA

14© 2007 Electric Power Research Institute, Inc. All rights reserved.
Unstable Generator
0
90
180
270
360
59.00 59.50 60.00 60.50 61.00 61.50 62.00 62.50 63.00 63.50 64.00
Frequency (Hz)A
ngle
(Deg
rees
)
Visualization in Phase Space vs. Time Domain
Stable Generator
-90
0
90
180
270
58.00 58.50 59.00 59.50 60.00 60.50 61.00 61.50 62.00
Frequency (Hz)
Ang
le (D
egre
e)
Marginally Unstable Generator
0
90
180
270
360
59.00 59.50 60.00 60.50 61.00 61.50 62.00
Frequency (HZ)
Ang
le (D
egre
e)

15© 2007 Electric Power Research Institute, Inc. All rights reserved.
Phase Space May be Approximated
• A Delta Tool can be turned into approximate Phase Space
Delta Y vs. Y
-1.0
-0.8
-0.6
-0.4
-0.2
0.0
0.2
0.4
0.6
0.8
1.0
0.0 0.1 0.2 0.3 0.4 0.5 0.6 0.7 0.8 0.9 1.0
Y
Del
ta Y
Delta Y vs. Y
-1.0
-0.8
-0.6
-0.4
-0.2
0.0
0.2
0.4
0.6
0.8
1.0
0.0 0.1 0.2 0.3 0.4 0.5 0.6 0.7 0.8 0.9 1.0
Y
Del
ta Y
Delta Y vs. Y
-1.0
-0.8
-0.6
-0.4
-0.2
0.0
0.2
0.4
0.6
0.8
1.0
0.0 0.1 0.2 0.3 0.4 0.5 0.6 0.7 0.8 0.9 1.0
Y
Del
ta Y
Delta Y vs. Y
-1.0
-0.8
-0.6
-0.4
-0.2
0.0
0.2
0.4
0.6
0.8
1.0
0.0 0.1 0.2 0.3 0.4 0.5 0.6 0.7 0.8 0.9 1.0
Y
Del
ta Y

16© 2007 Electric Power Research Institute, Inc. All rights reserved.
Cluster Analysis to Identify Precursors
• A sudden departure from a recent cluster’s neighborhood is an indication of some sudden abnormal events
• These cluster alarms are numerous and distributed
• Can be organized and diagnosed in a hierarchical framework

17© 2007 Electric Power Research Institute, Inc. All rights reserved.
Visualization of Relay Protection as Precursor
Presented by Enrique Martinez M., CFE Mexico, at EPRI/PG&E Protection and Control Workshop, March 1-2, 2007

18© 2007 Electric Power Research Institute, Inc. All rights reserved.
Hierarchical Visualization for Operators and Engineers
• Operators want minimum and clearest information to get their attention:– Geographical awareness– Facilities awareness– Controllability awareness– Predictive awareness
• Operators want to know what to do with the information– Take remedial actions– Get more information from engineers
• Engineers want capability to drill into the depth of the analysis to diagnose unusual problems and recommend remedial actions

19© 2007 Electric Power Research Institute, Inc. All rights reserved.
Hierarchical Visualization for Operators and Engineers
Alarm Indicators for Different Types of Problems
Geographical Visualization of the Location of That Problem
One-line Diagram Visualization of the Facilities with That Problem
Wide Area Visualizations
Layers of Information
• Frequency
• Voltage
• Line Flows
• Reactive Reserve
• Etc.
Type 1 - Overload Type 2 – Frequency Type 3 - Voltage Type 4 - Stability
Click here

20© 2007 Electric Power Research Institute, Inc. All rights reserved.
Underlying Trend
Time
Safe Zone
Probability ofCascading
Continue
Click here Click here the 2nd Time on this slide

21© 2007 Electric Power Research Institute, Inc. All rights reserved.
Geographical Areas
Area A Area B Area C
Map
1-Lines
Map
1-Lines
Map
1-Lines
Return
Click here
Click here

22© 2007 Electric Power Research Institute, Inc. All rights reserved.
Geographical Visualization of the Location of That Problem
ReturnClick here

23© 2007 Electric Power Research Institute, Inc. All rights reserved.
One-line Diagram Visualization of the Facilities with That Problem
Return
Click here

24© 2007 Electric Power Research Institute, Inc. All rights reserved.
Proposed research project on predicting cascading outages with human factor research
• Collaborative Research Opportunity with EPRI– In coordination with NASPI– Task force meetings and webcasts– Pooling of resources
• Funding to support research in methodologies and human factors
• Inhouse resources to support coding of computation and visualization modules
• Sharing of results and codes– Enable experiments for each
participant, using own EMS or PI servers
25© 2007 Electric Power Research Institute, Inc. All rights reserved.
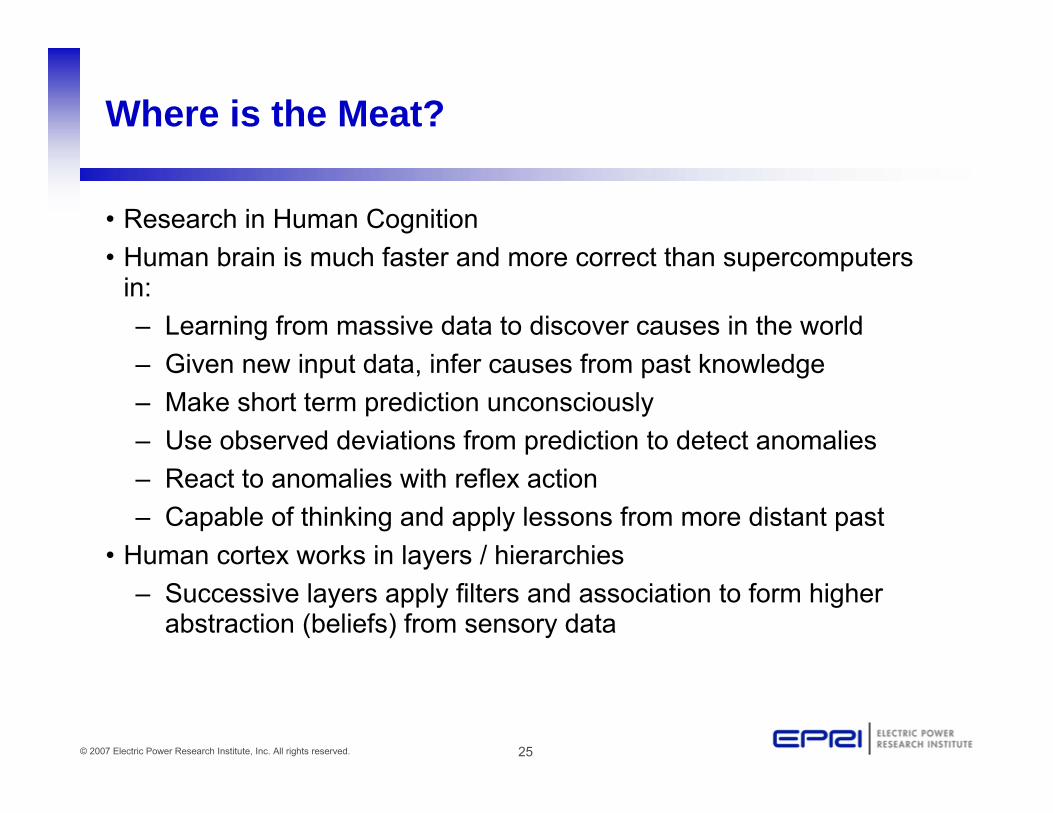
Where is the Meat?
• Research in Human Cognition• Human brain is much faster and more correct than supercomputers
in:– Learning from massive data to discover causes in the world– Given new input data, infer causes from past knowledge– Make short term prediction unconsciously– Use observed deviations from prediction to detect anomalies– React to anomalies with reflex action– Capable of thinking and apply lessons from more distant past
• Human cortex works in layers / hierarchies– Successive layers apply filters and association to form higher
abstraction (beliefs) from sensory data
26© 2007 Electric Power Research Institute, Inc. All rights reserved.
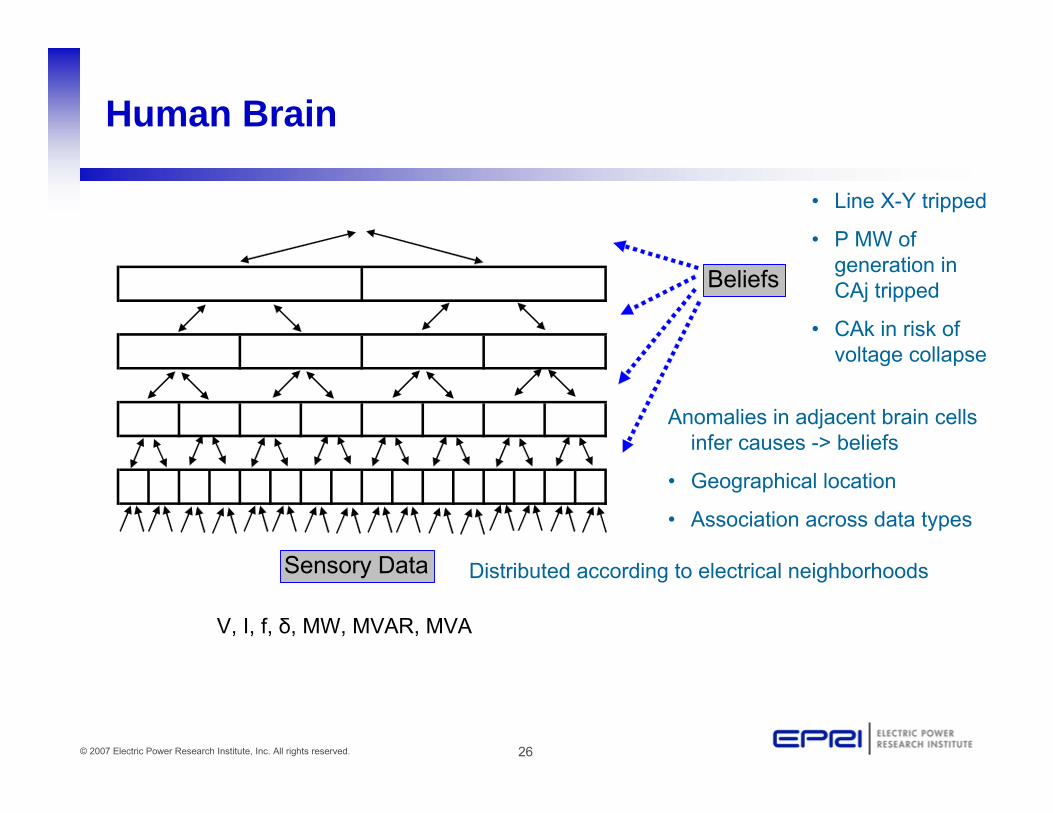
Human Brain
Beliefs
Sensory Data Distributed according to electrical neighborhoods
Anomalies in adjacent brain cells infer causes -> beliefs
• Geographical location
• Association across data types
V, I, f, δ, MW, MVAR, MVA
• Line X-Y tripped
• P MW of generation in CAj tripped
• CAk in risk of voltage collapse

27© 2007 Electric Power Research Institute, Inc. All rights reserved.
Predicting Cascading Outages with Human Factor Research for Visualization of Massive Data
• Turn PMU Data into Useful Information for Operators– Wide-area situational awareness– Human operators’ visualization requirements
• Forum for Operators and Researchers in support of NASPI– Develop visualization tools– Sharing of open-source code and visualization approaches
• Deliverables: – Webcasts, Open-source library, annual conferences
• Status:– EPRI base and TI research funding will increase leverage– New collaborative effort
• Key Research Questions– Precursor vulnerability signals for potential cascading outages– Human factors and human intelligence
• Cost to Participate: $30,000 ($15k+$15k) per year for two years
• Technical Contact: Stephen Lee, [email protected]

28© 2007 Electric Power Research Institute, Inc. All rights reserved.


![Qi MAGEN STAR-HOLY GRAIL VORTEX - danmirahorian.rodanmirahorian.ro/HOLY-GRAIL-TECHNOLOGY.pdf · Azi tehnologia Holy Grail Vortex este utilizată de Quantum Star[Norvegia], Psitronic](https://img.pdfslide.net/doc/110x75/5dd06072b734b93a313b09c4/qi-magen-star-holy-grail-vortex-azi-tehnologia-holy-grail-vortex-este-utilizatf.jpg)