Embed Size (px)
Citation preview
In-silico Analysis and Homology Modeling of Indonesian NS1 Antigen on Diagnostic Sensitivity Test of Dengue
Dewi Astriany1,4*, Herman Susanto1, Gina Tazkya Rahmaniah1, Ari Hardianto2, Muhammad Yusuf2,3, Ade Rizqi3, Toto Subroto2,3
1Department of Pharmacy, Indonesian School of Pharmacy, Bandung, West Java, Indonesia 40266, 2Department of Chemistry, Faculty of Mathematics and Natural Sciences, Padjadjaran
University, Sumedang, West Java, Indonesia 45363, 3Research Center of Molecular Biotechnology and Bioinformatics, Padjadjaran University, Bandung, 40133, 4Doctoral Programme in Department of Chemistry, Faculty of Mathematics and Natural Sciences,
Padjadjaran University, Sumedang, West Java, Indonesia 45363 Email*: [email protected]
ABSTRACT
Aim: The non-structural glycoprotein-1 (NS1) antigen is one of the device options in laboratory diagnostic test, that can be used to detect either primary or secondary infections in the earliest stages [13]. Nowadays, the sensitivity of the kit currently diagnosed with DHF during surveillance in Indonesia is less than 70% [1]. The aim of this study was to analyze 48 structures of Indonesian NS1 antigenes of DENV1-4 isolates.
Methods: In this study, bioinformatics approach was performed on the 48 structures of Indonesian NS1 antigenes of DENV1-4 to obtain the best model using BLAST and Pyre2. Homology modeling was carried out using Modeller 9.19 through templates which have a high homology level with the amino acid sequence NS1 antigen.
Results: We obtained the best template of NS1 antigen Indonesia with PDB ID 4O6B_A. The best model of DENV-1, DENV-2, DENV-3, and DENV-4 were NS1/ID/DENV1-20, NS1/ID/DENV2-2, NS1/ID/DENV3-6 and NS1/ID/DENV4-1 with Ramachandran plot value 91.3%, 90.5%, 90.6% and 90.2%, respectively.
Conclusion: The results showed that the differences of structures, amino acid residues, and epitopes from templates and each serotype are valuable tools for designing molecular antigen as diagnostic agent to enhance the sensitivity value of dengue diagnostic kits in Indonesia.
Keywords: dengue virus, NS1 antigen, homology modeling, sensitivity, dengue diagnostic kit.
INTRODUCTION
Dengue is one of the endemic diseases transmitted through the bite of Aedes aegypti or Aedes albopictus mosquitoes. This disease affects about 2.5 billion people living in tropical and subtropical regions in the Southeast Asia, Pacific and American regions [4]. The number of dengue sufferers in Indonesia is 126,675 per year with 1,229 death cases [7]. Indonesian lost almost 300 million dollars per year because of the outbreak of dengue fever [16].
Dewi Astriany et al ISPST 2018 ISSN: 0975-1459
JPSR-November(S)2018 29
Dengue Hemorrhagic Fever (DHF) was caused by dengue virus (DENV) and belongs to Flaviridae family and Flavivirus genus, with genetic diversity shown by the presence of four serotypes (DENV-1, DENV-2, DENV-3, and DENV-4) and several genotypes in each of these serotypes [5, 10]. The DENV genome consists of single-stranded positive-sense RNA which encodes three structural molecules (C, prM/M, E) and seven non-structural proteins (NS1, NS2A, NS2B, NS3, NS4A, NS4B, NS5) [6]. Clinical manifestation of dengue ranging from fever, Dengue Hemorrhagic Fever (DHF) and Dengue Shock Syndrome (DSS) [11]. Until now, no licensed vaccine or antiretroviral therapy for dengue have been successfully developed yet, so the management of patients rely on a good supportive care [1]. The diagnosis of dengue virus infection that is fast and precise becomes important for better management of the dengue patients. Detection of NS1 antigens encoded by viruses has become the basic of the device for dengue laboratory diagnostic tests [15].
NS1 is a glycoprotein that is important for the replication and viability of viruses, secreted into the blood immune system in individuals infected with dengue virus [12]. NS1 can provide as a guidance for specific diagnosis of dengue infection due to NS1 circulates at high concentrations in the serum of patients with primary and secondary infections during the clinical phase of illness and the first days of the convalescence phase [14].
Guzman and co-workers observed the sensitivity of NS1 detection that has been used in Asia and the Americas was 64% which is caused by geographical differences [4]. Aryati et al. (2013) have studied the Indonesian dengue surveillance at eight cities in 2010-2012 and successfully analyzed NS1 gene sequences and amino acid polymorphisms from 48 isolates of DENV and their contribution to the sensitivity of the ELISA test in detecting the dengue infection. NS1 diagnostic sensitivity research in Indonesia shows varying values for each serotype. DENV-1, DENV-2, DENV-3, and DENV-4 serotypes have sensitivity of 67.4%, 68.4%, 68.8%, and 19%, respectively [1].
Computational methods, such as homology modeling have been used to analyze tertiary structure of proteins based on protein structure homology and predict molecular at the atomic level. Homology modeling is based on the theory that two homologous proteins have structures that are very similar to each other. In this method, the structure of a protein, called the target protein, is determined based on the structure of other proteins (template proteins) that are known and have similar sequences to the target protein. [8, 18]
Based on the description above, an in silico analysis of the NS1 Indonesia antigen structure serotype DENV-1, DENV-2, DENV-3, and DENV-4 has been done through homology modeling in order to design molecular antigen that can be used as diagnostic agent for better sensitivity of NS1 detection in Indonesia. MATERIALS AND METHODS
Materials The in silico experiments were carried out using computer hardware Intel Core i3 2.0 GHz, 4 Gigabyte memory, Windows 10 operating system, software Biovia Discovery Studio 2017, Modeller 9.19, ClusPro server (https://cluspro.org), the Pyre2 (http://www.sbg.bio.ic.ac.uk/ phyre2), the server http://tools.iedb.org/discotope/ and Prochek (https://www.ebi.ac.uk/thorntonsrv/databases/pdbsum/Generate.html).
Dewi Astriany et al ISPST 2018 ISSN: 0975-1459
JPSR-November(S)2018 30
The amino acid sequences of NS1 were retrieved from the website of the National Center for Biotechnology Information (https://www.ncbi.nlm.nih.gov/) with the GenBank NS1 sequence code obtained from the isolates of the Indonesian DENV NS1 gene sequence. We used 48 codes of NS1 Indonesian Dengue antigen consist of 21 structures of DENV-1, 6 structures of DENV-2, 17 structures of DENV-3, and 4 structures of DENV-4 serotypes.[1] Methods Determination of Indonesian DENV NS1 Templates Basic Local Alignment Search Tools (BLAST) at GenBank site pages of NCBI has been done against the amino acid sequence of NS1 DENV-1, DENV-2, DENV-3, and DENV-4 by selecting "Run BLAST" with the option "blastx". Further analysis by Pyre2 server (http://www.sbg.bio.ic.ac.uk/phyre2) accessed by entering amino acid sequences obtained from NCBI. The best template for Indonesian NS1 modeling was selected from the BLAST and phyre2 results based on the sequence similarity, high homology level, folding pattern, and stucture quality parameters. Modeling of Indonesian DENV NS1 The structures of 48 Indonesian DENV NS1 were constructed using Modeller 9.19. The input file prepared in a folder containing the protein template downloaded from http://www.rcsb.org/ with the format (. pdb), the amino acid sequence of the model with the format (. ali), script to align the model and template (align2d.py), and script to create a model with one template (model _ single.py).
A statistical potential energy to assess model, Discrete Optimized Protein Energy (DOPE) value, were calculated for the structures of model and template. The model with the lowest DOPE value was selected then the quality of model structure was evaluated by Ramachandran plot using Prochek server accessed through the website (https://www.ebi.ac.uk/thorntonsrv/databases/pdbsum/ Generate.html). If there were residues in the restricted area (disallowed regions), the models optimized with script order to optimize the loop (loop.py) until there are no residues in the forbidden area. The script command is executed for evaluation of loop optimization results (evaluate_loop.py), and script to evaluate the template (evaluate_template.py). The DOPE profile between the model and the template was compared to opening the file (.profile), then creating a graph by Microsoft Excel software. The results of the model and comparison of the model and template forms viewed using the Biovia Discovey Studio 2017 Application.
Analysis modeling structure of Indonesian DENV NS1 In the Biovia Discovery Studio application, the models of NS1 Indonesian DENV overlayed through the template in the ribbon structure, the superimpose option was selected and the RMSD value was obtained. The addition of surface aromatic is done by selected the surface option and the aromatic edge/face option.
The Indonesian DENV epitope and template were searched using discotope on the server (http://tools.iedb.org/discotope/) and aligned on one view. The sequences were performed on the ribbon sequence and the show sequence option was selected. An alignment analysis of the sequence between the Indonesian DENV model and the template based on identical levels.
Dewi Astriany et al ISPST 2018 ISSN: 0975-1459
JPSR-November(S)2018 31
RESULTS AND DISCUSSION
Determination of Indonesian DENV NS1 Templates The amino acid sequences of Indonesian DENV NS1 serotypes were obtained from web server (https://www.ncbi.nlm.nih.gov) by entering the genbank code in the nucleotide option. This information on amino acid sequences can be used as the basic for making the NS1 structure and analyzing relationships between proteins [17].
Based on the sequence similarity, folding pattern, and stucture quality, there were two NSI protein structures with a high degree of homology obtained, the Chain A Dengue Type 1 NS1 Nauru (PDB code : 4OIG_A) with 80% homology and Chain A Dengue Type2 NS1 Thailand, Form 1 Crystal (PDB code : 406B_A) with 74% homology.
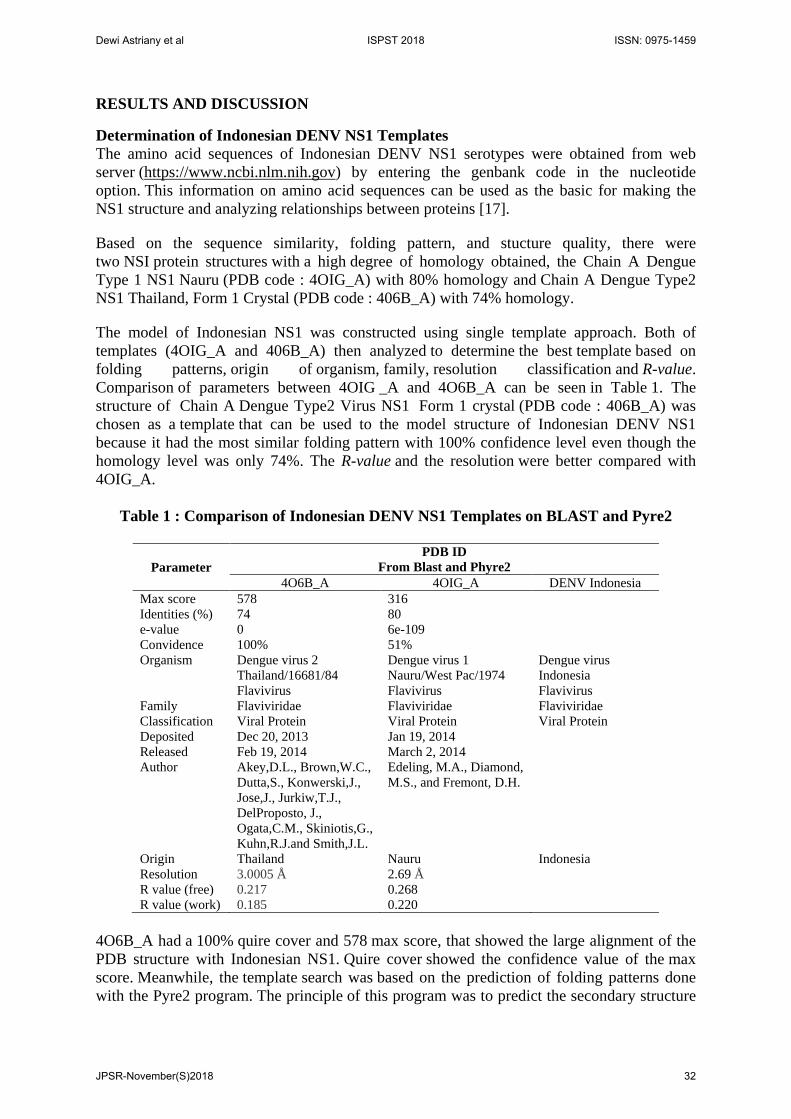
The model of Indonesian NS1 was constructed using single template approach. Both of templates (4OIG_A and 406B_A) then analyzed to determine the best template based on folding patterns, origin of organism, family, resolution classification and R-value. Comparison of parameters between 4OIG _A and 4O6B_A can be seen in Table 1. The structure of Chain A Dengue Type2 Virus NS1 Form 1 crystal (PDB code : 406B_A) was chosen as a template that can be used to the model structure of Indonesian DENV NS1 because it had the most similar folding pattern with 100% confidence level even though the homology level was only 74%. The R-value and the resolution were better compared with 4OIG_A.
Table 1 : Comparison of Indonesian DENV NS1 Templates on BLAST and Pyre2
Parameter PDB ID
From Blast and Phyre2 4O6B_A 4OIG_A DENV Indonesia
Max score 578 316 Identities (%) 74 80 e-value 0 6e-109 Convidence 100% 51% Organism Dengue virus 2
Thailand/16681/84 Flavivirus
Dengue virus 1 Nauru/West Pac/1974 Flavivirus
Dengue virus Indonesia Flavivirus
Family Flaviviridae Flaviviridae Flaviviridae Classification Viral Protein Viral Protein Viral Protein Deposited Dec 20, 2013 Jan 19, 2014 Released Feb 19, 2014 March 2, 2014 Author Akey,D.L., Brown,W.C.,
Dutta,S., Konwerski,J., Jose,J., Jurkiw,T.J., DelProposto, J., Ogata,C.M., Skiniotis,G., Kuhn,R.J.and Smith,J.L.
Edeling, M.A., Diamond, M.S., and Fremont, D.H.
Origin Thailand Nauru Indonesia Resolution 3.0005 Å 2.69 Å R value (free) 0.217 0.268 R value (work) 0.185 0.220
4O6B_A had a 100% quire cover and 578 max score, that showed the large alignment of the PDB structure with Indonesian NS1. Quire cover showed the confidence value of the max score. Meanwhile, the template search was based on the prediction of folding patterns done with the Pyre2 program. The principle of this program was to predict the secondary structure
Dewi Astriany et al ISPST 2018 ISSN: 0975-1459
JPSR-November(S)2018 32
of proteins and compare them with other secondary structures that have been previously known. 4O6B_A had the most similar folding pattern, with a 100% confidence level and 99% homology level. Then the best template can be used to model the structure of Indonesian NS1 DENV-1, DENV-2, DENV-3, and DENV-4 was 4O6B_A because it had the highest homology, comes from the same family, and the structure quality is 3 Å resolution. Modeling of Indonesian DENV NS1 Homology modeling has been done through 21 structures of NS1 DENV-1, 6 structures of NS1 DENV-2, 17 structures of NS1 DENV-3, and 4 structures of NS1 DENV-4 by Modeller 9.19 using the selected template (PDB code : 4O6B_A).
Each structure was made up of five models which are then selected based on the lowest DOPE values to be evaluated, then each of the best model results evaluated with a ramachandran plot. The DOPE value showed the potential energy of the model, the smaller (negative) the value the better the quality of the model.
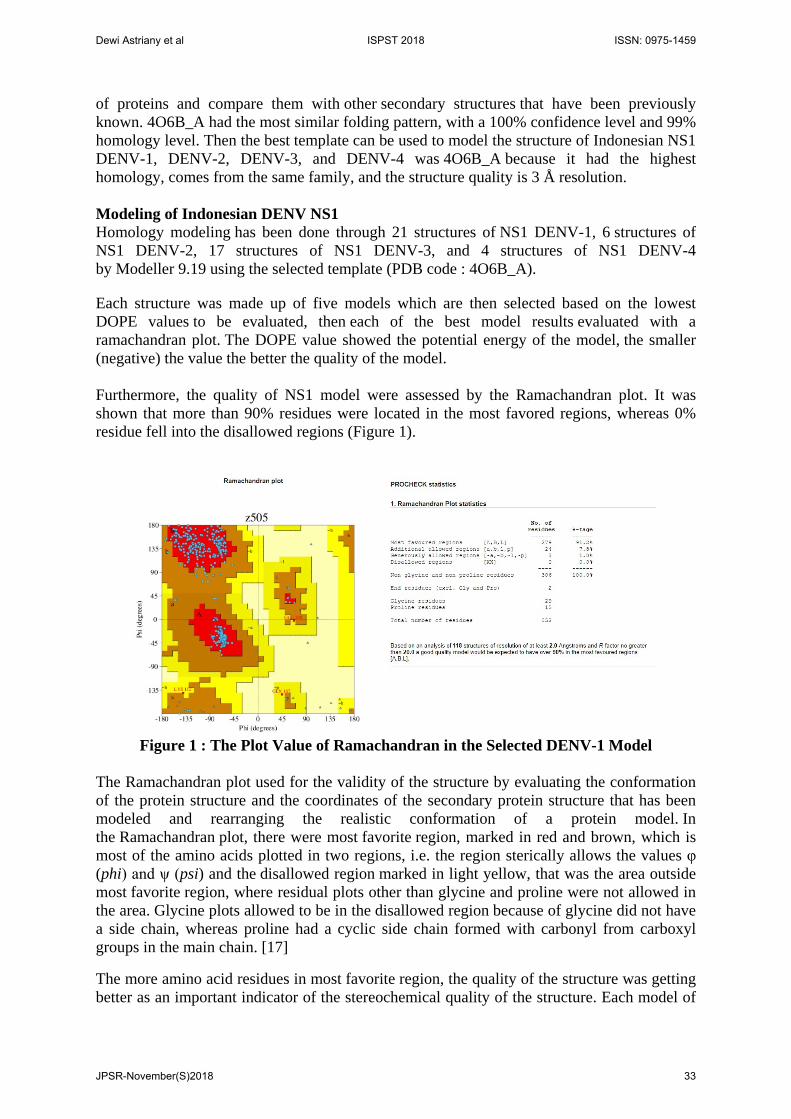
Furthermore, the quality of NS1 model were assessed by the Ramachandran plot. It was shown that more than 90% residues were located in the most favored regions, whereas 0% residue fell into the disallowed regions (Figure 1).
Figure 1 : The Plot Value of Ramachandran in the Selected DENV-1 Model
The Ramachandran plot used for the validity of the structure by evaluating the conformation of the protein structure and the coordinates of the secondary protein structure that has been modeled and rearranging the realistic conformation of a protein model. In the Ramachandran plot, there were most favorite region, marked in red and brown, which is most of the amino acids plotted in two regions, i.e. the region sterically allows the values φ (phi) and ψ (psi) and the disallowed region marked in light yellow, that was the area outside most favorite region, where residual plots other than glycine and proline were not allowed in the area. Glycine plots allowed to be in the disallowed region because of glycine did not have a side chain, whereas proline had a cyclic side chain formed with carbonyl from carboxyl groups in the main chain. [17]
The more amino acid residues in most favorite region, the quality of the structure was getting better as an important indicator of the stereochemical quality of the structure. Each model of
Dewi Astriany et al ISPST 2018 ISSN: 0975-1459
JPSR-November(S)2018 33
the Ramachandran plot evaluation results analyzed, if there was a residue in the restricted area then optimization of the loop section was carried out. Optimization was only carried out around the residuals in restricted areas because if it was optimized it can change the previously stable conformation. After that, each model of the optimization results was evaluated by a Ramachandran plot again. The model with the residual value in the highest permitted area (more than 90%) of each serotype was chosen because it had the best quality. The quality of the model produced depends on the residual equation between the two proteins. The target sequence equation with template must be greater than 30% to produce a good model. [2, 9]
The DENV structure model with the sample code NS1/ID/DENV1-20, NS1/ID/DENV2-2, NS1/ID/DENV3-6 and NS1/ID/DENV4-1 were chosen to be the model with the amino acid residues value in the highest allowed regions in Ramachandran plot value were 91.3%, 90.5%, 90.6% and 90.2%, respectively.
Based on the results of the study, modeling the tertiary structure of NS1 of DENV-3 and DENV-4 shows similarity greater than 50%, low of DOPE values, and the number of non-glycine residues in the discharged region of Ramachandran Plots predicted by Procheck were less than 15% of the total residue.
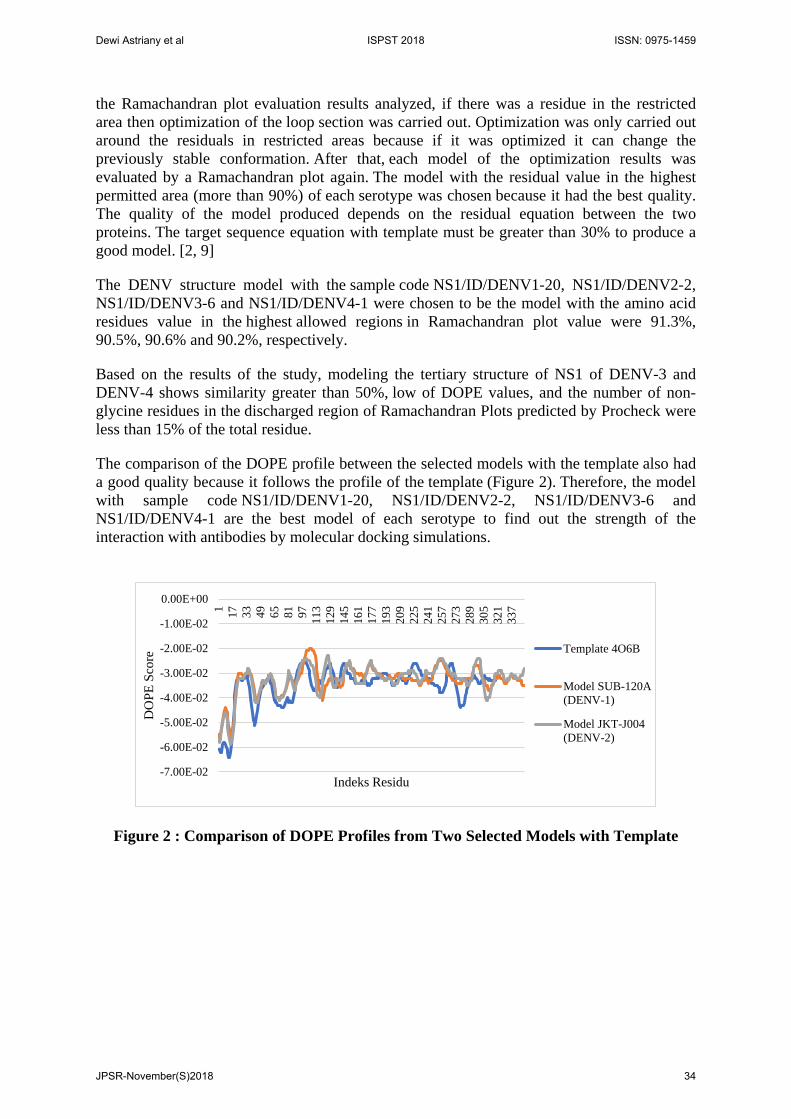
The comparison of the DOPE profile between the selected models with the template also had a good quality because it follows the profile of the template (Figure 2). Therefore, the model with sample code NS1/ID/DENV1-20, NS1/ID/DENV2-2, NS1/ID/DENV3-6 and NS1/ID/DENV4-1 are the best model of each serotype to find out the strength of the interaction with antibodies by molecular docking simulations.
Figure 2 : Comparison of DOPE Profiles from Two Selected Models with Template
-7.00E-02
-6.00E-02
-5.00E-02
-4.00E-02
-3.00E-02
-2.00E-02
-1.00E-02
0.00E+00
1 17 33 49 65 81 97 113
129
145
161
177
193
209
225
241
257
273
289
305
321
337
DO
PE S
core
Indeks Residu
Template 4O6B
Model SUB-120A(DENV-1)
Model JKT-J004(DENV-2)
Dewi Astriany et al ISPST 2018 ISSN: 0975-1459
JPSR-November(S)2018 34

(a)
(b)
(c)
(d)
Figure 3 : The Best Model of Indonesian DENV NS1 (a) NS1/ID/DENV1-20,
(b) NS1/ID/DENV2-2, (c) NS1/ID/DENV3-6, and (d) NS1/ID/DENV4-1 Analysis modeling structure of Indonesian DENV NS1 Sequence alignment analysis was the process of arranging two more sequences so that the similarities in the sequences really appear (Irianto, 2017). This analysis used to see the polymorphism of the Indonesian NS1 modeling of the DENV-3 and DENV-4 serotypes. The results showed there were different properties of each NS1 antigen in Indonesia because of
Dewi Astriany et al ISPST 2018 ISSN: 0975-1459
JPSR-November(S)2018 35
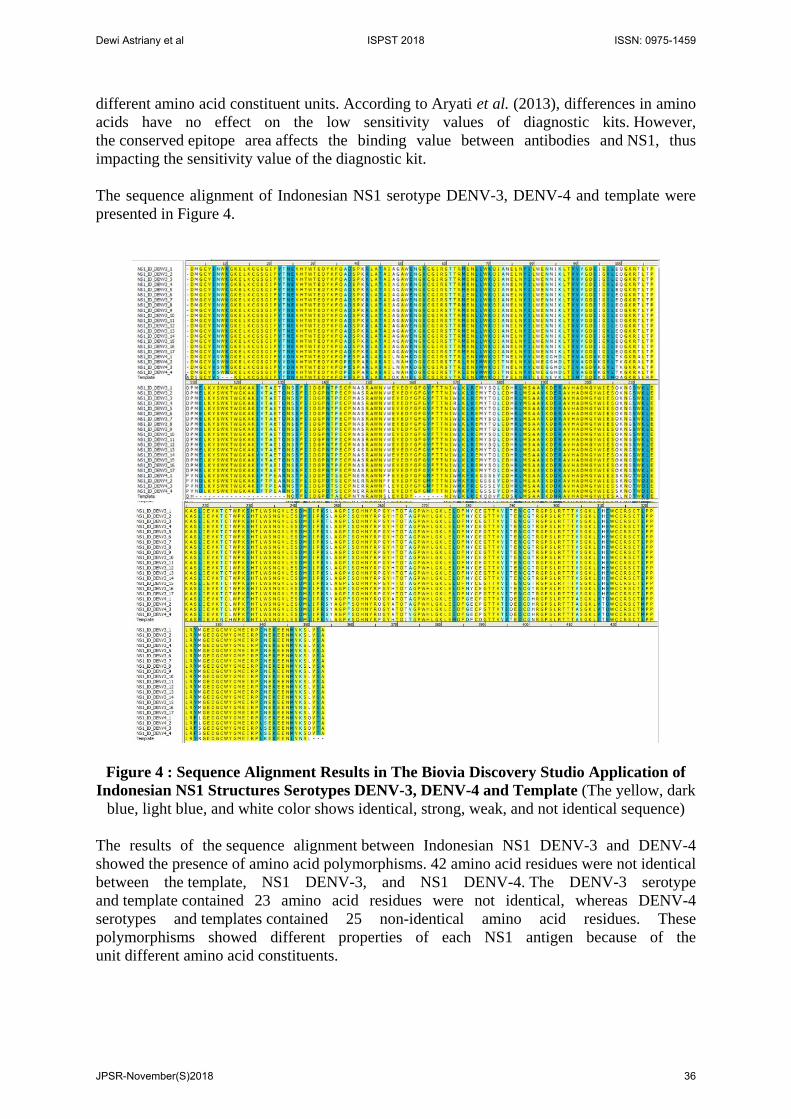
different amino acid constituent units. According to Aryati et al. (2013), differences in amino acids have no effect on the low sensitivity values of diagnostic kits. However, the conserved epitope area affects the binding value between antibodies and NS1, thus impacting the sensitivity value of the diagnostic kit. The sequence alignment of Indonesian NS1 serotype DENV-3, DENV-4 and template were presented in Figure 4.
Figure 4 : Sequence Alignment Results in The Biovia Discovery Studio Application of Indonesian NS1 Structures Serotypes DENV-3, DENV-4 and Template (The yellow, dark
blue, light blue, and white color shows identical, strong, weak, and not identical sequence) The results of the sequence alignment between Indonesian NS1 DENV-3 and DENV-4 showed the presence of amino acid polymorphisms. 42 amino acid residues were not identical between the template, NS1 DENV-3, and NS1 DENV-4. The DENV-3 serotype and template contained 23 amino acid residues were not identical, whereas DENV-4 serotypes and templates contained 25 non-identical amino acid residues. These polymorphisms showed different properties of each NS1 antigen because of the unit different amino acid constituents.
Dewi Astriany et al ISPST 2018 ISSN: 0975-1459
JPSR-November(S)2018 36
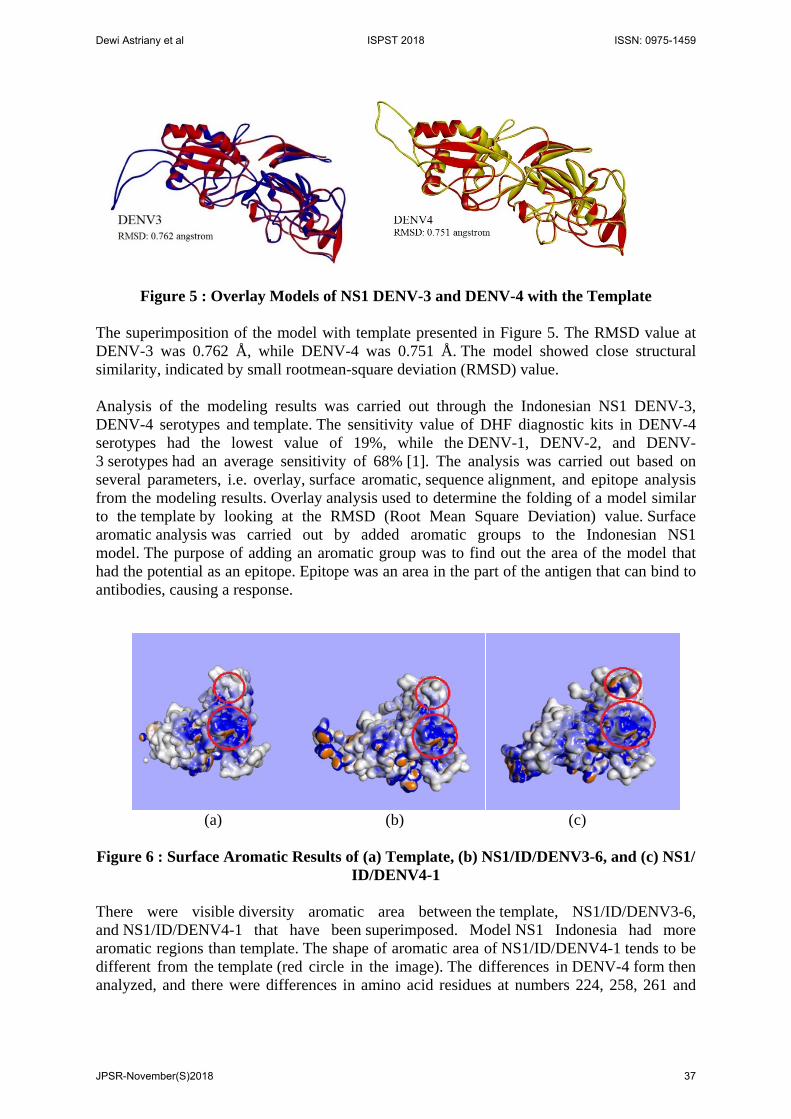
Figure 5 : Overlay Models of NS1 DENV-3 and DENV-4 with the Template The superimposition of the model with template presented in Figure 5. The RMSD value at DENV-3 was 0.762 Å, while DENV-4 was 0.751 Å. The model showed close structural similarity, indicated by small rootmean-square deviation (RMSD) value. Analysis of the modeling results was carried out through the Indonesian NS1 DENV-3, DENV-4 serotypes and template. The sensitivity value of DHF diagnostic kits in DENV-4 serotypes had the lowest value of 19%, while the DENV-1, DENV-2, and DENV-3 serotypes had an average sensitivity of 68% [1]. The analysis was carried out based on several parameters, i.e. overlay, surface aromatic, sequence alignment, and epitope analysis from the modeling results. Overlay analysis used to determine the folding of a model similar to the template by looking at the RMSD (Root Mean Square Deviation) value. Surface aromatic analysis was carried out by added aromatic groups to the Indonesian NS1 model. The purpose of adding an aromatic group was to find out the area of the model that had the potential as an epitope. Epitope was an area in the part of the antigen that can bind to antibodies, causing a response.
(a) (b) (c)
Figure 6 : Surface Aromatic Results of (a) Template, (b) NS1/ID/DENV3-6, and (c) NS1/ ID/DENV4-1
There were visible diversity aromatic area between the template, NS1/ID/DENV3-6, and NS1/ID/DENV4-1 that have been superimposed. Model NS1 Indonesia had more aromatic regions than template. The shape of aromatic area of NS1/ID/DENV4-1 tends to be different from the template (red circle in the image). The differences in DENV-4 form then analyzed, and there were differences in amino acid residues at numbers 224, 258, 261 and
Dewi Astriany et al ISPST 2018 ISSN: 0975-1459
JPSR-November(S)2018 37
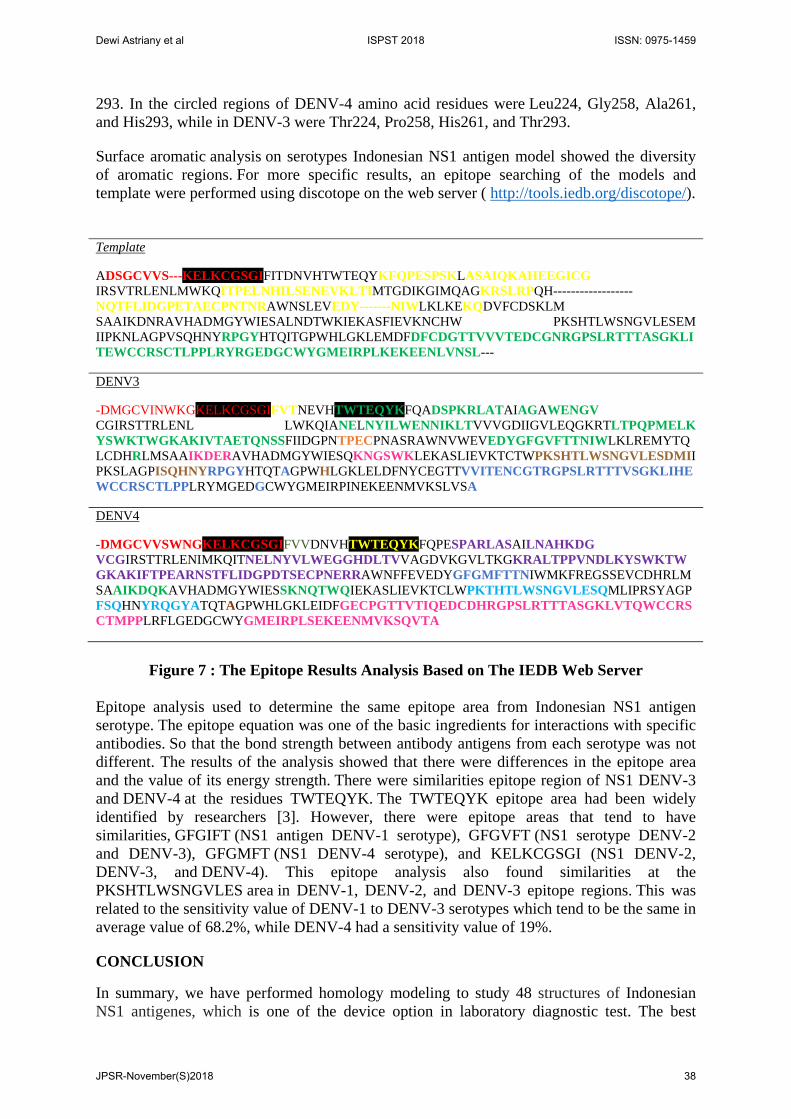
293. In the circled regions of DENV-4 amino acid residues were Leu224, Gly258, Ala261, and His293, while in DENV-3 were Thr224, Pro258, His261, and Thr293.
Surface aromatic analysis on serotypes Indonesian NS1 antigen model showed the diversity of aromatic regions. For more specific results, an epitope searching of the models and template were performed using discotope on the web server ( http://tools.iedb.org/discotope/). Template
ADSGCVVS---KELKCGSGIFITDNVHTWTEQYKFQPESPSKLASAIQKAHEEGICG IRSVTRLENLMWKQITPELNHILSENEVKLTIMTGDIKGIMQAGKRSLRPQH------------------NQTFLIDGPETAECPNTNRAWNSLEVEDY-------NIWLKLKEKQDVFCDSKLM SAAIKDNRAVHADMGYWIESALNDTWKIEKASFIEVKNCHW PKSHTLWSNGVLESEM IIPKNLAGPVSQHNYRPGYHTQITGPWHLGKLEMDFDFCDGTTVVVTEDCGNRGPSLRTTTASGKLITEWCCRSCTLPPLRYRGEDGCWYGMEIRPLKEKEENLVNSL---
DENV3
-DMGCVINWKGKELKCGSGIFVTNEVHTWTEQYKFQADSPKRLATAIAGAWENGV CGIRSTTRLENL LWKQIANELNYILWENNIKLTVVVGDIIGVLEQGKRTLTPQPMELK YSWKTWGKAKIVTAETQNSSFIIDGPNTPECPNASRAWNVWEVEDYGFGVFTTNIWLKLREMYTQLCDHRLMSAAIKDERAVHADMGYWIESQKNGSWKLEKASLIEVKTCTWPKSHTLWSNGVLESDMIIPKSLAGPISQHNYRPGYHTQTAGPWHLGKLELDFNYCEGTTVVITENCGTRGPSLRTTTVSGKLIHEWCCRSCTLPPLRYMGEDGCWYGMEIRPINEKEENMVKSLVSA
DENV4
-DMGCVVSWNGKELKCGSGIFVVDNVHTWTEQYKFQPESPARLASAILNAHKDG VCGIRSTTRLENIMKQITNELNYVLWEGGHDLTVVAGDVKGVLTKGKRALTPPVNDLKYSWKTWGKAKIFTPEARNSTFLIDGPDTSECPNERRAWNFFEVEDYGFGMFTTNIWMKFREGSSEVCDHRLMSAAIKDQKAVHADMGYWIESSKNQTWQIEKASLIEVKTCLWPKTHTLWSNGVLESQMLIPRSYAGPFSQHNYRQGYATQTAGPWHLGKLEIDFGECPGTTVTIQEDCDHRGPSLRTTTASGKLVTQWCCRSCTMPPLRFLGEDGCWYGMEIRPLSEKEENMVKSQVTA
Figure 7 : The Epitope Results Analysis Based on The IEDB Web Server
Epitope analysis used to determine the same epitope area from Indonesian NS1 antigen serotype. The epitope equation was one of the basic ingredients for interactions with specific antibodies. So that the bond strength between antibody antigens from each serotype was not different. The results of the analysis showed that there were differences in the epitope area and the value of its energy strength. There were similarities epitope region of NS1 DENV-3 and DENV-4 at the residues TWTEQYK. The TWTEQYK epitope area had been widely identified by researchers [3]. However, there were epitope areas that tend to have similarities, GFGIFT (NS1 antigen DENV-1 serotype), GFGVFT (NS1 serotype DENV-2 and DENV-3), GFGMFT (NS1 DENV-4 serotype), and KELKCGSGI (NS1 DENV-2, DENV-3, and DENV-4). This epitope analysis also found similarities at the PKSHTLWSNGVLES area in DENV-1, DENV-2, and DENV-3 epitope regions. This was related to the sensitivity value of DENV-1 to DENV-3 serotypes which tend to be the same in average value of 68.2%, while DENV-4 had a sensitivity value of 19%.
CONCLUSION
In summary, we have performed homology modeling to study 48 structures of Indonesian NS1 antigenes, which is one of the device option in laboratory diagnostic test. The best
Dewi Astriany et al ISPST 2018 ISSN: 0975-1459
JPSR-November(S)2018 38

model of DENV-1, DENV-2, DENV-3, and DENV-4 were NS1/ID/DENV1-20, NS1/ID/DENV2-2, NS1/ID/DENV3-6 and NS1/ID/DENV4-1 with Ramachandran plot value 91.3%, 90.5%, 90.6% and 90.2%, respectively.
Analysis of overlay results showed the similarity of Indonesian NS1 DENV-3 serotypes on templates was higher than DENV-4. Surface aromatic yield analysis showed there were different shapes and amino acids residues of Indonesian NS1 DENV-4 serotypes compared to DENV-3 and templates.
The results showed that the differences of structures, amino acid residues, and epitopes from templates and each serotype are valuable tools for designing molecular antigen as diagnostic agent to enhance the sensitivity value of dengue diagnostic kits in Indonesia.
ACKNOWLEDGEMENTS
This research was partly supported by Indonesian Endowment Fund for Education/Lembaga Pengelola Dana Pendidikan (LPDP) the Republic of Indonesia.
REFERENCES
1. Aryati A, Trimarsanto H, Yohan B, Wardhani P, Fahri S, Sasmono RT. Performance of commercial dengue NS1 ELISA and molecular analysis of NS1 gene of dengue viruses obtained during surveillance in Indonesia. BMC Infectious Diseases. 2013;(13):611.
2. Bordoli L, Florian K, Konstantin A, Pascal B, Battey J, & Schwede T. Protein structure homology modeling using SWISS-MODEL workspace. Nature Protocols. 2009; 4(1):1-13.
3. Gelanew, Tesfaye, & Hunsperger E. Development and characterization of serotype-specific monoclonal antibodies against the dengue virus-4 (DENV-4) non-structural protein (NS1). Virology Journal. 2018; (15):1-12.
4. Guzman MG, Halstead SB, Artsob H, Buchy P, Farrar J, Gubler DJ, Hunsperger E, Kroeger A, Margolis HS, Martinez E, Nathan MB, Pelegrino JL, Simmons C, Yoksan S, & Peeling RW. Dengue : A Continuing Global Threat, National Review Microbiology. 2010; 8(12):7-16.
5. Holmes EC & Burch SS. The Causes and Consequences of Genetic Variation in Dengue Virus, Trends in Microbiology, 2008:74–77.
6. Holmes EC & Twiddy S. The Origin, Emergence and Evolutionary Genetics of Dengue Virus. Journal of Infection Genetic Evolution. 2003; (3):19–28.
7. Kementerian Kesehatan Republik Indonesia. Situasi Demam Berdarah Dengue di Indonesia. Infodatin (Pusat Data dan Informasi Kementrian Kesehatan RI). 2016. p.1.
8. Irianto K. Biologi Molekuler. Bandung : Alfabeta; 2017. p. 456,461, & 470. 9. Laskowski R, MacArthur M, Moss D, Thornton J. PROCHECK : a program to check the
stereochemical quality of protein structures. J. Appl Crystalography. 1993; (26):283–291.
10. Lestari K. Epidemiologi dan Pencegahan Demam Berdarah Dengue (DBD) Di Indonesia. Farmaka. 2007; 5(3):12-29.
11. Martina BEE, Koraka P, & Osterhaus. ADME : Dengue Virus Pathogenesis and Integrated View. Clinical Microbiology Review. 2009; 22(4):564–581.
12. Noor RI, Aryati A, & Wardhani P. Keterkaitan Antigen NS1 Infeksi Virus Dengue dengan Serotipe Virus Dengue. Indonesian Journal of Clinical Pathology and Medical Laboratory. 2012; 18(2):77-75.
Dewi Astriany et al ISPST 2018 ISSN: 0975-1459
JPSR-November(S)2018 39
13. Robinson LN, Thrakaraman KJ, Rowley, et al. Structure-Guided Design of an Anti-dengue Antibody Directed to a Non-immunodominant Epitope. Cell. 2015; (162):493-504.
14. Rothman AL. Dengue : Defining Protective Versus Pathologic Immunity. The Journal ofClinical Investigation. 2004; 113(2):948.
15. Simmons CP, Farrar JJ, Van VCN, & Wills B. Dengue. England Journal Medicine.2012; 366(2):1423–1432.
16. Tan M, Kusriastuti R, Savioli L, Hotez PJ. Indonesia : An Emerging Market EconomyBeset by Neglected Tropical Diseases (NTDs). PLOS Neglected Tropical Diseases.2014; 8(2):3.
17. Thenawidjaja M, Ismaya WT, & Retnoningrum DS. Protein : Serial Biokimia Mudahdan Menggugah. Jakarta : Grasindo; 2017. p.35.
18. Venselaar H, Robbie P, Joosten BV, Coos AB, Baakman ML, Hekkelman EK, & Gert V.Homology Modelling and Spectroscopy, A Never-Ending Love Story. Journal of EuropeBiophysics. 2010; (39):551–563.
Dewi Astriany et al ISPST 2018 ISSN: 0975-1459
JPSR-November(S)2018 40