Embed Size (px)
Citation preview
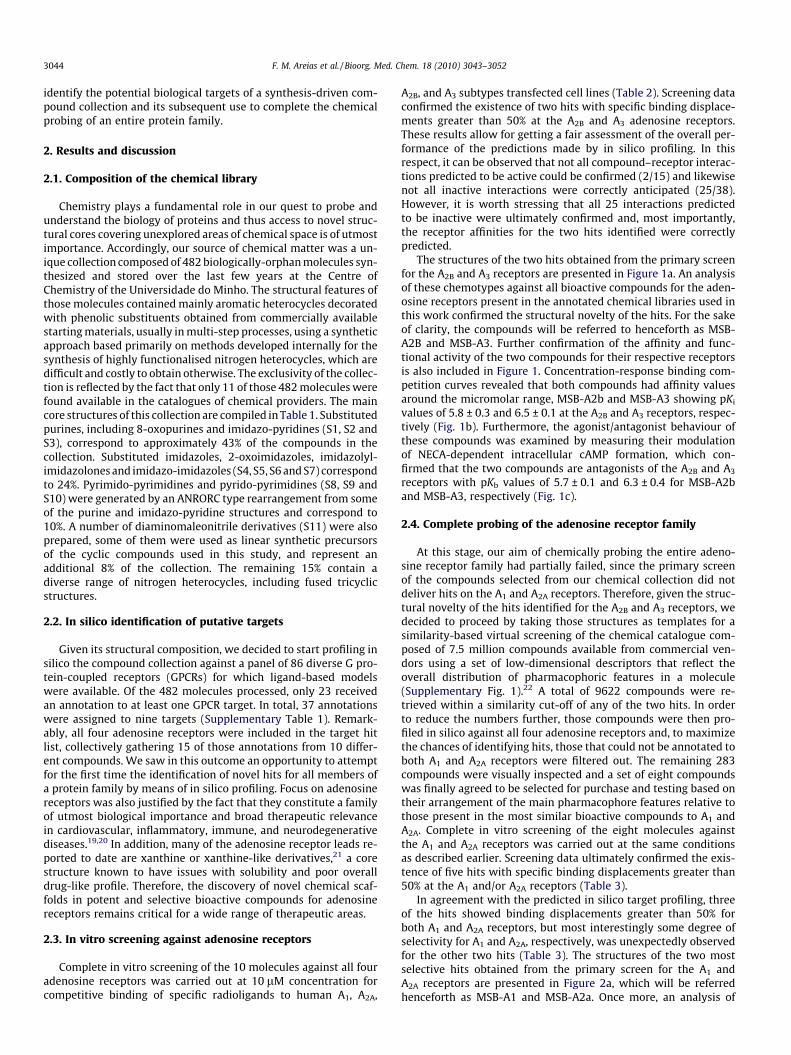
Bioorganic & Medicinal Chemistry 18 (2010) 3043–3052
Contents lists available at ScienceDirect
Bioorganic & Medicinal Chemistry
journal homepage: www.elsevier .com/locate /bmc
In silico directed chemical probing of the adenosine receptor family
Filipe M. Areias a,b, Jose Brea b, Elisabet Gregori-Puigjané c, Magdi E. A. Zaki a, M. Alice Carvalho a,Eduardo Domínguez b, Hugo Gutiérrez-de-Terán b, M. Fernanda Proença a, María I. Loza b, Jordi Mestres c,*
a Center of Chemistry, Campus de Gualtar, Universidade do Minho, 4710-057 Braga, Portugalb Department of Pharmacology, Universidade de Santiago de Compostela, 15782 Santiago de Compostela, Spainc Chemotargets SL and Chemogenomics Laboratory, Research Unit on Biomedical Informatics, Institut Municipal d’Investigació Mèdica and Universitat Pompeu Fabra, 08003 Barcelona,Catalonia, Spain
a r t i c l e i n f o a b s t r a c t
Article history:Received 12 January 2010Revised 12 March 2010Accepted 20 March 2010Available online 27 March 2010
Keywords:Target profilingAdenosine antagonistsChemogenomicsComputational chemical biology
0968-0896/$ - see front matter � 2010 Elsevier Ltd. Adoi:10.1016/j.bmc.2010.03.048
* Corresponding author.E-mail address: [email protected] (J. Mestres).
One of the grand challenges in chemical biology is identifying a small-molecule modulator for each indi-vidual function of all human proteins. Instead of targeting one protein at a time, an efficient approach toaddress this challenge is to target entire protein families by taking advantage of the relatively high levelsof chemical promiscuity observed within certain boundaries of sequence phylogeny. We recently devel-oped a computational approach to identifying the potential protein targets of compounds based on theirsimilarity to known bioactive molecules for almost 700 targets. Here, we describe the direct identificationof novel antagonists for all four adenosine receptor subtypes by applying our virtual profiling approach toa unique synthesis-driven chemical collection composed of 482 biologically-orphan molecules. Theseresults illustrate the potential role of in silico target profiling to guide efficiently screening campaignsdirected to discover new chemical probes for all members of a protein family.
� 2010 Elsevier Ltd. All rights reserved.
1. Introduction
The identification of the complete list of proteins to which smallmolecules could potentially have affinity is a cornerstone in the useof chemistry to probe biology, with important implications formodern drug discovery.1 The compilation of large compound col-lections and the implementation of high-throughput screening, inboth industry and academia, have increased dramatically ourcapacity to probe the chemical space for a single target. However,our capacity to probe the biological space of a single molecule isstill limited, mainly due to the huge logistics involved in the sys-tematic screening of molecules on a large panel of in vitro assayswhich, until recently, made these activities feasible only withinthe privacy of biotechnology and pharmaceutical industry.2–4 Inthis respect, the launch of global coordinated initiatives, such asthe NIH Molecular Libraries Screening Center Network (MLSCN)5
and the Psychoactive Drug Screening Program (PDSP),6 opens anavenue towards the consistent generation of screening data formolecules and the ultimate deposition of all chemical and biolog-ical data in public databases. In parallel, several informatics initia-tives, such as DrugBank,7 IUPHAR-DB,8 and BindingDB,9 arecomplementing these experimental screening programs by collect-ing all pharmacological data being published in multiple biblio-
ll rights reserved.
graphical sources and making them accessible also in the publicdomain. Additionally, a growing number of entries containing a li-gand forming a complex inside a protein cavity are being depositedin the Protein Data Bank,10 the major public repository for proteinstructure information.
The availability of an increasing amount of protein–ligand inter-action data has promoted the development of a variety of computa-tional methods aiming at predicting the pharmacological profile ofcompounds,11–13 and thus offering a perfect means to expand in sil-ico our capacity to probe the biological space of molecules. Depend-ing on the source of information being exploited, target profilingmethods can be divided into ligand-based and structure-basedmethods: ligand-based methods rely essentially on comparing a tar-get compound to a database of hundreds of thousands of chemicalstructures with known targets, whereas structure-based methodsrequire three-dimensional information of the protein binding cavityto dock compounds in or assess their fitness relative to the exposedpharmacophoric features. Ligand-based target profiling methodswere successfully applied recently to several drugs to detect addi-tional proteins other than their recognized primary targets14 andto predict the mechanism of action of antimalarials discovered in ahigh-throughput cell-based screen.15 Likewise, structure-based tar-get profiling methods allowed also for identifying a true target forsome compounds in a scaffold-focused library16 and to discoverthree targets associated with constituents of a medicinal plant.17
Here, we report the application of our own implementation of aligand-based approach to in silico pharmacological profiling18 to
3044 F. M. Areias et al. / Bioorg. Med. Chem. 18 (2010) 3043–3052
identify the potential biological targets of a synthesis-driven com-pound collection and its subsequent use to complete the chemicalprobing of an entire protein family.
2. Results and discussion
2.1. Composition of the chemical library
Chemistry plays a fundamental role in our quest to probe andunderstand the biology of proteins and thus access to novel struc-tural cores covering unexplored areas of chemical space is of utmostimportance. Accordingly, our source of chemical matter was a un-ique collection composed of 482 biologically-orphan molecules syn-thesized and stored over the last few years at the Centre ofChemistry of the Universidade do Minho. The structural features ofthose molecules contained mainly aromatic heterocycles decoratedwith phenolic substituents obtained from commercially availablestarting materials, usually in multi-step processes, using a syntheticapproach based primarily on methods developed internally for thesynthesis of highly functionalised nitrogen heterocycles, which aredifficult and costly to obtain otherwise. The exclusivity of the collec-tion is reflected by the fact that only 11 of those 482 molecules werefound available in the catalogues of chemical providers. The maincore structures of this collection are compiled in Table 1. Substitutedpurines, including 8-oxopurines and imidazo-pyridines (S1, S2 andS3), correspond to approximately 43% of the compounds in thecollection. Substituted imidazoles, 2-oxoimidazoles, imidazolyl-imidazolones and imidazo-imidazoles (S4, S5, S6 and S7) correspondto 24%. Pyrimido-pyrimidines and pyrido-pyrimidines (S8, S9 andS10) were generated by an ANRORC type rearrangement from someof the purine and imidazo-pyridine structures and correspond to10%. A number of diaminomaleonitrile derivatives (S11) were alsoprepared, some of them were used as linear synthetic precursorsof the cyclic compounds used in this study, and represent anadditional 8% of the collection. The remaining 15% contain adiverse range of nitrogen heterocycles, including fused tricyclicstructures.
2.2. In silico identification of putative targets
Given its structural composition, we decided to start profiling insilico the compound collection against a panel of 86 diverse G pro-tein-coupled receptors (GPCRs) for which ligand-based modelswere available. Of the 482 molecules processed, only 23 receivedan annotation to at least one GPCR target. In total, 37 annotationswere assigned to nine targets (Supplementary Table 1). Remark-ably, all four adenosine receptors were included in the target hitlist, collectively gathering 15 of those annotations from 10 differ-ent compounds. We saw in this outcome an opportunity to attemptfor the first time the identification of novel hits for all members ofa protein family by means of in silico profiling. Focus on adenosinereceptors was also justified by the fact that they constitute a familyof utmost biological importance and broad therapeutic relevancein cardiovascular, inflammatory, immune, and neurodegenerativediseases.19,20 In addition, many of the adenosine receptor leads re-ported to date are xanthine or xanthine-like derivatives,21 a corestructure known to have issues with solubility and poor overalldrug-like profile. Therefore, the discovery of novel chemical scaf-folds in potent and selective bioactive compounds for adenosinereceptors remains critical for a wide range of therapeutic areas.
2.3. In vitro screening against adenosine receptors
Complete in vitro screening of the 10 molecules against all fouradenosine receptors was carried out at 10 lM concentration forcompetitive binding of specific radioligands to human A1, A2A,
A2B, and A3 subtypes transfected cell lines (Table 2). Screening dataconfirmed the existence of two hits with specific binding displace-ments greater than 50% at the A2B and A3 adenosine receptors.These results allow for getting a fair assessment of the overall per-formance of the predictions made by in silico profiling. In thisrespect, it can be observed that not all compound–receptor interac-tions predicted to be active could be confirmed (2/15) and likewisenot all inactive interactions were correctly anticipated (25/38).However, it is worth stressing that all 25 interactions predictedto be inactive were ultimately confirmed and, most importantly,the receptor affinities for the two hits identified were correctlypredicted.
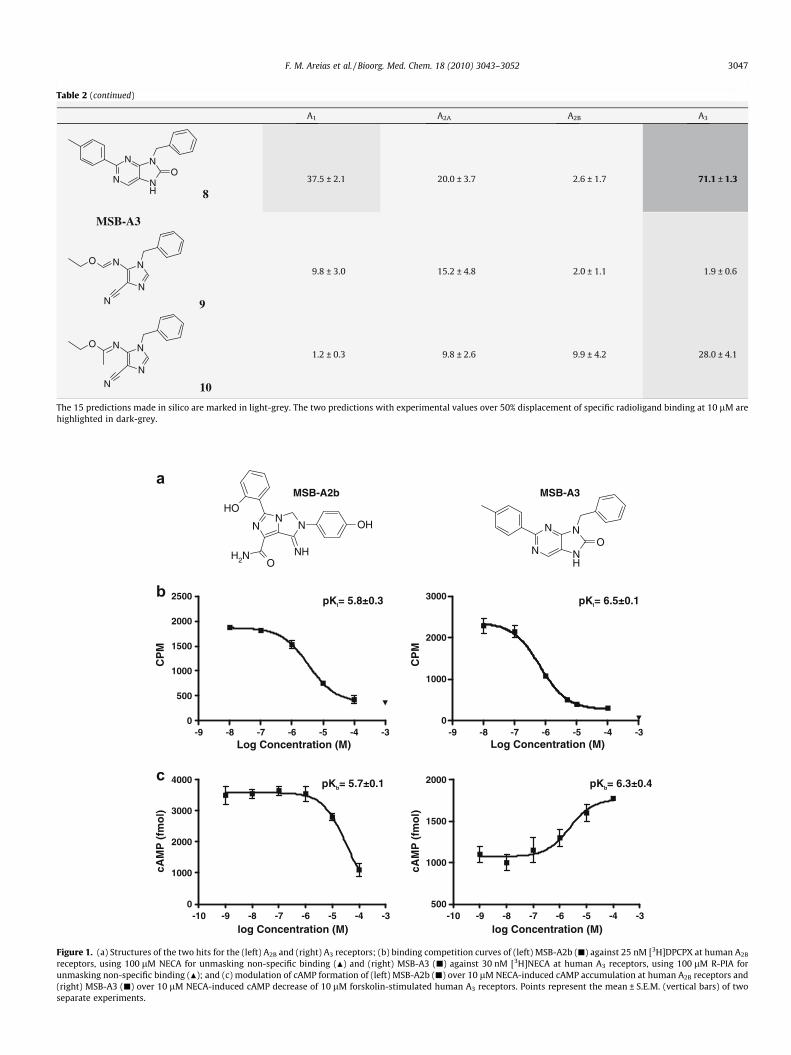
The structures of the two hits obtained from the primary screenfor the A2B and A3 receptors are presented in Figure 1a. An analysisof these chemotypes against all bioactive compounds for the aden-osine receptors present in the annotated chemical libraries used inthis work confirmed the structural novelty of the hits. For the sakeof clarity, the compounds will be referred to henceforth as MSB-A2B and MSB-A3. Further confirmation of the affinity and func-tional activity of the two compounds for their respective receptorsis also included in Figure 1. Concentration-response binding com-petition curves revealed that both compounds had affinity valuesaround the micromolar range, MSB-A2b and MSB-A3 showing pKi
values of 5.8 ± 0.3 and 6.5 ± 0.1 at the A2B and A3 receptors, respec-tively (Fig. 1b). Furthermore, the agonist/antagonist behaviour ofthese compounds was examined by measuring their modulationof NECA-dependent intracellular cAMP formation, which con-firmed that the two compounds are antagonists of the A2B and A3
receptors with pKb values of 5.7 ± 0.1 and 6.3 ± 0.4 for MSB-A2band MSB-A3, respectively (Fig. 1c).
2.4. Complete probing of the adenosine receptor family
At this stage, our aim of chemically probing the entire adeno-sine receptor family had partially failed, since the primary screenof the compounds selected from our chemical collection did notdeliver hits on the A1 and A2A receptors. Therefore, given the struc-tural novelty of the hits identified for the A2B and A3 receptors, wedecided to proceed by taking those structures as templates for asimilarity-based virtual screening of the chemical catalogue com-posed of 7.5 million compounds available from commercial ven-dors using a set of low-dimensional descriptors that reflect theoverall distribution of pharmacophoric features in a molecule(Supplementary Fig. 1).22 A total of 9622 compounds were re-trieved within a similarity cut-off of any of the two hits. In orderto reduce the numbers further, those compounds were then pro-filed in silico against all four adenosine receptors and, to maximizethe chances of identifying hits, those that could not be annotated toboth A1 and A2A receptors were filtered out. The remaining 283compounds were visually inspected and a set of eight compoundswas finally agreed to be selected for purchase and testing based ontheir arrangement of the main pharmacophore features relative tothose present in the most similar bioactive compounds to A1 andA2A. Complete in vitro screening of the eight molecules againstthe A1 and A2A receptors was carried out at the same conditionsas described earlier. Screening data ultimately confirmed the exis-tence of five hits with specific binding displacements greater than50% at the A1 and/or A2A receptors (Table 3).
In agreement with the predicted in silico target profiling, threeof the hits showed binding displacements greater than 50% forboth A1 and A2A receptors, but most interestingly some degree ofselectivity for A1 and A2A, respectively, was unexpectedly observedfor the other two hits (Table 3). The structures of the two mostselective hits obtained from the primary screen for the A1 andA2A receptors are presented in Figure 2a, which will be referredhenceforth as MSB-A1 and MSB-A2a. Once more, an analysis of
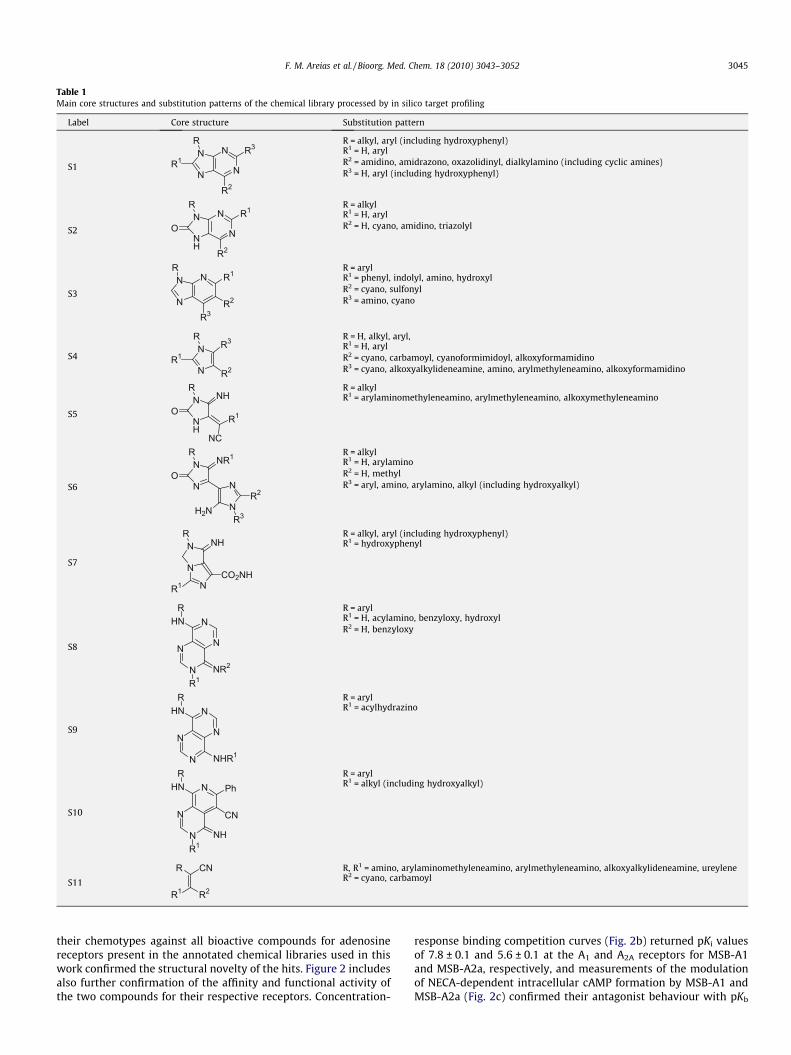
Table 1Main core structures and substitution patterns of the chemical library processed by in silico target profiling
Label Core structure Substitution pattern
S1N
N
N
NR
R1R3
R2
R = alkyl, aryl (including hydroxyphenyl)R1 = H, arylR2 = amidino, amidrazono, oxazolidinyl, dialkylamino (including cyclic amines)R3 = H, aryl (including hydroxyphenyl)
S2NH
N
N
NO
RR1
R2
R = alkylR1 = H, arylR2 = H, cyano, amidino, triazolyl
S3N
N NR
R1
R2
R3
R = arylR1 = phenyl, indolyl, amino, hydroxylR2 = cyano, sulfonylR3 = amino, cyano
S4
N
NR1
RR3
R2
R = H, alkyl, aryl,R1 = H, arylR2 = cyano, carbamoyl, cyanoformimidoyl, alkoxyformamidinoR3 = cyano, alkoxyalkylideneamine, amino, arylmethyleneamino, alkoxyformamidino
S5NH
NO
RNH
R1
NC
R = alkylR1 = arylaminomethyleneamino, arylmethyleneamino, alkoxymethyleneamino
S6 N
N NR1
O
R
N
N
H2NR2
R3
R = alkylR1 = H, arylaminoR2 = H, methylR3 = aryl, amino, arylamino, alkyl (including hydroxyalkyl)
S7 N
N
N
RNH
CO2NHR1
R = alkyl, aryl (including hydroxyphenyl)R1 = hydroxyphenyl
S8
N
NN
N
HNR
NR2
R1
R = arylR1 = H, acylamino, benzyloxy, hydroxylR2 = H, benzyloxy
S9
N
NN
N
HNR
NHR1
R = arylR1 = acylhydrazino
S10
N
N
N
HNR
R1NH
Ph
CN
R = arylR1 = alkyl (including hydroxyalkyl)
S11R1 R2
R CN R, R1 = amino, arylaminomethyleneamino, arylmethyleneamino, alkoxyalkylideneamine, ureyleneR2 = cyano, carbamoyl
F. M. Areias et al. / Bioorg. Med. Chem. 18 (2010) 3043–3052 3045
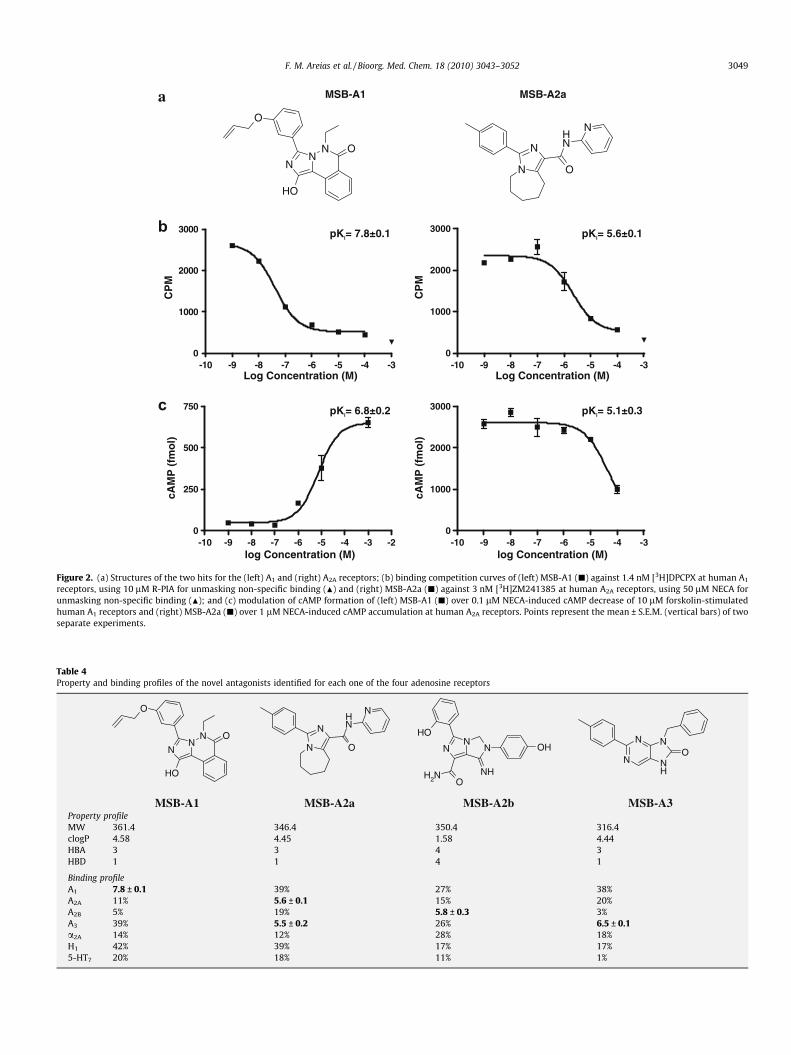
their chemotypes against all bioactive compounds for adenosinereceptors present in the annotated chemical libraries used in thiswork confirmed the structural novelty of the hits. Figure 2 includesalso further confirmation of the affinity and functional activity ofthe two compounds for their respective receptors. Concentration-
response binding competition curves (Fig. 2b) returned pKi valuesof 7.8 ± 0.1 and 5.6 ± 0.1 at the A1 and A2A receptors for MSB-A1and MSB-A2a, respectively, and measurements of the modulationof NECA-dependent intracellular cAMP formation by MSB-A1 andMSB-A2a (Fig. 2c) confirmed their antagonist behaviour with pKb
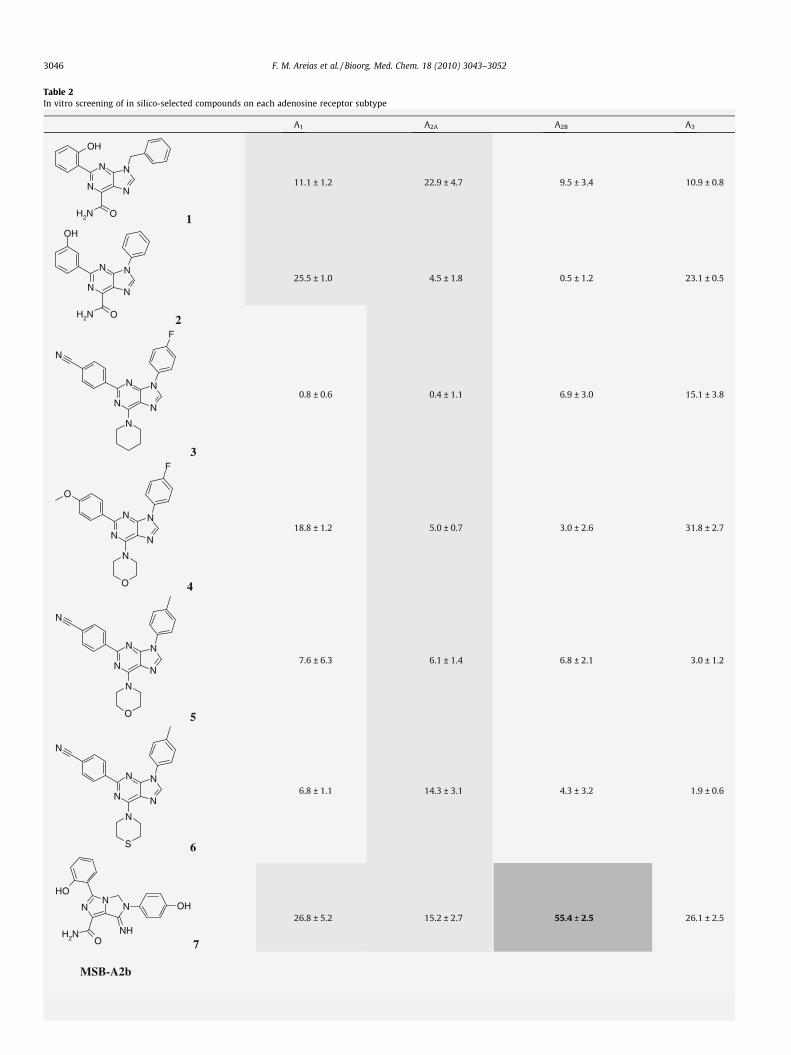
Table 2In vitro screening of in silico-selected compounds on each adenosine receptor subtype
3046 F. M. Areias et al. / Bioorg. Med. Chem. 18 (2010) 3043–3052
NN
N OH
NHNH2 O
OH
NH
NO
N
N
-9 -8 -7 -6 -5 -4 -30
500
1000
1500
2000
2500
Log Concentration (M)
CP
M
-9 -8 -7 -6 -5 -4 -30
1000
2000
3000
Log Concentration (M)
CP
M
-10 -9 -8 -7 -6 -5 -4 -30
1000
2000
3000
4000
log Concentration (M)
cAM
P (
fmo
l)
-10 -9 -8 -7 -6 -5 -4 -3500
1000
1500
2000
log Concentration (M)
cAM
P (
fmo
l)
pKi= 5.8±0.3 pKi= 6.5±0.1
MSB-A2b MSB-A3
pKb= 5.7±0.1 pKb= 6.3±0.4
Figure 1. (a) Structures of the two hits for the (left) A2B and (right) A3 receptors; (b) binding competition curves of (left) MSB-A2b (j) against 25 nM [3H]DPCPX at human A2B
receptors, using 100 lM NECA for unmasking non-specific binding (N) and (right) MSB-A3 (j) against 30 nM [3H]NECA at human A3 receptors, using 100 lM R-PIA forunmasking non-specific binding (N); and (c) modulation of cAMP formation of (left) MSB-A2b (j) over 10 lM NECA-induced cAMP accumulation at human A2B receptors and(right) MSB-A3 (j) over 10 lM NECA-induced cAMP decrease of 10 lM forskolin-stimulated human A3 receptors. Points represent the mean ± S.E.M. (vertical bars) of twoseparate experiments.
Table 2 (continued)
The 15 predictions made in silico are marked in light-grey. The two predictions with experimental values over 50% displacement of specific radioligand binding at 10 lM arehighlighted in dark-grey.
F. M. Areias et al. / Bioorg. Med. Chem. 18 (2010) 3043–3052 3047
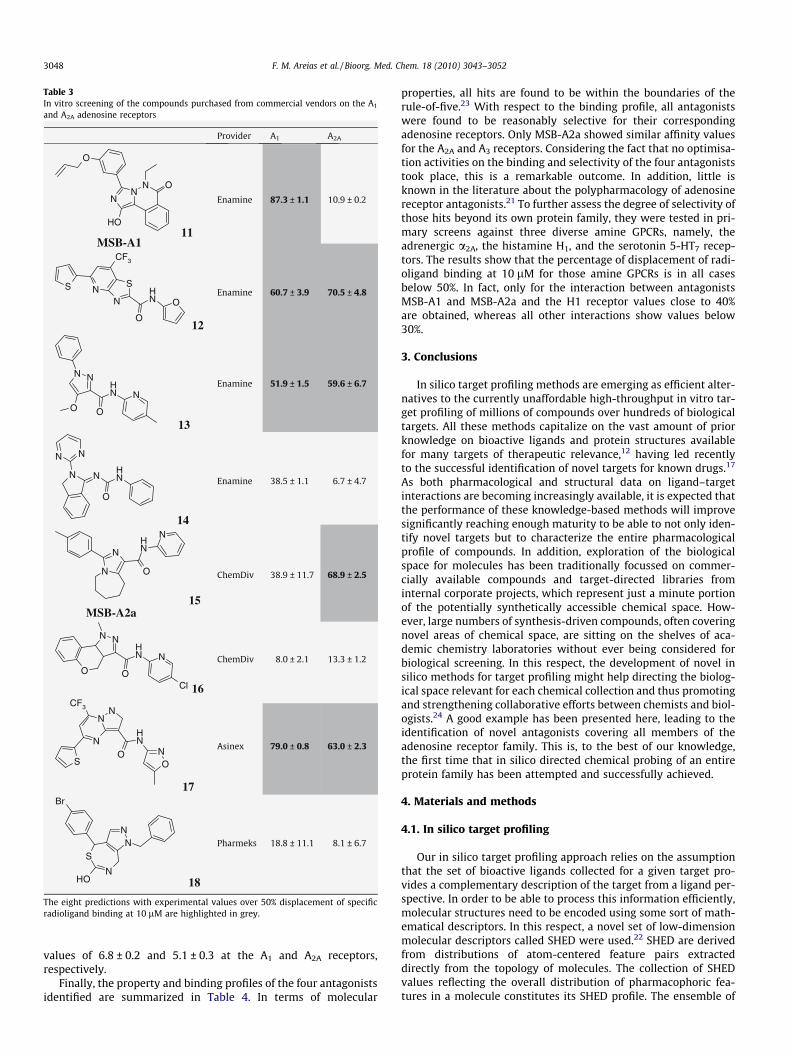
Table 3In vitro screening of the compounds purchased from commercial vendors on the A1
and A2A adenosine receptors
The eight predictions with experimental values over 50% displacement of specificradioligand binding at 10 lM are highlighted in grey.
3048 F. M. Areias et al. / Bioorg. Med. Chem. 18 (2010) 3043–3052
values of 6.8 ± 0.2 and 5.1 ± 0.3 at the A1 and A2A receptors,respectively.
Finally, the property and binding profiles of the four antagonistsidentified are summarized in Table 4. In terms of molecular
properties, all hits are found to be within the boundaries of therule-of-five.23 With respect to the binding profile, all antagonistswere found to be reasonably selective for their correspondingadenosine receptors. Only MSB-A2a showed similar affinity valuesfor the A2A and A3 receptors. Considering the fact that no optimisa-tion activities on the binding and selectivity of the four antagoniststook place, this is a remarkable outcome. In addition, little isknown in the literature about the polypharmacology of adenosinereceptor antagonists.21 To further assess the degree of selectivity ofthose hits beyond its own protein family, they were tested in pri-mary screens against three diverse amine GPCRs, namely, theadrenergic a2A, the histamine H1, and the serotonin 5-HT7 recep-tors. The results show that the percentage of displacement of radi-oligand binding at 10 lM for those amine GPCRs is in all casesbelow 50%. In fact, only for the interaction between antagonistsMSB-A1 and MSB-A2a and the H1 receptor values close to 40%are obtained, whereas all other interactions show values below30%.
3. Conclusions
In silico target profiling methods are emerging as efficient alter-natives to the currently unaffordable high-throughput in vitro tar-get profiling of millions of compounds over hundreds of biologicaltargets. All these methods capitalize on the vast amount of priorknowledge on bioactive ligands and protein structures availablefor many targets of therapeutic relevance,12 having led recentlyto the successful identification of novel targets for known drugs.17
As both pharmacological and structural data on ligand–targetinteractions are becoming increasingly available, it is expected thatthe performance of these knowledge-based methods will improvesignificantly reaching enough maturity to be able to not only iden-tify novel targets but to characterize the entire pharmacologicalprofile of compounds. In addition, exploration of the biologicalspace for molecules has been traditionally focussed on commer-cially available compounds and target-directed libraries frominternal corporate projects, which represent just a minute portionof the potentially synthetically accessible chemical space. How-ever, large numbers of synthesis-driven compounds, often coveringnovel areas of chemical space, are sitting on the shelves of aca-demic chemistry laboratories without ever being considered forbiological screening. In this respect, the development of novel insilico methods for target profiling might help directing the biolog-ical space relevant for each chemical collection and thus promotingand strengthening collaborative efforts between chemists and biol-ogists.24 A good example has been presented here, leading to theidentification of novel antagonists covering all members of theadenosine receptor family. This is, to the best of our knowledge,the first time that in silico directed chemical probing of an entireprotein family has been attempted and successfully achieved.
4. Materials and methods
4.1. In silico target profiling
Our in silico target profiling approach relies on the assumptionthat the set of bioactive ligands collected for a given target pro-vides a complementary description of the target from a ligand per-spective. In order to be able to process this information efficiently,molecular structures need to be encoded using some sort of math-ematical descriptors. In this respect, a novel set of low-dimensionmolecular descriptors called SHED were used.22 SHED are derivedfrom distributions of atom-centered feature pairs extracteddirectly from the topology of molecules. The collection of SHEDvalues reflecting the overall distribution of pharmacophoric fea-tures in a molecule constitutes its SHED profile. The ensemble of
NN
N
OH
O
O
N
N O
NH
N
-10 -9 -8 -7 -6 -5 -4 -30
1000
2000
3000
Log Concentration (M)
CP
M
-10 -9 -8 -7 -6 -5 -4 -30
1000
2000
3000
Log Concentration (M)
CP
M
-10 -9 -8 -7 -6 -5 -4 -3 -20
250
500
750
log Concentration (M)
cAM
P (
fmo
l)
-10 -9 -8 -7 -6 -5 -4 -30
1000
2000
3000
log Concentration (M)
cAM
P (
fmo
l)
pKi= 7.8±0.1 pKi= 5.6±0.1
MSB-A1 MSB-A2a
pKi= 6.8±0.2 pKi= 5.1±0.3
Figure 2. (a) Structures of the two hits for the (left) A1 and (right) A2A receptors; (b) binding competition curves of (left) MSB-A1 (j) against 1.4 nM [3H]DPCPX at human A1
receptors, using 10 lM R-PIA for unmasking non-specific binding (N) and (right) MSB-A2a (j) against 3 nM [3H]ZM241385 at human A2A receptors, using 50 lM NECA forunmasking non-specific binding (N); and (c) modulation of cAMP formation of (left) MSB-A1 (j) over 0.1 lM NECA-induced cAMP decrease of 10 lM forskolin-stimulatedhuman A1 receptors and (right) MSB-A2a (j) over 1 lM NECA-induced cAMP accumulation at human A2A receptors. Points represent the mean ± S.E.M. (vertical bars) of twoseparate experiments.
Table 4Property and binding profiles of the novel antagonists identified for each one of the four adenosine receptors
NN
N
OH
O
O
N
N O
NH
N
NN
N OH
NHNH2 O
OH
NH
NO
N
N
MSB-A2aMSB-A1 MSB-A2b MSB-A3Property profileMW 361.4 346.4 350.4 316.4clogP 4.58 4.45 1.58 4.44HBA 3 3 4 3HBD 1 1 4 1
Binding profileA1 7.8 ± 0.1 39% 27% 38%A2A 11% 5.6 ± 0.1 15% 20%A2B 5% 19% 5.8 ± 0.3 3%A3 39% 5.5 ± 0.2 26% 6.5 ± 0.1a2A 14% 12% 28% 18%H1 42% 39% 17% 17%5-HT7 20% 18% 11% 1%
F. M. Areias et al. / Bioorg. Med. Chem. 18 (2010) 3043–3052 3049
3050 F. M. Areias et al. / Bioorg. Med. Chem. 18 (2010) 3043–3052
SHED profiles representing all bioactive molecules annotated to aparticular protein target forms a mathematical description of thetarget from a chemical perspective. On this basis, ligand-baseddescriptor models were derived for 86 GPCRs using the interactiondata present in BindingDB9 and PDSP,25 supplemented with anadditional GPCR annotated chemical library assembled internally.The probability of any molecule to interact with a particular targetis assumed to be related to the degree of similarity relative to theset of known bioactive ligands for that target. Accordingly, Euclid-ean distances between the SHED profile of a molecule and all SHEDprofiles associated to a target are first calculated and a final targetscoring is given by the minimum value of all Euclidean distances.Following a previous validation analysis,26 if that minimum Euclid-ean distance is below 0.6, the molecule receives an annotation tothe target.
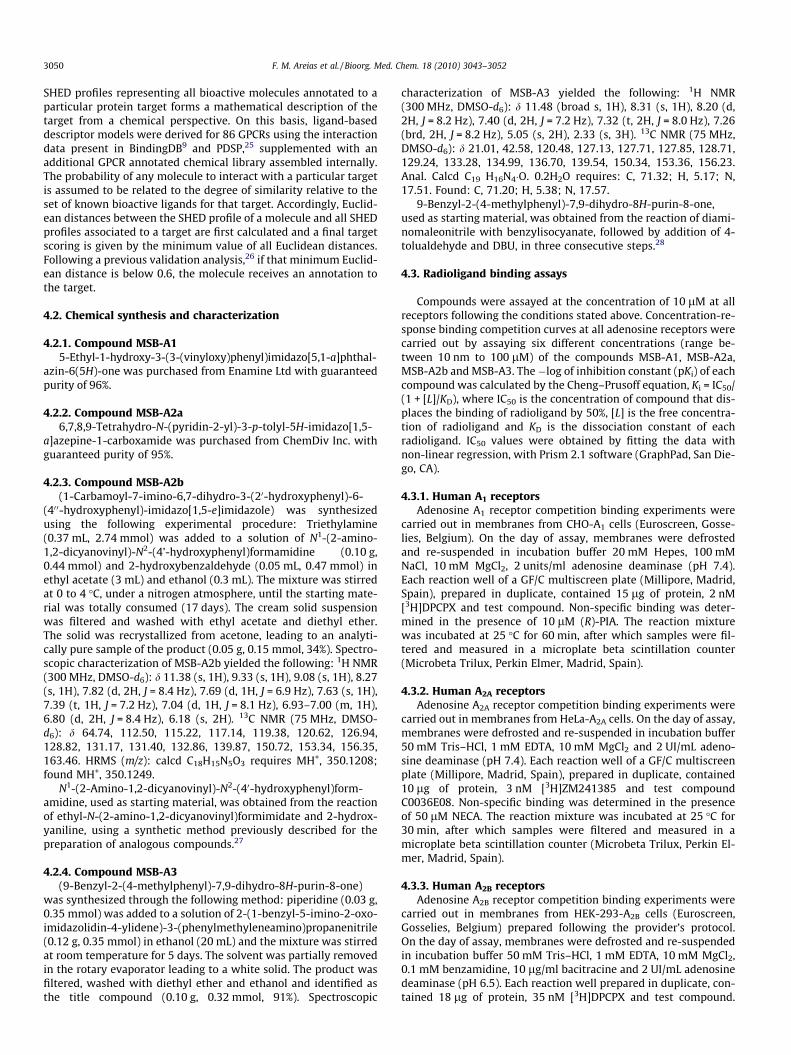
4.2. Chemical synthesis and characterization
4.2.1. Compound MSB-A15-Ethyl-1-hydroxy-3-(3-(vinyloxy)phenyl)imidazo[5,1-a]phthal-
azin-6(5H)-one was purchased from Enamine Ltd with guaranteedpurity of 96%.
4.2.2. Compound MSB-A2a6,7,8,9-Tetrahydro-N-(pyridin-2-yl)-3-p-tolyl-5H-imidazo[1,5-
a]azepine-1-carboxamide was purchased from ChemDiv Inc. withguaranteed purity of 95%.
4.2.3. Compound MSB-A2b(1-Carbamoyl-7-imino-6,7-dihydro-3-(20-hydroxyphenyl)-6-
(40 0-hydroxyphenyl)-imidazo[1,5-e]imidazole) was synthesizedusing the following experimental procedure: Triethylamine(0.37 mL, 2.74 mmol) was added to a solution of N1-(2-amino-1,2-dicyanovinyl)-N2-(4’-hydroxyphenyl)formamidine (0.10 g,0.44 mmol) and 2-hydroxybenzaldehyde (0.05 mL, 0.47 mmol) inethyl acetate (3 mL) and ethanol (0.3 mL). The mixture was stirredat 0 to 4 �C, under a nitrogen atmosphere, until the starting mate-rial was totally consumed (17 days). The cream solid suspensionwas filtered and washed with ethyl acetate and diethyl ether.The solid was recrystallized from acetone, leading to an analyti-cally pure sample of the product (0.05 g, 0.15 mmol, 34%). Spectro-scopic characterization of MSB-A2b yielded the following: 1H NMR(300 MHz, DMSO-d6): d 11.38 (s, 1H), 9.33 (s, 1H), 9.08 (s, 1H), 8.27(s, 1H), 7.82 (d, 2H, J = 8.4 Hz), 7.69 (d, 1H, J = 6.9 Hz), 7.63 (s, 1H),7.39 (t, 1H, J = 7.2 Hz), 7.04 (d, 1H, J = 8.1 Hz), 6.93–7.00 (m, 1H),6.80 (d, 2H, J = 8.4 Hz), 6.18 (s, 2H). 13C NMR (75 MHz, DMSO-d6): d 64.74, 112.50, 115.22, 117.14, 119.38, 120.62, 126.94,128.82, 131.17, 131.40, 132.86, 139.87, 150.72, 153.34, 156.35,163.46. HRMS (m/z): calcd C18H15N5O3 requires MH+, 350.1208;found MH+, 350.1249.
N1-(2-Amino-1,2-dicyanovinyl)-N2-(40-hydroxyphenyl)form-amidine, used as starting material, was obtained from the reactionof ethyl-N-(2-amino-1,2-dicyanovinyl)formimidate and 2-hydrox-yaniline, using a synthetic method previously described for thepreparation of analogous compounds.27
4.2.4. Compound MSB-A3(9-Benzyl-2-(4-methylphenyl)-7,9-dihydro-8H-purin-8-one)
was synthesized through the following method: piperidine (0.03 g,0.35 mmol) was added to a solution of 2-(1-benzyl-5-imino-2-oxo-imidazolidin-4-ylidene)-3-(phenylmethyleneamino)propanenitrile(0.12 g, 0.35 mmol) in ethanol (20 mL) and the mixture was stirredat room temperature for 5 days. The solvent was partially removedin the rotary evaporator leading to a white solid. The product wasfiltered, washed with diethyl ether and ethanol and identified asthe title compound (0.10 g, 0.32 mmol, 91%). Spectroscopic
characterization of MSB-A3 yielded the following: 1H NMR(300 MHz, DMSO-d6): d 11.48 (broad s, 1H), 8.31 (s, 1H), 8.20 (d,2H, J = 8.2 Hz), 7.40 (d, 2H, J = 7.2 Hz), 7.32 (t, 2H, J = 8.0 Hz), 7.26(brd, 2H, J = 8.2 Hz), 5.05 (s, 2H), 2.33 (s, 3H). 13C NMR (75 MHz,DMSO-d6): d 21.01, 42.58, 120.48, 127.13, 127.71, 127.85, 128.71,129.24, 133.28, 134.99, 136.70, 139.54, 150.34, 153.36, 156.23.Anal. Calcd C19 H16N4�O. 0.2H2O requires: C, 71.32; H, 5.17; N,17.51. Found: C, 71.20; H, 5.38; N, 17.57.
9-Benzyl-2-(4-methylphenyl)-7,9-dihydro-8H-purin-8-one,used as starting material, was obtained from the reaction of diami-nomaleonitrile with benzylisocyanate, followed by addition of 4-tolualdehyde and DBU, in three consecutive steps.28
4.3. Radioligand binding assays
Compounds were assayed at the concentration of 10 lM at allreceptors following the conditions stated above. Concentration-re-sponse binding competition curves at all adenosine receptors werecarried out by assaying six different concentrations (range be-tween 10 nm to 100 lM) of the compounds MSB-A1, MSB-A2a,MSB-A2b and MSB-A3. The�log of inhibition constant (pKi) of eachcompound was calculated by the Cheng–Prusoff equation, Ki = IC50/(1 + [L]/KD), where IC50 is the concentration of compound that dis-places the binding of radioligand by 50%, [L] is the free concentra-tion of radioligand and KD is the dissociation constant of eachradioligand. IC50 values were obtained by fitting the data withnon-linear regression, with Prism 2.1 software (GraphPad, San Die-go, CA).
4.3.1. Human A1 receptorsAdenosine A1 receptor competition binding experiments were
carried out in membranes from CHO-A1 cells (Euroscreen, Gosse-lies, Belgium). On the day of assay, membranes were defrostedand re-suspended in incubation buffer 20 mM Hepes, 100 mMNaCl, 10 mM MgCl2, 2 units/ml adenosine deaminase (pH 7.4).Each reaction well of a GF/C multiscreen plate (Millipore, Madrid,Spain), prepared in duplicate, contained 15 lg of protein, 2 nM[3H]DPCPX and test compound. Non-specific binding was deter-mined in the presence of 10 lM (R)-PIA. The reaction mixturewas incubated at 25 �C for 60 min, after which samples were fil-tered and measured in a microplate beta scintillation counter(Microbeta Trilux, Perkin Elmer, Madrid, Spain).
4.3.2. Human A2A receptorsAdenosine A2A receptor competition binding experiments were
carried out in membranes from HeLa-A2A cells. On the day of assay,membranes were defrosted and re-suspended in incubation buffer50 mM Tris–HCl, 1 mM EDTA, 10 mM MgCl2 and 2 UI/mL adeno-sine deaminase (pH 7.4). Each reaction well of a GF/C multiscreenplate (Millipore, Madrid, Spain), prepared in duplicate, contained10 lg of protein, 3 nM [3H]ZM241385 and test compoundC0036E08. Non-specific binding was determined in the presenceof 50 lM NECA. The reaction mixture was incubated at 25 �C for30 min, after which samples were filtered and measured in amicroplate beta scintillation counter (Microbeta Trilux, Perkin El-mer, Madrid, Spain).
4.3.3. Human A2B receptorsAdenosine A2B receptor competition binding experiments were
carried out in membranes from HEK-293-A2B cells (Euroscreen,Gosselies, Belgium) prepared following the provider’s protocol.On the day of assay, membranes were defrosted and re-suspendedin incubation buffer 50 mM Tris–HCl, 1 mM EDTA, 10 mM MgCl2,0.1 mM benzamidine, 10 lg/ml bacitracine and 2 UI/mL adenosinedeaminase (pH 6.5). Each reaction well prepared in duplicate, con-tained 18 lg of protein, 35 nM [3H]DPCPX and test compound.
F. M. Areias et al. / Bioorg. Med. Chem. 18 (2010) 3043–3052 3051
Non-specific binding was determined in the presence of 400 lMNECA. The reaction mixture was incubated at 25 �C for 30 min,after which samples were filtered through a multiscreen GF/Cmicroplate and measured in a microplate beta scintillation counter(Microbeta Trilux, Perkin Elmer, Madrid, Spain).
4.3.4. Human A3 receptorsAdenosine A3 receptor competition binding experiments were
carried out in membranes from HeLa-A3 cells. On the day of assay,membranes were defrosted and re-suspended in incubation buffer50 mM Tris–HCl, 1 mM EDTA, 5 mM MgCl2 and 2 UI/mL adenosinedeaminase (pH 7.4). Each reaction well of a GF/B multiscreen plate(Millipore, Madrid, Spain), prepared in triplicate, contained 90 lgof protein, 30 nM [3H]NECA and test compound. Non-specific bind-ing was determined in the presence of 100 lM (R)-PIA. The reac-tion mixture was incubated at 25 �C for 180 min, after whichsamples were filtered and measured in a microplate beta scintilla-tion counter (Microbeta Trilux, Perkin Elmer, Madrid, Spain).
4.3.5. Human a2A receptorsAdrenergic a2A receptor competition binding experiments were
carried out in membranes from CHO-a2A cells. On the day of assay,membranes were defrosted and re-suspended in incubation buffer25 mM Na2PO4 (pH 7.4). Each reaction well of a GF/C multiscreenplate (Millipore, Madrid, Spain), prepared in duplicate, contained25 lg of protein, 0.37 nM [3H]MK-912 and test compound. Non-specific binding was determined in the presence of 100 lM norepi-nephrine. The reaction mixture was incubated at 25 �C for 30 min,after which samples were filtered and measured in a microplatebeta scintillation counter (Microbeta Trilux, Perkin Elmer, Madrid,Spain).
4.3.6. Human H1 receptorsHistamine H1 receptor competition binding experiments were
carried out in membranes from CHO-H1 cells. On the day of assay,membranes were defrosted and re-suspended in incubation buffer50 mM Tris–HCl (pH 7.4). Each tube prepared in duplicate, con-tained 1 lg of protein, 2 nM [3H]pyrilamine and test compound.Non-specific binding was determined in the presence of 10 lM tri-prolidine. The reaction mixture was incubated at 27 �C for 60 min,after which samples were filtered through GF/C filters using aBrandel Harvester and measured in a beta scintillation counter(Beckman LS600 LL, Beckman Coulter, Madrid, Spain).
4.3.7. Human 5-HT7 receptorsSerotonin 5-HT7 receptor competition binding experiments
were carried out in membranes from HEK-293-5-HT7 cells. Onthe day of assay, membranes were defrosted and re-suspended inincubation buffer 50 mM Tris–HCl, 4 mM CaCl2, 1 mM ascorbicacid, 0.1 mM pargyline (pH 7.4). Each reaction well of a GF/C mul-tiscreen plate (Millipore, Madrid, Spain), prepared in duplicate,contained 5 lg of protein, 2 nM [3H]SB269970 and test compound.Non-specific binding was determined in the presence of 25 lM clo-zapine. The reaction mixture was incubated at 37 �C for 60 min,after which samples were filtered and measured in a microplatebeta scintillation counter (Microbeta Trilux, Perkin Elmer, Madrid,Spain).
4.4. cAMP prodution measurement
These assays were performed at adenosine receptors transfec-ted using a cAMP enzyme-immunoassay kit (Amersham Biosci-ences) and competition curves were obtained for compoundsMSB-A1, MSB-A2a, MSB-A2b and MSB-A3. Since A2A and A2B recep-tors are Gs-coupled receptors competition curves where performedover the NECA-induced cAMP accumulation. By other side, A1 and
A3 receptors are Gi/o-coupled receptors and therefore competitioncurves were performed over the NECA-induced inhibition of for-skolin-induced cAMP accumulation.
The antagonist potency was expressed as pKB (�log of the dis-sociation constant, KB), calculated for one concentration of antago-nist following the equation proposed by Leff and Dougall, KB = IC50/((2 + ([A]/[A50])n)1/n � 1), where IC50 is the concentration of antag-onist that inhibits receptor activation in a 50%, [A] is the agonistconcentration used to stimulate the receptor under study, [A50] isthe concentration of agonist that elicits a half-maximal stimulationof the receptor and n is the slope of the antagonist concentration-response curve.
4.4.1. Human A1 receptorsCHO-A1 cells were seeded (20,000 cells/well) in 96-well culture
plates and incubated at 37 �C in an atmosphere with 5% CO2 in Ea-gle’s Medium Nutrient Mixture F-12 (EMEM F-12), containing 10%Foetal Calf Serum (FCS) and 1% L-Glutamine. Cells were washed 3�with 200 ll assay medium (EMEM-F12 and 25 mM HEPES pH 7.4)and pre-incubated with assay medium containing 20 lM rolipramand test compounds at 37 �C for 15 min. 0.1 lM NECA was incu-bated for 15 min at 37 �C and 3 lM forskolin was incubated for3 min (total incubation time 30 min). Reaction was stopped withlysis buffer supplied in the kit and the enzyme-immunoassaywas carried out for detection of intracellular cAMP at 450 nm inan Ultra Evolution detector (Tecan). Data were fitted by non-linearregression using GraphPad Prism v2.01 (GraphPad Software).
4.4.2. Human A2A receptorsCHO-A2A cells were seeded (10,000 cells/well) in 96-well cul-
ture plates and incubated at 37 �C in an atmosphere with 5% CO2
in Dulbecco’s Modified Eagle’s Medium Nutrient Mixture F-12(DMEM F-12), containing 10% Foetal Calf Serum (FCS) and 1% L-Glutamine. Cells were washed 3� with 200 ll assay medium(DMEM-F12 and 25 mM HEPES pH 7.4) and pre-incubated with as-say medium containing 30 lM rolipram and test compounds at37 �C for 15 min. 1 lM NECA was incubated for 15 min at 37 �C (to-tal incubation time 30 min). Reaction was stopped with lysis buffersupplied in the kit and the enzyme-immunoassay was carried outfor detection of intracellular cAMP at 450 nm in an Ultra Evolutiondetector (Tecan). Data were fitted by non-linear regression usingGraphPad Prism v2.01 (GraphPad Software).
4.4.3. Human A2B receptorsHEK-293 cells were seeded (10,000 cells/well) in 96-well cul-
ture plates and incubated at 37 �C in an atmosphere with 5% CO2
in Eagle’s Medium Nutrient Mixture F-12 (EMEM F-12), containing10% Foetal Calf Serum (FCS) and 1% L-Glutamine. Cells werewashed 3� with 200 ll assay medium (EMEM-F12 and 25 mMHEPES pH 7.4) and pre-incubated with assay medium containing30 lM rolipram and test compounds at 37 �C for 15 min. 10 lMNECA was incubated for 15 min at 37 �C (total incubation time30 min). Reaction was stopped with lysis buffer supplied in thekit and the enzyme-immunoassay was carried out for detectionof intracellular cAMP at 450 nm in an Ultra Evolution detector (Te-can). Data were fitted by non-linear regression using GraphPadPrism v2.01 (GraphPad Software).
4.4.4. Human A3 receptorsCHO-A3 cells were seeded (20,000 cells/well) in 96-well culture
plates and incubated at 37 �C in an atmosphere with 5% CO2 Dul-becco’s Modified Eagle’s Medium Nutrient Mixture F-12 (DMEMF-12), containing 10% Foetal Calf Serum (FCS) and 1% L-Glutamine.Cells were washed 3x with 200 ll assay medium (DMEM-F12 and25 mM HEPES pH 7.4) and pre-incubated with assay medium con-taining 30 lM rolipram and test compounds at 37 �C for 15 min.
3052 F. M. Areias et al. / Bioorg. Med. Chem. 18 (2010) 3043–3052
1 lM NECA was incubated for 15 min at 37 �C and 10 lM forskolinwas incubated for 3 min (total incubation time 30 min). Reactionwas stopped with lysis buffer supplied in the kit and the en-zyme-immunoassay was carried out for detection of intracellularcAMP at 450 nm in an Ultra Evolution detector (Tecan). Data werefitted by non-linear regression using GraphPad Prism v2.01(GraphPad Software).
Acknowledgements
This research was funded by the Spanish Ministerio de Ciencia eInnovación (Grants HF2007-0055 and BIO2008-02329), the Portu-guese Fundação para a Ciência e Tecnologia (PPCDT/QUI/59356/2004), the Xunta de Galicia (07CSA003203PR and 08CSA020203PR), and the Instituto de Salud Carlos III. J.B. is the recipient ofan Isabel Barreto Contract from the Xunta de Galicia. FMA andMEAZ gratefully acknowledge Post-doc grants from the PortugueseFCT (SFRH/BPD/26106/2005 and SFRH/BPD/27029/2006).
Supplementary data
Supplementary data (full list of the 86 G protein-coupled recep-tors against which in silico target profiling was performed, to-gether with the predicted number of annotations assigned toeach target) associated with this article can be found, in the onlineversion, at doi:10.1016/j.bmc.2010.03.048.
References and notes
1. Schreiber, S. L. Nat. Chem. Biol. 2005, 1, 64.2. Krejsa, C. M.; Horvath, D.; Rogalski, S. L.; Penzotti, J. E.; Mao, B.; Barbosa, F.;
Migeon, J. C. Curr. Opin. Drug Discov. Devel. 2003, 6, 470.3. Whitebread, S.; Hamon, J.; Bojanic, D.; Urban, L. Drug Discovery Today 2005, 10,
1421.4. Karaman, M. W.; Herrgard, S.; Treiber, D. K.; Gallant, P.; Atteridge, C. E.;
Campbell, B. T.; Chan, K. W.; Ciceri, P.; Davis, M. I.; Edeen, P. T.; Faraoni, R.;Floyd, M.; Hunt, J. P.; Lockhart, D. J.; Milanov, Z. V.; Morrison, M. J.; Pallares, G.;
Patel, H. K.; Pritchard, S.; Wodicka, L. M.; Zarrinkar, P. P. Nat. Biotechnol. 2008,26, 127.
5. Austin, C. P.; Brady, L. S.; Collins, F. S. Science 2004, 306, 1138.6. Jensen, N. H.; Roth, B. L. Comb. Chem. High Throughput Screening 2008, 11, 420.7. Wishart, D. S.; Knox, C.; Guo, A. C.; Cheng, D.; Shrivastava, S.; Tzur, D.; Gautam,
B.; Hassanali, M. Nucleic Acids Res. 2008, 36, D901.8. Harmar, A. J.; Hills, R. A.; Rosser, E. M.; Jones, M.; Buneman, O. P.; Dunbar, D. R.;
Greenhill, S. D.; Hale, V. A.; Sharman, J. L.; Bonner, T. I.; Catterall, W. A.;Davenport, A. P.; Delagrange, P.; Dollery, C. T.; Foord, S. M.; Gutman, G. A.;Laudet, V.; Neubig, R. R.; Ohlstein, E. H.; Olsen, R. W.; Peters, J.; Pin, J. P.;Ruffolo, R. R.; Searls, D. B.; Wright, M. W.; Spedding, M. Nucleic Acids Res. 2009,37, D680.
9. Liu, T.; Lin, Y.; Wen, X.; Jorissen, R. N.; Gilson, M. K. Nucleic Acids Res. 2007, 35, D198.10. Berman, H. M.; Westbrook, J.; Feng, Z.; Gilliland, G.; Bhat, T. N.; Weissig, H.;
Shindyalov, I. N.; Bourne, P. E. Nucleic Acids Res. 2000, 28, 235.11. Jenkins, J. L.; Bender, A.; Davies, J. W. Drug Discovery Today: Technol. 2006, 3,
413.12. Ekins, S.; Mestres, J.; Testa, B. Br. J. Pharmacol. 2007, 152, 9.13. Jenwitheesuk, E.; Horst, J. A.; Rivas, K. L.; van Voorhis, W. C.; Samudrala, R.
Trends Pharmacol. Sci. 2008, 29, 62.14. Keiser, M. J.; Roth, B. L.; Armbruster, B. N.; Ernsberger, P.; Irwin, J. J.; Shoichet,
B. K. Nat. Biotechnol. 2007, 25, 197.15. Plouffe, D.; Brinker, A.; McNamara, C.; Henson, K.; Kato, N.; Kuhen, K.; Nagle,
A.; Adrián, F.; Matzen, J. T.; Anderson, P.; Nam, T. G.; Gray, N. S.; Chatterjee, A.;Janes, J.; Yan, S. F.; Trager, R.; Caldwell, J. S.; Schultz, P. G.; Zhou, Y.; Winzeler, E.A. Proc. Natl. Acad. Sci. U.S.A. 2008, 105, 9059.
16. Muller, P.; Lena, G.; Boilard, E.; Bezzine, S.; Lambeau, G.; Guichard, G.; Rognan,D. J. Med. Chem. 2006, 49, 6768.
17. Rollinger, J. M.; Schuster, D.; Danzl, B.; Schwaiger, S.; Markt, P.; Schmidtke, M.;Gertsch, J.; Raduner, S.; Wolber, G.; Langer, T.; Stuppner, H. Planta Med. 2009,75, 195.
18. Gregori-Puigjané, E.; Mestres, J. Comb. Chem. High Throughput Screening 2008,11, 669.
19. Jacobson, K. A.; Gao, Z. G. Nat. Rev. Drug Disc. 2006, 5, 247.20. Haskó, G.; Linden, J.; Cronstein, B.; Pacher, P. Nat. Rev. Drug Disc. 2008, 7, 759.21. Baraldi, P. G.; Tabrizi, M. A.; Gessi, S.; Borea, P. A. Chem. Rev. 2008, 108, 238.22. Gregori-Puigjané, E.; Mestres, J. J. Chem. Inf. Model. 2006, 46, 1615.23. Lipinski, C. A. Drug Discovery Today: Technol. 2004, 1, 337.24. Muir, T. W. ACS Chem. Biol. 2009, 4, 241.25. Roth, B. L.; Lopez, E.; Beischel, S.; Westkaemper, R. B.; Evans, J. M. Pharmacol.
Ther. 2004, 102, 99.26. Mestres, J.; Martin-Couce, L.; Gregori-Puigjané, E.; Cases, M.; Boyer, S. J. Chem.
Inf. Model. 2006, 46, 2725.27. Booth, B. L.; Dias, A. M.; Proença, M. F. J. Chem. Soc., Perkin Trans. I 1992, 2119.28. Booth, B. L.; Dias, A. M.; Proença, M. F.; Zaki, M. E. A. J. Org. Chem. 2001, 66,
8436.