Embed Size (px)
Citation preview
http://www.diva-portal.org
This is the published version of a paper presented at 21ST CONFERENCE OF FRUCTASSOCIATION.
Citation for the original published paper:
Kondoro, A. (2017)Simulation Tools for a Smart Micro-Grid: Comparison and OutlookIn: PROCEEDING OF THE 21ST CONFERENCE OF FRUCT ASSOCIATION, Helsinki,Nov. 2017, p. 7.
N.B. When citing this work, cite the original published paper.
Permanent link to this version:http://urn.kb.se/resolve?urn=urn:nbn:se:kth:diva-302970
Simulation Tools for a Smart Micro-Grid: Comparison and Outlook
Aron Kondoro1 2, Imed Ben Dhaou3 6, Diana Rwegasira 1 2, Amleset Kelati1 4, Naiman Shililiandumi2, Nerey Mvungi2,Hannu Tenhunen1 4.
1 KTH Royal Institute of Technology in Stockholm (SWEDEN)2 University of Dar es Salaam (TANZANIA)
3 College of Engineering, Qassim University (SAUDI ARABIA) 4University of Turku (FINLAND)6University of Monastir (Tunisia)
[email protected], [email protected], [email protected], [email protected], [email protected], [email protected],[email protected]
Abstract—Smart micro-grids are low voltage autonomous power systems that integrate information and communication technologies with electrical energy systems. In order to realize this, it is important to find the optimal configuration of components that will result in the most efficient and sustainable DC micro-grid. To facilitate this analysis, a number of modeling and simulation tools for power systems have been proposed. However, in practice, these tools differ widely in the features they provide and the implementation approach. In this paper, we compare the strength and weakness of four popular simulation tools for power systems: Anylogic, Repast, GridLAB-D and RAPSim. We propose a simplified model of a Photovoltaic (PV)panel for smart micro-grid which is implemented in all tools. We determine the strength and weaknesses of each tool based on ease of implementation, accuracy of the final model, and the ability to view results. We also recommend further improvements for existing tools.
I. INTRODUCTION
Recently, in an effort to optimize the electric power generation process, electric power systems have been evolving into more intelligent and autonomous smart-grid and smart micro-grid systems. Using Information and Communication Technologies (ICT), these systems have been able to introduce computational and communication components in all aspects of power generation, distribution and consumption. These ICT components interact with conventional electric components leading to the increase in complexity of electric power systems. In addition, the complexity of the smart-grid has been exacerbated by the penetration of distributed renewable energy and the implementation of advanced features such as load-shedding and dynamic pricing.
In order to a study, analyze and optimize smart micro-grids there is a need of effective simulation tools. These tools should allow the operator, for instance, to quickly assess the impact of a new communication technology on the performance of the grid, determine the effect of weather on control algorithms, or perform fault analyses.
Recently, a number of simulation tools for smart micro-grids have been proposed. Most of these tools focus on the control aspects of power systems. However, there are general purpose simulation tools that can be used form smart micro-
grids. These tools are based on different simulation approaches and methodologies. There is a need to assess the strengths and weaknesses of these tools with respect to the implementation process, accuracy of the model, and output for the final result. This will help to determine the best tool for the job which in turn will lead to more accurate study and analysis of these complex systems.
In this paper, we study popular smart micro-grid and general purpose simulators by using them to implement a simplified model of a Photovoltaic (PV) panel for a smart micro-grid. We go through the step by step process of implementing the model in each tool. Through this practical approach, we determine the ease of the implementation process. We also run and observe the output of the simulation process in order to determine the accuracy of the result.
The rest of the paper is structured as follows: Section II describes related work. Modelling tools will be described in Section III. The implementation process and result from each tool will be elaborated in Section IV. Section V will discuss the implementation results. Finally, Section VI will conclude thepaper.
II. RELATED WORK
Comparison between various smart-grid simulations tools have been reported in several published report. In [1], the authors developed a model that incorporates financial transactions and information flow. The models along with quantitative analyses have been used to compare ten simulators. However, since in 2013 GridLAB-D was immature, consequently, their results are outdated as the latest version of Jojoba has support for market model.
The comparison of three open source smart grid simulators(Aprem, OpenDSS, and GridLAB-D) has been the focus of [2]. The authors used two models to compare the speed of three simulators. The first model is to study the distribution loss with distributed generation. The model consists of loads, distribution lines and wind turbines. The second model is to study voltage control techniques to save power and reduce losses. The model is composed of 30 buses and 21 loads. The
______________________________________________________PROCEEDING OF THE 21ST CONFERENCE OF FRUCT ASSOCIATION
ISSN 2305-7254
authors found that GridLAB-D is faster than Aprem but slower than OpenDSS.
The work of [3] focused on comparing RAPSim and GridLAB-D. The author used two scenarios to compare the performance of the two simulators: renewable energy generator and street power distribution. The author concluded that RAPSim is better suited for education purpose while GridLAB-D is the tool of choice for research and development work. One shortcomings of the RAPSim is the lack of battery models that is considered as vital for testing and developing battery control algorithm for distributed renewable energy andplug-in electric vehicle (PEV). Table I summarizes the contributions reported in [1-3] and this work.
TABLE I. RESEARCH CONTRIBUTIONS
Work Simulation tools scenario Metric
[1] UWPFLOW, TEFTS, MatPower, PSAT, IPSYS, MatDyn, AMES, InterPSS, OpenDSS, and GridLAB-D
Power flow analyses using IEEE 14-bus test.
Accuracy of the results
[2] Aprem, OpenDSS, GridLAB-D
Distribution line loss andconservation voltage reduction
Run time
[3] RAPSim and GridLAB-D
Power flow and renewable energy integration
Efficiency and run-time
Our work Repast, Anylogic, RAPSim, and GridLAB-D
DC micro-gridwith solar panels and weather data.
Flexibility and adaptability
III. MODELLING TOOLS
A. AnyLogicAnylogic is a multi paradigm simulation tool that supports
the three main types of simulations: discrete event, agent based and system dynamics. This flexibility allows AnyLogic to be applicable in many use cases related to smart power simulations. It can be used to model and simulate power systems at different levels of abstraction. This allows for the analysis of smart power systems from the lowest level details of current and voltages up to the highest level of system perspectives.
As such, Anylogic with its free for personal use version, has been used extensively in Academia as a simulation platform to study different aspects of smart power systems. It has been used to simulate power flow analysis for renewable based micro grids in order to find the best way to maintain voltage stability [4]. It has also been used in a larger scale to model large-scale electricity generation systems in order to study the economic dynamics of power generation and consumption for countries [5]. Furthermore, Anylogic has also been used to simulate specific aspects in smart power systems such as the case of the performance analysis of power substations [6].
In addition to the ability to support multiple simulation methodologies, another part that has made AnyLogic a popular
simulation tools for power systems, is its extensive features and easy to use interface. It has a drag and drop graphical user interface which is used setup a model and control the simulation. This is the main way to interact with the tool.
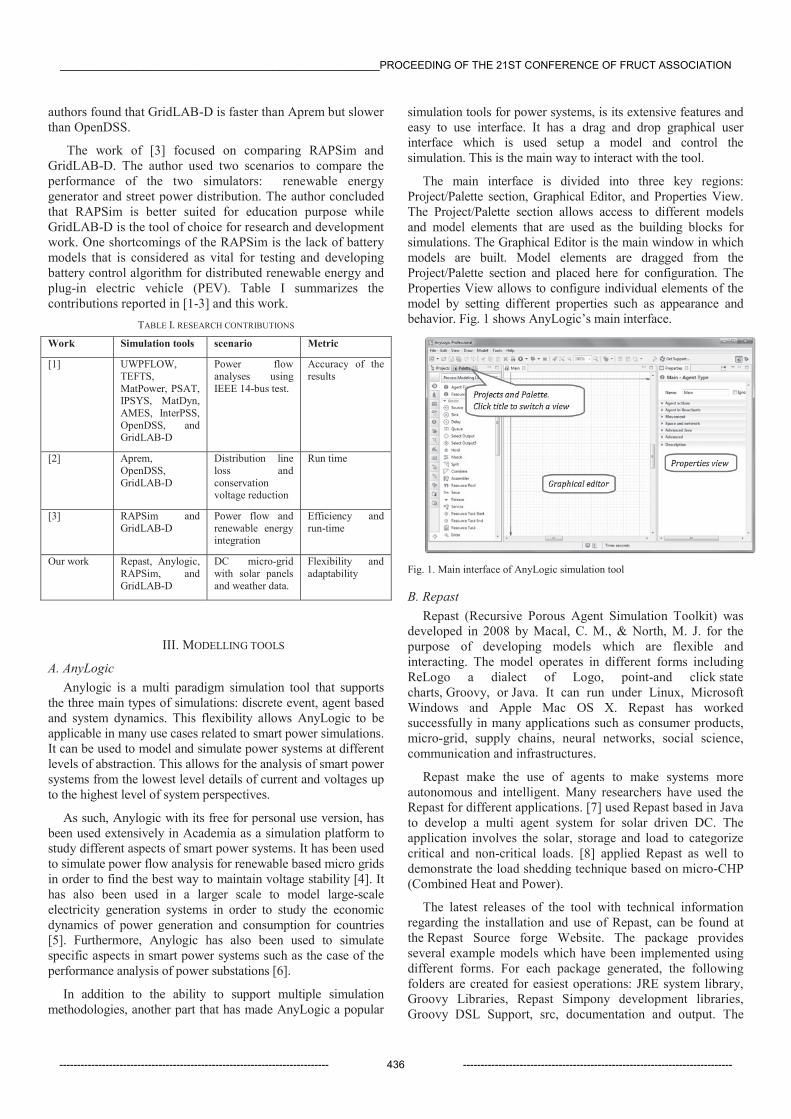
The main interface is divided into three key regions: Project/Palette section, Graphical Editor, and Properties View. The Project/Palette section allows access to different models and model elements that are used as the building blocks for simulations. The Graphical Editor is the main window in which models are built. Model elements are dragged from the Project/Palette section and placed here for configuration. The Properties View allows to configure individual elements of the model by setting different properties such as appearance and behavior. Fig. 1 shows AnyLogic’s main interface.
Fig. 1. Main interface of AnyLogic simulation tool
B. RepastRepast (Recursive Porous Agent Simulation Toolkit) was
developed in 2008 by Macal, C. M., & North, M. J. for the purpose of developing models which are flexible and interacting. The model operates in different forms including ReLogo a dialect of Logo, point-and click state charts, Groovy, or Java. It can run under Linux, Microsoft Windows and Apple Mac OS X. Repast has worked successfully in many applications such as consumer products, micro-grid, supply chains, neural networks, social science, communication and infrastructures.
Repast make the use of agents to make systems more autonomous and intelligent. Many researchers have used the Repast for different applications. [7] used Repast based in Java to develop a multi agent system for solar driven DC. The application involves the solar, storage and load to categorize critical and non-critical loads. [8] applied Repast as well to demonstrate the load shedding technique based on micro-CHP (Combined Heat and Power).
The latest releases of the tool with technical informationregarding the installation and use of Repast, can be found at the Repast Source forge Website. The package provides several example models which have been implemented using different forms. For each package generated, the following folders are created for easiest operations: JRE system library, Groovy Libraries, Repast Simpony development libraries, Groovy DSL Support, src, documentation and output. The
______________________________________________________PROCEEDING OF THE 21ST CONFERENCE OF FRUCT ASSOCIATION
---------------------------------------------------------------------------- 436 ----------------------------------------------------------------------------
output can also be visualized either in 2D or 3D visualizations. Repast provides the possibility to link Matlab code onto it using the JMatLink package. Fig. 2 shows the perspective dialog with all forms of implementations in the tool.
Fig. 2. Perspective dialog in Repast
C. RAPSimRAPSim is a micro-grid simulation tool designed in the
Alpen-Adria-Universität at Klagenfurt by student project to determine or calculate and simulate the power load flow of the micro gird with renewable energy sources.
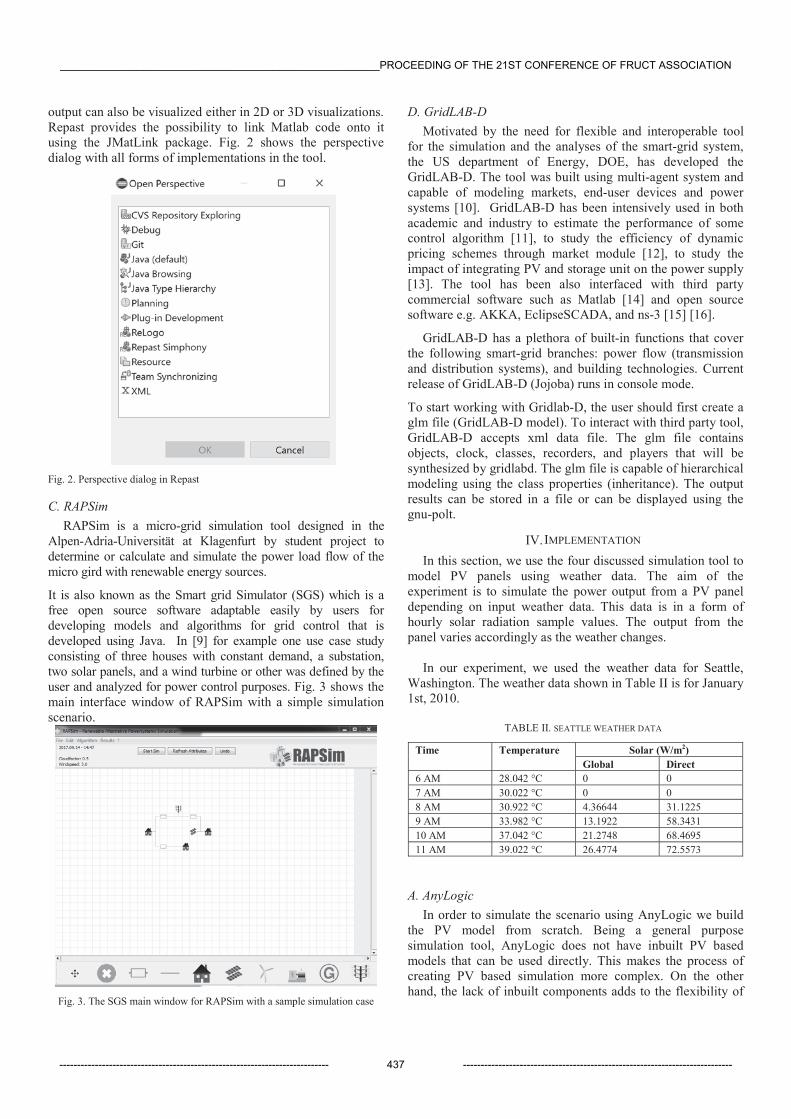
It is also known as the Smart grid Simulator (SGS) which is a free open source software adaptable easily by users for developing models and algorithms for grid control that is developed using Java. In [9] for example one use case study consisting of three houses with constant demand, a substation, two solar panels, and a wind turbine or other was defined by the user and analyzed for power control purposes. Fig. 3 shows the main interface window of RAPSim with a simple simulation scenario.
Fig. 3. The SGS main window for RAPSim with a sample simulation case
D. GridLAB-DMotivated by the need for flexible and interoperable tool
for the simulation and the analyses of the smart-grid system, the US department of Energy, DOE, has developed the GridLAB-D. The tool was built using multi-agent system and capable of modeling markets, end-user devices and power systems [10]. GridLAB-D has been intensively used in both academic and industry to estimate the performance of some control algorithm [11], to study the efficiency of dynamic pricing schemes through market module [12], to study the impact of integrating PV and storage unit on the power supply [13]. The tool has been also interfaced with third party commercial software such as Matlab [14] and open source software e.g. AKKA, EclipseSCADA, and ns-3 [15] [16].
GridLAB-D has a plethora of built-in functions that cover the following smart-grid branches: power flow (transmission and distribution systems), and building technologies. Current release of GridLAB-D (Jojoba) runs in console mode.
To start working with Gridlab-D, the user should first create a glm file (GridLAB-D model). To interact with third party tool, GridLAB-D accepts xml data file. The glm file contains objects, clock, classes, recorders, and players that will be synthesized by gridlabd. The glm file is capable of hierarchical modeling using the class properties (inheritance). The output results can be stored in a file or can be displayed using the gnu-polt.
IV. IMPLEMENTATION
In this section, we use the four discussed simulation tool to model PV panels using weather data. The aim of the experiment is to simulate the power output from a PV panel depending on input weather data. This data is in a form of hourly solar radiation sample values. The output from the panel varies accordingly as the weather changes.
In our experiment, we used the weather data for Seattle, Washington. The weather data shown in Table II is for January 1st, 2010.
TABLE II. SEATTLE WEATHER DATA
Time Temperature Solar (W/m2)Global Direct
6 AM 28.042 °C 0 07 AM 30.022 °C 0 08 AM 30.922 °C 4.36644 31.12259 AM 33.982 °C 13.1922 58.343110 AM 37.042 °C 21.2748 68.469511 AM 39.022 °C 26.4774 72.5573
A. AnyLogicIn order to simulate the scenario using AnyLogic we build
the PV model from scratch. Being a general purpose simulation tool, AnyLogic does not have inbuilt PV based models that can be used directly. This makes the process of creating PV based simulation more complex. On the other hand, the lack of inbuilt components adds to the flexibility of
______________________________________________________PROCEEDING OF THE 21ST CONFERENCE OF FRUCT ASSOCIATION
---------------------------------------------------------------------------- 437 ----------------------------------------------------------------------------
tool. A model can be created at any level of detail depending on the needs of the situation.
We build a simple PV model in AnyLogic based on (1).
(1)
where P is the output power (Watts), A is the area of the panel (m2), R is the hourly radiation (W/m2) and E is efficiency of the panel, typically with a value between 0.1 and 0.14.
The PV panel is represented by an agent which is the main object contained in the simulation. The agent has three inputs that are represented as parameters of the agent. Area and Efficiency are represented as static parameters with default values of 10m2 and 0.1 respectively. Radiation values are input as a table function with the values from table I. The table function allows input of multiple values in tabular form.
Output from the simulation is depicted in graphical form as shown in Fig 6. It shows the variation of DC power output from a simulated PV during a typical day depending on the input weather data. During the simulation process, a user can control the speed and input parameters.
Fig. 6. AnyLogic PV power output during a day in graphical form
B. RepastRepast has several models which have been included as a package during installation for tutorials. Some of the examples are Predator model, Solar Systems model and FlowZombies model, Mousetrap. All these models have been formulated either by Java, Relogo or Repast. With respect this, there is no inbuilt model for simulating the PV panel power generation in this tool, rather a designer has to design from the scratch or use the code implemented either from Matlab and link it.
The solar radiation can be simulated using (2) to (5) in repast which run in java.
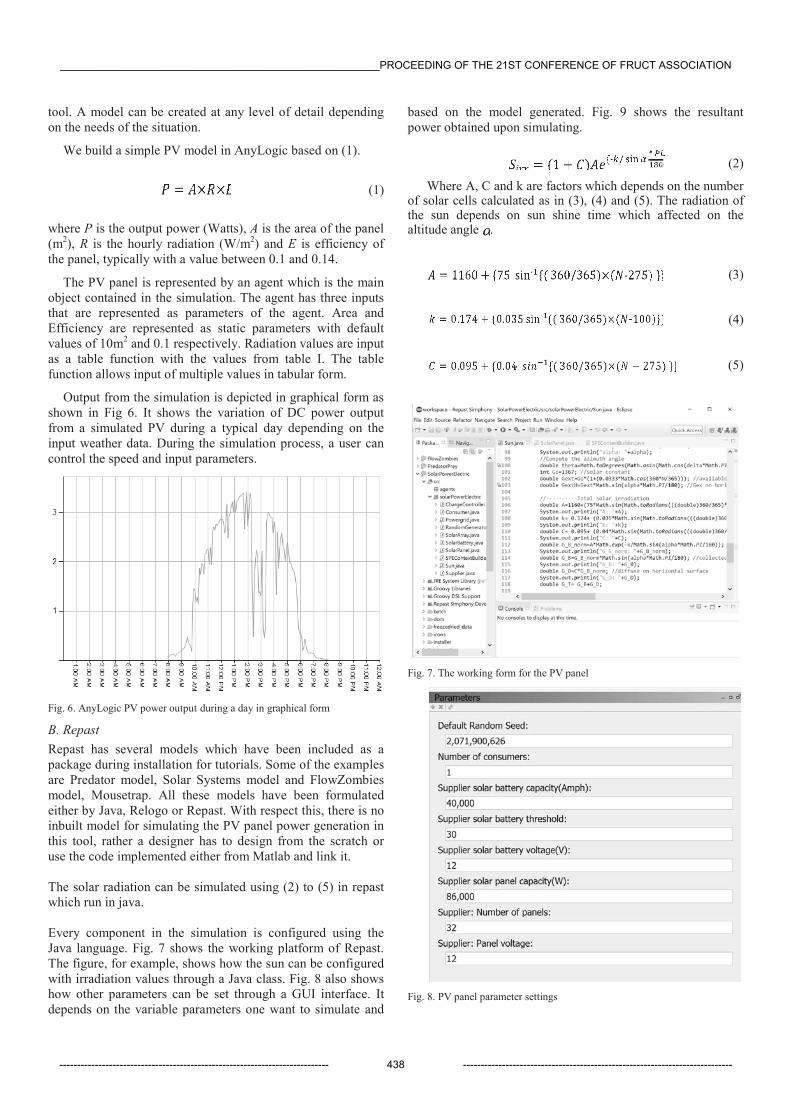
Every component in the simulation is configured using the Java language. Fig. 7 shows the working platform of Repast. The figure, for example, shows how the sun can be configured with irradiation values through a Java class. Fig. 8 also shows how other parameters can be set through a GUI interface. It depends on the variable parameters one want to simulate and
based on the model generated. Fig. 9 shows the resultant power obtained upon simulating.
(2)
Where A, C and k are factors which depends on the number of solar cells calculated as in (3), (4) and (5). The radiation of the sun depends on sun shine time which affected on the altitude angle .
(3)
(4)
(5)
Fig. 7. The working form for the PV panel
Fig. 8. PV panel parameter settings
______________________________________________________PROCEEDING OF THE 21ST CONFERENCE OF FRUCT ASSOCIATION
---------------------------------------------------------------------------- 438 ----------------------------------------------------------------------------
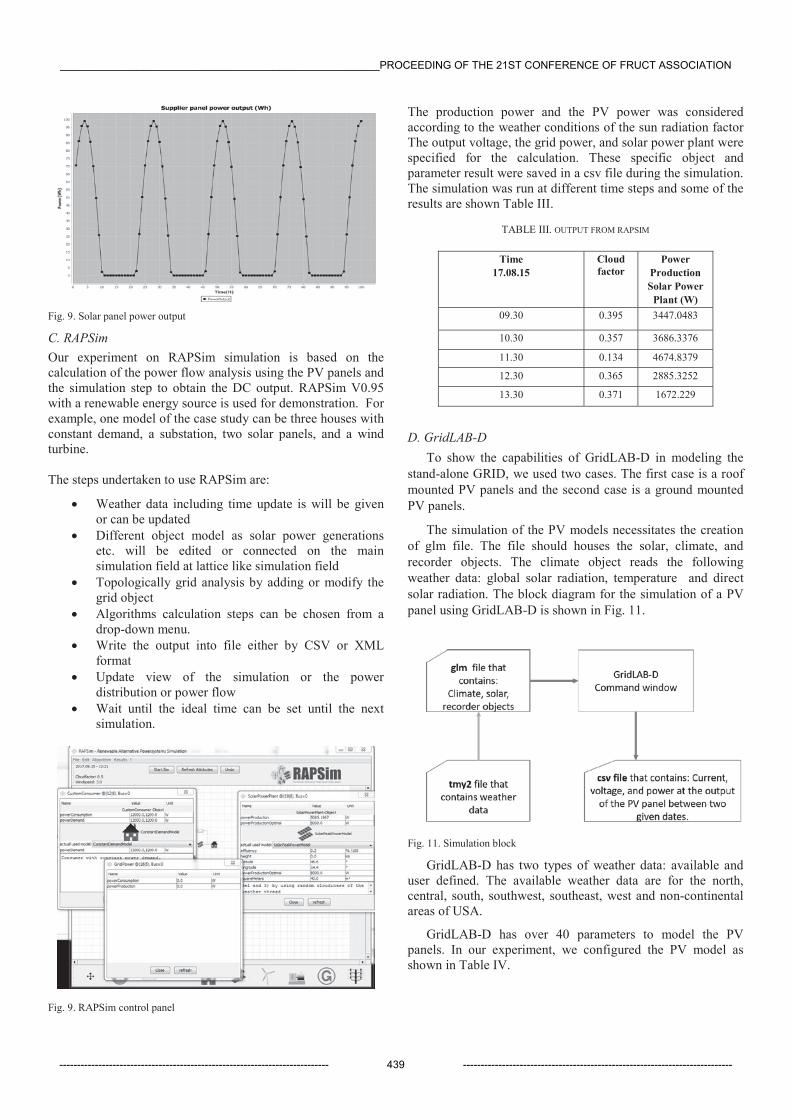
Fig. 9. Solar panel power output
C. RAPSimOur experiment on RAPSim simulation is based on the calculation of the power flow analysis using the PV panels and the simulation step to obtain the DC output. RAPSim V0.95 with a renewable energy source is used for demonstration. For example, one model of the case study can be three houses with constant demand, a substation, two solar panels, and a wind turbine.
The steps undertaken to use RAPSim are:
Weather data including time update is will be given or can be updatedDifferent object model as solar power generations etc. will be edited or connected on the main simulation field at lattice like simulation field Topologically grid analysis by adding or modify the grid objectAlgorithms calculation steps can be chosen from adrop-down menu.Write the output into file either by CSV or XML format Update view of the simulation or the power distribution or power flowWait until the ideal time can be set until the next simulation.
Fig. 9. RAPSim control panel
The production power and the PV power was considered according to the weather conditions of the sun radiation factor The output voltage, the grid power, and solar power plant were specified for the calculation. These specific object and parameter result were saved in a csv file during the simulation. The simulation was run at different time steps and some of the results are shown Table III.
TABLE III. OUTPUT FROM RAPSIM
Time 17.08.15
Cloud factor
PowerProductionSolar Power
Plant (W)09.30 0.395 3447.0483
10.30 0.357 3686.3376
11.30 0.134 4674.8379
12.30 0.365 2885.3252
13.30 0.371 1672.229
D. GridLAB-DTo show the capabilities of GridLAB-D in modeling the
stand-alone GRID, we used two cases. The first case is a roof mounted PV panels and the second case is a ground mounted PV panels.
The simulation of the PV models necessitates the creation of glm file. The file should houses the solar, climate, and recorder objects. The climate object reads the following weather data: global solar radiation, temperature and direct solar radiation. The block diagram for the simulation of a PV panel using GridLAB-D is shown in Fig. 11.
Fig. 11. Simulation block
GridLAB-D has two types of weather data: available and user defined. The available weather data are for the north, central, south, southwest, southeast, west and non-continental areas of USA.
GridLAB-D has over 40 parameters to model the PV panels. In our experiment, we configured the PV model as shown in Table IV.
______________________________________________________PROCEEDING OF THE 21ST CONFERENCE OF FRUCT ASSOCIATION
---------------------------------------------------------------------------- 439 ----------------------------------------------------------------------------
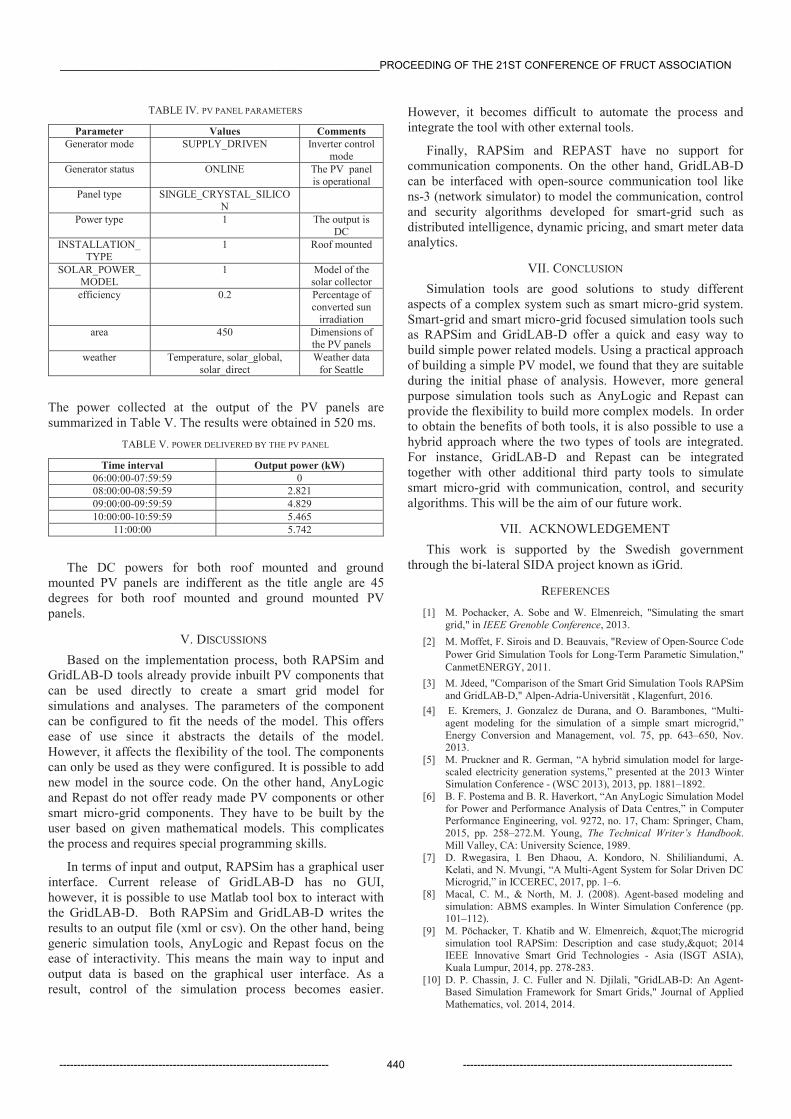
TABLE IV. PV PANEL PARAMETERS
Parameter Values CommentsGenerator mode SUPPLY_DRIVEN Inverter control
modeGenerator status ONLINE The PV panel
is operationalPanel type SINGLE_CRYSTAL_SILICO
NPower type 1 The output is
DCINSTALLATION_
TYPE1 Roof mounted
SOLAR_POWER_MODEL
1 Model of the solar collector
efficiency 0.2 Percentage of converted sun
irradiationarea 450 Dimensions of
the PV panelsweather Temperature, solar_global,
solar_directWeather data
for Seattle
The power collected at the output of the PV panels are summarized in Table V. The results were obtained in 520 ms.
TABLE V. POWER DELIVERED BY THE PV PANEL
Time interval Output power (kW)06:00:00-07:59:59 008:00:00-08:59:59 2.82109:00:00-09:59:59 4.82910:00:00-10:59:59 5.465
11:00:00 5.742
The DC powers for both roof mounted and ground mounted PV panels are indifferent as the title angle are 45 degrees for both roof mounted and ground mounted PV panels.
V. DISCUSSIONS
Based on the implementation process, both RAPSim and GridLAB-D tools already provide inbuilt PV components that can be used directly to create a smart grid model for simulations and analyses. The parameters of the component can be configured to fit the needs of the model. This offers ease of use since it abstracts the details of the model. However, it affects the flexibility of the tool. The components can only be used as they were configured. It is possible to add new model in the source code. On the other hand, AnyLogic and Repast do not offer ready made PV components or other smart micro-grid components. They have to be built by the user based on given mathematical models. This complicates the process and requires special programming skills.
In terms of input and output, RAPSim has a graphical user interface. Current release of GridLAB-D has no GUI, however, it is possible to use Matlab tool box to interact with the GridLAB-D. Both RAPSim and GridLAB-D writes the results to an output file (xml or csv). On the other hand, being generic simulation tools, AnyLogic and Repast focus on the ease of interactivity. This means the main way to input and output data is based on the graphical user interface. As a result, control of the simulation process becomes easier.
However, it becomes difficult to automate the process and integrate the tool with other external tools.
Finally, RAPSim and REPAST have no support for communication components. On the other hand, GridLAB-Dcan be interfaced with open-source communication tool like ns-3 (network simulator) to model the communication, control and security algorithms developed for smart-grid such as distributed intelligence, dynamic pricing, and smart meter data analytics.
VII. CONCLUSION
Simulation tools are good solutions to study different aspects of a complex system such as smart micro-grid system. Smart-grid and smart micro-grid focused simulation tools such as RAPSim and GridLAB-D offer a quick and easy way to build simple power related models. Using a practical approachof building a simple PV model, we found that they are suitable during the initial phase of analysis. However, more general purpose simulation tools such as AnyLogic and Repast can provide the flexibility to build more complex models. In order to obtain the benefits of both tools, it is also possible to use a hybrid approach where the two types of tools are integrated. For instance, GridLAB-D and Repast can be integrated together with other additional third party tools to simulate smart micro-grid with communication, control, and securityalgorithms. This will be the aim of our future work.
VII. ACKNOWLEDGEMENTThis work is supported by the Swedish government
through the bi-lateral SIDA project known as iGrid.
REFERENCES
[1] M. Pochacker, A. Sobe and W. Elmenreich, "Simulating the smart grid," in IEEE Grenoble Conference, 2013.
[2] M. Moffet, F. Sirois and D. Beauvais, "Review of Open-Source Code Power Grid Simulation Tools for Long-Term Parametic Simulation," CanmetENERGY, 2011.
[3] M. Jdeed, "Comparison of the Smart Grid Simulation Tools RAPSim and GridLAB-D," Alpen-Adria-Universität , Klagenfurt, 2016.
[4] E. Kremers, J. Gonzalez de Durana, and O. Barambones, “Multi-agent modeling for the simulation of a simple smart microgrid,” Energy Conversion and Management, vol. 75, pp. 643–650, Nov. 2013.
[5] M. Pruckner and R. German, “A hybrid simulation model for large-scaled electricity generation systems,” presented at the 2013 Winter Simulation Conference - (WSC 2013), 2013, pp. 1881–1892.
[6] B. F. Postema and B. R. Haverkort, “An AnyLogic Simulation Model for Power and Performance Analysis of Data Centres,” in Computer Performance Engineering, vol. 9272, no. 17, Cham: Springer, Cham, 2015, pp. 258–272.M. Young, The Technical Writer’s Handbook.Mill Valley, CA: University Science, 1989.
[7] D. Rwegasira, I. Ben Dhaou, A. Kondoro, N. Shililiandumi, A. Kelati, and N. Mvungi, “A Multi-Agent System for Solar Driven DC Microgrid,” in ICCEREC, 2017, pp. 1–6.
[8] Macal, C. M., & North, M. J. (2008). Agent-based modeling and simulation: ABMS examples. In Winter Simulation Conference (pp. 101–112).
[9] M. Pöchacker, T. Khatib and W. Elmenreich, "The microgrid simulation tool RAPSim: Description and case study," 2014 IEEE Innovative Smart Grid Technologies - Asia (ISGT ASIA), Kuala Lumpur, 2014, pp. 278-283.
[10] D. P. Chassin, J. C. Fuller and N. Djilali, "GridLAB-D: An Agent-Based Simulation Framework for Smart Grids," Journal of Applied Mathematics, vol. 2014, 2014.
______________________________________________________PROCEEDING OF THE 21ST CONFERENCE OF FRUCT ASSOCIATION
---------------------------------------------------------------------------- 440 ----------------------------------------------------------------------------

[11] W. Zhang, J. Lian, C.-Y. Chang and K. Kalsi, "Aggregated Modeling and Control of Air Conditioning Loads for Demand Response," IEEE Transactions on Power Systems, vol. 28, no. 4, pp. 4655-4664, 2014.
[12] K. A. A. G. Lucas Gelazanskas, "Neural Network Based Real-Time Pricing in Demand Side Management for future smart grid," in 7th IET International Conference on Power Electronics, Machines and Drives (PEMD 2014), 2014.
[13] "Integrating PV systems into distribution networks with battery energy storage systems," in Australasian Universities Power Engineering Conference (AUPEC), 2014.
[14] M. A. L. H. T. Antonia Nasiakou, "MatGridGUI- a Toolbox for GridLAB-D Simulation," in 7th International Conference on
Information, Intelligence, Systems & Applications (IISA), 2016. [15] D. Bytschkow, M. Zellner and M. Duchon, "Combining SCADA,
CIM, GridLab-D and Akka for Smart Grid Co-Simulation," in IEEE Power & Energy Society Innovative Smart Grid Technologies Conference (ISGT), 2015.
[16] S. C. J. A. D. A. F. M. H. Jason C. Fuller, "Communication Simulations for Power System," in Workshop on Modeling and Simulation of Cyber-Physical Energy Systems (MSCPES), 2013.
[17] T. Khatib A. Mohamed and K. Sopian "A review of solar energy modeling techniques " Renewable and Sustainable Energy Reviews vol. 16 no. 5 pp. 2864-2869 2012
______________________________________________________PROCEEDING OF THE 21ST CONFERENCE OF FRUCT ASSOCIATION
---------------------------------------------------------------------------- 441 ----------------------------------------------------------------------------