Embed Size (px)
Citation preview
Loughborough UniversityInstitutional Repository
In situ colorimetric andcomposite coloration
efficiency measurements forelectrochromic Prussian blue
This item was submitted to Loughborough University's Institutional Repositoryby the/an author.
Citation: MORTIMER, R.J. and REYNOLDS, J.R., 2005. In situ colorimetricand composite coloration efficiency measurements for electrochromic Prussianblue. Journal of Materials Chemistry, 15, pp. 2226-2233.
Additional Information:
• This article has been published in the journal, Journal of Ma-terials Science [ c© RSC]. The definitive version is available at:http://www.rsc.org/Publishing/Journals/jm/index.asp.
Metadata Record: https://dspace.lboro.ac.uk/2134/1045
Publisher: c© Royal Society of Chemistry
Please cite the published version.

This item was submitted to Loughborough’s Institutional Repository by the author and is made available under the following Creative Commons Licence
conditions.
For the full text of this licence, please go to: http://creativecommons.org/licenses/by-nc-nd/2.5/
Author for proofs and correspondence: Dr R J Mortimer, Department of Chemistry, Loughborough University, Loughborough, Leicestershire, LE11 3JU, UK. In situ colorimetric and composite coloration efficiency
measurements for electrochromic Prussian blue
Roger J. Mortimer*† and John R. Reynolds
The George and Josephine Butler Polymer Research Laboratory, Department of
Chemistry, Center for Macromolecular Sciences and Engineering, University of Florida,
Gainesville, Florida 32611, USA
An in situ colorimetric method, based on the CIE (Commission Internationale de
l'Eclairge) system of colorimetry, has been successfully applied to the study of
electrochromism in electrochemically deposited films of Prussian blue (iron(III)
hexacyanoferrate(II), PB) on transmissive ITO/glass substrates for the first time. On
electrochemical reduction of PB to Prussian white (iron(II) hexacyanoferrate(II), PW),
sharp and reversible changes in the hue and saturation occur, as shown by the track of the
CIE 1931 xy chromaticity coordinates. For PB, the CIELAB 1976 colour space
coordinates were L* = 73, a* = -26 and b* = -33, with a dominant wavelength calculated
as 488 nm. Concurrently, as the intensely absorbing PB mixed-valence chromophore is
‘bleached’ to the transparent PW, a large increase in the relative luminance of the
electrochromic film is observed. On oxidation of PB, the CIELAB 1976 colour space
† Permanent address: Dr R J Mortimer, Department of Chemistry, Loughborough University, Loughborough, Leicestershire, LE11 3JU, UK. E-mail: [email protected]
2
coordinates show the transition through intermediate green to the Prussian yellow
(iron(III) hexacyanoferrate(III), PY) state (L* = 94, a* = 2 and b* = 18), with a steady
increase in relative luminance. To reliably compare the power requirement of PB films
with other electrochromic systems, composite coloration efficiencies (CCE’s) have been
calculated, using a tandem chronoabsorptometry/chronocoulometry method, as
previously developed for organic polymer systems. Using 95% of the total transmittance
change at λmax as reference point, coloration efficiencies, η = ΔA(λmax)/Q, were calculated
as 143 and 150 cm2 C-1 respectively for the PB/PW and PW/PB electrochromic
transitions.
________________________________________________________________________
Introduction
Throughout its 300 year history,1 the mixed-valence complex Prussian blue (iron(III)
hexacyanoferrate(II), PB), has been extensively used as a pigment in the formulation of
paints, lacquers, and printing inks.2,3 PB and numerous other metal
hexacyanometallates,4,5 can be deposited onto inert electrode substrates to give redox-
active films6 that have electrochromic,5,7 electrocatalytic5,8,9 and electroanalytical
applications.10,11,12
PB films exhibit four-colour polyelectrochromicity.13,14 Electrochemical reduction of
PB produces Prussian white (iron(II) hexacyanoferrate(II), PW), which appears
transparent as a thin film. Oxidation of PB yields Prussian yellow (iron(III)
hexacyanoferrate(III), PY), via the intermediate Prussian green (PG). Early PB-based
electrochromic devices (ECD’s) employed PB as the sole electrochromic material.
Examples include a seven-segment display using PB-modified optically transparent
3
electrodes,15 a solid-state system16,17 where a PB-containing Nafion® composite film was
sandwiched between the two indium-doped tin oxide (ITO)/glass substrates, and an ECD
that utilised a single film of PB, without addition of a conventional electrolyte.18 The
blue-transparent (anodically-colouring) transition in PB at one electrode has also been
combined with cathodically-colouring electrochromic materials at the second electrode,
in ‘complementary’ ECD’s, where both films are coloured simultaneously. Examples
include PB/tungsten oxide,19,20,21,22,23 PB/polyaniline,24,25,26,27,28,29,30 and PB/ytterbium
bis(phthalocyanine) (pp–Yb(Pc)2)31 devices. More recently,32 an ECD based on the
assembly of PB/ITO/glass and poly(3,4-ethylenedioxythiophene) (PEDOT)/ITO/glass
substrates with a poly(methyl methacrylate) (PMMA)-based gel polymer electrolyte, has
been described.
In this paper, we describe the application of new methods33,34 to the quantitative
measurement of colour in electrochromic PB films. In electrochromism, such
measurements have previously been applied only to conducting polymer systems and will
be of value for the optimisation of PB-based ECD performance parameters. Colour is a
very subjective phenomenon, causing the description of colour difference or the
comparison of two colours to be quite difficult. However, much effort has been given to
the development of colorimetric analysis, which allows a quantitative description of
colour and relative transmissivity as sensed by the human eye. Colorimetry provides a
more precise way to define colour than spectrophotometry.35 Rather than measure
absorption bands, in colorimetry the human eye’s sensitivity to light across the visible
region is measured and a numerical description of colour is given. Since the recent
report33 of a simple in situ colorimetric analysis method for the precise control and
4
measurement of colour in electrochromic systems, this approach is currently in vogue for
the characterisation of electrochromic conductive polymer films and devices.36,37,38,39,40,41
Here we report the application of in situ colorimetric analysis to the precise mapping of
colour in electrochromic PB films in transmission mode. Earlier colorimetric analysis for
inorganic electrochromic systems has been restricted to measurements on tungsten oxide
films, using complicated electronic instrumentation.42,43,44 We anticipate that the simple
approach employed here, with use of a commercial Chroma Meter, will be of interest for
the colorimetric characterisation of a wide range of inorganic electrochromic systems.
In addition to colorimetric analysis, coloration efficiency (CE) measurements are a
useful tool in the study of electrochromism.45 CE, η (cm2 C-1), is defined as the ratio of
the change in absorbance, ΔA, at a specified wavelength, to the injected/ejected charge
per unit electrode area. The ideal electrochromic material or device would exhibit a large
absorbance change with a small amount of charge, giving rise to a high CE. As has been
recently pointed out,34 although the analysis of CE is important, the methods utilised to
measure it have varied between research groups and this can lead to difficulties in
comparisons between different electrochromic materials. A general method for
measuring electrochromic conductive polymer composite coloration efficiencies (CCE’s)
effectively and consistently has been proposed.34 We now show the application of this
tandem chronocoulometry/chronoabsorptometry method to electrochromic PB films.
5
Experimental
Materials
Anhydrous iron(III) chloride (FeCl3), potassium hexacyanoferrate(III) (K3Fe(CN)6), and
potassium chloride (KCl) were certified ACS grade from Fisher and used without further
purification. Electrode substrates were tin-doped indium oxide (ITO) on glass (7 x 50 x
0.7 mm, unpolished float glass, SiO2 passivated, 8-12 Ω/ , part no. CG-50IN-CUV) from
Delta Technologies Ltd..
Electrochemical measurements
Electrochemical measurements were carried out in de-oxygenated solutions using an
EG&G Model PAR273A potentiostat/galvanostat, under the control of Scribner and
Associates Corrware II software. No iR compensation was employed.
Prussian blue deposition
ITO/glass substrates were pre-treated, in order to remove any trace of adhesive/impurities
on the surface, by sonication (3 minutes) in a 1 M hydrochloric acid solution followed by
rinsing with deionised water. Immediately prior to electrochemical deposition of PB, the
ITO/glass substrates were rinsed in acetone and air dried. For the electrochemical
deposition of PB, a standard 1 cm quartz cuvette was used as electrochemical cell. A
machined polytetrafluoroethylene lid allowed the ITO/glass working electrode to be
mounted transverse to the optical face of the cuvette. Additional holes in the lid allowed
a coiled platinum wire counter electrode and silver/silver chloride wire reference
6
electrode to be positioned in the electrolyte solution. With aqueous 0.2 M KCl as
supporting electrolyte in all solutions, this reference electrode maintained a stable
potential of +0.067 V vs. a commercial BAS silver/silver chloride/saturated potassium
chloride (+0.197 V vs. SHE) reference electrode. For all measurements, the lower 40 mm
of each ITO/glass working electrode was immersed in solution, providing a submerged
geometric electrode area of 2.80 cm2. PB films, corresponding to an electrodeposition
charge density of 6.3 mC cm-2 and a film thickness of 320 nm,46 were potentiostatically
deposited at +0.50 V (vs. Ag/AgCl wire) for 300 s in an aqueous solution of 5 mM
FeCl3, 5 mM K3Fe(CN)6 and 0.2 M KCl. PB film charge densities were coulometrically
determined from the integrated current for electrochemical reduction to Prussian white,
on potential stepping from +0.50 to -0.20 V vs. Ag/AgCl wire, in 0.2 M KCl solution.
As-deposited Fe3+-counterion containing ‘insoluble’ PB films were converted to the
[(K+)1/3(Fe2+)1/3FeIIIFeII(CN)6] form,47,48 by 10 reductive potential cycles, 50 mV s-1,
+0.50 V to -0.20 V, in 0.2 M KCl.
Spectroscopic measurements
Visible/NIR region absorption spectra (350 – 1400 nm) and chronoabsorptometry data (at
the PB λmax (686 nm)) were recorded in situ in transmission using a Varian Cary 500
Scan UV-vis-NIR spectrophotometer. An identical quartz cuvette, with a mounted clean
ITO/glass substrate in 0.2 M KCl was employed in the reference beam.
7
Colorimetry
Colorimetry measurements were obtained, under potentiostatic control at a series of
potentials, by use of a Minolta CS-100 Chroma Meter and CIE recommended
normal/normal (0/0) illuminating/viewing geometry for transmittance measurements.49
The calibration was set to the preset mode. Samples were illuminated by a D50 (5000 K)
constant temperature daylight simulating light source in a light booth specially designed
to exclude external light. To ensure equilibrium readings, colour coordinates (Y, x, and y
values) were recorded after each potential had been applied for 50 seconds and the
current had decayed to background levels. Additional readings were taken at 60 seconds,
to ensure the colour coordinates had stabilised. A background measurement was taken
under identical conditions, using a blank ITO/glass substrate in a 0.2 M KCl electrolyte
solution held in a standard quartz cuvette. For all measurements, the ITO/glass substrate
was on the side of the cuvette closest to the Chroma Meter, with the conductive side
facing the light source. The Yxy values of the standard illuminant were measured and
converted to Xn, Yn, Zn tristimulus values.35 These tristimulus values were used with the
calculated tristimulus values (X, Y, Z) of the sample for conversion to CIELAB L*a*b*
coordinates. x and y coordinates were calculated from the XYZ tristimulus values using
the formulae, x = X/(X + Y + Z) and y = Y/(X + Y + Z).
Results and discussion
There are three attributes that are used to describe colour. The first identifies a colour by
its location in the spectral sequence, i.e., what wavelength is associated with this colour.
This is known as the hue, dominant wavelength, or chromatic colour, and is the
8
wavelength where maximum contrast occurs. It is this aspect which is commonly, but
mistakenly, referred to as colour. The second attribute, relating to the level of white
and/or black, is known as saturation, chroma, tone, intensity, or purity. The third
attribute is the brightness of the colour, also referred to as value, lightness, or luminance.
Luminance is very informative in considering the properties of cathodically or anodically
colouring electrochromic materials, because, with only one value, it provides information
about the perceived transparency of a sample over the entire visible range. For the PB
system it will be very useful to have knowledge of these three colour attributes for the
design and optimisation of ECD’s that employ PB as one or both of the electrochromic
materials. Furthermore, precise knowledge of the PB coloration efficiency will establish
whether its power requirement is appropriate for a given application.
Colorimetric analysis for the PB/PW electrochromic transition
PB films were potentiostatically deposited onto ITO/glass substrates by electroreduction
of solutions containing iron(III) and hexacyanoferrate(III) ions. Reduction of the
solution-phase adduct iron(III)hexacyanoferrate(III), present in equilibrium with the ions,
is the principal electron transfer process in PB electrodeposition.13 The electrochemical
deposition time and solution concentrations were established as optimal in terms of the
stability of the films, and the contrast of the visually-observed colour changes.13,14
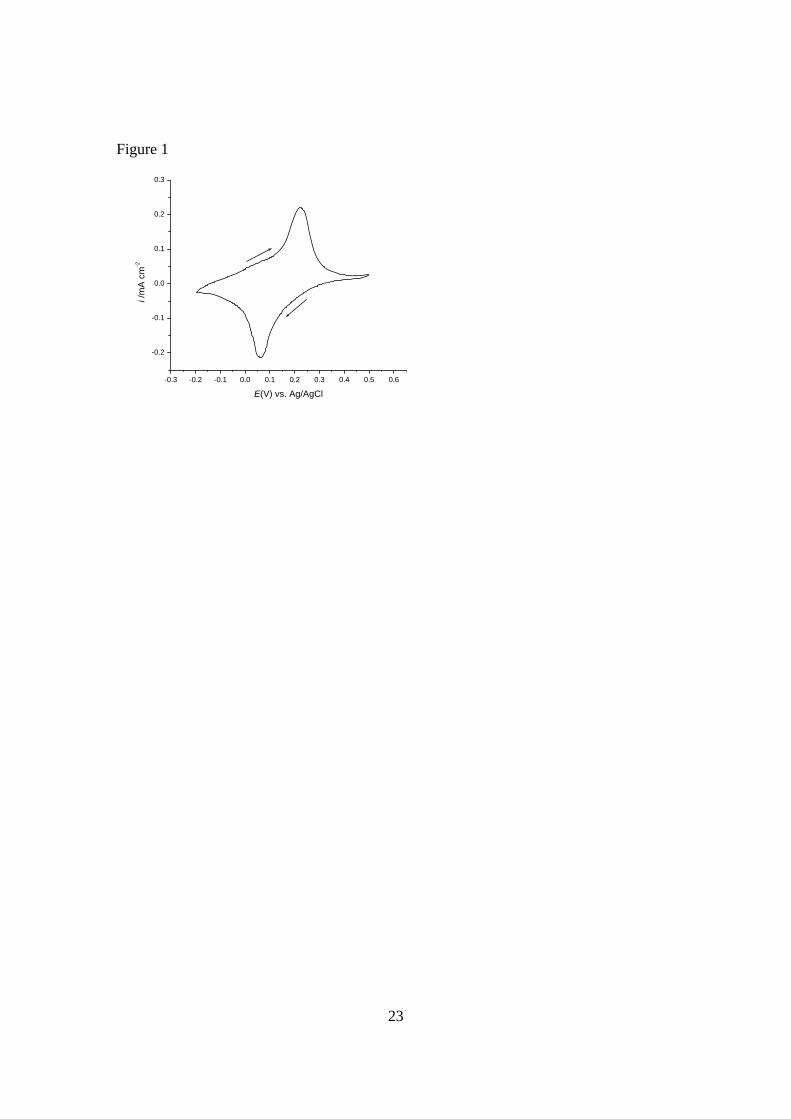
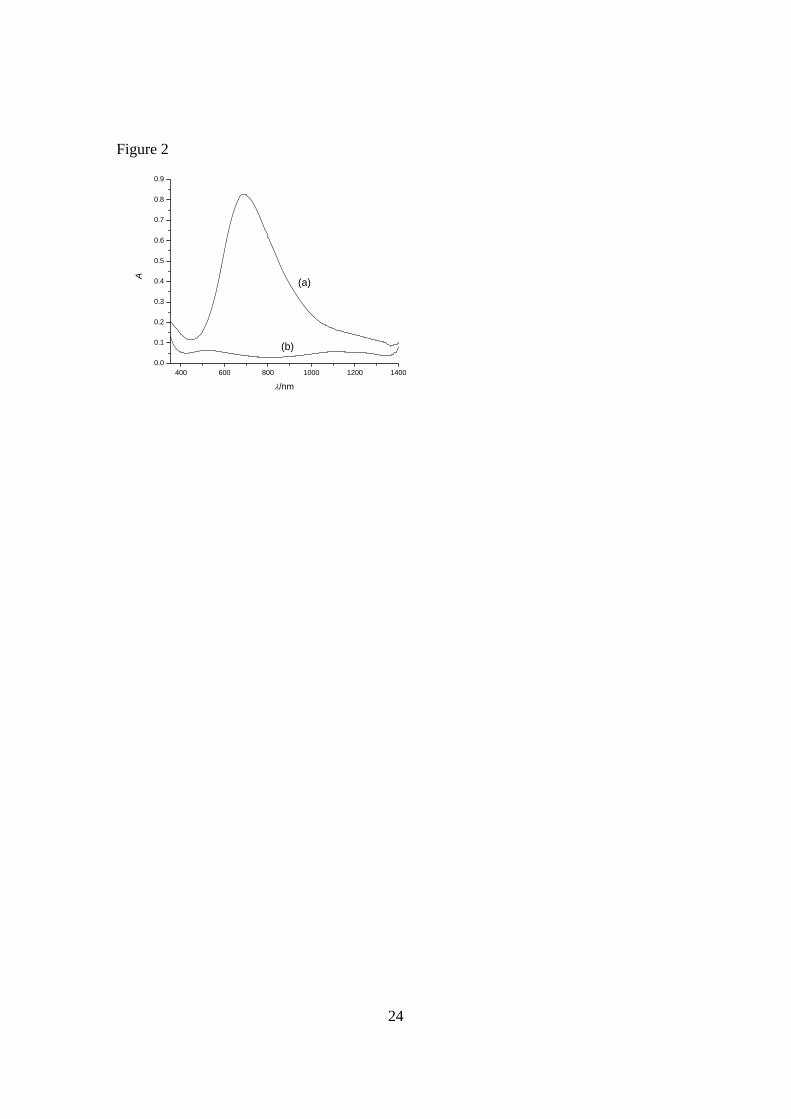
Fig. 1 shows the well-established cyclic voltammogram (CV) for the PB to PW
transition, with spectra for each of these states being shown in Fig. 2.
9
Fig. 1 See end
Fig. 2 See end
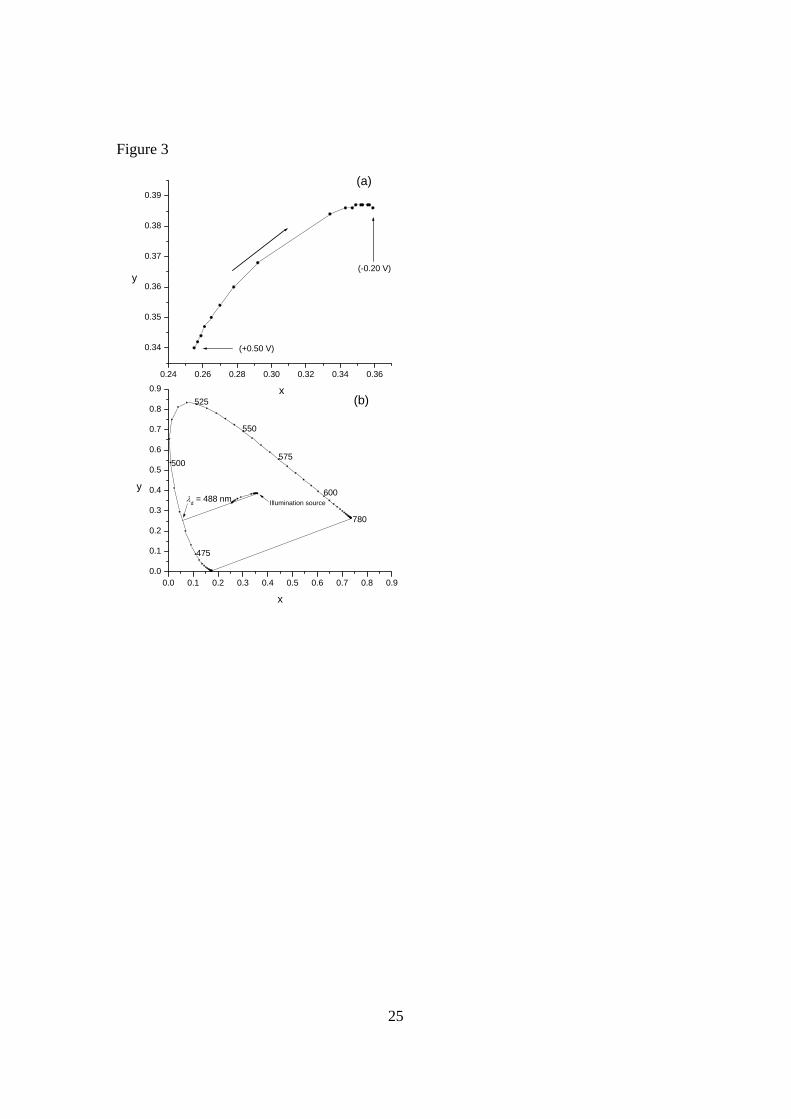
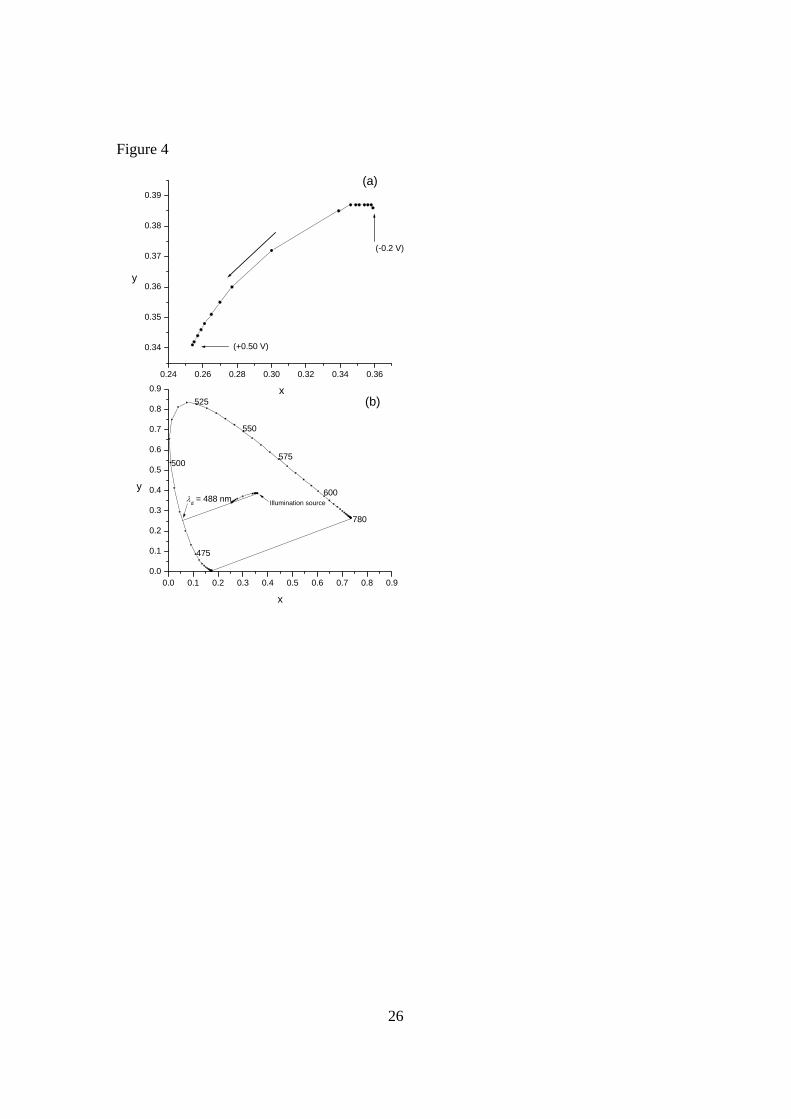
Fig. 3 shows the hue and saturation track in the xy chromaticity diagram for the PB to PW
transition, as the potential is slowly stepped between +0.50 and -0.20 V. Fig. 4 is the xy
chromaticity diagram for the reverse process.
Fig. 3 See end
Fig. 4 See end
Although the xy chromaticity diagram is not a uniform colour space, abrupt changes in
colour are found to correspond with significant changes in the xy coordinates. The large
changes in xy coordinates in Fig. 3 occur as the intensely absorbing mixed-valence
Fe3+[FeII(CN)6]4- blue chromophore is lost on reduction to PW. The reversibility of this
process is seen on comparison with data in Fig. 4. The chromaticity coordinates lack the
hysteresis that is seen on switching of electrochromic conducting polymer films between
conductive and insulating forms.50 In Figs. 3(b) and 4(b), the data are overlaid onto the
CIE (Commission Internationale de l'Eclairge) 1931 colour space template, showing the
track of the xy coordinates between the blue and white (transparent) colour states. In this
representation, the line surrounding the horse-shoe shaped area is called the spectral
locus, giving the visible light wavelengths. The most saturated colours lie along the
10
spectral locus. The line connecting the longest and shortest wavelength contains the non-
spectral purples and is known as the purple line. Surrounded by the spectral locus and
the purple line is the region known as the colour locus, which contains every colour that
can exist. For the PB/PW system, the PW state is confirmed as colourless, because the
coordinates are coincident with those of the illumination source (the ‘white point’, where
x = 0.358, y = 0.385). The location of any point in the xy diagram gives the hue and
saturation of the colour. The hue, measured as 488 nm for PB (see Figs. 3(b) and 4(b)),
was determined by drawing a straight line through the white point and the point of
interest to the spectral locus thus obtaining the dominant wavelength of the colour.
It is important to realise that the CIE does not associate a specific colour with any
point on the xy diagram. Colours cannot be specifically associated with a given pair of xy
coordinates, because the third dimension of colour, lightness, is not included in the
diagram. The relative lightness or darkness of a colour is very important in how it is
perceived, and is usually presented as the relative luminance, Y, of the sample, to that of
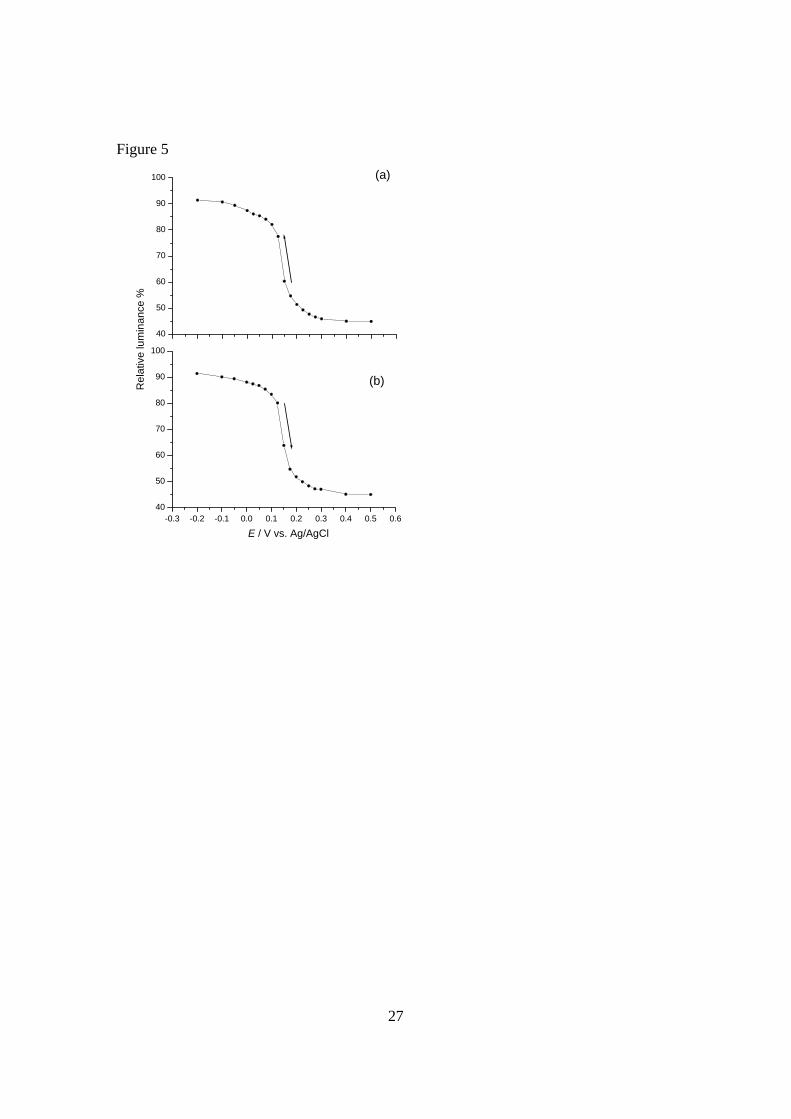
the background, Y0. Fig. 5 shows the variation of % relative luminance with potential for
the PB/PW transition during both the ‘bleaching’ and colouring processes by potential
stepping.
Fig. 5 See end
Relative luminance values can range from 100% for white samples (no light
absorbed) to zero for samples that absorb all the light. On PB reduction, the film
luminance rapidly increases over a narrow potential range. That the luminance doesn’t
11
reach 100% is attributed to light scattering of the PW form. As for the xy coordinate
measurements, Y values are coincident for the forward (reduction) (Fig. 5(a)) and reverse
(oxidation) (Fig. 5(b)) directions of the PB/PW transition, with no hysteresis, showing the
stability of the system. To obtain plots without hysteresis, preliminary measurements
established the need to thoroughly de-oxygenate the 0.2 M KCl supporting electrolyte
solution in the quartz cuvette. PW electrocatalytically reduces dissolved oxygen,51
leading to a significant pH increase during the substantial time periods that the PB/PW
system is held at reducing potentials during the colorimetric measurements. PB films are
unstable in alkaline solutions,52 film dissolution giving the appearance of enhanced
luminance of samples.
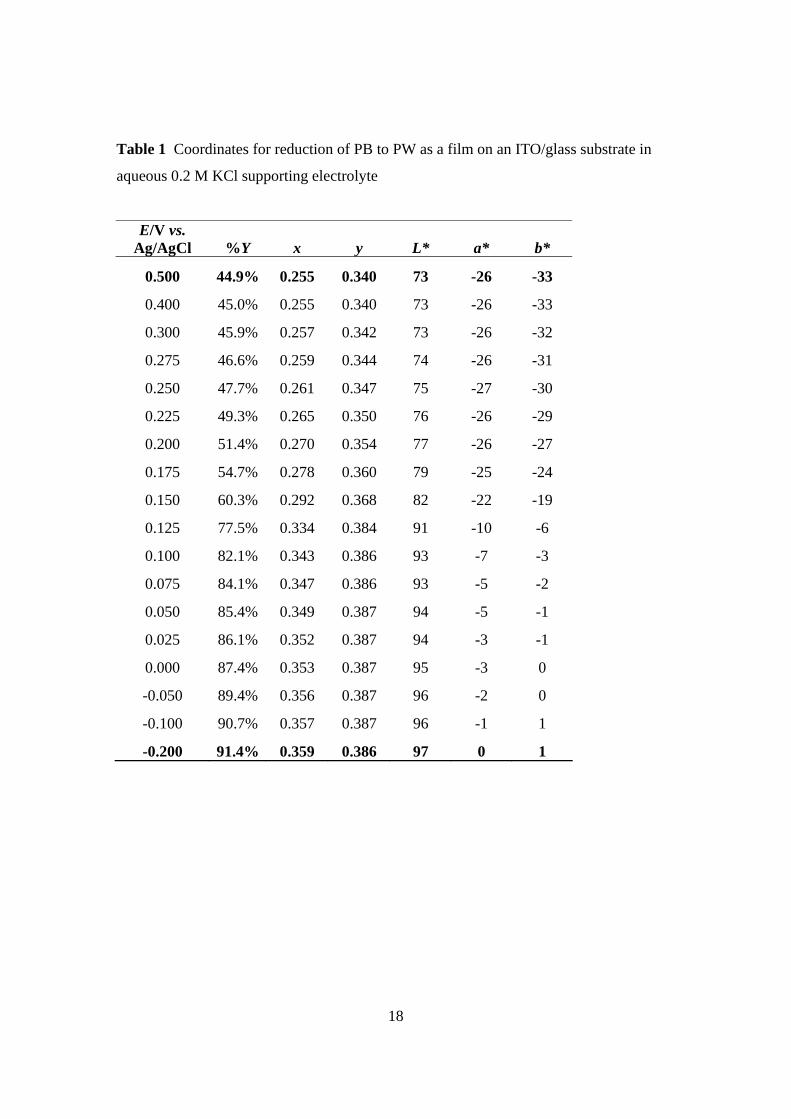
In Table 1, the calculated L*a*b* coordinates, a uniform colour space (CIELAB)
defined by the CIE in 1976, are also shown at each applied potential. This representation
further emphasises the narrow potential range for the PB/PW transition. The CIE L*a*b*
space is a standard commonly used in the paint, plastic, and textile industries. L* is the
lightness variable of the sample, while a* and b* correspond to the two antagonistic
chromatic processes (red-green and yellow-blue). In the L*a*b* chromaticity diagram, +
a* is the red direction, - a* is the green direction, + b* is the yellow direction, and – b* is
the blue direction. The centre (0, 0) of the chromaticity diagram is achromatic; as the a*
and b* values increase, the saturation of the colour increases. Comparison of the PB
coordinates with those of the reduced form of tungsten oxide42,43,44 and the blue states of a
range of different conducting polymer films33 show the distinct nature of the blue colour
provided by PB. For example, the L*a*b* coordinates for the (deep blue) neutral form of
PEDOT are 20, 15, and -43 respectively.33
12
Colorimetric analysis for the PB/PY electrochromic transition
As noted, PB is polyelectrochromic, oxidation yielding Prussian yellow (iron(III)
hexacyanoferrate(III), PY), via the intermediate Prussian green (PG) state. However, PY
is slightly soluble in water and for reason of stability, practical PB ECD’s have primarily
exploited the PB/PW transition. This does not rule out the prospect of four-colour PB
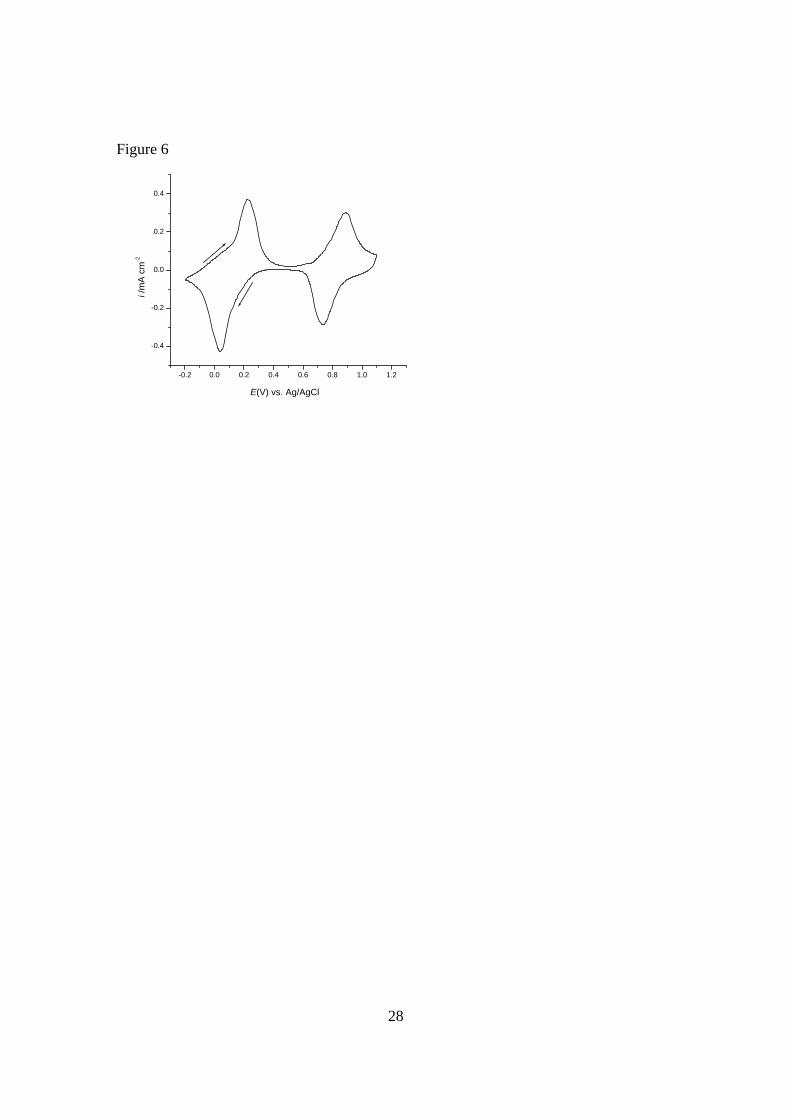
polyelectrochromic devices, as other solvent systems may not dissolve PY. Fig. 6 shows
the full CV for PB on an ITO/glass substrate, to include the PB/PY redox wave at
positive potentials. Due to the dissolution of PY during the substantial time periods that
the PB/PY system is held at oxidising potentials during the colorimetric measurements,
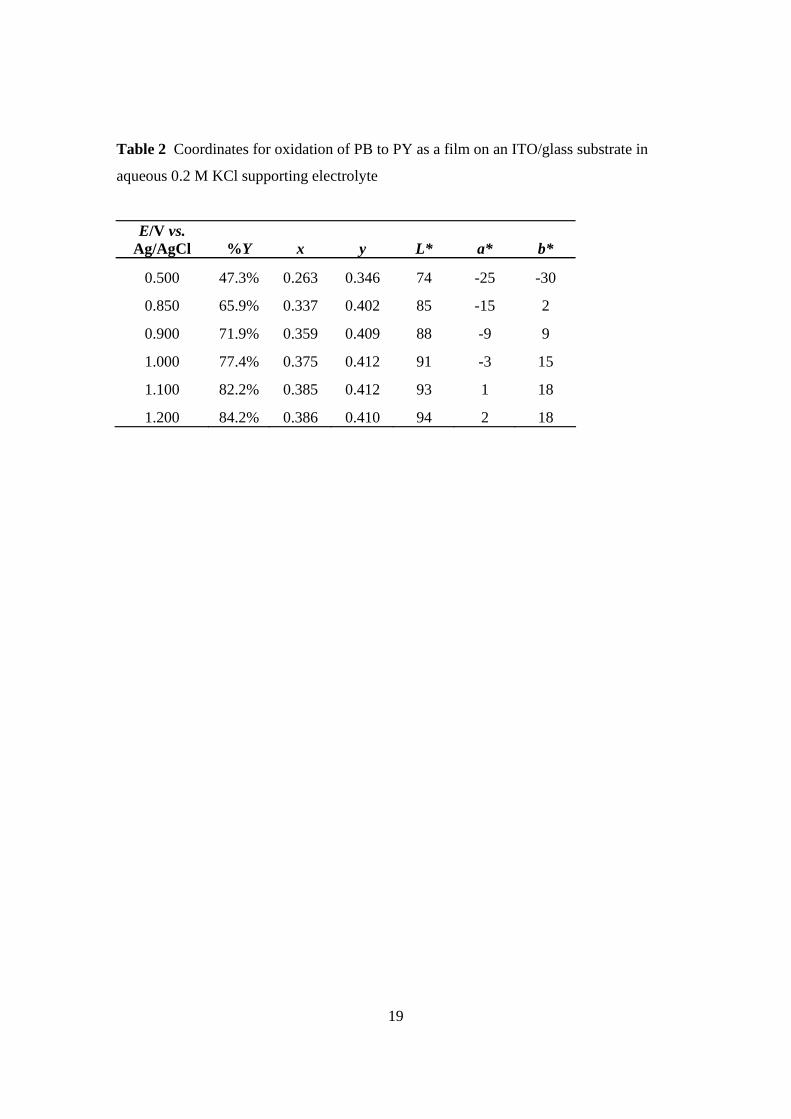
just a few measurements were recorded at a few specific potentials, as shown in Table 2.
The colour coordinates at +0.85 V and +0.90 V correspond to intermediate green states,
with the golden-yellow form being observed at +1.10 V and above. The L*a*b*
coordinates nicely show the changes that take place for the transition of blue through
green to yellow. The a* coordinate moves from the negative (green) direction to close to
zero. At the same time, the b* coordinate moves in a positive (yellow) direction,
although the final value (18) shows the yellow saturation to be low. As expected, the
oxidation of PB through PG to PY, led to an increase in luminance of the system (Table
2), although the film does not reach the luminance of the PW state.
Composite coloration efficiency measurements for the PB/PW transition
As noted above, the coloration efficiency, η = ΔA(λmax)/Q, is an efficient and practical
tool for the measurement of power requirements of electrochromic materials. This
13
concept has been used in studies for the comparison of different electrochromic
materials.34,40,45,53 We here show the application of the composite coloration efficiency
measurements to the PB/PW electrochromic transition. A tandem
chronocoulometry/chronoabsorptometry method is used, with CCE’s being calculated at
specific percentage transmittance changes at the λmax of the PB absorbance band.
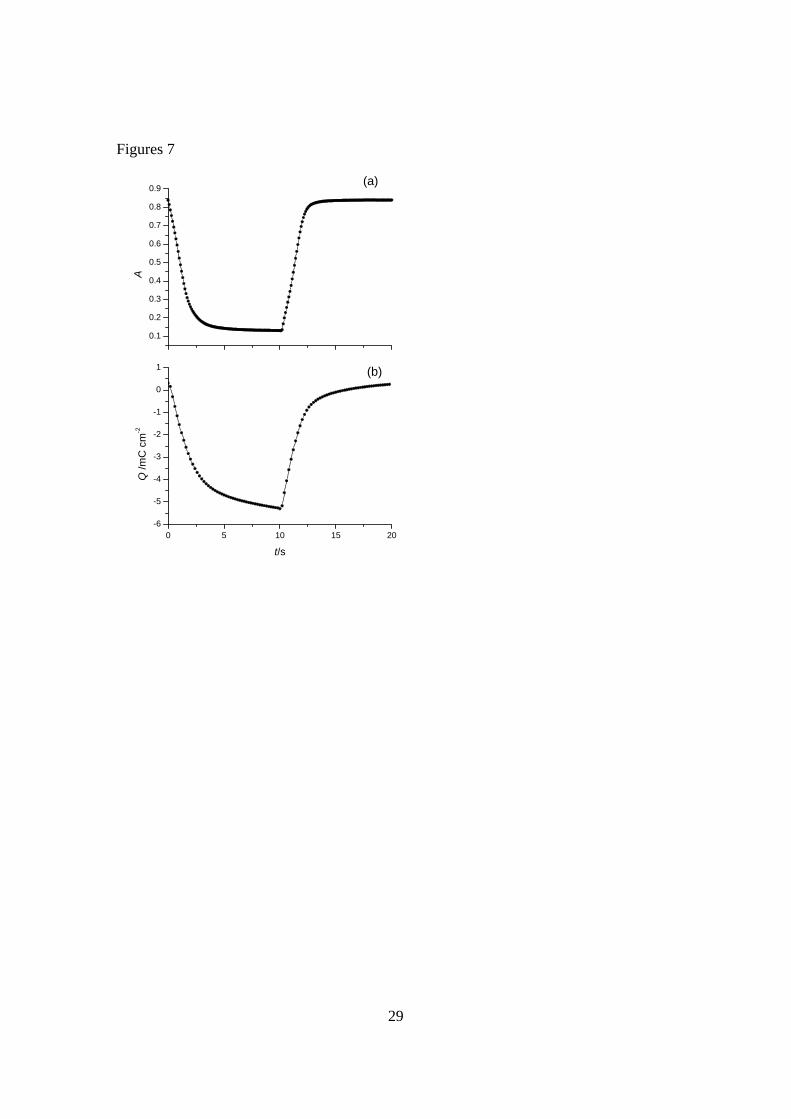
Fig. 7(a) shows the dynamic measurement of the film absorbance at 686 nm,
during square-wave switching between +0.50 V (PB, high absorbance) and -0.20 V (PW,
low absorbance). For the PB/PW transition, the electrochromic contrast at 686 nm,
calculated as Δ%T from the maximum and minimum absorbance values was 60%. This
result is substantially higher than the percentage relative luminance change established in
the colorimetric measurements (46.5% from Table 1). The difference nicely
demonstrates the importance of relative luminance changes in providing more realistic
contrast values since they offer a perspective on the transmissivity of a material as it
relates to the human eye perception of transmittance over the entire visible region.54
Charge measurements, recorded simultaneously with the absorbance data are given in
Fig. 7(b).
Fig. 7 See end
In the composite coloration efficiency method, to provide points of reference with
which to compare the CCE values of various electrochromic materials, η values are
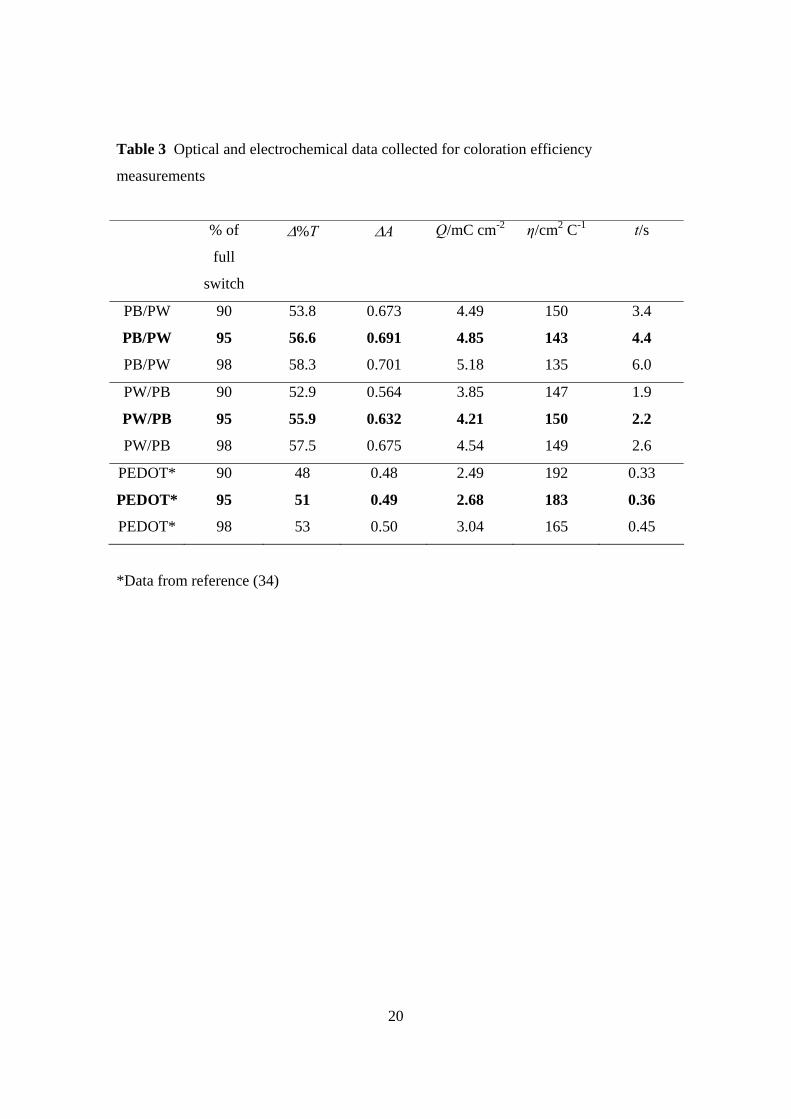
calculated at specific transmittance changes, as a percentage of the total Δ%T (60%).
Table 3 shows data for 90, 95 and 98% changes, for both reduction of PB to PW, and
14
oxidation of PW to PB. Although the chronocoulometric data were corrected for
background charging, as for measurements with conducting polymer films,34 the η values
for the reduction process are seen to slightly decrease with increase in optical change.
This again shows that it is important to measure the charge passed at very specific
transmittance values and not to simply divide the total absorbance change by the
maximum charge passed. Here, this is important for reduction of PB to PW, because, as
noted above, PW is a good catalyst for the reduction of oxygen, which may ingress into
the cuvette at long measurement times. (It should be noted that in the original
publication34 that introduced composite coloration efficiency measurements, the
calculated η values were described as being at 90, 95 and 98% of the total optical density
change [ΔOD (=ΔA)], at λmax. Considering the fundamental definition of ΔOD, this was
a misstatement and all composite coloration efficiency calculations, here and
previously,34,53 were determined using the ΔOD at 90, 95 and 98% of the total
transmittance (Δ%T).
Although inorganic materials typically exhibit lower η values than conducting
polymers, it is of interest to note (Table 3) that the carefully measured values calculated
here are comparable to those for films of PEDOT (at 150 nm film thickness), although
switching times are longer for the PB/PW transition. The η values are similar for both
reduction of PB to PW, and oxidation of PW to PB, although the switching times for the
latter process are slightly shorter. To preserve the electroneutrality of the solid
electrochromic film, potassium ion uptake/loss must accompany the colour-transforming
electron-transfer.47,48 The difference in switching times is likely to relate to different
rates of ingress/egress of potassium ions in the films.
15
Conclusion
An in situ colorimetric method, based on the CIE (Commission Internationale de
l'Eclairge) system of colorimetry, has been successfully applied to the study of
electrochromic colour changes in electrochemically deposited films of Prussian blue on
transmissive ITO/glass substrates. This technique is a convenient method for the precise
measurement of the hue, saturation and luminance of colour states and allows the changes
in these properties to be carefully monitored on redox switching between electrochromic
colour states. This approach is frequently used in the study of electrochromic organic
polymer films, and following the results described here, would clearly be applicable to
other electrochromic systems, such as other metal hexacyanometallates, metal oxides,
viologens, phthalocyanines and metallopolymers. Electrochromic materials have current
and proposed device applications in both transmission (e.g., electrochromic sunglasses,
‘smart’ windows) and reflective (e.g., displays) modes. Due to the light source being
behind the sample, the in situ colorimetry described here necessitates measurements to be
made in transmissive mode. As we have found for spectral properties of electrochromic
conductive polymers,39,55 we anticipate that the data would directly relate to both
transmissive and reflective modes. As the field of electrochromism matures, the
colorimetric method will be invaluable for the precise measurement, design and choice of
specific colour states. In the construction of practical ECD’s, a knowledge of electrical
power requirements is also essential. The tandem
chronocoulometry/chronoabsorptometry method, earlier introduced for the measurement
of electrochromic conductive polymer composite coloration efficiencies, has been
16
successfully applied here to Prussian blue, to allow reliable quantitative comparisons with
other electrochromic systems.
Acknowledgements
We thank the EPSRC for an Overseas Travel Grant (GR/T23886/01) to RJM and the
AFOSR (F49620-03-1-0091) for financial support. We acknowledge Aubrey L. Dyer for
assistance with the artwork for the figures.
17
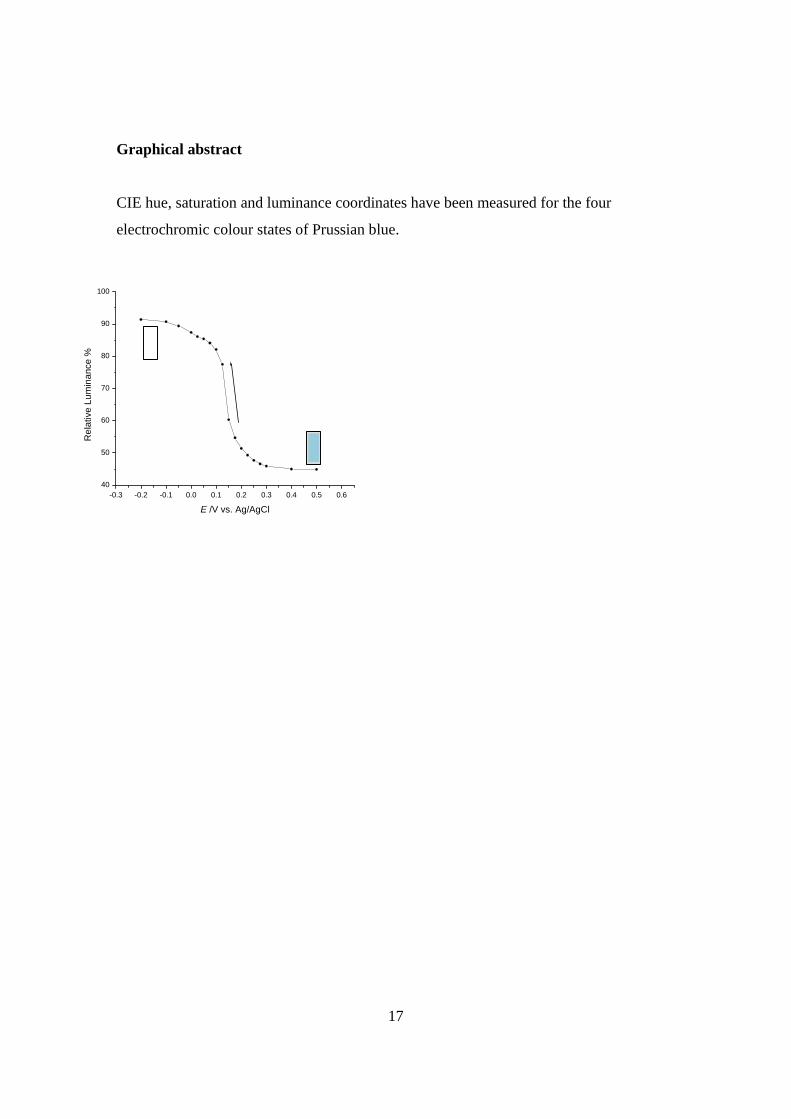
Graphical abstract
CIE hue, saturation and luminance coordinates have been measured for the four
electrochromic colour states of Prussian blue.
-0.3 -0.2 -0.1 0.0 0.1 0.2 0.3 0.4 0.5 0.640
50
60
70
80
90
100
Rel
ativ
e Lu
min
ance
%
E /V vs. Ag/AgCl
18
Table 1 Coordinates for reduction of PB to PW as a film on an ITO/glass substrate in
aqueous 0.2 M KCl supporting electrolyte
E/V vs. Ag/AgCl %Y x y L* a* b*
0.500 44.9% 0.255 0.340 73 -26 -33
0.400 45.0% 0.255 0.340 73 -26 -33
0.300 45.9% 0.257 0.342 73 -26 -32
0.275 46.6% 0.259 0.344 74 -26 -31
0.250 47.7% 0.261 0.347 75 -27 -30
0.225 49.3% 0.265 0.350 76 -26 -29
0.200 51.4% 0.270 0.354 77 -26 -27
0.175 54.7% 0.278 0.360 79 -25 -24
0.150 60.3% 0.292 0.368 82 -22 -19
0.125 77.5% 0.334 0.384 91 -10 -6
0.100 82.1% 0.343 0.386 93 -7 -3
0.075 84.1% 0.347 0.386 93 -5 -2
0.050 85.4% 0.349 0.387 94 -5 -1
0.025 86.1% 0.352 0.387 94 -3 -1
0.000 87.4% 0.353 0.387 95 -3 0
-0.050 89.4% 0.356 0.387 96 -2 0
-0.100 90.7% 0.357 0.387 96 -1 1
-0.200 91.4% 0.359 0.386 97 0 1
19
Table 2 Coordinates for oxidation of PB to PY as a film on an ITO/glass substrate in
aqueous 0.2 M KCl supporting electrolyte
E/V vs. Ag/AgCl %Y x y L* a* b*
0.500 47.3% 0.263 0.346 74 -25 -30
0.850 65.9% 0.337 0.402 85 -15 2
0.900 71.9% 0.359 0.409 88 -9 9
1.000 77.4% 0.375 0.412 91 -3 15
1.100 82.2% 0.385 0.412 93 1 18
1.200 84.2% 0.386 0.410 94 2 18
20
Table 3 Optical and electrochemical data collected for coloration efficiency
measurements
% of
full
switch
Δ%T ΔA Q/mC cm-2 η/cm2 C-1 t/s
PB/PW 90 53.8 0.673 4.49 150 3.4
PB/PW 95 56.6 0.691 4.85 143 4.4
PB/PW 98 58.3 0.701 5.18 135 6.0
PW/PB 90 52.9 0.564 3.85 147 1.9
PW/PB 95 55.9 0.632 4.21 150 2.2
PW/PB 98 57.5 0.675 4.54 149 2.6
PEDOT* 90 48 0.48 2.49 192 0.33
PEDOT* 95 51 0.49 2.68 183 0.36
PEDOT* 98 53 0.50 3.04 165 0.45
*Data from reference (34)
21
Figure captions
Fig. 1
Cyclic voltammogram at 5 mV s-1 scan rate for a PB/ITO/glass electrode in aqueous 0.2
M KCl supporting electrolyte, showing the voltammetric wave for the PB/PW redox
switch. Initial potential, +0.50 V vs. Ag/AgCl. Arrows indicate direction of potential
scan.
Fig. 2
Visible/NIR region in situ absorption spectra for a PB/ITO/glass electrode in aqueous 0.2
M KCl supporting electrolyte at +0.50 V (curve (a) for the PB redox state) and -0.20 V
(curve (b) for the PW redox state), respectively.
Fig. 3
CIE 1931 xy chromaticity diagrams for a PB/ITO/glass electrode in aqueous 0.2 M KCl
supporting electrolyte. The potential (vs. Ag/AgCl) was decreased, in the steps indicated
in Table 1, from the coloured PB (+0.50 V) to the transparent PW (-0.20 V) redox states.
In Fig. 3(b), the xy coordinates are plotted onto a diagram that shows the locus
coordinates, with labelled hue wavelengths, and the evaluation of the dominant
wavelength (488 nm) of the PB redox state.
Fig. 4
CIE 1931 xy chromaticity diagrams for a PB/ITO/glass electrode in aqueous 0.2 M KCl
supporting electrolyte. The potential (E/V vs. Ag/AgCl) was increased, in the same steps
as for Fig. 3, from the transparent PW (-0.20 V) to the coloured PB (+0.50 V) redox
states. In Fig. 4(b), the xy coordinates are plotted onto a diagram that shows the locus
coordinates, with labelled hue wavelengths, and the evaluation of the dominant
wavelength (488 nm) of the PB redox state.
22
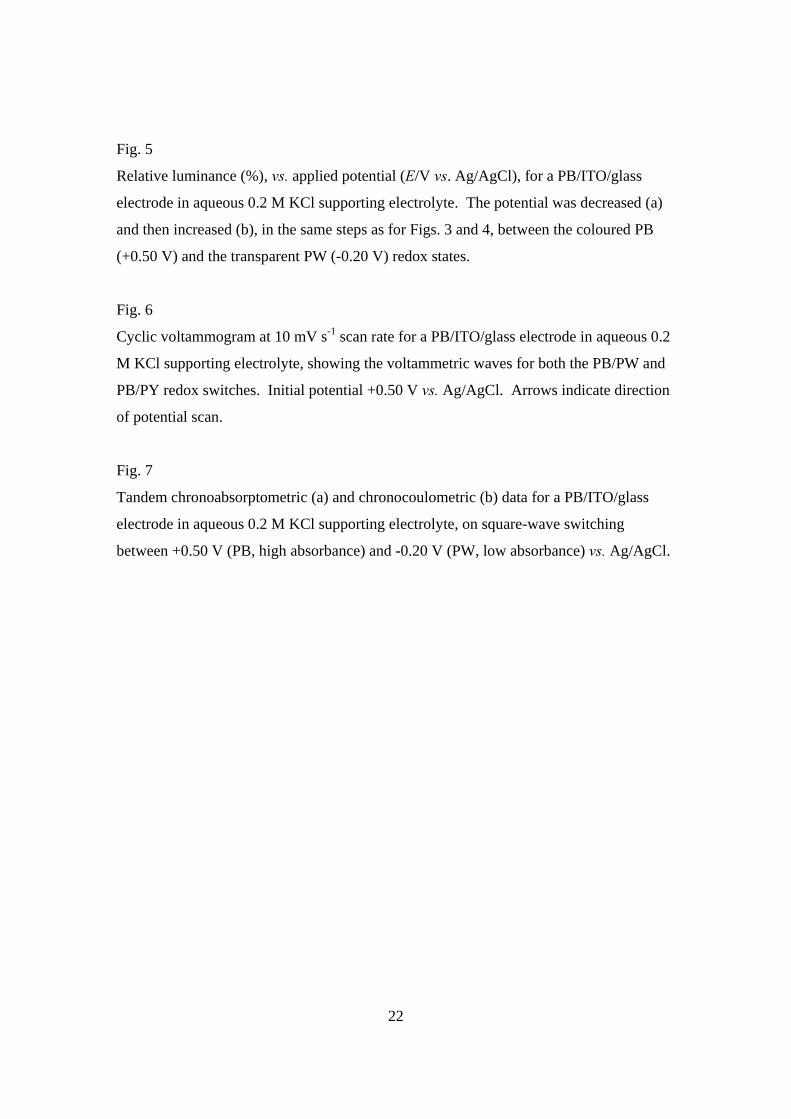
Fig. 5
Relative luminance (%), vs. applied potential (E/V vs. Ag/AgCl), for a PB/ITO/glass
electrode in aqueous 0.2 M KCl supporting electrolyte. The potential was decreased (a)
and then increased (b), in the same steps as for Figs. 3 and 4, between the coloured PB
(+0.50 V) and the transparent PW (-0.20 V) redox states.
Fig. 6
Cyclic voltammogram at 10 mV s-1 scan rate for a PB/ITO/glass electrode in aqueous 0.2
M KCl supporting electrolyte, showing the voltammetric waves for both the PB/PW and
PB/PY redox switches. Initial potential +0.50 V vs. Ag/AgCl. Arrows indicate direction
of potential scan.
Fig. 7
Tandem chronoabsorptometric (a) and chronocoulometric (b) data for a PB/ITO/glass
electrode in aqueous 0.2 M KCl supporting electrolyte, on square-wave switching
between +0.50 V (PB, high absorbance) and -0.20 V (PW, low absorbance) vs. Ag/AgCl.
23
Figure 1
-0.3 -0.2 -0.1 0.0 0.1 0.2 0.3 0.4 0.5 0.6
-0.2
-0.1
0.0
0.1
0.2
0.3
i /m
A c
m-2
E(V) vs. Ag/AgCl
24
Figure 2
400 600 800 1000 1200 14000.0
0.1
0.2
0.3
0.4
0.5
0.6
0.7
0.8
0.9
(b)
(a)A
λ/nm
25
Figure 3
0.0 0.1 0.2 0.3 0.4 0.5 0.6 0.7 0.8 0.90.0
0.1
0.2
0.3
0.4
0.5
0.6
0.7
0.8
0.9(b)
λd = 488 nm
475
Illumination source600
575
550
500
525
780
y
x
0.24 0.26 0.28 0.30 0.32 0.34 0.36
0.34
0.35
0.36
0.37
0.38
0.39
x
(a)
(+0.50 V)
(-0.20 V)y
26
Figure 4
0.0 0.1 0.2 0.3 0.4 0.5 0.6 0.7 0.8 0.90.0
0.1
0.2
0.3
0.4
0.5
0.6
0.7
0.8
0.9
(b)
λd = 488 nm
475
Illumination source600
575
550
500
525
780
y
x
0.24 0.26 0.28 0.30 0.32 0.34 0.36
0.34
0.35
0.36
0.37
0.38
0.39
x
(a)
(+0.50 V)
(-0.2 V)
y
27
40
50
60
70
80
90
100
E / V vs. Ag/AgCl
(b)Rel
ativ
e lu
min
ance
%
-0.3 -0.2 -0.1 0.0 0.1 0.2 0.3 0.4 0.5 0.640
50
60
70
80
90
100
(a)
Figure 5
28
Figure 6
-0.2 0.0 0.2 0.4 0.6 0.8 1.0 1.2
-0.4
-0.2
0.0
0.2
0.4
i /m
A c
m-2
E(V) vs. Ag/AgCl
29
Figures 7
0 5 10 15 20-6
-5
-4
-3
-2
-1
0
1 (b)
Q /m
C c
m-2
t/s
0.1
0.2
0.3
0.4
0.5
0.6
0.7
0.8
0.9(a)
A
30
References 1 Diesbach (1704) cited in Gmelin, Handbuch der Anorganischen Chemie, vol. 59, Teil
B.
2 K. Fukuda, in Pigment Handbook, ed. P. A. Lewis, vol. I, 2nd. ed., Wiley Interscience,
New York, 1988, pp. 357-365.
3 Colour Index 3rd. ed., vol. 4, Society of Dyers and Colourists, Bradford, England, 1971,
p. 4673.
4 K. R. Dunbar and R. A. Heintz, ed. K. D. Karlin, Progress in Inorganic Chemistry, J.
Wiley, New York, 1997, pp. 283-391.
5 K. Itaya, I. Uchida and V. D. Neff, Acc. Chem. Res., 1986, 19, 162.
6 V. D. Neff, J. Electrochem. Soc., 1978, 125, 886.
7 P. M. S. Monk, R. J. Mortimer and D. R. Rosseinsky, Electrochromism: Fundamentals
and Applications, VCH, Weinheim, 1995, ch. 6.
8 F. Li and S. Dong, Electrochim. Acta, 1987, 32, 1511.
9 S. Dong and G. Che, J. Electroanal. Chem., 1991, 315, 191.
10 J. A. Cox, R. K. Jaworski and P. J. Kulesza, Electroanalysis, 1991, 3, 869.
11 A. A. Karyakin, Electroanalysis, 2001, 13, 813.
12 R. Koncki, Crit. Rev. Anal. Chem., 2002, 32, 79.
13 R.J. Mortimer and D.R. Rosseinsky, J. Electroanal. Chem., 1983, 151, 133.
14 R.J. Mortimer and D.R. Rosseinsky, J. Chem. Soc. Dalton Trans., 1984 2059.
15 K. Itaya, K. Shibayama, H. Akahoshi and S. Toshima, J. Appl. Phys., 1982, 53, 804.
16 K. Honda, J. Ochiai and H. Hayashi, J. Chem. Soc., Chem. Commun., 1986, 168.
17 K. Honda and A. Kuwano, J. Electrochem. Soc., 1986, 133, 853.
31
18 M. K. Carpenter and R. S. Conell, J. Electrochem. Soc., 1990, 137, 2464.
19 K. Honda, M. Fujita, H. Ishida, R. Yamamoto and K. Ohgaki, J. Electrochem. Soc.,
1988, 135, 3151.
20 M. A. Habib, S. P. Maheswari and M. K. Carpenter, J. Appl. Electrochem., 1991, 21,
203.
21 M. A. Habib and S. P. Maheswari, J. Electrochem. Soc., 1992, 139, 2155.
22 J-G. Béraud and D. Deroo, Solar Energy Mater. Solar Cells, 1993, 31, 263.
23 K-C. Ho, Electrochim. Acta, 1999, 44, 3227.
24 E. A. R. Duek, M-A. De Paoli and M. Mastragostino, Adv. Mater., 1992, 4, 287.
25 E. A. R. Duek, M-A. De Paoli and M. Mastragostino, Adv. Mater., 1993, 5, 650.
26 M. Morita, J. Appl. Poly. Sci., 1994, 52, 711.
27 B. P. Jelle, G. Hagen and S. Nodland, Electrochim. Acta, 1993, 38, 1497.
28 B. P. Jelle and G. Hagen, J. Electrochem. Soc., 1993, 140, 3560.
29 N. Leventis and Y. C. Chung, J. Electrochem. Soc., 1990, 137, 3321.
30 B. P. Jelle and G. Hagen, J. Appl. Electrochem., 1999, 29, 1103.
31 N. Kashiwazaki, Solar Energy Mater. Solar Cells, 1992, 25, 349.
32 T-S. Tung and K-C. Ho, Abstract No. 1313. 203rd Electrochemical Society Meeting,
Paris, France, 27 April - 2 May, 2003. Meeting Abstracts, Volume 2003-01.
Electrochromics Materials and Applications Symposium, (Symposium Organisers: A.
Rougier, D. Rauh, G. A. Nazri and G. Hunter).
33 B. C. Thompson, P. Schottland, K. Zong and J. R. Reynolds, Chem. Mater., 2000, 12,
1563.
32
34 C. L. Gaupp, D. M. Welsh, R. D. Rauh and J. R. Reynolds, Chem. Mater., 2002, 14,
3964.
35 G. Wyszecki and W. S. Stiles, Color Science: Concepts and Methods, Quantitative
Data and Formulae, J. Wiley & Sons, New York, 2nd Edition, 1982.
36 B. C. Thompson, P. Scottland, G. Sönmez and J. R. Reynolds, Synth. Met., 2001, 119,
333.
37 I. Schwendeman, R. Hickman, G. Sönmez, P. Schottland, K. Zong, D. M. Welsh and J.
R. Reynolds, Chem. Mater., 2002, 14, 3118.
38 G. Sönmez, I. Schwendeman, P. Schottland, K. Zong and J. R. Reynolds,
Macromolecules, 2003, 36, 639.
39 A. Cirpan, A. A. Argun, C. R. G. Grenier, B. D. Reeves and J. R. Reynolds, J. Mater.
Chem., 2003, 13, 2422.
40 G. Sönmez, H. Meng and F Wudl, Chem. Mater., 2004, 16, 574.
41 C. A. Thomas, K. Zong, K. A. Abboud, P. J. Steel and J. R. Reynolds, J. Am. Chem.
Soc., 2004, in press.
42 T. Furuta, T. Shimomura, H. Mada and S. Kobayashi, Jap. J. Appl. Phys., Part 2:
Letters, 1981, 20, L768.
43 T. Shimomura, T. Furata and T. Maki, Jap. J. Appl. Phys., Part 2: Letters, 1987, 26,
L299.
44 T. Shimomura, T. Furata and Y. Eguchi, Jap. J. Appl. Phys., Part 2: Letters, 1988, 27,
L1137.
45 R. D. Rauh, F. Wang, J. R. Reynolds and D. L. Meeker, Electrochim. Acta, 2001, 46,
2023.
33
46 R. J. Mortimer, J. Electroanal. Chem., 1995, 397, 79.
47 D. R. Rosseinsky and A. Glidle, J. Electrochem. Soc., 2003, 150, C641.
48 D. R. Rosseinsky, L. Glasser and H. D. B. Jenkins, J. Am. Chem. Soc., 2004, 126,
10472.
49 R. T. Marcus, in Color for Science, Art, and Technology, ed. K. Nassau, Elsevier,
Amsterdam, 1998, pp. 31-96.
50 M. Ertas and J. R. Reynolds, unpublished results.
51 K. Itaya, N. Shoji and I. Uchida, J. Am. Chem. Soc., 1984, 106, 3423.
52 S. Lupu, C. Mihailciuc, L. Pigani, R. Seeber, N. Totir and C. Zanardi, Electrochem.
Commun., 2002, 4, 753.
53 P-H. Aubert, A. A. Argun, A. Cirpan, D. B. Tanner and J. R. Reynolds, Chem. Mater.,
2004, 16, 2386.
54 A. A. Argun, P-H. Aubert, B. C. Thompson, I. Scwendeman, C. L. Gaupp, J. Hwang,
N. J. Pinto, D. B. Tanner, A. G. MacDiarmid and J. R. Reynolds, Chem. Mater., 2004,
23, 4401.
55 B. D. Reeves, C. R. G. Grenier, A. A. Argun, A. Cirpan, T. D. McCarley and J. R.
Reynolds, Macromolecules, 2004, 37, 7559.