Embed Size (px)
Citation preview

IN SITU ELLIPSOMETRY OF SURFACES IN AN ULTRAHIGHVACUUM THIN FILM DEPOSITION CHAMBER
by
Joseph S. Choi
Submitted to Brigham Young University in partial fulfillment
of the graduation requirements for University Honors
Department of Physics and Astronomy
June 2000
Advisor: David D. Allred Alcuin Fellow: Hal L. Black
Signature: Signature:

Acknowledgments
This thesis has been possible through the support and guidance of Dr.David Allred, of the Department of Physics and Astronomy, Brigham YoungUniversity. I am also grateful for those who have helped in the building ofthe vacuum chamber and the measurements of films- Aaron Fox, J.J. War-riner, Greg Harris, Zach Barton, Bryan Schramm, Joseph Young, Wesley Lif-ferth, Scott Daniel, Nan Ellen Ah You, Matthew Squires, Cort Johnson, andMichael Newey. Training Luke Bissell, Richard Sandberg, and Tyler Smithon this UHV system while gaining feedback and comments have tremen-dously helped this thesis to be polished in its written form. The support andkindness of my parents, Soo-Young Choi and Ock-ja Choi, family members,Dr. Justin Peatross, Matthew Tollestrup and many others have also beenvaluable in completing this work.
Generous financial support from the Department of Physics and Astron-omy, Honors Department, ORCA Scholarship, Multi-cultural Student Ser-vices Scholarship of Brigham Young University, and SPIE Scholarship havebeen significant and much appreciated.

List of Figures
1 View of the UHV deposition system with in situ ellipsometry . 1092 Reflectance of Silicon film versus thickness of SiO2 layer . . . . 1093 Achieving UHV . . . . . . . . . . . . . . . . . . . . . . . . . . 1104 Conflat flange- sealing . . . . . . . . . . . . . . . . . . . . . . 1105 Setup of a possible leak detection . . . . . . . . . . . . . . . . 1116 Geometry of an ellipsometric experiment, showing the p- and
s- directions . . . . . . . . . . . . . . . . . . . . . . . . . . . . 1117 In situ ellipsometer operation principle . . . . . . . . . . . . . 1128 Electromagnetic plane wave . . . . . . . . . . . . . . . . . . . 1129 M-44TM in situ ellipsometer- Input unit on tilt stage . . . . . 11310 M-44TM in situ ellipsometer- Output unit on tilt stage . . . . 11311 Sorption pumps . . . . . . . . . . . . . . . . . . . . . . . . . . 11412 Cross section of an adsorption pump . . . . . . . . . . . . . . 11413 Cryopump . . . . . . . . . . . . . . . . . . . . . . . . . . . . . 11514 Cryopump components . . . . . . . . . . . . . . . . . . . . . . 11515 Design of a refrigerator cryopump . . . . . . . . . . . . . . . . 11616 Cryopump compressor unit- front . . . . . . . . . . . . . . . . 11617 Cross sectional view of Cryo-Torr 8 . . . . . . . . . . . . . . . 11718 Top view of the chamber . . . . . . . . . . . . . . . . . . . . . 11719 Left, side view of the chamber . . . . . . . . . . . . . . . . . . 11820 Right, side view of the chamber . . . . . . . . . . . . . . . . . 11821 Bottom view of the chamber . . . . . . . . . . . . . . . . . . . 11922 Gate valve . . . . . . . . . . . . . . . . . . . . . . . . . . . . . 11923 Gate valve components . . . . . . . . . . . . . . . . . . . . . . 12024 Gate valve sealing flange . . . . . . . . . . . . . . . . . . . . . 12025 Gauges- thermocouple and ion gauges . . . . . . . . . . . . . . 12126 SenTorrTM gauge controller . . . . . . . . . . . . . . . . . . . 12127 Rotatable CF flange . . . . . . . . . . . . . . . . . . . . . . . 122
i

28 Non-rotatable CF flange . . . . . . . . . . . . . . . . . . . . . 12229 QF fitting on the cryopump roughing line . . . . . . . . . . . . 12330 ASA type o-ring flange . . . . . . . . . . . . . . . . . . . . . . 12331 Various sizes of o-rings . . . . . . . . . . . . . . . . . . . . . . 12432 Bake out system . . . . . . . . . . . . . . . . . . . . . . . . . 12433 Cryopump heating tape . . . . . . . . . . . . . . . . . . . . . 12534 Variac voltage controllers for bake out . . . . . . . . . . . . . 12535 Sputter gun - Mighty Mak 4, by US Inc. . . . . . . . . . . . . 12636 Sputter gun mechanism in vacuum chamber . . . . . . . . . . 12637 Applied fields of planar magnetron sputtering . . . . . . . . . 12738 Target of the sputter gun . . . . . . . . . . . . . . . . . . . . . 12739 Evaporator with shields and support- Side view . . . . . . . . 12840 Evaporator with shields and support- Front view . . . . . . . . 12841 Sample stage . . . . . . . . . . . . . . . . . . . . . . . . . . . 12942 Sample stage inside the chamber . . . . . . . . . . . . . . . . . 12943 Installing the sample stage . . . . . . . . . . . . . . . . . . . . 13044 Shutter . . . . . . . . . . . . . . . . . . . . . . . . . . . . . . . 13045 Crystal monitor- crystal, oscillator, and feedthrough . . . . . . 13146 Oxygen and argon gas lines . . . . . . . . . . . . . . . . . . . 13147 Power supply racks . . . . . . . . . . . . . . . . . . . . . . . . 13248 Water cooling lines . . . . . . . . . . . . . . . . . . . . . . . . 13249 Water cooling source- pipes in the Physics Underground Lab-
oratory . . . . . . . . . . . . . . . . . . . . . . . . . . . . . . . 13350 Water cooling lines- control valves . . . . . . . . . . . . . . . . 13351 View of the sputtered ruthenium thin film (Taken out of the
chamber on May 31, 2001) . . . . . . . . . . . . . . . . . . . . 13452 Sputtered ruthenium film during first 30 minutes of argon
backfilling of the chamber- Ru thickness fit (A) . . . . . . . . 13453 Sputtered ruthenium film during first 30 minutes of argon
backfilling of the chamber- RuO2 thickness fit (A) . . . . . . . 13554 Sputtered ruthenium film during first 20-30 minutes of expo-
sure to atmospheric air- Ellipsometric measurements and fitof Psi . . . . . . . . . . . . . . . . . . . . . . . . . . . . . . . . 135
55 Sputtered ruthenium film during first 20-30 minutes of expo-sure to atmospheric air- Ru thickness fit (A) . . . . . . . . . . 136
56 Sputtered ruthenium film during first 20-30 minutes of expo-sure to atmospheric air- RuO2 thickness fit (A) . . . . . . . . 136
ii
57 Sputtered ruthenium film during first 24 hours of exposure toatmospheric air- Ellipsometric measurements of Psi . . . . . . 137
58 Sputtered ruthenium film during first 24 hours of exposure toatmospheric air- Ru thickness fit (A) . . . . . . . . . . . . . . 137
59 Sputtered ruthenium film during first 24 hours of exposure toatmospheric air- RuO2 thickness fit (A) . . . . . . . . . . . . . 138
A.1 Roughing line and pumps - labeling . . . . . . . . . . . . . . . 164A.2 Liquid nitrogen dewar currently used for the system . . . . . . 165A.3 Circuit design- Mass flow controller, voltage control knob, and
voltage display . . . . . . . . . . . . . . . . . . . . . . . . . . 166A.4 Pin-out for Simpson voltage display . . . . . . . . . . . . . . . 167A.5 Pin-out for Simpson voltage display (continued) . . . . . . . . 168

List of Tables
4.1 CTI-Cryogenics Cryo-Torrr 8 High Vacuum Pump Capacity . 384.2 Typical pressure variations during cooldown and normal op-
eration (all values are nominal) . . . . . . . . . . . . . . . . . 43
5.1 Usage of the Vacuum Chamber Ports . . . . . . . . . . . . . . 65
7.1 Variable Leak Valve Specifications . . . . . . . . . . . . . . . . 85
8.1 Ruthenium optical constants N and K - Fitted using six dif-ferent Ru thin film measurements; Based on published opticalconstants . . . . . . . . . . . . . . . . . . . . . . . . . . . . . 98
8.2 Ruthenium oxide (RuO2) optical constants N and K - Fit-ted using six different Ru thin film measurements; Based onpublished optical constants . . . . . . . . . . . . . . . . . . . . 99
8.3 Improved ruthenium optical constants N and K - Fitted using3 different Ru thin film in situ ellipsometric measurements inhigh vacuum . . . . . . . . . . . . . . . . . . . . . . . . . . . . 100
B.1 Cryopump performance operating log- Initial vacuum sessionduring April - May 2001 . . . . . . . . . . . . . . . . . . . . . 157
B.2 Cryopump performance operating log- Initial vacuum sessionduring April - May 2001 (continued) . . . . . . . . . . . . . . 158
B.3 Adhesive heating tapes calculated data . . . . . . . . . . . . . 159
C.1 Company References . . . . . . . . . . . . . . . . . . . . . . . 162C.2 Company References . . . . . . . . . . . . . . . . . . . . . . . 163


Contents
1 Introduction 11.1 Definition of Terms . . . . . . . . . . . . . . . . . . . . . . . . 11.2 Thesis Description . . . . . . . . . . . . . . . . . . . . . . . . 31.3 Motivation . . . . . . . . . . . . . . . . . . . . . . . . . . . . . 3
1.3.1 Oxidation of Thin Films . . . . . . . . . . . . . . . . . 31.3.2 High Purity Thin Films . . . . . . . . . . . . . . . . . 3
1.4 Building History . . . . . . . . . . . . . . . . . . . . . . . . . 4
2 Ultrahigh Vacuum 72.1 Additional Chapter Definitions . . . . . . . . . . . . . . . . . 72.2 Background . . . . . . . . . . . . . . . . . . . . . . . . . . . . 82.3 Relevant Theory . . . . . . . . . . . . . . . . . . . . . . . . . 9
2.3.1 Ideal Gas Law and Dalton’s Law . . . . . . . . . . . . 92.3.2 Steady State Conditions . . . . . . . . . . . . . . . . . 102.3.3 Dynamic Conditions . . . . . . . . . . . . . . . . . . . 11
2.4 Achieving Ultrahigh Vacuum (UHV) . . . . . . . . . . . . . . 142.4.1 Cleanliness . . . . . . . . . . . . . . . . . . . . . . . . 142.4.2 Bake out . . . . . . . . . . . . . . . . . . . . . . . . . . 152.4.3 Sealing methods . . . . . . . . . . . . . . . . . . . . . . 152.4.4 Material . . . . . . . . . . . . . . . . . . . . . . . . . . 162.4.5 Surface Area . . . . . . . . . . . . . . . . . . . . . . . . 162.4.6 Machining . . . . . . . . . . . . . . . . . . . . . . . . . 172.4.7 Leak Detection . . . . . . . . . . . . . . . . . . . . . . 17
3 In Situ Ellipsometry 193.1 Additional Chapter Definitions . . . . . . . . . . . . . . . . . 193.2 Principle of Ellipsometry . . . . . . . . . . . . . . . . . . . . . 19
3.2.1 Light- Electromagnetic Wave . . . . . . . . . . . . . . 20
vii

3.2.2 Polarized Light . . . . . . . . . . . . . . . . . . . . . . 213.2.3 Measurement . . . . . . . . . . . . . . . . . . . . . . . 223.2.4 Optical Constants . . . . . . . . . . . . . . . . . . . . . 223.2.5 General Experimental Procedures . . . . . . . . . . . . 233.2.6 Advantages . . . . . . . . . . . . . . . . . . . . . . . . 24
3.3 In Situ Ellipsometer . . . . . . . . . . . . . . . . . . . . . . . 243.3.1 Building . . . . . . . . . . . . . . . . . . . . . . . . . . 253.3.2 General M-44r Components . . . . . . . . . . . . . . 253.3.3 In situ M-44r Components . . . . . . . . . . . . . . . 263.3.4 Operation . . . . . . . . . . . . . . . . . . . . . . . . . 273.3.5 Comparison with Ex Situ . . . . . . . . . . . . . . . . 29
4 Vacuum Pumps 314.1 Additional Chapter Definitions . . . . . . . . . . . . . . . . . 314.2 Sorption Pumps . . . . . . . . . . . . . . . . . . . . . . . . . . 32
4.2.1 Advantages . . . . . . . . . . . . . . . . . . . . . . . . 334.2.2 Building . . . . . . . . . . . . . . . . . . . . . . . . . . 334.2.3 Components . . . . . . . . . . . . . . . . . . . . . . . . 354.2.4 Principles of Operation . . . . . . . . . . . . . . . . . . 354.2.5 Operation . . . . . . . . . . . . . . . . . . . . . . . . . 364.2.6 Regeneration . . . . . . . . . . . . . . . . . . . . . . . 38
4.3 Cryopump . . . . . . . . . . . . . . . . . . . . . . . . . . . . . 384.3.1 Components . . . . . . . . . . . . . . . . . . . . . . . . 394.3.2 Principles of Operation . . . . . . . . . . . . . . . . . . 394.3.3 Bonding of Gases . . . . . . . . . . . . . . . . . . . . . 404.3.4 Operation Procedures . . . . . . . . . . . . . . . . . . 424.3.5 Regeneration . . . . . . . . . . . . . . . . . . . . . . . 434.3.6 Assisted Regeneration . . . . . . . . . . . . . . . . . . 44
5 Vacuum Components 475.1 Additional Chapter Definitions . . . . . . . . . . . . . . . . . 475.2 Chamber . . . . . . . . . . . . . . . . . . . . . . . . . . . . . . 485.3 Gate Valve . . . . . . . . . . . . . . . . . . . . . . . . . . . . . 48
5.3.1 Advantages . . . . . . . . . . . . . . . . . . . . . . . . 485.3.2 Building . . . . . . . . . . . . . . . . . . . . . . . . . . 495.3.3 Components and Operation . . . . . . . . . . . . . . . 50
5.4 Gauges . . . . . . . . . . . . . . . . . . . . . . . . . . . . . . . 515.4.1 Thermocouple Gauge . . . . . . . . . . . . . . . . . . . 51
viii

5.4.2 Ion Gauge . . . . . . . . . . . . . . . . . . . . . . . . . 535.4.3 Gauge Controller- senTorrTM . . . . . . . . . . . . . . 54
5.5 Flanges . . . . . . . . . . . . . . . . . . . . . . . . . . . . . . 555.5.1 Conflat (CF) Flanges . . . . . . . . . . . . . . . . . . . 555.5.2 O-ring Fittings . . . . . . . . . . . . . . . . . . . . . . 56
5.6 Bake Out . . . . . . . . . . . . . . . . . . . . . . . . . . . . . 595.6.1 Heating Tapes . . . . . . . . . . . . . . . . . . . . . . . 595.6.2 Power Control . . . . . . . . . . . . . . . . . . . . . . . 605.6.3 Temperature Monitoring . . . . . . . . . . . . . . . . . 615.6.4 Aluminum Foil . . . . . . . . . . . . . . . . . . . . . . 61
5.7 Power Supply Racks . . . . . . . . . . . . . . . . . . . . . . . 615.8 UHV Cleaning . . . . . . . . . . . . . . . . . . . . . . . . . . . 61
5.8.1 Principles and Precautions . . . . . . . . . . . . . . . . 625.8.2 Procedures . . . . . . . . . . . . . . . . . . . . . . . . . 63
6 Deposition 676.1 Additional Chapter Definitions . . . . . . . . . . . . . . . . . 676.2 Sputtering . . . . . . . . . . . . . . . . . . . . . . . . . . . . . 68
6.2.1 Design and Building . . . . . . . . . . . . . . . . . . . 686.2.2 Plasma . . . . . . . . . . . . . . . . . . . . . . . . . . . 696.2.3 Procedures and Principles of Operation . . . . . . . . . 706.2.4 RF Sputtering . . . . . . . . . . . . . . . . . . . . . . . 726.2.5 Magnetron Sputtering . . . . . . . . . . . . . . . . . . 726.2.6 Advantages . . . . . . . . . . . . . . . . . . . . . . . . 73
6.3 Evaporation . . . . . . . . . . . . . . . . . . . . . . . . . . . . 746.3.1 Design and Building . . . . . . . . . . . . . . . . . . . 746.3.2 Principles of Operation . . . . . . . . . . . . . . . . . . 756.3.3 Advantages . . . . . . . . . . . . . . . . . . . . . . . . 75
7 Deposition Control 777.1 Additional Chapter Definitions . . . . . . . . . . . . . . . . . 777.2 Sample Stage . . . . . . . . . . . . . . . . . . . . . . . . . . . 78
7.2.1 Installation . . . . . . . . . . . . . . . . . . . . . . . . 787.3 Shutter . . . . . . . . . . . . . . . . . . . . . . . . . . . . . . . 78
7.3.1 Installation . . . . . . . . . . . . . . . . . . . . . . . . 797.3.2 Usage . . . . . . . . . . . . . . . . . . . . . . . . . . . 79
7.4 Quartz Crystal Monitor . . . . . . . . . . . . . . . . . . . . . 807.4.1 Principle of Operation . . . . . . . . . . . . . . . . . . 81
ix

7.4.2 Usage . . . . . . . . . . . . . . . . . . . . . . . . . . . 827.5 Gas Controls- O2 and Ar . . . . . . . . . . . . . . . . . . . . . 83
7.5.1 O2 Gas line . . . . . . . . . . . . . . . . . . . . . . . . 837.5.2 Ar Gas Line . . . . . . . . . . . . . . . . . . . . . . . . 85
7.6 Temperature Control- Cooling Lines . . . . . . . . . . . . . . . 877.6.1 Operation . . . . . . . . . . . . . . . . . . . . . . . . . 87
8 Measurement and Analysis 898.1 Additional Chapter Definitions . . . . . . . . . . . . . . . . . 898.2 Background . . . . . . . . . . . . . . . . . . . . . . . . . . . . 898.3 Sputtered Ruthenium Thin Film - History . . . . . . . . . . . 908.4 Ruthenium and Ruthenium Oxide Optical Constants . . . . . 93
8.4.1 Initial Optical Constants . . . . . . . . . . . . . . . . . 938.4.2 Improved Optical Constants . . . . . . . . . . . . . . . 93
8.5 Ruthenium Oxidation . . . . . . . . . . . . . . . . . . . . . . . 958.5.1 In High Vacuum . . . . . . . . . . . . . . . . . . . . . 958.5.2 During Argon Backfill of Chamber . . . . . . . . . . . 958.5.3 In Air At Atmospheric Pressure . . . . . . . . . . . . . 968.5.4 First 20-30 Minutes of Exposure . . . . . . . . . . . . . 968.5.5 First 24 Hours of Exposure . . . . . . . . . . . . . . . . 96
8.6 Aftermath . . . . . . . . . . . . . . . . . . . . . . . . . . . . . 978.7 Ruthenium Thin Film Conclusions . . . . . . . . . . . . . . . 97
9 Current Status and Future Enhancements 1019.1 Current Status . . . . . . . . . . . . . . . . . . . . . . . . . . 101
9.1.1 Vacuum Results . . . . . . . . . . . . . . . . . . . . . . 1019.1.2 Deposition Results . . . . . . . . . . . . . . . . . . . . 102
9.2 Future Enhancements . . . . . . . . . . . . . . . . . . . . . . . 1039.2.1 Ultrahigh Vacuum . . . . . . . . . . . . . . . . . . . . 1039.2.2 Component Design . . . . . . . . . . . . . . . . . . . . 105
10 Summary 10710.1 Ruthenium Thin Film . . . . . . . . . . . . . . . . . . . . . . 10710.2 System Capabilities . . . . . . . . . . . . . . . . . . . . . . . . 107
A Standard Operating Procedures 139A.1 Notes . . . . . . . . . . . . . . . . . . . . . . . . . . . . . . . . 139A.2 Vacuum Pump Down . . . . . . . . . . . . . . . . . . . . . . . 140
x
A.2.1 Liquid Nitrogen Dewar . . . . . . . . . . . . . . . . . . 140A.2.2 Roughing Vacuum . . . . . . . . . . . . . . . . . . . . 142A.2.3 Ultrahigh Vacuum . . . . . . . . . . . . . . . . . . . . 145
A.3 Bake Out . . . . . . . . . . . . . . . . . . . . . . . . . . . . . 145A.3.1 Sorption Pumps . . . . . . . . . . . . . . . . . . . . . . 146A.3.2 Cryopump . . . . . . . . . . . . . . . . . . . . . . . . . 147A.3.3 Chamber Body . . . . . . . . . . . . . . . . . . . . . . 149
A.4 Deposition . . . . . . . . . . . . . . . . . . . . . . . . . . . . . 151A.4.1 Sputter Gun- Plasma Formation . . . . . . . . . . . . . 151
B Documentations and Records 155B.1 Cryopump Performance Operating Log . . . . . . . . . . . . . 155B.2 Adhesive Heating Tapes Data . . . . . . . . . . . . . . . . . . 155B.3 Mass Flow Controller- Voltage Display . . . . . . . . . . . . . 155
C Company References 161

Abstract
As current microtechnology advances toward building nanosize componentsfor computers and aerospace devices, oxidation of thin films can have dra-matic effects on the electronic and optical properties of these devices. Inorder to understand optical properties of thin film materials and their oxidesin a high purity environment, we have been building an ultrahigh vacuumdeposition chamber to achieve a base pressure under 10−9 torr. We haveincorporated evaporation and sputtering capabilities for thin film depositionin vacuum, and an in situ ellipsometer to analyze the optical properties andoxidation of the films without exposure to atmosphere. This combined withan oxygen leak allows for control over the amount of oxidation on the films.Ruthenium was initially investigated with the chamber in high vacuum tounderstand initial oxidation of thin films, and the applicability of our cham-ber.


Chapter 1
Introduction
I have been working with a group of five BYU undergraduates, under thedirection of Dr. David Allred, my research advisor, in designing a vacuumsystem for thin film deposition and characterization. In April 2000, we beganbuilding the vacuum system from a stainless steel vacuum chamber bodymade by Varian, Inc. The chamber is designed to achieve UHV (ultrahighvacuum) with a base pressure < 10−9 torr. The system is designed to createthin films by two deposition methods- sputtering and thermal evaporation.Through an oxygen leak valve and an in situ ellipsometer, measurements ofinitial oxidation of thin films can be made. The chamber will allow BYU’sXUV (extreme ultraviolet) Research Group in the Department of Physicsand Astronomy to analyze oxidation rates, measure optical constants, andmodel the oxidation of thin films. Currently the UHV system is placed onthe second floor of the Physics Underground Laboratory of Brigham YoungUniversity. (See Figure 1)
1.1 Definition of Terms
In order to understand the research, some basic definitions are given. Addi-tional terms used in later chapters will be included under the proper chapterheading.
Chamber Port The opening or arm extending out from the main chamberbody. Devices used inside the vacuum chamber are usually mountedon the ports.
1

2 CHAPTER 1. INTRODUCTION
Deposition Act of depositing material onto a surface, hence creating a thinfilm layer.
Ellipsometry Technique of measuring optical properties of film by reflectingpolarized light off of the film. Measurement of reflection, transmission,optical constants, and thickness of layers can be determined.
Evaporation Deposition of material onto film substrate by using boats(usually metal plates with high resistance) to thermally heat and ‘evap-orate’ the material.
Flange Metal plate that provides sealing of any open ports of the chamber.
HV (High Vacuum) Base pressure less than 1 × 10⁻³ torr, and greaterthan 10−9 torr.(Atmospheric pressure is 7.6× 10+2 torr.)
In situ Measurement inside the chamber while under vacuum.
Optical Constants Constants that describe the behavior of light inside agiven material. It is a complex number that relates the speed of lightin vacuum (c = 3.0× 10⁸ m
sec) to the speed of light in the material, andspecifies the rate of absorption.
Reflectance The amount of light that reflects off an optical film in relationto the amount of light initially emitted.
Sputtering Deposition of material onto film substrate by bombarding pos-itive ions onto the material, and physically removing atoms from thematerial.
Substrate The underlying surface layer on which material will be depositedto create a thin film.
Transmission The amount of light that passes through an optical film inrelation to the amount of light initially emitted.
UHV (Ultrahigh Vacuum) Base pressure less than 10−9 torr.

1.2. THESIS DESCRIPTION 3
1.2 Thesis Description
My research goal is two fold. First, to build a UHV chamber with in situellipsometry, sputtering, and evaporation capabilities. Second, to study thinfilms by measuring and developing models for thin film oxidation.
A ruthenium thin film of Ru thickness ≈ 243A was created in high vac-uum. (in the 1×10⁻⁷−1×10⁻⁶ torr range) In situ ellipsometric measurementsto analyze oxidation rates, and to improve optical constants for rutheniumthin films was made and analyzed.
1.3 Motivation
1.3.1 Oxidation of Thin Films
The motivation behind building a UHV deposition chamber with an in situellisometer is primarily to understand oxidation. From a computer model ofa thin film of silicon oxide on a silicon film, (See Figure 2), it can be seenthat reflectance of a silicon film can vary from 70% to below 5% dependingon the amount of initial oxidation. In the micro-electronic industry wherenano-scale effects of electro-optical films are important, such difference inreflectance alone can have dramatic effects on devices.
Films begin to oxidize immediately as soon as they are taken out of thevacuum chamber in which they are created. Traditionally at BYU, thesefilms were taken out of the chamber and measured by an ellipsometer inatmospheric air. The very initial oxidation of films could not be measured orstudied because the film had already oxidized some before any measurementscould be made. In the new chamber we will be able to measure, with in situellipsometry, the oxidation and optical properties of thin films as they arecreated and from the time they begin to oxidize, without removing the film.
1.3.2 High Purity Thin Films
A UHV chamber will allow 100 - 10,000 times better vacuum than all but afew vacuum chambers at BYU. Most of the vacuum chambers at BYU arecurrently HV (high vacuum) chambers, which have a base pressure of about1× 10−6 torr.
The base pressure of a vacuum system is proportional to the number ofgas molecules in the system. Because of the presence of these gas molecules,
4 CHAPTER 1. INTRODUCTION
deposition onto a film occurs naturally even in vacuum. For example, afilm can still oxidize in vacuum over a period of time. At HV vacuum, onelayer of gaseous atoms impact onto the surface of the film every second. InUHV, for one layer of gas to deposit onto the film, it will take longer than1000 seconds. This also reduces the amount of oxygen molecules bindingonto the film surface, hence reducing the oxidation rate inside the chambertremendously. Thus, through UHV vacuum, high purity films with littleoxidation may be created.
1.4 Building History
In building our UHV chamber, I have worked with a total of five BYU un-dergraduates who were part of Dr. Allred’s ‘Building Group.’ These five areAaron Fox, J.J. Warriner, Greg Harris, Zach Barton, and Bryan Schramm.Detailed description and definition of most of the components we built areprovided in later chapters of the thesis.
During the summer of 2000, from April to August, Aaron Fox, a me-chanical engineering major, and I began the project. He and I completedmost of the overall design and mechanisms for the vacuum system. For thevacuum pumping mechanism, we designed it using two sorption pumps inparallel, along with the cryopump, and the positioning of the gate valve androughing line valves. For the deposition system, we required the sputter gunto be placed at the bottom of the chamber, and contemplated using a bellowwith a linear motion guide for a 3 boat evaporator. The ports for argonand oxygen gas lines, the crystal monitor, thermocouple gauges, and the insitu ellipsometer were also determined for the initial stage. We sent in thecryopump to be fixed to full capacity, and ordered two sorption pumps anddewers, con-flat flanges, electrical feedthrough for the evaporator, and thesputter gun from US Inc.
From September 2000, for all of Fall semester and most of Winter semester,J.J. Warriner and Greg Harris helped me in finalizing our design, improvingour components, and the actual building and assembling of necessary compo-nents. Several changes were made for the final design of the vacuum system.I oversaw the design and mechanism of each component, cleaning of parts,and the precautions necessary to obtain a UHV vacuum system. J.J. andGreg built many of the parts and accomplished much of the connections andpractical workings to allow the system to function.
1.4. BUILDING HISTORY 5
J.J. built the sample stage and with Greg he designed the shutter systemto protect the film substrate. J.J. also set up the argon and oxygen gas lineswith appropriate gas valves, and built the voltage reader for the argon massflow controller. He installed the air lines and the connections for the watercooling lines, as well as the operation of the pneumatic gate valve with asolenoid and an electrical switch.
The evaporator was designed to be at fixed position without any linearmotion, and with an optional shield to protect the sputter gun that it wouldsit above. Greg built the main structure of the 3-boat evaporator with thecopper lines. He also provided connections for and obtained the power sup-plies for both the sputter gun and the evaporator with the help of ScottDaniel in the department. Greg designed and built the heating system forthe chamber bake-out and provided the steel support for the gate-valve andthe cryopump.
All necessary parts were ordered, including the crystal monitor, thermo-couple gauge, copper gaskets and o-rings, sieve materials for the sorptionpumps, and additional flanges. All necessary parts inside the chamber wereinspected, cleaned, reassembled, and installed by myself to ensure UHV com-patibility.
Beginning in January 2001, Zach and Bryan joined our group. Zachfinished the shields for the evaporator and provided connections for the watercooling system. Bryan completed the building of the shutter and the bake-outsystem for the cryopump.
Even after more than a year of designing and building by our group,there remains improvements to our system, as well as additional vacuumcomponents to be installed. However, we have been able to construct aworking vacuum system with all the basic and necessary components forthin film deposition and in situ ellipsometric analysis.

6 CHAPTER 1. INTRODUCTION

Chapter 2
Ultrahigh Vacuum
2.1 Additional Chapter Definitions
Bake out Method of eliminating gas molecules on surfaces by thermallyheating, or ‘baking out’ the surface to high temperatures. Increasedthermal energy provides gas molecules energy to leave the surface.
Conflat (CF) Vacuum sealing method that uses a gasket in between twoknife-edge surfaces to provide the seal. The gasket used is usuallycopper shaped as a washer. (Refer to Figure 4)
Gasket Any material, usually in the shape of a ring or a washer, that ispressed against to provide sealing.
High Vacuum Pump Pump used to obtain high vacuum pressure or below(< 10−3 torr).
Leak Detection Testing to detect leaks in a vacuum system.
Outgassing The action of gas molecules leaving the walls and componentsinside the vacuum chamber, when under vacuum.
Partial Pressure The pressure of a particular type of gas, excluding thepressure of all other types of gases in the system.
Roughing Pressure ranging from atmospheric pressure down to 1 × 10⁻³
torr. This is the pressure range that must be achieved by a roughingpump before any high vacuum pumps usually can be operated.
7

8 CHAPTER 2. ULTRAHIGH VACUUM
Roughing Pump Pump used to obtain roughing pressures (atmosphericpressure down to 10−3 torr).
Seize The fusing with other parts as a result of high pressure or high tem-perature.
Virtual Leak Leak from a trapped pocket of air or contaminants, inside ofa vacuum system. The leak is not from a source outside the vacuumsystem, hence it is called a ‘virtual leak.’
2.2 Background
Ultrahigh vacuum has been defined as base pressures below 10−9 torr. Priorto 1950, there were no known methods of measuring such pressure, althoughthere are indications of some UHV achievements by experimenters. In 1950Bayard and Alpert were able to produce an ionization gauge that could mea-sure UHV pressures down to 1 × 10⁻¹⁰ torr relatively easy. With simplemeans of pressure measurement, UHV technology and equipment developedand became readily available by the 1960’s.[1]
There are about 3 × 10¹⁹ molecules/cm3 at atmospheric pressure (760torr). In UHV this would be reduced by ∼ 12 orders of magnitude or to ∼ 3×10⁷ molecules/cm3. Comparisons with the vacuum in space are helpful. Thepressure at the midpoint between the earth and the moon is ∼ 1×10⁻¹⁴ torr,and outside of the solar system, into interstellar space, the pressure drops to∼ 1 × 10⁻¹⁶ torr (∼ 3 molecules/cm3). Each order of magnitude decreasein pressure corresponds to an order of magnitude decrease in molecules inthe volume. Although there are researchers with vacuum systems achievingpressures in the 1 × 10⁻¹³ torr range, for most industrial and experimentalapplications the purity and reliability of measurements in 1×10⁻¹⁰ torr rangeseem sufficient.[2]
Various interactions are involved within a chamber under vacuum, in-cluding the chamber walls themselves. Some of these include molecule-molecule, molecule-surface interactions, charged particle interactions withsurfaces, scattering by projectiles with various energies, and in some casesradiation. Theoretical modelling and experiments have been conducted tounderstand these interactions in detail using thermodynamics, classical me-chanical behaviors, and analysis of their respective energy and potentials.
2.3. RELEVANT THEORY 9
Detailed theoretical treatment can be found in The Physical Basis of Ultra-high Vacuum.[1]
This chapter is an overview of some of the known theories, facts, anddesign practices of ultrahigh vacuum systems.
2.3 Relevant Theory
2.3.1 Ideal Gas Law and Dalton’s Law
In a vacuum chamber, there are many atoms and molecules in the gas phaseinteracting with each other. Most of these gases are those from atmosphericair, consisting of N2, O2, H2, water vapor, and others. The behavior of gasmolecules in a vacuum can be understood through the ideal gas law. Therelationship between pressure, p, volume, V , number of molecules, N , andtemperature, T , can be written as:
pV = NkBT, or (2.1)p = nkBT (2.2)
,where n = NV is the number of molecules per volume of gas, the molecular
number density, and kB = 1.38× 10⁻²³ JK is Boltzmann’s constant. Since in
most vacuum systems, the volume of the chamber or components are fixed,Equation 2.2 will be preferred in this thesis.
Another important equation is Dalton’s Law which states that the totalpressure of a mixture of gases, is the sum of the partial pressure of each gas:
pT =∑
i
pi (2.3)
The summation index i is for each species of gas.According to these two equations, the pressure inside a chamber due to
a mixture of gases is proportional to the number of molecules in the volumeconsidered, and to the temperature. Thus, there are at least two methods toreduce the pressure inside a vacuum chamber:
1. Reduce the number of gas molecules inside the chamber, by removingthe gas from the chamber.
2. Reduce the temperature.
10 CHAPTER 2. ULTRAHIGH VACUUM
There is a reason why ‘reducing the pressure’ was considered, over ‘re-ducing the number of molecules.’ Although the ultimate goal in a vacuumsystem is to reduce, if not eliminate, the number of gas molecules, this is notthe practical solution. Materials in vacuum chambers outgas at certain ratesthat decrease as they are pumped down over time. In order to compensatefor these outgas rates and to vacuum the chamber down from higher basepressure, the vacuum pumps need to pump faster. Thus, high pumping speedis essential to achieve low vacuum. ‘Pressure’ can also be thought as the ki-netic energy or the speed of the gas molecules inside the chamber. Thus, byreducing the ‘pressure’, the pumping speed of the vacuum pump is increasedrelatively, and hence the vacuum is improved.
2.3.2 Steady State Conditions
Achieving low vacuum is possible by reducing the pressure of the system.The partial pressure of an ideal gas in a vacuum system at steady state isgiven by:[2]
pi =∑
Qi∑
Si(2.4)
where
pi = Equilibrium pressure in system of species i.
Qi = Outgassing rate from all sources in system of species i. This is depen-dent on the material type and proportional to the surface area of eachoutgassing source.
Si = Pumping speed from all sources for species i. It is the volume of gasthat flows past a reference point per unit time.
In essence, to minimize pi, the pumping speed for the particular gasshould be maximized and the outgassing rate by the gas must be minimized.Pumping speed can be maximized by acquiring effective vacuum pumps thatcan be very expensive. In most cases, this is limited due to funding and avail-ability, hence vacuum systems are usually designed to work with availablevacuum pumps. So most designers of vacuum systems attempt to minimizethe outgassing rates of materials and components inside the chamber, be-cause over this is what they have most control.
2.3. RELEVANT THEORY 11
2.3.3 Dynamic Conditions
The dynamic conditions require analysis of vacuum phenomena in relationto time. This would require analysis of vacuum pressure and molecular in-teractions in relation to the energy and momentum inherent in the systemand of the gas molecules. This section will only analyze some useful rulesand surface interactions under vacuum.
Useful Rules
Ronald Outlaw, in UHV Design and Practices[2], provides some rules ofthumb that are readily derived and used for understanding the basic dynam-ics of vacuum systems.
Gas Number Density The number of ideal gas molecules in unit volumeat a given pressure. It is directly proportional to pressure.
ηp ∼ 3× 10¹⁶ molecules/cm3/torr (2.5)
Surface Density The average number of atoms on a solid ordered surfacein unit surface area. This is approximately how many atoms are on athin film surface.
ρs ∼ 1× 10¹⁵ atoms/cm2 (2.6)
Bulk Density The average density of atoms in an ordered solid bulk.
ρ ∼ 2× 10²² atoms/cm3 (2.7)
Incident Flux The number of incident gas molecules on a unit cross-sectionalarea at 20oC. This is directly proportional to the pressure.
Ia ∼ 1× 10¹⁵ molecules/sec/cm2 at 1× 10⁻⁶ torr (2.8)
or using the surface density rule (2.6),
I ∼ 1 monolayer/sec at 1× 10⁻⁶ torr (2.9)

12 CHAPTER 2. ULTRAHIGH VACUUM
Rule 2.9 is very useful for understanding dynamic vacuum conditions. Forthin film depositions, the flux I represents the number of gas molecules thatcan contaminate or oxidize the outer layer of film per unit time. Since I isdirectly proportional to pressure, lower pressure implies lower I, hence lesschance for contamination or oxidation. With this rule it is easy to see that for1×10−9 torr, which is the high end of UHV pressure, I ∼ 1
1000 monolayer/sec.Thus at UHV pressure, on average it takes many minutes or hours for onelayer of gas to form on a surface of thin film, compared to the seconds ittakes to form in HV.
Surface Interactions
There are various molecule-surface interactions involved in vacuum systemsthat affect the outgassing rate of gas molecules. In order to minimize outgasrates it is helpful to understand the mechanisms behind molecule-surfaceinteractions. A short list of some of the main interactions are describedbelow.[2]
Adsorption The bonding of atoms and molecules to a surface. There aretwo types- physisorption and chemisorption. In most cases the surfaceis affected by both physisorption and chemisorption.
Physisorption Physical bonding without exchange of electrons. Char-acterized by van der Waal’s forces. In general the bonding forceis weak enough to be overcome by increasing the temperature ofthe surface.Example) Dipole-dipole interactions such as water molecules ad-sorbed into stainless steel walls.
Chemisorption Chemical bonding with a reactive surface throughelectron transfer (ionic bonding) or electron sharing covalent bond-ing. The resulting bonding force is strong enough to result in along residence time, the time that the molecules stay bonded tothe surface.Example) Metal oxidation of surface walls.
Desorption The emission of surface adsorbed molecules or atoms back intothe gas phase of the vacuum space. These gases may be emitted intactor may form a new molecule at the surface and then be emitted. Thisprocess is usually considered as outgassing.

2.3. RELEVANT THEORY 13
Desorption can be separated into two conditions- baked and unbaked.Baking a system at high temperatures removes much of the physicallyadsorbed layer. So in a baked system most of the desorption comes fromthe chemisorbed molecules that were not removed during bake out. Onthe other hand, in an unbaked system the desorption comes mostlyfrom the physically adsorbed layer which lies on top of a chemisorbedlayer.
Absorption The subsequent dissolution of gases into the bulk surface afteradsorption takes place. The dissolution depends on the solubility ofthe gas.
In general hydrogen is very conducive to absorption because its smallsize allows hydrogen to fit well in the lattice of all metals and moveeasily from site to site in the bulk. Hydrogen however does not diffuseeasily through glass. OH molecules on the other hand fit more readilyin the open structure of amorphous solid like glass. Helium is also wellknown to dissolve into the lattice and move through a concentrationgradient in glass systems. He transport mechanism is primarily due tono chemical bonding at the relatively large and open sites.
Permeation The movement of gases from high density side of a solid barrier,through the solid, and to the low density side of the solid barrier.Usually there is very small permeation of gases from atmosphere (highdensity) to the inside (low density) of the vacuum chamber. Permeationdoes play a significant role when a pressure of 1×10⁻¹² torr is achievedor when o-rings are used. This is due to the large difference in pressurefrom one side of the barrier to the other side, or because of the relativelyporous polymers that make up o-rings.
Ultimate Versus Operational Pressure
The ultimate pressure is the steady state pressure achieved after a vacuumsystem is pumped down. This pressure is usually the lowest pressure achievedby the system and is often used when describing the pressure of a givenvacuum chamber. When vacuum pressure of our UHV chamber is describedin this thesis, ultimate pressure is implied.
When a system is actually in operation, and all the appropriate toolsare operating, the actual pressure of the chamber usually increases. This
14 CHAPTER 2. ULTRAHIGH VACUUM
is the operational pressure of the vacuum system. For example when theion gauge, evaporator, or the sputter gun is on, contaminants from thesedevices are emitted into the vacuum space, and hence the pressure rises.Also the location of the gauge that measures the chamber pressure may belocated close to the pump, hence will not be able to measure the pressure ofthe actual process.[2] In order to understand the vacuum environment of agiven process, it is important to realize these facts of operational pressure incomparison to the tolerance level of the process.
2.4 Achieving Ultrahigh Vacuum (UHV)
Achieving HV (high vacuum) is very routine in terms of conventional vacuumtechnology. However, to achieve UHV requires much care and planning.Some of the major issues involved with achieving UHV will be listed in thissection. (Refer to Figure 3)
2.4.1 Cleanliness
No oil must be inside the chamber. Vacuum oil for o-rings must be minimallyapplied. A thumbprint can jeopardize achieving UHV altogether.
Cleaning agents must be used. Use reagent or purer type to avoid con-tamination from the cleaning agents themselves. Hexane or acetone is firstused to eliminate oil, and then methanol is used to remove any debris thathexane or acetone may leave. Hexane is usually stronger at eliminating oilthan acetone. When cleaning, be sure to wear nitrile gloves (or other specialgloves that provide adequate protection), especially when using hexane oracetone. It is a good practice to wear a pair of disposable latex or vinylgloves underneath the nitrile gloves, so as to provide additional precautionsfor cleanliness.
Parts that are cleaned should be placed on a new sheet of Kimwipesr
from Kimberly-Clarkr, or similar delicate wipes. Clean aluminum foil un-derneath the sheet of Kimwipes is also useful. If storing the clean parts,ensure that they are covered with Kimwipes and aluminum foil and storedaway.
It is important to recognize that whatever someone has touched withhis/her skin or clothes is also a source of oil or dirt. Touching such areaseven with gloves can contaminate the gloves. In such cases, the gloves should
2.4. ACHIEVING ULTRAHIGH VACUUM (UHV) 15
either be cleaned or replaced before using the gloves to touch parts that willgo inside the vacuum chamber. It is always better to be sure and safe insteadof compromising the system with questionably clean parts.
2.4.2 Bake out
Chamber walls, screws, any parts, and any material inside the chamber aresources of outgassing. They are similar to sponges that soak up air whenexposed to atmosphere. In order to facilitate quick degassing of these com-ponents, baking out the chamber to temperatures above 150 oC (in our case,above 250 oC) is recommended. The temperature should be increased ordecreased at no more than about 20-25oC per hour to prevent the strainingof the components of the vacuum system. The bake out temperature of thesystem should be as high as the system can handle. This is because thereare almost always gases that degas better at higher temperatures than lowertemperatures. The bake-out is to be done continuously for three to four daysunder vacuum, with a roughing pump pumping out the gas. This allows forefficient degassing of water and hydrogen vapors.
Because of the high temperatures that a vacuum system may be bakedout, the screws and nuts may seize to each other or to the screw holes inthe flanges. To prevent the seizing, anti-seize lubricants should be used onthe threads of the screws for flanges that are baked out. The lubricant usedin our chamber is a Permatex anti-seize lubricant that protect metals fromseizing, galling, and corrosion for temperatures in -65 - 1600 oF (-55 - 870oC).
It is important to only use a thin film of anti-seize lubricant. Also glovesshould be worn and care should be taken as the anti-seize lubricant candamage both the skin and clothes upon contact. Because the lubricant onthe screws may be wiped on the inside of the vacuum chamber when installinga flange or taking the flange off, care should be taken to avoid this and cleanthe affected areas with acetone (acetone seems to work better than hexanefor anti-seize lubricant) and methanol.
2.4.3 Sealing methods
It is important to minimize, if not eliminate, any o-rings or polymers. Toseal the chamber from atmosphere, use of metal-to-metal seals is necessary,such as using conflat flanges.

16 CHAPTER 2. ULTRAHIGH VACUUM
2.4.4 Material
All materials inside the chamber should provide minimal outgassing, includ-ing at bake-out temperatures. Materials that have low outgas rates are nec-essary to achieve UHV.
Examples of materials that should be avoided in vacuum systems are cad-mium and zinc. Examples of materials with low outgas rates are aluminum,and stainless steel. Any components or device used inside the UHV partof the vacuum system should be made exclusively of aluminum or stainlesssteel, or other materials with low outgas rates that are safe for vacuum usage.This includes all the metal components such as bolts, nuts, and washers.
A very useful method of determining whether a metal is stainless steel isto use a magnet. If the metal is magnetic, then the metal is not stainlesssteel, and if it is not magnetic there is a high probability that it is stainlesssteel.
2.4.5 Surface Area
All surface areas are sources of outgassing. Smaller total surface area insidea vacuum system allows for less outgassing. The surface area of all thecomponents should be minimized, as much as it does not hinder the efficiencyof the operation and construction of the component.
Electrochemical Polishing
Surface area can be minimized by creating clean surfaces. Polishing the sur-face is also very helpful. Electrochemical polishing, or commonly ‘electropol-ishing,’ is one of the most efficient methods to polish metal surfaces for vac-uum systems. Electrochemical polishing employs an electric field to improvethe selective removal of peaks and protuberances on surfaces. Generally, themetal to be polished is immersed in an electrolyte at some distance awayfrom the cathode electrode. Electric field lines are concentrated at the peaksof the surface, and preferentially the metal from these peaks dissolve intosolution. It is by far the best way to reduce the surface area, establish a uni-form oxide layer, and provide the maximum passivation of the surface. Thefinal oxide surface has minimum defects that minimize the diffusion pathsfrom the bulk metal to the vacuum space, hence reducing outgassing.[2] Themain disadvantage of electrochemical polishing is that it is very expensive to

2.4. ACHIEVING ULTRAHIGH VACUUM (UHV) 17
implement, usually requiring the surface that needs polishing to be sent into be professionally electropolished.
2.4.6 Machining
When machining components that will be used inside the chamber, muchcare to reduce the surface area and provide a vacuum-tight seal should begiven. Machining of parts by inert gas welding or vacuum brazing is required.
When metals are pressed against each other, space between the two sur-faces can cause a virtual leak. This is apparent when a screw is screwedinside a metal surface. Usually there is a small pocket of air between theend of the screw and the bottom of the screw hole inside the metal piece.This pocket of air is a source of ‘virtual leak,’ because it provides a sourcefor air to enter into the vacuum system. To eliminate this virtual leak, holesthat go all the way through the screws can be drilled. It is important toensure that no virtual leaks are created by way of design or construction ofthe components inside the vacuum system.
2.4.7 Leak Detection
Perhaps the most challenging yet important method in achieving UHV is toproperly conduct a leak detection test. If the ultimate pressure (< 1× 10⁻⁹
torr for a UHV system) cannot be achieved, or when the rate of pressure riseis greater than the normal outgassing rate of the system (there are variousmethods of determining this and can be looked up in most vacuum systemliteratures), it is probable that there is a vacuum leak in the system.
Procedures
(Joseph Young, the vacuum expert in the Department of Physics and Astron-omy, is very knowledgable and experienced in detecting vacuum leaks andshould be consulted for more practical information, directions, and help.)
1. Leak detection must be done carefully so as not to contaminate thealready UHV clean system. If any area has been contaminated throughthe test, then the area(s) should be noted and cleaned appropriately.
18 CHAPTER 2. ULTRAHIGH VACUUM
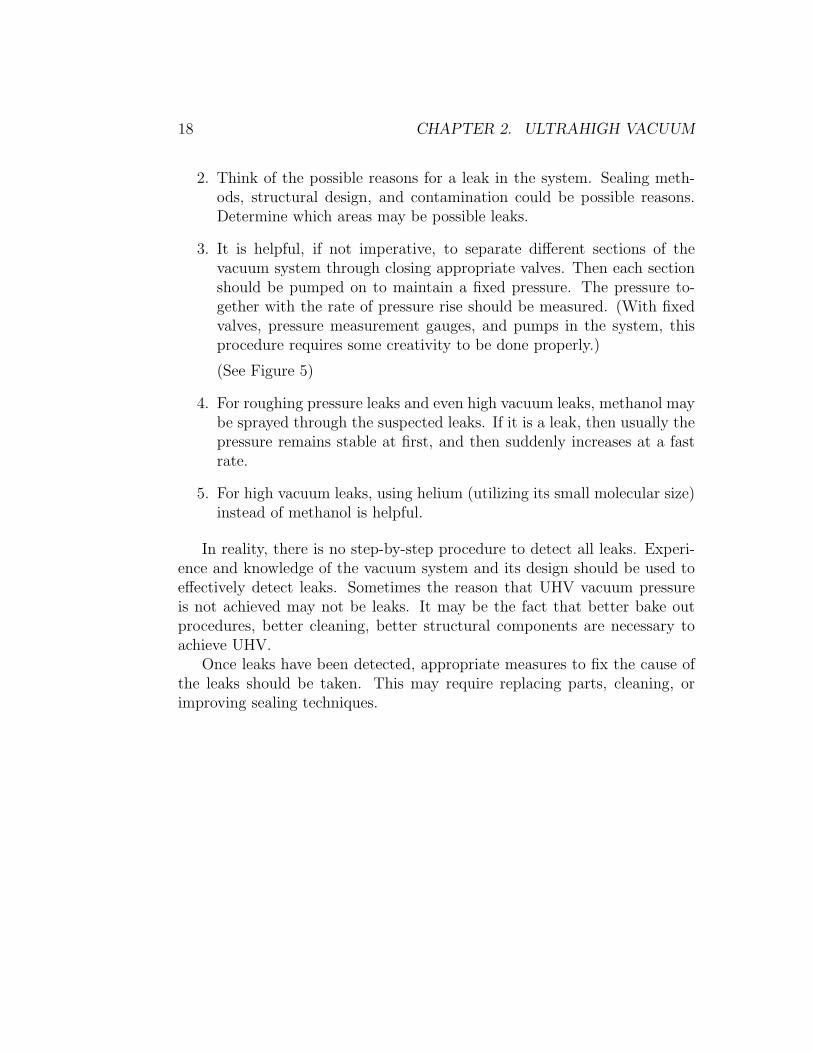
2. Think of the possible reasons for a leak in the system. Sealing meth-ods, structural design, and contamination could be possible reasons.Determine which areas may be possible leaks.
3. It is helpful, if not imperative, to separate different sections of thevacuum system through closing appropriate valves. Then each sectionshould be pumped on to maintain a fixed pressure. The pressure to-gether with the rate of pressure rise should be measured. (With fixedvalves, pressure measurement gauges, and pumps in the system, thisprocedure requires some creativity to be done properly.)
(See Figure 5)
4. For roughing pressure leaks and even high vacuum leaks, methanol maybe sprayed through the suspected leaks. If it is a leak, then usually thepressure remains stable at first, and then suddenly increases at a fastrate.
5. For high vacuum leaks, using helium (utilizing its small molecular size)instead of methanol is helpful.
In reality, there is no step-by-step procedure to detect all leaks. Experi-ence and knowledge of the vacuum system and its design should be used toeffectively detect leaks. Sometimes the reason that UHV vacuum pressureis not achieved may not be leaks. It may be the fact that better bake outprocedures, better cleaning, better structural components are necessary toachieve UHV.
Once leaks have been detected, appropriate measures to fix the cause ofthe leaks should be taken. This may require replacing parts, cleaning, orimproving sealing techniques.

Chapter 3
In Situ Ellipsometry
3.1 Additional Chapter Definitions
Ex situ Ellipsometry Ellipsometry conducted outside of the original en-vironment in which the sample was created.
Incident Angle The angle at which the light beam or wave reflects fromthe sample surface. (See Figure 6)
Incident Wave The original wave that is emitted to a surface, before anyreflection or transmission occurs.
Plane of Incidence The plane containing the incident and reflected beamsand the plane that is perpendicular to the sample surface. (See Fig-ure 6)
Propagation The movement or travelling of an electromagnetic wave in acertain direction.
Viewport Port used to view the inside of the chamber.
3.2 Principle of Ellipsometry
An ellipsometer emits polarized light from its input unit, or light source, andreflects the light at one of several angles off the surface of the film to bemeasured. The optical properties and thicknesses of the different layers inthe film will change the polarization of the incident light that was emitted.
19
20 CHAPTER 3. IN SITU ELLIPSOMETRY
The changed light is reflected and then received by the output unit, or thedetector and analyzer, of the ellipsometer, and in turn is measured by theellipsometer. Using a computer program such as that developed by J.A.Woollam Co., Inc., the measured data for various samples and angles can beprocessed to generate optical constants, reflectance, transmission, oxidation,and thicknesses of the different materials composing the film. (See Figure 7)
3.2.1 Light- Electromagnetic Wave
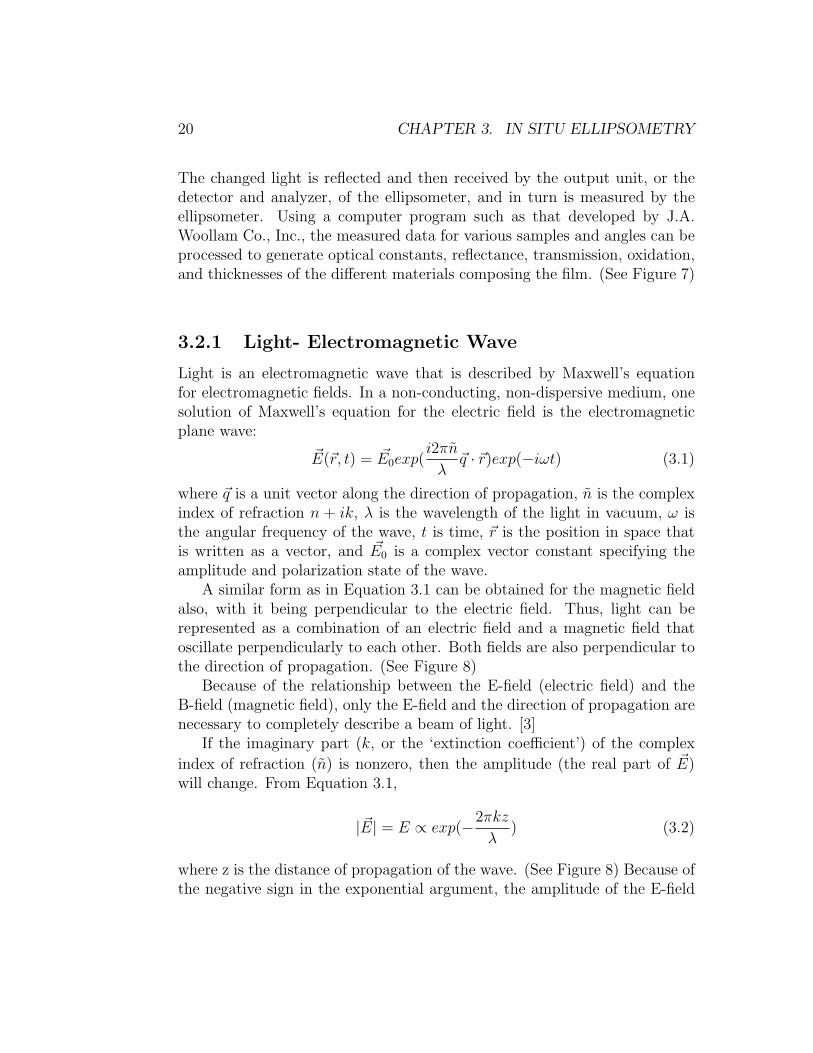
Light is an electromagnetic wave that is described by Maxwell’s equationfor electromagnetic fields. In a non-conducting, non-dispersive medium, onesolution of Maxwell’s equation for the electric field is the electromagneticplane wave:
~E(~r, t) = ~E0exp(i2πn
λ~q · ~r)exp(−iωt) (3.1)
where ~q is a unit vector along the direction of propagation, n is the complexindex of refraction n + ik, λ is the wavelength of the light in vacuum, ω isthe angular frequency of the wave, t is time, ~r is the position in space thatis written as a vector, and ~E0 is a complex vector constant specifying theamplitude and polarization state of the wave.
A similar form as in Equation 3.1 can be obtained for the magnetic fieldalso, with it being perpendicular to the electric field. Thus, light can berepresented as a combination of an electric field and a magnetic field thatoscillate perpendicularly to each other. Both fields are also perpendicular tothe direction of propagation. (See Figure 8)
Because of the relationship between the E-field (electric field) and theB-field (magnetic field), only the E-field and the direction of propagation arenecessary to completely describe a beam of light. [3]
If the imaginary part (k, or the ‘extinction coefficient’) of the complexindex of refraction (n) is nonzero, then the amplitude (the real part of ~E)will change. From Equation 3.1,
| ~E| = E ∝ exp(−2πkzλ
) (3.2)
where z is the distance of propagation of the wave. (See Figure 8) Because ofthe negative sign in the exponential argument, the amplitude of the E-field

3.2. PRINCIPLE OF ELLIPSOMETRY 21
will decay as z increases. This implies that as the E-field travels through anabsorbing medium, it will become weaker.
The distance, DP , known as the penetration depth is the distance thewave travels before it decays 1/e from its original amplitude:
DP =λ
2πk(3.3)
The penetration depth is an important concept in ellipsometry, as manymaterials exhibit large extinction coefficients such that a light beam mayonly penetrate a few tens of nm (10−9m) or less. No information can begained from a sample unless the light beam penetrates it sufficiently andthen is able to reflect back out of the sample. This is why typically it isimpossible to measure the thickness of metal films greater than about 50 nmthick with an ellipsometer.[3]
3.2.2 Polarized Light
The electric field described in Section 3.2.1, on page 20, lies on a planeperpendicular to the direction of beam propagation. Convention has createdtwo directions when describing the reflection and transmission of light relativeto a surface. The p-direction is defined as lying on the plane of incidence. Thes-direction (from Senkrecht, German for perpendicular) lies perpendicular tothe p-direction such that the p-direction, s-direction, and the direction ofpropagation (in the same order) define a right-handed Cartesian coordinatesystem. (See Figure 6)[3]
Both p- and s- directions are used to represent the polarization statesof an electromagnetic wave. The electric field can be defined using the p-direction and the s-direction since they form orthogonal vectors:
~E =[
Ep
Es
]
(3.4)
A beam of light reflected from a surface can be written in terms of thecomponent of the light lying in the p- and s- directions, similar to Equa-tion 3.4. Ellipsometry ultimately compares these two components, the po-larization of the light to analyze the optical properties of the reflected (oreven transmitted) surface.

22 CHAPTER 3. IN SITU ELLIPSOMETRY
3.2.3 Measurement
An ellipsometer measures the change in polarization state of the light re-flected from the surface of a sample film. This sample film can be consideredas an ‘optical system’ that modifies the polarization state of the beam oflight.
The actual values measured are expressed as psi (Ψ) and delta (∆). Thesevalues are related to the ratio of the Fresnel reflection coefficients Rp and Rs
for p- and s- polarized light respectively.[3]
ρ =Rp
Rs= tan(Ψ)ei∆ (3.5)
Rp and Rs represent the complex valued reflections for p- and s- polarizedlight respectively. From Equation 3.5, it can be seen that Ψ and ∆ correspondto the amplitude and phase of ρ. By measuring Ψ and ∆ and fitting a modelto it, the optical properties of a material can be deduced using a computerprogram. We use a WVASE32TM software by J.A. Woollam Co., Inc.
3.2.4 Optical Constants
Ellipsometry can determine thin film thicknesses, optical constants, and inmany cases both thickness and optical constants of the same film. Ellip-sometry has also proven to be a valuable technique in determining opticalconstants in the near-UV, visible, and near-IR wavelength ranges.[3]
Optical constants are important in understanding the optical propertiesof the material. They vary over differing wavelengths of light propagatingthrough the material. The optical constant can be represented as a complexindex of refraction, n = n + ik. The real part n corresponds to the speedof light inside the material compared to the speed of light in vacuum. Theimaginary part k corresponds to the amount of light absorbed through thematerial as the light passes through it.
Optical constants are especially important in ellipsometry. By using thecorrect optical constants over a range of wavelengths, an accurate and precisemodel of the sample film can be developed. (Section 3.2.5 on page 23) Thisallows accurate film thicknesses to be obtained by the ellipsometer. However,an ellipsometer can also obtain optical constants of a material. The accu-racy of such constants depend on how many unknown variables there werewhen fitting for the constants. (Section 3.2.5 on page 23) For example, if the

3.2. PRINCIPLE OF ELLIPSOMETRY 23
thicknesses of each film layer was measured accurately by x-ray diffraction,then these thicknesses can be entered into the WVASE, and the optical con-stants can be fitted for these known values. The resulting optical constantscould then be considered to be reasonably correct. Although it is possible todetermine both optical constants and thicknesses, doing so would not yieldhighly reliable results as these two properties tend to be strongly correlated.(Section 3.2.5 on page 24)
3.2.5 General Experimental Procedures
Optical experiments never directly measure the sample parameters of in-terest (thickness, optical constants, and others), rather they measure somequantity that is a function of the parameters of interest. J.A. Woollam Co.,Inc.[3] suggests four steps in conducting an optical experiment. These arethe basic steps that our ellipsometer uses to obtain optical constants and filmthicknesses.
Measurement
The parameters of interest (film thickness, optical constants, etc.) must bedetermined. Determine the optical quantities that can actually be measured(reflectance, transmission, Ψ, ∆), from which the parameters of interest canbe derived. Then devise an optical experiment and measure beam intensities(reflectance and transmission) or polarization states (Ψ, ∆), possibly as func-tions of the light beam wavelength, angle of incidence, and/or polarizationstates.
Model Development
Construct an accurate model from which we can predict what we shouldmeasure from a sample with known properties. The model should containsome known parameters, such as the incident wavelength, incident polariza-tion state, and the incident angle. It should also include unknown physicalparameters, such as layer thickness and optical constants.
Fitting of Model
The unknown physical parameters can then be varied and the known param-eters can be calculated from the model, until they closely match the actual

24 CHAPTER 3. IN SITU ELLIPSOMETRY
known parameters. The goal is for the model to be accurate enough, thatthrough this process of fitting to the known parameters, the true values of thephysical parameters are obtained. WVASE uses the Levenberg-Marquardtmultivariate regression algorithm.
Evaluation for Best-fit
The best-fit set of physical parameters must be determined to be parametersthat are unique, physically reasonable, and not strongly correlated. If thesecriteria are met, then the best-fit model probably represents the physicalreality of the sample reasonably well. Statistics can also be used to evaluatethe accuracy and precision of the fit results.
3.2.6 Advantages
Ellipsometry is very sensitive for thin film measurements. The sensitivityis actually greater than a simple reflectance measurement. The sensitivityof an ellipsometer is derived from determining the relative phase change (∆from Equation 3.5) of the beam of reflected polarized light.[3]
Another advantage of an ellipsometer is that the absolute intensity ofthe reflected light does not have to be measured. This allows ellipsometricmeasurements to be more accurate than simple intensity reflectance mea-surements. From Equation 3.5, an ellipsometer measures the ratio of thetwo reflectance values for p- and s-. This provides accurate and reproducibleresults unique to ellipsometers.[3]
Because the ellipsometer measures relative phase and intensity ratherthan their absolute values, it can be operated effectively in most any type ofenvironment. Conveniently, it is not necessary to maintain an ellipsometerin a dust-free area.
3.3 In Situ Ellipsometer
In situ ellipsometry refers to ellipsometry conducted in the original setting inwhich the sample was prepared. If a sample film is created inside a vacuumchamber, then in situ ellipsometry refers to ellipsometry conducted on thesample film inside the chamber, without removing the film.
3.3. IN SITU ELLIPSOMETER 25
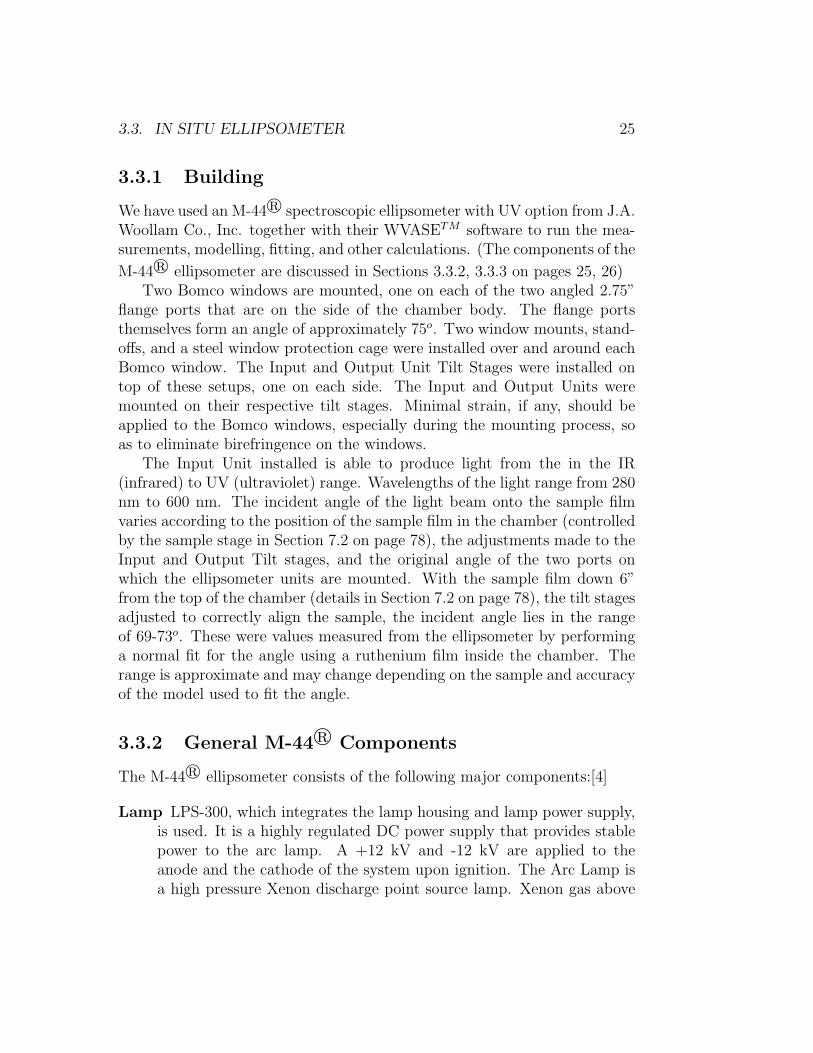
3.3.1 Building
We have used an M-44r spectroscopic ellipsometer with UV option from J.A.Woollam Co., Inc. together with their WVASETM software to run the mea-surements, modelling, fitting, and other calculations. (The components of theM-44r ellipsometer are discussed in Sections 3.3.2, 3.3.3 on pages 25, 26)
Two Bomco windows are mounted, one on each of the two angled 2.75”flange ports that are on the side of the chamber body. The flange portsthemselves form an angle of approximately 75o. Two window mounts, stand-offs, and a steel window protection cage were installed over and around eachBomco window. The Input and Output Unit Tilt Stages were installed ontop of these setups, one on each side. The Input and Output Units weremounted on their respective tilt stages. Minimal strain, if any, should beapplied to the Bomco windows, especially during the mounting process, soas to eliminate birefringence on the windows.
The Input Unit installed is able to produce light from the in the IR(infrared) to UV (ultraviolet) range. Wavelengths of the light range from 280nm to 600 nm. The incident angle of the light beam onto the sample filmvaries according to the position of the sample film in the chamber (controlledby the sample stage in Section 7.2 on page 78), the adjustments made to theInput and Output Tilt stages, and the original angle of the two ports onwhich the ellipsometer units are mounted. With the sample film down 6”from the top of the chamber (details in Section 7.2 on page 78), the tilt stagesadjusted to correctly align the sample, the incident angle lies in the rangeof 69-73o. These were values measured from the ellipsometer by performinga normal fit for the angle using a ruthenium film inside the chamber. Therange is approximate and may change depending on the sample and accuracyof the model used to fit the angle.
3.3.2 General M-44r Components
The M-44r ellipsometer consists of the following major components:[4]
Lamp LPS-300, which integrates the lamp housing and lamp power supply,is used. It is a highly regulated DC power supply that provides stablepower to the arc lamp. A +12 kV and -12 kV are applied to theanode and the cathode of the system upon ignition. The Arc Lamp isa high pressure Xenon discharge point source lamp. Xenon gas above

26 CHAPTER 3. IN SITU ELLIPSOMETRY
atmospheric pressure is filled inside the lamp. The lamp provides thebeam of light that enters the Input Unit through a fiber optic cable.
Input Unit The Input Unit conditions the beam from the Arc Lamp beforeit encounters the sample. It consists of an SMA Connector, Collimator,Shutter, and a Polarizer mounted in a rotational stage. (See Figure 9)
Output Unit The Output Unit consists of an analyzer and a detector thatfurther conditions the beam from the sample, and converts the beaminto electrical signals. (See Figure 10)
Analyzer During calibration and data acquisition the beam from thesample enters the Analyzer through a fixed aperture. The purposeof the aperture is to reject stray light and control the amount oflight entering the Detector.
Detector The detector box contains a small grating that dispersesthe desired spectrum of light across a diode array. Additionalcircuitry conditions the signals from the diode array to signalsthat can be analyzed by the computer. There is a four-quadrantdetector inside the detector box used for alignment.
Computer The computer controls all electrical systems of the ellipsometer.It initiates pulses to the stepper motor drivers in the EC-110. Thecomputer controls all stepper motors using digital I/O cards and ananalog to digital (A/D) card.
During the Alignment Procedure, signals from the Detector are sentto the computer and displayed as a cross hair on the computer screen.During the Calibration and Data Acquisition, the signal from the De-tector is coupled to the A/D card within the computer. The softwareuses this information for calibration and analysis.
Electronics Control Box The two stepper motors are controlled by theElectronics Control Box, EC-110. The EC-110 contains all the powersupplies and drivers for these motors. It also contains the circuitry forthe shutter within the ellipsometer.
3.3.3 In situ M-44r Components
The following parts are unique to the in situ set up of the M-44r ellipsometer:[4]

3.3. IN SITU ELLIPSOMETER 27
Alignment Jig The Alignment Jig is mounted on the Output Tilt Stageduring the Alignment Procedure if necessary. The reflected light beamfrom the sample should enter through the center of the entry-hole ofthe Alignment Jig. Then the light beam should be centered throughthe glass reticule (cross hair) at the end (bottom) of the Alignment Jig.
The Alignment Jig allows the path of the light beam through the Out-put Unit to be visible. This makes it easier to align the beam thanusing the Output Unit directly.
Bomco Window The Bomco windows, manufactured by Bomco, Inc., aremade with fused quartz and are shaped like a bottle. They have aquartz to moly seal between the window and the 2.75” UHV flange.Bomco windows can be heated to 400oC to remove typical growth de-posits on the windows. Retardation of Bomco windows are substan-tially and consistently less than conventional viewports.
Note: Because ellipsometers are very sensitive to birefringence of win-dows, no strain should be caused in the windows.
Input Unit Tilt Stage The stage on which the Input Unit is be mounted.The Input Unit Tilt Stage provides the tilting of the Input Unit sothat the beam encounters the surface of the sample and reflects intothe entry-hole of the Output Unit. (See Figure 9)
Output Unit Tilt Stage The stage on which the Output Unit is be mounted.The Output Unit Tilt Stage provides the tilting of the Output Unitso that the beam entering the entry-hole of the Output Unit passesstraight into the Analyzer and Detector. (See Figure 10)
3.3.4 Operation
The system should be powered. Usually it is recommended that 30 minuteselapse from the turning on of the lamp before operating the ellipsometer.The system should then be initialized, aligned, and calibrated before takingactual measurements.
Detailed procedures of initializing, aligning, and calibrating the systemand the sample may be found in Hardware Manual M-44TM Ellipsometer [4].Details on taking ellipsometric measurements, modelling, fitting, and analysis

28 CHAPTER 3. IN SITU ELLIPSOMETRY
can be found in Guide to Using WVASE32TM - Software for VASE and M-44Ellipsometers[3].
System Alignment
System Alignment is the adjustment of the input and output componentsrelative to the fixed angle base of the M-44TM system. It is required when thesystem is first delivered, first mounted on the chamber or base, or wheneverthe integrity of the alignment is in question.[4]
The System Alignment is done with the Input Unit and the AlignmentJig mounted on the Input Unit Tilt Stage and the Output Unit Tilt Stage re-spectively. The beam should be reflected off of the sample and enter straightthrough the Alignment Jig. The Input Unit Tilt Stage can be adjusted toallow the beam to reflect off the sample and center into the entry hole ofthe Alignment Jig. The Output Unit Tilt Stage can then be adjusted toallow the reflected beam to come out from the center of the cross hair on thebottom of the Alignment Jig.
System Calibration
System calibration is required when the M-44TM is operated for the first timeor the computer malfunctions, causing the hard drive to be corrupt. The sys-tem calibration is performed to determine the polarization sensitivity of thegrating, the electronic attenuation of the amplifier circuitry, and phase shiftsinduced in the detector channel signals by the detector amplifier circuitry.
The system is calibrated by using the ‘straight-through’ mode. Thisrequires that the Input and the Output Unit face each other directly. Thisis only possible in ex situ, so for in situ, the ‘straight-through’ is not quiteplausible.
Sample Alignment
Sample alignment is required for each new sample. It is necessary in orderto align the sample surface with respect to the probe beam and align thereflected light beam on the grating within the Output Unit.[4]
With the Output Unit on the Output Unit Tilt Stage, instead of theAlignment Jig, the sample can be aligned. The Input Unit Tilt Stage shouldbe adjusted to ensure that the beam reflects off the sample and is centeredinto the entry hole of the Output Unit. With the computer and WVASE on,

3.3. IN SITU ELLIPSOMETER 29
by selecting Hardware|Align, a cross hair appears on the computer screen.The Output Unit Tilt Stage should then be adjusted so that the cross hairis centered onto the origin of the x, y-axes as close as possible. Usuallyx = 0± 0.5 and y = 0± 0.5 or better can be achieved fairly easily.
Sample Calibration
Sample calibration must be performed every time the M-44TM hardware isinitialized. This is to acquire data to determine the azimuthal angles of thepolarizer, the analyzer, and the grating.[4]
First a Coarse calibration should be performed for the sample by selectingHardware|Calibrate|Coarse calibration. After a successful Coarse calibration,a Normal calibration should be performed by selecting Hardware|Calibrate|Normalcalibration.
Whenever the Electronics Control Box, EC-110, is turned on after beingoff, the sample has been replaced, or there has been a major change to thesample inside, it is recommended that a Coarse calibration be performed.This generates a calibration in a general ‘ball park’ area. The Normal cal-ibration refines this ‘ball park’ and should be performed for each sampleafter the hardware has been turned on and initialized. If the ellipsometerand WVASE has been continuously on, then it is not necessary to performsubsequent calibrations after the first one.
3.3.5 Comparison with Ex Situ
The principles of ellipsometry and the procedures for measuring films arebasically the same with in situ as that with ex situ (ellipsometry outside ofthe vacuum chamber). There are a few points to consider when conductingin situ ellipsometry.
Restrictions in In Situ Ellipsometry
• Usually incident angles cannot be varied to obtain more optical dataof the sample. Data from varying angles allows for a tighter fit on themodel. This option is not readily available for in situ analysis, since tochange angles to obtain useful data would require changing the vacuumchamber ports on which the ellipsometer is mounted. This means thatthe ports would have to be bent at varying angles, which usually is

30 CHAPTER 3. IN SITU ELLIPSOMETRY
impossible for fixed stainless steel chambers.
• The sample cannot be easily taken out, since doing so requires thevacuum system to be brought back to atmospheric pressure. Thusanalysis of multiple films is not efficient.
• Alignment and calibration must usually be done before the depositionof the sample occurs, i.e. on the silicon substrate. When metal isdeposited on the film, the calibration may give erroneous values thatcould affect the accuracy of the measurements. It is recommended thatthe EC-110, the Electronics Control Box, remain on when measuringthe same sample. This is to preserve the original calibration data thatwas obtained from the silicon substrate.
Advantages of In Situ Ellipsometry
• The sample can be measured continuously in real time as it is createdor developed.
• Analysis can be made of films and layers of films that are not oxidized.
• The initial oxidation of films can be analyzed since ellipsometric mea-surements may be made without removing the sample from the chamberwhen exposing the sample with oxygen.
Chapter 4
Vacuum Pumps
4.1 Additional Chapter Definitions
Backstream The process of molecules or atoms leaving the unit that shouldcontain them and travelling to a cleaner area of the vacuum system.Oil may sometimes backstream from a mechanical pump into a vacuumchamber if the pressure of the chamber is at lower pressure than thepump and the line between the two is open. Backstreaming can be asevere source of contamination in a vacuum system.
Cross Fitting Fitting shaped like a cross.
Crossover The point when pumping of a vacuum is switched from roughingpumps to high vacuum pumps. Usually around 1× 10⁻³ torr.
NPT (National Pipe Thread) Type of threading that is angled so thatthe outer diameter decreases towards the end/tip of the threading.Because of the angle, as an NPT screw/shaft is tightened, the gapbetween the wall of the female fitting (the screw hole) and the wall ofthe male fitting (the screw/shaft) decreases. This provides a seal asthe male fitting is screwed in the female fitting.
Reducing Flange Flange that allows a larger port to be connected to asmaller port.
Regeneration The process of emitting all the gases contained inside a vac-uum pump out into atmosphere. Pumps that store the gases inside
31
32 CHAPTER 4. VACUUM PUMPS
require regeneration when the gas load inside is saturated. Saturationcauses the pump to lose its capacity to pump.
Roughing Line The section of the vacuum system that contains the lines,valves, and pumps used to bring the chamber to roughing pressure.Usually the roughing line itself is not UHV leak tight since it is unnec-essary, however the valve connecting the roughing line to the rest ofthe UHV system should be UHV leak tight.
Tee Fitting Fitting shaped like the letter ‘T.’
Viton Polymer that may withstand temperatures as high as 150oC. Viton o-rings were preferred in our vacuum system over regular o-rings becauseof this property.
Zeolite/Molecular Sieve Material used to adsorb gases. Usually used insorption pumps. When cooled to liquid nitrogen temperature, gasesare bonded to the surfaces by Van der Waals forces.
Two types of pumps are used in our chamber- sorption pumps, and acryopump. The operation of these pumps rely on two main principles:
1. One principle is to use cold traps, by which the material or componentsinside the chambers are cooled to very low temperatures to attract thegas from the relatively hot chamber. Sorption pumps go down to liquidnitrogen temperatures (∼ 70 K), while cryopumps can go down to liquidhelium temperatures (∼ 4-10 K).
2. Another principle is to use material or components with very largesurface areas. Sorption pumps use sieve materials, while cryopumpsuse activated charcoal that can have surface areas of several footballfields.
Two sorption pumps are used to bring the chamber from atmosphericpressure to roughing pressure (1× 10⁻³ torr). The cryopump then takes thechamber down to UHV pressure (under 1× 10⁻⁹ torr).
4.2 Sorption Pumps
The term ‘sorption pumps’ includes all types of pumps that remove gases andvapors through sorption means- temperature-dependent adsorption forces

4.2. SORPTION PUMPS 33
(van der Waals forces), chemisorption, absorption, or by becoming embeddedduring the formation of new sorbing surfaces. Some of the different typesof sorption pumps are adsorption pump, getter pumps, evaporator pumps,and sputter pumps.[5] Only the adsorption pump will be described in thissection as it is the type of roughing pump that is employed in our vacuumsystem. When ‘sorption pump’ is used in this thesis, it will be assumed tobe an adsorption pump.
4.2.1 Advantages
• Sorption pumps were used in our vacuum system mainly because sorp-tion pumps do not require any oil to operate. This allows the vacuumsystem to be clean from any accidental backstreaming of oil from theroughing pumps to the rest of the UHV system.
• Sorption pumps, although their usage in the vacuum industry has de-creased over the past years, are relatively inexpensive.
• Sorption pumps are easy to maintain. There have hardly no mechanicalfailures. Regeneration of sorption pumps to their original pumpingcapacity only requires the molecular sieve to be baked out, and rarelyrequires the replacement of the molecular sieve.
4.2.2 Building
Two Varian sorption pumps (Model number 941-6501) are used in parallelin our system. The two are both standard size (15” in length) The sorptionpumps were bought used. The zeolite, or molecular sieve material inside wasfirst emptied, then the inside of the sorption pumps was cleaned with water,acetone, and methanol. After the pumps were air dried, the sorption pumpswere filled with new molecular sieve. The new molecular sieve material usedis 1
16” molecular sieve pellets (MS-5A-23) from Duniway. Two half gallonswere used to fill both sorption pumps.
The conical screen to protect the molecular sieve from leaving the sorp-tion pumps was inserted back. Each sorption pump is mounted on a right-angle high vacuum valve from MDC. (See Figure 11) These valves in effectopen or close the sorption pumps to the rest of the vacuum system. Thesevalves can withstand temperatures up to 150oC because of the o-ring that

34 CHAPTER 4. VACUUM PUMPS
provides the seal. (Technically there are two o-rings that provide the seal.One seals against atmospheric air, and the other seals against the gas thatpasses through the line that the valve is mounted on. The former seal is whatdistinguishes between UHV and HV, UHV valves requiring a copper gasketseal for this. The former seal is also what affects the maximum temperaturethat the valve can withstand.)
The two MDC valves were then mounted on a three-way tee. This tee wasmounted on a four-way cross. A thermocouple gauge to measure pressure ismounted on one end of the cross. Another end of the cross is connected to aUHV right-angle valve that is connected to the roughing line of the cryopumpby a steel-reinforced rubber hose. The other end of the cross is connected toa UHV in-line valve that is mounted on to the main chamber body through areducing flange. Both of these UHV valves are made by A&N Corporation,can withstand up to 204oC, and are rated to seal down to 10−10 torr.
All components and lines between the UHV in-line valve and the rough-ing line of the cryopump (including this line) is considered as the complete‘roughing line’ for our vacuum system. The roughing line of the system doesnot have to be UHV leak tight nor UHV clean. However, it must be able to becompletely isolated from the UHV section through a UHV valve, especiallywhen the UHV section is under lower vacuum pressure than the roughingline (i.e. when the cryopump is pumping on the chamber). This is so thatthe UHV section of the chamber is not contaminated by the roughing line.Hence, the in-line valve connected to the chamber is the most crucial valveas it provides the UHV seal necessary to separate the roughing line from theUHV section of the chamber.
A thermocouple gauge is mounted in an 18” NPT (National Pipe Thread)
hole which is threaded on a 2.75” conflat flange. This flange is mounted onthe top end of the four-way cross of the roughing line. The NPT threadsof the thermocouple gauge was wrapped with teflon tape to provide a HVsafe seal. The seal has been able to provide and adequate seal down to10−3− 10−2 torr. However if there is any leak in the roughing line, it is mostlikely from the thermocouple gauge as all other seals, besides that of thehoses connecting to cryopump, are HV leak tight (copper gaskets or o-rings).
4.2. SORPTION PUMPS 35
4.2.3 Components
(Refer to Figure 12[5]) Pumped gases enter the sorption pumps through theinlet port (1). These gases are then adsorbed by the zeolite (6) inside thepump. Vanes (5) to enhance the cooling of the zeolite are contained insidethe pump. The degassing port (2) should remain closed when the pump isoperating, and open when it is regenerating.
Stainless steel dewars should be mounted on the sorption pumps. Thesedewars are where the liquid nitrogen is poured in to operate the sorptionpumps. Heaters are also mounted around the outside of the pump bodies.The screws that tighten the heaters on the bodies were lubricated with anti-seize lubricant because of the high temperatures that the heaters reach (∼250oC). (See Figure 11)
4.2.4 Principles of Operation
Adsorption pumps work according to the principle of adsorption of gases atthe surfaces of molecular sieves. Zeolite is frequently used, which is molecularsieve.
Zeolite is an alkali aluminosilicate that possesses a very large surface area,about 1000 m2/g of solid substance. The pore diameter of a zeolite 13X isabout 13A which is within the size of water vapor or oil vapor. Assumingthat the mean molecular diameter of the average gas molecule is about 5A,about 5×10¹⁸ molecules are adsorbed in a monolayer on a surface of 1 m2.[5]A standard size sorption pump by Varian (which is what we have) containsnearly 300 acres of surface area.[6]
The adsorption of gases at surfaces depend on both the temperature andmore importantly on the pressure above the adsorption surface. Typically ifthis pressure is larger, the adsorption is greater. By immersing the body ofthe pump in liquid nitrogen, the pump is activated. Best values are achievedfor nitrogen, carbon dioxide, water vapors, and hydrocarbon vapors. Howevermolecules with small particle diameters, such as hydrogen, helium, and neon,are poorly adsorbed by sorption pumps. As the pumped gases cover thezeolite surfaces, the pumping speed decreases.[5]

36 CHAPTER 4. VACUUM PUMPS
4.2.5 Operation
Two pumps are used in the system to provide ideal pumping to roughingpressure. One pump is first used to pump out the first stage of air insidethe vacuum chamber. This first stage of air usually may be less clean (morecontaminants) than later stages, so by pumping initially with one pump, theless clean air can be contained inside one of the pumps alone. Also as the airis pumped in, it creates a type of ‘wind’ that causes helium, hydrogen, andneon to flow into the pump initially. If the pump is kept open, then thesegases may leak out from the pump since they are difficult for the zeolite toadsorb. However if one pump is used to initially pump on the chamber andthen if this pump is closed, then much of the helium, hydrogen, and neonmay be trapped inside this one pump. Thus by using one pump initially andthen closing it, lower vacuum pressure and relatively cleaner vacuum can beachieved, than when using only one sorption pump for the whole process.Typically opening the first pump for 1-11
2 minutes and then closing it issufficient for a standard size sorption pump.
The following is the manufacturer’s recommended procedure for using asingle sorption pump in a vacuum system.[6] A standard operating proce-dure for pumping down with the sorption pumps in our system is found inSection A.2.
1. Make sure the roughing valves are closed, so the sorption pump is sealedoff from the rest of the vacuum system.
2. Ensure that the Viton stopper is firmly inserted in the degassing port.A light film of vacuum grease on the inside of the Viton relief-valve (onthe degassing port) and on the Viton stopper will insure a leak-tightseal.
3. Place the liquid nitrogen container (the dewar) around the pump andfill it. After a few minutes of boiling of liquid nitrogen, refill the con-tainer so that the liquid nitrogen surface reaches the top of the 4.5”diameter portion of the pump body.
4. Allow the sorption pump to chill for at least 10 minutes or longer.After one hour of chilling, most of the molecular sieve will be nearliquid nitrogen temperature.

4.2. SORPTION PUMPS 37
5. Open the valve between the sorption pump and the vacuum system.Observe pressure decrease on the meter (thermocouple gauge in oursystem).
6. Leave the pump open to the system until the pressure is less than 10mtorr. (It is beneficial to go as low as possible and then hold thatpressure for an hour or two before closing the system from the sorp-tion pump) Then close the roughing valve and begin pumping of thechamber by a high vacuum pump.
7. When roughing is complete, remove the liquid nitrogen container andallow the pump to warm to room temperature. Complete warmuprequires 1-11
2 hours. Pressure inside the pump will increase, causingthe Viton stopper to come off the relief valve on the degassing port.The pump may also be warmed to room temperature in 30 minutes orless by using the wrap-around heaters.
8. When the pump is not used, keep the Viton stopper in the relief valveso that vapor is not accumulated in the molecular sieve. Also valve offthe pump to keep out water vapor and other gases.
Caution
It is important that when the roughing line is closed to the rest of the vacuumchamber, it remains closed unless it can be verified that the roughing line isat lower vacuum pressure than the section of the chamber that it may opento. If the roughing line is open to a section of the chamber that is at lowervacuum pressure, then contaminants from the relatively dirty roughing linemay enter the UHV clean section of the chamber. Probably most damagingmay be possible molecular sieve dust that could escape the roughing pumpbecause of the pressure differential.
One way of doing this is to place liquid nitrogen in the dewars and startpumping on the roughing line. The pressure of the section of the vacuumchamber that the roughing line will open to must be above 1 × 10⁻³ torr.After the roughing line reads below 1×10⁻³ torr, the roughing line may thenbe opened to that part of the chamber.

38 CHAPTER 4. VACUUM PUMPS
4.2.6 Regeneration
Most gases desorb, or leave, from the molecular sieve surfaces at room tem-perature. However water vapor remains with great tenacity. Once a con-siderable quantity of water vapor is accumulated in the molecular sieve, itis necessary to remove the water vapor by baking out the sorption pumps,hence regenerating the pumps.
The wrap-around heaters, when turned on, can heat the pumps up toabout 250oC after about 21
2 hours. A standard operating procedure for re-generating the sorption pumps in our system is found in Section A.3.
4.3 Cryopump
The cryopump that is installed in our vacuum system is a Cryo-Torrr 8 HighVacuum Pump, made by CTI-Cryogenics. It is a refrigerator type cryopump,which can become ‘cold upon demand,’ like a refrigerator. (See Figure 13)
Some of the characteristics of the Cryo-Torrr 8 High Vacuum Pump arelisted in Table 4.1.[7]
Table 4.1: CTI-Cryogenics Cryo-Torrr 8 High Vacuum Pump CapacityPumping Speeds - liters/sec
Water Vapor 4,000Air 1,500Hydrogen 2,500Argon 1,200
Capacity - std. literArgon 1,000Hydrogen(5× 10⁻⁶ torr) 12
Cooldown time1.5 hrs.
DimensionsLength - in. (mm) 20.7 (526)Weight - lbs. (kg) 45 (20.4)

4.3. CRYOPUMP 39
4.3.1 Components
A refrigerator cryopump consists of a compressor unit, cold head, pumpcasing, and flexible pressure lines. (See Figure 14).
Compressor Unit
The compressor unit provides the power for the refrigerant to circulate through-out the cryopump. Helium is used as the refrigerant because of the lowcondensation temperature it can achieve.
Cold Head
The cold head is the unit where the gases from the vacuum system coolswithin the cryopump. The gases bond to the cold surfaces of the panels ofthe cold head and condense. The cold head together with the casing aremounted directly onto the vacuum chamber with a gate valve in between.
Pump Casing
The metal casing that surrounds the cold head. It provides the structuralframe of the cryopump.
Pressure Lines
The helium flows through the flexible pressure lines in a closed cycle. Thepressure lines connect the cold head with the compressor unit.
4.3.2 Principles of Operation
The general principles behind the operation of a refrigerator pump will bedescribed.[5] Much of the pumping from a cryopump relies on condensationthat occurs in vacuum. This is similar to how water condenses on cold glasssurfaces, and ice forming on the evaporator unit of a refrigerator. Layers offrozen gases are stacked on to the panels of the cryopump due to bondingforces from mostly thermal interactions.
Figure 15 shows the design of a refrigerator cryopump. (adapted fromFundamentals of Vacuum Technology[5]) Cooling within the cryopump isprovided by a two-stage cold head. The thermal radiation shield (5) and

40 CHAPTER 4. VACUUM PUMPS
the baffle (6) are closely linked thermally to the first stage (9) of the coldhead. For pressures below 10−3 torr thermal radiation causes most of theheating within the cryopump. For this reason the second stage (7) withthe condensation and cryosorption panels (8) is surrounded by the thermalradiation shield (5) which is black on the inside and polished and nickelplated on the outside.
With no load the baffle and the thermal radiation shield (first stage) at-tain temperatures in the 50-80 K range at the cryopanels. At the second stagethe temperature is about 10 K. The surface temperatures of these cryopanelsare important in the actual pumping process. These surface temperaturesare dependent on the refrigerating power supplied by the cold head, and thethermal conduction properties in the direction of the pump’s casing. Duringoperation of the pump, loading of the gas and heat from condensation causesfurther warming of the cryopanels. The surface temperature depends on boththat of the cryopanels and that of the gas frozen on to the cryopanel.
The cryopanels (8) attached to the second stage (7) of the cold head arecoated with activated charcoal on the inside. The activated charcoals allowgases that do not easily condense to be pumped by cryosorption.
4.3.3 Bonding of Gases
As the condensate (solid) of the gases on the panels increase in thickness,thermal resistance and thus the surface temperature increase. This reducesthe pumping speed and capacity of the cryopump. The bonding process forthe various gases in the cryopump is performed in three steps:[5]
1. First the mixture of different gases and vapors meets the baffle whosetemperature is about 80 K. Mostly H2O and CO2 are condensed here.The partial pressures of these gases drop below 10−9 torr at T≈ 77 K.
2. The remaining gases penetrate the baffle and impinge on the outersurface of the cryopanel of the second stage, whose temperature is about10 K. Here gases like N2, O2 and Ar will condense. The partial pressuresof these gases drop below 10−9 torr at T≈ 20 K.
3. H2, He and Ne remain after these two stages. These gases, after severalimpacts with the thermal radiation shield, pass to the inside of thecryopanels which are coated with an adsorbent (cryosorption panels)

4.3. CRYOPUMP 41
where they are finally bonded by cryosorption. The partial pressuresof these gases drop below 10−9 torr at T< 4.2 K.
There are differences in the bonding mechanisms involved in the operationof a cryopump:[5]
Cryocondensation
The physical and reversible bonding of gas molecules through van der Waalsforces caused by sufficiently cold surfaces of the same material. The bondenergy is the energy of vaporization of the solid gas bonded to the surface.The bond energy decreases as the thickness of the condensate and the vaporpressure increase.
Cryosorption
Physical and reversible bonding of gas molecules through van der Waals forcescaused by sufficiently cold surfaces of other materials. The bond energy isequal to the heat of adsorption which is greater than the heat of vaporization.
In cryosorption gas molecules are adsorbed into adsorbent materials suchas activated charcoal, silica gel, alumina gel and molecular sieve. Thesematerials have very large specific surface areas of about 106 m2/kg.
As soon as a monolayer of adsorbed gases form, the gases condense on tosurfaces of the same kind, hence returning to cryocondensation. The higherbond energy of the cryocondensed layer further restricts the capacity for theadsorbed gases. This is why the adsorbent materials must have large surfaceareas.
Cryotrapping
The inclusion of a low boiling point gas which is difficult to pump (such ashydrogen), in the matrix of a gas with higher boiling point (such as Ar,CH4 orCO2) which can be pumped easily. At the same temperature the condensatemixture has a saturation vapor pressure which is several orders of magnitudelower than the pure condensate of the gas that has the lower boiling point.

42 CHAPTER 4. VACUUM PUMPS
4.3.4 Operation Procedures
The following procedures are recommended by the manufacturer- CTI-Cryogenics,Helix Technology Corporation.[8] A standard operating procedure for pump-ing down with the cryopump in our system is found in Section A.2.
Before Start-up
The compressor unit, cold head unit, lines, and power source should be prop-erly installed.
Operating Log An operating log will assist in troubleshooting if problemsarise. The log should include the cooldown time to 20 K, the roughingtime to 50 mtorr, the time to base pressure at crossover, the timebetween regeneration, and the compressor pressure reading.
Rough Pumping
Roughing pressure between a minimum of 50-75 mtorr should be achievedbefore the cryopump begins to pump on the vacuum system.
Rate-of-Rise (ROR)
Rate of the pressure rise is an important measure of the tightness of thevacuum system. To measure the rate of pressure rise, close the roughing valvewhen the pressure has reached 50-75 mtorr. Observe the rate of pressure riseover a five-minute period.
ROR < 10 mtorr/minute over a five-minute period (4.1)
The rate of rise in Equation 4.1 (50 mtorr total) is an indication of theintegrity and cleanliness of the cryopump and the vacuum system for highvacuum usage. If the total ROR is greater than 50 mtorr, the cryopumpshould be repurged, leaks should be checked, and the roughing cycle andROR procedure should be repeated.
Start-up and Cooldown
1. Confirm that the gate valve connecting the cryopump to the chamberis closed. Confirm that the pressure in the cryopump is approximately

4.3. CRYOPUMP 43
100 mtorr. Most importantly ensure that the roughing valve isclosed so that the roughing line is completely sealed from thecryopump. If this is not done then sieve dust may backstreaminto the chamber and the cryopump, contaminating and evencompromising the whole vacuum system.
2. Turn on the system power ON/OFF switch for the compressor andthen the cold head. (See Figure 16)
3. Note the helium pressure and the temperature reading during the initialcooldown. The typical values that should be achieved are shown inTable 4.2.[8] Refer to the Troubleshooting section of the Cryo-Torr 8manual[8] if problems arise.
4. When the cooldown temperature of 20 K or less is reached, the cryo-pump is ready for normal vacuum operation. An additional 30 minuteswill allow the cryopump to reach the bottom temperature.
5. Record the time that was required to reach 20 K in the log. Also recordthe compressor return gas pressure at 20 K. These values may be usefulfor future evaluation of cryopump performance.
Table 4.2: Typical pressure variations during cooldown and normal operation(all values are nominal)CryopumpModel
CompressorModel
Time Nominal He-lium PressurePsig (kPa)
TemperatureIndicatorReading
H2VPRead-ing(Psia)
CT-8 8200 Before start-up 250 (1725) 300 —90 mins. afterstart-up
280 (1930) 10-20 20
4.3.5 Regeneration
Because the cryopump condenses and stores all of the gas molecules pumpedinside the pump, after some time the cryopump becomes saturated. Thissaturation reduces the capacity of the cryopump to maintain high vacuum

44 CHAPTER 4. VACUUM PUMPS
pressures. Gases that are captured inside the cryopump can be released bybringing the cryopump to room temperature or higher and opening it toatmosphere.
If the cryopump becomes incapable of maintaining high-vacuum (typicallyan increase of the vacuum chamber base pressure by a factor greater than10, despite satisfactory performances by the compressor and cold head), thecryopump needs regeneration.[8] Also a ring of ice or condensation aroundthe exterior of the cryopump are signs that the cryopump is saturated andmust be regenerated.
After saturation, a regeneration of the cryopump that is complete andthorough will increase the pumping ability of the cryopump, hence loweringthe base vacuum pressure of the overall vacuum system. There are severalmethods to regenerate the cryopump. One is to simply turn the cryopumpoff, close the gate valve, let the pump come to room temperature, and pumpout the gas from the cryopump through the roughing pumps. Another is tobake out the cryopump while regenerating (this is what we have implemented;procedures are described in detail in Section A.3). The most effective maybe an assisted regeneration that uses dry inert gas to purge the cryopump.
4.3.6 Assisted Regeneration
Assisted regeneration incorporates the use of heated dry inert purge gas(nitrogen or argon) to regenerate the cryopump.
Advantages
The advantages of assisted regeneration over unassisted regeneration are:[8]
1. Minimizes the time required to bring the condensing and cryo-adsorbingarrays to room temperature.
2. Reduces the time required to pump the cryopump to roughing pres-sures. This is because the dry inert purge gas will minimize the amountof residual water vapor in the 15 K array.
3. Dilutes hazardous gases and ensures their removal from the cryopumphousing.

4.3. CRYOPUMP 45
Procedures
The following are the steps to conduct assisted regeneration:[8] (Refer toFigure 17)
1. Isolate the cryopump from the vacuum chamber by closing the gatevalve.
2. Shut off the cryopump by turning off the ON/OFF switch of the coldhead and the compressor.
3. Immediately introduce heated dry purge gas through the vacuum vesselpurge fitting at approximately 150oF (66oC) and at a flow rate of 1-2cfm. Allow the purge gas to vent through the ‘poppet’ relief valve.
4. Halt the gas purge when the condensing arrays reach 80oF (26oC) (300K).
5. When the condensing arrays reach ambient temperature, rough the cry-opump to 50-100 mtorr. After roughing, perform a rate-of-rise (ROR)test to ensure that the cryopump regeneration has been thorough andthat no leaks are present in the system.
6. Close the cryopump from the roughing line and start the cryopump.
7. The cryopump is ready for use when the second stage cold head reachesa temperature of 20 K or lower.

46 CHAPTER 4. VACUUM PUMPS

Chapter 5
Vacuum Components
5.1 Additional Chapter Definitions
Backfill Filling a volume with material; usually a closed chamber is filledwith gas.
Dewar Container used to hold liquid gases at low temperatures. Dewarsare thermally insulated so that the gas can last and so the containeritself does not become cold.
Inner Diameter (ID) The diameter size of the inner boundary.
Load-lock Isolating one particular volume in a vacuum chamber from therest of the chamber. This is done to open this particular volume toatmospheric pressure while maintaining the rest of the chamber undervacuum pressure. Load-lock provides an efficient method of changingsamples since changing samples would require only a small volume tobe pumped down to vacuum instead of the whole chamber.
Mass Spectrometer Instrument used to determine the composition of thegas inside the vacuum system.
Outer Diameter (OD) The diameter size of the outer boundary.
47

48 CHAPTER 5. VACUUM COMPONENTS
5.2 Chamber
The main body of the vacuum chamber was custom built by Varian, Inc. Thechamber body is made of stainless steel. The total volume enclosed by themain body, excluding all additional components installed, is approximately15-20 liters. The chamber sits on a steel cart to provide support and mobility.All the flanges on the original body are conflat, sealed with copper gaskets.An ion gauge was already installed on one of the ports of the chamber,presumably by Varian, before I started working on the system in April 2000.Many of the components that are mentioned in this section will be describedwith more detail in later chapters of the thesis.
In Table 5.1, each port of the main chamber body, its diameter, andcorresponding usage are listed.
5.3 Gate Valve
A gate valve is used to separate the vacuum chamber from a pump, typicallya high vacuum pump. It provides partial or full sealing of the chamber fromthe high vacuum pump.
5.3.1 Advantages
When the gate valve is closed, the high vacuum pump can first pump onitself, meaning the high vacuum pump can reach optimal vacuum pressurewith no load to pump, before pumping on the chamber. For example, coolingof the cold head for a cryopump can be achieved much faster with a gate valveclosed against the chamber.
The gate valve allows gas flow in the high vacuum pump to be separatedfrom the gas flow in the chamber and the rest of the vacuum system. (Itshould be noted that the port on the end of the cryopump, which is connectedto the roughing line, must be sealed in order to completely separate thecryopump from the entire vacuum system.) This allows separate testing ofthe cryopump and the rest of the chamber when conducting a leak detectiontest.
The gate valve can be closed, so that when the chamber is open to at-mospheric pressure, the cryopump can still maintain high vacuum pressure.This eliminates the need, and hence saves time, for the cryopump cold head
5.3. GATE VALVE 49
to cool down each time the chamber is to be pumped down from atmosphericpressure.
5.3.2 Building
(Refer to Figure 22)The gate valve installed is a pneumatic aluminum gate valve. The gate
valve is mounted on an 11” diameter reducing flange that fits on the 8”diameter port of the main chamber body. This reducing flange was customordered to allow the gate valve to mount on to the chamber properly. Theseal between the reducing flange and the main chamber uses a conflat coppergasket. The seal between the gate valve and the reducing flange uses a Vitono-ring. The cryopump is mounted on the other side of the gate valve with aViton o-ring seal.
The gate valve was taken apart, and all of its parts were cleaned withhexane, acetone, and methanol. All o-rings, including those in the shaft thatopens/closes the gate valve, were replaced with new Viton o-rings. Vitono-rings were used so that the gate valve and all its seals could withstand upto 150oC temperatures during bake out. As we baked out the chamber up to270oC, the outside of the gate valve was well below 150oC. We assume thatthe temperature of the inside of the gate valve to be similar to the outside,especially because no heating tapes were directly placed on the gate valve.Caution should be taken, however, so that the temperature of the gate valvenever exceeds 150oC.
One important note on the design of the gate valve is that both sides ofthe gate valve has o-ring grooves that are the same size. For our system itis imperative that only one of these grooves on the gate valve be used. AViton o-ring should be used only on the side facing the reducing flange on thechamber body. The o-ring groove on the other side of the gate valve shouldnot be used. Instead a Viton o-ring should be placed on the inlet port ofthe cryopump, which itself contains an o-ring groove. (Refer to Figure 17)This is because the o-ring groove of the gate valve is too small to provide aseal between the cryopump and the gate valve. The reason that our initialvacuum pump down would not achieve 10−3 torr was because we placedan o-ring on the o-ring groove of the gate valve instead of the one on thecryopump. This o-ring was not in contact with the mounting flange of thecryopump. Instead it was positioned inside the open inlet of the cryopump,where the 80K condensing arrays are. After this leak was detected and fixed,
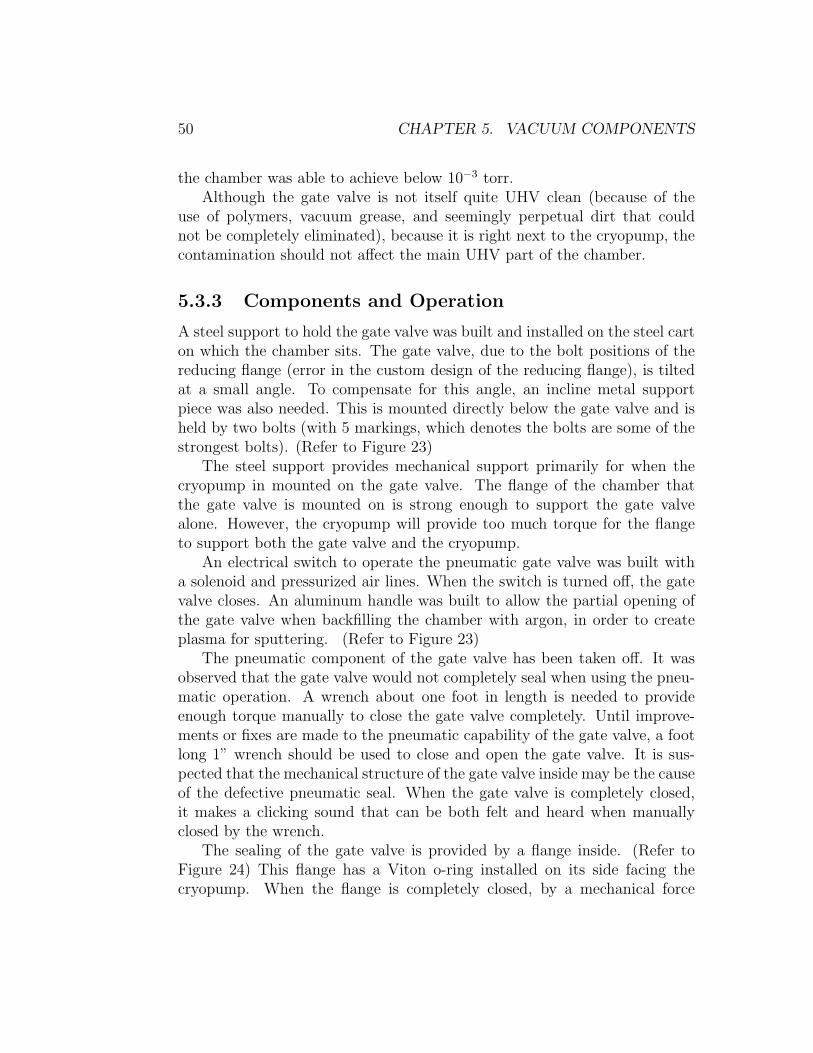
50 CHAPTER 5. VACUUM COMPONENTS
the chamber was able to achieve below 10−3 torr.Although the gate valve is not itself quite UHV clean (because of the
use of polymers, vacuum grease, and seemingly perpetual dirt that couldnot be completely eliminated), because it is right next to the cryopump, thecontamination should not affect the main UHV part of the chamber.
5.3.3 Components and Operation
A steel support to hold the gate valve was built and installed on the steel carton which the chamber sits. The gate valve, due to the bolt positions of thereducing flange (error in the custom design of the reducing flange), is tiltedat a small angle. To compensate for this angle, an incline metal supportpiece was also needed. This is mounted directly below the gate valve and isheld by two bolts (with 5 markings, which denotes the bolts are some of thestrongest bolts). (Refer to Figure 23)
The steel support provides mechanical support primarily for when thecryopump in mounted on the gate valve. The flange of the chamber thatthe gate valve is mounted on is strong enough to support the gate valvealone. However, the cryopump will provide too much torque for the flangeto support both the gate valve and the cryopump.
An electrical switch to operate the pneumatic gate valve was built witha solenoid and pressurized air lines. When the switch is turned off, the gatevalve closes. An aluminum handle was built to allow the partial opening ofthe gate valve when backfilling the chamber with argon, in order to createplasma for sputtering. (Refer to Figure 23)
The pneumatic component of the gate valve has been taken off. It wasobserved that the gate valve would not completely seal when using the pneu-matic operation. A wrench about one foot in length is needed to provideenough torque manually to close the gate valve completely. Until improve-ments or fixes are made to the pneumatic capability of the gate valve, a footlong 1” wrench should be used to close and open the gate valve. It is sus-pected that the mechanical structure of the gate valve inside may be the causeof the defective pneumatic seal. When the gate valve is completely closed,it makes a clicking sound that can be both felt and heard when manuallyclosed by the wrench.
The sealing of the gate valve is provided by a flange inside. (Refer toFigure 24) This flange has a Viton o-ring installed on its side facing thecryopump. When the flange is completely closed, by a mechanical force

5.4. GAUGES 51
coupled with the o-ring, the flange provides a high vacuum seal that can sealoff even atmospheric pressure.
5.4 Gauges
There are two gauges to measure the pressure in our vacuum system. A TC(thermocouple) gauge is used to measure from atmospheric pressure downto roughing pressure, and an ion gauge is used to measure from roughingpressure down to UHV vacuum pressure. Both gauges are connected to aVarian senTorrTM gauge controller which displays the pressure readings forboth gauges.
Vacuum gauges to monitor the pressure within the chamber are importantin evaluating the vacuum capability of any vacuum systems. It is importantto understand the limitations, range, and reliability of the gauges that areused in order to assess the vacuum system properly and determine the actualvacuum of the system.
5.4.1 Thermocouple Gauge
A thermocouple gauge, Model DST-531 from Duniway Stockroom Corp., ismounted on the top end of the four-way cross of the roughing line. Thisis the only gauge in our vacuum system used to measure from atmosphericpressure down to roughing pressure. (See Figure 25)
The thermocouple gauge is mounted on the roughing line because of itsNPT (National Pipe Thread) thread which is not UHV leak tight. TheNPT threads on the thermocouple gauge provide some vacuum type sealing,however clean teflon tape must also be wrapped around the NPT threads toprovide high vacuum tight sealing.
A cable to connect the thermocouple gauge to the senTorrTM gauge con-troller was made by Scott Daniel. The senTorrTM gauge controller displaysthe pressure read by the thermocouple gauge. In atmospheric pressure, be-fore pumping the system (or at least the roughing line), the thermocouplegauge reading on the senTorr gauge should be calibrated to atmospheric pres-sure (typically 7.6 × 10² torr). This provides a point of reference for futurevacuum pressure readings by the thermocouple gauge.

52 CHAPTER 5. VACUUM COMPONENTS
Limitations
It should be noted that the thermocouple gauge nor the senTorr gauge con-troller is able to accurately and reliably read pressures near atmosphericpressure (7.6× 10² torr). Varian states that their 531 Thermocouple Gauge(which is what Duniway’s model is similar to, if not exact.) provides accurateindication of total pressure from 1× 10⁻³ torr to 2.0 torr.[9]
In our first attempt with the vacuum system, the thermocouple gaugereading on the senTorr gauge read 3.6 − 3.9 × 10² torr even though thepressure of the roughing line was at least at atmospheric pressure. This waseven after calibrating the thermocouple gauge reading on the senTorr gaugeto 7.6×10² torr before pumping on the system. This is simply the mechanicallimitations of a thermocouple gauge and the gauge controller.
Operation
Because there is only one roughing pressure gauge installed on the vacuumsystem, careful and creative methods must be used to measure the roughingpressure of a given section of the vacuum system. Luckily there are 4 valvesimmediately next to the thermocouple gauge to provided some control. Alsothe gate valve provides additional control.
Usually there are only three sections in our vacuum system that requiresthe roughing pressure to be measured by the TC gauge.
1. The main chamber body: The roughing pressure must be measuredbefore opening the main chamber to the cryopump. This can be mea-sured by closing all valves but the one valve connecting the roughingline to the main chamber body. (So 3 roughing line valves and the gatevalve should be closed.)
2. The cryopump: The pressure inside the cryopump should be monitoredto determine whether an appropriate regeneration of the cryopump hasbeen achieved. This can be measured by closing all valves but the onevalve connecting the roughing line to the cryopump roughing line. (So3 roughing line valves and the gate valve should be closed.)
3. The roughing line: The pressure of the roughing line must be measuredso as to determine when to open the roughing line to any other sectionsof the vacuum chamber. Typically it is safest to only open the roughingline to any other section when the roughing line is below 1× 10⁻³ torr.

5.4. GAUGES 53
The pressure of the roughing line should be measured by closing all 4valves.
Perhaps the most important precaution to take when using the ther-mocouple gauge is to ensure that no contaminants from the roughing linebackstream into the section of the vacuum chamber that the TC gauge istrying to measure. If the section that the TC gauge is trying to measure hasbeen open to the roughing line, then there is no problem in using the TCgauge. However, if the roughing line has been closed to this section of thechamber, then before opening it to the roughing line to use the TC gauge,it must be ensured that the roughing line is at lower vacuum pressure thanthe pressure of this particular section.
For example, suppose that the main chamber body is closed to the rough-ing line and is at a pressure above 1×10⁻³ torr. (Since the ion gauge cannotread pressures above 1 × 10⁻³ torr, when the ion gauge does not read thepressure of the main chamber, assuming it being still functional, the mainchamber can be though to be at pressures above 1× 10⁻³ torr.) To measurethe pressure of the chamber, the TC gauge must be used because it is abovehigh vacuum pressure. If the roughing line is at 1× 101 torr, then the valveconnecting the chamber and the roughing line should not be opened. This isbecause there is a possibility that the main chamber may still be at pressureslower than 1×101 torr. Opening the roughing line in this case may cause therelatively dirty roughing line to contaminate the UHV clean main chamber,and may even cause molecular sieve dust to enter into the chamber. Thisis due to the pressure differential between the roughing line and the mainchamber. It is always better to be overly cautious than to not be careful andcontaminate a UHV vacuum system.
5.4.2 Ion Gauge
A D571-K2471-303 Bayard-Alpert type ionization tube gauge is mounted ona 2.75” conflat flange on the port to which the roughing line is connected. Itis directly connected to the main UHV section of the vacuum chamber. Theion gauge is connected to the senTorrTM gauge controller through a cable.(See Figure 25)
The ion gauge can withstand long periods of degassing or accidental ex-posure to atmosphere at operating temperature and still recover its originalcharacteristics. The sensitivity of the ion gauge is typically 10 (torr)−1. The

54 CHAPTER 5. VACUUM COMPONENTS
operating pressure of the ion gauge is 2× 10⁻¹⁰ torr to 1× 10⁻³ torr.[9]
Limitations
The ion gauge can only be operated at pressures below 1× 10⁻³ torr. Henceabove this pressure, the ion gauge should not be operated. The senTorr gaugeactually provides a safety mechanism that shuts the ion gauge off when thepressure is above 1 × 10⁻³ torr. So unless the ion gauge is malfunctioning,when the ion gauge cannot read the pressure and the senTorr gauges shutsit off, the pressure may be assumed to be greater than 1× 10⁻³ torr.
Also the thermocouple gauge reading and the ion gauge reading usuallydo not coincide. In our initial pump down, it took some additional pumpingby the roughing pumps for the ion gauge to read below 1 × 10⁻³ torr; thiswas after the thermocouple gauge had already read below 1× 10⁻³ torr.
5.4.3 Gauge Controller- senTorrTM
(See Figure 26)The senTorrTM Gauge Controller by Varian has been installed to display
the pressure readings from both the thermocouple gauge and the ion gauge.Up to two thermocouple gauges and one ionization tube may be connected tothe senTorr gauge. The setpoint option has not been installed on our senTorrgauge. This option could allow automatic control of pneumatic valves thatopen or close depending on the programmed pressures of the thermocoupleor ionization gauges. It is called a gauge controller because of this abilityto control the operation of the vacuum system according to the measuredpressures from the gauges.
The senTorrTM Gauge Controller supplies the power for the ionizationgauge. To protect the ion gauge, the senTorr gauge automatically turns theion gauge off when pressures are too high (usually above 1.0 × 10⁻³ torr).Whenever a thermocouple gauge is connected to the senTorr gauge, and thesenTorr gauge is turned on, the pressure measured by the thermocouple gaugewill automatically be displayed on one of the TC1 or TC2 displays.
The configuration, functions, and options of the senTorrTM Gauge Con-troller can be found in the Instruction Manual.[10] There are three pressuresthat can be displayed- the top one for the ion gauge and the two lower dis-plays for two thermocouple gauges (TC1 and TC2).
The senTorrTM Gauge Controller has a programmable option to auto-

5.5. FLANGES 55
matically turn the ion gauge on when the TC1 gauge reads between either1.0× 10−3 to 5.0× 10⁻³ torr or 1.0× 10⁻² to 5.0× 10⁻² torr.
Some of the basic functions of the senTorrTM Gauge Controller are listedbelow:[10]
Option Select Puts the senTorr into programming mode.
Units Pressing this key toggles the pressure measurement between Torr,mBar and Pascal for all pressure readings.
Cal This calibrates the vacuum and atmospheric readings for the thermo-couple gauges.
Emis Turns the high vacuum gauge (the ion gauge for our system) on or off.The high vacuum gauge emissions will come on only if the appropriatevacuum has been achieved.
It has been advised that all vacuum chambers can possibly become chargedto lethal voltage levels if they are not properly grounded with the commonground of the controller of the ionization tube.[10] The chamber has beengrounded using braided copper wires connecting to the ground of the electri-cal lines in the Physics Underground Laboratory.
5.5 Flanges
Flanges are the metal plates that cover and seal the open ports of vacuumchambers. There are many different methods of providing the seal. Ourchamber utilizes two main sealing methods- conflat copper gaskets and o-rings.
Where possible in our vacuum system, all flanges are conflat flanges be-cause of the UHV tight seal that conflat flanges provide. O-rings have beenavoided. Any of the areas where o-rings are used to seal atmospheric airfrom the inside of the vacuum system can be potential leak sources for UHVvacuum pressure.
5.5.1 Conflat (CF) Flanges
Conflat flanges are the industry standard for achieving UHV vacuum. Twoflanges with knife edges are screwed together with a copper ring gasket placed

56 CHAPTER 5. VACUUM COMPONENTS
in between. (See Figure 4[11]) The knife edges press annular grooves into thesoft copper gaskets, and the extruded fills all voids or defects, providing avery tight high vacuum seal. A typical CF flange can withstand temperaturesin the range of -196oC (-321oF) to 450oC (840oF).[11]
There are two basic CF flange designs: fixed (non-rotatable) and rotat-able. The rotatable flange is very useful when the component that will bemounted on has to be turned at certain angles to be placed properly (suchas the tee used for the oxygen gas lines). In the rotatable flange, the knifeedge and bolt hole ring are separate pieces. During welding, the knife-edgepiece is welded to a tube or component, leaving the bolt-hole-ring free torotate. This allows the component to be mounted in any orientation regard-less of the bolt hole orientation of the flange to which it is attached.[11] (SeeFigures 27, 28[11])
Two conflat flange surfaces are bolted together. To allow the bolts to alsowithstand high bake out temperatures, a light layer of anti-seize lubricantshould be applied. It is important to be aware of the lubricant so as to notcontaminate the inside (any area within the copper gaskets of the vacuumchamber) of the chamber when opening or closing the ports with the conflatflanges. Caution should be taken to avoid or clean lubricant contamination.
5.5.2 O-ring Fittings
O-rings have been used in our system for the gate valve and the cryopumpwhich cannot have conflat fittings due to their manufactured designs. Ano-ring is also used for the quick-coupler fitting on the flange of the sputtergun. All o-rings used in the vacuum system have been replaced with newViton o-rings, which can withstand up to 150oC. If possible, o-rings shouldbe eliminated in the system because of the inability of o-rings to provideUHV tight seals.
An o-ring is pressed against two mating surfaces to provide a seal. Thereare various types of mechanisms to provide o-ring sealing. One type uses ano-ring inside a quick-coupler fitting, which is pressed against a shaft whenthe quick-coupler fitting is tightened. This type was used for the sputter gun.The most commonly used o-ring sealing methods are those of QF and ASAflanges.

5.5. FLANGES 57
QF Flanges
A QF assembly consists of two identical (‘sexless’) flanges, a clamp, and acentering ring to align the flanges and to prevent the o-ring from collapsing.The o-ring is mounted around the outer diameter of the centering ring. Thetwo QF flanges are typically tightened through a thumbscrew clamp. A QFsystem is ideal for small diameter tubing that needs frequent reassembly.QF fittings work in rough or foreline vacuum plumbing and simple HV (10-6torr) chambers.[11]
A QF flange is used at the end of the cryopump, connecting to the rubberhose of the roughing line. (See Figure 29
ASA Flanges
An ASA flange has either a flat surface or an o-ring groove machined in it.A series of holes for bolts encircles the edge of the flange. The pair of flangesare bolted together, one flat and the other grooved with an o-ring installed.If the mating pair has both o-ring grooves of identical ID’s (inner diameter), then o-rings should be places in both grooves with a ring of thin metalsheet to separate them. If both flanges are smooth, flat rubber gaskets or o-rings molded into carriers between the flange faces can be installed. Finally,when mating a normal flange pair, it is important that the flat flange has asmaller ID than the o-ring, or else the o-ring will not provide a seal.[11] (SeeFigure 30[11])
ASA flanges with Viton o-rings are used for both the gate valve and cry-opump flanges in our vacuum system. Because these o-ring flanges are closeto the pumping source, we assume that the pumping rate would be greaterthan the leak rate through these flanges. Also, if the vacuum grease flowsout from the o-rings, they will most likely be pumped toward the cryopump,hence away from the UHV clean chamber.
Ordering O-rings
To order o-rings for ASA flanges, first the inner diameter (ID), outer diameter(OD), and thickness (width) of the o-ring or the o-ring groove should bemeasured. These measurements can then be used to order o-rings. Howeverit is more efficient, if possible before ordering, to look in an industry standardmanual for o-rings and determine the number that represents the size of theo-rings. Joseph Young in the Physics Department can provide much help in

58 CHAPTER 5. VACUUM COMPONENTS
determining the appropriate number for the size of the o-rings based on themeasurements. These numbers can then be used to order the appropriateo-rings. (See Figure 31[11])
Vacuum Grease
It is generally advised that a light film of vacuum grease be used to provideenough lubrication for the o-rings to seat properly in the o-ring grooves. DowCorningr high vacuum grease was used in our vacuum system. Typicallyvacuum grease has low outgassing rate that is compatible for high vacuumsystems.
The following is a guideline when applying vacuum grease on to o-ringsused for ASA flange type fittings.
1. The o-ring should be cleaned with some methanol and Kimwipes.
2. With clean gloves, a thin film of vacuum grease should be applied withthe fingers evenly around the o-ring.
3. Place the lubricated o-ring inside the o-ring groove.
4. Carefully bolt the flanges together, avoiding contact of the o-ring onto other surfaces. The grease should be thought of as a contaminantwhen placed on unnecessary surfaces.
According to Kurt J. Lesker Company, leak-free joints depend as muchon the absence of dust or lint particles on the o-ring and imperfection on theflange surfaces as on the presence or absence of grease. The choice between‘to grease or not to grease’ probably relates to how oil-free the user wishesthe system to be. Greases, in general, have very low vapor pressures, butany measurable vapor pressure means the grease will (very slowly) migratefrom the O-ring to other surfaces.[11]
Hence it is important to be wise in the usage of vacuum grease in avacuum system. If it can be avoided, vacuum grease should not be used.It should also be noted that vacuum grease tend to flow out from the o-ring surfaces and may eventually contaminate the system, compromising thesystem’s vacuum capability. This is one reason why the o-ring on the quick-coupler fitting of the sputter gun flange should be replaced as soon as it isfeasible.

5.6. BAKE OUT 59
5.6 Bake Out
A thorough bake out of the system over a period of three to four days attemperatures above 250oC speeds up the outgassing rate of surfaces in thevacuum system. This allows a faster and cleaner pump down to vacuumpressures. To achieve UHV pressures, it is a standard practice to bake outthe vacuum system.
It is important to be able to control the rate of change of temperaturethroughout the bake out process and the cool down process of the vacuumsystem. The temperature should increase or decrease at no more than 20-25oC per hour so that the strain on the components of the vacuum systemis minimized.
Our vacuum system is baked out by using heating tapes. The heatingtapes are powered by controls that can vary the voltage level of the powersupply. The cryopump and the main chamber body have independent bakeout systems. (See Figure 32)
Because of the high bake out temperatures, it is important that peopleare aware when the system is being baked out. A sign and/or notes may behelpful, but not sufficient.
5.6.1 Heating Tapes
There are two types of heating tapes on the system. One is used for theCryopump and another for the main chamber body.
Cryopump
The heating tape on the cryopump is a continuous tape wrapped around theoutside of the cryopump. It should rise to 150oC for the regeneration processof the cryopump. (See Figure 33)
Main Chamber Body
The heating tapes on the main chamber body were custom ordered fromClayborn Labs, Inc. These adhesive tapes were attached to the outer sur-faces of the chamber walls. Aluminum adhesive tape and high temperaturesilicon glue were also used to keep the tapes on the surfaces. As electricalpower is sent through the tapes through an electrical power supply from the

60 CHAPTER 5. VACUUM COMPONENTS
wall, the resistance of the tapes allow the tapes to be heated to the desiredtemperatures. (See Figure 32)
Because of the different geometry of the various areas of the chamber, andthe fact that the heating tapes cannot effectively be wrapped continuously onthe whole chamber at varying angles and surfaces, the characteristics of theheating tape had to be customized for each port and area. The resistance andpower required for each heating tape for each section was calculated so thata maximum temperature of at least 250oC could be achieved. The calculateddata for each heating tape for each section of the chamber can be found inTable B.3 in Section B.2.
5.6.2 Power Control
Cryopump
The power to the cryopump heating tape is controlled by the smaller Variaccontroller which is cylindrically shaped and painted with a blue greyish color.(See Figure 34) This Variac controller should be able to control the voltageacross the cryopump heating tape so that temperature changes of 20-25oCper hour, and a maximum temperature of 150oC may be maintained.
Main Chamber Body
The power to the main chamber heating tapes are controlled by the largerVariac controller which is hexagonally shaped. (See Figure 34) This Variaccontroller should be able to control the voltage across all the heating tapesso that temperature changes of 20-25oC per hour, and at least a bake outtemperature of 250oC may be maintained.
The heating tapes on the ports and those on the main body may beseparately powered if desired. There are two electrical lines, one for each,coming off of the heating tapes. These two lines go through a plastic casingthat is mounted on one of the steel support bars, right next to the gate valve.(See Figure 32)
The fuse inside either the Variac or the transformer behind the Variacshas blown a couple of times. The blown fuses have been replaced, and thetransformer has been fixed, however there still may be problems when tryingto achieve high bake out temperatures.

5.7. POWER SUPPLY RACKS 61
5.6.3 Temperature Monitoring
Two K-type thermocouple temperature gauges have been mounted on thechamber walls. The thermocouples measure the temperature of the chamberwalls, providing a way of monitoring the bake out temperature.
Aluminum tape and high temperature silicon glue have been used sothat the thermocouples are firmly attached to the surface of the chamberwalls. This is important because it minimizes the amount of contact with therelatively cool air outside of the chamber walls, hence providing an accuratereading of the temperature of the chamber walls.
A portable thermocouple and reader has been used also. This is usefulin monitoring the temperature of the various parts of the vacuum chamber.For example, it can be used to monitor areas where excess heat may damagethe components, such as areas where Viton o-rings are used.
5.6.4 Aluminum Foil
Aluminum foil provides insulation when baking out the vacuum system. Alu-minum foil should be tightly wrapped around all areas of the vacuum systemthat require baking out. These sheets of aluminum foil can be reused whenbaking out.
5.7 Power Supply Racks
There are two racks used for our vacuum system. (See Figure 47) One con-tains the RF power supply for the sputter system (left rack in Figure 47).The other (right rack in Figure 47), from top to bottom, contains a powerswitch for the fan in the rack, voltage display for the amount of gas flowthrough the mass flow controller, heating tape switches and the thermocou-ple temperature readers, the crystal monitor, evaporator power supply, andthe Variac controllers.
5.8 UHV Cleaning
Creating and maintaining a UHV clean environment is essential for achievingUHV vacuum. Dust and dirt must be removed from all components insidethe vacuum system. Perhaps it is most important to eliminate any oil inside
62 CHAPTER 5. VACUUM COMPONENTS
the vacuum chamber. Overcoming outgassing from oil in the system can takedays or weeks of constant pumping. In most cases oil completely compromisesthe vacuum system from achieving UHV altogether.
5.8.1 Principles and Precautions
• If any part of the body comes in contact with any harmfulchemicals, immediately wash affected area with flowing waterand soap. If irritations arise or persists, contact proper helpor authority immediately.
• Be careful so that prolonged contact with fume, gases, or vapor fromthe chemicals are avoided. Always provide adequate circulation andventing of air in the room.
• Anything that will be placed inside the vacuum system must be madeof UHV safe material (aluminum, stainless steel, or other materialswith low outgassing material).
• Anything that will be placed inside the vacuum system must be UHVclean- free from oil, dirt, contaminants, or coated with material that isnot UHV safe.
• Two steps should be used at all times when cleaning. First, hexane(or acetone) should be used to remove oil. Second, methanol should beused to remove any remaining residue left by hexane of acetone. Usereagent or purer type to avoid contamination from the cleaning agentsthemselves.
• Always use clean gloves and clean Kimwipes when cleaning surfaces orhandling any parts that have been cleaned. Gloves, after worn, shouldbe cleaned with hexane (or acetone) to eliminate oil (if the gloves aresafe for these chemicals, such as the green nitrile gloves or latex gloves,although these chemicals should be used carefully on the latex gloves),and then with methanol using Kimwipes.
• Anything in indirect and/or direct contact with human skin contami-nates it from UHV usage, and hence should be cleaned properly. For ex-ample, gloves that touch clothes, telephone, tables, or even the hexane,acetone or methanol bottles should be considered as ‘contaminated.’

5.8. UHV CLEANING 63
• Be careful when taking off or installing flanges, especially if the boltholes may have some traces of anti-seize lubricant. Clean the areason the flange and the mating port that may be considered part of the‘inside’ of the vacuum system (usually anywhere inside of the diameterwhere the knife edges clamp onto the copper gaskets). Usually acetonefollowed by methanol works well for removing the anti-seize lubrication.
• It is a good practice to place clean parts separately on clean sheets ofKimwipes.
• If storing the clean parts, wrap them in clean sheets of Kimwipes, andthen wrap this around with aluminum foil, before storing.
• It is a safe practice to store all clean parts separately, with notes orsigns that ensure others know the parts are clean.
• Contaminated gloves should be replaced and/or cleaned before the finalcleaning components. For example, when cleaning a metal plate, theplate can be dipped in a container containing hexane, together with thehands with the gloves on. This allows the gloves to be cleaned whilecleaning the plate simultaneously. The plate should then be wipedwith Kimwipes, and then dipped in methanol together with the gloves.Kimwipes should be used again to wipe off the methanol, at the sametime being careful that the gloves are not contaminated until the cleanmetal plate has been placed on a clean sheet of Kimwipes.
• It is always better to be overly cautious than to be semi-cautious.
• Assume that whatever has not been cleaned by yourself or is not knownto be clean, is ‘contaminated.’
5.8.2 Procedures
1. First put on disposable latex or vinyl gloves. Be careful not to touchthe fingers of the gloves. Touching these areas contaminate them withbody oil. Clean the gloves with methanol and Kimwipes. Latex glovescan be cleaned with acetone which will eliminate the oil.

64 CHAPTER 5. VACUUM COMPONENTS
2. When cleaning with hexane or acetone, put on a pair of nitrile glovesor other gloves that can withstand these chemicals, over the disposablegloves.
3. Repeat the following for first hexane (or acetone) and then methanol:
(a) Clean the gloves with hexane (or acetone) and methanol.
(b) If possible, use an ultrasonic cleaner when cleaning, as this willvibrate and get much of the dirt from the small areas, holes, andcomponents that are difficult to clean otherwise.
(c) Soak the parts to be cleaned adequately (5-15 minutes) in theultrasonic cleaner, or a container with the chemical. Soaking isnot necessary, and if desired the parts may just be wiped with thechemical.
(d) Wipe off the chemical and dirt with clean sheets of Kimwipes.
(e) Place the clean parts on adequate sheets of Kimwipes.
4. Install, mount, or assemble the clean parts together. Always ensurethat clean parts are not contaminated by any contact with ‘contami-nated’ items or gloves. If ‘contaminated,’ clean the affected areas againas necessary.
5. If parts are not installed immediately after being cleaned, store in cleansheet of Kimwipes, and wrap around with aluminum foil.
6. Dispose of used chemicals properly. BYU Waste Management is varyhelpful in the proper disposal of these chemicals.
7. Dispose of gloves and clean the working area.

5.8. UHV CLEANING 65
Table 5.1: Usage of the Vacuum Chamber PortsPort Diameter Usage
Top of the Chamber(See Figure 18)
Center port 6” Sample Stage2 Angled ports 4.5” May be used in the future for a mass spec-
trometer or load-lock system2 Angled ports 2.75” Oxygen line, crystal monitorOffside port 2.75” Ion gauge
Left, Side of the Chamber(See Figure 19)
Short, lower port 8” EvaporatorLeft, upper port 8” Gate valve and cryopumpRight, upper port 8” Roughing line, sorption PumpsAngled port 4.5” Ellipsometer Output Unit (Can be inter-
changed with the Input Unit if desired)Right, Side of the Chamber
(See Figure 20)Long, lower port 8” Not currently in useAngled port 4.5” Ellipsometer Input Unit (Can be inter-
changed with the Output Unit if desired)Right, upper port 2.75” Shutter system for the sample stage
Bottom of the Chamber(See Figure 21)
Bottom port 8” Sputter gun

66 CHAPTER 5. VACUUM COMPONENTS

Chapter 6
Deposition
6.1 Additional Chapter Definitions
Breaking Vacuum Reference to opening the vacuum chamber at atmo-spheric pressure.
Cross-contamination Mixing of two or more different materials, thus com-promising the purity of the sample.
Evaporation Boat Casing, plate, or wire used to hold and heat the mate-rial source for evaporation. Usually made of tungsten to withstand thehigh temperature created by the current applied and the resistance ofthe boat.
Mean Free Path The average distance that gas molecules travel beforecolliding with other gas molecules. Lower pressures increase the meanfree path since there are less gas molecules for collision to occur thanthat of higher pressures.
mtorr 1×10⁻³ torr. The typical pressure range for sputtering is about 1-100mtorr.
RF (radio frequency) An oscillating electrical signal much like an ac (al-ternating current) signal.
Target The source containing the material that deposits onto a film.
67
68 CHAPTER 6. DEPOSITION
Our UHV chamber allows for two different methods of deposition- RFmagnetron sputtering and thermal evaporation (physical vapor deposition).These two methods allow flexibility and versatility in the material type andcomposition of thin films created in the chamber. The deposition pattern forboth sputtering and evaporation typically follow the line of sight, i.e. theatoms leaving the source deposit onto whatever surface they ’see’ if they hadeyes.
6.2 Sputtering
Sputtering refers to the method of deposition that uses ions impacting asurface to create a train of collisions in the target material, thus emittingatoms from the target material into the chamber. It is analogous to a cueball (ion) breaking up a set of billiard balls (a pool of atoms), scattering theballs in all directions. The efficiency of sputtering is related to the energytransfer that takes place in these collisions.[13] There are two main typesof sputtering, categorized by the source of the power supply. These are dcsputtering and RF sputtering which use either a dc (direct current) or an RF(radio-frequency) electrical power source.
6.2.1 Design and Building
The sputtering system we implemented uses a Mighty MAK 4” from US Inc.It is a planar magnetron sputtering system, powered by an RF power supply.This will be described in more detail in Sections 6.2.4, 6.2.5.
The sputter gun is placed inside the chamber from underneath, throughan 8” flange. The flange initially used is a conflat flange with a quick-coupler,o-ring sealed fitting. The quick-coupler fitting contains a small Viton o-ringinside which tightens around the shaft of the sputter gun as the quick-couplernut is tightened. This nut should be no more than hand tightened.
The steel cart that the vacuum chamber sits on was an obstacle wheninstalling the sputter gun. To provide enough space for the sputter gun tobe installed, and to allow the shaft of the sputter gun to extend below thebottom flange after it has been installed, a hole of about 8” diameter wascut from the metal plate below the bottom flange. The sputter gun can thenbe installed through this hole, although some hard work may be required sothat the UHV clean sputter gun does not touch external areas.
6.2. SPUTTERING 69
There are two stainless steel collars, one right below the quick-coupler nut(on the outside of the chamber) and another that is placed against the insideof the 8” flange (on the inside of the chamber). The outer collar (relativeto the chamber) was mounted to hold the sputter gun from being sucked infurther into the chamber, which would be caused by the pressure differentialbetween atmosphere and vacuum when the system is under vacuum pressure.The inner collar was mounted to hold the sputter gun from falling downbecause of the force of gravity.
The quick-coupler, o-ring sealed fitting should be a temporary fitting.The reason for using this o-ring seal initially was to first ensure the appropri-ate, working position of the sputter gun in the chamber before permanentlybrazing or welding it to the flange, in which case the stainless steel collarsmay be unnecessary. (See Figure 35)
6.2.2 Plasma
Plasma, or discharge, is the collection of ionized gas composed of ions, elec-trons, and neutral particles that is electrically neutral overall. The densityof the charged particles in a plasma is large enough to promote Coulombicinteractions.
A plasma must be created in order for sputtering to begin. Argon istypically used as the medium of the plasma. Argon is a noble gas, so itremains relatively unreactive in the deposition process. This keeps the filmdeposited by the desired material without any impurities from the plasmasource.
The charged particles in the plasma allow for Coulombic interactions totake place among the ions and electrons, creating a fluidlike behavior in theplasma. Typically there are about 1-10 charged particles per 10,000 neutralparticles in a plasma. At pressures of 10 mtorr, in room temperature therewill be about 3 × 10⁹ ions and electrons in 1 cm3 volume. The averagemeasured electron energy is about 2 eV, which corresponds to an extremelyhigh temperature of some 23,000 K. However there are relatively few electronsto raise the chamber temperature by much. Neutral atoms and ions in theplasma have energies of 0.025 eV (T = 290 K) and ∼0.04 eV (T = 460 K)respectively. Ions have higher energies due to that obtained from the electricfield.[13] When the ions are accelerated to the target, their energies increaseto several hundred eV, sufficient to break off atoms from the target source.
The creation of plasma is evident from the noticeable sudden tempera-
70 CHAPTER 6. DEPOSITION
ture increase of the chamber, which could be seen from the thermocoupleconnected to our chamber wall. Because the plasma is positioned in vacuumspace away from the chamber walls, and the temperature increase is not sus-tained well enough, the chamber does not remain hot. However, electricaland thermal cautions should be taken when creating a plasma. The brightlight that is emitted from the plasma source is another evidence of plasmathat is easy to see. In our chamber with an argon plasma source, we wereable to see noticeably bright, purplish light that was emitted through thewindows of the in situ ellipsometer ports.
6.2.3 Procedures and Principles of Operation
Each step in operating a sputter gun can be broken down in their respectiveorder to target preparation, gas medium backfilling, plasma formation, andsputter deposition.
Target Preparation
First, a target plate is placed on the sputter gun parallel to the film substrate.The target must have a smooth contact with the sputter gun, a contact thatis both electrically and thermally conductive.
Thermal conduction is required to allow for appropriate cooling, which isprovided by the sputter gun water cooling lines. Thermal conductivity canbe provided by applying a very thin film of vacuum safe paste between thetarget and the sputter gun block. (US Inc. provides Thermal Contact Pastewhich is essentially a type of vacuum grease.)[14]
We did not use any paste with the ruthenium target that was sputtered.(Ruthenium measurements will be discussed in Chapter 8) This was to avoidany possible outgassing of the paste that may compromise UHV vacuum.Instead, we soldered the ruthenium target with high purity (99.97%) indiumonto a copper backing plate provided by US Inc. This copper plate was thencoated with a thin indium foil, which provided both the electrical and thermalcontact between the sputter gun block and the target. Indium was chosenbecause of its low outgassing, ideal for vacuum systems, its low melting point(∼ 250oC), and malleability. It was soldered so that the ruthenium targetcould later be taken off of the plate for use in other sputter systems. (Referto Figure 38)
6.2. SPUTTERING 71
Gas Medium (Argon) Backfilling
The chamber should be backfilled with the gas medium for the plasma to becreated, usually argon. There should be enough of this gas medium in thechamber to provide the discharge. At the same time the gas should be inconstant flow. To accomplish this, the gate valve for the pump should beslightly open, usually about 1
4 open. The recommended operating pressure forMighty MAK, is 0.6 - 600 mtorr of argon, while the most efficient operationoccurs between 2 - 15 mtorr.[14] The argon pressure should be raised highfirst to create the plasma. Once the plasma is created, the argon pressurecan be lowered.
Plasma Formation
A DC sputter gun, powered by DC power, produces a plasma through alarge voltage difference. An external potential difference is applied from thesputter power source. In our case the power source is RF. (The RF powersource is itself difficult to manage. It’s operation is discussed in detail inAppendix A.) The maximum power that can be handled by the MightyMAK 4” is DC power of 3000 watts, or RF power of 1200 watts.
In DC sputtering, the target is charged to a high negative voltage (3 to 5kV)[12] while grounding the outer parts of the sputter gun. In RF sputtering,the target is kept at a negative potential most of the time, and at periodicintervals it becomes positive for a very brief time. The argon is ionized andplasma is created above the target. The collision of argon ions from theplasma begins the deposition process.
Sputter Deposition
(Refer to Figure 36)The ions created from the plasma source collide with the target material onthe sputter gun to initiate and maintain the sputter deposition process. Thesecollisions transfer kinetic energy to the atoms from the target material, whichbreak the bonds from the target source and are emitted into the vacuumchamber. These atoms from the target which are mostly neutral, scatterin all directions away from the target. Many of these atoms will depositonto the substrate, creating a thin film. A typical sputter deposition rate is∼ 3× 10¹⁶ atoms/cm2/sec.[13]

72 CHAPTER 6. DEPOSITION
6.2.4 RF Sputtering
When sputtering, insulating materials tend to accumulate positive ions whenkept at a negative voltage. This saturates the target so that the targetbecomes electrically neutral as a whole, eliminating any sputter deposition.
RF sputtering was invented to deposit insulating materials. DC sputter-ing of an insulating material would require an impossibly large voltage, inthe order of 1012V, to operate.[13] RF sputtering uses an oscillating radiofrequency signal similar to an ac signal. The oscillating signal allows thetarget to remain at negative potential for most of the time, while switchingto positive potential for relatively brief periods of time. This brief switchallows the insulating material to remove positive ions that accumulated onit. When the target potential becomes negative again, the ions can thenbombard the target, allowing the sputter deposition process to continue.
Two effects of RF sputtering are notable. First, ionizing collisions dueto oscillating electrons reduce the need for additional electrons to sustainthe plasma. Second, RF voltage can couple through any kind of impedance,which makes sputtering of material possible regardless of its resistivity. Typ-ical RF frequencies used range from 5 to 30 MHz. Because the FederalCommunications Commission has reserved 13.56 MHz for plasma formation,this is the frequency most widely used.[13]
6.2.5 Magnetron Sputtering
Magnetron sputtering uses electric and magnetic fields to enhance sputtering.It is the most widely used commercial method of sputtering. The magneticfields prolong the life of the electrons in the plasma. This enhances theprobability of ion collisions, leads to a larger discharge current, and increasesthe sputter deposition rate.[13] More importantly it allows sputtering to bepossible at much lower pressure (1-3 mtorr) than that of a non-magnetronsputter gun.
Sputtering at low pressures produce dense and tightly bound thin films.The mean free path is inversely proportional to pressure. So at low pressures(1-3 mtorr), sputtered atoms can travel a relatively large distance (∼ 1-10meters) without colliding with other atoms or gas molecules. This allows thesputtered atoms to arrive at the substrate with much of the initial energythey had when they left the target. Because of the high energy with whichthe sputtered atoms arrive at the substrate, the film produced tend to be

6.2. SPUTTERING 73
dense and tightly bound.In magnetron sputtering, magnetic fields are created by magnets placed
behind the target, with their south poles toward the center of the sputtergun. This creates a magnetic field pointing toward the center, and parallelto the target plate. (Refer to Figure 37) Because the cathode, which is thetarget material, is kept at negative voltage, the electric field points down,and into the target. Electrons that are created from the cathode begin toaccelerate toward the anode, and away from the target source. As theyaccelerate, the presence of the magnetic field causes the electrons to returnback to the target in a helical path. This is due to the Lorentz Force on theelectron:
FLorentz = −q(E + v ×B) (6.1)
where q, v, E, and B are the electron charge, velocity, the electric field, andthe magnetic field respectively. Thus the electrons ‘hop’ along the surfaceof the target, rotating along this track. This track of the electrons is wheremost of the sputtering occurs, since the ionization of the gas is most intensethere.[13] This is evident by the circular ring that forms on the target whenwe have sputtered. (Refer to Figure 38)
6.2.6 Advantages
• Sputtering allows for the composition of the target material to bemostly preserved in the deposition process of films. The ability todeposit metal alloy films with the same composition as the target isone of the main reasons for the wide use of sputtering. This is an ad-vantage over evaporation, in which a composite material breaks into itsindividual component materials in separate stages of evaporation.[13]This property of evaporation is analogous to water and alcohol in liquorboiling out at different temperatures.
• High kinetic energy of sputtered atoms (2 - 30 eV)[13] allows for fastdeposition. Sputter deposition rates are improved with an RF sputtersystem because of increased density of the plasma.[12]
• A sputter gun allows for good control over deposition initiation andcompletion. When a plasma is created or destroyed, sputtering beginsand ends almost immediately without any lingering deposition that istypical in evaporation.

74 CHAPTER 6. DEPOSITION
6.3 Evaporation
Evaporation is much more simple in its operating principle than a sputtersystem. The basic idea is that current is sent through an evaporation boatwhose resistance coupled with the current produces extreme heat. When ap-propriate temperature and vapor pressure have been reached, the depositionbegins.
The first known evaporations were conducted by Faraday who explodedmetal wires in vacuum. His attempt led to the discovery of thermal evapo-ration in the late 1880’s. These techniques were used to study properties ofthin films for many years since then. However, most of the applications ofthis technique arose in the 1940’s and 1950’s.[12]
6.3.1 Design and Building
A three-boat evaporator using four medium current electrical feedthroughsfrom MDC Vacuum Products Corporation was used. We custom built fourhigh purity copper extensions and connections to attach three evaporationboats. We built the evaporator to handle up to three separate evaporationsin a single vacuum session (without breaking vacuum), two from each of thetwo alumina coated boats and one from the tungsten boat. These evapora-tion boats were obtained from R.D. Mathis Company. However, any boatsdrawing less than 150 amps may be used, the current limitation being thelimitation of the current feedthroughs. The bottom copper wire is the com-mon return line of the current while the other three copper wires may beturned on one at a time, not simultaneously. This system provides thin filmdeposition of up to three multilayers. (See Figures 39, 40)
Three alumina ceramic shields and two aluminum shields, mounted onan aluminum plate, are used to protect cross-contamination from the threeevaporation sources, if more than one boat were to be used together in thesame vacuum session. Alumina was used to prevent any shorting of theelectrical circuit in case contact is made with any of the three possible ‘hot’copper wires. The two aluminum shields on the side are to protect thechamber walls, and the bottom aluminum mount to protect the sputter gunbelow. The two aluminum plates on the side should have enough distanceto avoid contact with any of the copper wires. The top of the shields areapproximately 1.5-2.0” above the evaporation boats.
To provide additional support for the copper extensions and the alu-

6.3. EVAPORATION 75
minum and alumina shields, a small alumina piece shaped as a keyhole ismounted on the bottom copper extension. The alumina support lies betweenthe back alumina shield and the 2.75” flange. (See Figure 39) This supportlies on the floor of the 8” port that the evaporator goes in.
Alumina is a very hard material, ranked right below diamond. It maybe brittle, however, so care should be taken when machining alumina. Ahigh-pressure water jet, from the Engineering Department, was used to cutthe alumina into the desired shapes and design. Although the surfaces thatwere cut by the water jet were rough and inaccurate, it suited our purposes.
The evaporator is to be mounted on the shorter of the two lower, side, 8”diameter ports. The electrical feedthroughs, built on a 2.75” conflat flange,is mounted on a 8” to 2.75” reducing flange. The approximate distancefrom the evaporation boats to the sample stage is about 6-8”. The centerevaporation boat was designed to be directly below the sample stage.
6.3.2 Principles of Operation
Current sent through the evaporation boat will produce heat. This will heatthe material to increase its temperature, thus its vapor pressure. Two modesof evaporation can be distinguished in this process of heating. They dependon whether the vapor from the material emanates from the liquid state orsolid state of the material.
Most metals require a melt into their liquid phase for evaporation to be-gin. Usually the element to be evaporated must achieve a vapor pressuregreater than 10−3 torr. Thus, if the element doesn’t achieve this vapor pres-sure before its melting point then melting is necessary for evaporation. If theelement is able to achieve this vapor pressure before its melting point, theneffective deposition is possible in its solid phase. Some elements that fit thelatter case are Cr, Ti, Mo, Fe, and Si that reach sufficiently high vapor pres-sures below melting, hence they sublime. A typical evaporation depositionrate is ∼ 1.3× 10¹⁷ atoms/cm2/sec.[13]
6.3.3 Advantages
• Simple operating principle. Only sufficient current and power shouldbe supplied to turn the system on.

76 CHAPTER 6. DEPOSITION
• Relatively cheap to obtain evaporation source material, boats, andequipment.

Chapter 7
Deposition Control
Effective deposition requires correct monitoring and control of the deposi-tion rate, amount, and duration. From the point of view of our thicknessmonitors, oxidation is like deposition. The mass of the film increases and itsthickness changes, usually increasing (with rare cases of thickness decreas-ing). Thus monitoring and control of oxidation is important and the samemeasurement tools can also be used. In our vacuum system there are aboutsix components that factor into the monitoring and controlling of the depo-sition and oxidation of thin films. These include the sample stage, shutter,quartz crystal monitor, oxygen line, argon line, and water cooling lines.
In addition to these components, perhaps the most effective monitor inthe system is the in situ ellipsometer discussed in Chapter 3. The in situ ellip-someter allows real-time measurement of deposition thickness and oxidationthickness relatively accurately.
7.1 Additional Chapter Definitions
VCR Fitting Fitting that requires the male fitting screwed into the femalefitting with a metal gasket/washer in between. Mainly used for gaslines, a VCR fitting is similar to a conflat flange in its sealing methodand effectiveness.
77

78 CHAPTER 7. DEPOSITION CONTROL
7.2 Sample Stage
(See Figures 41, 42)Vertical and horizontal adjustments are made to hold the substrate/film inthe correct position for material to be deposited. The adjustments also pro-vide additional degrees of freedom to align the ellipsometric beam. By thedesign of the sample stage the width of the film must be less than 2 inches,while the length can be up to 6 inches long due to the flange size of thesample stage port. The width of the film is to fit the 2” movement providedby the shutter in Section 7.3
7.2.1 Installation
(See Figure 43)The sample stage is mounted from the top facing down. It is directly
above the sputter gun and the evaporator. The height and lateral adjust-ments should first be made accurately outside of the chamber with cleangloves. These adjustments should position the film in the center and 6” fromthe surface of the flange the whole stage is mounted on. The substrate/filmshould be placed in the stage with the spring holding it well in place. Thelong side of the stage and the film should be perpendicular to the linearfeedthrough of the shutter.
7.3 Shutter
(See Figure 44)A shutter is necessary in order to protect the substrate/film from the impu-rities of the initial stages of sputtering or evaporation. This is because thesurface of the target material usually contains oxidation or impurities whichare sputtered or evaporated before the pure material. The shutter also allowsfor the deposition rate to stabilize before actually opening the film for de-position. By stabilizing the actual deposition rate, control over the amountand quality of the deposited film can be established.
We have placed an aluminum plate 0.25” underneath the sample stage.The distance between the sample stage and the shutter should be minimal,yet provide enough room for no accidental bumping of the shutter into thestage. This aluminum plate is attached to another aluminum mount that

7.3. SHUTTER 79
provides ∼ 0.50” vertical movement and ∼ 4” forward/backward movement.This setup is attached to a 2.00” linear motion feedthrough from MDC. Thisfeedthrough provides a 2” sideways movement of the aluminum plate througha bellow that preserves vacuum. 2” was the most cost effective movementrange for our shutter system. The 2” length in turn regulates the width ofthe sample film. An aluminum casing and spring held cap provide protectionof the shaft of the linear feedthrough from evaporated or sputtered atoms.
7.3.1 Installation
1. If the shutter has not been installed, then remove the sample stagefirst.
2. The aluminum mount and shaft casing should then be attached to thelinear feedthrough.
3. Insert this set up through the 2.75” port on the side of the chamberand tighten the flange bolts.
4. After the flange has been attached, the long aluminum plate can thenbe placed on the mount through the sample stage port above the shut-ter. The plate should then be placed appropriately and the screwstightened.
5. The sample stage can now be installed after any necessary adjustmentsare made.
This is a very difficult process where care should be given so that UHV safecleanliness is achieved. All parts should first be cleaned, clean gloves used,and any area where the arm or clothing has touched should be thoroughlycleaned.
7.3.2 Usage
Before pumping the chamber down to vacuum, the aluminum plate of theshutter must be positioned directly below the sample stage. It should ad-equately cover the sample film and be about 0.25” below the film. At thispoint, the correct position of the linear feedthrough should be noted by read-ing the position of the mark on the ruler of the feedthrough. This is gener-ally not at 2.00” mark. After this is completed, and when the chamber is in

80 CHAPTER 7. DEPOSITION CONTROL
vacuum, the following steps are recommended for appropriate usage of theshutter.
1. For each vacuum session, the shutter (the aluminum plate, not thewhole shutter system) must first be removed from underneath the sam-ple stage. This is accomplished by pulling the linear feedthrough handlecompletely away from the chamber.
2. The initial alignment, calibration, and measurements of the substrate/filmshould be made through the in situ ellipsometer at this stage.
3. Move the shutter back into its position directly underneath the samplestage by using the ruler mark noted before. The shutter should beprotecting the sample film before any deposition takes place.
4. When the deposition rate has stabilized, which can be monitored throughthe quartz crystal monitor, and after some time has passed for all theoxidation and impurities of the target surface to leave, the shuttermay be removed from underneath the sample film by pulling the linearfeedthrough away from the chamber.
5. After the desired amount has been deposited, the shutter may be placedunderneath the sample film to protect the film from any more deposi-tion.
7.4 Quartz Crystal Monitor
(See Figure 45)It is helpful to monitor the deposition rate and deposition amount in orderto control the thickness of each layer and the quality of the film created.A quartz crystal monitor measures both the deposition rate and the filmthickness.
A quartz crystal monitor by MaxTek, Inc. was installed. The crystaland electrical feedthrough are mounted on a 2.75” conflat flange. The lengthof the feedthrough from the inner surface of the flange to the crystal is 7”.This was to allow the crystal to be placed 1.5” away from the sample fromthe flange port that is 65o from the horizontal plane. The feedthrough wasvacuum brazed by MaxTek, Inc. Metal water cooling lines allow the crystalmonitor to be baked out without overheating the system and to provide a

7.4. QUARTZ CRYSTAL MONITOR 81
cool operating temperature. The monitor is placed on the 9” wide rack thatseats the evaporator power supply, the thermocouple gauge reader, and themass flow controller voltage reader.
A shutter was not installed to protect the crystal monitor from the initialdeposition process. Maxtek recommends that a shutter be installed for thesensor head which contains the crystal. This is to protect the crystal fromsmall droplets of molten material that may hit the crystal.[15] If the crystalis damaged by such material, the oscillation would cease and the crystalmonitor would not function appropriately.
7.4.1 Principle of Operation
The crystal used is a resonating quartz crystal which oscillates at its naturalfrequency. One of the crystal’s surface is exposed to deposition. The massof the oscillator is one of the factors which influences the natural frequencyof the crystal. As material is deposited onto the crystal, the mass of theoscillator (the crystal together with the deposited material) increases. Thischanges the resonant frequency of the crystal which can be detected. Byusing the acoustic impedance and density of the known material that isdeposited (which should be input in to the monitor before deposition begins),the monitor then calculates the deposition rate and thickness.
Tooling Factor
Careful calibration of the monitor is initially required. The calibration isperformed by comparing the apparent thickness of the crystal monitor withthe thickness of the film measured by a known and accurate instrument,such as an ellipsometer.[12] This calibration corrects for the position of thecrystal, which is at some distance away from the actual film, and any errorsin the calculation. From this initial calibration, all future measurements bythe crystal monitor will yield the thickness and rate of the deposition at theposition of the film, not at the position of the crystal.
The calibration is accomplished by adjusting the Tooling Factor of themonitor. The tooling is entered in percent units. Theoretically, the ToolingFactor depends only on the relative position of the source, the crystal, andthe substrate film as follows:[15]
Tooling% = (Distance from the source to the crystal
Distance from the source to the substrate)2 × 100% (7.1)

82 CHAPTER 7. DEPOSITION CONTROL
Equation 7.1 shows that a 100% Tooling Factor implies that the crystal isplaced exactly where the substrate film is. However, the tooling factor is notexactly equal to that in Equation 7.1. The Tooling Factor does not correctfor position alone, but all other factors contributing to the mis-calculationof the monitor. So the Tooling Factor should be adjusted to calibrate themonitor reading to correspond to an accurate measurement of the film byan independent source. The positive side of this is that the calibration maybe done only once, and no Tooling Factor adjustments should be necessaryafterwards.
Acoustic Impedance
The shear wave acoustic impedance of the material is required to accuratelyestablish the sensor scale factor when the crystal is heavily loaded by deposi-tion. The unit of the acoustic impedance is entered in 100,000 gm/cm2/sec.This should be obtained from a handbook of physics or other reliable sources.The shear wave acoustic impedance can be calculated from the shear modulusor the shear wave velocity and the density:
Acoustic Impedance = PC = PG, (7.2)
where
P = Density (gm/cm3)C = Transverse (shear) wave velocity (cm/sec)G = Shear modulus (dynes/cm2)
(7.3)
If the crystal is not heavily loaded, then using 8.83 × 100, 000 gm/cm2/seccan be used to obtain sufficient accuracy.[15]
7.4.2 Usage
A crystal monitor can be used as an additional thickness and oxidation mea-surement device that is independent of the in situ ellipsometer. Although notquite accurate and reliable by itself, it can give us a relatively accurate rangefor the thickness of the film layers along with the oxidation thickness. Thiscan contribute to evaluating the results from the ellipsometer by providingwhat to expect. In fact, by using the thickness obtained from the crystal

7.5. GAS CONTROLS- O2 AND AR 83
monitor restrictions of the model fittings by the ellipsometer can be made toobtain more accurate optical constants or film thicknesses.
• First, the appropriate acoustic impedance, density, and tooling factorshould be input, and accurate calibration should have been completed.
• To measure the thickness of each layer, restart before each layer isdeposited. Record the value of the crystal monitor thickness. Repeatfor each layer.
• To measure the oxidation of the top surface of the film, keep the crys-tal monitor on after deposition. The thickness may be reset or kept.Record the change in thickness when any oxygen is entered in the cham-ber. A recommended method is to measure the change of thickness overtime as the chamber is brought back to atmospheric pressure. Carefulmonitoring should take place as soon as the chamber is opened to at-mospheric air, or as soon as any oxygen enters the chamber. The initialoxidation may occur too quickly if care is not taken.
After repeated deposition, the life of the crystal will eventually expire.The monitor can show when to replace the crystal. The crystal can bereplaced by removing its container at the bottom of the feedthrough insidethe chamber.
7.5 Gas Controls- O2 and Ar
There are two gas lines installed in the system that affects deposition andoxidation. The argon line is used to provide argon for sputter deposition andto repressurize the system; the controlled oxygen leak gives control over thetotal amount of oxidation possible. (See Figure 46)
7.5.1 O2 Gas line
Oxidation can occur naturally on a film surface by atmospheric air whichcontains 21% oxygen by volume. For this to happen, the film in the chamberonly needs to be exposed to atmospheric air by opening the chamber toatmospheric air. Another method of oxidation is through a controlled leakvalve, which is installed in our system.

84 CHAPTER 7. DEPOSITION CONTROL
The controlled oxygen leak makes it possible to control the amount ofoxidation on the surface of the film before breaking vacuum. Also it is pos-sible to create multilayer films with each layer oxidized if desired. This canbe accomplished by sending in oxygen into the chamber after each layer offilm is created. Thus the oxygen leak provides variety and control over thetype of film created in the chamber.
The oxygen goes through a stainless steel 1/4” line. Stainless steel gasketsare used to provide the vacuum-tight seal in the VCR fittings. Two valvescontrol the flow of oxygen through the line. One of the valve is a UHVvariable leak valve, by Varian, Inc., and the other is an open/close valve byNupro Company. Both valves are connected through VCR fittings on a teefitting. This tee has 2.75” conflat flanges on its ends and is mounted on oneof the ports on the top of the chamber body.
Oxygen Line Valves and Flow Control
The Nupro open/close valve (model SS-4H) is placed before the variable leakvalve in reference to the flow of the oxygen from the gas tank. It is heliumleak tight, meaning molecules as small as helium cannot leak through theseal. However, if the knob is not tightened fully, there has been evidence ofvacuum leak through the valve.
If no oxygen is to flow into the chamber, then the Nupro valve should becompletely closed. If any oxygen is to flow into the chamber, then this valveshould be completely open. The amount of flow is then controlled by thevariable leak valve.
The Varian, Inc. variable leak valve controls the amount of oxygen flowinto the chamber when the Nupro valve is open. Leak rate adjustments arecontrolled by the finger knobs on the side of the valve. The seal inside thevalve is provided by an optically flat sapphire. The sapphire is controlled bya threaded shaft-and-lever mechanism that has a mechanical advantage of13,000 to 1. The sapphire compresses a metal gasket inside the valve whichresults in a permanent change in the gasket. However, the change is verysmall, and when the knob is returned to its previous position the leak rateremains approximately the same.
To open the valve from a closed, leak-tight condition, and provide a leak,the finger knobs must be turned a minimum of two full turns counterclock-wise. By turning the knobs (together) clockwise to the stop position againstthe handle, the valve is closed. Any state in between would provide a pro-

7.5. GAS CONTROLS- O2 AND AR 85
portional leak.Some of the specifications of the variable leak valve are provided in Ta-
ble 7.1.[16]
Table 7.1: Variable Leak Valve SpecificationsMinimum leak rate 1× 10⁻⁹ to 1× 10⁻¹⁰ torr-litres/secRate of change of leak Rate of change increases as the size of
the leak increases, giving precise control inproportion to the size of the leak
Vacuum range Atmospheric pressure to below 1 × 10⁻¹¹
torrTemperature range Up to 450oC in either open or closed posi-
tionInlet gas pressure 500 psi maximumGasket life ∼ 300 closures for unbaked systems; 20-
30 closures for baked systems. Gaskets arereplaceable
7.5.2 Ar Gas Line
Argon is an abundant inert gas which is ideal for vacuum systems since it doesnot chemically react with other molecules. Argon is used for two reasons.
1. Argon is used as the gas medium for creating a plasma, whose ionsprovide sputtering of a target material onto the films substrate.
2. Because argon does not react with the components and materials in thechamber, it is well suited for venting the chamber back to atmosphericpressure. Argon is much easier for a vacuum pump to pump out thanother gases in atmospheric air. Typically hydrogen, helium, and oxygenfrom air become difficult to pump out when adsorbed and absorbed bythe chamber walls or devices in the chamber.
By filling the vacuum chamber with argon first, the chamber walls andcomponents will first soak in argon. Then when the chamber is openedto atmospheric air, the argon will prevent much of the gases from air toadsorb and absorb into these parts. Thus pumping the chamber down

86 CHAPTER 7. DEPOSITION CONTROL
into low vacuum becomes much more efficient after venting with argonthan without.
The argon goes through a stainless steel 1/4” line. Stainless steel gasketsare used to provide the vacuum-tight seal in the VCR fittings. The mass flowcontroller is used to control the amount of flow of the argon. There are twoopen/close valves, one for the bypass line and another that provides the sealbetween the argon line and the chamber.
Argon Line Valves and Flow Control
A model FC-260 mass flow controller from Tylan Corp., with a maximumflow of 150 psig, is used. The purpose of the mass flow controller is to controlthe bulk flow of argon into the chamber when creating a plasma. The massflow controller is connected to a Simpson Electric voltage display that ismounted on one of the racks. (See Figure 47) There is also a knob next tothe display that controls the opening within the mass flow controller. Thiscontrols the amount of argon flow through the mass flow controller.
With the gate valve 3/4 way closed against the cryopump, the flow ofargon can be controlled well enough for the chamber base pressure to remainin the 10−4 torr range. Of course when creating a plasma, the base pressurecan also be raised to the 10−3 − 10−1 torr range necessary and also loweredback. (Refer to Section 6.2 for details)
The Nupro Company open/close valve (model SS-4H) is placed beforethe chamber in reference to the flow of the argon from the gas tank. It isthe final valve before any argon goes directly into the chamber. It is heliumleak tight, meaning molecules as small as helium cannot leak through theseal. However, if the knob is not tightened fully, there has been evidence ofvacuum leak through the valve.
The Nupro valve should be either completely open or completely closed.If no argon is to flow into the chamber, then this valve should be completelyclosed. If any oxygen is to flow into the chamber, then this valve should becompletely open. If the mass flow controller does not function well, then theNupro valve may be used to provide some control over the flow rate of argoninto the chamber.
When venting the chamber with argon, in order to open the chamberback to atmospheric pressure, the bypass line should be used. The bypassline is controlled by an open/close valve made by Veriflo Corp. Because theNupro valve is helium leak tight, the bypass valve does not have to be quite

7.6. TEMPERATURE CONTROL- COOLING LINES 87
as vacuum tight, although if it is it would be beneficial for the purity of argonflowing through the line.
The mass flow controller does not allow argon to flow freely, so it takesdays or sometimes weeks to fill the chamber with argon at atmospheric pres-sure. The bypass line allows the argon to bypass the mass flow controllerand directly enter the chamber, as long as the Nupro valve is opened.
7.6 Temperature Control- Cooling Lines
The RF power source for the sputter gun, the crystal monitor, and the sputtergun need to be cooled. The RF power supply needs to be cooled whenever inoperation due to heat generated inside the source. The sputter gun and thecrystal monitor require cooling especially when the system is at temperaturesabove 100-150oC.
It is recommended that water cooling of the sensor head be provided allthe time, except during short depositions at low temperatures. The sensorhead containing the crystal should not be operated above 100oC. Sufficientcooling can be provided by ∼ 0.2 gallons per minute water flow, in an en-vironment up to 300oC.[15] Thus, when baking out the chamber, the sensorhead and crystal should be appropriately cooled.
The sputter gun should also be cooled. For the Mighty MAK 4.0”, aminimum water flow of 0.75 gallons per minute should be provided. TheMaximum inlet temperature should not exceed 70oF/21oC.[14] The coolingof the magnetron sputter gun is mainly to protect the magnets since at hightemperatures magnets lose their ferromagnetic properties.
Cooling is provided by the water lines that connect the RF power supply,the sputter gun, and the crystal monitor. Distilled water from water coolingpipes in the Physics Underground Laboratory is used. (Refer to Figure 48)
7.6.1 Operation
1. First, the valves from the pipe source on the ceiling should be openedfor both the in-line and out-line. (See Figure 49)
2. Both control valves on the wall for the in-line and out-line should beopened. When opened, the yellow valve is aligned vertically and thebottom black valve is aligned horizontally. (See Figure 50)

88 CHAPTER 7. DEPOSITION CONTROL
3. It may be difficult, yet it is possible to know if water is flowing bypaying careful attention to the slight movement of the lines and thesmall noise produced when the valves are opened. (See Figure 48)
4. Check to see if there are any water leaks from the lines.

Chapter 8
Measurement and Analysis
8.1 Additional Chapter Definitions
Mean Square Error (MSE) The average sum of the square of the errors.MSE is generated by WVASE when fitting measured data to a partic-ular model. MSE shows how well the model fits the measured, exper-imental data. Generally MSE less than 1.0 in WVASE implies a goodfit. Higher MSE may demonstrate that the model (optical constants,thicknesses, etc.) may be incorrect.
8.2 Background
Dr. Allred’s XUV Research Group in Brigham Young University has beeninterested in understanding optical constants of ruthenium, ruthenium ox-ide (thought to be RuO2), the oxidation rate and amount of oxidation forruthenium thin films. I have been able to study and improve the optical con-stants of ruthenium, ruthenium oxide with the help of Cort Johnson, MichaelNewey, and others in Dr. Allred’s XUV Research Group. With the UHVthin film deposition chamber, I have been able to analyze ruthenium thinfilms in more depth, and at the same time understand the initial oxidation ofruthenium thin films from high vacuum pressure up to atmospheric pressure.
After a successful high vacuum pressure of 1.5× 10⁻⁷ torr (according tothe ion gauge connected to the senTorr gauge) was achieved on April 12,2001, several attempts were made to create a plasma above the sputter gun.
89

90 CHAPTER 8. MEASUREMENT AND ANALYSIS
On May 3, 2001, a ruthenium thin film was successfully sputtered from abase pressure of 1.0 × 10⁻⁶ torr (pressure had steadily risen in the vacuumsystem during this time period).
The sputtered ruthenium thin film was then analyzed with the in situellipsometer (M-44r spectroscopic ellipsometer with UV option from J.A.Woollam Co., Inc. together with the WVASETM software) through many dy-namic real time scans and single spectroscopic scans. Ellipsometric analysiswas then performed to improve the known optical constants for ruthenium,and measure the oxidation rate and amount of the ruthenium thin film.
8.3 Sputtered Ruthenium Thin Film - His-tory
May 3, 2001 Ruthenium was deposited onto the prepared substrate usingthe Mighty MAK 4” sputter gun. Base vacuum pressure inside thechamber was 1× 10⁻⁶ torr.
Before sputtering, the in situ ellipsometer was aligned and calibratedwith the silicon substrate on the sample stage. The silicon oxide layeron the substrate was measured to be about 31.6A. with a mean squareerror (MSE) of 0.9064. The incident angle was also fitted by WVASEto be about 69.25o.
Sputtering started at 1:18pm with a deposition rate of about 1A persecond until 1:24pm. The crystal monitor read 350A total thickness. Itshould be noted that the crystal monitor was used for the first time, sothe tooling factor could not be calibrated properly and the rutheniumacoustic impedance could not be found. The tooling factor was setto 100%, the acoustic impedance set to 8.83 × 100, 000 gm/cm2/sec,and the density was correctly set to about 12.45 gm/cm3. Hence thereadings of the crystal monitor could not be taken to be correct untilfurther calibrations and corrections were made.
Real time continuous ellipsometric measurements were made during thesputtering process, however the data was lost due to computer failure.The last read data and fit, using optical constants obtained earlier (inTables 8.1, 8.2), fitted the thickness of the ruthenium layer as 243.4A.
Beginning at 2:55pm on May 3, real time continuous ellipsometric mea-
8.3. SPUTTERED RUTHENIUM THIN FILM - HISTORY 91
surements were again made for each 1-2 minute periods for about 7+hours.
May 10, 2001 Crystal monitor read 348A, chamber pressure read 2.810−6
torr. The chamber was prepared to be open to air by first using argon tobackfill it to atmospheric pressure. At 12:01pm, gate valve was closedand the pressure rose to 2.7×10⁻⁵ torr in about 15 seconds. Beginningat 12:04pm the argon line was open to the chamber, and argon flowedthrough the mass flow controller (the bypass line for argon had not yetbeen installed). At 12:45pm, the chamber pressure rose to 1.1 torr andthe crystal monitor read 350A.
May 11, 2001 At 4:00pm, the crystal monitor read 356A, indication someoxidation of the ruthenium film that was deposited on the crystal. At4:38pm, chamber pressure read 2.2 torr.
May 15, 2001 At 3:05pm, chamber pressure read 9.9 torr, and the crystalmonitor read 356A.
May 17, 2001 At 3:40pm, chamber pressure read 7.2 × 101 torr, and thecrystal monitor read 355A.
May 18, 2001 At 4:35pm, chamber pressure read 1.5 × 10² torr, and thecrystal monitor read 355A.
May 23, 2001 At 4:00pm, chamber pressure read 3.6 × 10² torr, and thecrystal monitor read 359A. After opening the chamber on a future date(May 29), it was apparent that 3.6×10² torr was atmospheric pressure,as the thermocouple gauge was not reading the pressure correctly inthis range.
May 24, 2001 At 3:30pm, chamber pressure read 3.6 × 10² torr, and thecrystal monitor read 360A.
May 25, 2001 Chamber pressure read 3.8× 10² torr, and the crystal mon-itor read 360A.
May 29, 2001 Chamber pressure read 3.6× 10² torr, and the crystal mon-itor read 361A. The argon bypass line was installed on this day. Up tothis day, single spectroscopic scans were made of the film, once a dayfor about the past week.

92 CHAPTER 8. MEASUREMENT AND ANALYSIS
The chamber was flooded with argon through the argon bypass line.The thermocouple reading decreased to about 2.1 × 10² torr. It hadbeen inside the chamber reading the pressure incorrectly. The flangeon the left side of the chamber, above the senTorr gauge, was openedand air at atmospheric pressure was introduced into the chamber.
Real time continuous ellipsometric measurements were made from thetime of opening the chamber to air for about 30 minutes every 1-2seconds. Real time continuous ellipsometric measurements were againmade from an hour after opening the chamber to air until the followingday, every 1-2 minutes.
May 30, 2001 At 6:30pm, the open chamber pressure read 3.9 × 10² torr,and the crystal monitor read 357A.
Another spectroscopic measurement was made of the ruthenium film.In situ measurements of the film up to this day were analyzed withWVASE by Michael Newey and I. After comparing several in situ dataand by fitting for the ruthenium thickness, using optical constants de-rived from literature (in Tables 8.1, 8.2), the thickness of the rutheniumlayer alone averaged out to be about 290A while the apparent thick-ness of ruthenium oxide ranged from 0-67A with an MSE around 14.The errors and the thickness of the ruthenium oxide were so high thatwe decided to determine our own optical constants for ruthenium, inorder to obtain a more realistic model than what we had before. (SeeTable 8.3)
May 31, 2001 The ruthenium film was taken out of the sample stage. Thesurface of the film showed visible blemishes. After showing it to Dr.Allred several days later, he stated that delamination or lift off of thesurface had occurred. This was due to compressional stress. (See Fig-ure 51) More water vapor was introduced by blowing on the film, whichcaused the top layer of the film to be lifted up by too many bubbles.The film may have been ruined.

8.4. RUTHENIUM AND RUTHENIUM OXIDE OPTICAL CONSTANTS93
8.4 Ruthenium and Ruthenium Oxide Opti-cal Constants
8.4.1 Initial Optical Constants
During the summer of 2000, Cort Johnson had created some ruthenium thinfilms. He and I measured these and other old ruthenium thin films (oneto two years after they had been deposited) using the M-44r spectroscopicellipsometer from J.A. Woollam Co., Inc. Measurements were made with thevariable angle option that had been installed previously in April 2000, aspart of my research.
Cort Johnson and I had previously adapted the ruthenium[17][18] andruthenium oxide (RuO2)[19] optical constants that had been published. Cortextrapolated these published constants over the range that the M-44 ellip-someter covered, with the help of the WVASE program.
These optical constants that Cort Johnson obtained were then improved.Michael Newey and I, using WVASE, attempted to find the best fit basedon these optical constants for six different ruthenium sample measurements.The optical constants were fitted by WVASE and were then initially used forthe modelling of the newly created in situ ruthenium thin film.
The optical constants initially used when modelling the newly sputteredruthenium film, which was created on May 3, 2001, are shown in Tables 8.1, 8.2.
8.4.2 Improved Optical Constants
Michael Newey and I did not attempt to recalculate the optical constants forthin ruthenium oxide because the ruthenium oxide layer on the sample wasvery thin. We did recompute the optical constants for ruthenium thin filmsbased on the in situ ellipsometric measurements made of the ruthenium thinfilm in high vacuum. We assumed that the thickness of the ruthenium oxidelayer on top of the film was negligible. This assumption was safe to takebecause the measurements were made under the following conditions:
1. Measurements were made within an hour of sputtering.
2. The film was in high vacuum (∼ 1×10⁻⁶ torr) during the measurement.
3. After the XUV group has analyzed previous ruthenium thin film sam-ples, oxidation of ruthenium has been known to be slow and relatively

94 CHAPTER 8. MEASUREMENT AND ANALYSIS
thin, even after the film has been exposed to air at atmospheric pressurefor a long period of time (months or years).
On May 30, 2001, Michael Newey and I, with this assumption and usingthe previous in situ measurements, improved the ruthenium optical constantsof Table 8.1. The silicon oxide layer was set to 33.8A with an MSE of 1.054after fitting for the silicon oxide thickness previously that day. The incidentangle was fixed to 69.25o after trying different angles that ranged from 62-73o. 69.25o was chosen as it is what WVASE fitted when the uncoated siliconsubstrate was measured inside the system before sputtering.
In computing optical constants of a metal thin film, knowing the thick-ness of the film can be important. This can be done iteratively. We tookthree thicknesses suggested by the measurements and determined the opticalconstants for all three.
We set the ruthenium oxide layer of the model in WVASE to be nearly 0A(0.1A ). The previous ruthenium optical constants were adapted to severalof our in situ measurements with the thickness of ruthenium fixed to 243A,290A, and 352A to fit the constants. Only the measurements made on May3, when the chamber was in high vacuum (in the 1× 10⁻⁶ to 1 × 10⁻⁵ torrrange) were taken into account.
243A and 290A thicknesses were chosen because when the WVASE fittedfor the thickness of ruthenium on the sputtered film using the constants inTables 8.1, 8.2, the fitted values were 243A and 290A on May 3 and May30 respectively. (Refer to Section 8.3). 352A was used because this was theinitial crystal monitor reading for the amount of sputtered ruthenium on thecrystal.
After comparing various data that were measured after the deposition,we noticed that the optical constants did not vary much over the range ofruthenium thicknesses we had used. So we fixed the Ru thickness to be 352Aand the RuO2 thickness to nearly 0A (as before). We used the measurementsmade on May 3, which began an hour and a half after sputtering, while stillin high vacuum. Out of these measurements, data from 2, 200, and 400minutes into the measurement was used to fit for the optical constants ofruthenium. These improved optical constants for thin film ruthenium areshown in Table 8.3.
8.5. RUTHENIUM OXIDATION 95
8.5 Ruthenium Oxidation
8.5.1 In High Vacuum
In high vacuum (1× 10⁻⁶ to 1× 10⁻⁵ torr range), there seems to be minimalamount of oxidation, which was one of our assumptions when developing theruthenium optical constants in Section 8.4.2. After analyzing the measure-ments made in high vacuum, with WVASE using the initial optical constantsin Tables 8.1, 8.2, the ruthenium oxide layer would either remain at 0A orjump to about 67A (with an MSE of about 14 or more) when the incidentangle was fixed at 69.25o or allowed to be fitted respectively. The latter ishighly unlikely from our understanding that ruthenium film oxidizes veryslowly and forms a rather thin oxide layer. It is very likely that 0A of RuO2
layer was formed in high vacuum.The crystal monitor did not show any change greater than 1-2A even
after it remained in high vacuum for a week. (See Section 8.3) Althoughthe crystal monitor may not have been completely accurate or reliable, anyoxidation of the ruthenium film on the crystal should affect the crystal tosome extent that could be noticed by a change in the crystal monitor reading.Hence, the readings of the crystal monitor also support that very little (0-1A), if any, oxidation of ruthenium occurred in high vacuum.
8.5.2 During Argon Backfill of Chamber
Both the crystal monitor and the ellipsometric measurements show a changeof the film layer. This is due to the small amount of oxygen that may haveentered together with the argon, or through outgassing or leaks (though leaksare probably unlikely) in the vacuum system.
The crystal monitor reading changed from 348A to 360A over the twoweek period of filling the chamber with argon from May 10 to May 24. Duringthis period, the chamber pressure rose from 2.8 × 10⁻⁶ torr to atmosphericpressure. Air at atmospheric pressure was not introduced at this stage.
The ellipsometric data was not quite conclusive, however. Using theimproved Ru optical constants, the ruthenium oxide thickness after about 30minutes of backfilling the chamber with argon came out to be about 0.7A. Infact the oxide layer seem to decrease from 1.6A to 0.7A over this initial 30minute period of argon backfilling. The ruthenium layer remained at about312A. The average MSE was 1.8. (See Figures 52, 53)
96 CHAPTER 8. MEASUREMENT AND ANALYSIS
8.5.3 In Air At Atmospheric Pressure
The vacuum system was open to air at atmospheric pressure on May 29,about three and a half weeks after sputtering the ruthenium film. Two stagesof the oxide development were measured initially- the first 20-30 minutes andthe next 24 hours after the first hour.
The crystal monitor increased about 1A initially from 360A, however de-creased to 357A the next day on May 30. The flux of gases inside the chamberafter opening it to air may have caused the slight drop in value. The crystalmonitor reading has been mostly disregarded in analyzing the oxidation ofruthenium in air at atmospheric pressure. Instead the ellipsometer has beenused more extensively to understand the initial oxidation of the rutheniumthin film in air.
8.5.4 First 20-30 Minutes of Exposure
When the chamber was open to atmosphere, real-time ellipsometric measure-ments were made every 1-2 seconds for approximately 20-30 minutes. Thefitted Ru and RuO2 layers were 280A and 3.2A thick respectively. Therewere slightly noticeable changes (slope of Psi data changed) in the ellipso-metric measurements, over the first 20-30 minutes of exposure. (See Fig-ure 54) This demonstrates the high probability of some initial oxidation inair at atmospheric pressure.
Fittings for Ru and RuO2 thicknesses fluctuated over this period of time.(See Figures 55, 56) The spike/dip in the figures may have been caused bythe flux of gases present after the chamber was open to atmosphere.
8.5.5 First 24 Hours of Exposure
After about an hour had passed since opening the chamber to atmosphere,real-time ellipsometric measurements were made every 1-2 minutes for ap-proximately 24 hours, until the following day on May 30. The fitted Ru andRuO2 layers were 280.7A and 3.1A thick respectively. The average MSEwas about 6.8. There seem to have been little change in the ellipsometricmeasurements, over this 24 hour period of exposure. (See Figure 57)
Fittings for Ru and RuO2 thicknesses fluctuated over this period of timealso. (See Figures 58, 59)
8.6. AFTERMATH 97
8.6 Aftermath
After additional water vapor was introduce on May 31, 2001, and about aweek after it was taken out of the vacuum system, the film was remeasured.Michael Newey obtained measurements at five different angles (60o, 65o, 70o,75o, 80o) using a better version of J.A. Woollam’s ellipsometer in the Chem-istry Department than the M-44 ellipsometer in our UHV system.
This data has been analyzed by WVASE on June 8, 2001. The fittingresulted with a ruthenium layer that is about 313.3A thick, a ruthenium ox-ide layer that is about 24.6A thick, with an MSE of 31.35. Dr. Allred and Ibelieve that the MSE is too high. The surface of the ruthenium film was dam-aged too much for the ellipsometer to be able to make correct measurements.This would be the cause of these results.
Future improvements to obtain better Ru and RuO2 optical constantscould have been made. Further data obtained through measuring the thick-nesses of each layer of the film by X-ray diffraction could have also provideduseful and relevant data in improving the optical constants for Ru and RuO2.A new ruthenium film should be deposited and analyzed in the future.
8.7 Ruthenium Thin Film Conclusions
From the in situ analysis of a sputtered ruthenium thin film of about 280Aruthenium thick layer, it appears that there is some noticeable oxidation. TheRuO2 layer seems to form even before the vacuum chamber is exposed to airat atmospheric pressure, while the chamber is being backfilled with argon.The ultimate RuO2 thickness appears to stabilize to about 3.1A after theinitial 24 hours of exposure of the 280A ruthenium layer to air. This is avery small amount, in the order of 1-2 atomic layers of RuO2.
It appears that the known optical constants of both Ru and RuO2 canbe substantially improved to better fit the ruthenium thin film model whenusing ellipsometry to determine the thin film properties and thicknesses. Theimproved Ru optical constants that we were able to develop seem to workrelatively better than the initial published Ru optical constants. The initialconstants would not allow WVASE to give a reasonable RuO2 thickness,whereas the improved constants provided a fit for a 3.1A thick RuO2 layer.

98 CHAPTER 8. MEASUREMENT AND ANALYSIS
Table 8.1: Ruthenium optical constants N and K - Fitted using six differentRu thin film measurements; Based on published optical constants
Wavelength(Angstrom)
N (real part) K (imaginarypart)
2861 1.617622 3.5963612931 1.636191 3.6863863001 1.673544 3.7563963070 1.746131 3.8163323141 1.825034 3.8892033212 1.89865 3.9467713284 1.985777 4.0132823358 2.053746 4.0744453432 2.132705 4.1396773506 2.200425 4.2067893581 2.297176 4.2769693654 2.402717 4.2933813726 2.45048 4.3110913794 2.551048 4.3837433886 2.698917 4.4276223957 2.782718 4.4471314033 2.891218 4.43454110 2.9555 4.4467434185 3.024968 4.4539934259 3.089138 4.4561334337 3.159788 4.4653294412 3.218202 4.4712164491 3.277843 4.4868734567 3.334018 4.4957674649 3.368167 4.5222734718 3.410582 4.5360774799 3.461029 4.5489264872 3.504962 4.5627534946 3.551499 4.5772195024 3.588483 4.6063955100 3.633274 4.6315345177 3.681743 4.6506555251 3.729378 4.6697095327 3.775189 4.6982855401 3.828698 4.7121765473 3.873171 4.7350365549 3.930596 4.7495385624 3.977997 4.7733235697 4.033931 4.7845625770 4.095135 4.7933335840 4.151261 4.7948915911 4.196892 4.8058495981 4.257076 4.7999646052 4.301175 4.808517

8.7. RUTHENIUM THIN FILM CONCLUSIONS 99
Table 8.2: Ruthenium oxide (RuO2) optical constants N and K - Fittedusing six different Ru thin film measurements; Based on published opticalconstants
Wavelength(Angstrom)
N (real part) K (imaginarypart)
2861 1.222544 1.0021232931 1.600873 1.0023533001 1.384585 0.91688933070 1.382675 0.96217513141 1.420025 0.88942643212 1.430229 0.88058873284 1.439517 0.87567953358 1.444712 0.87533253432 1.445715 0.88122633506 1.452538 0.91511143581 1.450349 0.92859333654 1.438749 0.95618123726 1.446778 1.0086963794 1.49304 1.0443723886 1.547467 1.0492353957 1.574388 1.0558274033 1.598108 1.0406444110 1.614351 1.0425234185 1.632137 1.0337834259 1.646106 1.0300184337 1.659933 1.0265064412 1.671002 1.0222924491 1.684256 1.019994567 1.693332 1.0139624649 1.700616 1.0145944718 1.70845 1.0064284799 1.71745 0.99983244872 1.72465 0.98859454946 1.730432 0.977965024 1.734762 0.96680885100 1.736629 0.95646425177 1.738297 0.93843465251 1.737419 0.92367665327 1.730304 0.91263215401 1.727696 0.88521855473 1.715055 0.8644335549 1.701118 0.84767345624 1.682353 0.83205315697 1.655688 0.80814195770 1.623477 0.80106515840 1.591355 0.78278865911 1.55581 0.78559575981 1.517066 0.77848756052 1.479561 0.7887052

100 CHAPTER 8. MEASUREMENT AND ANALYSIS
Table 8.3: Improved ruthenium optical constants N and K - Fitted using 3different Ru thin film in situ ellipsometric measurements in high vacuum
Wavelength(Angstrom)
N (real part) K (imaginarypart)
2861 1.414168 3.9095932931 1.452633 4.0257863001 1.488577 4.0860543070 1.543297 4.1803543141 1.611849 4.3158923212 1.676743 4.3918683284 1.748177 4.488593358 1.832845 4.5923263432 1.904305 4.664123506 1.997548 4.7548833581 2.07482 4.8311543654 2.169967 4.9088033726 2.256361 4.9916843794 2.334881 5.0351643886 2.443673 5.1116833957 2.561181 5.2008424033 2.663018 5.251414110 2.772643 5.2975124185 2.878374 5.3332754259 2.980662 5.3593294337 3.068179 5.368444412 3.158358 5.3884764491 3.210132 5.3887984567 3.279537 5.406754649 3.341914 5.420784718 3.385379 5.4610174799 3.430885 5.4922024872 3.484785 5.5372634946 3.529718 5.5780055024 3.591648 5.6119945100 3.651888 5.6430775177 3.71899 5.700435251 3.776683 5.7295775327 3.851703 5.7571415401 3.911889 5.832725473 3.991945 5.8388675549 4.070646 5.8514875624 4.153063 5.9036485697 4.230457 5.9381515770 4.326889 5.9789065840 4.377103 5.9750375911 4.480794 5.9735635981 4.542005 5.9686626052 4.669601 5.985336

Chapter 9
Current Status and FutureEnhancements
(As of June 21, 2001)
9.1 Current Status
9.1.1 Vacuum Results
The first vacuum session of our UHV system was conducted from Marchthrough April, 2001. The lowest pressure that the senTorr gauge controllerread was 1.5×10⁻⁷ torr on April 12, after about two days with the cryopumppumping on the chamber.
The chamber had been baked out previous to turning the cryopump on for3-4 days at 250− 270oC. During this bake out, the sorption pumps pumpedout the chamber 2-3 times. On the third day of bake out the power sourcefor the heating tapes blew out, due to a failure of a fuse. Greg Harris andScott Daniel fixed the problem, although the fix may not allow the heatingtapes to reach 250oC (as we have yet to test). With the fix, the chamber wasagain baked out to 150oC, so as not to blow the fuse again, for an extra day.During this time the chamber was also pumped out by the sorption pumpsagain.
By pumping out the chamber and cryopump several times each, the cryo-pump was able to achieve high vacuum pressures. High vacuum of 1.5×10⁻⁷
torr was achieved on April 12. After a week, the base pressure of the chamber
101

102CHAPTER 9. CURRENT STATUS AND FUTURE ENHANCEMENTS
rose to 4.0 × 10⁻⁷ torr. By the end of April, the base pressure had risen to1.0 × 10−6 torr. The chamber pressure then stabilized in the low 10−6 torrrange until argon was introduced on May 10 to bring the chamber back toatmospheric pressure.
From this rise of pressure, it could be thought that there may be a smallhigh vacuum leak. It is possible that the outgassing of the material insidethe chamber may be the sole cause of the rise in pressure also. Although thelowest base pressure was not quite UHV, with HV pressure in the low 10−6
torr range, high purity thin films can still be created and analyzed.
9.1.2 Deposition Results
Sputtering
A ruthenium thin film of about 280A was sputtered using the Mighty MAK4” sputter gun. Plasma formation and the sputtering was successful afterseveral attempts. Delamination of the film occurred which shows that stresson the sputtered film must be reduced.
Evaporation
The evaporator has been installed. Several boats, including two aluminaboats, several tungsten boats, and a chromium boat have been obtained. Oneof each of the three boats, with the chromium boat in the middle, have beenmounted on the three copper extensions of the electrical feedthrough. Threealumina shields have been mounted on the evaporator. The two aluminumside shields have not been installed yet, as they had to be bent in order tofit inside the port. The length of the support needs to be fixed in order tofit properly inside the port.
The next vacuum session will be conducted to study an evaporated chromiumthin film. The positioning of the shields, support, and the boats will re-quire some adjustments and testing. Also the evaporator power supply andcontrol over the amount of current and power sent through the evaporatorfeedthroughs will require some attention.

9.2. FUTURE ENHANCEMENTS 103
9.2 Future Enhancements
9.2.1 Ultrahigh Vacuum
There may or may not be high vacuum leaks in the current system. Afterdiscussing the system with Joseph Young, he thinks that there may not bea leak, but that the rise of pressure in the chamber while under vacuumis rather caused by outgassing. The following are suggested improvementsthat may help the vacuum system to achieve improved vacuum pressure,eventually in the UHV range.
Cleaning of the Inside of the Chamber
The inside of the chamber should be cleaned again. There are pieces ofKimwipes and aluminum foil that accidentally entered the vacuum chamberwhen it was below atmospheric pressure.
Before the chamber was able to be pumped down to roughing pressure,we had discovered a large leak together with the fact that the gate valvewould not seal. The cryopump was then taken off of the system, and thegate valve was analyzed. Joseph Young found out that the gate valve justhad to be tightened with a wrench that would provide enough torque.
Once the gate valve had been reinstalled, the sorption pumps were usedto see if the chamber could hold roughing pressure. The chamber was ableto hold roughing pressure, however we learned that the mass flow controllerwould not allow argon to flow through it fast enough to bring the chamberto atmospheric pressure. To keep the gate valve clean, while trying to finda way to bring the chamber back to atmospheric pressure, the gate valvewas wrapped with Kimwipes and aluminum foil while the chamber remainedunder vacuum.
Although the chamber pressure was close to atmospheric pressure, it wasbelow atmospheric pressure. One of our builders attempted to find a mech-anism for the gate valve so that it could seal better. He did not realize thatthe chamber was below atmospheric pressure and accidentally opened thechamber, which caused pieces of Kimwipes and aluminum foil to enter intothe system. The extent of the problem had not been noticed until after thechamber brought back to atmospheric pressure after our first high vacuumsession. Eliminating all the particles may be a very effective means of helpingthe vacuum system achieve UHV.

104CHAPTER 9. CURRENT STATUS AND FUTURE ENHANCEMENTS
Replacing Sputter Gun Flange
The o-ring of the quick-coupler unit in the sputter gun flange may provideextensive outgassing, if not a high vacuum leak. It is positioned at a fairdistance away from the cryopump, hence the leak or outgassing rate fromthe o-ring may exceed the high vacuum pumping speed of the area where theo-ring is placed.
First, the exact permanent position of the target of the sputter gun rel-ative to the bottom flange should be determined. This would depend onthe position of the evaporator and the sample stage, together with the idealdistance of the target from the substrate film.
Once the position of the sputter gun is determined, the sputter gun shouldbe vacuum brazed to the bottom flange with the quick-coupler unit. The o-ring can be eliminated because the shaft will be brazed onto the flange. Thiswould provide a UHV leak tight seal.
Improved Bake Out
The heating tapes have been installed for the cryopump and the cryopumpwas successfully baked out at 150oC on June 7-8, 2001. This should allowthe cryopump to pump more effectively.
The main chamber body can also be baked out more effectively thanthat of the first vacuum session. The bake out should be continuously con-ducted for 3-4 days, or more, at temperatures above 250oC. Joseph Youngrecommended a bake out temperature of 300-400oC, as this would speed upthe degassing of gases that are difficult to degas at 250oC. While the maxi-mum possible temperature should be achieved during bake out, care shouldbe taken so that all components in the vacuum system can withstand thehigh bake out temperature by ensuring that adequate cooling is provided ifnecessary.
In addition to increasing the bake out temperature, adequate pumping ofthe chamber by the roughing pumps should be maintained throughout thebake out process. During the first vacuum session we achieved, the chamberwas not pumped out regularly by the sorption pumps. Pumping the chamberout to roughing pressure once a day may be sufficient in achieving UHV afterthe bake out process.
Also aluminum foil can be used more extensively than before. The alu-minum foil should be wrapped around the chamber walls tightly, and as much

9.2. FUTURE ENHANCEMENTS 105
of the chamber surface as possible should be insulated using the aluminumfoil. Using a better insulating material than aluminum foil will also increasethe bake out effectiveness.
Gate Valve
Joseph Young recommended that the aluminum gate valve currently installedin the system be replaced by a stainless steel gate valve. Apparently the samecryopump installed in our system was able to achieve UHV vacuum with astainless steel gate valve.
9.2.2 Component Design
There are many improvements that can be made to the current design of ourUHV thin film deposition system. Improvements in design and components ofthe system may allow the system to be more efficient in deposition, analysis,and vacuum pump down.
Sputtered Film
The stress applied to the substrate film when sputtering should be reduced.The compressional stress on a sputtered film was apparent with the delamina-tion of the sputtered ruthenium thin film. The solution may be to extend thedistance from the target to the substrate, reduce the energy of the plasmawhen sputtering, or to modify the sample stage to eliminate some of thestress.
Mass Flow Controller
The current mass flow controller does not seem to effectively control theflow of argon passing through it. The maximum flow of argon through themass flow controller into the chamber, when attempting to bring the cham-ber to atmospheric pressure, was very slow compared to typical mass flowcontrollers. (Although the mass flow controller is not meant to be used tovent a whole chamber with argon, typical mass flow controllers should takeno longer than couple days to vent the whole chamber with argon.) Alsothe argon flow controlled by the knob next to voltage display of the massflow controller, was somewhat too large and random when backfilling thechamber to create a plasma. The mass flow controller may need to be fixed

106CHAPTER 9. CURRENT STATUS AND FUTURE ENHANCEMENTS
or replaced in order to achieve accurate and reliable control over the flow ofargon through it.
Mass Spectrometer
A 4” to 2.75” reducing flange has already been purchased. The mass spec-trometer, mounted on a 2.75” flange on the sputter chamber on the bottomfloor of the Physics Underground Laboratory, may be available for our UHVsystem. The mass spectrometer could be installed on one of the top 4”flanges of chamber. (Refer to Section 5.2 on page 48) A mass spectrometerwill allow analysis of the various gases present in the vacuum system whenunder vacuum. This could help determine the gases present in the systemthat pose possible leak or outgassing problems.
Load-lock System
A load-lock system for the sample stage would be effective in reducing theamount of time required to pump the system to UHV, between each vacuumsession. Such a load-lock system would allow the isolation of the samplestage from the rest of the chamber. Thus the rest of the chamber couldremain under UHV vacuum while the sample stage alone could be broughtto atmospheric pressure for the sample film to be replaced or taken out.
A load-lock for the sample stage may be too difficult of a task to imple-ment because of the position of the sample stage in our current design. Thesample stage is currently on the top port which is relatively small in its flangesize (6”) and too crowded with the other flanges surrounding it. Also thesample stage is about 6” in height and 2-4” in width and length, which makesit difficult to be moved through the ports in order for the stage to be isolated.Thus any type of gate valve to take out and isolate the sample stage wouldbe difficult to install. This could be overcome by moving the sample stage toa less crowded, larger port, but then the deposition equipment (sputter gunand the evaporator) would have to be adjusted accordingly. If all these issuescould be overcome by some clever design, it may be worthwhile to install aload-lock system.

Chapter 10
Summary
10.1 Ruthenium Thin Film
Ruthenium can be used as a good XUV mirror because of its low oxidationin air. The ellipsometric measurements show that a very small layer of ruthe-nium oxide (∼ 3 − 4A) may form on a ruthenium thin film after the film’sexposure to air in atmospheric pressure.
10.2 System Capabilities
The UHV thin film deposition system that has been designed and built canachieve low high vacuum, down to 1 × 10⁻⁷ torr. With improved vacuumtechniques and cleaning, UHV pressures below 10−9 torr should be achiev-able. Thin film sputtering and real-time in situ ellipsometric measurementshave been made. Future sputtering and in situ measurements should poselittle difficulty, with the RF power source operating correctly. Thin filmevaporation should also be available once the evaporator has been correctlyinstalled. Oxidation of deposited films can also be controlled through theoxygen line, together with the variable leak valve.
Even after a year of designing, planning, building, and researching onhow to build a UHV vacuum chamber, actually achieving UHV is itself aformidable task. However, the full benefit of this system is yet to be realized.This in situ ellipsometry UHV chamber, even with its basic functions, canproduce many publishable experiments and data that will improve currentunderstanding of thin film optics, especially controlled thin film oxidation.
107

108 CHAPTER 10. SUMMARY
Through this research, I have developed extensive knowledge in vacuumsystems, experience in leading a small research group, some machining knowl-edge, and experience in a real research environment that have required muchwork while producing much satisfaction.

Figure 1: View of the UHV deposition system with in situ ellipsometry
Figure 2: Reflectance of Silicon film versus thickness of SiO2 layer
109

Figure 3: Achieving UHV
Figure 4: Conflat flange- sealing
110
Figure 5: Setup of a possible leak detection
Figure 6: Geometry of an ellipsometric experiment, showing the p- and s-directions
111

Figure 7: In situ ellipsometer operation principle
Figure 8: Electromagnetic plane wave
112

Figure 9: M-44TM in situ ellipsometer- Input unit on tilt stage
Figure 10: M-44TM in situ ellipsometer- Output unit on tilt stage
113

Figure 11: Sorption pumps
Figure 12: Cross section of an adsorption pump
114

Figure 13: Cryopump
Figure 14: Cryopump components
115

Figure 15: Design of a refrigerator cryopump
Figure 16: Cryopump compressor unit- front
116

Figure 17: Cross sectional view of Cryo-Torr 8
Figure 18: Top view of the chamber
117

Figure 19: Left, side view of the chamber
Figure 20: Right, side view of the chamber
118
Figure 21: Bottom view of the chamber
Figure 22: Gate valve
119
Figure 23: Gate valve components
Figure 24: Gate valve sealing flange
120
Figure 25: Gauges- thermocouple and ion gauges
Figure 26: SenTorrTM gauge controller
121

Figure 27: Rotatable CF flange
Figure 28: Non-rotatable CF flange
122

Figure 29: QF fitting on the cryopump roughing line
Figure 30: ASA type o-ring flange
123

Figure 31: Various sizes of o-rings
Figure 32: Bake out system
124

Figure 33: Cryopump heating tape
Figure 34: Variac voltage controllers for bake out
125

Figure 35: Sputter gun - Mighty Mak 4, by US Inc.
Figure 36: Sputter gun mechanism in vacuum chamber
126

Figure 37: Applied fields of planar magnetron sputtering
Figure 38: Target of the sputter gun
127

Figure 39: Evaporator with shields and support- Side view
Figure 40: Evaporator with shields and support- Front view
128

Figure 41: Sample stage
Figure 42: Sample stage inside the chamber
129

Figure 43: Installing the sample stage
Figure 44: Shutter
130

Figure 45: Crystal monitor- crystal, oscillator, and feedthrough
Figure 46: Oxygen and argon gas lines
131

Figure 47: Power supply racks
Figure 48: Water cooling lines
132

Figure 49: Water cooling source- pipes in the Physics Underground Labora-tory
Figure 50: Water cooling lines- control valves
133

Figure 51: View of the sputtered ruthenium thin film (Taken out of thechamber on May 31, 2001)
Figure 52: Sputtered ruthenium film during first 30 minutes of argon back-filling of the chamber- Ru thickness fit (A)
134
Figure 53: Sputtered ruthenium film during first 30 minutes of argon back-filling of the chamber- RuO2 thickness fit (A)
Figure 54: Sputtered ruthenium film during first 20-30 minutes of exposureto atmospheric air- Ellipsometric measurements and fit of Psi
135

Figure 55: Sputtered ruthenium film during first 20-30 minutes of exposureto atmospheric air- Ru thickness fit (A)
Figure 56: Sputtered ruthenium film during first 20-30 minutes of exposureto atmospheric air- RuO2 thickness fit (A)
136

Figure 57: Sputtered ruthenium film during first 24 hours of exposure toatmospheric air- Ellipsometric measurements of Psi
Figure 58: Sputtered ruthenium film during first 24 hours of exposure toatmospheric air- Ru thickness fit (A)
137
Figure 59: Sputtered ruthenium film during first 24 hours of exposure toatmospheric air- RuO2 thickness fit (A)
138

Appendix A
Standard Operating Procedures
This appendix contains procedures, precautions, and principles in additionto the main body of the thesis. The procedures contained in this appendixshould be used in conjunction with appropriate precautions and principles de-scribed in both this appendix and in the main body of the thesis. Whereas theprocedures in the main body of the thesis may apply generally and/or specif-ically to our vacuum system, those described in this appendix are specificallydesigned for our UHV system as of June 2001, while the principles thereinmay still be applied generally.
A.1 Notes
Refer to Figure A.1 for the labelling of the valves and sorption pumps onthe roughing line. This is helpful when following the procedures for vacuumpump down and bake out.
In general, know and follow the cleaning procedures and precautions laidout in Section 5.8 on page 61. When handling any parts that will or areplaced inside of the vacuum system, especially be aware of the following:
• Use clean gloves at all times.
When working with internal parts, after gloves have touched any exter-nal parts or anything other than the chamber such as after using thetelephone, pens, etc., either clean the gloves or replace the gloves.
• If skin or body touches anywhere internal to the chamber or gloves,clean with hexane or acetone (use protective nitrile gloves) and then
139
140 APPENDIX A. STANDARD OPERATING PROCEDURES
wipe residue off with methyl alcohol. (Use reagent or purer type toavoid contamination)
• Caution: Never open roughing valve and cryo valve unless thechamber and the cryopump has been vented and is in atmo-spheric pressure. The only other instance when the roughingvalve or the cryo valve is safe to open is when the chamberor the cryopump, respectively, is at higher pressure than theroughing line for certain.
Opening these valves under unwarranted circumstances may cause therelatively dirty roughing line to contaminate the UHV clean cryopumpor chamber, and may even cause the molecular sieve dust from thesorption pumps to backstream into these UHV clean areas.
A.2 Vacuum Pump Down
(Refer to Figure A.1)
A.2.1 Liquid Nitrogen Dewar
A liquid nitrogen dewar is needed for the sorption pumps. Any dewar willsuffice. The following describes how to operate the large dewar that is cur-rently used for our system. (See Figure A.2)
Filling an Empty Dewar
1. Unscrew the clamp and disconnect the hose that connects the dewarto the pressurized air line from the ceiling.
2. Fill the dewar with liquid nitrogen from Chem-Stores (Chemistry Cen-tral Stockroom) in the Nicholes Building.
Be careful with transporting dewar, especially if the dewar containsliquid nitrogen, so it does not accidentally tilt over.
3. Connect the air line back to the proper fitting. (See Figure A.2)

A.2. VACUUM PUMP DOWN 141
Pouring Liquid Nitrogen Out From Dewar
By sending pressurized air through the dewar, the liquid nitrogen inside willcome out of the dewar. However, it is important to realize that too much airpressure going through the dewar may cause the ∼3” diameter black corklid to pop off the dewar. Hence it is important to be able to control theair pressure entering the dewar so that sufficient liquid nitrogen flows outwithout compromising safety.
The air that entered in may condense to very low temperatures, andwhen it comes out, it may freeze anything immediately near it. Also liquidnitrogen may leak out or spray out sporadically. After liquid nitrogen beginsto come out of the dewar, the hoses will freeze and hence harden. Frozenparts become very brittle which allow them to break easily if not carefullyhandled. Be aware of these and take the proper precautions.
Repeat these steps for each dewar of the sorption pumps:
1. Close all four roughing valves.
2. Ensure that the air line hose is connected properly to the fitting of thedewar.
3. Safely place the end hose of the dewar (from where the liquid nitro-gen will come out) inside the container that is to be filled with liquidnitrogen.
It is a good idea to place the hose so that sudden jerking (caused bythe liquid nitrogen coming out) is minimized. Also it is helpful for thetip of the hose to be visible so as to determine the amount of flow ofliquid nitrogen coming out of the dewar.
4. If closed, open the bronze-colored knob several turns; this fitting islocated on the dewar fitting for the air line hose.
5. Slightly open the air valve on the ceiling, until some air flow throughthe hose can be heard.
Be careful so that enough air flows through the line, at the same timeregulate the flow so that the pressure reader does not exceed around 3psi.
6. Open the top knob of the dewar while ensuring proper insulation be-tween the knob and hands.

142 APPENDIX A. STANDARD OPERATING PROCEDURES
Try to avoid direct contact with the knob. The knob may become coldas liquid nitrogen flows from out of the dewar. Using a long metal piecesuch as a wrench may be helpful, unless there is adequate insulationon the knob itself.
7. Wait initially until liquid nitrogen begins to come out.
This may take a little time because the hoses of the dewar must comeclose to equilibrium temperature with the liquid nitrogen.
8. Control the air pressure until enough liquid nitrogen is flowing out ofthe dewar, in a safe and controlled manner.
Violent boiling of liquid nitrogen will occur initially, but it will slowdown as the sorption pumps reach equilibrium temperature with liquidnitrogen. Because of the boiling, it may be helpful to go back and forthbetween the two dewars, filling each dewar as much as possible, partiallyinitially, until both dewars are full with liquid nitrogen. The dewarsmay be considered ‘full’ when the top surface of the liquid nitrogenreaches the bottom of the neck of the sorption pumps. However, fulloperation of the sorption pumps does not necessarily require that thedewars are completely ‘full.’
9. After filling the container, close the top knob.
10. Close the air valve from the ceiling.
11. Carefully remove hose and the dewar away.
This can be done after the hoses have warmed up.
A.2.2 Roughing Vacuum
The following procedures describe how to operate the two sorption pumpsthat are connected in parallel on the roughing line.
Preparing the Sorption Pumps
The sorption pumps must be cooled to liquid nitrogen temperature beforethey are ready to pump on the system.
1. Have enough liquid nitrogen to fill both sorption pump ready in adewar.

A.2. VACUUM PUMP DOWN 143
2. Ensure that the sorption pumps are close to room temperature, espe-cially after baking out.
(The pumps may be cooled with liquid nitrogen even when the pumpsare initially above room temperature; however, if possible, it is alwaysmore energy efficient to wait until the pumps are at room temperature.)
3. Close all four roughing valves.
4. If the Viton stoppers are already placed inside the gas release valve,then proceed to the next step. If not:
(a) Put on clean gloves.
(b) Clean the stoppers, and the gas release valve if needed, withmethanol and Kimwipes.
(c) With the fingers, spread a thin film of vacuum grease on the Vitonstoppers, on the area of the stoppers that come in contact withthe release valves. Wipe off the excess grease.
(d) Carefully place the Viton stoppers in the gas release valves.They only need to placed lightly on the valves, as the pressure dropin the sorption pumps will naturally tighten the seal between thestoppers and the valves.
5. Ensure that the stainless steel dewars are placed on the each sorptionpump.
6. Carefully pour liquid nitrogen into each dewar, one at a time. (Referto Section A.2.1 if necessary)
Violent boiling of liquid nitrogen will occur initially, but it will slowdown as the sorption pumps reach equilibrium temperature with liquidnitrogen. Because of the boiling, it may be helpful to go back and forthbetween the two dewars, filling each dewar as much as possible, partiallyinitially, until both dewars are full with liquid nitrogen. The dewarsmay be considered ‘full’ when the top surface of the liquid nitrogenreaches the bottom of the neck of the sorption pumps. However, fulloperation of the sorption pumps does not necessarily require that thedewars are completely ‘full.’

144 APPENDIX A. STANDARD OPERATING PROCEDURES
7. Let the sorption pumps reach equilibrium temperature with liquid ni-trogen.
When the boiling of liquid nitrogen stops, and the base pressure ofthe pumps are below 1 × 10⁻³ torr, the sorption pumps are ready foroperation. Usually right before the sorption pumps reach this point,a sudden increase of noise from the boiling occurs, and then stopsimmediately.
Operation
After the sorption pumps are cooled to liquid nitrogen temperature, thefollowing steps are recommended for operating the sorption pumps.
1. Close all four roughing valves.
2. Make sure chamber body (or the cryopump, whichever is to be pumped)is in atmospheric pressure, or at least at higher pressure than the rough-ing pumps.
3. Open either the roughing valve or the cryo valve, depending on whetherthe chamber or the cryopump is to be pumped, respectively.
4. Open valve #1 for 1-112 minute and then close valve #1.
This initial ‘wind’ will absorb and trap much of the hydrogen, helium,and neon that is usually hard to absorb. Also much of the ‘dirt’ willbe absorbed and trapped inside only sorption pump #1.
5. Open valve #2. The pressure should eventually read below 1 × 10⁻³
torr.
6. Pump for as long as the sorption pump can maintain pressures below 1×10⁻³ torr, or until the rate of pressure rise of the chamber or cryopumpis sufficiently low.
Usually, with a ‘full’ dewar, the sorption pump can last for 3-4 hours.
7. Close valve #2 and roughing valve.
8. The roughing valve or the cryo valve may remain open. However, itshould be eventually closed when necessary.

A.3. BAKE OUT 145
A.2.3 Ultrahigh Vacuum
After the chamber has been able to maintain adequate roughing pressure(≤ 1 × 10⁻³ torr), the cryopump may then be used to pump the chamberdown to UHV pressure.
Preparation
1. Close the gate valve and the cryo valve.
2. Turn the power on with the two switches for the compressor and thenthe cold head, on the compressor unit. (See Figure 16)
3. Wait for about 212 hours, enough for the cold heads to cool, so that the
cryopump can pump to or below high vacuum pressures.
Operation
1. Make sure all four roughing valves are closed completely.
2. Ensure that the chamber can maintain a base pressure ≤ 1× 10⁻³ torrfor an adequate time period.
If the chamber cannot maintain low roughing pressures in the 10−3 torrrange for about five minutes, it is best that the roughing pumps pumpon the chamber longer. This will preserve the pumping capacity andspeed of the cryopump.
3. Open the gate valve.
4. Turn on ion gauge and wait until it reads below 1× 10⁻⁹ torr for UHVvacuum, or until the desired vacuum pressure is reached.
A.3 Bake Out
(Refer to Figure A.1) Precautions:
• Ensure that everyone is aware of the high temperature bake out whenbaking out.
• Ensure that all cables, wiring, and anything else that cannot stand hightemperatures are removed away from the heat.

146 APPENDIX A. STANDARD OPERATING PROCEDURES
Each of the following parts may be baked out separately. The sorptionpumps must be baked out before the chamber or the cryopump can be bakedout, since the sorption pumps provide the vacuum source for both bake outs.
A.3.1 Sorption Pumps
To regenerate the sorption pumps, they should be baked out to 250oC forabout 24 hours, and then cooled. This will emit most, if not all, of the gasesthat were trapped inside the sorption pumps.
Heating
1. Close the roughing and cryo valves.
2. Open valves #1 and #2 all the way.
3. Take both dewars off from the sorption pumps. (optional)
4. Ensure that any wires, hoses, or material are removed away from theheaters.
5. Turn heaters on sorption pumps by plugging the electrical cords intothe proper power outlet.
6. When the pressures of the sorption pumps are close to atmosphericpressure, take the Viton stoppers off both sorption pumps and placethem in a safe place.
If the pressures of the sorption pumps are below atmospheric pressure,then the Viton stoppers will be difficult to take off. If the pressuresof the sorption pumps are above atmospheric pressure, then the Vitonstoppers will usually pop off on its own.
7. The heaters should heat the sorption pumps to 250oC in about 212
hours. It is recommended that this temperature be maintained for 24hours.
Cooling
1. Turn the heaters off.

A.3. BAKE OUT 147
2. Allow the sorption pumps to begin cooling. Proceed to next step.
3. When needed, clean and lubricate the Viton stoppers: (These sub-stepsshould be performed right before placing the stoppers inside the releasevalves, which is the next step.)
(a) Put on clean gloves.
(b) Clean the stoppers, and the gas release valve if needed, withmethanol and Kimwipes.
(c) With the fingers, spread a thin film of vacuum grease on the Vitonstoppers, on the area of the stoppers that come in contact withthe release valves. Wipe off the excess grease.
4. After about 1-2 hours of cooling, or when the valves are below 150oC,without touching the area of the stoppers that come in direct contactwith the release valves, place the Viton stoppers lightly inside the re-lease valves.
They only need to placed lightly on the valves, as the cooling will causethe pressure to drop in the sorption pumps, and will naturally tightenthe seal between the stoppers and the release valves.
5. When the sorption pumps reach room temperature, place the dewarson the pumps.
Note: Because of the Viton o-rings inside valves #1 and #2, if the tem-perature of these valves exceed 150oC, provide adequate cooling of thesevalves. However, the two valves have never exceeded 150oC when we bakedout the sorption pumps.
A.3.2 Cryopump
For this procedure, the sorption pumps should be prepared beforehand andbe ready to pump on the cryopump. The gases trapped in the cryopump willbe dumped into the sorption pumps when regenerating the cryopump.
Heating
1. Close the gate valve completely.

148 APPENDIX A. STANDARD OPERATING PROCEDURES
2. Close all four roughing valves.
3. Shut down the cryopump by turning the power off with the two switchesfor the cold head and the compressor, on the compressor unit. (SeeFigure 16)
4. If possible, vent the cryopump with argon, or other suitable, dry, noblegas.
5. Allow the surface temperature of the cryopump to rise to room tem-perature.
6. Open only valve #1 to bring the roughing line pressure below the cry-opump pressure. (Usually < 1 × 10⁻³ torr for the roughing line willsuffice)
7. Open the cryo valve.
8. Pump on the cryopump with the sorption pumps. (Follow the proce-dures in Section A.2.2) While still pumping on the cryopump, proceedto the next step.
9. Turn on the cryopump heating tape with the Variac controller.
10. The cryopump should be baked out at 150oC. Slowly increase theVariac voltage so that the temperature increases +25oC, each hour,up to 150oC. Maintain this temperature for about 24 hours, or for asuitable time.
11. When the base pressure of the sorption pumps begin to increase, orwhen they cannot maintain good roughing pressures (in the 10−3 torrrange), be sure to close the sorption pump valves (valves #1 and #2).
12. In order to adequately regenerate the cryopump, repeat the followingfor at least 1-2 times, in addition to the pump down completed above:
(a) Regenerate the sorption pumps.
(b) Use the sorption pumps to pump out the cryopump over the courseof the bake out process (including when it is being cooled down).

A.3. BAKE OUT 149
Cooling
1. Slowly decrease the Variac voltage so that the temperature decreasesby no more than 25oC, each hour, down to room temperature.
2. Close all valves.
A.3.3 Chamber Body
For this procedure, the sorption pumps should be ready to pump on thechamber, no later than when the chamber bake out temperature reaches250oC. The gases baked out from the walls of the chamber, together withall other gases inside the chamber, will be dumped into the sorption pumpswhen baking out the chamber body.
Preparation
1. Take off the Input and Output Units, together with the tilt stages ofthe ellipsometer from the chamber.
2. Remove cords, lines, and anything that could be burned away from theheating tapes and chamber surfaces.
3. Close the gate valve and all four roughing valves.
4. Turn on the water cooling lines by opening all four water line valves,two from the ceiling and two on the wall. (See Figures 49, 50)
(The sputter gun and the crystal monitor need to be cooled when bak-ing out the chamber.)
5. Wrap the surfaces to be baked out with aluminum foil to provide somethermal insulation. Do not wrap aluminum foil around componentsthat contain o-rings or material that may not withstand high bake outtemperatures. Monitor these areas so that they do not exceed criticaltemperatures.
Heating
The chamber body should be baked out to temperatures ≥ 250oC:

150 APPENDIX A. STANDARD OPERATING PROCEDURES
1. Turn ON the electrical switch (on the evaporator power supply rack)for the chamber heating tapes.
2. Slowly increase the Variac voltage for the chamber heating tapes, sothe temperature increases +25oC, each hour, until ≥ 250oC has beenachieved. Use the top of the two thermocouple thermometers locatedon the evaporator power supply rack.
3. Maintain this temperature for 3-4 days or more. While baking out,proceed to the next step.
4. Open only valve #1 to bring the roughing line pressure below the cham-ber pressure. (Usually < 1×10⁻³ torr for the roughing line will suffice)
5. Open the roughing valve.
6. Pump on the chamber with the sorption pumps. (Follow the proceduresin Section A.2.2)
7. When the base pressure of the sorption pumps begin to increase, orwhen they cannot maintain good roughing pressures (in the 10−3 torrrange), be sure to close the sorption pump valves (valves #1 and #2).
8. In order to adequately bake out the chamber, repeat the following forat least 2-3 times, in addition to the pump down completed above:
(a) Regenerate the sorption pumps.
(b) Use the sorption pumps to pump out the chamber over the courseof the bake out process (including when it is being cooled down).
Cooling
1. Slowly decrease the Variac voltage so that the temperature decreasesby no more than 25oC, each hour, down to room temperature.
2. Close all valves.

A.4. DEPOSITION 151
A.4 Deposition
A.4.1 Sputter Gun- Plasma Formation
Plasma is created by backfilling the vacuum chamber, while under vacuum,with a gas medium (usually argon), and then applying potential differencesbetween the target source (on the sputter gun) and the rest of the chamberwith a power supply. Our system uses an RF power supply to create a plasmaabove the sputter gun target.
The following procedures describe how to use the RF power supply forthe magnetron sputter gun. The RF power supply is contained in the leftrack in Figure 47. Operating the RF power supply to create a plasma is noteasy. In fact, even after following these procedures, a plasma may not becreated. If any difficulty arises, consult with Scott Daniel, in the PhysicsDepartment.
Preparation
1. The vacuum system should be initially in UHV or HV vacuum.
2. Close the gate valve until 14 is open. Make sure that the gate valve can
maintain this position until the sputtering is completed.
A 1” wrench may be used to get it stuck on the gate valve, thus holdingthe position of the gate valve.
3. Tightly close the valve on the argon bypass line.
4. Open the valves on the argon gas tank to appropriate pressure readings(around 10-20 psi on the line may be sufficient).
5. Turn the mass flow controller voltage display on and set the knob tothe minimum 0 value.
6. Slightly open the Nupro valve on the argon line.
Be careful that the Nupro valve is not opened too much, causing toomuch argon to flow through it.
7. Slowly turn the mass flow controller knob and increase the argon flowthrough the mass flow controller. Backfill the chamber with argon to apressure in the (10−3 − 10−1) torr range.

152 APPENDIX A. STANDARD OPERATING PROCEDURES
There should be enough argon in the chamber to provide the discharge.At the same time the gas should be in constant flow.
Operation of RF Power Supply
1. Check to see that all plugs and connections are secure and safe.
2. Turn on all switches on the back.
3. Turn on all power switches on the front, including the Control and Lineswitches, all but the HV (high voltage) power switch and the RF Onswitch.
4. Wait 2-3 minutes for the power source to warm up.
5. Turn RF Power control knob to a minimum.
6. Turn the RF power switch on.
7. It may be helpful to check that the proper voltages are on.
8. Turn HV power on.
9. Flip Power Control switch to Auto Power Control.
10. Manually set Loading and Tuning to about 108.5 and 150.5 respectively.(These are the values that the RF power supply was tuned to, whenplasma was created.)
11. Turn RF Power knob to get about 200 Watts of Incident power.
12. Tune the Plate Current with the PA Tuning knob so that the Incidentpower is maximized while the Reflective power is minimized. Eventu-ally when a plasma is actually created, the PA Tuning knob tends tolie on 65.
The Incident and Reflective power represent the power going into theimpedance source (the sputter gun) and the power coming out fromthis source back into the RF power supply, respectively. By maximizingIncident power and minimizing Reflective power, the output power fromthe RF power source is efficiently consumed.
13. Set the Loading and Tuning to Automatic tuning.

A.4. DEPOSITION 153
14. Try the following until a plasma is created.
When a plasma has been successfully created, a bright purplish lightcan be seen from the view ports of the in situ ellipsometer. Also thecrystal monitor can detect the plasma, as a creation of plasma impliesthe immediate sputter deposition of the target material.
(a) Adjust the RF Power knob.
(b) Adjust the PA Tuning.
(c) If the Loading and Tuning tend to go off the limits, or are faraway from 108.5 and 150.5 respectively, and a plasma has notbeen created, manually reset Loading and Tuning to about 108.5and 150.5 respectively.
(d) Adjust the RF Power knob to provide enough Incident power.
(e) Adjust the PA Tuning to maximize and minimize Incident andReflective power respectively.
(f) Set the Loading and Tuning to Automatic tuning.
(g) The argon pressure may not be appropriate. Increase or decreasethe argon flow adequately.
(h) Carefully check to see if all connections on the RF power supplyare sound. The inside of some wiring may have burned due toerrors in the plasma creation process.
(i) Scott Daniel is very knowledgeable with the RF power supply.Seek his help if necessary.
15. After the plasma has been created, the argon flow should be reducedto the recommended operating pressure for Mighty MAK- between 2 -15 mtorr.[14]
16. The power can be controlled manually by switching to Manual PowerControl, and by adjusting the RF Power knob. Controlling the outputpower will allow control over the sputter deposition rate and the energyof the sputtered material.
Shutting Down
1. After the deposition has been completed, turn RF Power knob to theminimum, and turn off all power switches on the RF power supply.

154 APPENDIX A. STANDARD OPERATING PROCEDURES
2. Close all valves on the argon gas tank.
3. Wait for several seconds so argon from the line is vented into the cham-ber, eliminating an unnecessary high pressure differential between theargon line and the chamber.
4. Turn off the mass flow controller voltage display and knob.
5. Tightly close the Nupro valve.
If the Nupro valve is not closed tight enough, it provides a UHV leak.
6. Completely open the gate valve.

Appendix B
Documentations and Records
B.1 Cryopump Performance Operating Log
Tables B.1, B.2 contain the performance log of the cryopump when it wasfirst used to pump the initial vacuum session of our UHV system.
B.2 Adhesive Heating Tapes Data
Greg Harris calculated the data in Table B.3 to order the adhesive heatingtapes for baking out the main chamber body. The heating tapes were orderedfrom Clayborn Labs, Inc.
Greg based his calculations on achieving a ∆T of 430oF (500oF total)by applying 142 watts per square foot. (If these resistances are not avail-able in stock, they should be substituted with the next hottest tapes.) Allcalculations were based on 1/2 inch tape.
The position of the tapes is relative to the perspective of facing the vac-uum system with the sorption pumps in the front, as in Figure A.1.
B.3 Mass Flow Controller- Voltage Display
The voltage display used to display the voltage reading across the mass flowcontroller is a product of Simpson Electric Company. J.J. designed a circuitconnecting the knob that controls the voltage applied, the voltage display,and the mass flow controller. This circuit design is shown in Figure A.3.
155

156 APPENDIX B. DOCUMENTATIONS AND RECORDS
The pin-out for the mass flow controller is shown on the controller itself.The pin-out for the Simpson voltage display is shown in Figures A.4, A.5.

B.3. MASS FLOW CONTROLLER- VOLTAGE DISPLAY 157
Table B.1: Cryopump performance operating log- Initial vacuum session dur-ing April - May 2001Date /Time
ETM H2
VaporPres-sure
CompressorUnit Pres-sure (psi)
Chamber Base Pressure(torr)
April 10@11:00pm
13040.9 Devicenotavail-able
221 2.1× 10⁻⁴
11:12pm > 1.0 × 10⁻³ (Cryopump notquite prepared to pump)
11:17pm 225 2.4 × 10⁻⁴ (Chamber wasroughed again, with gate valveclosed)
11:57pm 13041.9 23112:25am 13042.3 23012:39am 23012:51am 13042.7 2301:12am 227 9.8 × 10⁻⁵ (Gate valve opened
again)1:15am 8.8× 10⁻⁵
April 11@11:50am
13053.8 223 2.4× 10⁻⁶
12:00pm Decrease of bake out tempera-ture began from ∼ 160oC
3:22pm 1.1× 10⁻⁶
4:08pm 223 9.9× 10⁻⁷ @93oC4:25pm 8.8× 10⁻⁷ @73oC4:57pm 13058.9 222 7.5 × 10⁻⁷ @54oC - Bake out
completely turned off at thistemperature
April 12@12:24pm
13078.3 224 5.2× 10⁻⁷ @24oC
1:06pm 2.2 × 10⁻⁷ (Gas valves wereclosed tighter than before)
1:50pm 1.7 × 10⁻⁷ (Gas valves wereclosed even tighter, togetherwith the UHV variable leakvalve)
3:30pm 1.5× 10⁻⁷

158 APPENDIX B. DOCUMENTATIONS AND RECORDS
Table B.2: Cryopump performance operating log- Initial vacuum session dur-ing April - May 2001 (continued)Date /Time
ETM H2
VaporPres-sure
CompressorUnit Pres-sure (psi)
Chamber Base Pressure(torr)
April 16@4pm
3.2× 10⁻⁷
April 17 3.5× 10⁻⁷
April 19@1pm
3.9×10⁻⁷- Unsuccessful sputterattempt on this day
May 3 1.0×10⁻⁶- Successful sputteringof ruthenium on this day
May 10 222 2.1 × 10⁻⁶- Venting of chamberwith argon began
May 11@4:38pm
222 2.2×100- Continuing attempt tovent chamber with argon
May 17@3:40pm
7.2×101 @24oC- Continuing at-tempt to vent chamber with ar-gon
May 18@4:35pm
220 1.5×10² @24oC- Continuing at-tempt to vent chamber with ar-gon
May 23@4pm
220 3.6 × 10² @24oC- This is aboutatmospheric pressure. The ther-mocouple gauge was reading in-correctly.
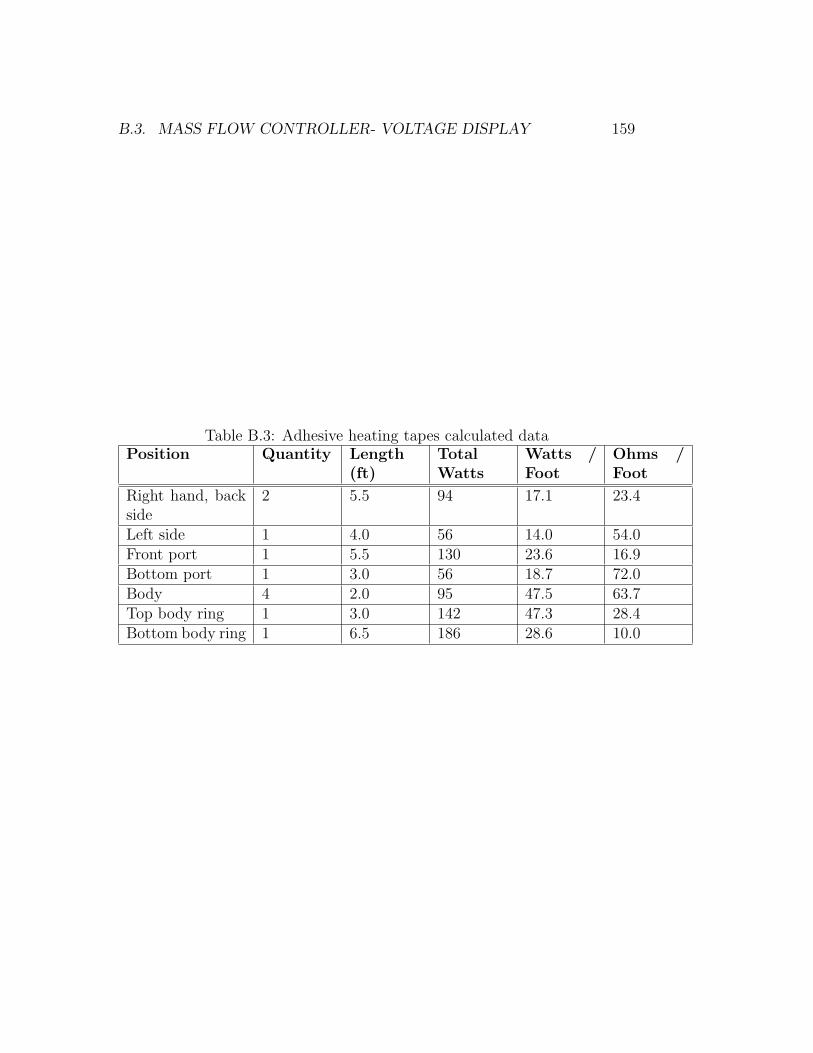
B.3. MASS FLOW CONTROLLER- VOLTAGE DISPLAY 159
Table B.3: Adhesive heating tapes calculated dataPosition Quantity Length
(ft)TotalWatts
Watts /Foot
Ohms /Foot
Right hand, backside
2 5.5 94 17.1 23.4
Left side 1 4.0 56 14.0 54.0Front port 1 5.5 130 23.6 16.9Bottom port 1 3.0 56 18.7 72.0Body 4 2.0 95 47.5 63.7Top body ring 1 3.0 142 47.3 28.4Bottom body ring 1 6.5 186 28.6 10.0

160 APPENDIX B. DOCUMENTATIONS AND RECORDS

Appendix C
Company References
161

162 APPENDIX C. COMPANY REFERENCES
Table C.1: Company ReferencesCompany Name Description
Address PhoneNumber
FaxNumber
Webpage Contact
A&N Corporation Vacuum products
707 Southwest 19th AvenueWilliston, FL 32696
(800)FLANGE1
(352)528-3441
www.ancorp.com
Clayborn Labs, Inc. Heating tapes
12219 Business Park Drive, Suite11Truckee, CA 96161
(530)587-4700
(530)587-5255
Duniway Stockroom Corp. Vacuum products
1305 Space Park WayMountain View, CA 94043
(800)446-8811
(650)965-0764
www.duniway.com
Helix Technology Corporation Cryo pumps
3350 Montgomery DriveSanta Clara, CA 95054
(408)727-8077
(408)988-6630
www.ctivacuum.com
Huntington Vacuum products
1040 L’AvenidaMountain View, CA 94043
(650)964-3323
(650)964-6153
www.huntvac.com
Inficon Thin Film Deposition Control
Two Technology PlaceEast Syracuse, New York 13057-9714
(315)434-1100
(315)437-3803
www.inficon.com
J.A. Woollam Co., Inc. Ellipsometry
645 M Street, Suite 102Lincoln, NE 68508
(402)477-7501
(402)477-8214
www.jawoollam.com
Kurt J. Lesker Company Vacuum products
1515 Worthington Ave.Clairton, PA 15025-2700
(800)245-1656
(412)233-4275
www.lesker.com
Maxtek, Inc. Quartz crystal monitor
11980 Telegraph Rd.Santa Fe Springs, CA 90670-6084
(562)906-1515
(562)906-1622
www.maxtekinc.com
MDC Vacuum Products Corporation Vacuum products
23842 Cabot Blvd.Hayward CA 94545-1661
(800)443-8817
(510)887-0626
www.mdc-vacuum.com

163
Table C.2: Company ReferencesCompany Name Description
Address PhoneNumber
FaxNumber
Webpage Contact
R.D. Mathis Company Evaporative boats
PO Box 92916Long Beach, CA 90809-2916
(562)426-7049
(562)595-0907
www.rdmathis.com
Simpson Electric Company Voltage meters
853 Dundee AvenueElgin, IL 60120
(847)697-2260
(847)697-2272
www.simpsonelectric.comTomFranta(ext. 1479)
US Inc. Sputter gun
6280 San Ignacio Ave.Suite E San Jose, CA 95119-1365
(408)363-6906
(408)363-6996
www.us-incorp.com ToddJohnson
Varian, Inc. Vacuum systems
121 Hartwell AvenueLexington, MA 02421
(800)882-7426
www.varianinc.com Bill Horton

Figure A.1: Roughing line and pumps - labeling
164

Figure A.2: Liquid nitrogen dewar currently used for the system
165

Figure A.3: Circuit design- Mass flow controller, voltage control knob, andvoltage display
166

Figure A.4: Pin-out for Simpson voltage display
167

Figure A.5: Pin-out for Simpson voltage display (continued)
168

Bibliography
[1] P.A. Redhead, J.P. Hobson & E.V. Kornelsen. The Physical Basis ofUltrahigh Vacuum. American Institute of Physics, New York, NY, 1993.
[2] Ronald A. Outlaw. UHV Design and Practices- An AVS Short Course.The Short Course Executive Committee, American Vacuumsd Society,2001.
[3] J.A. Woollam Co., Inc. Guide to Using WVASE32TM - Software for VASEand M-44 Ellipsometers. Lincoln, NE.
[4] J.A. Woollam Co., Inc. Hardware Manual M-44TM Ellipsometer. Lincoln,NE.
[5] Walter Umrath. Fundamentals of Vacuum Technology. Leybold Vacuum,2000.
[6] Varian Vacuum Technologies. VacSorbr Pumps- Model Nos. 941-6501and 941-6502- Instruction Manual. Palo Alto, CA, 1981.
[7] CTI-Cryogenics, Helix Technology Corporationhttp://www.helixtechnology.com/usacanada/cti/cti products new.html.1998.
[8] Helix Technology Corporation. Cryo-Torrr 100, 7, 8 and 8F-High-Vacuum Pump Installation, Operation, and Service Instructions.Mansfield, MA, 1999.
[9] Varian Vacuum Technologies. Varian Vacuum Technologies ProductCatalog 2000. Lexington, MA, 1999.
[10] Varian Vacuum Technologies. SenTorrTM Gauge Controller-Instructino Manual. Lexington, MA, 1999.
169

170 BIBLIOGRAPHY
[11] Kurt J. Lesker Company. Kurt J. Lesker Company e-catalog -http://www.lesker.com/CFDOCS/newweb/CatalogIndex.cfm. Clairton,PA, 2001.
[12] Aicha Elshabini-Riad & Fred D. Barlow III. Thin Film TechnologyHandbook. The McGraw-Hill Companies, 1998.
[13] Milton Ohring. The Materials Science of Thin Films. Academic Press,Inc., San Diego, CA, 1992.
[14] US Inc. 4” & 6” MAKTM - Owner’s Operation and MaintenanceManual of the Mighty MAKTM Sputtering Sources. San Jose, CA.
[15] Maxtek, Inc. Operation and Service Manual- Model TM-350/400Maxtek Thickness Monitor. Santa Fe Springs, CA, 1998.
[16] Varian, Inc. Variable Leak Valve Manual (model 951-5106). Lexington,MA.
[17] J.T. Cox, G. Hass, J.B. Ramsey, and W.R. Hunter. Reflectance andOptical Constants of Evaporated Ruthenium in the Vacuum UltravioletFrom 300 to 2000 /AA. J.Opt.Soc.Am. 64, 4, 1974.
[18] J.J. Carroll and A.J. Melmed. Optical Constants of (1120) Rutheniumin the Visible Region. J.Opt.Soc.Am. 66, 10, 1976.
[19] A. Belkind, Z. Orban, J.L. Vossen, and J.A. Woollam. OpticalProperties of RuO2 Films Deposited by Reactive Sputtering. Thin SolidFilms. 207, 242, 1991.

Index
Absorption, 13Acoustic Impedance, 82, 90Activated Charcoal, 32, 40, 41Adsorption, 12, 35, 41
Chemisorption, 12Physisorption, 12
Alumina, 74, 75Aluminum Foil, 61, 105, 149Anti-seize Lubrication, 15, 35, 56,
63
Backfill, 47, 50, 70Argon, 71, 91, 95, 97, 105, 151
Backstream, 31, 53, 140Oil, 33
Bake out, 7, 13, 15, 49, 59, 101,104, 145
BrazeVacuum, 17, 69, 104
Bulk Density, ρ, 11
Chamber Port, 1Cleaning, 14, 18, 61, 103, 140, 143,
147Collars, 69Conflat (CF), 7, 55
Knife Edge, 56, 63Cross-contamination, 67Crossover, 31Cryocondensation, 41Cryopump, 38, 105, 145, 147
Cold Head, 39, 40Compressor Unit, 39Operating Log, 42, 155Pressure Lines, 39Pump Casing, 39Rate-of-Rise (ROR), 42, 45
Cryosorption, 40, 41Cryotrapping, 41
Dalton’s Law, 9Delamination, 92, 102, 105Deposition, 2, 67Desorption, 13Dewar, 35, 37, 47, 142, 146
‘Full’, 142–144Liquid Nitrogen, 140
Electrochemical Polishing, 16Ellipsometry, 2, 19
Computer, 26Electronics Control Box, 26Ex situ, 19, 29In Situ, 19, 24, 77
Alignment Jig, 27Bomco Window, 27Input Unit Tilt Stage, 27Output Unit Tilt Stage, 27
Input Unit, 26Lamp, 26Output Unit, 26
Analyzer, 26
171

172 INDEX
Detector, 26Sample Alignment, 28Sample Calibration, 29System Alignment, 28System Calibration, 28
Evaporation, 2, 74, 102Advantages, 75Boat, 67
Fan, 61Fitting
Cross, 31, 34Quick-coupler, 56, 58, 68, 104Tee, 32, 84VCR, 77, 84, 86
Flange, 2, 55ASA, 57Cleaning, 56, 63QF, 57Reducing, 31, 34, 49, 50, 75
Gas LineAr, 85O2, 83
Gas Number Density, ηp, 11Gasket, 7Gate Valve, 48, 52, 103, 105Gauge
Ion, 53Thermocouple, 51
Gauge ControllersenTorrTM , 51, 53, 54, 90, 92
Heating Tape, 49, 59, 155HV (High Vacuum), 2, 4
Ideal Gas Law, 9In situ, 2Incident Angle, 19, 25
Incident Flux, I, 11Incident Wave, 19Inner Diameter (ID), 47, 57
Kimwipesr, 14, 58
Leak Detection, 7, 17, 48, 50, 103Light
Polarization, 2, 20–24, 26, 28,29
Line of Sight, 68Liquid Nitrogen, 35–37, 140, 141,
143, 144Load-lock, 47, 65, 106
Mass Flow Controller, 86, 103, 105Voltage Display, 61, 81, 86, 106,
151, 155Mass Spectrometer, 47, 65, 106Mean Free Path, 67, 72Mean Square Error (MSE), 89, 90,
92, 94–97Molecular Sieve, 41, 140mtorr, 67, 69
NPT (National Pipe Thread), 31,34, 51
O-ring, 50, 56, 57Viton, 49, 56, 61
Optical Constants, 1–3, 20, 22, 23,83, 89
Ruthenium, 89, 90, 92, 93, 95,97
Ruthenium Oxide, 89, 92, 93,95, 97
Outer Diameter (OD), 47, 57Outgas Rate, 10, 104Outgassing, 7, 10, 12, 62, 103
INDEX 173
Oxidation, 1, 3, 4, 12, 20, 30, 77,78, 83, 89–91, 94, 95, 97,107
Permeation, 13Pin-out, 156Plane of Incidence, 19Plasma, 50, 69, 105, 151Power Supply Rack, 61Pressure
Operational, 14Partial, 7, 10Ultimate, 13
Propagation, 19, 20Pump
High Vacuum, 7, 38, 48, 104,145
Roughing, 8, 15, 32, 142, 144Pumping Speed, 10, 104
Quartz Crystal Monitor, 80, 90, 95,96
Reflectance, 2Regeneration, 32
Assisted, 44Cryopump, 43, 52, 59, 147Sorption Pump, 38, 146
RF (radio frequency), 67RF Power Supply, 61, 68, 87, 151
Cooling Line, 87Operation, 152Shutting Down, 153
Roughing, 7, 42Line, 32, 34, 51, 53, 139
RutheniumOxidation, 95Target, 70
Thin Film, 3, 25, 89, 90, 102,105, 107
Ruthenium Oxide, 89
Sample Stage, 78Seize, 8Shutter, 78Sorption Pump, 32, 104, 142, 146Sputtering, 2, 50, 68, 102, 104, 105,
151Advantages, 73Magnetron, 72RF, 72
Substrate, 2, 5, 30, 70, 71, 73, 78,81, 85, 90, 94, 102, 104, 105
Surface Density, ρs, 11
Target, 67Teflon Tape, 34, 51Thermocouple, 61, 150Tooling Factor, 81, 90Transmission, 2
UHV (Ultrahigh Vacuum), 2, 3, 7,8, 14, 103
Ultrasonic Cleaner, 64
VacuumBreaking, 67
Vacuum Grease, 36, 50, 58, 70, 143,147
Variable Leak Valve, 84, 85, 107,157
Variac Control, 60, 61, 148Viewport, 19Virtual Leak, 8, 17Viton, 32, 147
Water Jet, 75

174 INDEX
WeldingInert Gas, 17, 56, 69
WVASE, 22–25, 29, 89, 90, 92–95,97
XUV (Extreme Ultraviolet), 1, 89,94, 107
Zeolite/Molecular Sieve, 32, 33, 35,37, 53