Embed Size (px)
Citation preview
1
In Situ Magnetohydrodynamic Energy Generation for Planetary
Entry Systems
AE8900 MS Special Problems Report
Space Systems Design Lab (SSDL)
Guggenheim School of Aerospace Engineering
Georgia Institute of Technology
Atlanta, GA
Author:
Hisham K. Ali
Advisor:
Dr. Robert D. Braun
May 1, 2015
2
In Situ Magnetohydrodynamic Energy Generation for Planetary
Entry Systems
Hisham K. Ali * and Robert D. Braun†
Space Systems Design Laboratory, Georgia Institute of Technology
270 Ferst Drive, Atlanta, GA 30331
Proposed missions such as a Mars sample return mission and a human mission to Mars
require landed payload masses in excess of any previous Mars mission. Whether human or
robotic, these missions present numerous engineering challenges due to their increased mass
and complexity. To overcome these challenges, new technologies must be developed, and
existing technologies advanced. Mass reducing technologies are particularly critical in this
effort. The proposed work aims to study the suitability of various entry trajectories for
reclaiming vehicle kinetic energy through magnetohydrodynamic energy generation from
the high temperature entry plasma. Potential mission and power storage configurations are
explored, with results including recommended trajectories, amount of kinetic energy
reclaimed, and additional system mass for various energy storage technologies.
Nomenclature
A = vehicle characteristic area
Ac = generator area
B = magnetic field strength
CD = drag coefficient
Li = generator interaction length
m = vehicle mass
ne = electron number density
�̅� = radial distance between vehicle and Mars center of mass
u = vehicle velocity
β = ballistic coefficient
μMars = mars gravitational parameter
ρ = atmospheric density
* Graduate Research Assistant, Aerospace Engineering † David and Andrew Lewis Professor of Space Technology, Aerospace Engineering
3
I. Introduction and Motivation
UTURE missions to Mars such as a Mars sample return mission and potential human mission will require much
higher masses than have ever been landed on Mars. Previous Mars missions have relied primarily on Viking era
technology for entry descent and landing.1 The limit of this technology is being reached, with the Mars Science
Laboratory (MSL) landing system in 2012 illustrating the difficulty in high mass Martian landings.
To achieve humanity's goals for Mars exploration, significant technology development is required. Mass reducing
technologies are particularly critical in this effort. Not only does a larger mass require more fuel to launch, but it also
carries significantly more kinetic energy that must be reduced to near zero if the vehicle is to land safely. Previous
Mars missions have shown that the majority of the vehicle's kinetic energy is dissipated during the hypersonic phase,
about 92.5% in the case of Mars Pathfinder.2 During this hypersonic phase of entry, there exists a highly heated,
ionized flow around the vehicle. The free electrons in the flow can be potentially harnessed to create a sustained,
usable electric current via magnetohydrodynamic (MHD) power generation, reclaiming some of the vehicle's
dissipated kinetic energy.
MHD vehicle interaction for high speed aerospace applications has been studied since the dawn of the space race,
with early theoretical studies dating back to the fifties and early sixties.3 These studies focused primarily on the flow
control applications possible with MHD interaction for purposes such as drag and peak heating modulation. At the
time, such studies were limited by available technologies, as the magnetic coils needed to produce the necessary
magnetic field were mass prohibitive. Since that time, however, dramatic advances in energy storage and magnetic
field generation have been made, and in conjunction with a pressing need to reduce interplanetary launch masses,
warrants additional investigation of the topic.
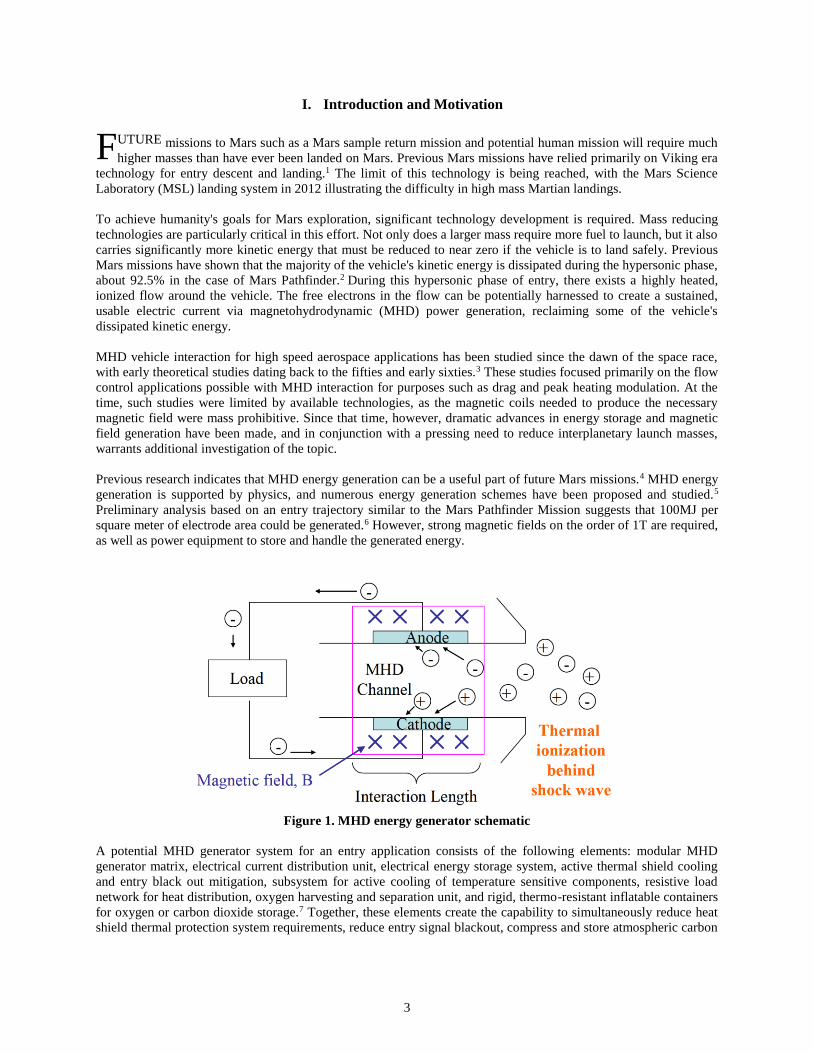
Previous research indicates that MHD energy generation can be a useful part of future Mars missions.4 MHD energy
generation is supported by physics, and numerous energy generation schemes have been proposed and studied.5
Preliminary analysis based on an entry trajectory similar to the Mars Pathfinder Mission suggests that 100MJ per
square meter of electrode area could be generated.6 However, strong magnetic fields on the order of 1T are required,
as well as power equipment to store and handle the generated energy.
Figure 1. MHD energy generator schematic
A potential MHD generator system for an entry application consists of the following elements: modular MHD
generator matrix, electrical current distribution unit, electrical energy storage system, active thermal shield cooling
and entry black out mitigation, subsystem for active cooling of temperature sensitive components, resistive load
network for heat distribution, oxygen harvesting and separation unit, and rigid, thermo-resistant inflatable containers
for oxygen or carbon dioxide storage.7 Together, these elements create the capability to simultaneously reduce heat
shield thermal protection system requirements, reduce entry signal blackout, compress and store atmospheric carbon
F
4
dioxide, generate oxygen for later use on the surface, and of course obtain and store power for subsequent use during
later stages of entry, descent, and landing or on the surface.
For a conventional internal MHD generator, the amount of power that can be extracted is linear with ambient electron
number density and quadratic with flow velocity in the flow regimes of interest for planetary entry.4 Thus, for a given
MHD generator configuration, increased velocity and electron number density will increase output power. The
ambient electron number density is driven by ionizing reactions taking place in the high temperature post shock region,
and for a traditional direct entry trajectory is significant for a relatively short period of time. For example, the
aforementioned 92.5% of kinetic energy lost during the hypersonic phase occurs in less than 60s, presenting
difficulties in implementing an energy storage system capable of handling the load. It is estimated that for a Mars
Pathfinder type space craft, about 14MJ of energy per m2 of electrode area can be reclaimed during this period;
however, this energy generation occurs over about 30s at a rate of nearly 1 MW.4 If the energy storage device cannot
accept power at this rate, then much of the energy will go to waste. Unfortunately, the ability of an energy storage
device to accept energy at a high rate is coupled to its mass, making claiming all of the available energy through a
potential challenge.8
One proposed alternative is to employ a multi-pass trajectory framework to increase the time spent in the atmosphere
and harvest energy at a more manageable rate.4 The challenge of this approach lies in maintaining enough velocity to
cause the atmosphere to ionize in order to raise the electron number density to suitable levels. Additional challenges
include the fact that the entry velocity must be sufficiently low to enable exit from the atmosphere on an elliptic orbit
while also having a non-zero flight path angle. This challenge is primarily navigational, based on the initial flight path
angle.
It was found that seeding the post shock flow region with small amounts of alkali metals such as potassium or cesium
dramatically increases electron number density at concentrations up to 1% owing to their comparatively lower
ionization energies.5 Seeding the flow while employing multi-pass trajectories would allow for sustained power
generation for multiple orders of magnitude more time, potentially increasing the amount of energy that can be stored
with conventional electrical energy storage technologies.
The concept of aerobraking for interplanetary missions has been studied for quite some time, with most initial focus
on Mars and Venus.9 Aerobraking has primarily been utilized for science payloads to assist in transferring the satellite
from its hyperbolic interplanetary trajectory to its intended orbit around the target body. Typically, aerobreaking
campaigns begin with propulsive orbit insertion to place the spacecraft on an elliptic trajectory with respect to the
planetary body, followed by multiple controlled passes and a propulsive burn to achieve the final desired orbit. Notable
missions to Mars that have employed aerobraking include the 1997 Mars Global Surveyor10, 2001 Mars Odyssey11,
and 2006 Mars Reconnaissance Orbiter12. These aerobraking maneuvers lasted for significant amounts of time, with
the maneuvers taking four and a half months, three months, and five months respectively.
Aerobraking operations that have been studied for MHD power generation take place during significantly shorter
periods of time on the order of hours. Previous work studied multi-pass entry, descent, and landing trajectories, termed
EiDL, where i represents the number of atmospheric passes. These orbit cases were generated by assuming an entry
velocity and vehicle mass and varying the system drag area.4
In the above case, varying the drag area produced 3, 7, and 11 pass entry paths spending 1881s, 4390s, and 7400s in
the atmosphere respectively. The analysis was carried out for a 1000kg sample entry vehicle with a drag coefficient
of 0.4, yielding an average of 500MJ per square meter of electrode area per pass. It is also claimed that future carbon
nanotube based superconducting energy storage devices could store this energy with approximately 200 kg of added
system mass, but without this technology, the additional mass requirement would become approximately 3000kg.4
It would be of great benefit to extend this analysis to various types of entry vehicles, and also to attempt to control the
number of atmospheric passes through only the initial position and velocity states at the Mars atmospheric boundary.
The proposed trajectories would consist of an aerocapture pass in which the space craft is transferred from a hyperbolic
interplanetary trajectory followed by a brief aerobraking campaign and concluding with entry from orbit. Furthermore,
advances in electrical energy storage technologies since the publication of previous results warrants additional review.
The contributions contained herein are an effort to achieve these goals. They consist of a multi-pass trajectory
simulator, a post-shock electron number density model, a MHD energy generation power availability model, and an
5
electrical energy storage system performance model applied to various trajectories, vehicle configurations, and energy
storage technologies. Results presented include total amount of energy available for storage, mass estimates for storing
all available energy with various electrical energy storage systems, and minimum electrical energy storage system
performance required to store all available energy within a given mass constraint.
II. Relevant Background and Theoretical Approach
A. Determining the Power Available for MHD Energy Generation
The total energy available via MHD energy generation is the integration of the power available for a MHD generator
along a given trajectory. To actually calculate this power generation profile, it is necessary to identify the relevant
physical interactions occurring along a given trajectory. These interactions are the gravitational interaction between
planetary body and spacecraft, the aerodynamic interaction between planetary atmosphere and spacecraft, and the
thermochemical interaction within the atmosphere as the spacecraft moves at hypersonic speed. The superimposed
effects of these three physical interactions allow for the definition of the position state, velocity state, and electron
number density. These states define the total power that can be generated by MHD energy conversion. For a
conventional internal MHD generator, the generated power behaves the following scaling law4
𝑷 ∝ 𝒏𝒆𝒖𝟐𝑩𝟐𝑨𝒄𝑳𝒊 (1) Where P is the generator power output, ne is the ambient electron number density, u is the flow velocity, B is the
magnetic field strength, Ac is the generator area, and Li is the generator length. For the purposes of this analysis, the
magnetic field strength will be assumed in all cases to be a constant 0.2 Tesla. The generator area will be assumed to
be 1 square meter in all cases as well, with a characteristic length of 1 meter. As a result, the above scaling law can be
reduced to a function of electron number density and velocity only.
The velocity can be calculated by defining the system dynamics and integrating to obtain position and velocity. Taking
into account the gravitational and aerodynamic interaction, the Equation of motion shown as equation 2 below for the
system relative to the Martian center of mass is solved.
�̈̅� = −𝝁𝑴𝒂𝒓𝒔
(�̅� ∙ �̅�)𝟑/𝟐�̅� −
𝝆(�̇̅� ∙ �̇̅�)
𝟐𝜷�̂̇̅�
(2)
where β is the ballistic coefficient of the entry vehicle, a similarity parameter that governs the hypersonic flight,
defined below as follows:
𝜷 =
𝒎
𝑪𝑫𝑨
(3)
where m is the entry vehicle mass, CD is the entry vehicle drag coefficient, and A is the entry vehicle area.
To calculate the electron number density, the atmospheric properties and composition after passing through a shock
wave must be calculated. Since the ambient density, pressure, and temperature can be calculated as functions of
altitude, and Martian atmospheric species composition is known and assumed to be constant, the addition of velocity
fully specifies the post shock state. A chemical equilibrium solver, in this case NASA’s Chemical Equilibrium and
Applications (CEA) code, is then used to calculate the post shock state.13
Table 1 Martian Atmospheric Compositions14
Constituent Relative Abundance
CO2 96.0%
Ar 1.9%
N2 1.9%
O2 0.14%
CO 0.06%
Martian atmospheric constituents and their abundances are presented above as table 1 in order of relative abundance.14
Post shock species include: Ar, C, N, O, C2, N2, O2, CN, CO, NO, CO2, NCO, Ar+, C+, C2+, N+, N2
+, O+, O2+, CN+,
CO+, NO+, and e-. In the case of seeding, there will also be K+ present in the post-shock species. Using these data in
6
conjunction with the atmospheric properties as a function of altitude, the post shock temperature, pressure, and species
composition can be calculated as a function of velocity.
Once the species composition, temperature, and pressure are known, the equilibrium electron number density is
calculated using the post shock density, molecular weight, and electron mole fraction. Equilibrium electron number
density is strongly dependent on the post shock temperature, and the standard Mars atmospheric constituents fail to
yield sufficient electron number density for MHD energy generation below velocities of 5 km/s. However, previous
work indicates that seeding the post-shock flow with a small amount of easily ionizable species such as alkali metals
can boost the electron number density. This seeding could be accomplished with nozzles near the stagnation region
or by impregnating the seed material into the TPS.4 For example seeding the flow in the vicinity of the MHD Generator
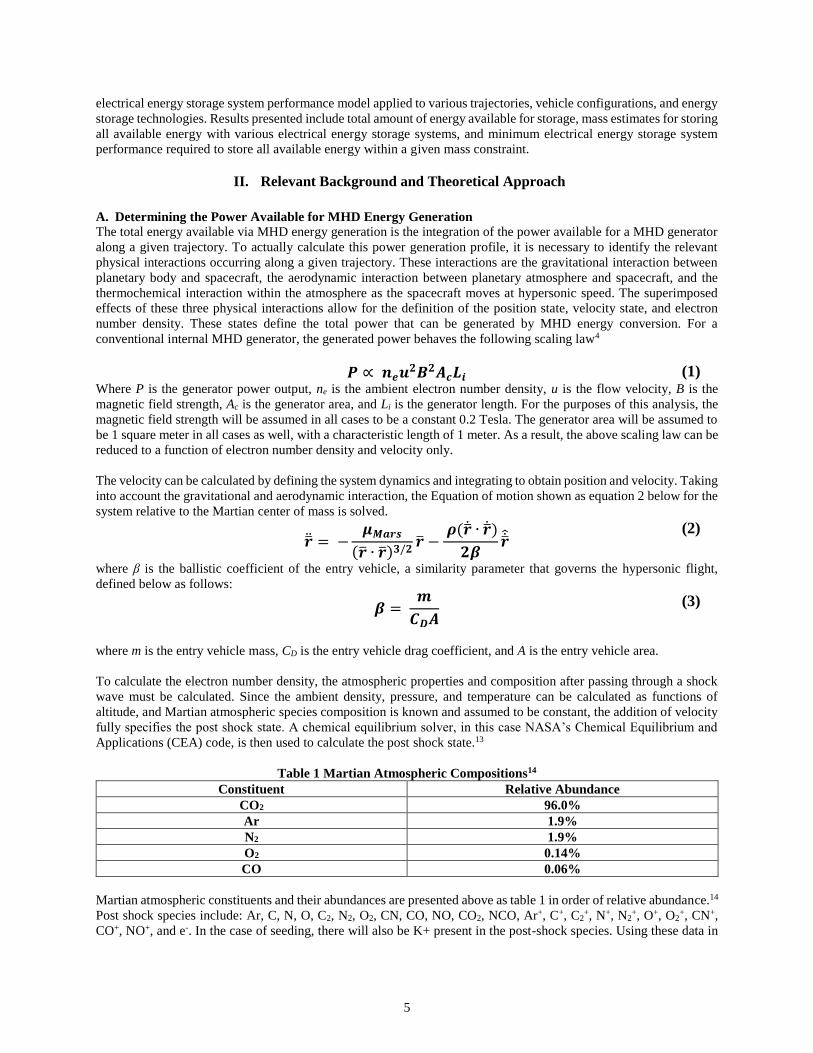
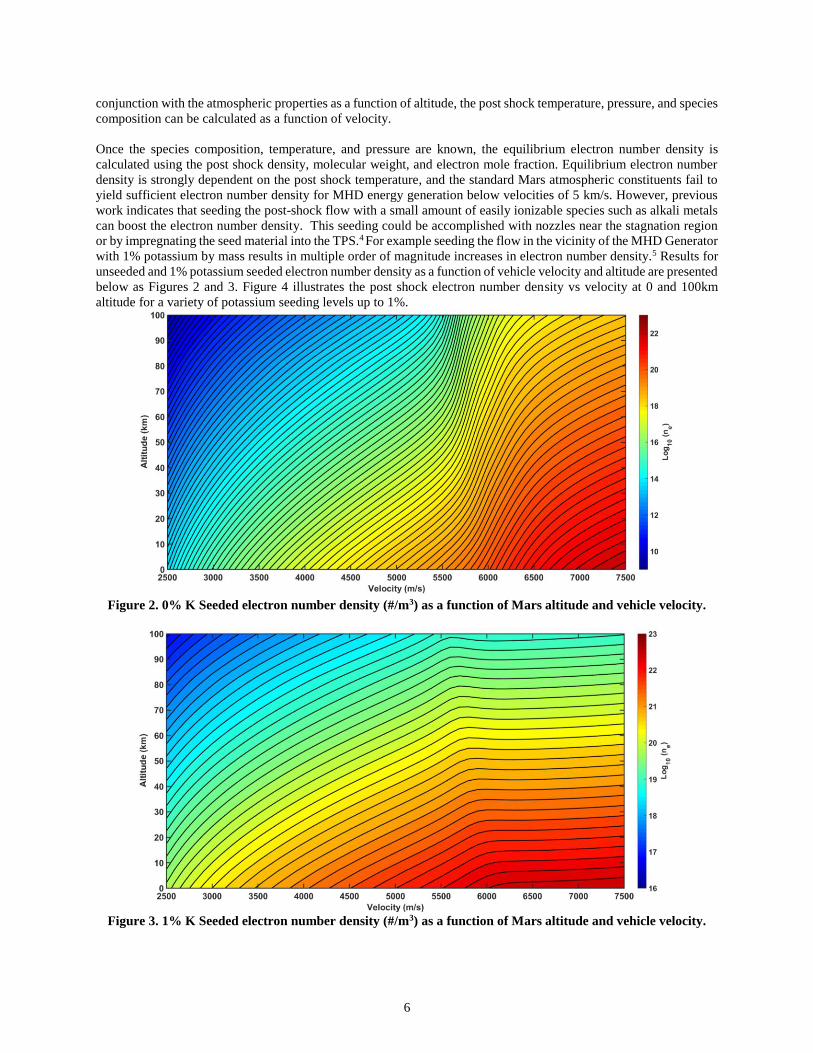
with 1% potassium by mass results in multiple order of magnitude increases in electron number density.5 Results for
unseeded and 1% potassium seeded electron number density as a function of vehicle velocity and altitude are presented
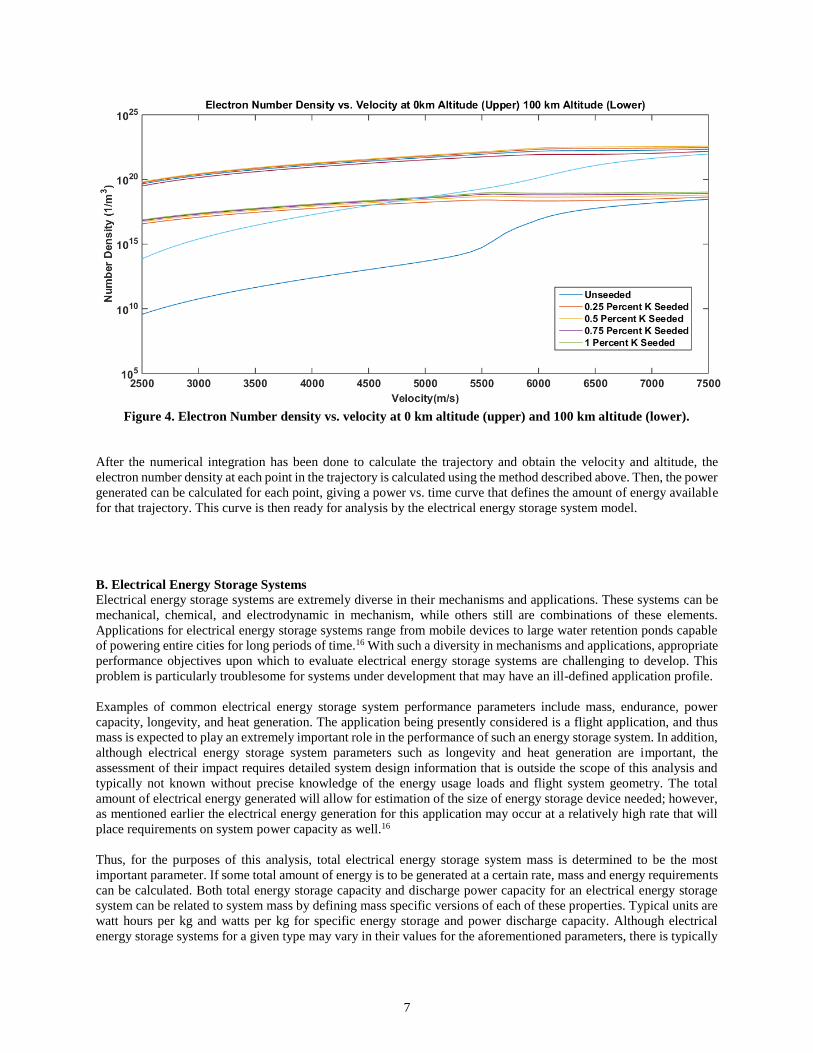
below as Figures 2 and 3. Figure 4 illustrates the post shock electron number density vs velocity at 0 and 100km
altitude for a variety of potassium seeding levels up to 1%.
Figure 2. 0% K Seeded electron number density (#/m3) as a function of Mars altitude and vehicle velocity.
Figure 3. 1% K Seeded electron number density (#/m3) as a function of Mars altitude and vehicle velocity.
7
Figure 4. Electron Number density vs. velocity at 0 km altitude (upper) and 100 km altitude (lower).
After the numerical integration has been done to calculate the trajectory and obtain the velocity and altitude, the
electron number density at each point in the trajectory is calculated using the method described above. Then, the power
generated can be calculated for each point, giving a power vs. time curve that defines the amount of energy available
for that trajectory. This curve is then ready for analysis by the electrical energy storage system model.
B. Electrical Energy Storage Systems
Electrical energy storage systems are extremely diverse in their mechanisms and applications. These systems can be
mechanical, chemical, and electrodynamic in mechanism, while others still are combinations of these elements.
Applications for electrical energy storage systems range from mobile devices to large water retention ponds capable
of powering entire cities for long periods of time.16 With such a diversity in mechanisms and applications, appropriate
performance objectives upon which to evaluate electrical energy storage systems are challenging to develop. This
problem is particularly troublesome for systems under development that may have an ill-defined application profile.
Examples of common electrical energy storage system performance parameters include mass, endurance, power
capacity, longevity, and heat generation. The application being presently considered is a flight application, and thus
mass is expected to play an extremely important role in the performance of such an energy storage system. In addition,
although electrical energy storage system parameters such as longevity and heat generation are important, the
assessment of their impact requires detailed system design information that is outside the scope of this analysis and
typically not known without precise knowledge of the energy usage loads and flight system geometry. The total
amount of electrical energy generated will allow for estimation of the size of energy storage device needed; however,
as mentioned earlier the electrical energy generation for this application may occur at a relatively high rate that will
place requirements on system power capacity as well.16
Thus, for the purposes of this analysis, total electrical energy storage system mass is determined to be the most
important parameter. If some total amount of energy is to be generated at a certain rate, mass and energy requirements
can be calculated. Both total energy storage capacity and discharge power capacity for an electrical energy storage
system can be related to system mass by defining mass specific versions of each of these properties. Typical units are
watt hours per kg and watts per kg for specific energy storage and power discharge capacity. Although electrical
energy storage systems for a given type may vary in their values for the aforementioned parameters, there is typically
8
a range for each parameter that is considered appropriate for a given technology. These values are determined
experimentally and continually evolve as new developments in energy storage techniques come to fruition. These
ranges can be used to define a best, average, and worst case scenario for a given technology.
The electrical energy storage systems categories that will be considered in this analysis are batteries, capacitors, and
miscellaneous devices such as flywheels and super conducting magnetic energy storage.
Batteries are used in a variety of both static and mobile situations, with applications ranging from low to high power.
They involve some sort of chemical reaction that when activated generates electricity. Although the bulk system
performance for a battery is a function of complex multi-step reactions in reality, the performance as measured by
power and energy density can be abstracted to a rough function of mass. Batteries under consideration are chosen as
being representative, though not exhaustive, of the rechargeable technologies available and listed in order of age
include lead acid, nickel cadmium, and lithium ion. Each of these systems has a characteristic performance, proven
robustness, and longevity that makes them representative of the category from a performance analysis perspective.
Capacitors are another electrical energy storage system type that has the potential for portability, but unlike batteries,
they store their energy in an electrical field generated internally. They can thus be said to have an electrodynamic
energy storage mechanism. Capacitors as typically seen in consumer electronics are electrolytic capacitors, consisting
of two metal plates a certain distance apart filled with a dielectric. They can be made to withstand extremely high
voltage and energy storage rates, but their specific total energy storage capacity is usually poor. Recently, new types
of capacitors that do not involve conventional dielectrics, but instead achieve much higher capacitance through
separation of charge along extremely short distances or electrochemical reactions. These capacitors, termed super or
ultracapacitors, have energy charge and discharge rates comparable to conventional capacitors, but have much higher
specific energy values. The performance ranges for both types are distinct, and together these ranges serve as useful
characterizations for the technology.
Other electrical energy storage systems are considered in this analysis. Some of these systems are exotic in nature and
are quite new. One example is superconducting magnetic energy storage. In this storage technique, the resistance-less
property of a superconducting material is used to facilitate an extremely high loop current that results in a dense
magnetic field. This magnetic field stores the electrical energy. Due to their superconductivity, such systems have
very high power discharge and charge rates, and acceptable energy storage density. Disadvantages, however, include
the cryogenics usually necessary to achieve superconductivity, the effect of the strong magnetic field on neighboring
electronics, and overall system mass. Super conducting magnetic energy storage system performance may be enhanced
by exploiting superconductivity of carbon nanotubes, reducing system weight while increasing specific energy and
power capability.17 Another type of electrical energy storage system considered is a flywheel based system, where
electrical energy is stored mechanically, typically with the assistance of magnetic bearings. Such a system can store a
relatively large amount of energy with minimal thermal loss and high discharge rates when needed. This system may
also have additional effects on flight vehicles with regards to stability and control owing to the large rotating mass.
In summary, electrical energy storage systems performance can be represented as mass specific energy and discharge
power capacity. For the present application of power generation and energy storage, charge power capacity and
discharge power capacity are assumed to be roughly equal, simplifying the analysis. One way in which to visualize
the performance of these systems is to plot the specific power vs. the specific energy storage capacity. Such a plot is
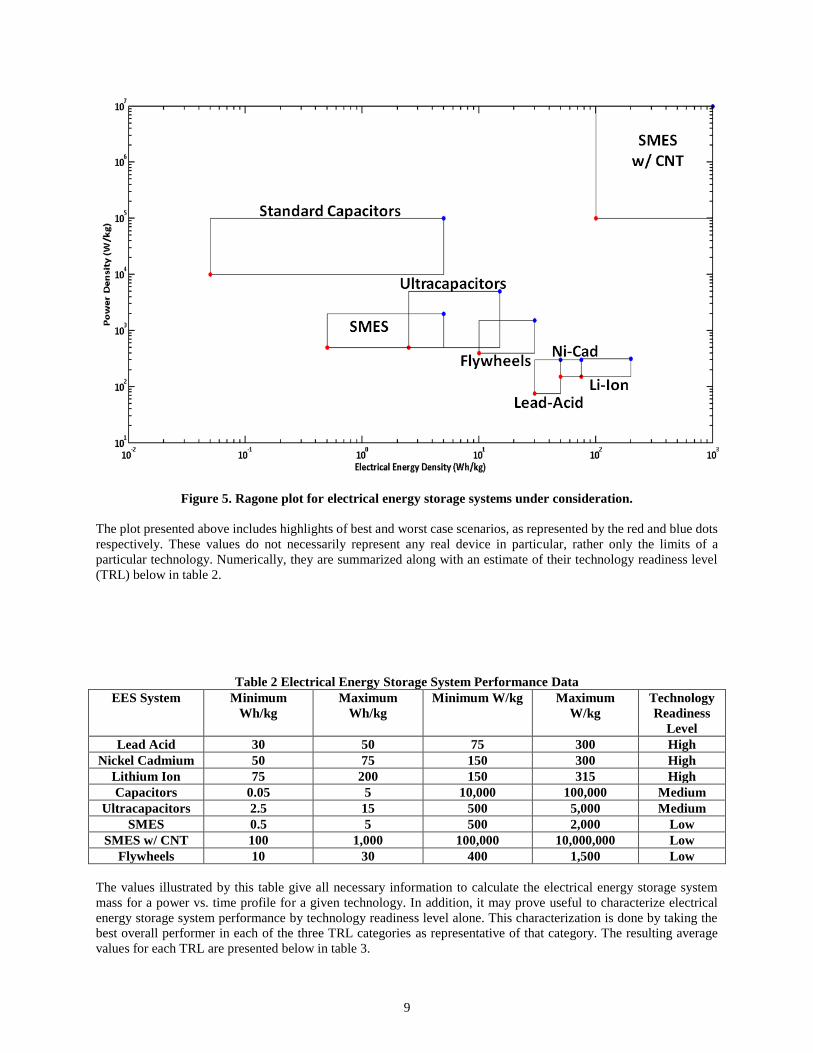
termed a Ragone plot and is very useful for selecting power systems. For the application being considered, good
choices generally lie to the top right of the chart, while poorer choices lie to the bottom left. A Ragone plot generated
from industry data for the energy storage devices being considered is presented below as Figure 5.
9
Figure 5. Ragone plot for electrical energy storage systems under consideration.
The plot presented above includes highlights of best and worst case scenarios, as represented by the red and blue dots
respectively. These values do not necessarily represent any real device in particular, rather only the limits of a
particular technology. Numerically, they are summarized along with an estimate of their technology readiness level
(TRL) below in table 2.
Table 2 Electrical Energy Storage System Performance Data
EES System Minimum
Wh/kg
Maximum
Wh/kg
Minimum W/kg Maximum
W/kg
Technology
Readiness
Level
Lead Acid 30 50 75 300 High
Nickel Cadmium 50 75 150 300 High
Lithium Ion 75 200 150 315 High
Capacitors 0.05 5 10,000 100,000 Medium
Ultracapacitors 2.5 15 500 5,000 Medium
SMES 0.5 5 500 2,000 Low
SMES w/ CNT 100 1,000 100,000 10,000,000 Low
Flywheels 10 30 400 1,500 Low
The values illustrated by this table give all necessary information to calculate the electrical energy storage system
mass for a power vs. time profile for a given technology. In addition, it may prove useful to characterize electrical
energy storage system performance by technology readiness level alone. This characterization is done by taking the
best overall performer in each of the three TRL categories as representative of that category. The resulting average
values for each TRL are presented below in table 3.

10
Table 3 Electrical Energy Storage System Performance Data
EES System TRL Average Specific Energy (Wh/kg) Average Specific Power (W/kg)
High (Lithium-Ion) 137.5 232.5
Medium(Ultracapacitors) 8.75 2750
Low (SMES w/ CNT) 550 5,050,000
III. Methodology and Experimental Design
A. Dynamical Model Implementation and Power Profile Construction
The aforementioned approach is implemented numerically in MATLAB. The temperature and pressure are written as
simple functions of altitude based on relevant Mars atmospheric data, with temperature following a linear profile and
pressure following an exponential one. The Martian atmospheric composition is known to be relatively constant with
altitude14 and in conjunction with the ideal gas law allows for the calculation of the density variation with altitude as
well. The specification of the ambient temperature, pressure, composition, density completes all relevant Martian
atmospheric inputs into the model.
Given initial conditions, the model calculates the position and velocity states as functions of time until the spacecraft’s
trajectory intersects with the Martian surface. In addition, the model is also set up to record and count each instance
in which the spacecraft exits or leaves the Martian atmospheric boundary, taken in this case as an altitude of 100km.
This tabulation is important in effectively determining the number of complete orbits made during a multi-pass entry
trajectories as well as determining the total time spent in the atmosphere.
Table 4 Test Vehicle Configurations
Vehicle Mass (kg) CD A (m2) β (kg/m2)
Mars Pathfinder 582 1.68 5.52 63.1
Mars Science Lab 3151 1.68 16.6 112.9
Moses Test Vehicle4 1000 0.4 7.00 357.1
Mars Human Mission 100,000 1.68 78.5 757.9
The test vehicle configurations considered in this analysis are presented above as Table 4 in order of increasing
ballistic coefficient. For each configuration, the initial altitude and velocity was 100 km and 5 km/s respectively, and
multi-pass entry trajectories were found experimentally by varying the initial flight path angle and solving the
equations of motion to determine the number of passes and the total time in atmosphere. The result was a series of
entry trajectories for each configuration, with number of passes ranging from two to ten. Here a ‘pass’ is defined as
complete entry and exit of the atmosphere. Thus, a 10 pass case would enter and exit the atmosphere 10 times, followed
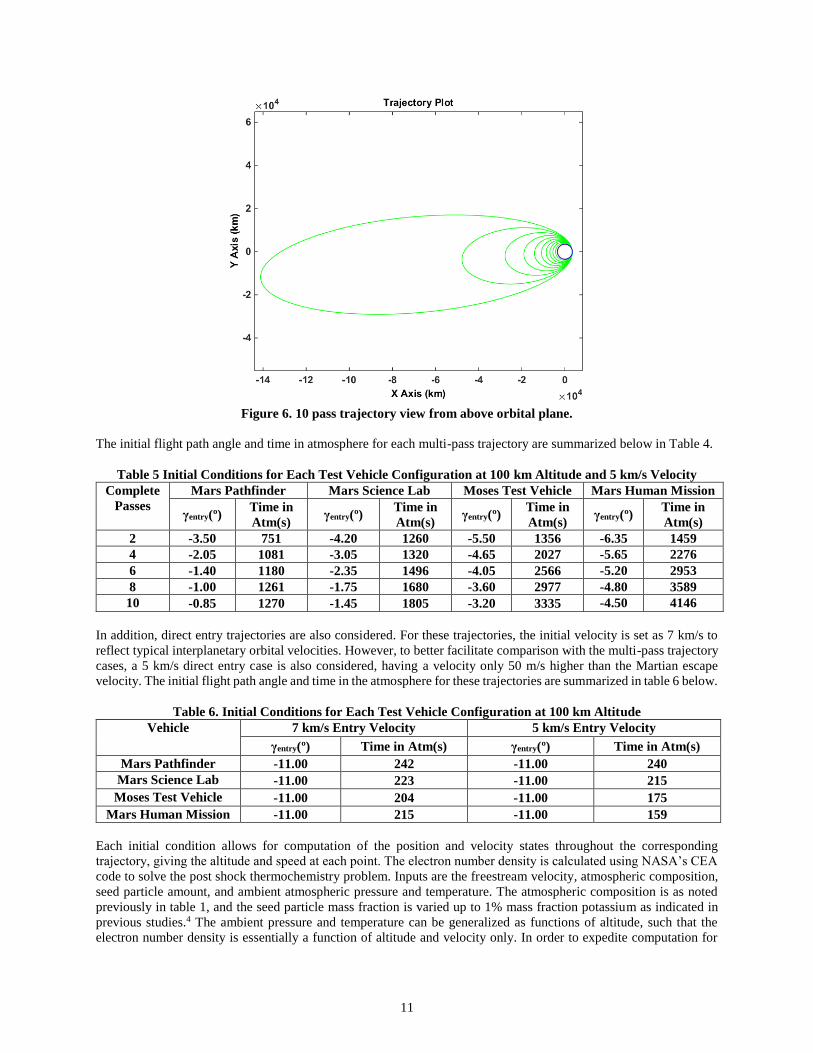
by a final entry from which the spacecraft does not reemerge. An example plot of a 10 pass trajectory as generated by
the model is given below as figure 6.
11
Figure 6. 10 pass trajectory view from above orbital plane.
The initial flight path angle and time in atmosphere for each multi-pass trajectory are summarized below in Table 4.
Table 5 Initial Conditions for Each Test Vehicle Configuration at 100 km Altitude and 5 km/s Velocity
Complete
Passes
Mars Pathfinder Mars Science Lab Moses Test Vehicle Mars Human Mission
γentry(º) Time in
Atm(s) γentry(º)
Time in
Atm(s) γentry(º)
Time in
Atm(s) γentry(º)
Time in
Atm(s)
2 -3.50 751 -4.20 1260 -5.50 1356 -6.35 1459
4 -2.05 1081 -3.05 1320 -4.65 2027 -5.65 2276
6 -1.40 1180 -2.35 1496 -4.05 2566 -5.20 2953
8 -1.00 1261 -1.75 1680 -3.60 2977 -4.80 3589
10 -0.85 1270 -1.45 1805 -3.20 3335 -4.50 4146
In addition, direct entry trajectories are also considered. For these trajectories, the initial velocity is set as 7 km/s to
reflect typical interplanetary orbital velocities. However, to better facilitate comparison with the multi-pass trajectory
cases, a 5 km/s direct entry case is also considered, having a velocity only 50 m/s higher than the Martian escape
velocity. The initial flight path angle and time in the atmosphere for these trajectories are summarized in table 6 below.
Table 6. Initial Conditions for Each Test Vehicle Configuration at 100 km Altitude
Vehicle 7 km/s Entry Velocity 5 km/s Entry Velocity
γentry(º) Time in Atm(s) γentry(º) Time in Atm(s)
Mars Pathfinder -11.00 242 -11.00 240
Mars Science Lab -11.00 223 -11.00 215
Moses Test Vehicle -11.00 204 -11.00 175
Mars Human Mission -11.00 215 -11.00 159
Each initial condition allows for computation of the position and velocity states throughout the corresponding
trajectory, giving the altitude and speed at each point. The electron number density is calculated using NASA’s CEA
code to solve the post shock thermochemistry problem. Inputs are the freestream velocity, atmospheric composition,
seed particle amount, and ambient atmospheric pressure and temperature. The atmospheric composition is as noted
previously in table 1, and the seed particle mass fraction is varied up to 1% mass fraction potassium as indicated in
previous studies.4 The ambient pressure and temperature can be generalized as functions of altitude, such that the
electron number density is essentially a function of altitude and velocity only. In order to expedite computation for
12
multiple runs, a lookup table for electron number density as a function of altitude and velocity is generated, with
altitude varying from 0 to 100 km in 1km increments and velocity varying from 2500 – 7500 m/s in 100 m/s
increments. These values cover the range of conditions and velocities suitable to MHD energy generation4, with final
electron number density linearly interpolated based on the table values.
B. Electrical Energy Storage System Performance Model A model has been created that calculates the electrical energy storage system mass for a given power generation profile
and energy storage system type. It does so by integrating the power generation vs. time profile curve to calculate the
total energy available for storage while also noting the peak energy generation power. As shown in Figure 5 and table
2, both power and energy requirements define energy storage system mass. Thus, there are two possibilities, power
capacity driven mass, and energy generation driven mass. Both approaches must be taken, and the final stored energy
is assessed relative to the initial amount of energy. From the system mass and relative energy conversion metrics, an
educated assessment can be made with regards to what energy storage system mass is most advantageous for a given
technology.
The minimum and maximum pairs in Table 2 above define worst and best cases respectively. In addition, an average
case can be generated. Thus, three distinct performance cases for each technology are selectable within the model by
the user. The end result is to generate values for power and energy density given selections for energy storage system
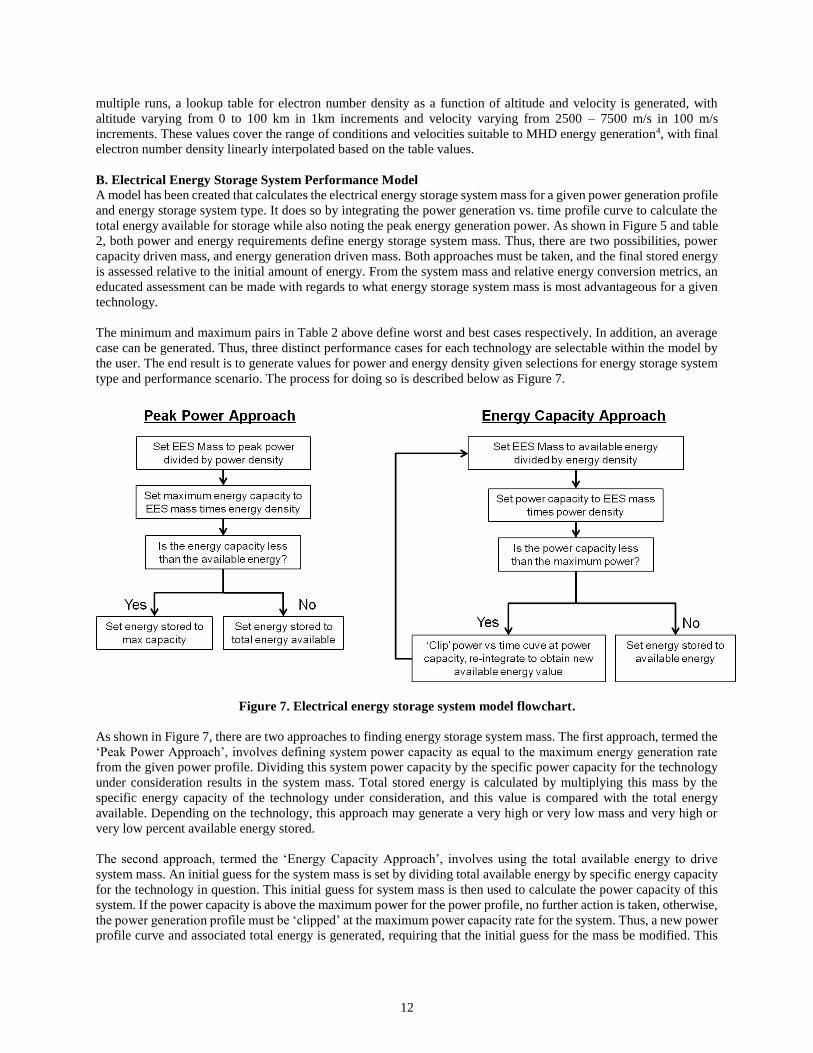
type and performance scenario. The process for doing so is described below as Figure 7.
Figure 7. Electrical energy storage system model flowchart.
As shown in Figure 7, there are two approaches to finding energy storage system mass. The first approach, termed the
‘Peak Power Approach’, involves defining system power capacity as equal to the maximum energy generation rate
from the given power profile. Dividing this system power capacity by the specific power capacity for the technology
under consideration results in the system mass. Total stored energy is calculated by multiplying this mass by the
specific energy capacity of the technology under consideration, and this value is compared with the total energy
available. Depending on the technology, this approach may generate a very high or very low mass and very high or
very low percent available energy stored.
The second approach, termed the ‘Energy Capacity Approach’, involves using the total available energy to drive
system mass. An initial guess for the system mass is set by dividing total available energy by specific energy capacity
for the technology in question. This initial guess for system mass is then used to calculate the power capacity of this
system. If the power capacity is above the maximum power for the power profile, no further action is taken, otherwise,
the power generation profile must be ‘clipped’ at the maximum power capacity rate for the system. Thus, a new power
profile curve and associated total energy is generated, requiring that the initial guess for the mass be modified. This
13
process must be completed iteratively until a converged value for energy storage mass is found. At the completion of
the process, the final mass determines the amount of energy stored, and it can be compared with the original amount
of energy available from the power generation profile.
At the conclusion of this process, the model outputs the system mass and converted energy using both approaches in
addition to the total energy available for conversion. Different technologies may result in one or the other approach
being better than the other. For this analysis, the highest percent energy retained is chosen. Finally, there is an option
to limit the total energy storage system mass to come predefined value, taken as 10% for this analysis.
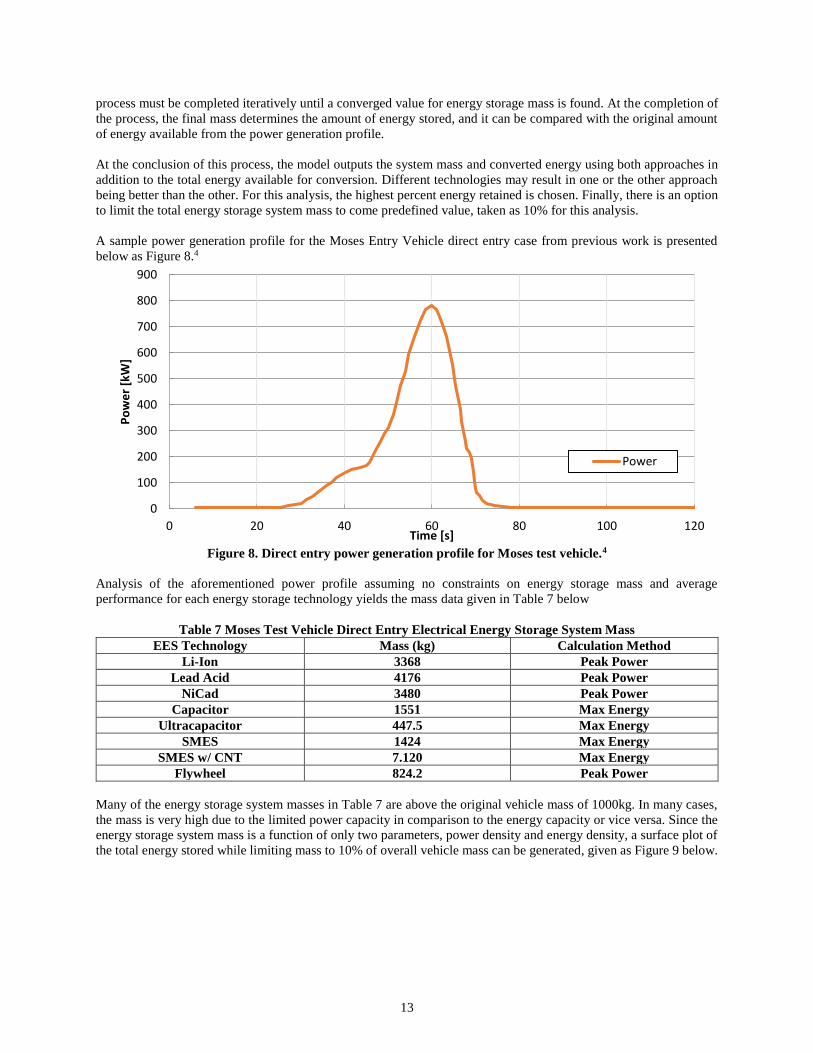
A sample power generation profile for the Moses Entry Vehicle direct entry case from previous work is presented
below as Figure 8.4
Figure 8. Direct entry power generation profile for Moses test vehicle.4
Analysis of the aforementioned power profile assuming no constraints on energy storage mass and average
performance for each energy storage technology yields the mass data given in Table 7 below
Table 7 Moses Test Vehicle Direct Entry Electrical Energy Storage System Mass
EES Technology Mass (kg) Calculation Method
Li-Ion 3368 Peak Power
Lead Acid 4176 Peak Power
NiCad 3480 Peak Power
Capacitor 1551 Max Energy
Ultracapacitor 447.5 Max Energy
SMES 1424 Max Energy
SMES w/ CNT 7.120 Max Energy
Flywheel 824.2 Peak Power
Many of the energy storage system masses in Table 7 are above the original vehicle mass of 1000kg. In many cases,
the mass is very high due to the limited power capacity in comparison to the energy capacity or vice versa. Since the
energy storage system mass is a function of only two parameters, power density and energy density, a surface plot of
the total energy stored while limiting mass to 10% of overall vehicle mass can be generated, given as Figure 9 below.
0
100
200
300
400
500
600
700
800
900
0 20 40 60 80 100 120
Po
we
r [k
W]
Time [s]
Power
14
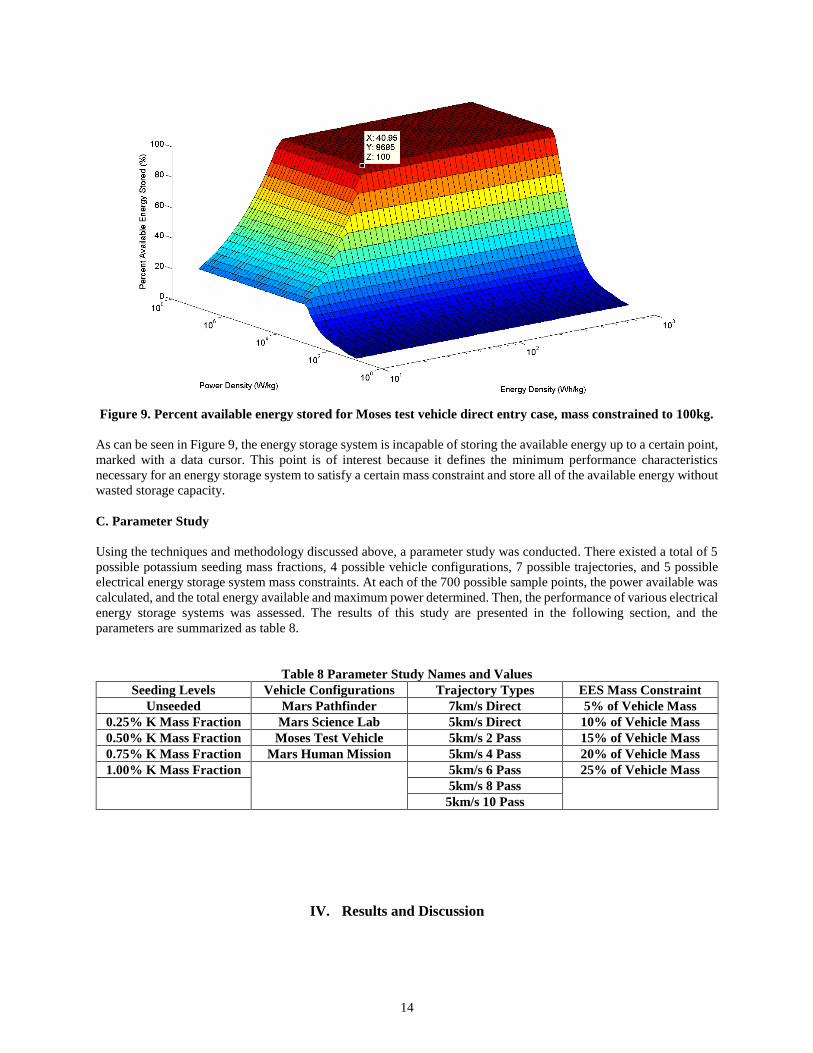
Figure 9. Percent available energy stored for Moses test vehicle direct entry case, mass constrained to 100kg.
As can be seen in Figure 9, the energy storage system is incapable of storing the available energy up to a certain point,
marked with a data cursor. This point is of interest because it defines the minimum performance characteristics
necessary for an energy storage system to satisfy a certain mass constraint and store all of the available energy without
wasted storage capacity.
C. Parameter Study
Using the techniques and methodology discussed above, a parameter study was conducted. There existed a total of 5
possible potassium seeding mass fractions, 4 possible vehicle configurations, 7 possible trajectories, and 5 possible
electrical energy storage system mass constraints. At each of the 700 possible sample points, the power available was
calculated, and the total energy available and maximum power determined. Then, the performance of various electrical
energy storage systems was assessed. The results of this study are presented in the following section, and the
parameters are summarized as table 8.
Table 8 Parameter Study Names and Values
Seeding Levels Vehicle Configurations Trajectory Types EES Mass Constraint
Unseeded Mars Pathfinder 7km/s Direct 5% of Vehicle Mass
0.25% K Mass Fraction Mars Science Lab 5km/s Direct 10% of Vehicle Mass
0.50% K Mass Fraction Moses Test Vehicle 5km/s 2 Pass 15% of Vehicle Mass
0.75% K Mass Fraction Mars Human Mission 5km/s 4 Pass 20% of Vehicle Mass
1.00% K Mass Fraction 5km/s 6 Pass 25% of Vehicle Mass
5km/s 8 Pass
5km/s 10 Pass
IV. Results and Discussion
15
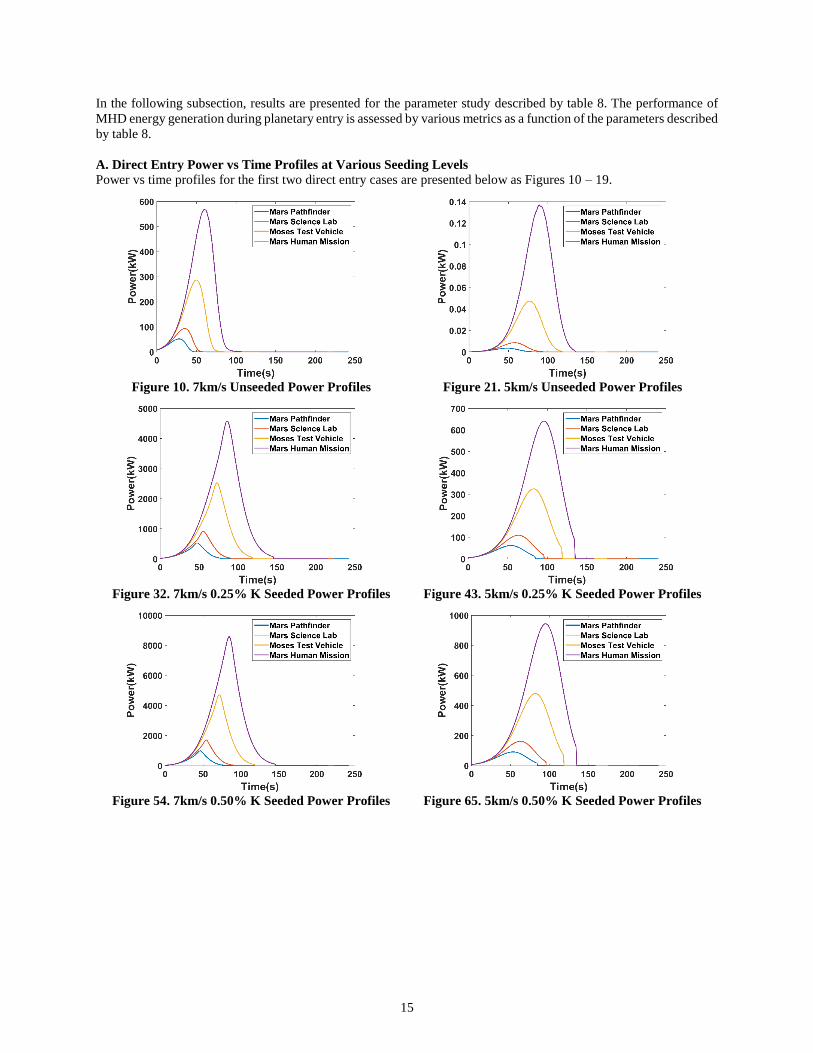
In the following subsection, results are presented for the parameter study described by table 8. The performance of
MHD energy generation during planetary entry is assessed by various metrics as a function of the parameters described
by table 8.
A. Direct Entry Power vs Time Profiles at Various Seeding Levels
Power vs time profiles for the first two direct entry cases are presented below as Figures 10 – 19.
Figure 10. 7km/s Unseeded Power Profiles Figure 21. 5km/s Unseeded Power Profiles
Figure 32. 7km/s 0.25% K Seeded Power Profiles Figure 43. 5km/s 0.25% K Seeded Power Profiles
Figure 54. 7km/s 0.50% K Seeded Power Profiles Figure 65. 5km/s 0.50% K Seeded Power Profiles
16
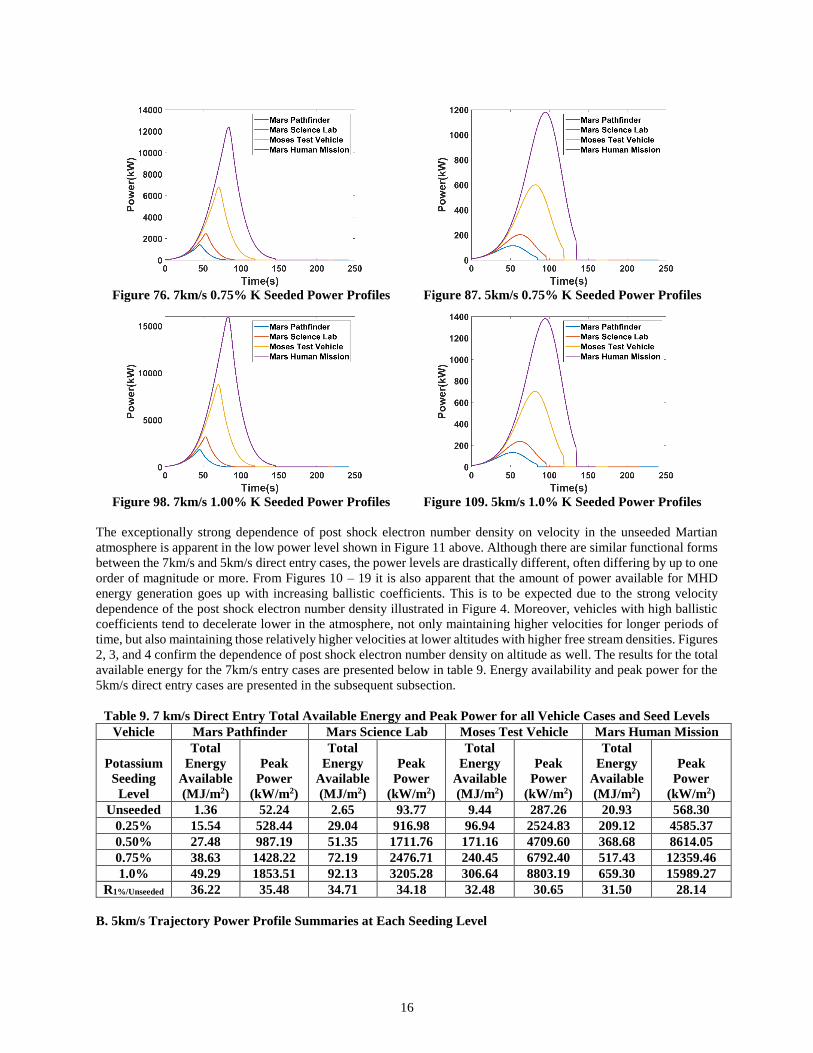
Figure 76. 7km/s 0.75% K Seeded Power Profiles Figure 87. 5km/s 0.75% K Seeded Power Profiles
Figure 98. 7km/s 1.00% K Seeded Power Profiles Figure 109. 5km/s 1.0% K Seeded Power Profiles
The exceptionally strong dependence of post shock electron number density on velocity in the unseeded Martian
atmosphere is apparent in the low power level shown in Figure 11 above. Although there are similar functional forms
between the 7km/s and 5km/s direct entry cases, the power levels are drastically different, often differing by up to one
order of magnitude or more. From Figures 10 – 19 it is also apparent that the amount of power available for MHD
energy generation goes up with increasing ballistic coefficients. This is to be expected due to the strong velocity
dependence of the post shock electron number density illustrated in Figure 4. Moreover, vehicles with high ballistic
coefficients tend to decelerate lower in the atmosphere, not only maintaining higher velocities for longer periods of
time, but also maintaining those relatively higher velocities at lower altitudes with higher free stream densities. Figures
2, 3, and 4 confirm the dependence of post shock electron number density on altitude as well. The results for the total
available energy for the 7km/s entry cases are presented below in table 9. Energy availability and peak power for the
5km/s direct entry cases are presented in the subsequent subsection.
Table 9. 7 km/s Direct Entry Total Available Energy and Peak Power for all Vehicle Cases and Seed Levels
Vehicle Mars Pathfinder Mars Science Lab Moses Test Vehicle Mars Human Mission
Potassium
Seeding
Level
Total
Energy
Available
(MJ/m2)
Peak
Power
(kW/m2)
Total
Energy
Available
(MJ/m2)
Peak
Power
(kW/m2)
Total
Energy
Available
(MJ/m2)
Peak
Power
(kW/m2)
Total
Energy
Available
(MJ/m2)
Peak
Power
(kW/m2)
Unseeded 1.36 52.24 2.65 93.77 9.44 287.26 20.93 568.30
0.25% 15.54 528.44 29.04 916.98 96.94 2524.83 209.12 4585.37
0.50% 27.48 987.19 51.35 1711.76 171.16 4709.60 368.68 8614.05
0.75% 38.63 1428.22 72.19 2476.71 240.45 6792.40 517.43 12359.46
1.0% 49.29 1853.51 92.13 3205.28 306.64 8803.19 659.30 15989.27
R1%/Unseeded 36.22 35.48 34.71 34.18 32.48 30.65 31.50 28.14
B. 5km/s Trajectory Power Profile Summaries at Each Seeding Level
17
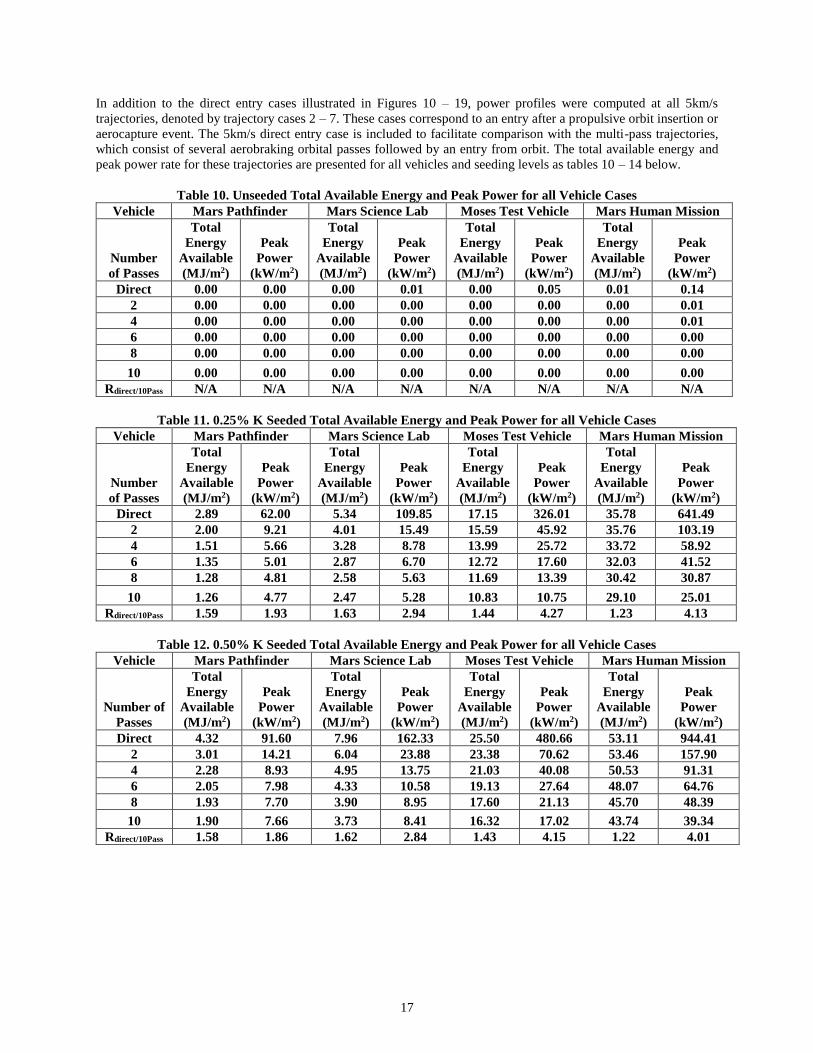
In addition to the direct entry cases illustrated in Figures 10 – 19, power profiles were computed at all 5km/s
trajectories, denoted by trajectory cases 2 – 7. These cases correspond to an entry after a propulsive orbit insertion or
aerocapture event. The 5km/s direct entry case is included to facilitate comparison with the multi-pass trajectories,
which consist of several aerobraking orbital passes followed by an entry from orbit. The total available energy and
peak power rate for these trajectories are presented for all vehicles and seeding levels as tables 10 – 14 below.
Table 10. Unseeded Total Available Energy and Peak Power for all Vehicle Cases
Vehicle Mars Pathfinder Mars Science Lab Moses Test Vehicle Mars Human Mission
Number
of Passes
Total
Energy
Available
(MJ/m2)
Peak
Power
(kW/m2)
Total
Energy
Available
(MJ/m2)
Peak
Power
(kW/m2)
Total
Energy
Available
(MJ/m2)
Peak
Power
(kW/m2)
Total
Energy
Available
(MJ/m2)
Peak
Power
(kW/m2)
Direct 0.00 0.00 0.00 0.01 0.00 0.05 0.01 0.14
2 0.00 0.00 0.00 0.00 0.00 0.00 0.00 0.01
4 0.00 0.00 0.00 0.00 0.00 0.00 0.00 0.01
6 0.00 0.00 0.00 0.00 0.00 0.00 0.00 0.00
8 0.00 0.00 0.00 0.00 0.00 0.00 0.00 0.00
10 0.00 0.00 0.00 0.00 0.00 0.00 0.00 0.00
Rdirect/10Pass N/A N/A N/A N/A N/A N/A N/A N/A
Table 11. 0.25% K Seeded Total Available Energy and Peak Power for all Vehicle Cases
Vehicle Mars Pathfinder Mars Science Lab Moses Test Vehicle Mars Human Mission
Number
of Passes
Total
Energy
Available
(MJ/m2)
Peak
Power
(kW/m2)
Total
Energy
Available
(MJ/m2)
Peak
Power
(kW/m2)
Total
Energy
Available
(MJ/m2)
Peak
Power
(kW/m2)
Total
Energy
Available
(MJ/m2)
Peak
Power
(kW/m2)
Direct 2.89 62.00 5.34 109.85 17.15 326.01 35.78 641.49
2 2.00 9.21 4.01 15.49 15.59 45.92 35.76 103.19
4 1.51 5.66 3.28 8.78 13.99 25.72 33.72 58.92
6 1.35 5.01 2.87 6.70 12.72 17.60 32.03 41.52
8 1.28 4.81 2.58 5.63 11.69 13.39 30.42 30.87
10 1.26 4.77 2.47 5.28 10.83 10.75 29.10 25.01
Rdirect/10Pass 1.59 1.93 1.63 2.94 1.44 4.27 1.23 4.13
Table 12. 0.50% K Seeded Total Available Energy and Peak Power for all Vehicle Cases
Vehicle Mars Pathfinder Mars Science Lab Moses Test Vehicle Mars Human Mission
Number of
Passes
Total
Energy
Available
(MJ/m2)
Peak
Power
(kW/m2)
Total
Energy
Available
(MJ/m2)
Peak
Power
(kW/m2)
Total
Energy
Available
(MJ/m2)
Peak
Power
(kW/m2)
Total
Energy
Available
(MJ/m2)
Peak
Power
(kW/m2)
Direct 4.32 91.60 7.96 162.33 25.50 480.66 53.11 944.41
2 3.01 14.21 6.04 23.88 23.38 70.62 53.46 157.90
4 2.28 8.93 4.95 13.75 21.03 40.08 50.53 91.31
6 2.05 7.98 4.33 10.58 19.13 27.64 48.07 64.76
8 1.93 7.70 3.90 8.95 17.60 21.13 45.70 48.39
10 1.90 7.66 3.73 8.41 16.32 17.02 43.74 39.34
Rdirect/10Pass 1.58 1.86 1.62 2.84 1.43 4.15 1.22 4.01
18
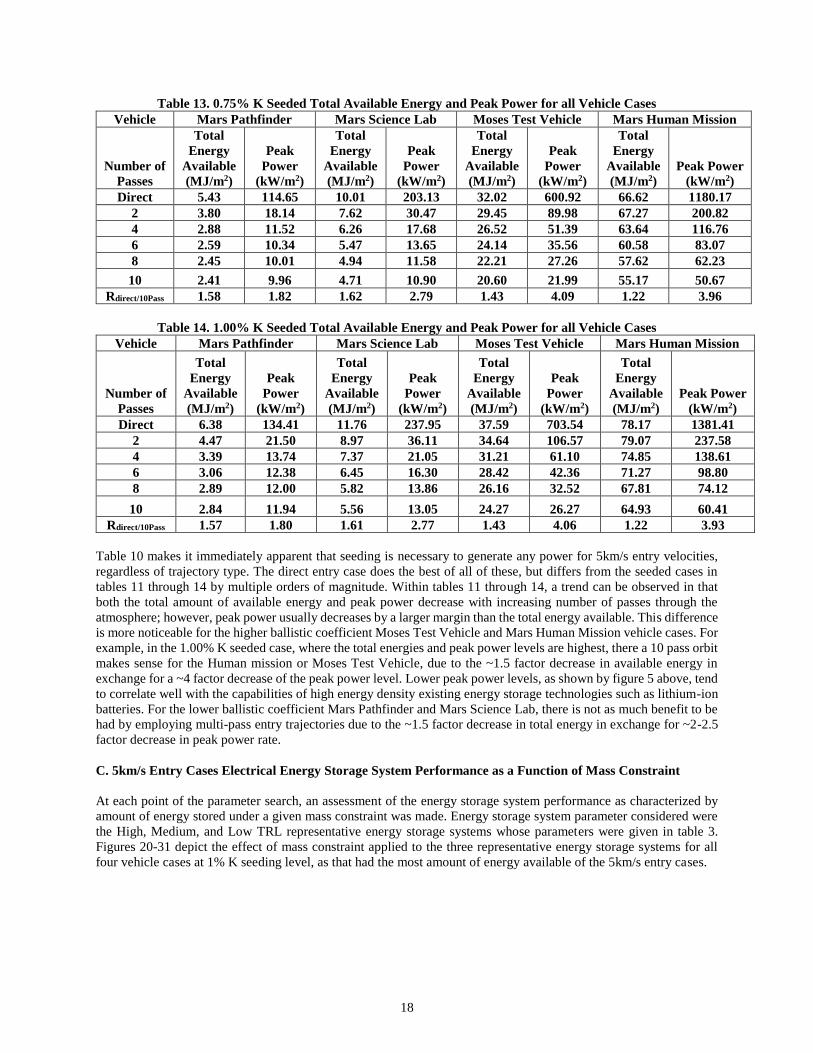
Table 13. 0.75% K Seeded Total Available Energy and Peak Power for all Vehicle Cases
Vehicle Mars Pathfinder Mars Science Lab Moses Test Vehicle Mars Human Mission
Number of
Passes
Total
Energy
Available
(MJ/m2)
Peak
Power
(kW/m2)
Total
Energy
Available
(MJ/m2)
Peak
Power
(kW/m2)
Total
Energy
Available
(MJ/m2)
Peak
Power
(kW/m2)
Total
Energy
Available
(MJ/m2)
Peak Power
(kW/m2)
Direct 5.43 114.65 10.01 203.13 32.02 600.92 66.62 1180.17
2 3.80 18.14 7.62 30.47 29.45 89.98 67.27 200.82
4 2.88 11.52 6.26 17.68 26.52 51.39 63.64 116.76
6 2.59 10.34 5.47 13.65 24.14 35.56 60.58 83.07
8 2.45 10.01 4.94 11.58 22.21 27.26 57.62 62.23
10 2.41 9.96 4.71 10.90 20.60 21.99 55.17 50.67
Rdirect/10Pass 1.58 1.82 1.62 2.79 1.43 4.09 1.22 3.96
Table 14. 1.00% K Seeded Total Available Energy and Peak Power for all Vehicle Cases
Vehicle Mars Pathfinder Mars Science Lab Moses Test Vehicle Mars Human Mission
Number of
Passes
Total
Energy
Available
(MJ/m2)
Peak
Power
(kW/m2)
Total
Energy
Available
(MJ/m2)
Peak
Power
(kW/m2)
Total
Energy
Available
(MJ/m2)
Peak
Power
(kW/m2)
Total
Energy
Available
(MJ/m2)
Peak Power
(kW/m2)
Direct 6.38 134.41 11.76 237.95 37.59 703.54 78.17 1381.41
2 4.47 21.50 8.97 36.11 34.64 106.57 79.07 237.58
4 3.39 13.74 7.37 21.05 31.21 61.10 74.85 138.61
6 3.06 12.38 6.45 16.30 28.42 42.36 71.27 98.80
8 2.89 12.00 5.82 13.86 26.16 32.52 67.81 74.12
10 2.84 11.94 5.56 13.05 24.27 26.27 64.93 60.41
Rdirect/10Pass 1.57 1.80 1.61 2.77 1.43 4.06 1.22 3.93
Table 10 makes it immediately apparent that seeding is necessary to generate any power for 5km/s entry velocities,
regardless of trajectory type. The direct entry case does the best of all of these, but differs from the seeded cases in
tables 11 through 14 by multiple orders of magnitude. Within tables 11 through 14, a trend can be observed in that
both the total amount of available energy and peak power decrease with increasing number of passes through the
atmosphere; however, peak power usually decreases by a larger margin than the total energy available. This difference
is more noticeable for the higher ballistic coefficient Moses Test Vehicle and Mars Human Mission vehicle cases. For
example, in the 1.00% K seeded case, where the total energies and peak power levels are highest, there a 10 pass orbit
makes sense for the Human mission or Moses Test Vehicle, due to the ~1.5 factor decrease in available energy in
exchange for a ~4 factor decrease of the peak power level. Lower peak power levels, as shown by figure 5 above, tend
to correlate well with the capabilities of high energy density existing energy storage technologies such as lithium-ion
batteries. For the lower ballistic coefficient Mars Pathfinder and Mars Science Lab, there is not as much benefit to be
had by employing multi-pass entry trajectories due to the ~1.5 factor decrease in total energy in exchange for ~2-2.5
factor decrease in peak power rate.
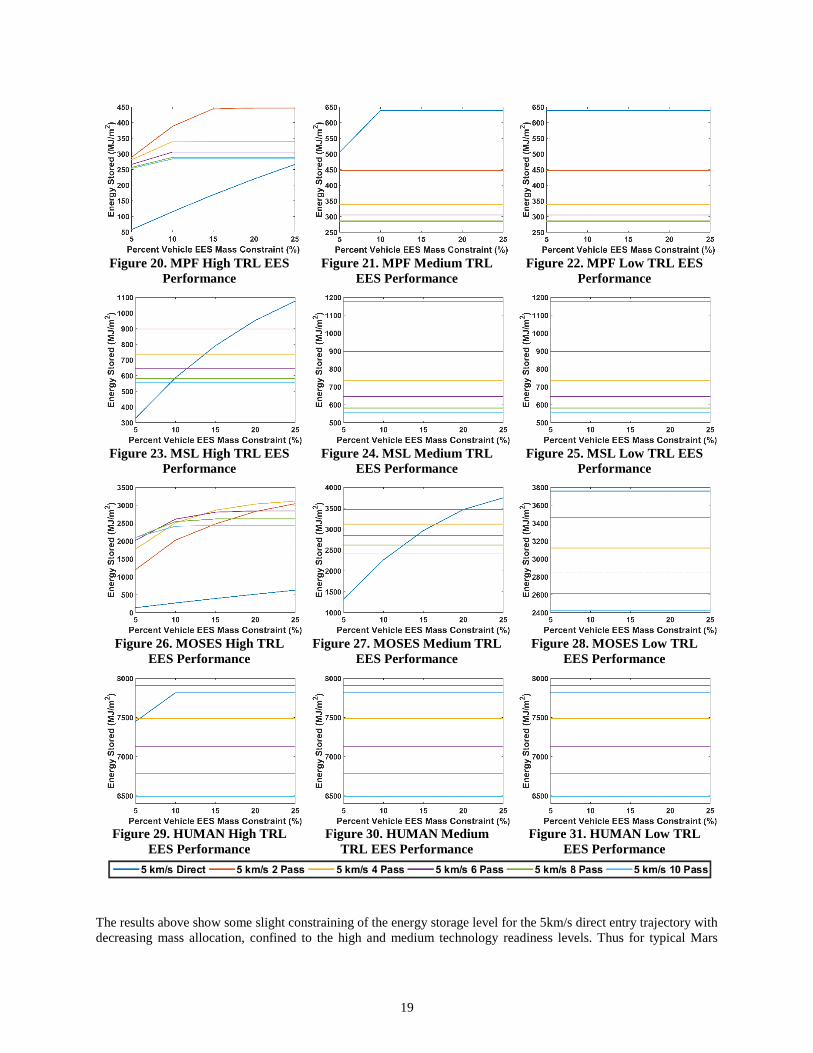
C. 5km/s Entry Cases Electrical Energy Storage System Performance as a Function of Mass Constraint
At each point of the parameter search, an assessment of the energy storage system performance as characterized by
amount of energy stored under a given mass constraint was made. Energy storage system parameter considered were
the High, Medium, and Low TRL representative energy storage systems whose parameters were given in table 3.
Figures 20-31 depict the effect of mass constraint applied to the three representative energy storage systems for all
four vehicle cases at 1% K seeding level, as that had the most amount of energy available of the 5km/s entry cases.
19
Figure 20. MPF High TRL EES
Performance
Figure 21. MPF Medium TRL
EES Performance
Figure 22. MPF Low TRL EES
Performance
Figure 23. MSL High TRL EES
Performance
Figure 24. MSL Medium TRL
EES Performance
Figure 25. MSL Low TRL EES
Performance
Figure 26. MOSES High TRL
EES Performance
Figure 27. MOSES Medium TRL
EES Performance
Figure 28. MOSES Low TRL
EES Performance
Figure 29. HUMAN High TRL
EES Performance
Figure 30. HUMAN Medium
TRL EES Performance
Figure 31. HUMAN Low TRL
EES Performance
The results above show some slight constraining of the energy storage level for the 5km/s direct entry trajectory with
decreasing mass allocation, confined to the high and medium technology readiness levels. Thus for typical Mars
20
robotic exploration entry vehicles, high TRL energy storage technologies are limited not by the available power for
MHD energy generation, but rather by their capabilities to store the available energy. The more massive the entry
vehicle initially, the higher the mass constraint and the lower the demands on the performance of the energy storage
system, as illustrated by the Mars Human Mission in Figure 29. In fact, for the Human class mission, none of the
5km/s trajectories were limited by energy storage system performance at medium and high TRLs. These results
indicate that more massive future Human missions to Mars may be able to store the energy from MHD energy
generation within a reasonable mass envelope.
It may be useful to have an idea of how much energy storage system performance is being constrained by mass for
the 5km/s direct entry cases. The unconstrained energy storage masses required to store all available energy for the
5km/s direct entry with 1% K seeding is presented below as table 15.
Table 15. 1% K Seeded 5km/s Direct Entry Unconstrained Energy Storage Mass Estimates
Vehicle
Mars
Pathfinder
Mars Science
Lab Moses Test Vehicle
Mars Human
Mission
EES Name EES Mass(kg) EES Mass(kg) EES Mass(kg) EES Mass(kg)
Lithium-Ion 578.1 1023.4 3026.0 5941.6
Lead Acid 716.9 1269.1 3752.2 7367.5
NiCad 597.4 1057.6 3126.8 6139.6
Capacitor 702.3 1293.5 4135.2 8599.6
Ultracapacitor 202.7 373.3 1193.3 2481.6
SMES 644.9 1187.7 3796.8 7896.0
SMES CNT 3.2 5.9 19.0 39.5
Flywheel 141.5 250.5 740.6 1454.1
As is shown in table 15 above, some of the energy storage technologies are poor choices for MHD energy generation
during entry, with required masses well in excess of the entire entry vehicle under consideration. However, some
emerging energy storage technologies such as SMES w/ CNT could prove very promising for flight applications.
These results indicate much opportunity for improvement in energy storage system performance; however the
importance of energy storage system performance is also dependent on the mass allocation by the mission in question.
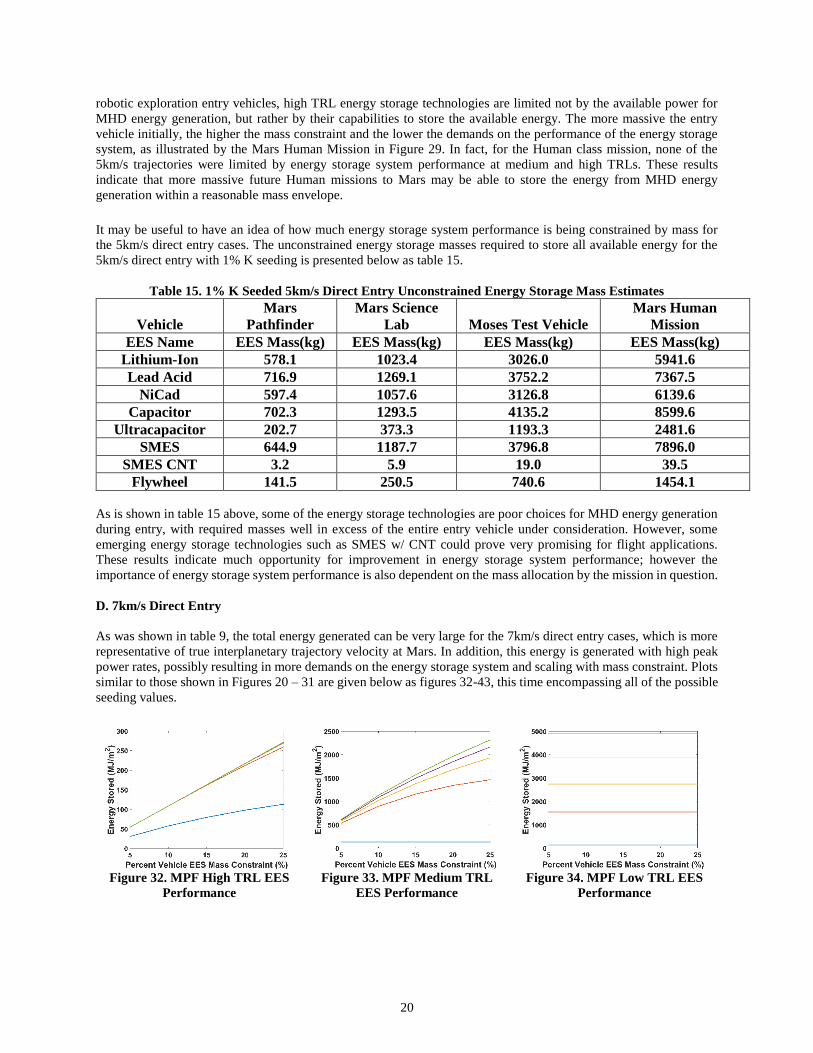
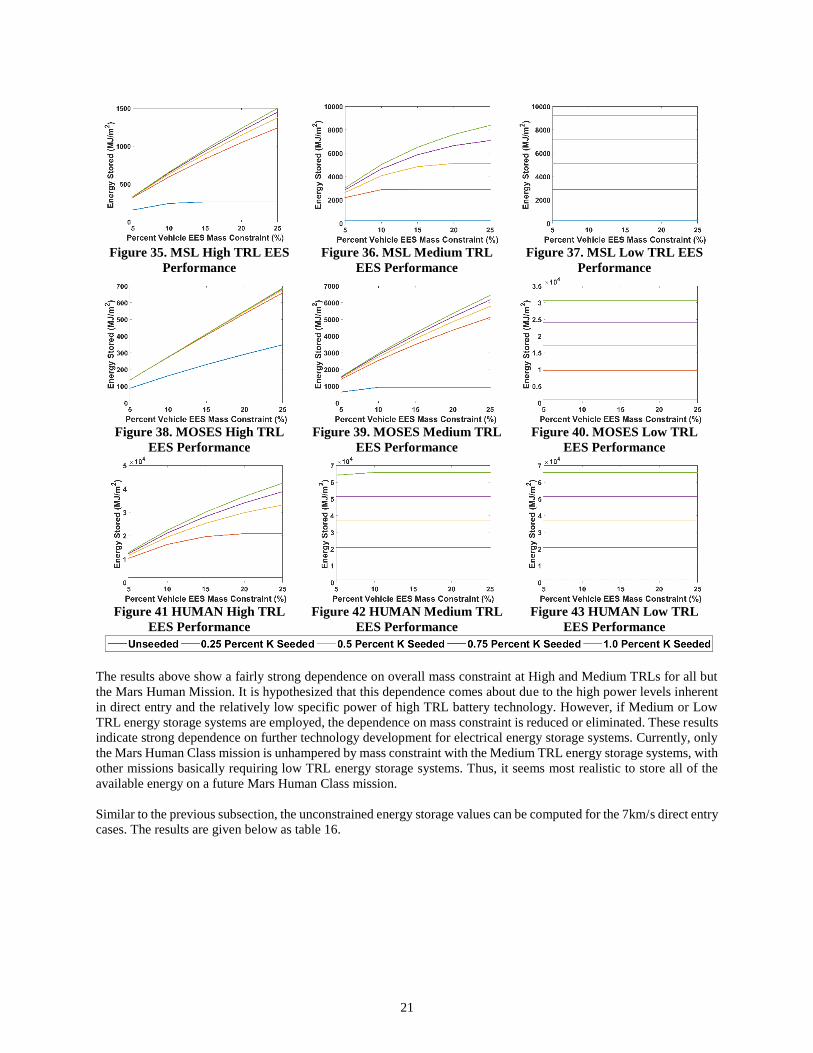
D. 7km/s Direct Entry
As was shown in table 9, the total energy generated can be very large for the 7km/s direct entry cases, which is more
representative of true interplanetary trajectory velocity at Mars. In addition, this energy is generated with high peak
power rates, possibly resulting in more demands on the energy storage system and scaling with mass constraint. Plots
similar to those shown in Figures 20 – 31 are given below as figures 32-43, this time encompassing all of the possible
seeding values.
Figure 32. MPF High TRL EES
Performance
Figure 33. MPF Medium TRL
EES Performance
Figure 34. MPF Low TRL EES
Performance
21
Figure 35. MSL High TRL EES
Performance
Figure 36. MSL Medium TRL
EES Performance
Figure 37. MSL Low TRL EES
Performance
Figure 38. MOSES High TRL
EES Performance
Figure 39. MOSES Medium TRL
EES Performance
Figure 40. MOSES Low TRL
EES Performance
Figure 41 HUMAN High TRL
EES Performance
Figure 42 HUMAN Medium TRL
EES Performance
Figure 43 HUMAN Low TRL
EES Performance
The results above show a fairly strong dependence on overall mass constraint at High and Medium TRLs for all but
the Mars Human Mission. It is hypothesized that this dependence comes about due to the high power levels inherent
in direct entry and the relatively low specific power of high TRL battery technology. However, if Medium or Low
TRL energy storage systems are employed, the dependence on mass constraint is reduced or eliminated. These results
indicate strong dependence on further technology development for electrical energy storage systems. Currently, only
the Mars Human Class mission is unhampered by mass constraint with the Medium TRL energy storage systems, with
other missions basically requiring low TRL energy storage systems. Thus, it seems most realistic to store all of the
available energy on a future Mars Human Class mission.
Similar to the previous subsection, the unconstrained energy storage values can be computed for the 7km/s direct entry
cases. The results are given below as table 16.
22
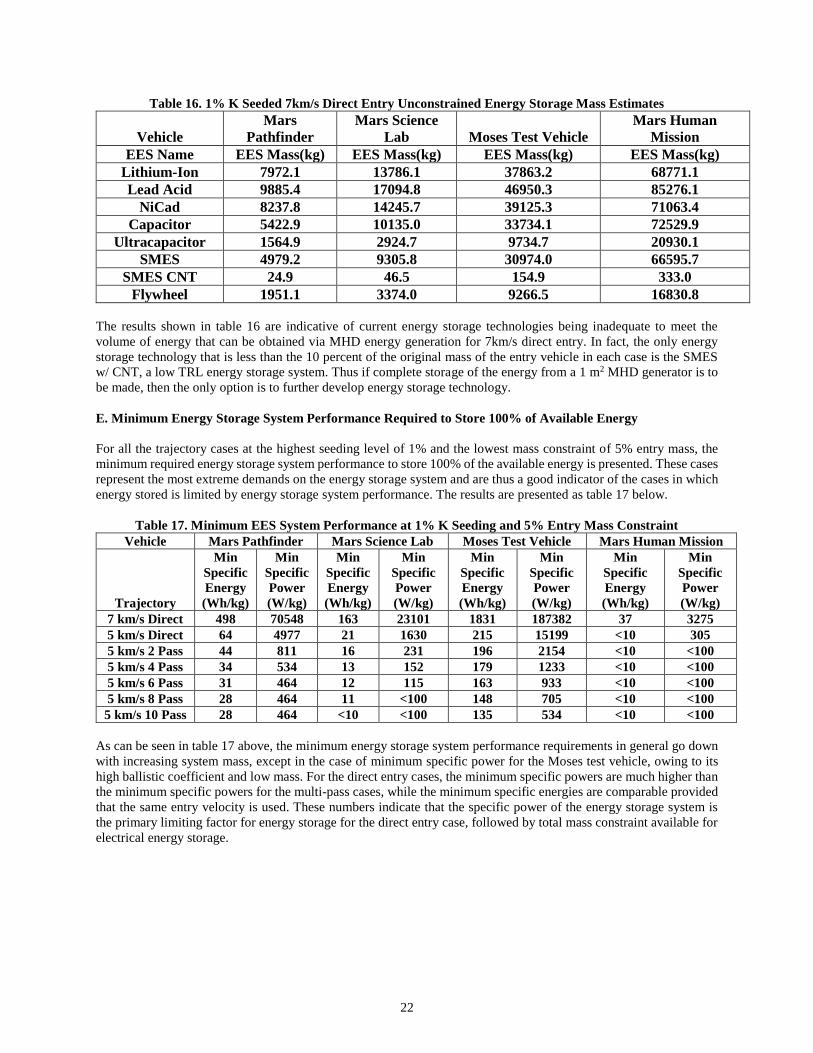
Table 16. 1% K Seeded 7km/s Direct Entry Unconstrained Energy Storage Mass Estimates
Vehicle
Mars
Pathfinder
Mars Science
Lab Moses Test Vehicle
Mars Human
Mission
EES Name EES Mass(kg) EES Mass(kg) EES Mass(kg) EES Mass(kg)
Lithium-Ion 7972.1 13786.1 37863.2 68771.1
Lead Acid 9885.4 17094.8 46950.3 85276.1
NiCad 8237.8 14245.7 39125.3 71063.4
Capacitor 5422.9 10135.0 33734.1 72529.9
Ultracapacitor 1564.9 2924.7 9734.7 20930.1
SMES 4979.2 9305.8 30974.0 66595.7
SMES CNT 24.9 46.5 154.9 333.0
Flywheel 1951.1 3374.0 9266.5 16830.8
The results shown in table 16 are indicative of current energy storage technologies being inadequate to meet the
volume of energy that can be obtained via MHD energy generation for 7km/s direct entry. In fact, the only energy
storage technology that is less than the 10 percent of the original mass of the entry vehicle in each case is the SMES
w/ CNT, a low TRL energy storage system. Thus if complete storage of the energy from a 1 m2 MHD generator is to
be made, then the only option is to further develop energy storage technology.
E. Minimum Energy Storage System Performance Required to Store 100% of Available Energy
For all the trajectory cases at the highest seeding level of 1% and the lowest mass constraint of 5% entry mass, the
minimum required energy storage system performance to store 100% of the available energy is presented. These cases
represent the most extreme demands on the energy storage system and are thus a good indicator of the cases in which
energy stored is limited by energy storage system performance. The results are presented as table 17 below.
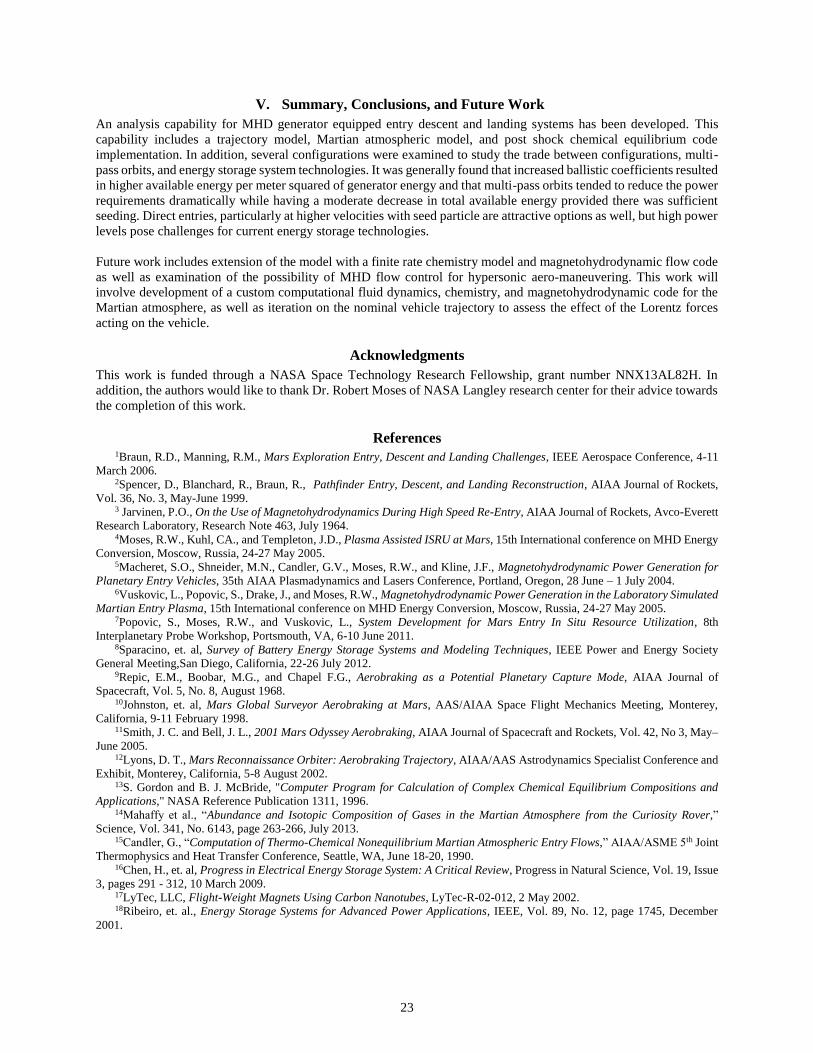
Table 17. Minimum EES System Performance at 1% K Seeding and 5% Entry Mass Constraint
Vehicle Mars Pathfinder Mars Science Lab Moses Test Vehicle Mars Human Mission
Trajectory
Min
Specific
Energy
(Wh/kg)
Min
Specific
Power
(W/kg)
Min
Specific
Energy
(Wh/kg)
Min
Specific
Power
(W/kg)
Min
Specific
Energy
(Wh/kg)
Min
Specific
Power
(W/kg)
Min
Specific
Energy
(Wh/kg)
Min
Specific
Power
(W/kg)
7 km/s Direct 498 70548 163 23101 1831 187382 37 3275
5 km/s Direct 64 4977 21 1630 215 15199 <10 305
5 km/s 2 Pass 44 811 16 231 196 2154 <10 <100
5 km/s 4 Pass 34 534 13 152 179 1233 <10 <100
5 km/s 6 Pass 31 464 12 115 163 933 <10 <100
5 km/s 8 Pass 28 464 11 <100 148 705 <10 <100
5 km/s 10 Pass 28 464 <10 <100 135 534 <10 <100
As can be seen in table 17 above, the minimum energy storage system performance requirements in general go down
with increasing system mass, except in the case of minimum specific power for the Moses test vehicle, owing to its
high ballistic coefficient and low mass. For the direct entry cases, the minimum specific powers are much higher than
the minimum specific powers for the multi-pass cases, while the minimum specific energies are comparable provided
that the same entry velocity is used. These numbers indicate that the specific power of the energy storage system is
the primary limiting factor for energy storage for the direct entry case, followed by total mass constraint available for
electrical energy storage.
23
V. Summary, Conclusions, and Future Work
An analysis capability for MHD generator equipped entry descent and landing systems has been developed. This
capability includes a trajectory model, Martian atmospheric model, and post shock chemical equilibrium code
implementation. In addition, several configurations were examined to study the trade between configurations, multi-
pass orbits, and energy storage system technologies. It was generally found that increased ballistic coefficients resulted
in higher available energy per meter squared of generator energy and that multi-pass orbits tended to reduce the power
requirements dramatically while having a moderate decrease in total available energy provided there was sufficient
seeding. Direct entries, particularly at higher velocities with seed particle are attractive options as well, but high power
levels pose challenges for current energy storage technologies.
Future work includes extension of the model with a finite rate chemistry model and magnetohydrodynamic flow code
as well as examination of the possibility of MHD flow control for hypersonic aero-maneuvering. This work will
involve development of a custom computational fluid dynamics, chemistry, and magnetohydrodynamic code for the
Martian atmosphere, as well as iteration on the nominal vehicle trajectory to assess the effect of the Lorentz forces
acting on the vehicle.
Acknowledgments
This work is funded through a NASA Space Technology Research Fellowship, grant number NNX13AL82H. In
addition, the authors would like to thank Dr. Robert Moses of NASA Langley research center for their advice towards
the completion of this work.
References 1Braun, R.D., Manning, R.M., Mars Exploration Entry, Descent and Landing Challenges, IEEE Aerospace Conference, 4-11
March 2006. 2Spencer, D., Blanchard, R., Braun, R., Pathfinder Entry, Descent, and Landing Reconstruction, AIAA Journal of Rockets,
Vol. 36, No. 3, May-June 1999. 3 Jarvinen, P.O., On the Use of Magnetohydrodynamics During High Speed Re-Entry, AIAA Journal of Rockets, Avco-Everett
Research Laboratory, Research Note 463, July 1964. 4Moses, R.W., Kuhl, CA., and Templeton, J.D., Plasma Assisted ISRU at Mars, 15th International conference on MHD Energy
Conversion, Moscow, Russia, 24-27 May 2005. 5Macheret, S.O., Shneider, M.N., Candler, G.V., Moses, R.W., and Kline, J.F., Magnetohydrodynamic Power Generation for
Planetary Entry Vehicles, 35th AIAA Plasmadynamics and Lasers Conference, Portland, Oregon, 28 June – 1 July 2004. 6Vuskovic, L., Popovic, S., Drake, J., and Moses, R.W., Magnetohydrodynamic Power Generation in the Laboratory Simulated
Martian Entry Plasma, 15th International conference on MHD Energy Conversion, Moscow, Russia, 24-27 May 2005. 7Popovic, S., Moses, R.W., and Vuskovic, L., System Development for Mars Entry In Situ Resource Utilization, 8th
Interplanetary Probe Workshop, Portsmouth, VA, 6-10 June 2011. 8Sparacino, et. al, Survey of Battery Energy Storage Systems and Modeling Techniques, IEEE Power and Energy Society
General Meeting,San Diego, California, 22-26 July 2012. 9Repic, E.M., Boobar, M.G., and Chapel F.G., Aerobraking as a Potential Planetary Capture Mode, AIAA Journal of
Spacecraft, Vol. 5, No. 8, August 1968. 10Johnston, et. al, Mars Global Surveyor Aerobraking at Mars, AAS/AIAA Space Flight Mechanics Meeting, Monterey,
California, 9-11 February 1998. 11Smith, J. C. and Bell, J. L., 2001 Mars Odyssey Aerobraking, AIAA Journal of Spacecraft and Rockets, Vol. 42, No 3, May–
June 2005. 12Lyons, D. T., Mars Reconnaissance Orbiter: Aerobraking Trajectory, AIAA/AAS Astrodynamics Specialist Conference and
Exhibit, Monterey, California, 5-8 August 2002. 13S. Gordon and B. J. McBride, "Computer Program for Calculation of Complex Chemical Equilibrium Compositions and
Applications," NASA Reference Publication 1311, 1996. 14Mahaffy et al., “Abundance and Isotopic Composition of Gases in the Martian Atmosphere from the Curiosity Rover,”
Science, Vol. 341, No. 6143, page 263-266, July 2013. 15Candler, G., “Computation of Thermo-Chemical Nonequilibrium Martian Atmospheric Entry Flows,” AIAA/ASME 5th Joint
Thermophysics and Heat Transfer Conference, Seattle, WA, June 18-20, 1990. 16Chen, H., et. al, Progress in Electrical Energy Storage System: A Critical Review, Progress in Natural Science, Vol. 19, Issue
3, pages 291 - 312, 10 March 2009. 17LyTec, LLC, Flight-Weight Magnets Using Carbon Nanotubes, LyTec-R-02-012, 2 May 2002. 18Ribeiro, et. al., Energy Storage Systems for Advanced Power Applications, IEEE, Vol. 89, No. 12, page 1745, December
2001.