Embed Size (px)
Citation preview
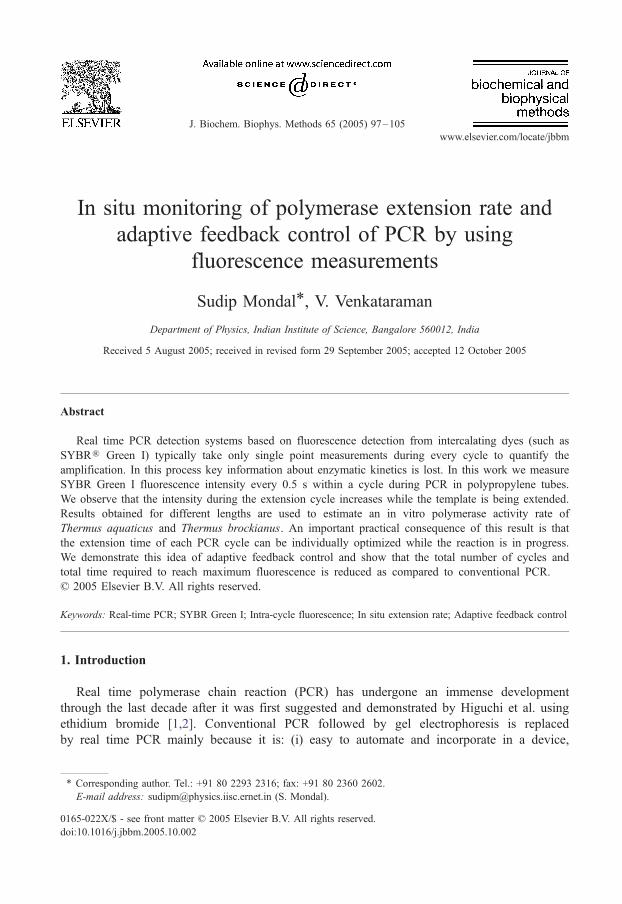
J. Biochem. Biophys. Methods 65 (2005) 97–105
www.elsevier.com/locate/jbbm
In situ monitoring of polymerase extension rate and
adaptive feedback control of PCR by using
fluorescence measurements
Sudip Mondal*, V. Venkataraman
Department of Physics, Indian Institute of Science, Bangalore 560012, India
Received 5 August 2005; received in revised form 29 September 2005; accepted 12 October 2005
Abstract
Real time PCR detection systems based on fluorescence detection from intercalating dyes (such as
SYBRR Green I) typically take only single point measurements during every cycle to quantify the
amplification. In this process key information about enzymatic kinetics is lost. In this work we measure
SYBR Green I fluorescence intensity every 0.5 s within a cycle during PCR in polypropylene tubes.
We observe that the intensity during the extension cycle increases while the template is being extended.
Results obtained for different lengths are used to estimate an in vitro polymerase activity rate of
Thermus aquaticus and Thermus brockianus. An important practical consequence of this result is that
the extension time of each PCR cycle can be individually optimized while the reaction is in progress.
We demonstrate this idea of adaptive feedback control and show that the total number of cycles and
total time required to reach maximum fluorescence is reduced as compared to conventional PCR.
D 2005 Elsevier B.V. All rights reserved.
Keywords: Real-time PCR; SYBR Green I; Intra-cycle fluorescence; In situ extension rate; Adaptive feedback control
1. Introduction
Real time polymerase chain reaction (PCR) has undergone an immense development
through the last decade after it was first suggested and demonstrated by Higuchi et al. using
ethidium bromide [1,2]. Conventional PCR followed by gel electrophoresis is replaced
by real time PCR mainly because it is: (i) easy to automate and incorporate in a device,
0165-022X/$ - see front matter D 2005 Elsevier B.V. All rights reserved.
doi:10.1016/j.jbbm.2005.10.002
* Corresponding author. Tel.: +91 80 2293 2316; fax: +91 80 2360 2602.
E-mail address: [email protected] (S. Mondal).
S. Mondal, V. Venkataraman / J. Biochem. Biophys. Methods 65 (2005) 97–10598
(ii) makes the whole process faster, and (iii) reduces the number of steps of handling and
hence minimizes chances of contamination. Fluorescent probes used to monitor in vitro
DNA amplification are (i) double stranded-DNA (ds-DNA) specific dyes and (ii) DNA
sequence specific oligonucleotide probes. The most commonly used ds-DNA intercalating
dye is SYBRR Green I (SG) in both research and commercial RT-PCR protocols. This is
because it is relatively inexpensive and selective to ds-DNA compared to single stranded
DNA (ss-DNA) by ~11 fold [3]. SG fluorescence sensitivity is limited by binding to
non-specific products, which can be overcome by melting curve analysis. For example in
the case of amplifying multiple DNA fragments in multiplex PCR [4,5], the final
products can be distinguished by their characteristic melting temperatures. Similarly
complex DNA melting profiles with A/T- and G/C-rich clusters give rise to multiple
transition peaks [6,7]. SG fluorescence has been used to monitor DNA amplification
during PCR in plastic reaction tubes [8,9], glass capillary tubes [10–15], miniaturized
devices [16,17] and hand held diagnostic devices [18].
Since DNA polymerase plays an important role in PCR, attempts have been made to
understand every reaction mechanism such as polymerase binding, effect of buffer
components, extension along the template and release of polymerase from the fully extended
template. DNA polymerization catalyzed by Klenow Fragment of DNA polymerase I (KF)
and Thermus aquaticus (Taq) DNA polymerase has been examined by gel electrophoresis of
rapidly quenched products [19–22], quartz microbalance [23,24] and time resolved
fluorescence spectroscopy [25–27]. These techniques have some drawbacks: for example,
rapid quench technique requires isotope labeling, quartz microbalance requires immobiliza-
tion of the template and fluorescence technique requires fluorophore labeling. Hence they
have not been used to monitor polymerase activity during PCR. In this paper we show that
real time continuous fluorescence data obtained during the extension phase within a PCR
cycle can be used to directly infer polymerase extension rates. Though attempts have been
made previously to collect complete fluorescence spectra in real time [1,10,15,28,29], very
little was concluded from those measurements. In present work we demonstrate how the
intra-cycle fluorescence can be used to adapt the cycling parameters to optimize extension
stay time. This can reduce the number of cycles required to reach the maximum fluorescence
by considerable amount.
2. Materials and methods
2.1. DNA samples and primers
DNA amplification was performed using DyNAmok SYBRR Green qPCR kit (Finzymes, Espoo,
Finland) containing modified Thermus brockianus (Tbr) DNA polymerase, SYBR Green I fluorescent dye,
optimized PCR buffer, 5 mM MgCl2, dNTP mix including dUTP. A 20-AL amplification mixture was
prepared using 10 AL of 2�qPCR kit, 1 AL of template solution, 0.2 AM of both upstream and downstream
primers. In order to test the effect of another polymerase without isolating the Tbr from the mix, 2 U of Taq
polymerase, supplied in 20 mM Tris–HCl (pH 8.0), 100 mM KCl, 0.1 mM EDTA, 1 mM DTT, 0.5%
TweenR-20, 0.5% Igepal and 50% Glycerol (Bangalore Genei, Bangalore, India) was added wherever
mentioned. We used Prostatin C1 (PC1, 346 bp) and TGFh1 (999 bp) cDNAs cloned in the plasmid
BlueScript (Stratagene, USA) as template at concentration of 1 ng/AL for PCR. The above templates were
selectively amplified using the same primer set T3 (5V-ATTAACCCTCACTAAAGGGA-3V) and T7 (5V-TAATACGACTCACTATAGGG-3V) to produce 502 bp and 1155 bp size, respectively. Genomic DNA
purified from S. marcescens (Bangalore Genei) at concentration 80 ng/AL, amplified using forward (5V-
S. Mondal, V. Venkataraman / J. Biochem. Biophys. Methods 65 (2005) 97–105 99
AGCAGGGATGACCAACTC-3V) and reverse (5V-GCGGATCCTCTTGCCAAAGAGAGAAT-3V) primers
produced 800 bp products.
2.2. Amplification in commercial thermocycler
Amplification was carried out for volumes ranging from 1 to 25 AL of PCR mixture in low profile tube
using PTC-150 MiniCycler (MJ Research, Waltham, Massachusetts, USA). Apart from a change in the
fluorescence intensity, the results obtained were independent of the reaction volume. Here we report the
results only for 3 AL. The tubes were used without caps and the hot bonnet to collect maximum
fluorescence from the top. The mixture was overlaid using 6 AL of mineral oil (M-5904, Sigma, St. Louis,
MO, USA) to avoid evaporation at high temperatures. The sample was initially incubated at 95 8C for 1 min
followed by 35 cycles of thermal cycling (denatured at 95 8C for 15 s, annealed at 50 8C for 15 s, extended
at 72 8C for 1 min) and a final extension step at 72 8C for 5 min. During the optimization experiment of
extension time, the stay time was fixed at 40 s, 1, 2, or 4 min, or varied manually according to the
fluorescence as mentioned in the text. In order to record the thermal profile a 2�2.3 mm 100 V Platinum
resistor was used as a temperature sensor. The sensor was dipped inside an adjacent tube containing 10 ALof mineral oil.
2.3. Fluorescence detection system
An optical detection system for fluorescence measurement was made for SG dye. SG emits fluorescence
at 520 nm when excited at 470 nm. The fluorescence setup was mounted on a stage with vertical movement
to focus on the sample. It consists of a high power blue light emitting diode (LED) (Roithner Lasertechnik,
Vienna, Austria) mounted on a heat sink attached to a cooling fan. The LED was driven by a LED current
driver (Roithner Lasertechnik). The light was focused using an aspheric glass lens (Roithner Lasertechnik)
and filtered by excitation band-pass filter of 450–490 nm (Carl Zeiss, Germany). The filtered blue light was
reflected and guided perpendicularly to the reaction chamber by a dichroic beam-splitter (Carl Zeiss) and
focused using a 10� objective (Carl Zeiss). Emitted fluorescence was collected by the same objective,
guided vertically through the beam-splitter (Carl Zeiss), filtered using green emission filter (Carl Zeiss) and
focused on to a silicon photo detector by a lens. The photo current was recorded using a SR830 Lock-In
Amplifier (Stanford Research Systems, Sunnyvale, CA, USA). Lock-In detection technique was used since
it is very sensitive and removes background noise. The amplifier was locked on to an internal frequency of
190 Hz that was used to modulate the LED driver. The resistance of the platinum temperature sensor inside
the dummy tube with mineral oil was recorded using Keithley 196 system DMM, and converted to
temperature later. All data was recorded and stored in a PC for further processing.
3. Results
3.1. Continuous intra-cycle fluorescence monitoring
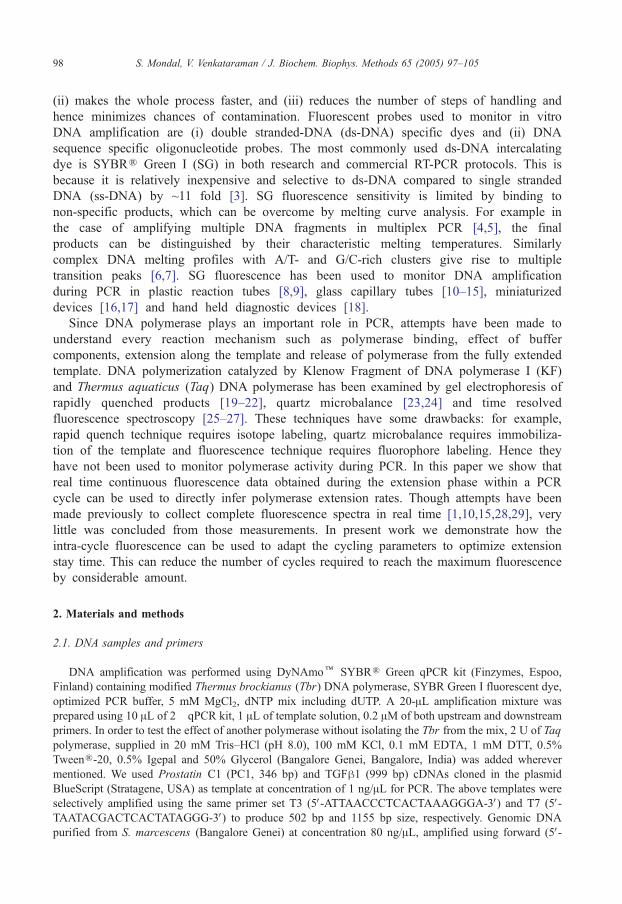
We start with amplification of PC1 DNA in polypropylene tubes using a commercial
thermocycler. In Fig. 1a we show a typical curve of detector current, which is proportional to
fluorescence intensity, as a function of cycle number for three samples (one positive and two
negative controls). The data is recorded after the extension step in every cycle. All three samples
were loaded in 1% agarose gel. The results agree with the fluorescence measurements, i.e., only
the lane corresponding to the positive control gives a bright band in the gel.
Instead of single point fluorescence in every cycle the detector signal is recorded
continuously with a delay of 0.5 s. Time evolution of fluorescence for PC1 DNA for 35 cycles
is shown in Fig. 1b. The fluorescence trace as a function of time follows the temperature profile,
as observed by earlier workers [1,10]. The amplification can be clearly observed as an increase
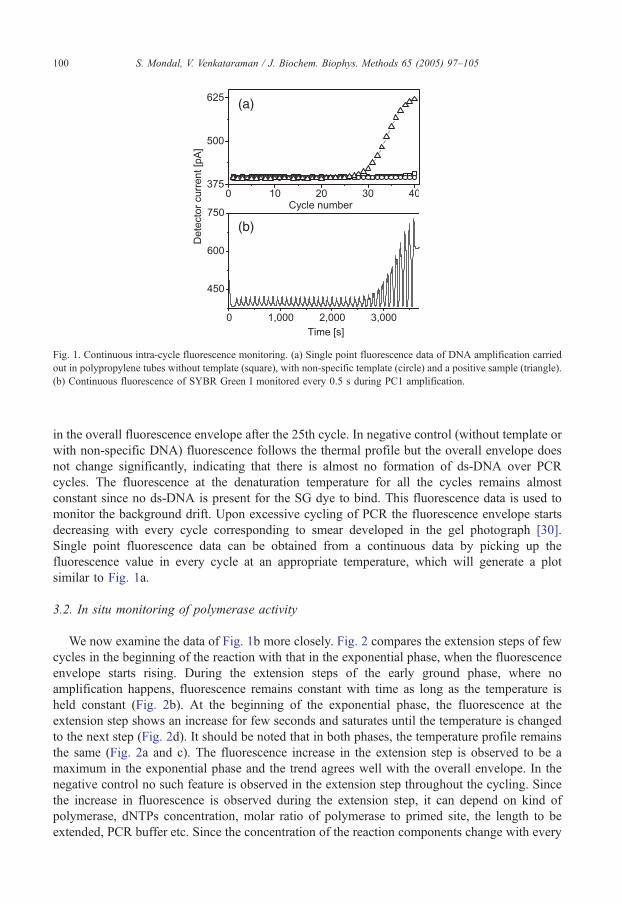
Fig. 1. Continuous intra-cycle fluorescence monitoring. (a) Single point fluorescence data of DNA amplification carried
out in polypropylene tubes without template (square), with non-specific template (circle) and a positive sample (triangle).
(b) Continuous fluorescence of SYBR Green I monitored every 0.5 s during PC1 amplification.
S. Mondal, V. Venkataraman / J. Biochem. Biophys. Methods 65 (2005) 97–105100
in the overall fluorescence envelope after the 25th cycle. In negative control (without template or
with non-specific DNA) fluorescence follows the thermal profile but the overall envelope does
not change significantly, indicating that there is almost no formation of ds-DNA over PCR
cycles. The fluorescence at the denaturation temperature for all the cycles remains almost
constant since no ds-DNA is present for the SG dye to bind. This fluorescence data is used to
monitor the background drift. Upon excessive cycling of PCR the fluorescence envelope starts
decreasing with every cycle corresponding to smear developed in the gel photograph [30].
Single point fluorescence data can be obtained from a continuous data by picking up the
fluorescence value in every cycle at an appropriate temperature, which will generate a plot
similar to Fig. 1a.
3.2. In situ monitoring of polymerase activity
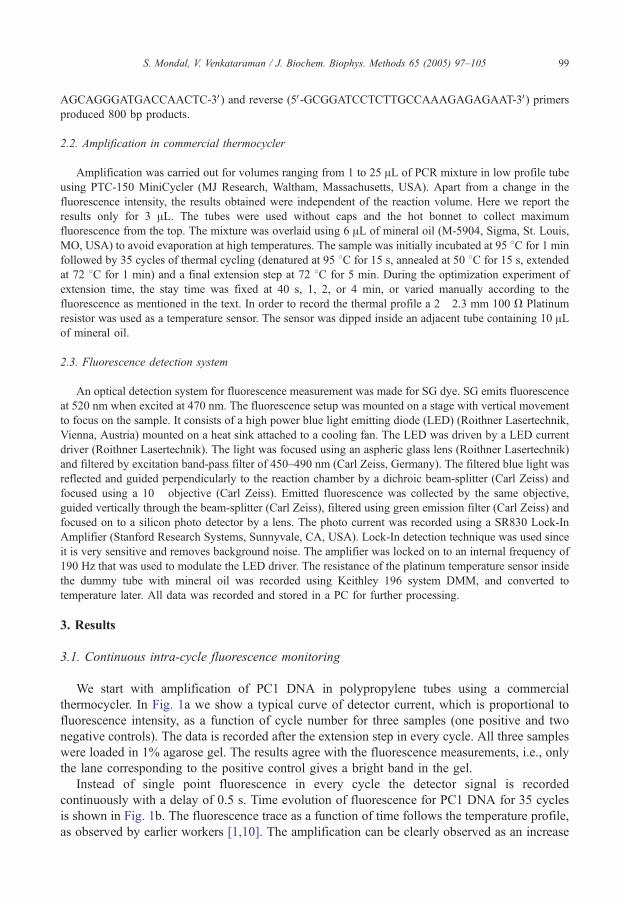
We now examine the data of Fig. 1b more closely. Fig. 2 compares the extension steps of few
cycles in the beginning of the reaction with that in the exponential phase, when the fluorescence
envelope starts rising. During the extension steps of the early ground phase, where no
amplification happens, fluorescence remains constant with time as long as the temperature is
held constant (Fig. 2b). At the beginning of the exponential phase, the fluorescence at the
extension step shows an increase for few seconds and saturates until the temperature is changed
to the next step (Fig. 2d). It should be noted that in both phases, the temperature profile remains
the same (Fig. 2a and c). The fluorescence increase in the extension step is observed to be a
maximum in the exponential phase and the trend agrees well with the overall envelope. In the
negative control no such feature is observed in the extension step throughout the cycling. Since
the increase in fluorescence is observed during the extension step, it can depend on kind of
polymerase, dNTPs concentration, molar ratio of polymerase to primed site, the length to be
extended, PCR buffer etc. Since the concentration of the reaction components change with every
Fig. 2. Comparison of fluorescence data for initial and intermediate cycles. The fluorescence for 16th, 17th and 18th
cycles during the ground phase (b) and 25th, 26th and 27th during exponential phase (d) are shown as a function of time
with corresponding thermal profiles (a and c).
S. Mondal, V. Venkataraman / J. Biochem. Biophys. Methods 65 (2005) 97–105 101
cycle during amplification, they are difficult to control. So we have chosen to study the
dependence of this feature on the nature of polymerase and the length of the template.
Fig. 3 shows increasing fluorescence features in extension step during three typical PCR
cycles with two different template sizes, PC1 (Fig. 3a) and TGFh1 (Fig. 3b). Extension
temperature is maintained at 72 8C, optimum for the polymerase activity as specified by the
supplier, for both of them. The horizontal axes are offset to start both figures from zero at an
arbitrary point in a cycle. The polymerase used for both of these is modified Tbr DNA
polymerase. Fig. 3c and d compares the same two templates using a different kind of
Fig. 3. Comparison of extension steps for two different template lengths PC1 (a) and TGFh1 (b). The reactions were
carried out using Thermus brockianus polymerase. Comparison of extension steps for same two template lengths PC1 (c
and TGFh1 (d) carried out using extra Thermus aquaticus polymerase added to Thermus brockianus master mix.
)
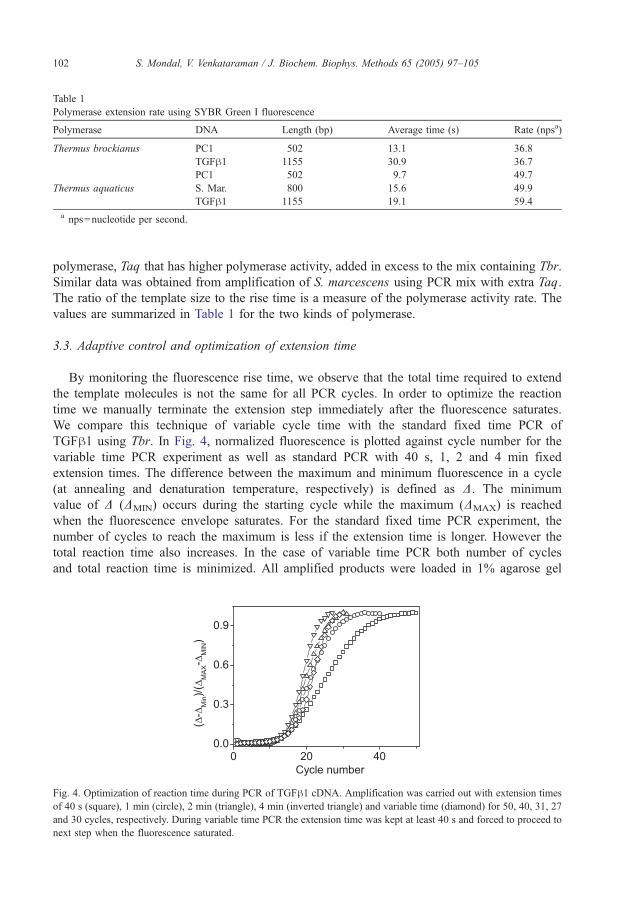
Table 1
Polymerase extension rate using SYBR Green I fluorescence
Polymerase DNA Length (bp) Average time (s) Rate (npsa)
Thermus brockianus PC1 502 13.1 36.8
TGFh1 1155 30.9 36.7
PC1 502 9.7 49.7
Thermus aquaticus S. Mar. 800 15.6 49.9
TGFh1 1155 19.1 59.4
a nps=nucleotide per second.
S. Mondal, V. Venkataraman / J. Biochem. Biophys. Methods 65 (2005) 97–105102
polymerase, Taq that has higher polymerase activity, added in excess to the mix containing Tbr.
Similar data was obtained from amplification of S. marcescens using PCR mix with extra Taq.
The ratio of the template size to the rise time is a measure of the polymerase activity rate. The
values are summarized in Table 1 for the two kinds of polymerase.
3.3. Adaptive control and optimization of extension time
By monitoring the fluorescence rise time, we observe that the total time required to extend
the template molecules is not the same for all PCR cycles. In order to optimize the reaction
time we manually terminate the extension step immediately after the fluorescence saturates.
We compare this technique of variable cycle time with the standard fixed time PCR of
TGFh1 using Tbr. In Fig. 4, normalized fluorescence is plotted against cycle number for the
variable time PCR experiment as well as standard PCR with 40 s, 1, 2 and 4 min fixed
extension times. The difference between the maximum and minimum fluorescence in a cycle
(at annealing and denaturation temperature, respectively) is defined as D. The minimum
value of D (DMIN) occurs during the starting cycle while the maximum (DMAX) is reached
when the fluorescence envelope saturates. For the standard fixed time PCR experiment, the
number of cycles to reach the maximum is less if the extension time is longer. However the
total reaction time also increases. In the case of variable time PCR both number of cycles
and total reaction time is minimized. All amplified products were loaded in 1% agarose gel
Fig. 4. Optimization of reaction time during PCR of TGFh1 cDNA. Amplification was carried out with extension times
of 40 s (square), 1 min (circle), 2 min (triangle), 4 min (inverted triangle) and variable time (diamond) for 50, 40, 31, 27
and 30 cycles, respectively. During variable time PCR the extension time was kept at least 40 s and forced to proceed to
next step when the fluorescence saturated.
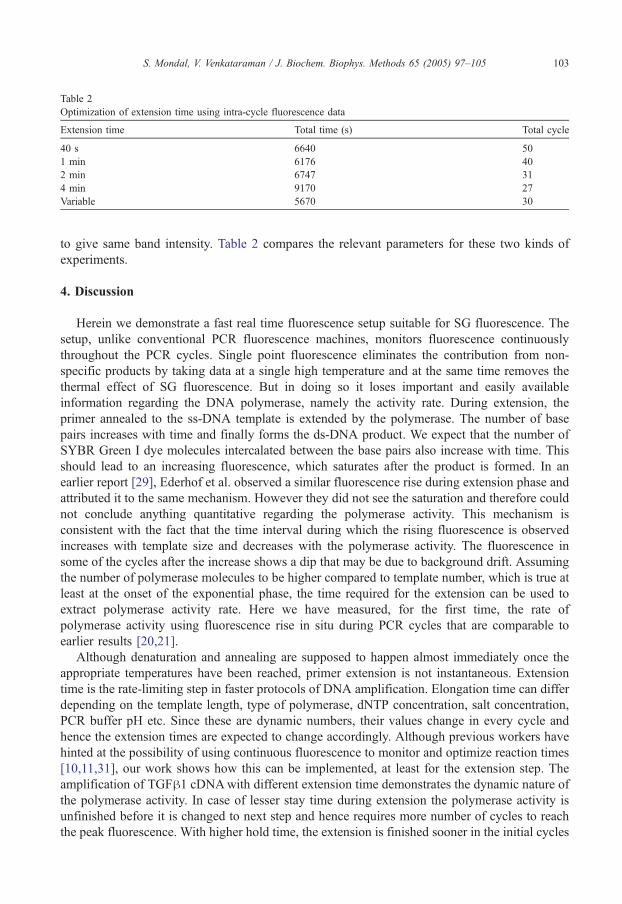
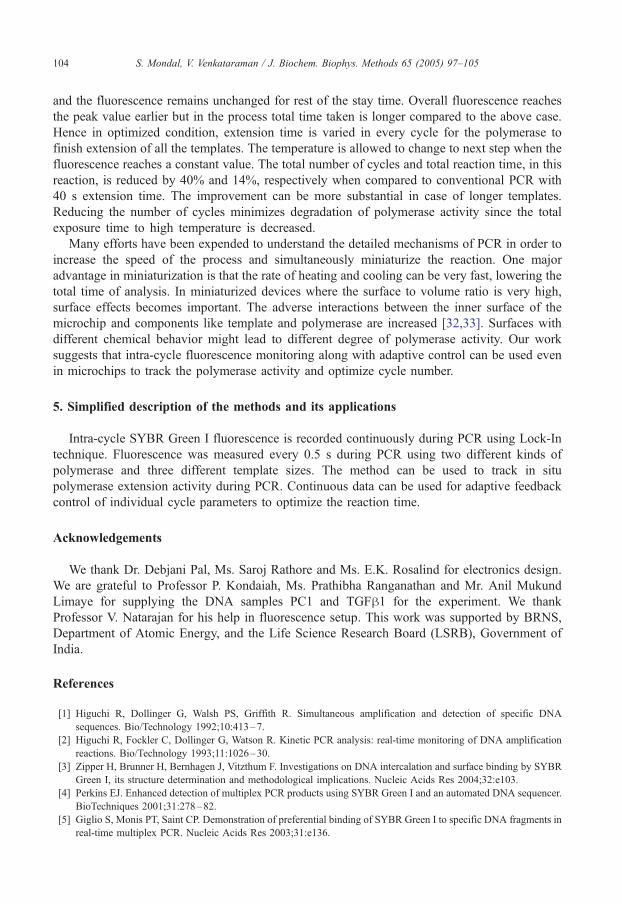
Table 2
Optimization of extension time using intra-cycle fluorescence data
Extension time Total time (s) Total cycle
40 s 6640 50
1 min 6176 40
2 min 6747 31
4 min 9170 27
Variable 5670 30
S. Mondal, V. Venkataraman / J. Biochem. Biophys. Methods 65 (2005) 97–105 103
to give same band intensity. Table 2 compares the relevant parameters for these two kinds of
experiments.
4. Discussion
Herein we demonstrate a fast real time fluorescence setup suitable for SG fluorescence. The
setup, unlike conventional PCR fluorescence machines, monitors fluorescence continuously
throughout the PCR cycles. Single point fluorescence eliminates the contribution from non-
specific products by taking data at a single high temperature and at the same time removes the
thermal effect of SG fluorescence. But in doing so it loses important and easily available
information regarding the DNA polymerase, namely the activity rate. During extension, the
primer annealed to the ss-DNA template is extended by the polymerase. The number of base
pairs increases with time and finally forms the ds-DNA product. We expect that the number of
SYBR Green I dye molecules intercalated between the base pairs also increase with time. This
should lead to an increasing fluorescence, which saturates after the product is formed. In an
earlier report [29], Ederhof et al. observed a similar fluorescence rise during extension phase and
attributed it to the same mechanism. However they did not see the saturation and therefore could
not conclude anything quantitative regarding the polymerase activity. This mechanism is
consistent with the fact that the time interval during which the rising fluorescence is observed
increases with template size and decreases with the polymerase activity. The fluorescence in
some of the cycles after the increase shows a dip that may be due to background drift. Assuming
the number of polymerase molecules to be higher compared to template number, which is true at
least at the onset of the exponential phase, the time required for the extension can be used to
extract polymerase activity rate. Here we have measured, for the first time, the rate of
polymerase activity using fluorescence rise in situ during PCR cycles that are comparable to
earlier results [20,21].
Although denaturation and annealing are supposed to happen almost immediately once the
appropriate temperatures have been reached, primer extension is not instantaneous. Extension
time is the rate-limiting step in faster protocols of DNA amplification. Elongation time can differ
depending on the template length, type of polymerase, dNTP concentration, salt concentration,
PCR buffer pH etc. Since these are dynamic numbers, their values change in every cycle and
hence the extension times are expected to change accordingly. Although previous workers have
hinted at the possibility of using continuous fluorescence to monitor and optimize reaction times
[10,11,31], our work shows how this can be implemented, at least for the extension step. The
amplification of TGFh1 cDNAwith different extension time demonstrates the dynamic nature of
the polymerase activity. In case of lesser stay time during extension the polymerase activity is
unfinished before it is changed to next step and hence requires more number of cycles to reach
the peak fluorescence. With higher hold time, the extension is finished sooner in the initial cycles
S. Mondal, V. Venkataraman / J. Biochem. Biophys. Methods 65 (2005) 97–105104
and the fluorescence remains unchanged for rest of the stay time. Overall fluorescence reaches
the peak value earlier but in the process total time taken is longer compared to the above case.
Hence in optimized condition, extension time is varied in every cycle for the polymerase to
finish extension of all the templates. The temperature is allowed to change to next step when the
fluorescence reaches a constant value. The total number of cycles and total reaction time, in this
reaction, is reduced by 40% and 14%, respectively when compared to conventional PCR with
40 s extension time. The improvement can be more substantial in case of longer templates.
Reducing the number of cycles minimizes degradation of polymerase activity since the total
exposure time to high temperature is decreased.
Many efforts have been expended to understand the detailed mechanisms of PCR in order to
increase the speed of the process and simultaneously miniaturize the reaction. One major
advantage in miniaturization is that the rate of heating and cooling can be very fast, lowering the
total time of analysis. In miniaturized devices where the surface to volume ratio is very high,
surface effects becomes important. The adverse interactions between the inner surface of the
microchip and components like template and polymerase are increased [32,33]. Surfaces with
different chemical behavior might lead to different degree of polymerase activity. Our work
suggests that intra-cycle fluorescence monitoring along with adaptive control can be used even
in microchips to track the polymerase activity and optimize cycle number.
5. Simplified description of the methods and its applications
Intra-cycle SYBR Green I fluorescence is recorded continuously during PCR using Lock-In
technique. Fluorescence was measured every 0.5 s during PCR using two different kinds of
polymerase and three different template sizes. The method can be used to track in situ
polymerase extension activity during PCR. Continuous data can be used for adaptive feedback
control of individual cycle parameters to optimize the reaction time.
Acknowledgements
We thank Dr. Debjani Pal, Ms. Saroj Rathore and Ms. E.K. Rosalind for electronics design.
We are grateful to Professor P. Kondaiah, Ms. Prathibha Ranganathan and Mr. Anil Mukund
Limaye for supplying the DNA samples PC1 and TGFh1 for the experiment. We thank
Professor V. Natarajan for his help in fluorescence setup. This work was supported by BRNS,
Department of Atomic Energy, and the Life Science Research Board (LSRB), Government of
India.
References
[1] Higuchi R, Dollinger G, Walsh PS, Griffith R. Simultaneous amplification and detection of specific DNA
sequences. Bio/Technology 1992;10:413–7.
[2] Higuchi R, Fockler C, Dollinger G, Watson R. Kinetic PCR analysis: real-time monitoring of DNA amplification
reactions. Bio/Technology 1993;11:1026–30.
[3] Zipper H, Brunner H, Bernhagen J, Vitzthum F. Investigations on DNA intercalation and surface binding by SYBR
Green I, its structure determination and methodological implications. Nucleic Acids Res 2004;32:e103.
[4] Perkins EJ. Enhanced detection of multiplex PCR products using SYBR Green I and an automated DNA sequencer.
BioTechniques 2001;31:278–82.
[5] Giglio S, Monis PT, Saint CP. Demonstration of preferential binding of SYBR Green I to specific DNA fragments in
real-time multiplex PCR. Nucleic Acids Res 2003;31:e136.
S. Mondal, V. Venkataraman / J. Biochem. Biophys. Methods 65 (2005) 97–105 105
[6] Ririe KM, Rasmussen RP, Wittwer CT. Product differentiation by analysis of DNA melting curves during the
polymerase chain reaction. Anal Biochem 1997;245:154–60.
[7] Li W, Xi B, Yang W, Hawkins M, Schubart UK. Complex DNA melting profiles of small PCR products revealed
using SYBR Green I. BioTechniques 2003;35:702–6.
[8] Karsai A, Muller S, Platz S, Hauser MT. Evaluation of a home-made SYBR Green I reaction mixture for real-time
PCR quantification of gene expression. BioTechniques 2002;32:790–6.
[9] Arezi B, Xing W, Sorge JA, Hogrefe HH. Amplification efficiency of thermostable DNA polymerases. Anal
Biochem 2003;321:226–35.
[10] Wittwer CT, Herrmann MG, Moss AA, Rasmussen RP. Continuous fluorescence monitoring of rapid cycle DNA
amplification. BioTechniques 1997;22:130–8.
[11] Wittwer CT, Ririe KM, Andrew RV, David DA, Gundry RA, Balis UJ. The LightCyclerk: a microvolume
multisample fluorimeter with rapid temperature control. BioTechniques 1997;22:176–81.
[12] Rasmussen R, Morrison T, Herrmann M, Wittwer CT. Quantitative PCR by continuous fluorescence monitoring of a
double strand DNA specific binding dye. Biochemica 1998;2:8–11.
[13] Morrison TB, Weis JJ, Wittwer CT. Quantification of low-copy transcripts by continuous SYBR Green I monitoring
during amplification. BioTechniques 1998;24:954–62.
[14] Betzl G, Seller M, Eichner C, Kalbe A, Geyer M, Kleider W, et al. Reproducibility of PCR on the LightCycler
system. Biochemica 2000;1:22–6.
[15] Lee DS, Wu MH, Ramesh U, Lin CW, Lee TM, Chen PH. A novel real-time PCR machine with a miniature
spectrometer for fluorescence sensing in a micro liter volume glass capillary. Sens Actuators, B, Chem
2004;100:401–10.
[16] Webster JR, Burns MA, Burke DT, Mastrangelo CH. Monolithic capillary electrophoresis device with integrated
fluorescence detector. Anal Chem 2001;73:1622–6.
[17] Lin YC, Li M, Chung MT, Wu CY, Young KC. Real-time microchip polymerase-chain-reaction system. Sens Mater
2002;14:199–208.
[18] Higgins JA, Nasarabadi S, Karns JS, Shelton DR, Cooper M, Gbakima A, et al. A handheld real time thermal cycler
for bacterial pathogen detection. Biosens Bioelectron 2003;18:1115–23.
[19] Kuchta RD, Mizrahi V, Benkovic PA, Johnson KA, Benkovic SJ. Kinetic mechanism of DNA polymerase I
(Klenow). Biochemistry 1987;26:8410–7.
[20] Innis MA, Myambo KB, Gelfand DH, Brow MAD. DNA sequencing with Thermus aquaticus DNA polymerase
and direct sequencing of polymerase chain reaction-amplified DNA. Proc Natl Acad Sci U S A 1988;85:9436–40.
[21] Carballeira N, Nazabal M, Brito J, Garcia O. Purification of a thermostable DNA polymerase from Thermus
thermophilus HB8, useful in the polymerase chain reaction. BioTechniques 1990;9:276–81.
[22] Huang MM, Arnheim N, Goodman MF. Extension of base mispairs by Taq DNA polymerase: implications for
single nucleotide discrimination in PCR. Nucleic Acids Res 1992;20:4567–73.
[23] Niikura K, Matsuno H, Okahata Y. Direct monitoring of DNA polymerase reactions on a quartz-crystal
microbalance. J Am Chem Soc 1998;120:8537–8.
[24] Matsuno H, Niikura K, Okahata Y. Direct monitoring kinetic studies of DNA polymerase reactions on a DNA-
immobilized quartz-crystal microbalance. Chem Eur J 2001;7:3305–12.
[25] Datta K, LiCata VJ. Thermodynamics of the binding of Thermus aquaticus DNA polymerase to primed-template
DNA. Nucleic Acids Res 2003;31:5590–7.
[26] Datta K, LiCata VJ. Salt dependence of DNA binding by Thermus aquaticus and Escherichia coli DNA
polymerases. J Biol Chem 2003;278:5694–701.
[27] Krantz LJR, Marquez LA, Elisseeva E, Baker RP, Bloom LB, Dunford HB, et al. The proofreading pathway of
bacteriophage T4 DNA polymerase. J Biol Chem 1998;273:22969–76.
[28] Woudenberg TM, Stevens J. Quantitative PCR by real time detection. SPIE 1996;2680:306–15.
[29] Ederhof T, Walter NG, Schober A. On-line polymerase chain reaction (PCR) monitoring. J Biochem Biophys
Methods 1998;37:99–104.
[30] Bell DA, DeMarini DM. Excessive cycling converts PCR products to random-length molecular weight fragments.
Nucleic Acids Res 1991;19:5079.
[31] Wittwer CT, Garling DJ. Rapid cycle DNA amplification: time and temperature optimization. BioTechniques
1991;10:76–83.
[32] Shoffner MA, Cheng J, Hvichia GE, Kricka LJ, Wilding P. Chip PCR. I. Surface passivation of microfabricated
silicon-glass chips for PCR. Nucleic Acids Res 1996;24:375–9.
[33] Erill I, Campoy S, Erill N, Barbe J, Aguilo J. Biochemical analysis and optimization of inhibition and adsorption
phenomena in glass-silicon PCR-chips. Sens Actuators, B, Chem 2003;96:685–92.