Embed Size (px)
Citation preview
1
IN SITU MONITORING OF REINFORCEMENT CORROSION BY MEANS OF ELECTROCHEMICAL METHODS
Oskar Klinghoffer, M.Sc.
FORCE Institute, Park Allé 345, DK-2605 Brøndby, Denmark
ABSTRACT The well-known and usually adapted potential mapping technique, measuring half-cell potential on concrete surface leads to some misinterpretation especially in structures placed in wet and anaerobic environment. In order to avoid these problems additional polarization technique has been introduced. The method, called galvanostatic pulse technique, is now successfully applied on site. Measurements have been performed on different structures and its elements, such as supporting beam, bridge pillars and concrete decks. The results of these measurements are presented in the paper and show that it is also possible to detect the corrosion state when the half-cell potential are difficult to interpret. Keywords: Concrete, steel reinforcement corrosion, site measurements, galvanostatic pulse
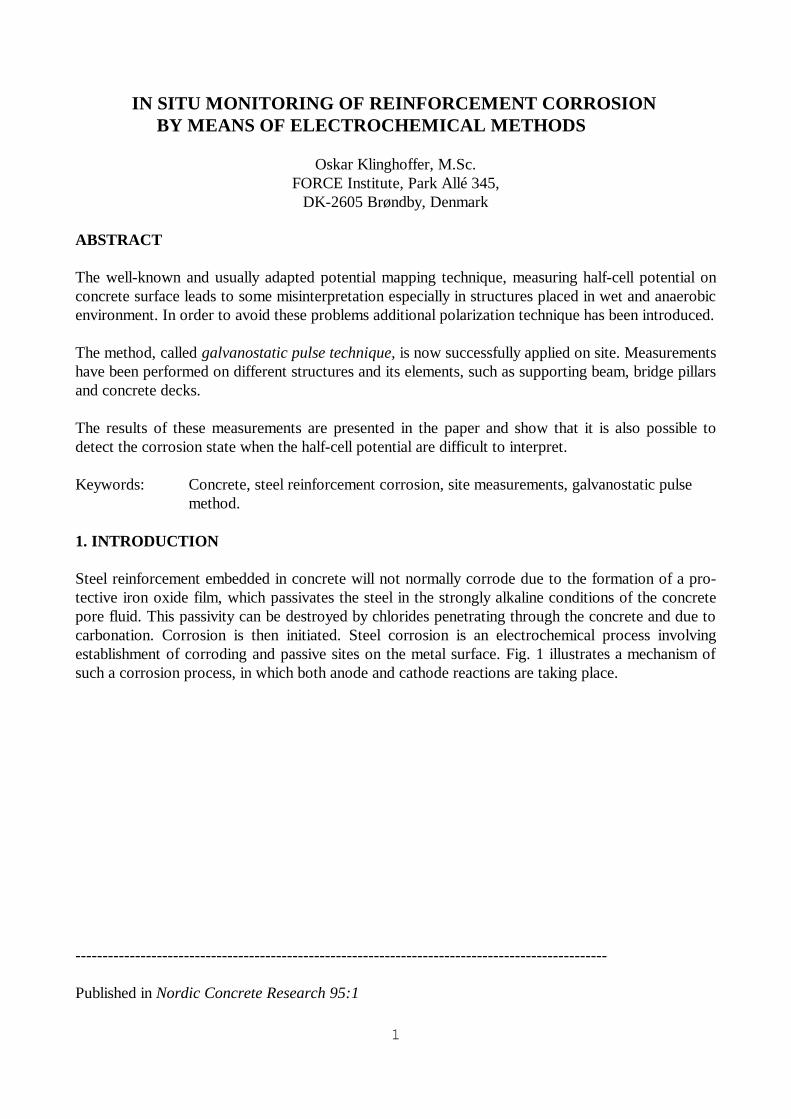
method. 1. INTRODUCTION Steel reinforcement embedded in concrete will not normally corrode due to the formation of a pro-tective iron oxide film, which passivates the steel in the strongly alkaline conditions of the concrete pore fluid. This passivity can be destroyed by chlorides penetrating through the concrete and due to carbonation. Corrosion is then initiated. Steel corrosion is an electrochemical process involving establishment of corroding and passive sites on the metal surface. Fig. 1 illustrates a mechanism of such a corrosion process, in which both anode and cathode reactions are taking place. -------------------------------------------------------------------------------------------------- Published in Nordic Concrete Research 95:1
2
Fig. 1 Mechanism of reinforcement corrosion. The anode reactions are: Fe = Fe++ + 2 e- (metal dissolution, active corrosion) 3Fe + 4 H2O = Fe3O4 + 8 H+ + 8 e- (formation of passive layer) The released electrons travel through the steel to the local cathode on which they are used in the oxygen reduction reaction,
O2 + 2H2O + 4e- = 4OH- These reactions leads to the development of regions of differing electrochemical potentials and resulting in current flow within the concrete. Measuring the potentials and the magnitude of corrosion currents may, in principle, enable the detection of existing corrosion sites and the present rate of corrosion to be assessed. As long as the ambient conditions do not change, predictions of fu-ture corrosion failure can be made. In practice, concrete has cracks, flaws and aggregate particles, which affect diffusion flow characteristics, and it is not in uniform contact with reinforcement. There-fore, measurements of electrical characteristics can only provide a general guide to corrosion condition. On the other hand these measurements are based on the non-destructive methods and, therefore, offer a wide range of possibilities for obtaining information about what is happening below the surface of hardened concrete on site. Assessment of the risk and extent of corrosion of embedded steel forms a current major area of concern, and is particularly important in relation to maintenance an repair programs. In this paper two of these methods will be described and discussed regarding both advantages and problems occurring during measurements and interpretation of results. The well-known half-cell po-tential mapping will be compared with the galvanostatic pulse method.
3
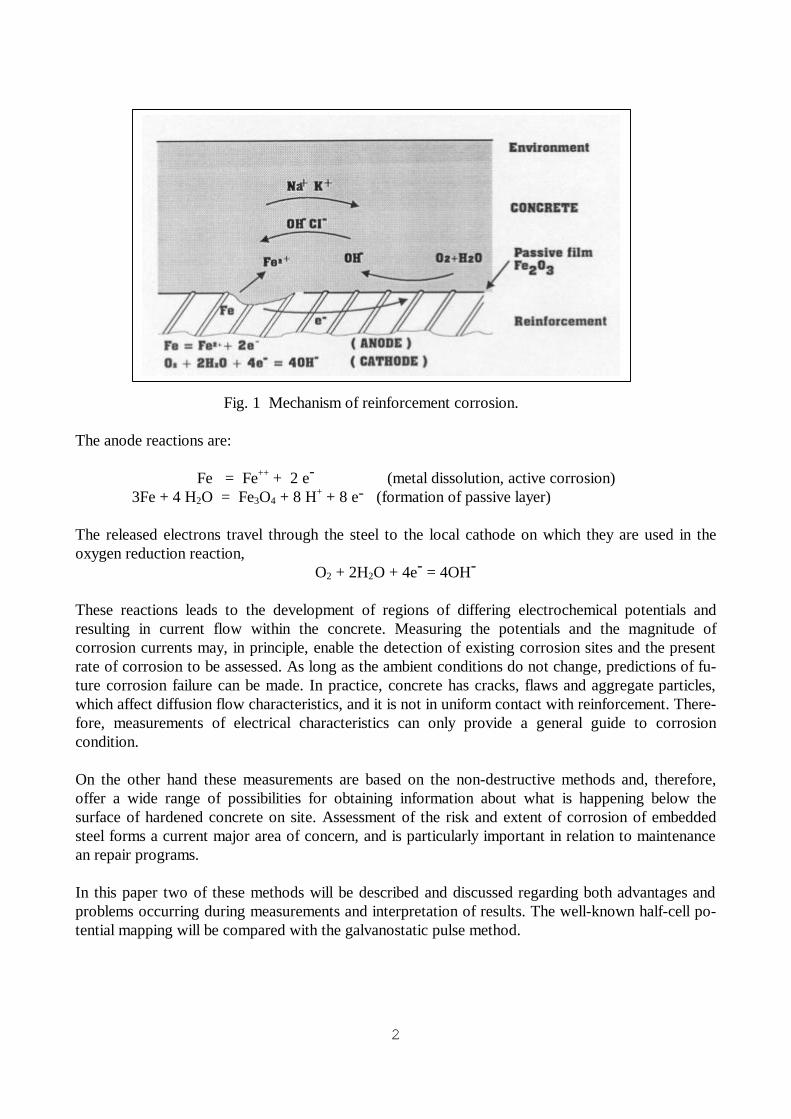
2. HALF-CELL POTENTIAL MAPPING. This method was first developed in the late 1950's (1) and has since been extensively used, particularly in the USA, for the assessment of concrete bridges. It was adopted in 1977 as an ASTM method C876 (2). The method has also found wide use in Europe, among other countries also in Denmark since beginning of 1980 (3). The method measures the electrochemical potential of reinfor-cement against a reference electrode placed on the concrete surface. The basic set up of this method is shown in Fig. 2. Prior to testing, electrical continuity of reinforcement is checked by applying a potential difference across rebar at different sections of the structure. Normally a measured re-sistance of less than 1 ohm is used to indicate continuous electrical connection of reinforcement. Fig. 2 Set-up of half-cell potential measurements. In order to ensure a good contact with the reference electrode the concrete surface requires pre-wetting. A number of reference electrodes may be used, including copper/copper sulphate (CSE), silver/silver chloride or calomel (SCE). Potentials are measured with a high impedance voltmeter (>10 Mega ohm) to ensure low current conditions during testing. The evaluation of the results is normally performed by means of a personal computer. ASTM C876-87 provides a classification for assessing the results of the half-cell potential mapping. There is a special difficulty in interpreting the results, which lie between -200 and -350 mV vs. CSE. Comparing neighboring surface potentials, i.e. potentials gradients, is a more appropriate procedure (4). Measurements are then presented in the form of equipotential contour maps from which areas of suspected corrosion are identified.

4
The measured electrochemical potentials are affected by a number of factors and these should be considered in interpreting the results. One of the most important factors is the quality of the cover concrete, particularly its moisture condition and contamination by carbonation and/or chlorides. Also oxygen access strongly determines the potential values of passive steel in concrete. Low oxygen content results in decrease of the potential. In wet concrete, due to low oxygen admission, conditions may prevail resulting in a shift of the potential to comparably low values. Consequently passive steel may show low potentials similar to those of corroding steel. This leads to the risk that passive areas under low aeration conditions will be classified as corroding areas. A further limitation of this method is that the results only give an indication of whether corrosion is thermodynamically possible and no information relating to corrosion kinetics can be obtained. It resulted in the need to supplement or replace this method with another in which these difficulties could be overcome. The galvanostatic pulse technique is a good choice in order to eliminate these problems.
5
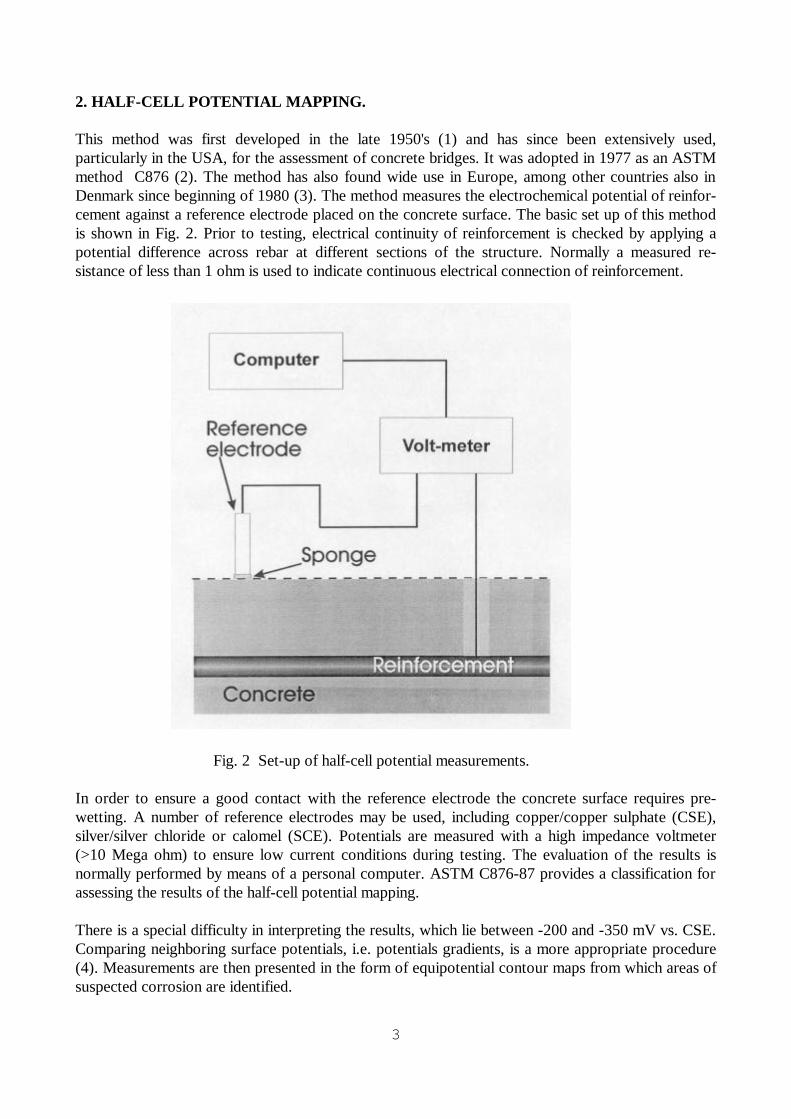
3. GALVANOSTATIC PULSE METHOD Galvanostatic pulse method is a rapid non-destructive polarization technique. The method set-up is shown in Fig.3. A short-time anodic current pulse is impressed galvanostatically from a counter electrode placed on concrete surface together with an reference electrode of the same type as previously described for potential mapping measurements. The applied current is normally in the range of 10 to 100 µA and the typical pulse duration is between 5 to 30 seconds. The small anodic current results in change of reinforcement potential, which is recorded by means of data logger. Reinforcement is polarized in anodic direction compared to its free corrosion potential.
Fig. 3 Set-up of galvanostatic pulse measurements
The extent of this polarization depends on the corrosion state. The reinforcement is easy to polarize in the passive state, which is illustrated by the big difference between the free corrosion potential and the polarized potential. This difference is much lower for a rebar, which is corroding. The galvanostatic pulse method yields much better information on the corrosion behavior. The superiority of this method has been confirmed in the recently published works (5),(6), which emphasize its ap-plicability to wet concrete, where the problems with interpretation of low potentials registered by potential mapping technique occur. Together with the more reliable qualitative information concerning classification of passive and corroding areas this technique gives also possibility for quantitative evaluation, namely calculation of the corrosion current (7). Under assumption that the area of the polarized reinforcement is known this corrosion current can be converted to the corrosion rate.
6
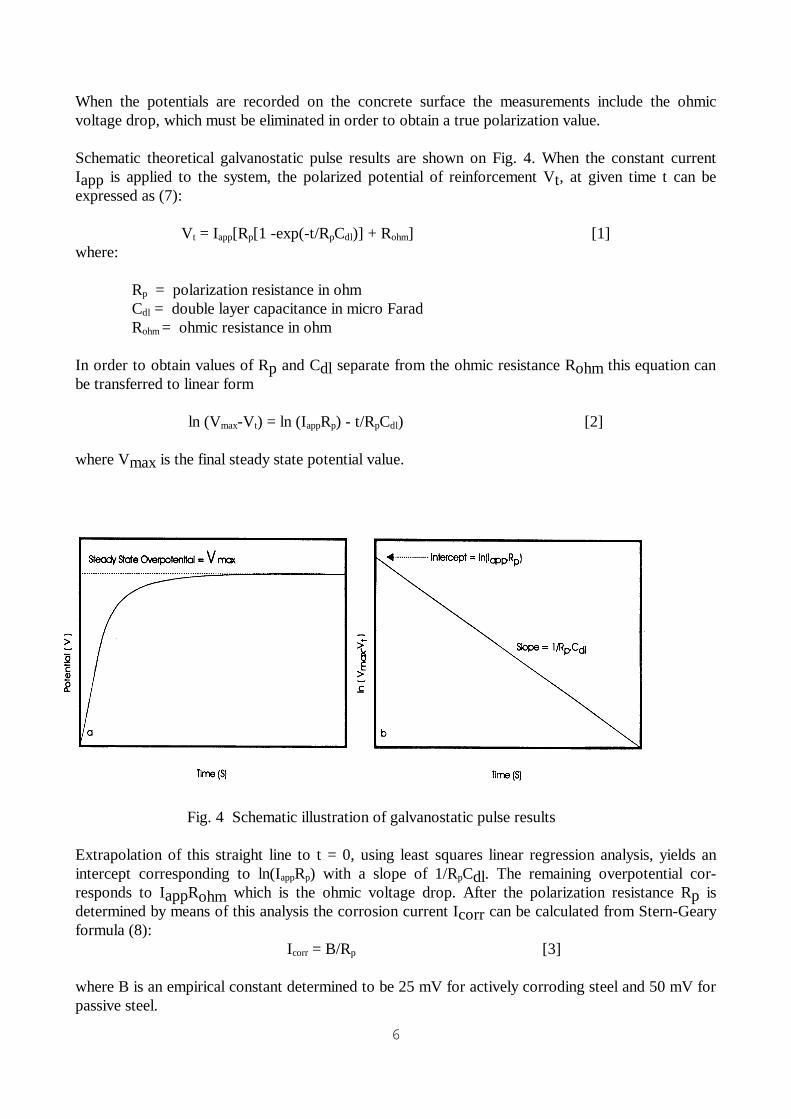
When the potentials are recorded on the concrete surface the measurements include the ohmic voltage drop, which must be eliminated in order to obtain a true polarization value. Schematic theoretical galvanostatic pulse results are shown on Fig. 4. When the constant current Iapp is applied to the system, the polarized potential of reinforcement Vt, at given time t can be expressed as (7):
Vt = Iapp[Rp[1 -exp(-t/RpCdl)] + Rohm] [1] where: Rp = polarization resistance in ohm Cdl = double layer capacitance in micro Farad Rohm = ohmic resistance in ohm In order to obtain values of Rp and Cdl separate from the ohmic resistance Rohm this equation can be transferred to linear form
ln (Vmax-Vt) = ln (IappRp) - t/RpCdl) [2] where Vmax is the final steady state potential value. Fig. 4 Schematic illustration of galvanostatic pulse results Extrapolation of this straight line to t = 0, using least squares linear regression analysis, yields an intercept corresponding to ln(IappRp) with a slope of 1/RpCdl. The remaining overpotential cor-responds to IappRohm which is the ohmic voltage drop. After the polarization resistance Rp is determined by means of this analysis the corrosion current Icorr can be calculated from Stern-Geary formula (8):
Icorr = B/Rp [3] where B is an empirical constant determined to be 25 mV for actively corroding steel and 50 mV for passive steel.
7
4. MEASUREMENTS ON SITE These measurements were performed on the structures placed in wet and anaerobic environments. According to the reason mentioned in section 2 in such structures the half-cell potential measurements could lead to the misinterpretation of the corrosion state. By means of a set-up shown on Fig. 3 both half-cell potential and galvanostatic pulse measurements were conducted. A constant anodic current pulse in the range of 80 µA to 100 µA was applied to the reinforcement from a stainless steel counter electrode. The current source was connected to the data logger, which also controlled its operation. Potential measurements were performed by means of silver/silver chloride reference electrode and registered in the data logger together with the potential changes due to the applied pulse. In the beginning the potential changes were registered with 27 msec interval (approx. 50 records), followed up by 125 msec between the remaining measuring points. All data were collected in the data logger and then evaluated by means of special developed software in personal computer. In the following measurements performed on three different structures are reported.
8
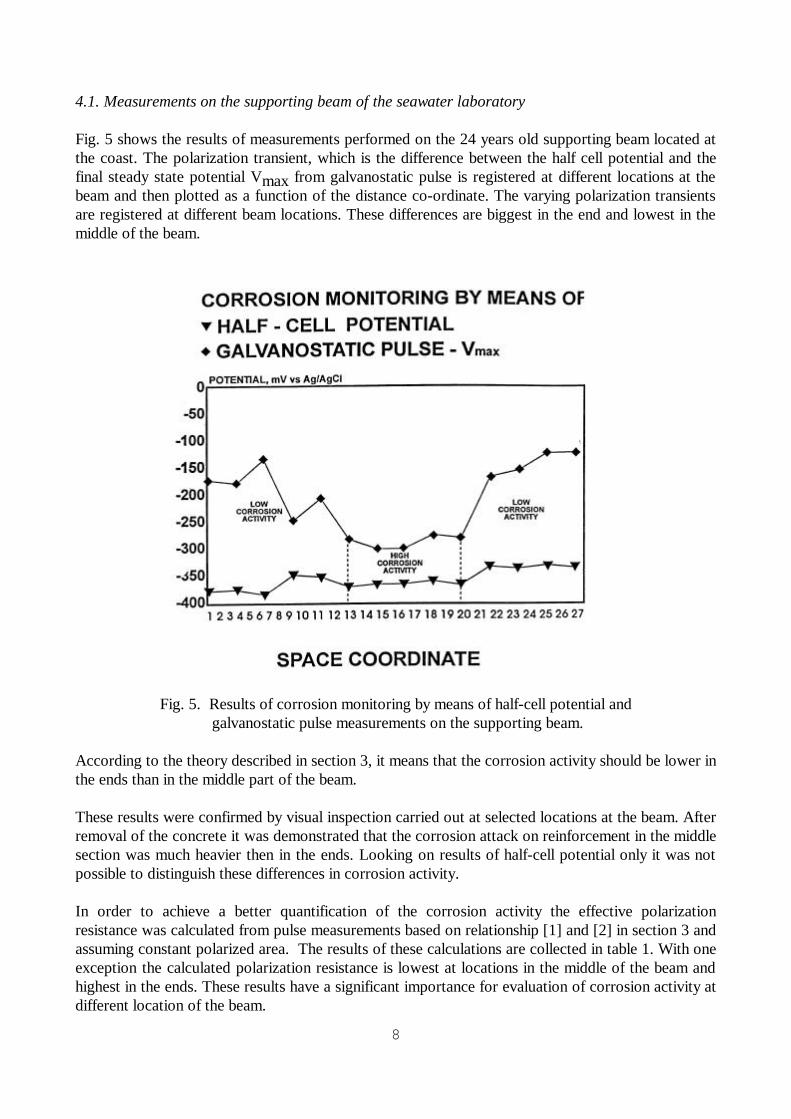
4.1. Measurements on the supporting beam of the seawater laboratory Fig. 5 shows the results of measurements performed on the 24 years old supporting beam located at the coast. The polarization transient, which is the difference between the half cell potential and the final steady state potential Vmax from galvanostatic pulse is registered at different locations at the beam and then plotted as a function of the distance co-ordinate. The varying polarization transients are registered at different beam locations. These differences are biggest in the end and lowest in the middle of the beam.
Fig. 5. Results of corrosion monitoring by means of half-cell potential and galvanostatic pulse measurements on the supporting beam.
According to the theory described in section 3, it means that the corrosion activity should be lower in the ends than in the middle part of the beam. These results were confirmed by visual inspection carried out at selected locations at the beam. After removal of the concrete it was demonstrated that the corrosion attack on reinforcement in the middle section was much heavier then in the ends. Looking on results of half-cell potential only it was not possible to distinguish these differences in corrosion activity. In order to achieve a better quantification of the corrosion activity the effective polarization resistance was calculated from pulse measurements based on relationship [1] and [2] in section 3 and assuming constant polarized area. The results of these calculations are collected in table 1. With one exception the calculated polarization resistance is lowest at locations in the middle of the beam and highest in the ends. These results have a significant importance for evaluation of corrosion activity at different location of the beam.
9
It is not possible to calculate the corrosion rate from polarization resistance values, because the p-olarized reinforcement area is not being exactly defined. Variation in concrete resistivity and varying rebar density at different measurement locations may influence the results (9). In order to obtain the true polarization resistance, which can be converted to the corrosion rate, it is necessary to assure a uniform distribution of the electrical current on the defined area of reinforcement.
Distance (cm)
Half cell potential (mV)
Galvanostatic pulse
Vmax (mV)
Vmax-(Iapp?Rohm) (mV)
Rp eff (ohm)
0 40 80 120 160 200 240 280 320 360 400 440 480 520
-380 -377 -385 -350 -352 -371 -367 -366 -359 -366 -332 -337 -330 -334
-172 -178 -134 -255 -207 -281 -299 -300 -272 -279 -166 -153 -123 -120
14 5 20 2 5 9 3 4 4 5 4 15 17 13
303 65 1946 1851 1946 68 32 105 95 72 165 173 342 238
All potential values are in mV vs. Ag/AgCl.
Table 1. Calculation of effective polarization resistance from galvanostatic pulse measurements performed on supporting beam
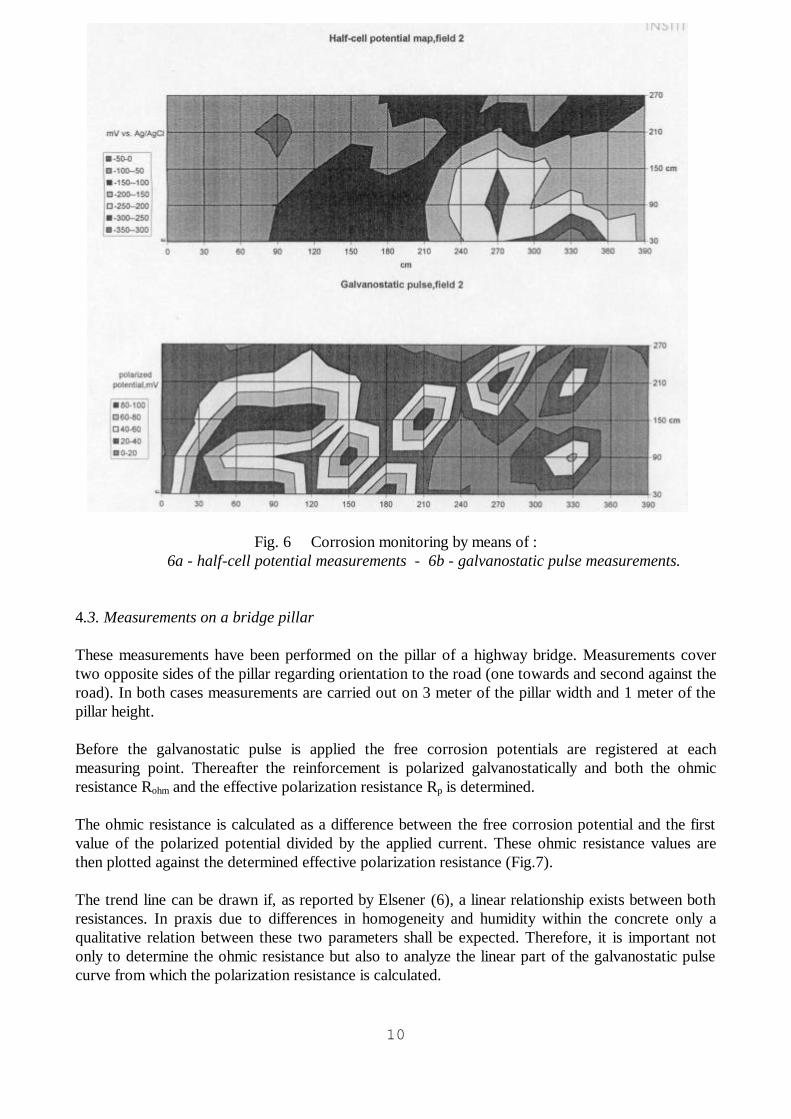
4.2. Measurements on concrete deck at power station Another possibility for comparison of results from half-cell potential measurements and galvanostatic pulse is shown on Fig. 6. These measurements are performed on concrete deck at the local power station. This concrete deck is placed 20 cm over sea level. The upper part of the fig. (6a) shows potential gradients obtained from half-cell potential mapping. It is noticed that only few potential gradients are registered, furthermore in the region, where it is difficult to interpret the results. This picture changes when we look at the lower part of the fig. (6b), which represents the results from galvanostatic pulse measurements. These results are plotted as a polarized potentials (the steady state over potential Vmax with the potential drop subtracted, IappRohm), at different neighboring locations. Now it is possible to find much more detailed picture of the corrosion state than by means of half-cell potential mapping. Especially the area between 0 and 180 cm (x co-ordinate) is divided in five different regions compared to only two gradients obtained by the potential mapping technique. Galvanostatic pulse technique provides us, therefore, with more reliable results than it is possible by means of half-cell potential mapping in order to distinguish different corrosion activity.
10
Fig. 6 Corrosion monitoring by means of : 6a - half-cell potential measurements - 6b - galvanostatic pulse measurements.
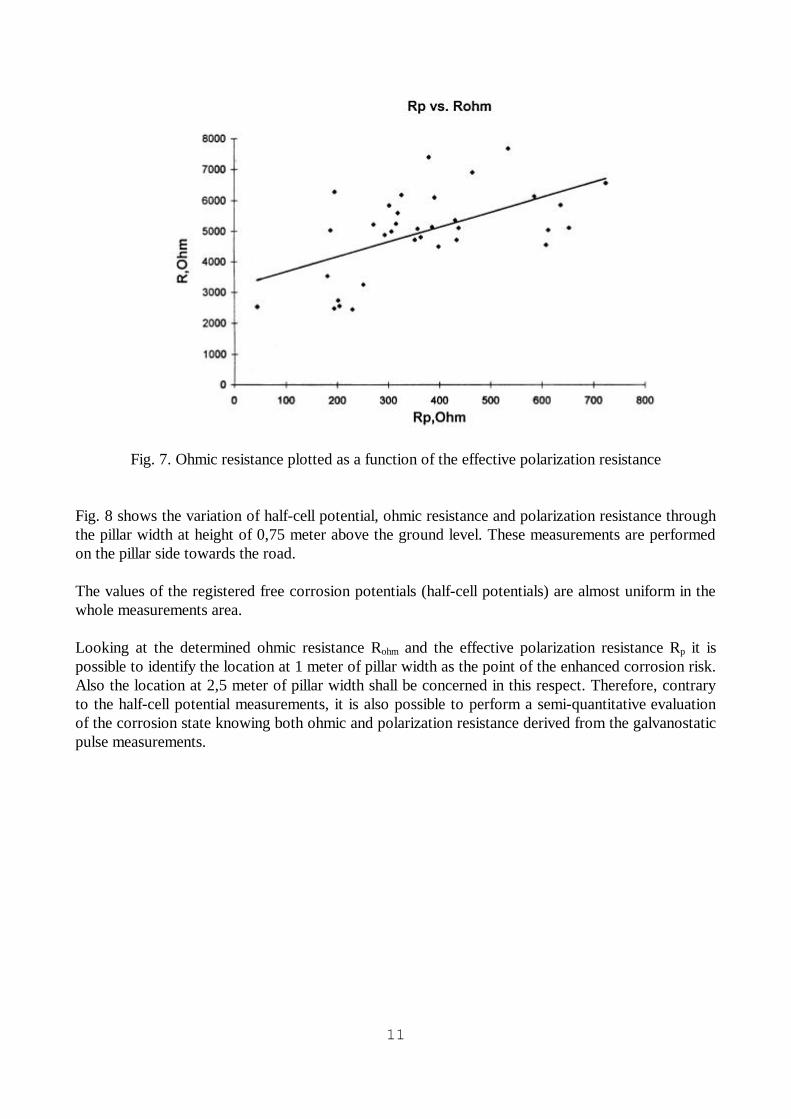
4.3. Measurements on a bridge pillar These measurements have been performed on the pillar of a highway bridge. Measurements cover two opposite sides of the pillar regarding orientation to the road (one towards and second against the road). In both cases measurements are carried out on 3 meter of the pillar width and 1 meter of the pillar height. Before the galvanostatic pulse is applied the free corrosion potentials are registered at each measuring point. Thereafter the reinforcement is polarized galvanostatically and both the ohmic resistance Rohm and the effective polarization resistance Rp is determined. The ohmic resistance is calculated as a difference between the free corrosion potential and the first value of the polarized potential divided by the applied current. These ohmic resistance values are then plotted against the determined effective polarization resistance (Fig.7). The trend line can be drawn if, as reported by Elsener (6), a linear relationship exists between both resistances. In praxis due to differences in homogeneity and humidity within the concrete only a qualitative relation between these two parameters shall be expected. Therefore, it is important not only to determine the ohmic resistance but also to analyze the linear part of the galvanostatic pulse curve from which the polarization resistance is calculated.
11
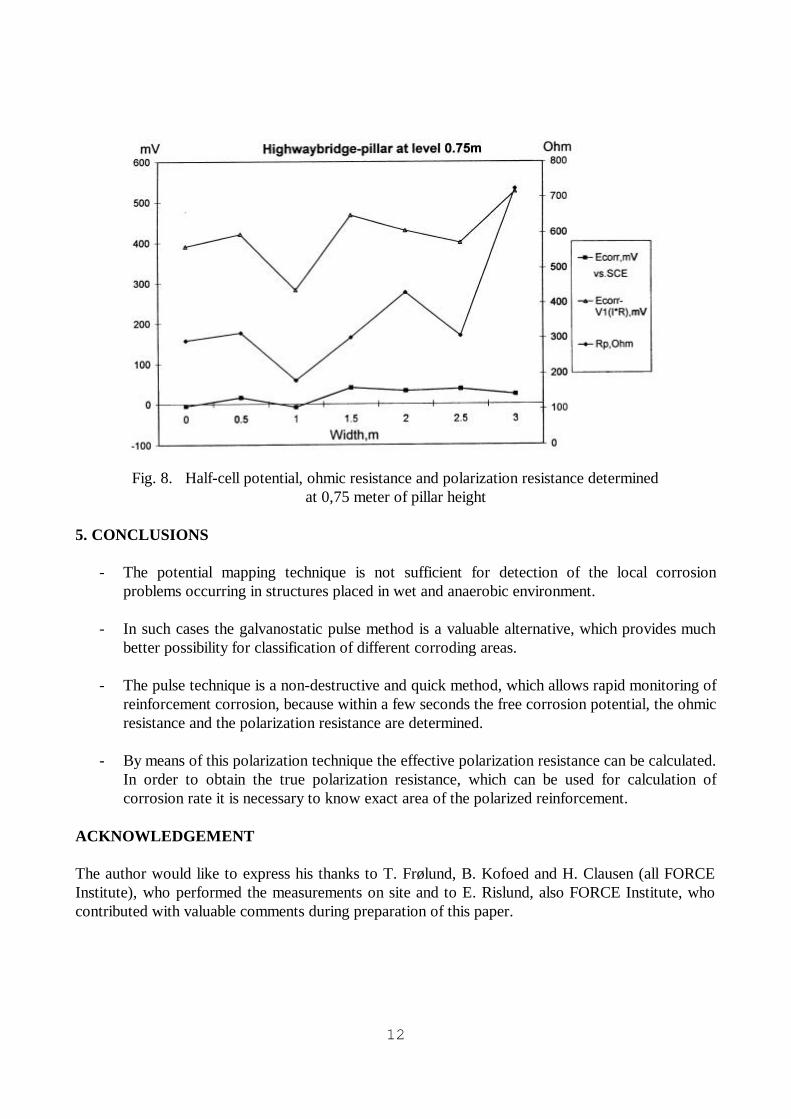
Fig. 7. Ohmic resistance plotted as a function of the effective polarization resistance Fig. 8 shows the variation of half-cell potential, ohmic resistance and polarization resistance through the pillar width at height of 0,75 meter above the ground level. These measurements are performed on the pillar side towards the road. The values of the registered free corrosion potentials (half-cell potentials) are almost uniform in the whole measurements area. Looking at the determined ohmic resistance Rohm and the effective polarization resistance Rp it is possible to identify the location at 1 meter of pillar width as the point of the enhanced corrosion risk. Also the location at 2,5 meter of pillar width shall be concerned in this respect. Therefore, contrary to the half-cell potential measurements, it is also possible to perform a semi-quantitative evaluation of the corrosion state knowing both ohmic and polarization resistance derived from the galvanostatic pulse measurements.
12
Fig. 8. Half-cell potential, ohmic resistance and polarization resistance determined
at 0,75 meter of pillar height 5. CONCLUSIONS
- The potential mapping technique is not sufficient for detection of the local corrosion problems occurring in structures placed in wet and anaerobic environment.
- In such cases the galvanostatic pulse method is a valuable alternative, which provides much
better possibility for classification of different corroding areas.
- The pulse technique is a non-destructive and quick method, which allows rapid monitoring of reinforcement corrosion, because within a few seconds the free corrosion potential, the ohmic resistance and the polarization resistance are determined.
- By means of this polarization technique the effective polarization resistance can be calculated.
In order to obtain the true polarization resistance, which can be used for calculation of corrosion rate it is necessary to know exact area of the polarized reinforcement.
ACKNOWLEDGEMENT The author would like to express his thanks to T. Frølund, B. Kofoed and H. Clausen (all FORCE Institute), who performed the measurements on site and to E. Rislund, also FORCE Institute, who contributed with valuable comments during preparation of this paper.
13
REFERENCES
(1) Stratfull,R.F.: "The Corrosion of Steel in a Reinforced Concrete Bridge". Corrosion 1957, Vol. 13, pp 173-179.
(2) American Society of Testing and Materials. Standard Test Method for Half-Cell Potentials of
uncoated Reinforcing Steel in Concrete. ASTM C876, 1987. (3) Arup,H.: "Potential Mapping of Reinforced Concrete Structures". The Danish Corrosion
Centre Report, January 1984. (4) Hansson,C.M.:"Comments on Electrochemical Measurements of Corrosion of Steel in
Concrete". Cement and Concrete Research, 1984, Vol.14, pp 574-584. (5) Mietz,J., Isecke,B.: "Electrochemical Potential Mapping on Reinforced Concrete Structures
using Anodic Pulse Technique". Proceedings of Conference "Non-Destructive Testing in Civil Engineering". Liverpool 1993, pp 567-577.
(6) Elsener,B., Wojtas,H., Bohni,H.: "Gavanostatic Pulse Masurements - Rapid on Site
Corrosion Monitoring". Proceeding of International Conference held at the University of Sheffield, 24-28 July 1994.
(7) Newton,C.J., Sykes,J.M.: "A Galvanic Pulse Technique for Investigation of Steel Corrosion
in Concrete"; Corrosion Science, 1988, Vol.28, pp 1051-1073. (8) Stern,M., Geary,A.L.: "Electrochemical Polarization, I. A Theoretical Analysis of Shape of
Polarization Curves". Journal of the Electrochemical Society, 1957, Vol. 104, pp 56-63. (9) Feliu,S., Gonzales,J.A., Andrade,C., Feliu,V.: "On Site Determination of the Polarization
Resistance in a Reinforced concrete Beam", Corrosion Engineering, 1988, Vol. 44, pp 761-765.


![Thoughts - XXV [Compilation, Kurdistan, Temple Mount, Klinghoffer, Guns, Amnesty, Ebola, Midterms, Judge-McCaffrey]](https://img.pdfslide.net/doc/110x75/577cc4161a28aba7119813f8/thoughts-xxv-compilation-kurdistan-temple-mount-klinghoffer-guns-amnesty.jpg)