Embed Size (px)
Citation preview
In Situ Probing Calcium Carbonate Formation by Combining FastControlled Precipitation Method and Small-Angle X‑ray ScatteringYanjia Chao,†,‡,§ Olivier Horner,†,∇ Philippe Vallee,∥ Florian Meneau,⊥ Olga Alos-Ramos,† Franck Hui,‡,§
Mireille Turmine,‡,§ Hubert Perrot,*,‡,§ and Jean Ledion@
†EDF R&D, Laboratoire National d’Hydraulique et Environnement, 6 Quai Watier, 78401 Chatou, Cedex, France‡CNRS, Laboratoire Interfaces et Systemes Electrochimiques, 4, place Jussieu, 75252 Paris, Cedex 05, France§Universite P. et M. Curie, LISE, 4, place Jussieu, 75252 Paris Cedex 05, France∥Biophys-Solutions, 24, rue Alphand, 75013 Paris, France⊥Synchrotron Soleil, Saint-Aubin, BP 48, 91192 Gif-sur-Yvette Cedex, France@ARTS, 151, boulevard de l’Hopital, 75013 Paris, France
*S Supporting Information
ABSTRACT: The initial stage of calcium carbonate nucleation and growth,found usually in “natural” precipitation conditions, is still not well understood.The calcium carbonate formation for moderate supersaturation level could beachieved by an original method called the fast controlled precipitation (FCP)method. FCP was coupled with SAXS (small-angle X-ray scattering)measurements to get insight into the nucleation and growth mechanisms ofcalcium carbonate particles in Ca(HCO3)2 aqueous solutions. Two sizedistributions of particles were observed. The particle size evolutions of thesetwo distributions were obtained by analyzing the SAXS data. A nice agreementwas obtained between the total volume fractions of CaCO3 obtained by SAXSanalysis and by pH-resistivity curve modeling (from FCP tests).
1. INTRODUCTION
The formation of calcium carbonate (CaCO3) in water has animportant implication in biology and geoscience research,ocean chemistry studies, and CO2 emission issues1,2 It is also amajor concern in some industrial processes (i.e., energyproduction),3−5 where the scaling phenomenon can causeproblems such as reduction of heat transfer efficiency in coolingsystems and obstruction of pipes. A lot of studies have beencarried out to understand the different polymorphs ofCaCO3,
6,7 their nucleation and crystallization processes,8,9 aswell as the control of CaCO3 particles formation (size andphase).10,11 However, the initial stage of CaCO3 nucleation isnot well understood, due to the difficulties of in situobservation at the nanometer scale.A variety of experimental methods have been applied to
study the formation and growth of CaCO3 particles. The widelyused SEM technique allows the observation of particles at themicrometer scale. However, SEM investigations potentiallysuffer from drying artifacts, which may leave some ambi-guities.12,13 Gebauer et al.14 have provided evidence for theexistence of prenucleation clusters, even in undersaturatedsolutions, by using analytical ultracentrifugation (AUC). High-resolution Cryo-TEM was also used to detect CaCO3
nanoparticles of less than 10 nm and CaCO3 clusters withdimensions from 0.6 to 1.1 nm.12,13,15,16 With these techniques,
a nucleation process was demonstrated, involving prenucleationCaCO3 clusters as early precursors. These precursors aggregateto form amorphous calcium carbonate (ACC), which willfurther evolve to crystallize. However, due to some technicallimitations, these works were not always able to make in situquantitative analysis (i.e., size distribution and number density)for the nucleation process.The synchrotron small-angle X-ray scattering (SAXS) has
been proven to be a useful tool to study in situ nucleation andgrowth stages of CaCO3.
17 CaCO3 particle size distribution andnumber density could be obtained from the scattering curves,Bolze et al. have carried out a series of works using the SAXSmeasurements for the CaCO3 study.17−19 They providedcaptivating scattering curves with clear-cut evidence forspherically shaped particles at the point of nucleation.20 Particlesize, number density, and mass density were also successfullyextracted. Nevertheless, in these studies and many others,8,21
the CaCO3 formation was triggered by direct mixing of a Ca2+
solution with a CO32− solution of high concentrations for high
pH values. In this case, the reaction starts at the interface of twoliquids in conditions of supersaturation which are not
Received: June 17, 2013Revised: February 21, 2014Published: February 25, 2014
Article
pubs.acs.org/Langmuir
© 2014 American Chemical Society 3303 dx.doi.org/10.1021/la500202g | Langmuir 2014, 30, 3303−3309
homogeneous. In addition, the timescale of CaCO3 nucleationis similar to that of the mixing process and is not very well-known.It is therefore difficult to achieve, through this direct mixing
method, homogeneous nucleation conditions.22−24 Moreover,the test solution rapidly reaches a very high supersaturationlevel, which is not the case in natural conditions. A few studieshave been carried out to achieve homogeneous CaCO3nucleation at moderate supersaturation level. Faatz et al.described a method in which the homogeneous release of CO2was obtained by the hydrolysis of dialkyl carbonate to give aslow precipitation of CaCO3.
22 Wolf et al. used an approachwhere the nucleation of CaCO3 was triggered by gradualevaporation and CO2 degassing.23 Nevertheless, the SEM,TEM, and WAXS measurements used in these studies were notpowerful enough to characterize the nucleation stage.In this work, a new experimental setup which combines the
SAXS measurement and the fast controlled precipitation orFCP method25,26 is presented. In these conditions, it is possibleto study the in situ formation of CaCO3 under conditions ofmoderate supersaturation levels. The principle of the FCPmethod is indeed based on the degassing of CO2 by a moderatestirring.26 The process of nucleation−growth of CaCO3 istherefore similar to that of a real scaling phenomenon. The goalof this work is to characterize the calcium carbonate particles,with respect to their geometry and their distributions, whichappear during a FCP test.
2. EXPERIMENTAL SECTION2.1. Materials. Ca(HCO3)2 test solutions were prepared by
dissolving solid calcium carbonate (VWR AnalaR NORMAPUR,99.7% purity) in pure water (Milli -Q water, resistivity of 18.2 MΩ cm,TOC < 5 μgL−1) by CO2 gas bubbling. After the dissolution of thesolid, the pH of the solution was in the range of 5.2−5.5. In theseconditions, no spontaneous precipitation of CaCO3 happened becausethe supersaturation of the solution was very low. The solution wasthen filtered by using Millipore filters of 0.45 μm to eliminate dusts orundissolved solids.2.2. FCP Experiment. In a typical FCP experiment,26,27 400 mL of
Ca(HCO3)2 solution was stirred at 850 r min−1 to accelerate the CO2
degassing. This gradually increased the pH value of the solution andthus gave rise to the CaCO3 precipitation. By this method,precipitation for a moderate supersaturation level was ensured. Duringthe FCP experiment, the pH and the resistivity of the solution weremeasured and registered every five seconds by lab-made software, witha pH electrode (radiometer pHG301) associated to its referenceelectrode (Radiometer REF421) and a conductivity electrode(radiometer CDC741T). The temperature of the experiment wascontrolled with a water bath at 30 °C and measured with a lab-madesensor. The reaction cell was made of a Teflon beaker with a coveringlid. An open hole located at the center of the lid ensured that the CO2
would vent. The covering lid also helped to hold the electrodes.2.3. SAXS Experiment. Synchrotron small-angle X-ray scattering
experiments were conducted at the SWING beamline (SynchrotronSOLEIL, Saint-Aubin, France). The wavelength λ of radiation was setto λ = 1.033Å. The sample-to-detector distance was set to 1.385 m.The acquisition time for one frame was in the range of 0.8−3 s.2.4. FCP-SAXS Coupling. The FCP experiment was coupled with
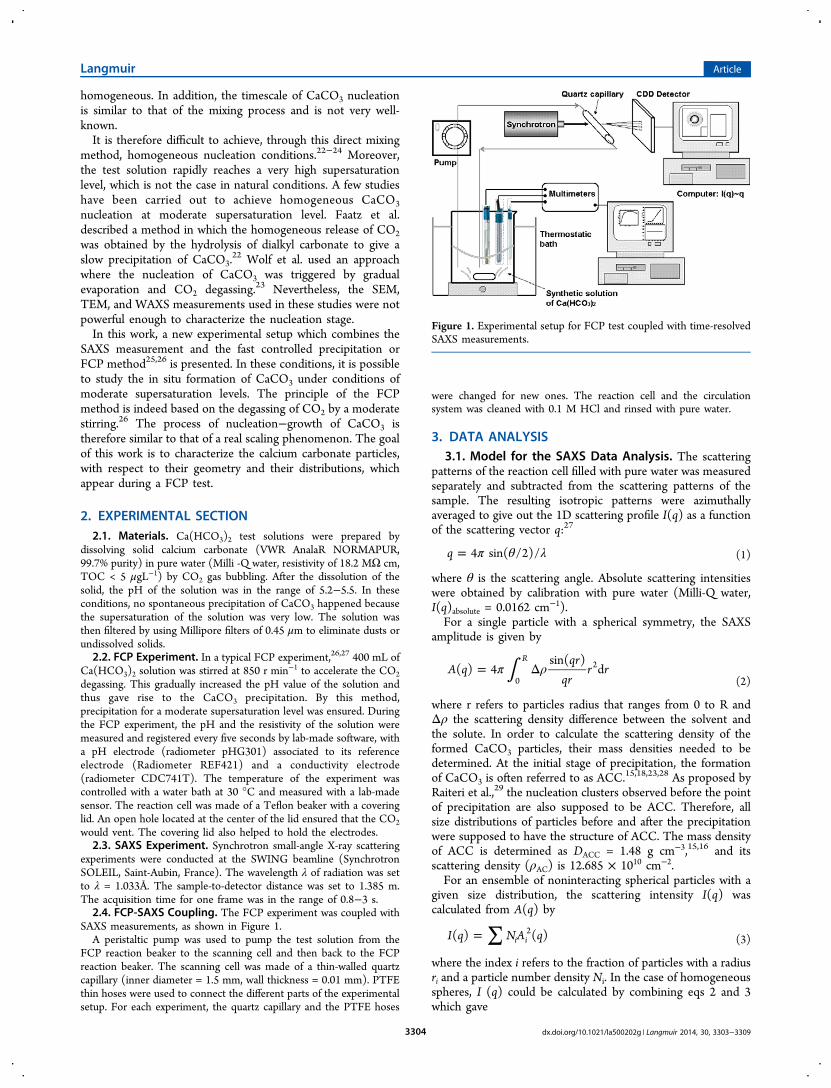
SAXS measurements, as shown in Figure 1.A peristaltic pump was used to pump the test solution from the
FCP reaction beaker to the scanning cell and then back to the FCPreaction beaker. The scanning cell was made of a thin-walled quartzcapillary (inner diameter = 1.5 mm, wall thickness = 0.01 mm). PTFEthin hoses were used to connect the different parts of the experimentalsetup. For each experiment, the quartz capillary and the PTFE hoses
were changed for new ones. The reaction cell and the circulationsystem was cleaned with 0.1 M HCl and rinsed with pure water.
3. DATA ANALYSIS3.1. Model for the SAXS Data Analysis. The scattering
patterns of the reaction cell filled with pure water was measuredseparately and subtracted from the scattering patterns of thesample. The resulting isotropic patterns were azimuthallyaveraged to give out the 1D scattering profile I(q) as a functionof the scattering vector q:27
π θ λ=q 4 sin( /2)/ (1)
where θ is the scattering angle. Absolute scattering intensitieswere obtained by calibration with pure water (Milli-Q water,I(q)absolute = 0.0162 cm−1).For a single particle with a spherical symmetry, the SAXS
amplitude is given by
∫π ρ= ΔA qqr
qrr r( ) 4
sin( )d
R
0
2
(2)
where r refers to particles radius that ranges from 0 to R andΔρ the scattering density difference between the solvent andthe solute. In order to calculate the scattering density of theformed CaCO3 particles, their mass densities needed to bedetermined. At the initial stage of precipitation, the formationof CaCO3 is often referred to as ACC.15,18,23,28 As proposed byRaiteri et al.,29 the nucleation clusters observed before the pointof precipitation are also supposed to be ACC. Therefore, allsize distributions of particles before and after the precipitationwere supposed to have the structure of ACC. The mass densityof ACC is determined as DACC = 1.48 g cm−3,15,16 and itsscattering density (ρAC) is 12.685 × 1010 cm−2.For an ensemble of noninteracting spherical particles with a
given size distribution, the scattering intensity I(q) wascalculated from A(q) by
∑=I q NA q( ) ( )i i2
(3)
where the index i refers to the fraction of particles with a radiusri and a particle number density Ni. In the case of homogeneousspheres, I (q) could be calculated by combining eqs 2 and 3which gave
Figure 1. Experimental setup for FCP test coupled with time-resolvedSAXS measurements.
Langmuir Article
dx.doi.org/10.1021/la500202g | Langmuir 2014, 30, 3303−33093304
∑ ρ= Δ * *−⎡
⎣⎢⎤⎦⎥I q N V
qr qr qrqr
( ) 3sin( ) cos( )
( )i ii i i
i
2 23
2
(4)
where Vi represents the volume per particle. This relation willbe used in the following fitting procedure.3.2. SAXS Data Fitting. The fitting of I(q) from SAXS was
carried out using SANS_Analysis provided by the NationalInstitute of Standards and Technology.30 In the fittingprocedure, a spherical form factor with a LogNormal particlesize distribution model was used. The LogNormal distributionis a continuous distribution in which the logarithm of a variablehas a normal distribution, as follows:
μ σσ π
= μ σ− −f rr
e( , , )1
2Rr(ln ) /22 2
(5)
where f R is the particle distribution, μ is the logarithm of themedian radius, and σ is the standard deviation of the logarithmof r. Equation 5 could be combined with eq 4 to obtain the I(q)values as the function of q in the SAXS curve fitting process.Thus, for a given size distribution, four key parameters were
involved in the fitting process: the volume fraction Φ, themedian radius r, the standard deviation σ and the backgroundb.29 To launch the fitting process, the initial values for Φ, r, andσ needed to be determined for each considered distribution ofparticles.For each I(q) vs q curve, the calculation of the number
density related to each particles distribution could be achievedafter the fitting process thanks to the function ‘NumberDensi-ty_LogN’ in SANS_Analysis.30
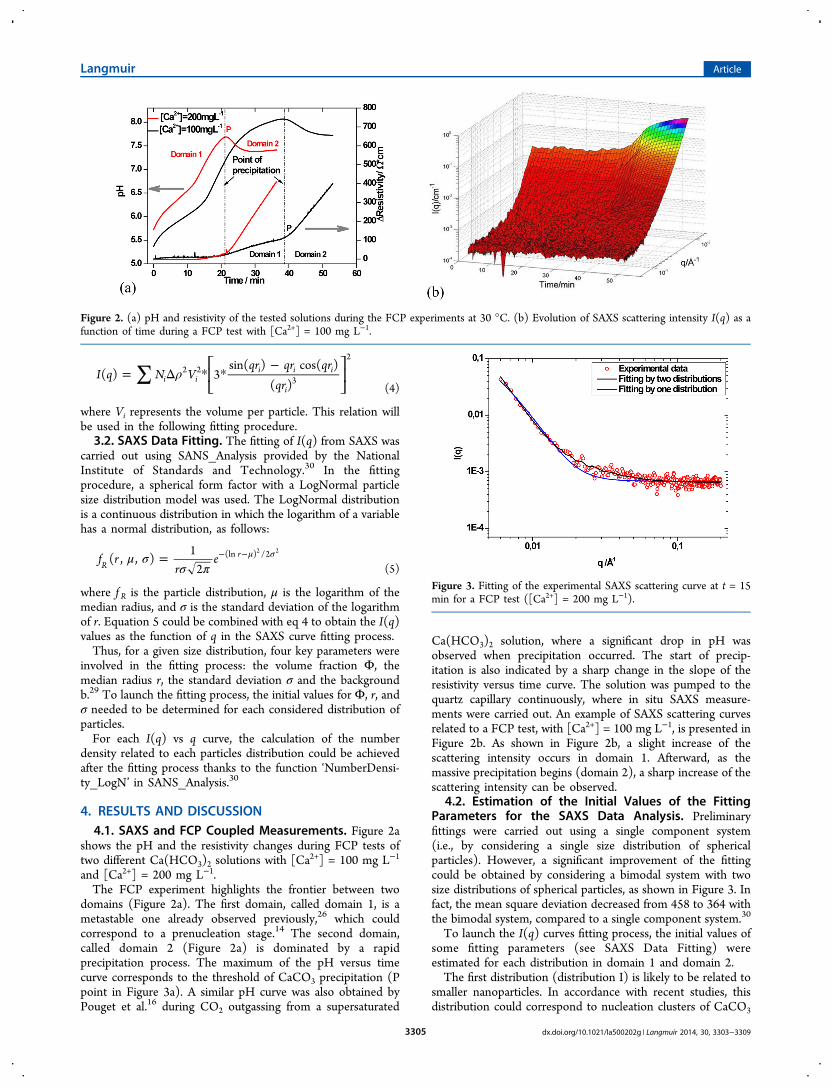
4. RESULTS AND DISCUSSION4.1. SAXS and FCP Coupled Measurements. Figure 2a
shows the pH and the resistivity changes during FCP tests oftwo different Ca(HCO3)2 solutions with [Ca2+] = 100 mg L−1
and [Ca2+] = 200 mg L−1.The FCP experiment highlights the frontier between two
domains (Figure 2a). The first domain, called domain 1, is ametastable one already observed previously,26 which couldcorrespond to a prenucleation stage.14 The second domain,called domain 2 (Figure 2a) is dominated by a rapidprecipitation process. The maximum of the pH versus timecurve corresponds to the threshold of CaCO3 precipitation (Ppoint in Figure 3a). A similar pH curve was also obtained byPouget et al.16 during CO2 outgassing from a supersaturated
Ca(HCO3)2 solution, where a significant drop in pH wasobserved when precipitation occurred. The start of precip-itation is also indicated by a sharp change in the slope of theresistivity versus time curve. The solution was pumped to thequartz capillary continuously, where in situ SAXS measure-ments were carried out. An example of SAXS scattering curvesrelated to a FCP test, with [Ca2+] = 100 mg L−1, is presented inFigure 2b. As shown in Figure 2b, a slight increase of thescattering intensity occurs in domain 1. Afterward, as themassive precipitation begins (domain 2), a sharp increase of thescattering intensity can be observed.
4.2. Estimation of the Initial Values of the FittingParameters for the SAXS Data Analysis. Preliminaryfittings were carried out using a single component system(i.e., by considering a single size distribution of sphericalparticles). However, a significant improvement of the fittingcould be obtained by considering a bimodal system with twosize distributions of spherical particles, as shown in Figure 3. Infact, the mean square deviation decreased from 458 to 364 withthe bimodal system, compared to a single component system.30
To launch the I(q) curves fitting process, the initial values ofsome fitting parameters (see SAXS Data Fitting) wereestimated for each distribution in domain 1 and domain 2.The first distribution (distribution I) is likely to be related to
smaller nanoparticles. In accordance with recent studies, thisdistribution could correspond to nucleation clusters of CaCO3
Figure 2. (a) pH and resistivity of the tested solutions during the FCP experiments at 30 °C. (b) Evolution of SAXS scattering intensity I(q) as afunction of time during a FCP test with [Ca2+] = 100 mg L−1.
Figure 3. Fitting of the experimental SAXS scattering curve at t = 15min for a FCP test ([Ca2+] = 200 mg L−1).
Langmuir Article
dx.doi.org/10.1021/la500202g | Langmuir 2014, 30, 3303−33093305
in the range of a few nanometers (0.7−4 nm).14,16,29 In thefitting procedure, these values were set as the starting point forthe median radius of the particles in distribution I. The seconddistribution (distribution II) corresponds to larger nano-particles. In the fitting procedure, the starting point of themedian size for distribution II was set to 8−20 nm. This wasbased on the study of Donnet et al.15 who observed CaCO3seeds of this size range in filtered Ca(HCO3)2 solution. It mustbe noticed that the fitting results were sensitive to the choice ofinitial size values for both distributions of particles. Onlysatisfactory results were obtained with the above starting points.4.3. SAXS Fitting Results. The fitting of the experimental
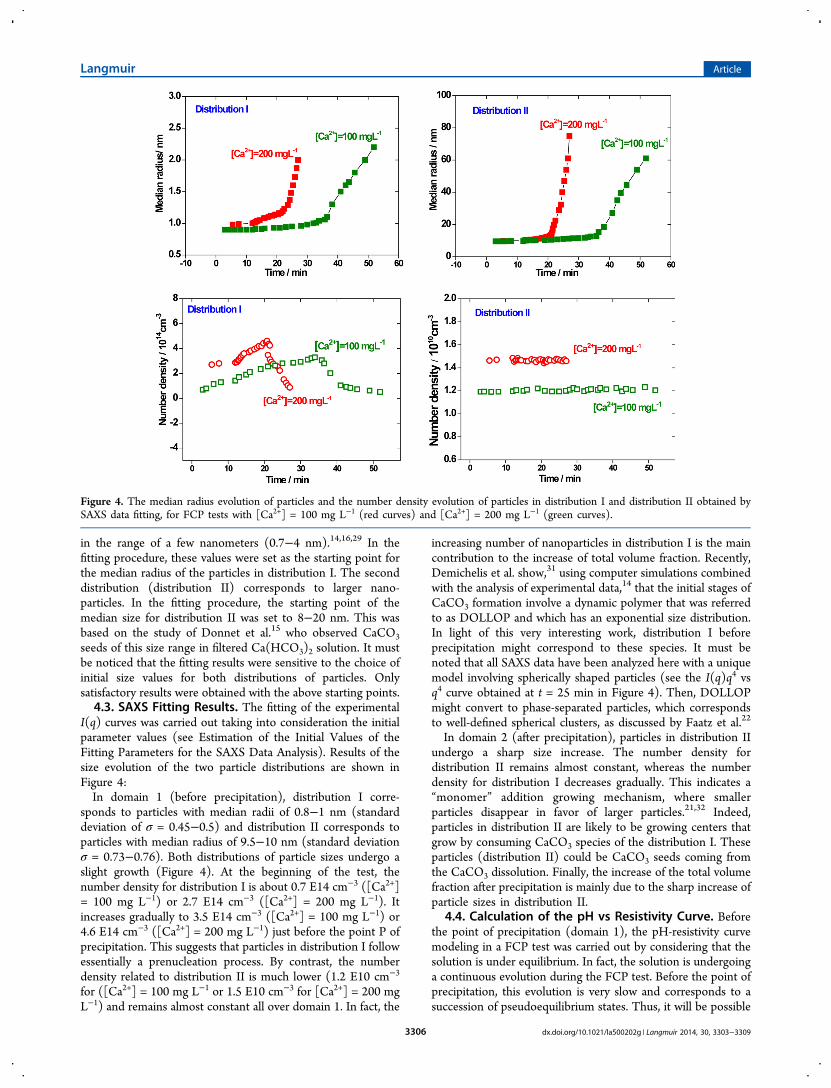
I(q) curves was carried out taking into consideration the initialparameter values (see Estimation of the Initial Values of theFitting Parameters for the SAXS Data Analysis). Results of thesize evolution of the two particle distributions are shown inFigure 4:In domain 1 (before precipitation), distribution I corre-
sponds to particles with median radii of 0.8−1 nm (standarddeviation of σ = 0.45−0.5) and distribution II corresponds toparticles with median radius of 9.5−10 nm (standard deviationσ = 0.73−0.76). Both distributions of particle sizes undergo aslight growth (Figure 4). At the beginning of the test, thenumber density for distribution I is about 0.7 E14 cm−3 ([Ca2+]= 100 mg L−1) or 2.7 E14 cm−3 ([Ca2+] = 200 mg L−1). Itincreases gradually to 3.5 E14 cm−3 ([Ca2+] = 100 mg L−1) or4.6 E14 cm−3 ([Ca2+] = 200 mg L−1) just before the point P ofprecipitation. This suggests that particles in distribution I followessentially a prenucleation process. By contrast, the numberdensity related to distribution II is much lower (1.2 E10 cm−3
for ([Ca2+] = 100 mg L−1 or 1.5 E10 cm−3 for [Ca2+] = 200 mgL−1) and remains almost constant all over domain 1. In fact, the
increasing number of nanoparticles in distribution I is the maincontribution to the increase of total volume fraction. Recently,Demichelis et al. show,31 using computer simulations combinedwith the analysis of experimental data,14 that the initial stages ofCaCO3 formation involve a dynamic polymer that was referredto as DOLLOP and which has an exponential size distribution.In light of this very interesting work, distribution I beforeprecipitation might correspond to these species. It must benoted that all SAXS data have been analyzed here with a uniquemodel involving spherically shaped particles (see the I(q)q4 vsq4 curve obtained at t = 25 min in Figure 4). Then, DOLLOPmight convert to phase-separated particles, which correspondsto well-defined spherical clusters, as discussed by Faatz et al.22
In domain 2 (after precipitation), particles in distribution IIundergo a sharp size increase. The number density fordistribution II remains almost constant, whereas the numberdensity for distribution I decreases gradually. This indicates a“monomer” addition growing mechanism, where smallerparticles disappear in favor of larger particles.21,32 Indeed,particles in distribution II are likely to be growing centers thatgrow by consuming CaCO3 species of the distribution I. Theseparticles (distribution II) could be CaCO3 seeds coming fromthe CaCO3 dissolution. Finally, the increase of the total volumefraction after precipitation is mainly due to the sharp increase ofparticle sizes in distribution II.
4.4. Calculation of the pH vs Resistivity Curve. Beforethe point of precipitation (domain 1), the pH-resistivity curvemodeling in a FCP test was carried out by considering that thesolution is under equilibrium. In fact, the solution is undergoinga continuous evolution during the FCP test. Before the point ofprecipitation, this evolution is very slow and corresponds to asuccession of pseudoequilibrium states. Thus, it will be possible
Figure 4. The median radius evolution of particles and the number density evolution of particles in distribution I and distribution II obtained bySAXS data fitting, for FCP tests with [Ca2+] = 100 mg L−1 (red curves) and [Ca2+] = 200 mg L−1 (green curves).
Langmuir Article
dx.doi.org/10.1021/la500202g | Langmuir 2014, 30, 3303−33093306
to calculate, over the time, the volume fraction of CaCO3. Therelated equations and constants of equilibrium at 30 °C aregiven in Table S1 of the Supporting Information.The calcium mass balance and the charge balance (refer to
the Supporting Information) were used to calculate the[Ca2+]free concentration:
=+ + − −
−
= − + −
= + +
= + +
+ + −−
= − −
−
+
− + − + +
−
+ +
+ +
+ − +
+
− + +
+
+
⎧
⎨
⎪⎪⎪⎪⎪⎪⎪⎪⎪
⎩
⎪⎪⎪⎪⎪⎪⎪⎪⎪
K
b b aca
a K K K K
b K K
K K
c
[Ca ][CO ](2 [H ]/K ) [OH ] [H ] [Ca ]
1 [CO ]
where
[CO ]4
2
(2 [H ]/ )( [H ]/ )
2 [H ]/ [Ca ]
( [H ]/K )([OH ] [H ][Ca ] )
[OH ] [H ] 2[Ca ]
2free
32
22
total
CaCO 32
32
2
2 CaCO CaHCO 2
22
total CaCO
CaCO CaHCO 22
total
2total
3
3 3
3
3 3
(6)
The [Ca2+]total value is well-known, and the value of [H+] can
be determined by pH measurements. The solution con-ductivity/resistivity could be then deduced from all thedetermined ions concentrations. The limiting values of molarconductivity for the different ions used in this study are given inTable S2 of the Supporting Information. It must be noticed thatthese molar conductivity values are given for a temperature of25 °C. Therefore, the experimental resistivity values measuredat 30 °C had to be corrected at 25 °C. In order to carry out thisadaptation, measurements were carried out at differenttemperatures in standard buffer solutions. The coefficients ofresistivity values between these two different temperaturescould be then estimated.The Debye−Huckel−Onsager equation was developed to
calculate the conductivity at finite concentrations for asymmetric electrolyte, taking into consideration the ionicinteractions as retarding electrophoresis and retardingrelaxation forces. However, the Debye−Huckel−Onsagerequation is only suitable for the symmetric electrolyte, andthe Ca(HCO3)2 solution is a 1:2 electrolyte. Thus, a modifiedequation developed by Jacobson and Langmuir33 was used herefor the Ca(HCO3)2 aqueous solution (eq 7):
ε η εΛ = Λ −
× | | Λ+
+| | + | |
×+
+ − + −⎡⎣⎢⎢
⎤⎦⎥⎥
z z q
T q
z z
T
IKd
2.801 10
( ) (1 )
41.25( )
( )
(1 )
oo6
3/2 1/2
(7)
with
ε= × −K T I50.29 10 ( )8 1/2
= | | | | + | | | | + | |+ − + − + + − +q z z z z z t z t/(( )( )o o
where I is the ionic strength of the solution, Λo the molarconductivity of the salt, η the viscosity of water, ε the dielectricconstant of water, T the temperature (K), d the mean hydrateddistance of close approach of cation and anion, z+ the cationcharge, z− the anion charge, λ+
0 the limiting value of molarconductivity for cation, and λ−
0 the limiting value of molarconductivity for anion.
For a totally dissociated Ca(HCO3)2 solution at 25 °C, eq 7reduced to:
Λ = − +I I104.0 (136.28 )/(1.0 1.728 ) (8)
The conductivity σ could be calculated according to thefollowing equation:
σ = Λ +Ca[ ]2Free (9)
After the point of precipitation (domain 2), the evolution ofthe solution is very fast. Ion concentrations can no longer beestimated by using association constants of solution equili-brium. Thus, it is difficult to estimate the resistivity values fromthe measured pH values. However, an estimation of the amountof [Ca2+]free based on the pH and conductivity measurementscould be done. The test solution is still considered as a totallydissociated Ca(HCO3)2 solution, in which [Ca2+]free decreasesrapidly to form solid calcium carbonate. Equations 8 and 9 wereused to calculate the [Ca2+]free concentration. The contributionof CO3
2− ions to ionic force F was not taken into considerationbecause its concentration is negligible compared to that of[Ca2+]free and [HCO3
−]. The [HCO3−] concentration was
estimated by using the following equation:
=− +[HCO ] 2[Ca ]32
Free (10)
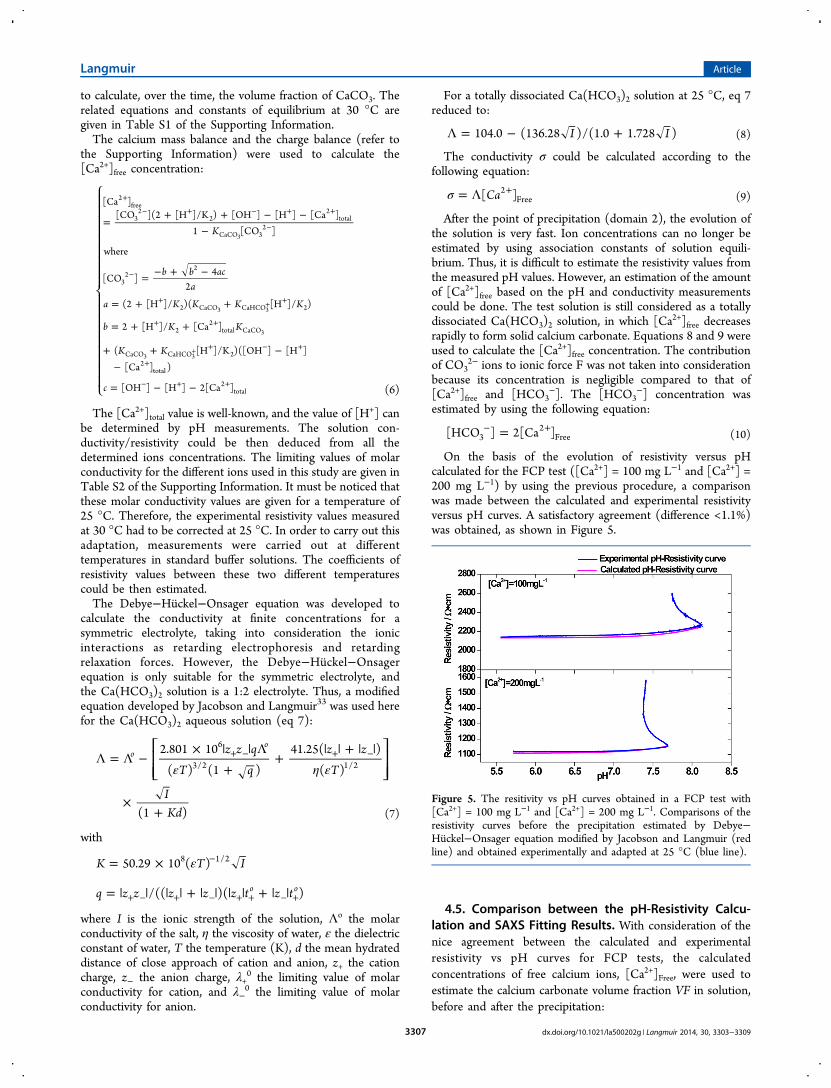
On the basis of the evolution of resistivity versus pHcalculated for the FCP test ([Ca2+] = 100 mg L−1 and [Ca2+] =200 mg L−1) by using the previous procedure, a comparisonwas made between the calculated and experimental resistivityversus pH curves. A satisfactory agreement (difference <1.1%)was obtained, as shown in Figure 5.
4.5. Comparison between the pH-Resistivity Calcu-lation and SAXS Fitting Results. With consideration of thenice agreement between the calculated and experimentalresistivity vs pH curves for FCP tests, the calculatedconcentrations of free calcium ions, [Ca2+]Free, were used toestimate the calcium carbonate volume fraction VF in solution,before and after the precipitation:
Figure 5. The resitivity vs pH curves obtained in a FCP test with[Ca2+] = 100 mg L−1 and [Ca2+] = 200 mg L−1. Comparisons of theresistivity curves before the precipitation estimated by Debye−Huckel−Onsager equation modified by Jacobson and Langmuir (redline) and obtained experimentally and adapted at 25 °C (blue line).
Langmuir Article
dx.doi.org/10.1021/la500202g | Langmuir 2014, 30, 3303−33093307
ρ
= −
= × ×
+ + +
+VF M
[Ca ] [Ca ] [Ca ]
0.001 [Ca ] /
2envolved
2total
2free
CaCO2
envolved CaCO3 3 (11)
where MCaCO3 (g mol−1) is the molar mass of calcium carbonate
and ρACC (g cm−3) the volume density of ACC. The massdensity ACC was used instead of that of CaCO3°, which is notavailable in the literature. Indeed, compared to other CaCO3crystal forms, ACC is a hydrated form of CaCO3, whose massdensity could be the closest to that of CaCO3°.The volume fraction of formed calcium carbonate estimated
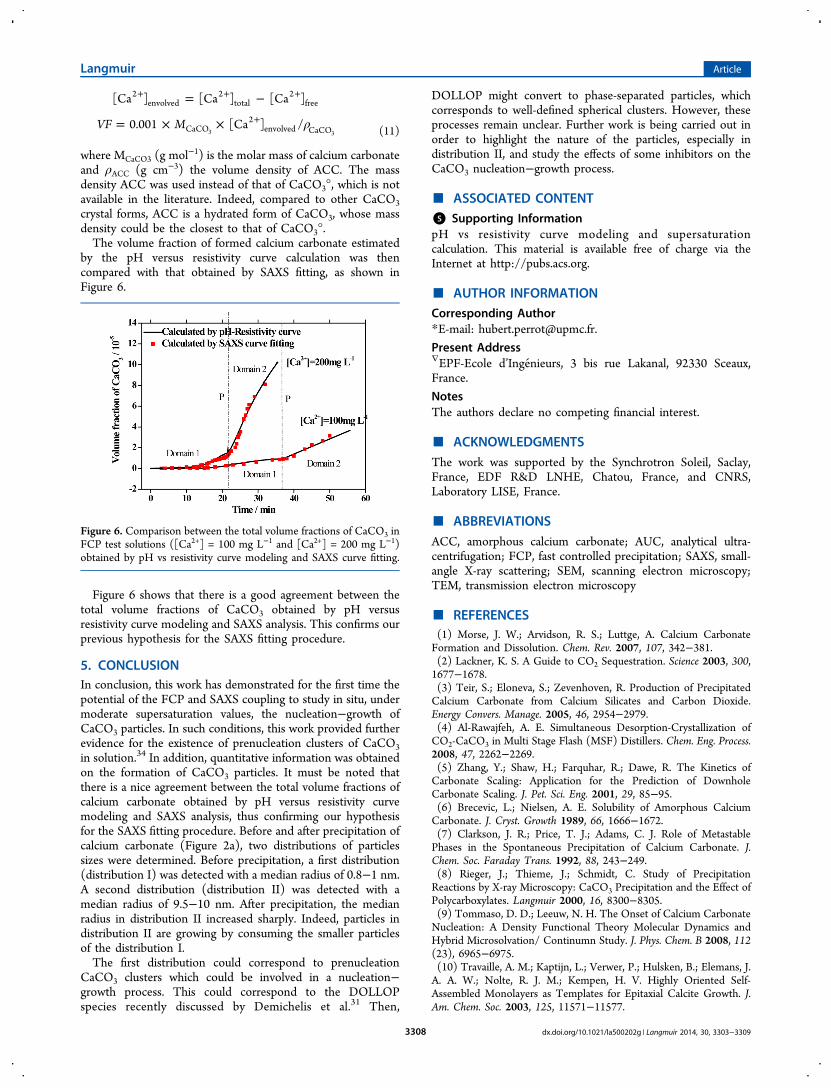
by the pH versus resistivity curve calculation was thencompared with that obtained by SAXS fitting, as shown inFigure 6.
Figure 6 shows that there is a good agreement between thetotal volume fractions of CaCO3 obtained by pH versusresistivity curve modeling and SAXS analysis. This confirms ourprevious hypothesis for the SAXS fitting procedure.
5. CONCLUSIONIn conclusion, this work has demonstrated for the first time thepotential of the FCP and SAXS coupling to study in situ, undermoderate supersaturation values, the nucleation−growth ofCaCO3 particles. In such conditions, this work provided furtherevidence for the existence of prenucleation clusters of CaCO3in solution.34 In addition, quantitative information was obtainedon the formation of CaCO3 particles. It must be noted thatthere is a nice agreement between the total volume fractions ofcalcium carbonate obtained by pH versus resistivity curvemodeling and SAXS analysis, thus confirming our hypothesisfor the SAXS fitting procedure. Before and after precipitation ofcalcium carbonate (Figure 2a), two distributions of particlessizes were determined. Before precipitation, a first distribution(distribution I) was detected with a median radius of 0.8−1 nm.A second distribution (distribution II) was detected with amedian radius of 9.5−10 nm. After precipitation, the medianradius in distribution II increased sharply. Indeed, particles indistribution II are growing by consuming the smaller particlesof the distribution I.The first distribution could correspond to prenucleation
CaCO3 clusters which could be involved in a nucleation−growth process. This could correspond to the DOLLOPspecies recently discussed by Demichelis et al.31 Then,
DOLLOP might convert to phase-separated particles, whichcorresponds to well-defined spherical clusters. However, theseprocesses remain unclear. Further work is being carried out inorder to highlight the nature of the particles, especially indistribution II, and study the effects of some inhibitors on theCaCO3 nucleation−growth process.
■ ASSOCIATED CONTENT*S Supporting InformationpH vs resistivity curve modeling and supersaturationcalculation. This material is available free of charge via theInternet at http://pubs.acs.org.
■ AUTHOR INFORMATIONCorresponding Author*E-mail: [email protected].
Present Address∇EPF-Ecole d’Ingenieurs, 3 bis rue Lakanal, 92330 Sceaux,France.
NotesThe authors declare no competing financial interest.
■ ACKNOWLEDGMENTSThe work was supported by the Synchrotron Soleil, Saclay,France, EDF R&D LNHE, Chatou, France, and CNRS,Laboratory LISE, France.
■ ABBREVIATIONSACC, amorphous calcium carbonate; AUC, analytical ultra-centrifugation; FCP, fast controlled precipitation; SAXS, small-angle X-ray scattering; SEM, scanning electron microscopy;TEM, transmission electron microscopy
■ REFERENCES(1) Morse, J. W.; Arvidson, R. S.; Luttge, A. Calcium CarbonateFormation and Dissolution. Chem. Rev. 2007, 107, 342−381.(2) Lackner, K. S. A Guide to CO2 Sequestration. Science 2003, 300,1677−1678.(3) Teir, S.; Eloneva, S.; Zevenhoven, R. Production of PrecipitatedCalcium Carbonate from Calcium Silicates and Carbon Dioxide.Energy Convers. Manage. 2005, 46, 2954−2979.(4) Al-Rawajfeh, A. E. Simultaneous Desorption-Crystallization ofCO2-CaCO3 in Multi Stage Flash (MSF) Distillers. Chem. Eng. Process.2008, 47, 2262−2269.(5) Zhang, Y.; Shaw, H.; Farquhar, R.; Dawe, R. The Kinetics ofCarbonate Scaling: Application for the Prediction of DownholeCarbonate Scaling. J. Pet. Sci. Eng. 2001, 29, 85−95.(6) Brecevic, L.; Nielsen, A. E. Solubility of Amorphous CalciumCarbonate. J. Cryst. Growth 1989, 66, 1666−1672.(7) Clarkson, J. R.; Price, T. J.; Adams, C. J. Role of MetastablePhases in the Spontaneous Precipitation of Calcium Carbonate. J.Chem. Soc. Faraday Trans. 1992, 88, 243−249.(8) Rieger, J.; Thieme, J.; Schmidt, C. Study of PrecipitationReactions by X-ray Microscopy: CaCO3 Precipitation and the Effect ofPolycarboxylates. Langmuir 2000, 16, 8300−8305.(9) Tommaso, D. D.; Leeuw, N. H. The Onset of Calcium CarbonateNucleation: A Density Functional Theory Molecular Dynamics andHybrid Microsolvation/ Continumn Study. J. Phys. Chem. B 2008, 112(23), 6965−6975.(10) Travaille, A. M.; Kaptijn, L.; Verwer, P.; Hulsken, B.; Elemans, J.A. A. W.; Nolte, R. J. M.; Kempen, H. V. Highly Oriented Self-Assembled Monolayers as Templates for Epitaxial Calcite Growth. J.Am. Chem. Soc. 2003, 125, 11571−11577.
Figure 6. Comparison between the total volume fractions of CaCO3 inFCP test solutions ([Ca2+] = 100 mg L−1 and [Ca2+] = 200 mg L−1)obtained by pH vs resistivity curve modeling and SAXS curve fitting.
Langmuir Article
dx.doi.org/10.1021/la500202g | Langmuir 2014, 30, 3303−33093308
(11) Tracy, S. L.; Francois, C. J. P.; Jennings, H. M. The Growth ofCalcite Spherulites from Solution II. Kinetics of Formation. J. Cryst.Growth 1998, 193, 374−381.(12) Colfen, H.; Qi, L. A Systematic Examination of theMorphogenesis of Calcium Carbonate in the Presence of a Double-Hydrophilic Block Copolymer. Chem.Eur. J. 2001, 7, 106−116.(13) Gower, L. B.; Odom, D. J. Deposition of Calcium CarbonateFilms by a Polymer-Induced Liquid-Precursor (PILP) Process. J. Cryst.Growth 2000, 210, 719−734.(14) Gebauer, D.; Volkel, A.; Colfen, H. Stable PrenucleationCalcium Carbonate Clusters. Science 2008, 322, 1819−1822.(15) Donnet, M.; Bowen, P.; Jongen, N.; Lemaître, J.; Hofmann, H.Use of Seeds to Control Precipitation of Calcium Carbonate andDetermination of Seed Nature. Langmuir 2005, 21, 100−108.(16) Pouget, E. M.; Bomans, P. H. H.; Goos, J. A. C. M.; Frederik, P.M.; With, G.; Sommerdijk, N. A. J. M. The Initial Stages of Template-Controlled CaCO3 Formation Revealed by Cryo-TEM. Science 2009,323, 1455−1458.(17) Bolze, J.; Peng, B.; Dingenouts, N.; Panine, P.; Narayanan, T.;Ballauf, M. Formation and Growth of Amorphous Colloidal CaCO3Precursor Particles as Detected by Time-Resolved SAXS. Langmuir2002, 18, 8364−8369.(18) Pontoni, D.; Bolze, J.; Dingenouts, N.; Narayanan, T.; Ballauff,M. Crystallization of Calcium Carbonate Observed In-situ byCombined Small- and Wide-Angle X-Ray Scattering. J. Phys. Chem.B 2003, 107, 5123−5125.(19) Bolze, J.; Pontoni, D.; Ballauff, M.; Narayanan, T.; Colfen, H.Time-Resolved SAXS Study of the Effect of a Double HydrophilicBlock-Copolymer on the Formation of CaCO3 from a SupersaturatedSalt Solution. J. Colloid Interface Sci. 2004, 277, 84−94.(20) Wallace, A. F; Hedges, L. O.; Fernandez-Martinez, A.; Raiteri,P.; Gale, J. D.; Waychunas, G. A.; Whitelam, S.; Banfield, J. F.; DeYoreo, J. Microscopic Evidence for Liquid-Liquid Separation inSupersaturated CaCO3 Solutions. Science 2013, 341, 885−889.(21) Liu, J.; Pancera, S.; Boyko, V.; Shukla, A.; Narayanan, T.; Huber,K. Evaluation of the Particle Growth of Amorphous CalciumCarbonate in Water by Means of the Porod Invariant from SAXS.Langmuir 2010, 26, 17405−17412.(22) Faatz, M.; Grohn, F.; Wegner, G. Amorphous CalciumCarbonate: Synthesis and Potential Intermediate by Biomineralization.Adv. Mater. 2004, 16, 996−1000.(23) Wolf, E. S.; Leiterer, J.; Kappl, M.; Emmerling, F.; Tremel, W.Early Homogenous Amorphous Precursor Stages of CalciumCarbonate and Subsequent Crystal Growth in Levitated Droplets. J.Am. Chem. Soc. 2008, 130, 12342−12347.(24) Liu, J.; Rieger, J.; Huber, K. Analysis of the Nucleation andGrowth of Amorphous CaCO3 by Means of Time-Resolved StaticLight Scattering. Langmuir 2008, 24, 8262−8271.(25) Ledion, J.; Francois, B.; Vienne, J. Caracterisation du PouvoirEntartrant de l’Eau par Precipitation Controlee Rapide. JournalEuropeen d’Hydrologie 1998, 28 (1), 15−35.(26) Gauthier, G.; Chao, Y.; Horner, O.; Alos-Ramos, O.; Hui, F.;Ledion, J.; Perrot, H. Application of the Fast Controlled PrecipitationMethod to Assess the Scale-Forming Ability of Raw River Waters.Desalination 2012, 299, 98−95.(27) Ginier, A.; Fournet, G. Small Angle Scattering of X-ray; Chapman& Hall: London, 1955.(28) Donnet, M.; Aimable, A.; Lemaître, J.; Bowen, P. Contributionof Aggregation to the Growth Mechanism of Seeded CalciumCarbonate Precipitation in the Presence of Polyacrylic Acid. J. Phys.Chem. B 2010, 114, 12058−12067.(29) Raiteri, P.; Gale, J. D. Water Is the Key to NonclassicalNucleation of Amorphous Calcium Carbonate. J. Am. Chem. Soc. 2010,323, 1455−1458.(30) Kline, S. R. Reduction and Analysis of SANS and USANS Datausing Igor Pro. J. Appl. Crystallogr. 2006, 39 (6), 895.(31) Demichelis, R.; Raiteri, P.; Gale, J. D.; Quigley, D.; Geabauer, D.Stable Prenucleation Mineral Clusters Are Liquid-Like Ionic Polymers.Nat. Commun. 2011, No. 2, 590.
(32) Bogush, G. H.; Zukoski, C. F. Uniform Silica ParticlePrecipitation: An Aggregative Growth Model. J. Colloid Interface Sci.1991, 142, 19−34.(33) Jacobson, R. L.; Langmuir, D. Dissociation Constants of Calciteand CaHCO3
+ from 0 to 50°C. Geochim. Cosmochim. Acta 1974, 38,301−318.(34) Glatter, O.; Kratky, O. Small-Angle X-ray Scattering; AcademicPress: London, 1982.
Langmuir Article
dx.doi.org/10.1021/la500202g | Langmuir 2014, 30, 3303−33093309