Embed Size (px)
Citation preview

NASA Grant NGR-36-003-054
Part I
INFRARED STUDIES OF CHAIN FOLDING
IN POLYETHYLENE TEREPHTHALATE
Work Performed By
Martin J. Hannon
Report Prepared By
J. L. Koenig and Mart in J. Hannon
ABSTRACT
https://ntrs.nasa.gov/search.jsp?R=19660020447 2019-08-01T21:17:24+00:00Z

I ..
TABLE OF aMTENTS
Page IH!l?R3DUCTIoIN . . . . . . . . . . . . . . . . . . . . . . . 1
SPECTR(ISCOPY0F'ISEFOLDEXlMAIN . . . . . . . . . . . . 5
EXPERIMENTAL . . . . . . . . . . . . . . . . . . . . . . . 14
Instrumental . . . . . . . . . . . . . . . . . . . 14
Base Line Study . . . . . . . . . . . . . . . . . . 16 Sample Preparation . . . . . . . . . . . . . . . . 15
RESULTS . . . . . . . . . . . . . . . . . . . . . . . . . 19 IQon-Crystlalllne Samples . . . . . . . . . . . . . . 19 Melt and Solution Crystallized Samples . . . . . . 19 Annealing Studies . . . . . . . . . . . . . . . . . 19 Degradation . . . . . . . . . . . . . . . . . . . . 31 Oligomers . . . . . . . . . . . . . . . . . . . . . 36 Strain Induced Crystallization . . . . . . . . . . 36 Deformation . . . . . . . . . . . . . . . . . . . 40
DISCUSSICW . . . . . . . . . . . . . . . . . . . . . . . . 45
BandAssigment . . . . . . . . . . . Structure of the Fold in PET . . . . . The 988 cm-l Band in the Linear Trimer M e l t and Solution Crystallized Samples Annealing Studies . . . . . . . . . . . Oligomers . . . . . . . . . . . . . . . Strain Induced Crystallization . . . . Defamation.. . . . . . . . . . . . . FutureWork . . . . . . . . . . . . . .
. . . . . 0 4 5 . . . . . . 46 . . . . . - 4 6 . . . . . . 49 . . . . . . so . . . . . . 53 . . . . . . 53 . . . . . . 54 . . . . 0 . 5 5
mcuIs1ows . . . . . . . . . . . . . . . . . . . . . . . 57
RE-CES . . . . . . . . . . . . . . . . . . . . . . . . 58
i v
.

Figuse 1
2
3
4
5
6
7
8a
8b
9a
9b
10
11
LXST OF FXCURES
Title
Model of a Growing Sphem . .te.
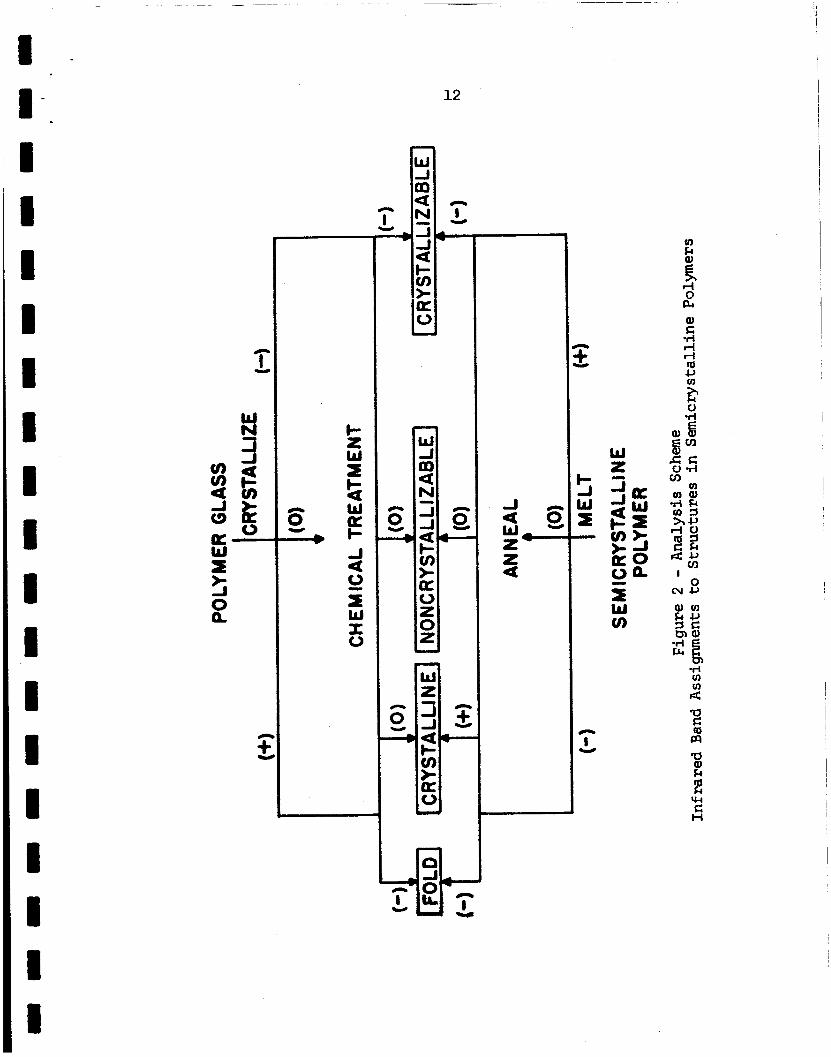
Analysis Schane - Infrared Band Assignments t o Stmctures i n Semicrystalline Polymers.
Polyethylene Terephthalate Baselines.
Wide Angle X-ray Pattern of Crystalline PET.
988 an'' Band i n Various PE!F Samples.
1380 cuto1 Band i n Various PET Samples . Behavior of the 973 an" Crys- t a l l i n e Band During Annealing.
Behavior of the 988 cm'l Band During Annealing Behavior of the A973 an -1 / A 988 an-' Ratio During Annealing. 26
Page
7
3.2
18
20
2 1
22
25
26 -
Behavior of the 1380 a'' Band During Annealing. 27
Behavior of the A973 an -1 / A 1380 cm'l Ratio During Annealing. 27
Small Angle Long Period versus Reciprocal Fold Absorbance a t 14OoC. 28
Smal l Angle Long Period versus Reciprocal Fold Absorbance a t 20OoC. 29
V
Figure Title Page
12
13
i4a
14b
15
16
17
18
19
20
S m a l l Angle Long Per iod versus Reciprocal Fold Absorbance a t 24OoC.
Small Angle Scan of Annealed hor;phous PET.
Cqstalllne PET before hgr'adation
Crystalline PET after DegMdation.
Hydrplxsis as a Function of Time Ratio 988p973.
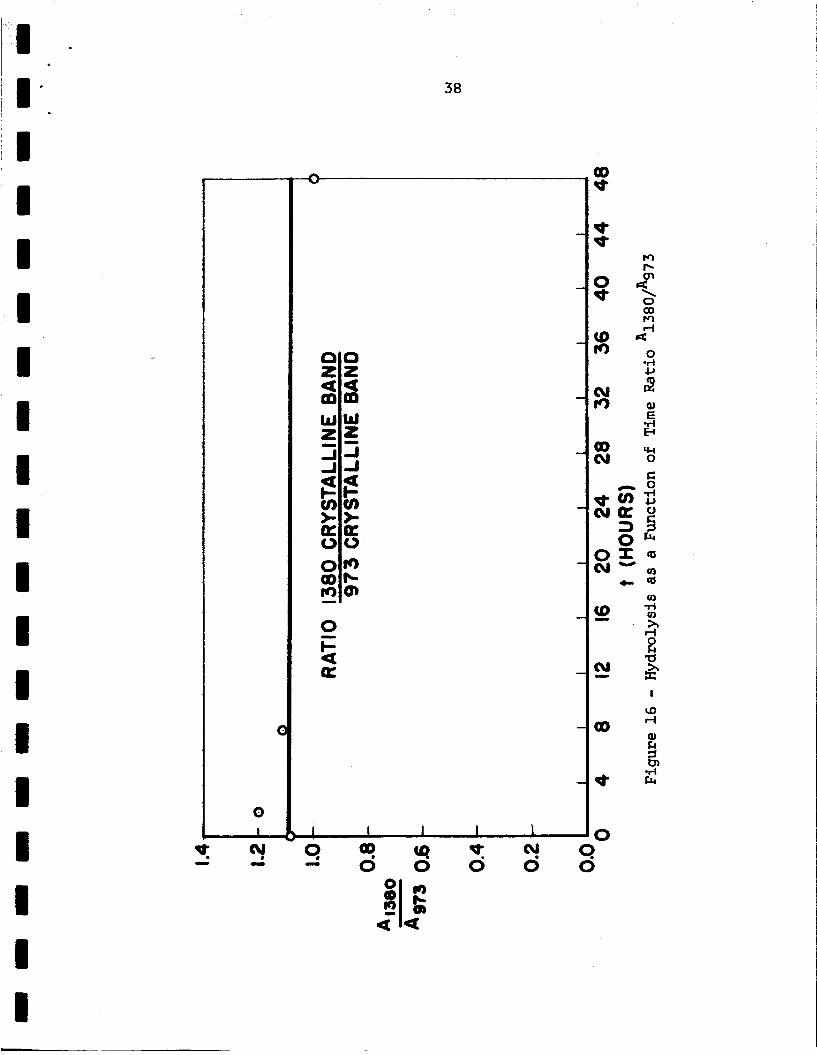
Hydrolysis as a Function of Time Ratio A1380/A973.
Behavior of the 988 cm'l Band in Crystalline PET.
Momation Studies Upon PET Film.
Possible Conformation of the Fold in PET.
Limiting Density as a Function of Temperature i n PET.
c
30
32
35
35
37
38
41
42
47
52

!
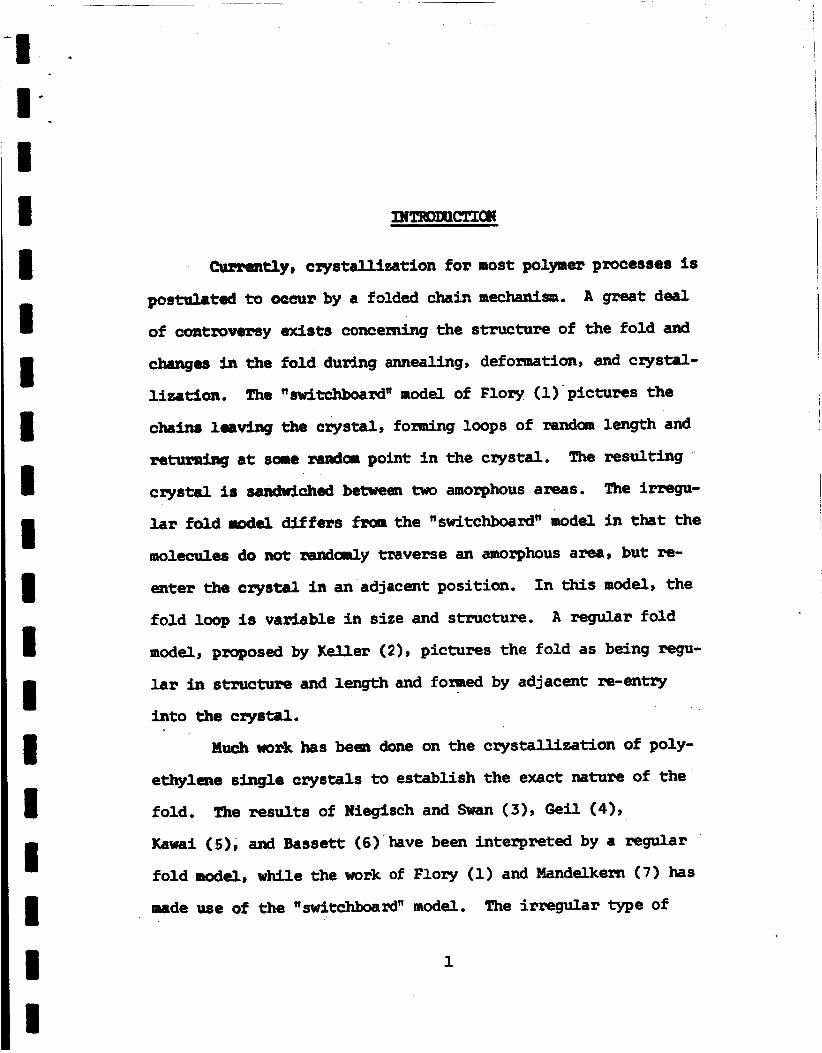
INmCTIm
Currently, crystallieation for most polymer processes is
postulatd to occur by a folded chain mec2udsan. A great deal.
of cantrovemy exists concerning the structure of the fold and
changes ia the fold during annealing, deformation, and crystal-
lization.
chaW leaving the crystal , foming loops of random length and
re- a t some Madoaa point i n the crystal .
crystal 58 saadtdched betrreen two amorphous areas. The irregu-
l a r fold model di f fem from the nswitchboard" model in that the
moltcules do not Hudotnly traverse an aa~>rphous area, but re-
enter the crystal in an adjacent position.
fold loop is variable i n size and structure.
model, proposed by K e l l e r (2), pictures the fold as being regu-
lar in structure and length and fonaed by adjacent re-entry
The nswitchboardw nodel of Flory (1) 'pictures the
The resulting
I n this model, the
A regular fold
in to the crystal.
M u c h work has been done on the crystal l izat ion of poly-
ethylene single crystals t o establish the exact nature of the
fold. The results of Niegisch and man (31, Geil (41,
Kawai (5), and Bassett (6) have been interpreted by a regular
fold model, while the work of
made use of the "switchboard"
Flory (1) and Mandelkern ( 7 ) has
model. The i r regular type of
1

, I
folding (8) seems t o exist in polyethylene single crystals when
first grown - later rearranging t o a more perfect crystal .
Bulk crystall ization is considerably inore camplex and
has been the subject of intensive study i n recent years.
crystals have been gxwwn frun the m e l t (9) pmviding evidence
that polymers also crystall ize frun the melt by a chain folding
mechanism.
polyethylene.
Subsequently, Koenig and Witenhafer (11) have provided evidence
for the s i m i l a r i t y of fold structure i n bulk and solution crys-
t a m z e d polyethylene.
Single
Brown (10) has studied single crystals and bulk
H e reports the two are morphologically similar.
The nature of the crystals i n oriented polymer samples
has also been studied.
crystal defonnation (12) and subsequent annealing (13) i n order
t o further elucidate the nature of the morphology and i ts fold-
ing mechanisms.
show the manner of folding i n these polymers.
the defamation process i n bulk crystal l ine polymers have been
proposed by Peterlin (15) as a result of intensive studies upon
polyethylene.
fonaation i n the early stages of deformation.
a r e further oriented,' one observes t i l t i n g of the lamellae and
slipping of the molecules past one another. In the final stage
of orientation, Peterlin postulates the "breaking off of larger
blocks of folded chains which are then incorporated in to the
G e i l has studied polyethylene single
Studies on Nylon 6 and polyoxymethylene (14)
Mechanisms fo r
The studies indicate twinning and phase trans-
As the chains
3
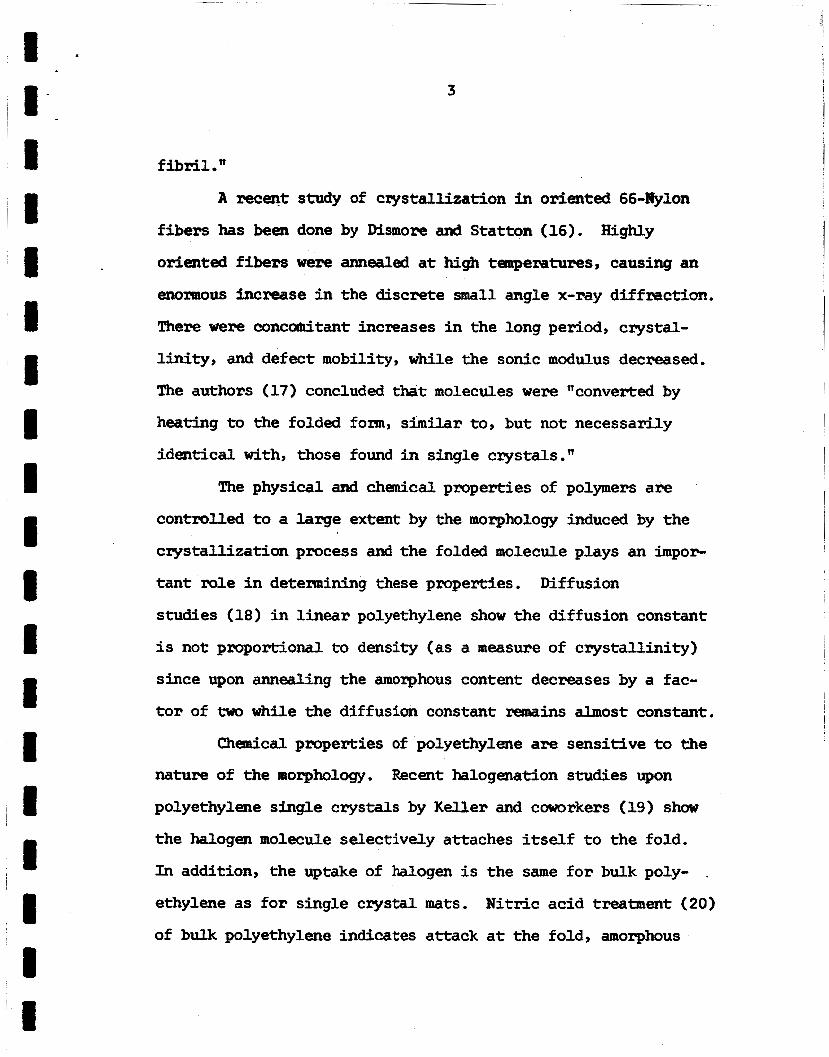
f ibr i l ."
A recent study of crystallization i n oriented 66-Nylon
f ibers has been done by Dismore and Statton (16).
oriented f ibers w e r e annealed a t high temperatures, causing an
enomus increase i n t h e discrete small angle x-ray diffraction.
There w e r e concomitant increases i n the long period, crystal-
l i n i ty , and defect mobility, w h i l e the sonic modulus decreased.
The authors (17) concluded that molecules w e r e "converted by
heating t o the folded fonn, similar to, but not necessarily
ident ical with, those found i n single crystals."
Highly
The physical and chemical properties of polymers are
controlled t o a large extent by the morphology induced by the
crystal l izat ion process and the folded molecule plays an impor-
t a n t role i n determining these properties. Diffusion
s tudies (18) i n l inear polyethylene show the diffusion constant
i s not proportional t o density (as a measure of crystal l ini ty)
since upon annealing the aorphous content decreases by a fac-
t o r of two while the diffusion constant xwnains almost constant.
chemical properties of polyethylene are sensit ive t o the
nature of the raorphology.
polyethylene single crystals by K e l l e r and coworkers (19) show
the halogen molecule se lec t ive ly attaches itself t o the fold.
I n addition, the uptake of halogen i s the same fo r bulk poly- .
ethylene as for single crystal mats.
of bulk polyethylene indicates attack a t the fold, amorphous
Recent halogenation studies upon
N i t r i c acid treatment (20)
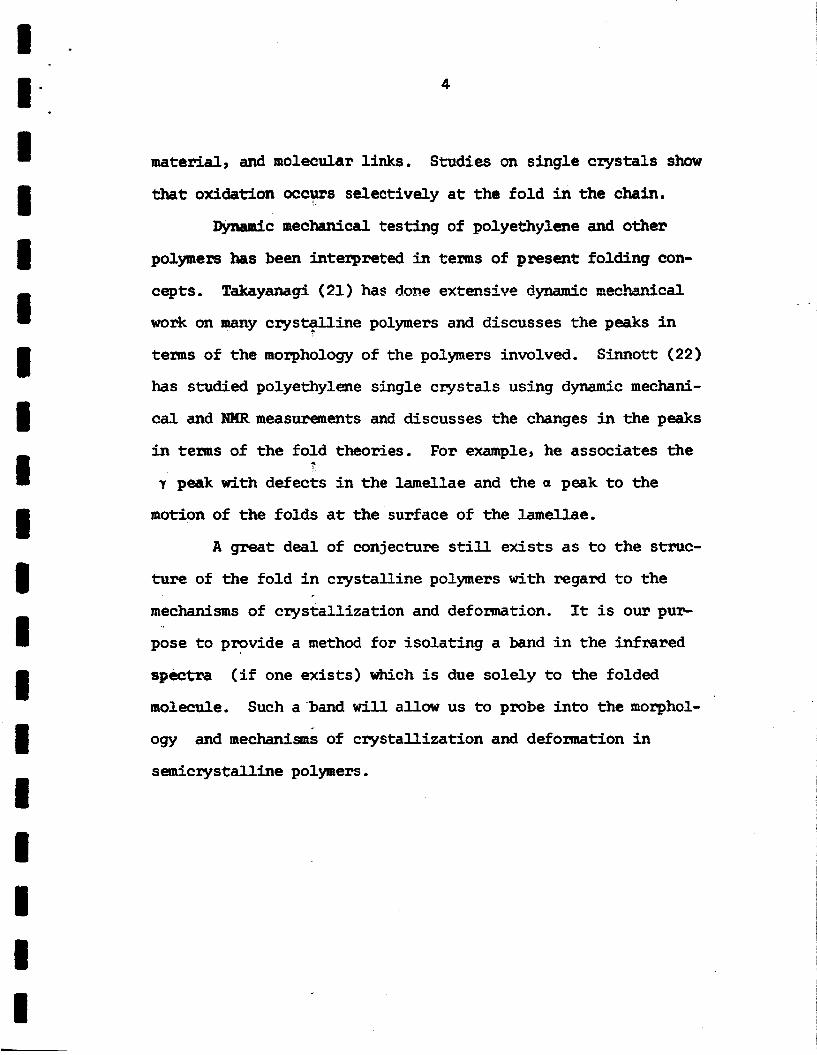
4
material, and molecular links. Studies on single crystals show
that oxidation occyrs selectively a t the fold i n the chain.
Dyxmmic mechanical testing of polyethylene and other
polymers has been interpreted i n terms of present folding con-
cepts.
work on many cryst$lline polymers and discusses the peaks i n
Takayanagi (21) has done extensive dynamic nechanical
terms of the morphology of the polymers involved. Sinnott (22)
has studied polyethylene single crystals using dynamic mechani-
ca l and "Rmeasurements and discusses the changes i n the peaks
i n tenus of the fold theories. For example, he associates the t
Y peak with defects i n the lamellae and the a peak t o the
motion of the folds a t the surface of the lamellae.
A great deal of conjecture still exis ts as t o the struc-
tu re of the fold i n crystall ine polymers with regard t o the
mechanisms of crystall ization and deformation. It i s our pur-
pose t o provide a method for isolat ing a band i n the infrared
spectra
molecule.
( i f one exists) which is due solely t o the folded
Such a-band w i l l allow us t o probe in to the morphol-
ogy and mechanisms of crystall ization and defolmation i n
semicrystalline polymers.
SP€cTRI>scaPY OF RIE RlLDED C"
i
Infrared spectroscopy is a useful tool f o r measuring
differences i n the configuration, confonaatfon, and environment
of polymers (231, as w e l l as low molecular weight materials.
Bands at t r ibutable t o the trans and gauche rotational isomers
i n polymers are w e l l known. Stereoregularity i n polymers has
bed characterized by infrared spectroscopy.
and crys ta l l in i ty are enviroxnnental effects i n polymers which
have been shown t o produce differences i n the infrared spectra.
Therefore, infrvlred spectroscopy would appear t o be an effective
too l f o r studying folding i n polymers i f a m e t h o d of assigning
and interpreting the bands can be developed.
Hydmgen bonding
When a polymer folds, one of two factors may cause
changes i n the infrared spectra. The regularity of the fold
m y induce spectral coupling of the repeat units due t o the
unique environment of the atoms i n the fold. This coupling
effect , i f it is large enough, may cause a change i n the vibra-
t i o n a l frequency, absorption coefficient o r both.
Witenhafer (11) have shown t ha t the consecutive gauche ethylene
units in the polyethylene fold produce a difference i n the ex-
t inc t ion coefficient f o r the 1304 an'' and 1350 c m - l bands.
With proper calibration, they w e r e then able t o measure the
relat ive amounts of folded and amorphous material in various
Koenig and
5

6
polyethylene samples from t h e i r respective contributions t o the
1304 cm'l and 1350 an'' bands.
the fold may exist in a unique confoxmation. A new confonae-
t i on would obviously cause a perturbation of frequency i n the
spectra.
The second possibi l i ty i s that
I n order t o f ac i l i t a t e the systematic study of polymer
spectra f o r the existence of a band due t o the folded molecule,
the bands will be divided into four different types based upon
the i r spec tml properties during melting, crystall ization,
annealing, and chemical treatment of the semicrystalline poly-
m e r .
various morphological foms.
existing i n the highly ordered region (C), i n the amorphous
regions (A ) , and i n the f o l d e d regions a t the surface will have
different environments and perhaps different confonaations.
This w i l l produce frequency s h i f t s i n the infmred pee-.
The structures producing the four types of bands w i l l be termed
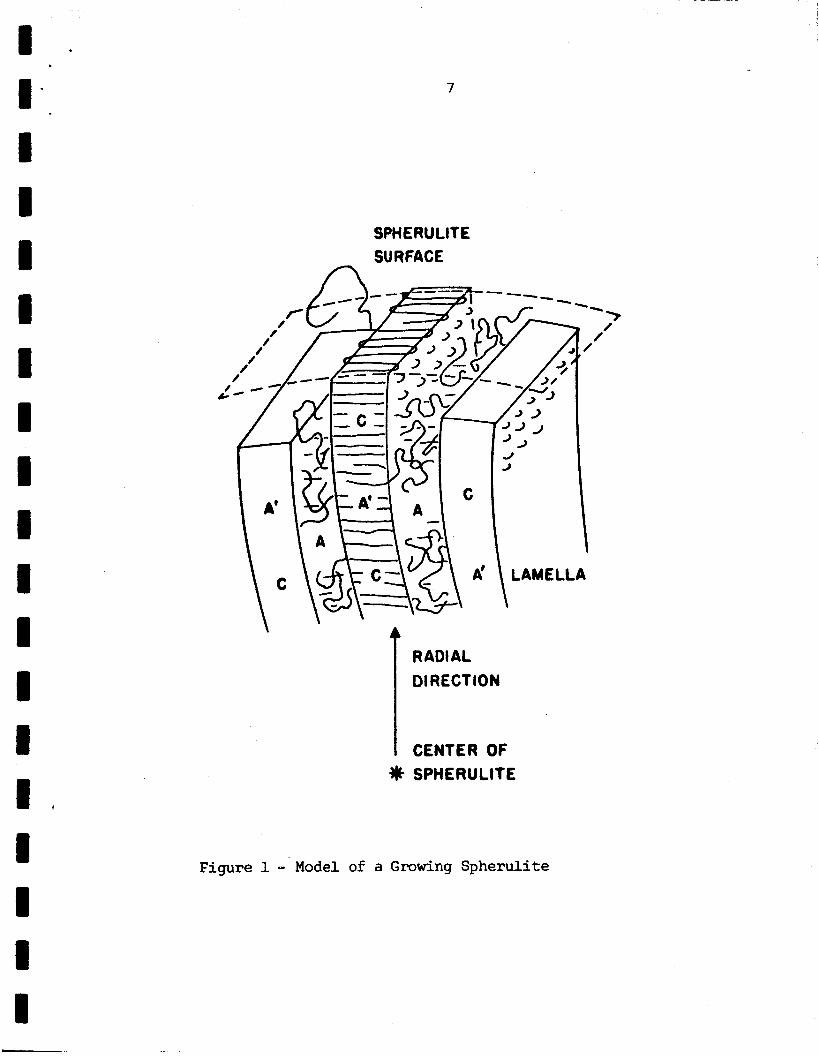
Figure 1 shows a model of a growing spherulite with the
We expect that the molecules
crystall ine, non-crystallizable, crystall izable and folded.
The spectral behavior of these bands a re shown i n Table 1.
Those infrared bands associated w i t h the crystal l ine
phase w i l l :
t a l l i n i t y , but disappear above the melting point, 2) be absent
i n the amorphous polymer but appear and increase i n intensity
w i t h time during crystall ization, 3) increase i n intensi ty when
annealing occurs, 4) be unaffected by a chemical treatment which
1) appear i n i n t e n s i t y proportional t o the crys-
SPHERULITE SURFACE
\
RADIAL 01 RECTION I CENTER OF SPHERULITE
Figure 1 - Model of a Growing Spherulite

1 - I - -
I
U
8 8
I I
F i n I30
W
1 I
8
* n n n n + O l I u u w v
a:
n I
& I 0 -
U
n 0
4 a 0 * U
Q E
n 4 v
n I
W
0) E; rf rl rl
‘ 5
h
W 0
n 0 W
a, rl CI 4) N -rl rl
E
n 1 U
n + U
n I
W
n + U
n I
W
I - 9
is not able t o penetrate into the crystal l ine regions.
are many bands in the spectra of polyethylene terephthalate
(PET) w h i c h exhibit predominantly crystal l ine behavior. The
most significant of these i s the band a t 973 an''.
There
Non-crystallizable stmcture will exh5blt bands Whose
intensi ty wlll be l i t t l e affected by melting, crystall ization,
annealing o r chemical treatment. These bands may a r i se from
end groups, branches and other fonns of heterogeneities due
t o side reactions during the polymerization.
Crystallizable bands a r i se from cbmponents' of the poly-
m e r chain in the non-crystalline phase which can be made t o
c rys ta l l ize by heat, s t ra in o r pressure. These bands w i l l :
1) exhibit intensity inversely proportional t o the degree of
c rys ta l l in i ty and may increase in intensi ty on melting,
2) appear i n the glass and m e l t , bu t decrease as crystall iza-
t ion occurs, 3) decrease i n intensity as annealing transforms
the structure t o the crystall ine phase, 4) decrease i n intensi ty
proportional t o the degree of attack of a chemical reagent on
the disordered o r amorphous portion of the polymer.
crystal l izable bands will ar ise from rotat ional isomeric con-
formations of the polymer chain (as the gauche fom) which
can be converted by heat, pressure o r s t ra in t o the stable
isomeric form found i n the crystall ine phase.
896 an'' and 1042 cm'l bands are examples of crystal l izable
bands. These bands are believed t o arise from vibrations
These
In PET the

10
of the molecule i n the gauche conformation of the ethylene
oxide unit.
Bands at t r ibutable to the fold conformation i n the
seaticrystalline polymer will:
solid state proportional t o the amount of folding and w i l l dis-
appear on melting, 2) appear i f crystal l izat ion f r o m the glass
occurs by the folded chain mechanism, 3) decrease during the
annealing process when the annealing increases the fold period
a t the expense of the folds, 4) disappear rapidly and irreversi-
bly during the chemical treatment. This f i n a l behavior results
since the folds consti tute the accessible lamellar surfaces and
due t o the energetic nature of the confornation are chemically
more reactive.
introduces a characterist ic conformation having resolvable
energy differences from conformations i n the disordered regions.
When the fold conformation arises from a combination of ordinary
rotational isomers as it apparently does i n polyethylene, no
unique fold band would be expected.
different ia t ion between a fold band and a crystal l izable type
can be made and the fold contribution i s reflected as par t of
the in tens i t ies of the crystallizable bands.
show that the 988 em'' band i n the PET spectrum is a band
ar i s ing from a unique fold conformation.
1) have an intensi ty i n the
Unique fold bands will occur only when the fold
For this case, no spectral
We propose t o
Theoretically, a l l four types of bands have different
energy levels but, due to small energy differences and the in-
11
herent band width, an observed spectral band may be a combina-
t ion of oner two o r a l l four types. I f a band is at t r ibutable
t o a single structural type, however, it can be assigned by the
analysis schme shown i n Figure 2.
When one crystall izes from the glass, one expects an
increase i n the fold and crystall ine bands according t o their
behavior explained above.
crease and the non-crystallizable bands w i l l be unaffected.
The crystal l izable bands w i l l de-
I f
one n o w takes the semicrystalline polymer and treats it with a
reagent which will attack the "amorphous" areas, but w i l l not
penetrete the crystal l ine amas, one can assign the four types
of bands. The fold band will decrease, the crystal l ine band
w i l l be unaffected, the crystall izable band w i l l decrease and,
again, the non-crystallizable band will remain unaffected.
Thus, the fold band can be isolated and assigned as a result of
these two treatments.
It is also possible t o assign these four types of bands
by s tar t ing with a semicrystalline polymer. Melting w i l l cause
a decrease i n the fo ld and crystall ine bands and an increase i n
the crystal l izable band.
unaffected.
t a l l i n e regions should elongate causing an increase i n crystal-
l i n i t y a t the expense of the fold.
The non-crystallizable band will be
Annealing the semicrystalline polymer, the crys-
The method outlined above w i l l be used t o analyze the
spectra of polyethylene terephthalate fo r a band ar is ing from
12
I C 1
I

i - 13
the folded molecule. Evidence w i l l show the 988 an’’ band is
such a fold band. Then, having found such a band, we propose
to study crystallization and defolmation i n PET with regard t o
the effect upon the folds. F m these results, we hope to
infer mechanisms for these processes in PET,

2% ?erMn-Elmer
&he all the polymer
521 infrared spectrcmeter, was used to
samples. The solid t o molten transi-
t ion was studied using a heating cell, attached t o a-taspema-
ture controller, in the sample compartment of the instrument.
The stretching experiments w e r e carried out by means
of an Instron tester.
required a set of rubber jaws t o prevent tear i n the sample.
The DuPont 900 Differential Thennal Analyzer was used
The very thin samples, which w e r e used,
t o chamcterize all samples. The D.T.A. was useful i n asceF-
taining the crystal l ine or amorphous character of some of the
samples,
samples under study - i n particular, the samples of oligomers,
w h i c h w e r e not prepared i n our own laboratory.
It was also useful i n checking the purity of the
satall angle x-ray results w e r e obtained on the Rigaku-
D e n k i unit , Which i s equipped w i t h a rotating anode allowing a
much more intense beam on the sample, The uni t is attached t o
a recorder which allows one t o scan the region of interest ,
The annealing experiments w e r e carried out using a
specially designed c e l l .
tubing and was f i t t e d with valves to allow quick heat transfer
and a dry nitrogen purge.
The cell was made of thin aluminum
14
I - I - .
I I I ' I ~I ~
I I I I I I
I
I I I I I I
15
Sample Prepanation
Solution crystallized PET w a s obtained from two differ-
ent solvents, under several conditions of crystall ization. One
set of crystals was grown isothemally from a 0.1% solution of
dinethyl phthalate at 13OoC.
grown frola a 0.1% solution of PET i n 242-BUtoxy ethoxy)
ethanol by slowly cooling from the boiling point of the solvent.
A f ina l set w a s grown isothermally from a 1% solution of
2-(2-Butoxy ethoxy) ethanol a t 190°C. This was close t o the
temperature that the maximum rate of crystal l izat ion occurs.
It is necessary t o grow the crystals j u s t p r ior t o use since
hydrolysis occurs i f they are stored f o r any length of t h e .
The second set of crystals was
The study of oligomers of PET was very important i n the
analysis of the spectra. Our oligomer samples were obtained
from several different sources:
1) l i nea r trimers w e r e obtained from the Mobil
Chemical Company, the Goodyear Company and by A. Miyake.
2 ) a l inear oligomer with a DP of 5 was provided
by Y. Yamashita and by M. Ishibashi.
3) a linear oligomer with an average DP of 10-20
was also provided by M. Ishibashi.
4) f inal ly , a prepolymer of commercial PE2 with
an average DP equal t o 15-20 was provided by C. Heffelfinger
of the E. I. duPont Company.
All of the solution crystall ized samples and oligomers
‘ I I- 16
w e r e analyzed by preparing KBr pel le t s and running them using
a beam condenser made of KBr lenses.
M e l t crystall ized samples w e r e prepared by sandwiching
very th in f i lm between rolled s i lve r chloride.
then pressed causing f low of th Am, w h i c h completely en-
compassed the polymer f i l m . The film w a s melted w h i l e embedded
This unit was
i n this A g C l matrix which prevented f low and kept the sample
a t the same thickness as the original film sample.
mer was then allowed t o slowly cool - folming a coherent, very
thin film of m e l t crystallized PET.
The poly-
The annealing experiments were perfomed on solution
cast amorphous filrns which were obtained from C. Heffelfinger
of t he E. I. duPont -any.
tetzachloroethylene-phenol solution and had a number average
molecular weight of about 15,000 gms/mole.
analyzed by DTa and x-ray t o verify their completely amorphous
character.
t a l l i za t ion fmn the glass.
These films w e r e cast from a
They were i n i t i a l l y
An exothem amund l l 5 O C i n the DTA indicates crys-
Base Line Study
Before performing any quantitative study on the spectra,
it was f i r s t necessary to detemine which baselines gave the
most accurate and reproducible results.
ion was used t o select the baselines. A band was found a t
1955 an’’ which is isolated from all other bands i n the sgec-
The following criter-

17
1 I II I I I
I a I 1 I I I I I I
a
trura.
band. Samples of various thicknesses, having the identical pre-
paration (annaed a t 200'~ for a half hour) were analyzed.
The various baselines t o be tested were drawn and the mtio of
the absorbance of the band to the 1955 cm'' band was calculated,
Those baselines which gave the most reproducible results are
shown in Figure 3. These baselines w e r e used for all subse-
quent calculations.
Only one reasonable baseline could be dram for this

I . I * .
~
I I I I I N i i I i B I I 1 B 1 B
18
NOISSIHISNWtll x

I - I - .
1 I I I (I
I I I I I I I I I I I I
Non-Crystalline Sass, les
~ y s i s of the glass and m e l t spectra shed strong
amorphous bands a t 896 an’’ and a t 1042 an”. Most of the
bands which have been assigned as crystal l ine conformation
bands w e r e very weak. No new bands appeared i n these spectra.
M e l t and Solution h‘ystallized Samples
M e l t and solution crystallized samples of polyethylene
terephthalate, as had previously been shown (24), are highly
crystal l ine and contain a high degree of folding. The sharp
wide angle x-ray pattern shown i n Figure 4 indicates the high
degree of c rys ta l l in i ty i n these samples.
bands a t 973 an’’ and 848 an’’ were quite intense.
two bands appeared i n the spectra a t 988 an‘’ and 1380 an-’
which had been reported previously only by Miyake ( 2 5 ) ,
The crystal l ine
I n addition,
Fig-
ures 5 and 6 show these two bands i n the solution and m e l t
crystall ized samples, as well as the i r absence i n the non-
crystal l ine samples. Table 2 gives a quantitgtive measure of
the relat ive 973 an-’ and 988 cm’l absorbances i n m e l t and
solution crystall ized samples.
Annealinq Studies
We annealed the amorphous films of PET a t temperatures
19

I I I I I D I I I
20
Figure 4 Wide Angle X-ray Pat te rn of Crys ta l l ine PET

I * _
I I I I I I I I I I I I I I I I I
21
tn W
cn f
I
In a, k 3 b,

I .
I I I I I I I I I I I I I I I I I
1 -.
-
22
9 b k
L
E s a

I . 23
n
f;: E 0 v
. N N cv N r l d
h I-l 0 0 0 73
N r( rf rl
a Q) N 4
n u m rl
00 W
73 N
a Q) N ;;1
U d E V
r(
k % E V
rl
; c, 0)
5 rl 0 pc c,
E n
2 u 4 2 n
Q) a n
n n h x Q) u E 0
ro m a 0 co rl U
0 W
H
r 3 W pc

1 - 24
I ‘
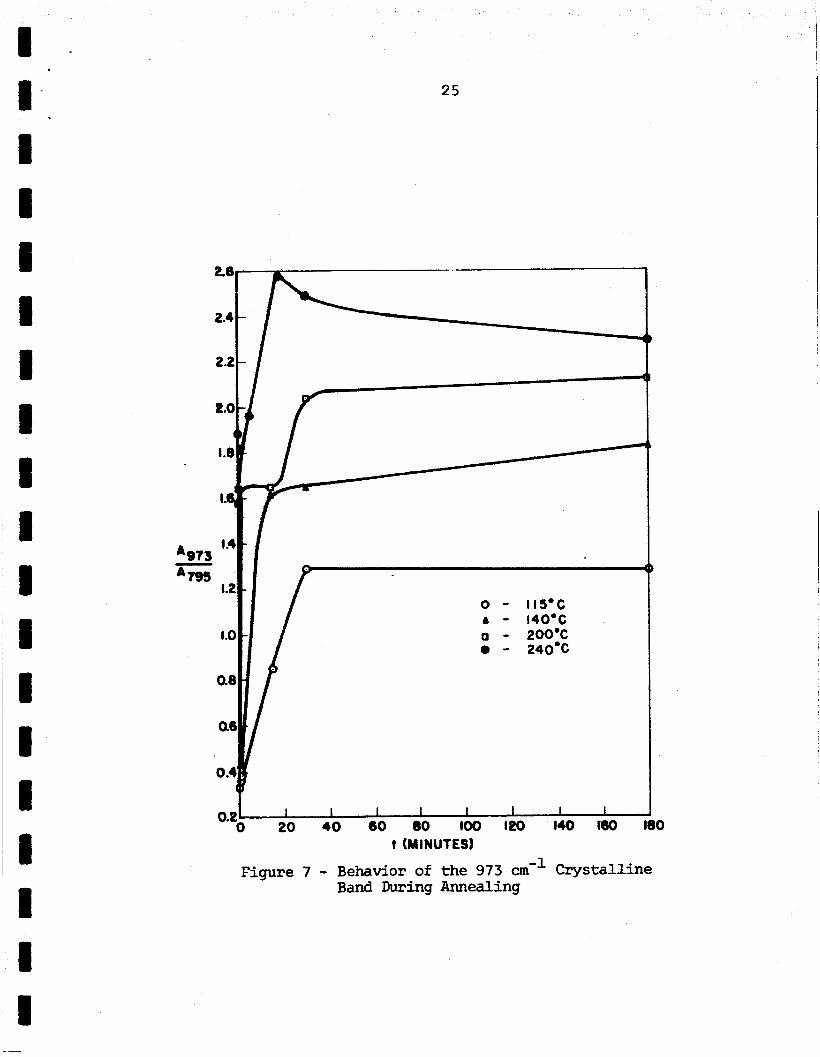
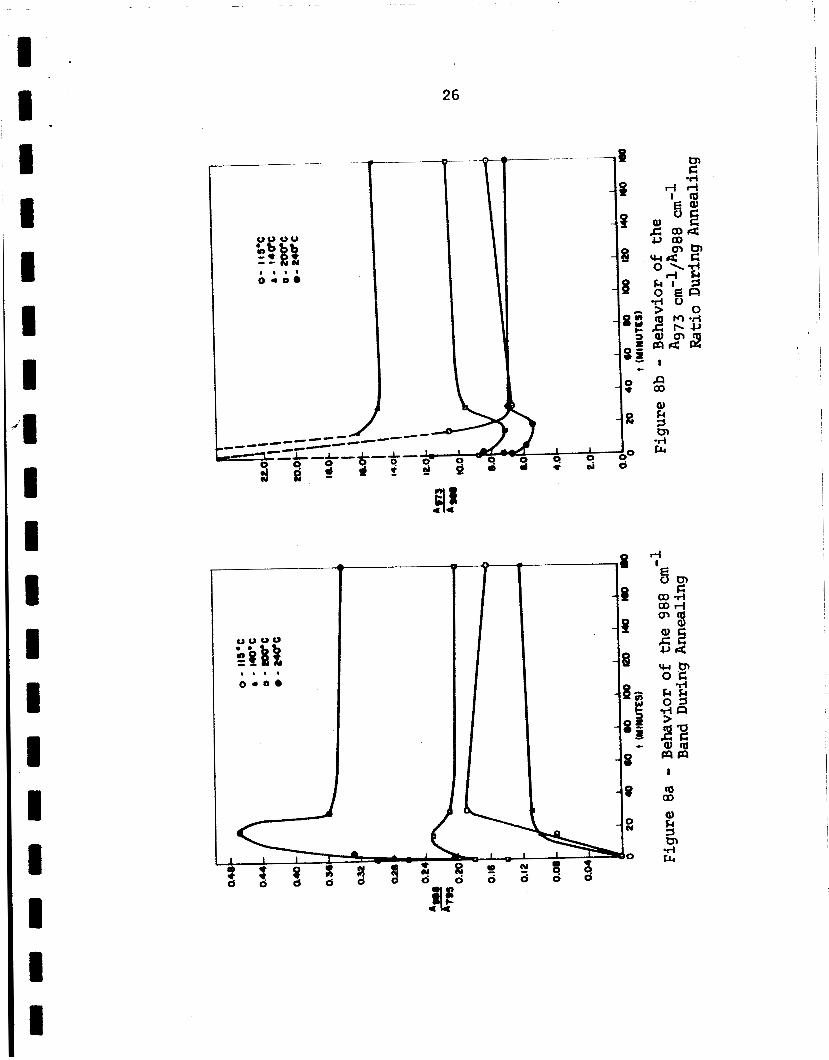
of 115OC, 14OoC, 2OO0C and 240OC. The behavior of the band a t
973 an’’ with annealing t h e i s shown i n Figure 7 . (We divide
by the internal thickness band a t 795 on’’ i n order to compare
samples of various thickness on the same basis.) The observed
b&dv50r i s typical of a clystal l ine band i n crystal l izat ion
from the glass.
988 CUI-’ band, while Figure 8b compares the 973 ano1 and
988 an’’ bands.
values for the 1380 an’’ band as a function of annealing time,
while Figure 9b gives the ra t io of the 973 an’’ and 1380 on-’
bands. One expects two crystalline bands t o vary i n the same
manner, and the natio should be re lat ively constant as a func-
t i on of annealing time.
the 988 an” and 1380 em’’ bands a s shown by Figures 8b and 9b.
The 1380 an‘’ band seems t o vary i n the same manner as the
973 cm-l crystal l ine band while the 988 cm’’ band obviously
does not.
Figure 8a shows the same ra t io for the
Likewise, Figure 9a shows the absorbance
Notice the difference i n behavior of
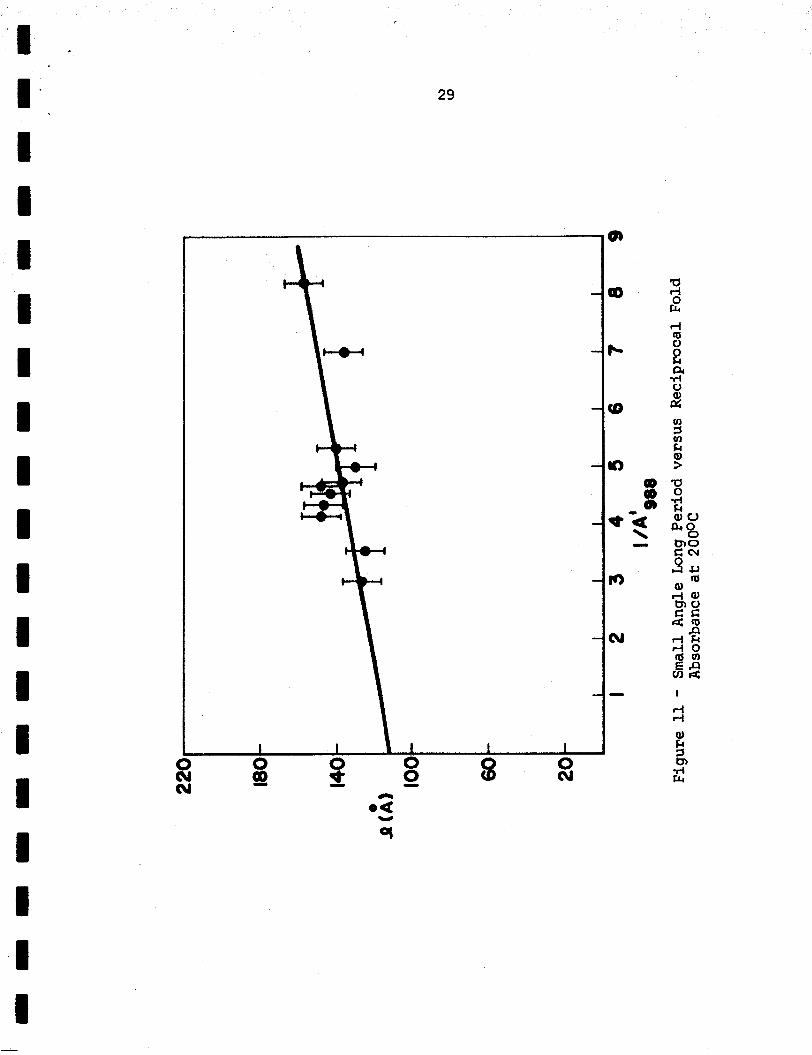
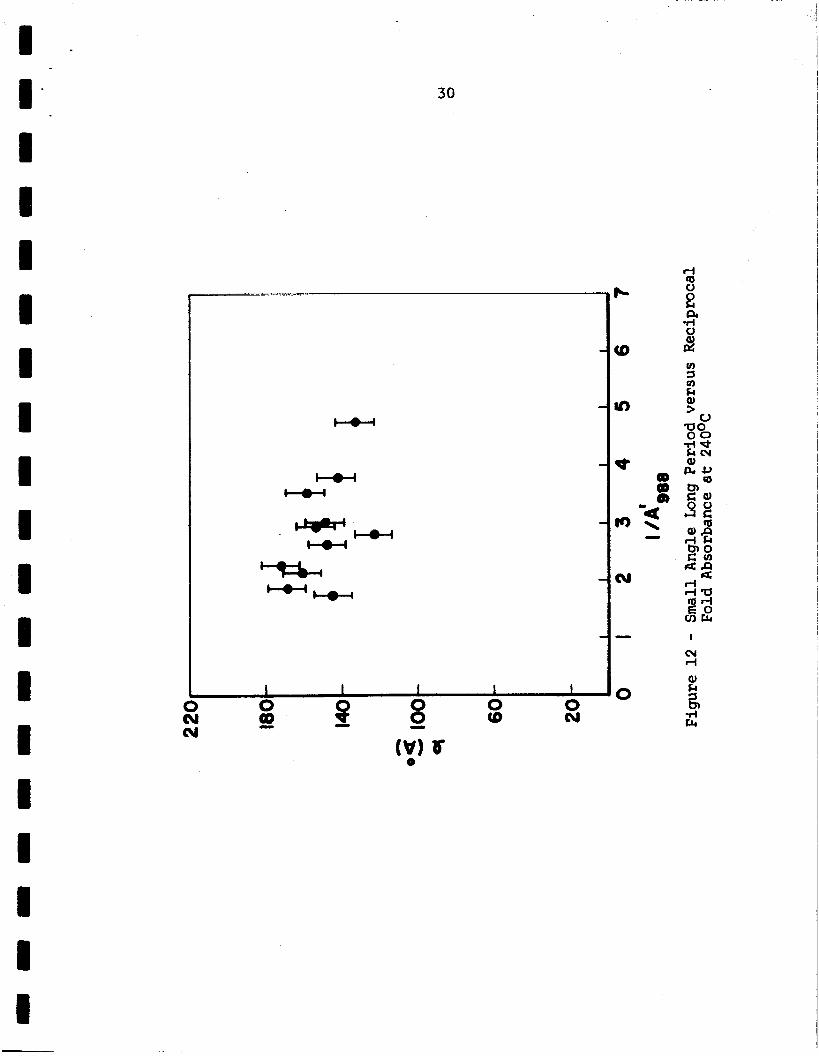
Small angle x-ray results w e r e obtained for a l l the
annealed samples.
against the reciprocal of the absorbance of the 988 ano1 band
a t the various temperatures are shown i n Figures 10, 11, and
12. A clearly defined peak could not be obtained for the sam-
ples annealed a t l JSoC, so no correlation could be obtained a t
t h i s temperature. A t temperatures above 200°C the data showed
quite a b i t of scattering.
The results of the x-my long period plotted
Further study of the small angle
25
4 t.8'
U I
I
1.0
a
c
QA
Figure 7 - Behavior of the 973 cm'l Crystalline Band During Annealing
1 . I i 1
1 .I I 1 I I I I I I I I I
n
26
‘ i I
I
cg a> Q,
m 4 tcr
Y

27
I
- 0

28
ul I ul & Q) > a 0 ri & Q) [L
ri F
I I- I I I I I I I I I I I I I I 1 I I
29
I .
-- m
30
u)
rz)
cu
-
0
1 .
1 I U 1 I I I I I U
results shows the appearance of a second peak above 20OoC. In
order t o verify that this second peak was real, a step scan was
run on one of the samples. The x-ray was placed a t a certain
angle reading, counts were recorded fo r 1000 seconds and a new
angle set.
the data since so many counts w e r e recorded.
Wds step scan esseneially el-hinated the noise in
The results of
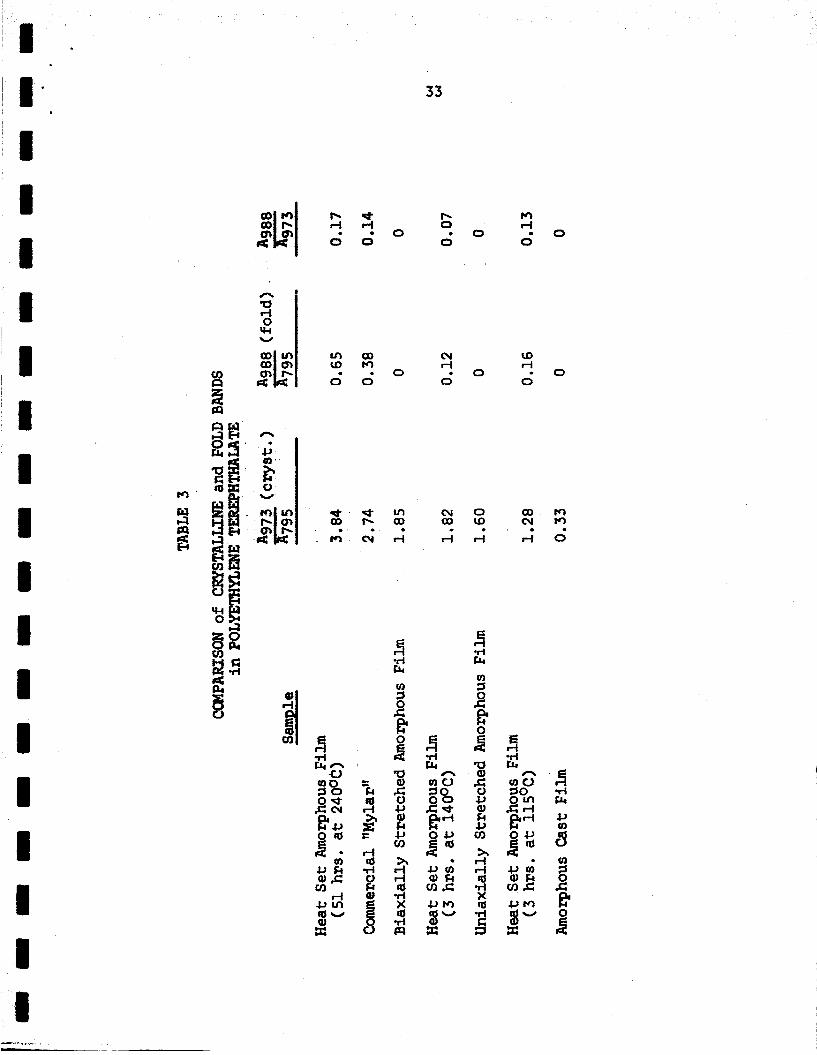
the scan showing two peaks a r e shown i n Figure 13. The effect
of annealing fo r different times and temperatures are shown i n
Table 3, as compared t o other film samples.
Degradation
We carried out degradation experiments on solution crys-
tallized PET, which in i t i a l ly exhibited a very intense 988 cm'l
band. Famw (26) previously did an extensive study on PET but
interpreted the results only i n terms of the wamorphous" and
crystal l ine content of the polymer. A 20% solution of methyla-
mine i n water was prepared and allowed t o come i n contact with
the polymer fo r times up tb 48 hours with continuous agitation.
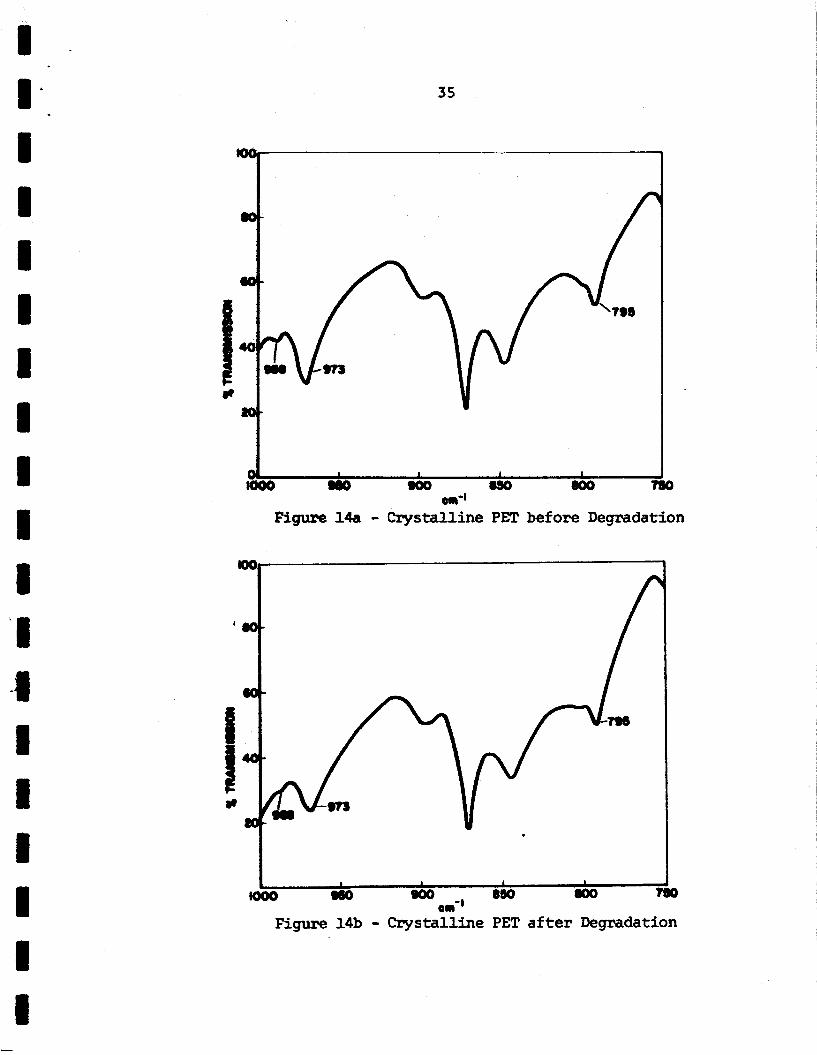
The results i n Table 4 show the 988 an'' band decreases with
time w h i l e the 973 ano1 band is not appreciably affected.
crystal l ine and amorphous band ratios a re sensit ive t o the f a c t
The
t h a t the 795 anof band is no longer a val id internal thickness
band.
spectra before and after d e p d a t i o n (Fig. 14).
degradation products i s obviously interfer ing with the 795 an''
This conclusion is quite obvious if one looks a t the
One of the

32
SlNn03
i
33
I , I 1 1 1 1 I II I
rc)
' i o 0
h * I
M ' " I
R
a m C U M
r l o * *
4 22 5
TI Clc
m
R
1 I I I I
L E id rl
E i? z
c, cn x rt rl a VI X rp
3
h l-i rt 0 rl X cd VI PI
WJU, sF4 cns
UM U M 3" X
illw X

34
1 1 I 1 1 1 I I 1
- I
E 0 U
n W 4 0 YI v
0
35
Figure 14a - Crystalline PET before Degradation
F i g u r e 14b - Crystalline PET after Degradation
~-
I - I * -
I I I I I
, ‘
36
band.
band by the 973 ano1 band. The r a t io is plotted i n Figure 15.
The x-ray results of Farrow have shown that the crystal l ine
amas are not attacked initially.
this l o t io as shown in the p l o t re f lec ts the decrcagc in the
988 amo1 band as a function of time.
1380 an’’ band t o the 973 cmol band, on the other hand, does
not show such a decrease (Fig. 16).
This diff icul ty is mininu ed by dividing the 988 cm’l
Therefore, the decrease i n
The ra t io of the
This ra t io is relatively
constant and indicates that the 1380 an-’ band is constant
during the degradation process.
O l i q o m e r s
The 988 an’’ and 1380 ano1 bands a% also observed i n
the crystal l ine low molecular weight oligomers.
band did not show the same dec rease upon d e p d a t i o n i n the
The 988 cut’’
oligomers tha t it did i n the polymer.
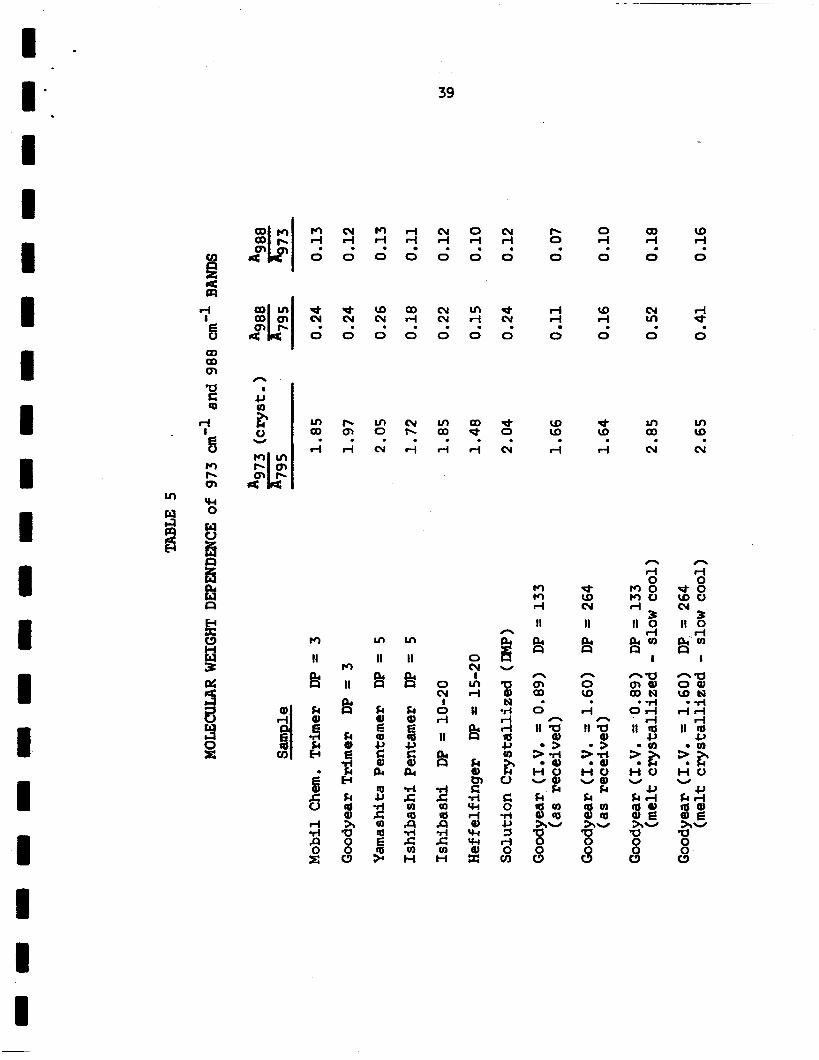
973 ar’l band i n the oligomers are shown in’Table 5 for PET <.
having a wide m g e of molecular weights.
Relative values for the
Strain Induced Crystallieation
A n experiment was run i n which PET was crystallized
similar to the commercial ”Mylar“ process.
was stretched t o 450% elongation. The crystall ine band a t
973 an‘’ was quite intense while the bands a t 988 car’’ and
1380 ca-l were absent. The film was subsequently annealed
w h i l e st i l l i n tension a t 2OO0C i n the MCU& oven.
A n amorphous film
_- As a

I
W
O S a 0
37
~ i I’
I I I I I I I I i I 1 1 1 1
30
0
0
K i= a
u)
I
cb
0
q E a a
OJ 9 0 0 0 0 0 a ! Q c! -
39
M rl 0 . 3
0
M rl 0
ri d 0
cv rl 0
0 rl 0 s
01 rl 0 . +
0
0
0 rl 0
aD CD ri rl 0 0
0 9
R H 2
(D cv 0
a0 4 0 . e cv
0 9
rl d 0
3 E u
z 0
cv cv 0
m rt 0 s
(D 4 0
cy rl VI * 0 0 0
n P $ v
0 U $ 1 ln OD
rl
3 8
m 0
cy b
1
ln a0
rl
OD e rl
* 0
e CD
4
VI m OD CD
cy cv 01 (v
R
M PI Q,
m y1 0
n n ri 0 * o
CDU cy 3
11 0
M tr) 4 11
* CD cy
11 li B 3 n M B II
& 0 01
I L n 4 U
I
-a m a ODN
M
I1
&
U
J f3 3 0 E
0 01
I 0 rl 11
I3
k 4) E
Lc
k
. p1
RI JJ
1.I 2 CR
rl JJ I rl 0 v)
40
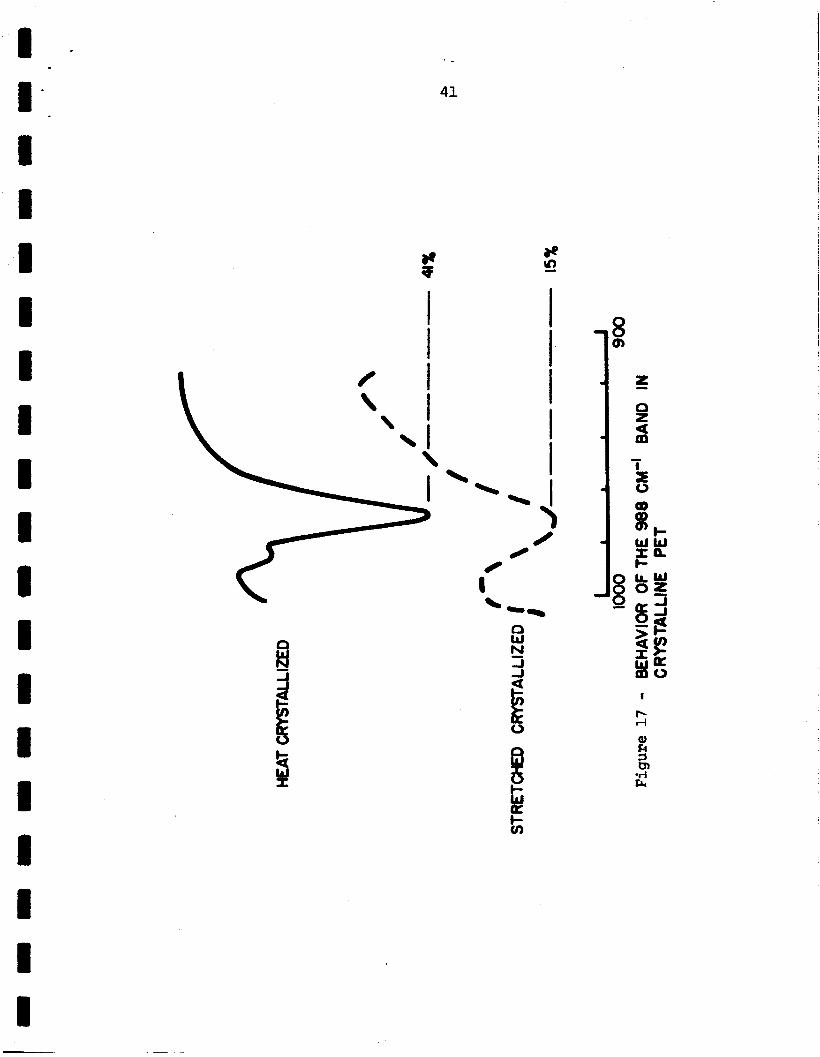
result of this treatment, the 973 an’’ band increased s l igh t ly
and the bands at 988
of the 988 ano1 band
shown i n Figure 17.
m’l.and 1380 uu-l appeared. The region
before and a f t e r the annealing pmcess i s
I n order to study defonnation mechanisms i n crystal l ine
polymers, we perfonned a sequence of treatments on the same
polymer sample and measured the changes which occurred.
was f i r s t stretched t o 430% elongation.
973 ano1 region is shown i n Figure 18a.
annealed w h i l e s t i l l in tension.
988 un-l‘baurd appears. This very crystal l ine sample was re-
stretched another 50% giving now a t o t a l elongation of 645%.
Analysis of the spectrrmn (Fig. 18c) shows that the 988 an’’
band has disappeared and the band width of the 973 an” band
has increased significantly.
sample, a t 14OoC for a half hour, again produces the 988 an’’
band and a sharpening of the band a t 973 CUI-’ (Fig. 18d).
quantitative absorbance values of the 973 tmol and 988 an-’
A film
The spectnan of the
The sample was then
Figure 18b shows that the
Reannealing of the strained
The
bands as w e l l as their mtio w e r e calculated. These values are
shown i n Table 6.
measured by the 973 cm” band steadily increases during the
The relat ive amount of c rys ta l l in i ty as
experiment . Absorbance values were calculated for a l l the poly-
I - I' I 1 I I I I I I I I I I 1 I I 1 i
* -
41

1 I - _
1 I I I I I I I 1 I I I I I I i I
100
80
6C
4c
2c
C
42
I000 950 c m-1
900
Figure 18 - Deformation Studies Upon PET. Film

Sample
43
TABLE 6
- A973 (cryst.) A988 (fold) - A988 A795 A795 A973
a) Amorphous Film 0.33 0 0
b) Sample (a) Stretched 430% 1.28 0 0
d) Sample ( c ) Stretched 50% 1.76 0 0
e) Sample (d) Annealed at 140% - k hour 1.89 0.2s 0.13
44
ethylene terephthalate samples which had been analyzed.
2 shows the data for the solution and m e l t crystallized s a -
ples, while the results for the films under different t h e m
and mechanical condit$ons are shown in Table 3.
Table
I . ,
I Band Assltzment
The analysis scheme proposed tc assign a band to a fold
The annealing and degradation structure is shown i n Figure 2.
eqeriments have been perfonned and the results presented.
Figures 8a and 8b show the behavior of the 988 ~1-l band as a
function of time during the annealing process, w h i l e Figures 9a
and 9b show the behavior of the 1380 an‘’ band. Both bands
show an increase with t h e indicating a crystal l ine or fold
assigrlnent, although the i r respective natios with the 973 an-’
crystal l ine band show a difference. One of the distinguishing
factors betwem crystal l ine and fold bands i s the i r behavior
upon degradation.
allinity that i n i t i a l l y the crystal l ine areas a re not attacked
during the depadation process.
bance to the 973 cm’l absorbance (Fig. 15) decreases mthe r
abruptly indicating that the 988 cm’l band can be assigned to
a fold confonaation,
stages of degradation indicates there is very l i t t l e folding
Farrow (26) has already shown by x-ray cryst-
The ra t io of 988 eta-’ absor-
The lev&ing off o f the ratio i n the l a t e r L
l e f t and the crystall ine areas a re slowly being attacked. The
natio of the 1380 an’’ band to the 973 an’’ band i s relat ively
constan$ over the time of the experiment, as shown i n Figure 16.
This indicates the stmetulle giving rise t o the 1380 car’’ band
45
46
1 I I I I I I I I I I I 1 I I I 1
i s changing i n the same manner as the 973 uno' band, so a crys-
t a l l i n e band assignment for the 1380 uno' band can be made. We
w e r e not able t o fur ther verify these assignments by the second
independent means, i .e. , m e l t i n g and annealing of the semicrys-
t a l l i n e polymer, s W e thermal degradatfon tcok place a t the
high temperatures.
t o j u s t i fy both the assignment of the 988 an'' band t o the fold
and examination of crystall ine systems w i t h the band assignment.
However, sufficient evidence has accumulated
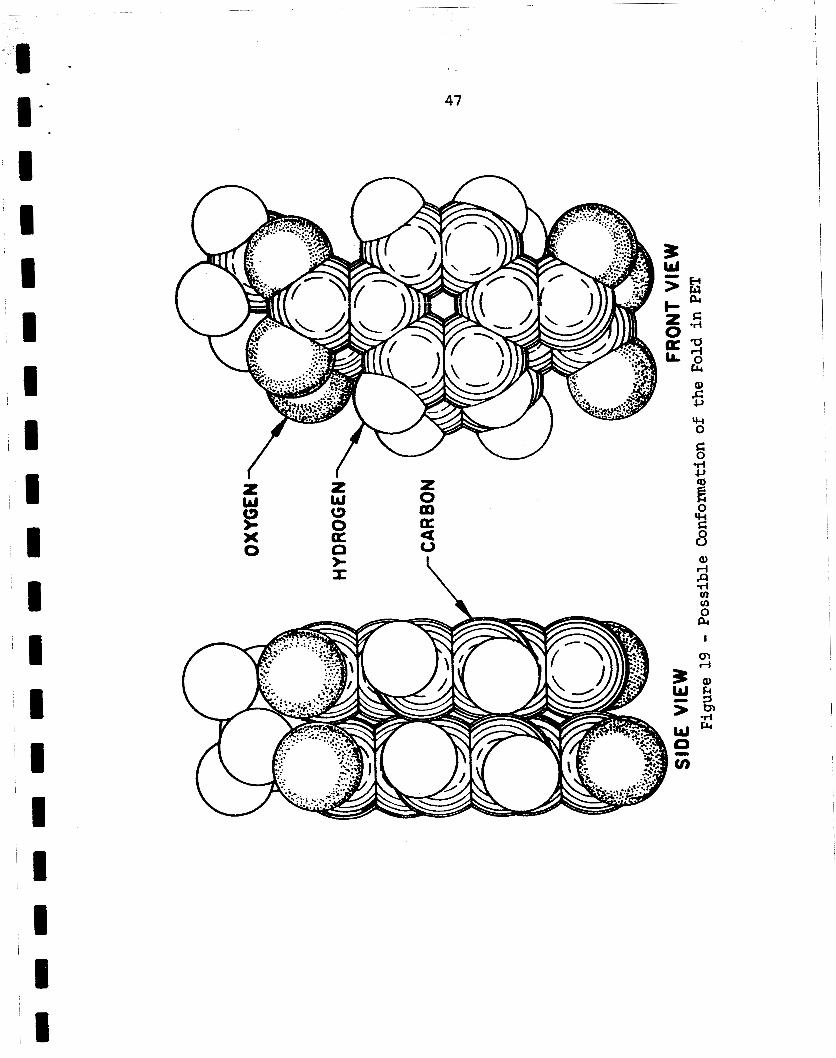
Structure of the Fold i n PET
Having assigned the band a t 988 ano1 t o the fold, w e
would like t o relate it to a particular confomation. Because
of the length of the repeat unit, the effect of coupling should
be minimal. Therefore, a unique conformation of the fold not
e a s i l y accessible t o the disordered chain i s demanded, Figure
19 shows one possible conformation which is not easily accessi-
ble t o the chain, but sa t i s f ies the requirement of a regular,
adjacent re-entry fold model.
also arise from the loose-loop and "switchboard" fold models.
However, these conformations wuld appear t o be acceslible t o
the d i s o r d e m chain-and would absorb a s crystal l izable bands
Strained conformations would
i n the spectra. To date, insufficient work has been done t o
preclude these additional folding mechanisms i n PET.
The 988 an-1 Band i n the Linear Trimer
A band a t 988 ano1 also appears i n the linear t r i m e r .
2 W
% 9
47
3 W > c- 2 0 lL
.I
a
z 0 m
z w (3 0 a a a
0 0 0 t X
2; oi c; T i
P I-i 0 c4 a 5
a, k
Ti c4
B - 1' 48
We must, therefore, show the absorption arising from the trimer
is not sufficient t o be of concern i n our systems during the
process of annealing, degradation, and crystall ization,
are several fac ts worth considering:
There
1) Strong absorption h n d s in the spectra of the
l inear trimer are not present i n the polymer spectra.
2) The defonaation studies show t h a t the fonnation
of trimer i s not a factor. The fold band appeared upon anneal-
ing, disappeared upon stretching and reappeared once again upon
annealing,
species such as the linear trimer by such treatments.
One cannot simply create and destroy a chemical
3) Breaking bonds simply by heating the polymer
his is t o a temperature of UOOC to form trimer is remote.
the tempemture a t which the fold band f i r s t appears upon crys-
ta l l izat ion.
4) It is a known f ac t t h a t polyethylene tereph-
thalate mmally contains low molecular weight materials corn-
pr is ing about 1.3 - 1.7% of the polymer sample. This low
molecular weight material is the result of an equilibrium
established i n the m e l t , Goodman and Nesbitt ( 2 7 ) have ex-
trvrcted all the low molecular weight material, remelted the
polymer, crystall ized and obtained once again precisely the
same percentage of low molecular weight material that they had
previously extracted. This small amount of material could not
possibly produce a detectable amount of the very weak band a t
I - 49
988 a''.
The trimer i s not long enough t o fold. The structure
giving rise t o the 988 an'' band i n the trimer did not suffer
any significant change during the degradation. Therefore, w e
conclude that the ccrfomation i n the l i nea r trimer gives rise
t o a different mode than the vibration giving r i s e t o the
988 ern-' band i n the folded polymer chain.
Melt and Solution Crystallized Samples
The PET grown from solution and from the m e l t have a
large degree of folding, as evidenced by the very intense band
a t 988 cm' l , shown i n Figure 5.
i n Table 2 give a quantitative measure of the absorbance.
While one cannot obtain an absolute value f o r the amount of
folding, the relative values a re useful.
t a l l i zed by very slowly cooling from the melt contain a large
The absorbance values, shown
Samples of PET crys-
degree of folding as measured by the 988 an-' band, i n agree-
m e n t with current concepts of crystall ization. Solution grown
crystals were observed to be spheruli t ic i n nature. These
samples also had large degrees of folding a s measured by the
988 an-' band. Crystals were grown from 2-(2-Butoxy ethoxy)
ethanol under two se ts of conditions. Those grown isothermally
a t 190°C contained a larger amount of folding (0.25) than those
grown by slowly cooling from the boiling point of the solvent
(0.17). These l a t t e r crystals probably a l l crystall ized

50
above 190°C with a larger fold period than the isothennally
grown crystals. The as-polymerized high I.V. PET which had
been received from the Goodyear Tire and Rubber Company had a
re lat ively small amount of folding, probably due t o the solid
state polymerization process.
slowly crystall izing it from the melt, the molecules recrystal-
l i z e t o a state containing a large degree of folding. The be-
havior of the 988 c m ' l band i n both m e l t and solution crystal-
l i zed samples i s consistent with current theories of fold for-
mation.
Upon melting the smpie and
Annealinq Studies
The annealing results f o r the 973 cm'l c rystal l ine band
a s a function of time a re shown i n Figure 7. The intensity
i n i t i a l l y increases sharply and then more slowly with time.
The amount of crystal l ini ty i s higher a t higher annealing tem-
peratures. We asswne subsequent t o the i n i t i a l crystal l izat ion
annealing occurs only i n t h e crystal l ine regions already formed,
but no fur ther crystall ization occurs. The annealing would pro-
duce an increase in the long period a t the expense of the Folds.
A l i nea r correlation of the small angle long period with the
reciprocal of the fold concentration is expected. Figure 10
shows that while a l i nea r relationship i s obtained a t 14OoC,
w e do not obtain a large enough change i n the long period t o
note any trends. Above 2OO0C w e do not find the l inea r rela-
1 - 51
tionship anticipated (Figs. 11 and 12) .
plicated by secondary crystallization.
angle long period peak appears i n these samples (Fig. 13).
Mayhan (28) postulated secondary crystal l izat ion above 2OO0C
f m . M s density measuments. His results (Fig. 2 0 ) show a
s l igh t increase i n the limiting density between l lO°C and 2OO0C
with a rather sharp increase above this temperature. These
density results a re completely consistent with the limiting
values of the 973 an’’ band as a measure of crystal l ini ty .
These results a re com-
An additional small
The ratio of the crystal l ini ty t o the folding as shown
by Figure 8b exhibits some reverses. A priori,we would expect
that crystall ization a t a higher temperature should produce a
larger fold period, and therefore a larger ratio of crystal-
l i n i t y t o folding. This i s observed f o r crystall ization a t
115OC and 140OC. A t 2OO0C and 24OoC, however, one obtains a
much larger amount of folding than i s warranted by this assump-
tion. We postulate the following behavior. Crystallization
f r o m the glass occurs by a collapse of adjacent polymer chains
in to a crystal l ine cell.
function of the order i n the glass and the thermal mobility of
the chains. A t lower temperatures, where the thermal mobility
i s low, perfection of the crystal l ini ty i s restricted by the
inabi l i ty of the chains t o diffuse together; large loops of
uncrystallized chains can result.
have suff ic ient energy t o collapse t o the regular fold struc-
The degree of c rys ta l l in i ty i s a
Only a portion of them w i l l

I - ~ 1’ 52
W W z 0 N

53
ture demanded by 988 an'' band.
the mobility of the chain i s greater, the large loops perfect
themselves unt i l the restricted confomt ion measured by the
988 ano1 band is fonned. Therefore, a t 2OO0C and 24OoC, one
obtains a more intense 38% cm'l band i n relation t o the crys-
tal l inity.
A t higher temperatures, where
O l i q o m e r s
The values of the 988 an-' band absorbances for the
DP = 3 and IF = 5 Samples, as shown i n Table 5, do not repre-
sent the fold structure and can be used only i n comparison t o
the other samples.
depending upon the manner of crystall ization.
solution crystall ized samples show the greatest amounts of fold-
ing, i n agreement with the current theories of crystall ization.
The folding i n the remaining samples varies
The m e l t and
Strain Induced Crystallization
Crystallization studies of drawn films, shown i n Figure
17, indicate that, before annealing, crystal l izat ion occurs by
a folding type which i s not measured by the 988 an-' band. The
molecules are simply drawn t ight ly enough f o r large segments t o
come into la t t ice regis ter but the loop portions do not crystal-
l i z e sufficiently t o produce regular folds. When this sample,
while s t i l l in tension is heated above l lO°C, crystal l izat ion
continues wherever thermal motion i s large enough i n those
loop portions t o fonn a regular fold. I f one follows up the

1
I I 1 I I 1 I I I I I I I I I I I
54
drawing process by heating above 2OO0C, many more of the mole-
cules now have sufficient energy to form s regular fold, and an
increase i n the amount of folding i s observed as i n the anneal-
ing studies.
l i za t ion process i n oriented systems - when crystal l ine regions
are formed by stretching, along-loop type of fold occurs.
Heating the oriented fi lm generates additional mobility t o
allow these random length long-loop type folds t o become
regular; the degree of regularity depends upon the temperature.
This mechanism is similar to , but not precisely the same as,
the mechanism presented by Disnore and Statton (16) i n oriented
Hence, w e a r e proposing a model €or the crystal-
66-Nyl0n.
Deformation
The deformation results give an indication of the types
of changes occuring i n crystal l ine PET. Upon deformation of
the previously stretched and annealed polymer, w e observed a
disappearance of the 988 an-l fold band and a broadening of
the 973 cm'l band (Fig. lac), indicating both a loss of the
precise cmfonnation formed i n the fold and wider range of
interaction on the molecules which give rise t o t h i s 973 an''
band.
completely when one stretches the previously stretched and
While it i s unlikely that the folds are being destroyed
heat set polymer, the fold no longer ex is t s i n the same confor-
mation. Peter l in (15) has speculated that one obtains molecu-
55
I 1 I I I I I I I
I I I
l a r s l i p , chain tilt, or both i n the deformation of crystal l ine
polyethylene.
was precisely the same as before the second stretching, a s
shown quantitatively in Table 6 . This is consistent with the
above interpretation. The molecules a re not being pulled out
completely, causing the f o l d s t o be destroyed, but a re merely
being distorted.
i s introduced t o re-perfect the folding.
Upon annealing the PET, the amount of folding
During subsequent annealing, sufficient energy
Future Work
The assignment of the exact conformation producing the
988 cm'l fold band is desirable. This is accomplished by:
1) Nom1 Coordinate Analysis - it is hoped that
a computer program, which will allow one t o predict wave
lengths of vibrations i n simple molecules, i n simple polymers,
and f i n a l l y i n more complicated polymer molecules, such a s PET,
w i l l be written.
molecular conformation, as w e l l as the force constants, due t o
changes i n environment, and then predict an exact model f o r the
molecule under study.
Having such a program, one can vary the
2) Model compound studies will be useful i n deter-
mining the band assignment in two ways:
be possible t o obtain a model compound which w i l l simulate the
conformation i n the fold.
trimer which has a l l three ethylene oxide uni ts i n a gauche
f i r s t of a l l , it may
For example, one can obtain a cyclic
56
conformation, or a cyclic t e t m e r which has two t r ans units
and two gauche units. Secondly, the m o d e l colnpounds w i l l be
useful in set t ing up and testing band assigments i n the normal
coordinate analysis.
3) Deuteration studies on PET have been done i n
the past but the results have been inconsistent (29,30).
these results have not been used i n assigning the 988 cm'l band.
There is a possibi l i ty that this band ar ises from a vibration
involving the oxygen i n the chain backbone.
saturate the PET chain with s8 i n the glycol linkage, one
would observe sh i f t s i n those bands ar is ing from vibrations
involving this atom.
may be useful i n the band assignment.
Also,
I f one w e r e t o
Therefore, synthesis of 0l8 saturated PET
A quantitative measure of the long-loop irregular type.
folding i s possible.
measure this type folding.
A detailed study w i l l be perfomed t o
Further studies will be done i n verifying the modes of
crystal l izat ion and defomation i n oriented films. The effects
of percentage elongation, annealing conditions and pr ior treat-
ment w i l l be studied.
U -
1 1
I I I 1 I
The results of this study are consistent w i t h the
following caaclusions :
1) The band a t 988 ano1 arises due t o the require-
ments of the folded PET. molecule. The results are consistent
w i t h a unique highly regular confonnation.
2) High degrees of folding, as measured by the
988 an-’ band, are obtained by crystdll izing PET flcloen solution
or frarn the m e l t .
samples, one must anneal a e sample f o r long pebiods of *e - - ’Po effect high degrees of folding in glassy
a t re la t ive ly high tmeratures.
3) The a m d i n g of amorphous PET indicates the
Irregular folds fonned poss ib i l i ty of two types of folding.
a t the lower temperatures seem t o become regular when annealed
a t higher temperatures.
4) Strain induced crystal l izat ion does not produce
the regular fold as measured by the 988 cato1 band. Subsequent
annealing of these samples w i l l induce t h i s regular type
folding.
5) Deformation of a film containing regular folds,
as measured by the 988 cm-l band, causes this regularity t o be
disrupted and the band disappears.
perfects the folds.
Subsequent annealing re-
57

1 - I - -
I I 1 3.
4. Geil, P.H, , Polymer Sinqle Crystals, Interscience (1963).
HAegisch, W.D., and P.R. Swan, J. Appl. PWs-, z, 1906 (1960).
5.
6.
Kawai, T., J. Polymer Sc i . , Par t B, - 2, 429 (1964).
Bassett, D.C., Phil. Mdg., - 10, 595 (19W).
7 . Mandelkern, L., Cry s ta l l iza t ion of Polymers, McGraw Hill, (1964).
8. Bassett, D.C., F.C. Frank and A. K e l l e r , Phil. Mag., E, 1753 (1963).
11. Koenig, J.L. and D.E. Witenhafer, Makromol. Chem.
12.
13.
( i n print 1966).
Geil, P,H., J. Polymer Sci., Part A, - 2, 3813 (1964)- G e i l , P.B., J. Polymer Sei., Par t A, - 2, 3835 (1964).
14. G e i l , P.H., J. Polymer Sci., Par t A, 2, 3857 (1964). 15. Peterlin, A., J, Polymer Sci., Par t C, 2, 61 (1965). 16. Dismore, P.F., and W.O. Statton, Wont Report ( p r e p a t
1966) . 17. Disrnore, P.F., and W.O. Statton, J. Polymer Sci., E,
18. M i c h a e l s , A.S., and H.J. B i d e r , J. Polymer Sci., 50, 1113 (1964).
413 (1961).
58
1 - . 59
U I I
19. Xeller, A,, W, Matreyek and F.H. Winslow, J. Polymer Sci., - 62, 291 (1962).
20,
21.
22
23.
24.
25 . 26.
27.
Palmer, R.P., and A , J . Qbbold, Die Makro. them., 2, 174 (1964).
Takaymgk, M . , Faculty of Kyushu, - 23, NO. 1, 41 (1963).
Sinnott, K.M., J. Polymer S c i . , Part B, 3, No. 11, 945 (1965) ,
- Zerbi, G . , F, Ciampelli, and V. Zamboni, J. Polymer SCi., Part C, No, 7 , 141 (1963).
Yeh, G . , Case Institute of Technology, unpublished work, (personal communication) . Miyake, A . , J, Polymer S c i . , 38, 479 (1959). Farrow, G., D.A.S. Ravens, and I.M. Ward, Polymer, 3, 17 (1962).
-
Goodman, I. , and B.F. Nesbitt , Polymer, - 1, 384 (1960). 28, Mayhan, K.G., W.J. James, Wouter Bosch, J. Appl. Polymer
S c i . , 2, 3605 (1965). 29,
30.
Liang, C.Y., and S . Krimm, J. Mol. Spectr. , 3, 554 (1959).
Hiyake, A. , J . Polymer S c i . , 38, 497 (1959).