Embed Size (px)
Citation preview
David R. Harris
In the Eye of the Beholder: Observed Race andObserver Characteristics
PSC Research ReportReport No. 02-522
August 2002
POPULATION S TUDIES C ENTER
AT THE INSTITUTE FOR SOCIAL RESEARCH
UNIVERSITY OF MICHIGAN
PSC

PSC Publications Population Studies Center, University of Michiganhttp://www.psc.isr.umich.edu/pubs/ PO Box 1248, Ann Arbor, MI 48106-1248 USA
The Population Studies Center (PSC) at the University of Michigan is one of the oldestpopulation centers in the United States. Established in 1961 with a grant from the FordFoundation, the Center has a rich history as the main workplace for an interdisciplinarycommunity of scholars in the field of population studies. Today the Center is supported by aPopulation Research Center Core Grant from the National Institute of Child Health andHuman Development (NICHD) as well as by the University of Michigan, the National Instituteon Aging, the Hewlett Foundation, and the Mellon Foundation.
PSC Research Reports are prepublication working papers that report on currentdemographic research conducted by PSC associates and affiliates. These papers are written fortimely dissemination and are often later submitted for publication in scholarly journals. ThePSC Research Report Series was begun in 1981. Copyrights for all Reports are held by theauthors. Readers may quote from, copy, and distribute this work as long as the copyright holderand PSC are properly acknowledged and the original work is not altered.
In the Eye of the Beholder: Observed Race and Observer Characteristics*
David R. Harris, University of Michigan
* An earlier draft of this paper was presented at the 2002 annual meetings of the Population Association of America, Atlanta. Please direct all correspondence to David Harris, Institute for Social Research, University of Michigan, 426 Thompson Street, Ann Arbor, MI 48109-1248; [email protected]. Draft—July 1, 2002.

Abstract
Over the past decade there has been intense debate about racial categories, but surprisingly little discussion of racial categorization. Specifically, there has been little attention devoted to if, and how, characteristics of observers affect observed race. This is troubling because racial classification data are the foundation upon which scholarly studies of race, and policy initiatives to fight discrimination, rest. In this paper I present findings from a web-based survey that was designed to address gaps in our understanding of racial categorization. As part of the Study of Observed Race, 1,672 college freshmen were presented with photographs of individuals, and asked to identify each person’s race. Results indicate that observers’ race, sex, and familiarity with racial groups each influence how they classify by race, and that there are important interactions between observers’ characteristics. I close by discussing the implications of my findings for the 2000 census.

On April 1, 2000, the U.S. Census Bureau did something that was both revolutionary and
controversial. Rather than ask individuals to identify with a single racial group, the 2000 Census allowed people to identify with as many as six racial groups. Even casual observers of American racial classification realized that this was revolutionary, as it directly challenged the precedent that individuals identify with one, and only one, racial group. What was less obvious was just how controversial this change in racial classification procedures would be. When the race counts were released in early 2001, few were sure how to interpret these new data. Many wondered what it meant that people had identified with multiple racial groups? For others, there were very real concerns about how to use the data. Should those who identified with more than one racial group be reassigned to a single-race group? If so, how?
In order to make sense of the new census race data, it is imperative that one first understand that these data implicitly assume that the race people select for themselves, or that is selected for them by someone in their household, is the same race that would have been selected by any other observer in any other context. Previous work has challenged this assumption by arguing that self-identified race can vary by context (Harris and Sim 2002), and that self-identified and observer-identified race need not agree (Hahn, Mulinare, and Teutsch 1992; Harris and Sim 2000). In this paper I pursue a further challenge to the assumption of fixed racial classifications by examining if, and how, observed race varies by observer characteristics. If it is true that an individual’s race can be adequately described through self-reports, then observed race should not vary by observer. If observed race does vary by observer, and especially if it does so systematically, then there may be further reasons to question the census race counts.
This work is important for at least three reasons. First, it provides basic information about processes of racial classification. Second, the new census race question is part of a major change in how the federal government measures race. By 2003, all federal race data will be collected using the “one or more races” approach (Office of Management and Budget 1997). Furthermore, because organizations outside the federal government are also likely to adopt this new racial classification scheme, work that affects our understanding of the new census race data will have a broad impact. Third, because a central impetus for collecting race data is to enforce civil rights laws (Office of Management and Budget 1997), and much discrimination is based on observed race (e.g., racial profiling), it is imperative that we understand if, and how, race varies by observer. Failing to do so will limit our ability to effectively enforce civil rights laws.
Previous Research
In 1994, the National Academy of Sciences convened a workshop to examine federal standards for racial and ethnic classification (Edmonston et al. 1996). Among the many topics discussed were differences between self-identification and observer identification of race. Self-identification had been the preferred method of racial classification in the federal statistical system for nearly 20 years (Office of Management and Budget 1997), but observer identification was still being used in situations where self-identification was not feasible (e.g., death certificates). On this topic workshop participants concluded that:
Research is needed to assess data comparability between racial and ethnic identifications done by self-reports and observer reports. Such research is likely to improve the use of data based on self-reporting in relation to issues of discrimination, for which classification by others is usually of principal importance. Research in this area might be particularly important in the consideration of a multirace category. (Edmonston et al. 1996, p. 52)
2
Despite this call for research into the relationship between self-identified and observed race, few scholars have worked on this topic in recent years. This is unfortunate not only because such research would have proved useful in efforts to interpret Census 2000 data, but also because it would have informed recent debates about racial profiling data (Schweitzer 2001).
One recent study that does assess the relationship between self-identified and observed race is work by Harris and Sim (2000). They report that even when an interviewer’s observation of race is recorded after the respondent reports his or her race, there are still significant discrepancies between the two reports. In the National Longitudinal Study of Adolescent Health, only 67 percent of youth who identify as white and black, and then report that white is the single race that best describes them, are identified as white by interviewers. By contrast, 95 percent of white/black youth who report that black is their best single race are identified as black by interviewers.1
Although this work has advanced our understanding of racial classification patterns (Harris 2001; Schmitt 2001), it has a significant limitation. Each respondent was observed by only one interviewer, so these data cannot address the consistency of observed race across observers. Acknowledging that observed race might vary across observers is a critical first step in assessing the comparability of self-identified and observed race data. If we are to compare results from disparate datasets, and use data to enforce civil rights laws, we must take the next step of exploring how observed race varies across observers.
In advocating a focus on observed race I am not arguing that variation in observed race is a new phenomenon. There have always been Americans with fluid racial identities (Davis 1991), but the number of such individuals is likely greater now than at any other time in our nation’s history. Between 1980 and 2000, the share of the U.S. population that was either Asian or Latino doubled from 8 to 16 percent (Grieco and Cassidy 2001; U.S. Census Bureau 1994). Also during this period the percentage of marriages between people of different races more than tripled (U. S. Census Bureau 1998). As a result, the number of Americans who cannot easily be placed on one side of the traditional American racial divide (i.e., black or white) is increasing rapidly.
Several theories make connections between observed race and characteristics of the observer. One line of research argues that racial contexts have a significant impact on how people interpret racial cues (Eberhardt and Banaszynski 2000; Hirschfeld 1996; Pettigrew, Allport, and Barnett 1958; Waters 1990). According to these scholars, the process of social categorization involves first attempting to assign stimuli to familiar categories. Only when no familiar category seems plausible are stimuli assigned to unfamiliar categories. Contexts are an important part of this argument because they determine which categories are familiar. When this general theory is applied to racial classification, it suggests that patterns of observed race should vary according to the racial composition of observers’ contexts. It also suggests that observers from diverse contexts should have a more difficult time completing racial categorization tasks because they are familiar with more racial groups, and must therefore discriminate between a larger number of salient alternatives.
Hypothesis 1: Observers disproportionately classify other people into racial groups that are prominent in the observers’ social contexts. Hypothesis 2: Observers from racially-diverse social contexts require more time to assign a race to other people than do observers from homogeneous settings.
A second line of work argues that race of observer affects observed race. In part, this
relationship derives from the persistence of racial segregation in American society (Massey 2001). Segregation insures that an individual’s own race will affect the race of his or her neighbors, friends, classmates, and coworkers. If racial contexts affect observed race, then segregation produces an indirect effect of observers’ race on observed race. 1 In this paper, A/B refers to multiracials who identify as A and B.

3
Hypothesis 3: Race of observer affects observed race.
Hypothesis 3a: Race of observer affects observed race through its influence on the racial composition of contexts.
An alternative explanation for observers’ race effects builds on the tendency for people from
different racial groups to perceive similar racial contexts in dissimilar ways. Here observers’ race affects observed race directly, rather than through racial contexts. Support for this argument appears in Frankenberg’s (1993) work on gender and racial identity. Based on intensive interviews with white women, she concludes that many whites lack racial consciousness, by which she means that they are not cognizant of the privileges whiteness affords them in everyday life, or the burdens it creates for nonwhites. Davis (1991) also identifies racial differences in how race is perceived. He argues that because the children of black-white couples have traditionally resided in black communities, blacks have developed a heightened sensitivity to the subtleties of race (see also Parker 1999).
Hypothesis 3b: The effect of racial contexts on observed race varies by race of the observer.
Yet a third line of work posits a relationship between observers’ gender and his or her
perceptions of race. Recent research finds that girls are more likely than boys to identify as multiracial (Corrin and Cook 1999; Harris 2002). Schuman and his colleagues (1997) report that on most racial attitude items, white women offer more liberal responses than do white men. Johnson and Marini (1998) extend this work on gender and racial attitudes. They find that women are more willing than men to have social relationships with people of other races, and that gender differences are more pronounced among whites than blacks. Their research suggests that these differences are due to gendered socialization—girls are encouraged to think of others; boys are taught to think of themselves. Johnson and Marini doubt that women translate personal experiences of sexism into an understanding of racism, but are unable to definitively rule out this alternative hypothesis.
Hypothesis 4: Women are more likely than men to classify other people into nontraditional racial groups—Asian, Latino, and especially multiracial. Hypothesis 5: Women require more time than men to assign a race to other people.
Although theory provides compelling arguments for how and why observers’ characteristics
might affect observed race, surprisingly little empirical research examines these hypotheses directly. Waters (1990; 1999) finds that observers’ familiarity with ethnic groups affects their perceptions of blacks’ and whites’ ethnic identities, but her work does not examine whether these same processes also affect observed race. Of greater relevance is a series of social psychological studies that examine racial categorization.2 Pettigrew, Allport, and Barnett (1958) initiated this line of research with a study of observed race in South Africa. Their methodology involved the use of a stereoscope, which is a device that presents distinct images to the right and left eye, and then blends them so that respondents see only one object. With this tool Pettigrew and his colleagues assessed how people classify images that are a combination of stimuli from different racial groups. Their results showed that whites, and especially Afrikaners, were more likely than Africans, Coloreds, and Asians to perceive interracial 2 My analysis assesses demographic and contextual effects on observed race, rather than the role of social psychological factors. This focus is primarily driven by Lent’s (1970) conclusion that demographic and contextual factors likely explain more of the variation in observed race than do psychological factors, as well as concerns about obtaining reliable measures of prejudice. As Blascovich and his colleagues (1997) observe, prejudice data are likely to be biased when collected in the context of a survey on race.

4
images as representative of extreme racial groups (i.e., white or African). The researchers suggested that the extreme racial attitudes of Afrikaners might explain their patterns of observed race, but they lacked the data necessary to test this hypothesis.
In 1970, Lent replicated Pettigrew et al.’s study with a sample of 120 American adults. First, he concluded that for some pictures, observed race did indeed vary by race of the respondent. Second, he found that unlike in South Africa, where whites were substantially more likely than other respondents to use extreme racial categories, in the U.S. it was dark-skinned blacks who were most likely to classify stimuli as white or black. Third, Lent acknowledged that the social psychological variables he employed explained few of the differences in observed race. Instead, he suggested that future attempts to understand observed race should include a broader range of demographic variables and information about social group membership.
A third social psychological study of observed race was conducted by Blascovich, Wyer, Swart, and Kibler (1997). In two experiments, one involving 15 students and the other involving 38 students, they showed that individuals who score higher on indices of racial prejudice take longer to classify others’ race than do less prejudiced individuals. They interpreted their results as support for the Pettigrew et al. hypothesis that prejudiced individuals are concerned about enforcing rigid racial boundaries, and so are uncomfortable with racial ambiguity.
Most recently, Eberhardt and Banaszynski (2000) examined contextual effects on observed race. First, they digitally merged a photograph of a white male with a photograph of an Asian male. Next, the original photograph of the white male was merged with a photograph of a black male. This process produced 82 morphed photographs, ranging from white to black, and white to Asian. Sixty undergraduates were then asked to assign a race to each photograph. Results indicate that the order in which photographs are shown (i.e., the context) influences observed race. When asked to classify a photograph that was 50 percent white and 50 percent black, respondents were significantly more likely to identify the photograph as white if they had previously viewed morphs that were predominately white, but black if preceding morphs were predominately black. Eberhardt and Banaszynski concluded that for many people observed race is both unstable and context specific.
The Study of Observed Race
The existing research on observed race has several shortcomings. First, the generalizability of the aforementioned social psychological studies is compromised by their reliance on small convenience samples. Pettigrew et al. and Lent each interviewed about 120 respondents. Neither Eberhardt and Banaszynski, nor Blascovich and his colleagues, interviewed more than 60 students. Second, the Blascovich et al. sample is extremely homogeneous. Of their 53 respondents, 48 are white. Third, it is unclear whether a stereoscope that blends dissimilar images is a substitute for a photograph of a racially-ambiguous person. In the former case respondents might legitimately see a single-race individual, while in the latter case doing so requires a particular interpretation of physical cues. Fourth, as Lent observes, these studies largely fail to assess the effect of demographic factors on perceptions of race. Blascovich and his colleagues offer no discussion of the implications of using a nearly all-white sample. Eberhardt and Banaszynski acknowledge that their findings are independent of observers’ race and sex, but they fail to assess whether effects vary by observers’ characteristics. Last, none of the studies examine the relationship between observers’ racial contexts and observed race. Eberhardt and Banaszynski come closest to evaluating these effects, but their analysis uses weak measures of racial contexts, and again stops at controlling for observers’ familiarity with racial groups, rather than assessing if and how observed race varies by familiarity.
In light of the shortcomings of existing empirical work, strong predictions from theoretical work, and the importance of understanding observed race, I conducted the Study of Observed Race (SOR) in September and October 2001. The SOR is a web-based survey of University of Michigan freshmen. To encourage participation, each student who completed the survey received a five-dollar

5
credit to his or her University identification card account, which could then be used at vending machines around campus.3 In contrast to the aforementioned studies of observed race, the SOR uses a probability sample, and is therefore generalizable to a known population. Additionally, the sample is sufficiently large and diverse to allow for comparisons between observers from several racial groups.4 A third advantage of the SOR is that it collects data on race, gender, and dimensions of racial context (see Appendix A). This allows for a direct examination the relationship between observers’ characteristics and observed race.
The decision to use University of Michigan freshmen was guided by a desire to assess demographic and contextual effects in a cost-effective and efficient manner. The key advantage of this population is that it is both racially and geographically diverse (Office of the Registrar 2000). The 2001 entering class includes about 3,600 whites, 595 Asians, 484 blacks, and 229 Latinos. Approximately two-thirds of students are from Michigan, but California, Illinois, New Jersey, New York, and Ohio each contribute more than 100 students. Thus, by interviewing University of Michigan freshmen during their first month on campus, I am able to sample from a diverse range of racial contexts without incurring the monetary and time costs that accompany large, national, face-to-face surveys. The sample is academically selective and homogeneous with respect to age, but it nevertheless serves as a foundation for future studies, and an important source of new information about observed race.
The core of the SOR is observations of race. Given that the SOR is designed to assess the relationship between observed race and characteristics of observers, and not how this relationship varies across myriad characteristics of the person being observed (e.g., race, sex, age, social class, style of dress), my goal in selecting stimuli was to identify racially-ambiguous photographs. I began by collecting the identification badge photographs of young adults (age 20-38) employed by a California firm.5 In the photographs employees are dressed in casual, professional attire, and are standing in front of a solid blue background. Women’s hair varies in length, but all of the men have short hair (i.e., above the ears). A survey completed by employees at the time they were hired reveals that the group is quite diverse with respect to single-race groups, but includes only two individuals who self-identified as multiracial.
In an effort to increase the number of racially-ambiguous photographs available for the SOR, a research assistant and I used the employee photographs and the software Morpheus to construct composite photographs.6 The process of creating these morphs involved first selecting two photographs, and then using the software to place dots on similar attributes in the two pictures (e.g., left pupil, right ear lobe). Next, we specified that the original photographs should contribute equally to the morph. Last, we used pairs of dots as a guide as one photograph was superimposed over the other. This process produced photographs of a number of “new people” (see Appendix B).
Once we had collected and created a set of potential stimuli, photographs were subjected to a series of informal and formal pretests. The informal part of this process consisted of consultations with several graduate student and faculty colleagues. This group identified photographs that were obviously computer-generated, and therefore had to be dropped. Next, I conducted a formal pretest with a group of University of Michigan alumni. As part of a presentation on the 2000 census, I asked alumni to assign a race or races to the person shown in each photograph. Although none of the more than 100 alumni at the presentation questioned the legitimacy of the photographs, several did ask whether I had shown them the same photograph more than once. I had not, but this experience revealed that no individual should appear as part of more than one morph, because the resulting photographs tend to
3 Singer, Hoewyk, and Maher (2000) show that incentive payments significantly improve response rates. 4 Cohen (1988) and nQuery Advisor 4.0 were used to compute target sample sizes. 5 Confidentiality agreements preclude showing these photographs outside the context of SOR interviews. 6 This emerging technology is increasingly being used by social scientists to study social categorization (Eberhardt and Banaszynski 2000; Eberhardt, Dasgupta, and Banaszynski 2001; Pollak and Kistler 2002).

6
bear a strong resemblance to one another. A final, web-based pretest of the SOR consisted of interviews with six undergraduates and five staff members from the University of Michigan.
This process led to the selection of a final group of 19 photographs. Ten of the photographs are morphs; 9 are females; and 11 are individuals who self-identify as monoracial, or morphs of individuals who self-identify with the same single-race group (Table 1). Pretest data and interviews with pretest participants confirmed that these pictures satisfy the criteria for appropriate stimuli—they elicit interobserver variation in observed race, and appear to observers to be unaltered photographs of real people.
In addition to observed race, the SOR also collects data on observers’ race, sex, and racial
contexts. The specific contexts addressed in the survey are family, high school, neighborhood, and dormitory room. Participants are asked if everyone in their immediate family is of the same race. If not, they are asked to report the race of each family member whose race differs from their own. Participants are also asked to report the name, city and state of their high school, and the city, state, and zip code of their permanent address.7 This information is then merged with school data from the National Center for Education Statistics, and zip code data from the 2000 census. Last, participants are asked if they have a roommate, and if so, whether they and all of their roommates are of the same race.
The final step in fielding the survey was to draw a sample from the incoming class. With the assistance of the Registrar’s Office, and their access to admissions data, I drew a sample that included all blacks, Asians, and Latinos in the 2001 entering class, as well as a randomly selected sample of
7 Permanent address information from the University of Michigan student directory is used for students who either failed to report a permanent address, or indicated that their permanent address was in Ann Arbor. Although most students understood that permanent address refers to where they lived before coming to the University, some interpreted it as a question about where they live on campus. This latter interpretation led to the false reports of “Ann Arbor”.
Table 1. Description of SOR Stimuli.Photograph Real Female Self-Reported Race
1 X X White2 Latino3 X X Black4 X X Asian5 X White6 Black7 X White-Asian8 X White-Black9 Black-Asian10 Asian11 X X Black12 X Black-Latino13 X Latino14 White-Latino15 X X Latino16 Asian-Latino17 X X White-Asian18 White-Black19 X X White

7
1,500 incoming whites.8 Participation in the SOR was solicited by email (see Appendix C).9 On September 7, 2001, the first 101 whites were contacted. Once it was clear that there were no technical problems with the web survey, the remaining 2,706 eligible cases were released in three waves between September 18 and September 20. On October 6, the field period ended. It had been at least ten days since any student had received an email reminder, and only two completed surveys had been received since October 4.
Table 2 reports that response rates for the SOR are quite good. Of the 18 web surveys reviewed by Couper (2001), only three had response rates above 40 percent. In the SOR, 65.2 percent of eligible students completed the survey. Response rates range from a high of 72.1 percent for Asians, to a low of 58.3 percent for blacks. These relatively high response rates are likely due to the subject matter of the survey, as well as the use of email reminders and the innovative way that incentives payments were disbursed.
One consequence of high response rates is that the SOR contains fairly large samples of
whites, Asians, and blacks. Unfortunately, the same is not true for Latinos. As Table 2 shows, a majority of the students who identified as Latino on their college application identified with a different racial group(s) on the SOR.10 As a result, the data do not contain enough self-identified Latinos to support comparisons between Latino and non-Latino observers.
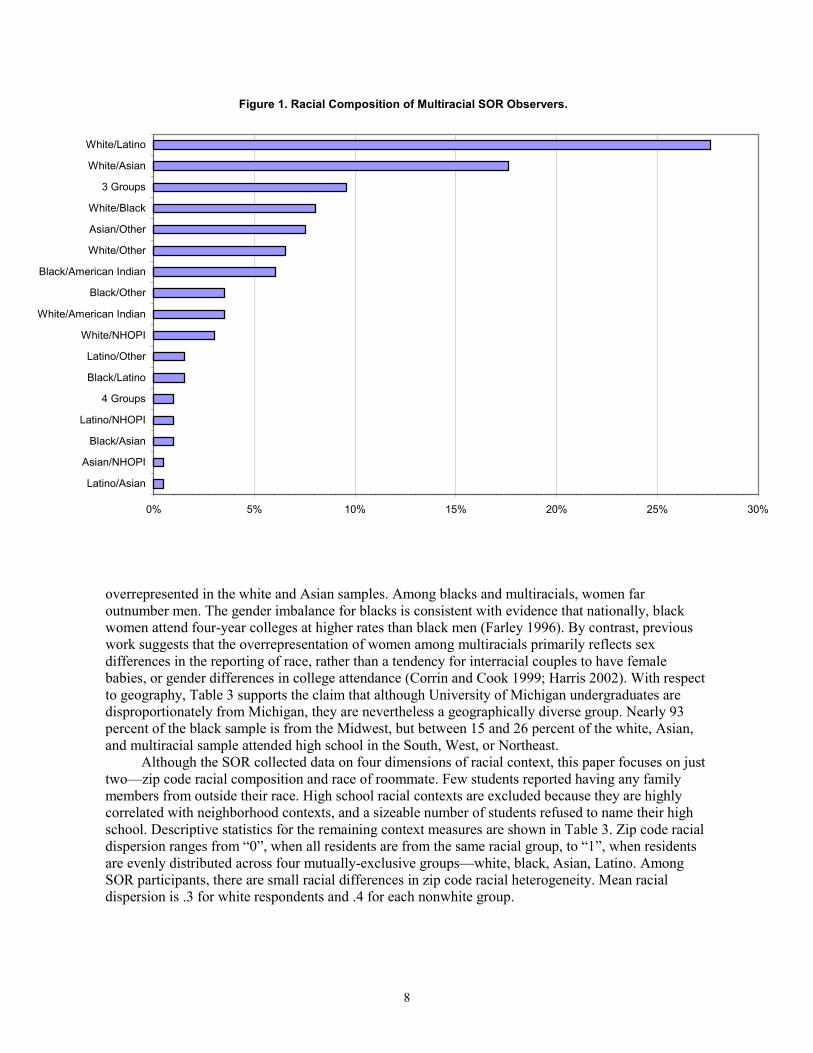
However, the SOR is able to support comparisons between multiracial and single-race observers, because a majority of those who expressed inconsistent racial identities identified as multiracial on the SOR. As Figure 1 indicates, these multiracial respondents are quite diverse with respect to race. White/Latinos and white/Asians are the two largest subgroups, but together they account for only 46 percent of multiracials. Although the presence of racial diversity within multiracial populations is often provided as a rationale for not characterizing them as a single group (Harris 2002), studies of observed race are the rare case in which aggregating multiracials probably makes sense. The fact that these respondents chose to self-identify with more than one racial group suggests that they see their own race as complex, and so might also share a perspective on others’ race. Thus, the sample used in this paper includes 1,672 observers—929 whites, 220 blacks, 325 Asians, and 198 multiracials.11
Table 3 reports characteristics of the SOR sample, as well as descriptive statistics for the racial context variables. On average, participants from all four racial groups were able to complete the survey in less than eight minutes. It was imperative that the SOR be brief, because of the difficulty of sustaining users’ attention on web surveys (Couper 2001). Table 3 also reports that participants are similar in age—almost all are 17 or 18, but that sex ratios vary by race. Women are slightly 8 Students with a permanent address outside the United States were excluded from the sample because their numbers are small and their contexts are fundamentally different from those experienced by domestic students. 9 Incoming students are assigned an email address by the University. Dormitory rooms are wired for Internet access, and there are an abundance of public computers around campus. 10 University admissions data on race is confidential, and cannot be used in my analysis. 11 Sample sizes vary slightly across analyses due to missing data.
Table 2. Response Rates by Race on Admissions Application.White Black Asian Latino All
Students Contacted 1,498 484 595 229 2,806Completed Surveys 975 282 429 143 1,829Response Rate 65.1% 58.3% 72.1% 62.4% 65.2%
Consistent Admissions and SOR Race 94.6% 78.0% 75.3% 44.1% 83.5%
8
overrepresented in the white and Asian samples. Among blacks and multiracials, women far outnumber men. The gender imbalance for blacks is consistent with evidence that nationally, black women attend four-year colleges at higher rates than black men (Farley 1996). By contrast, previous work suggests that the overrepresentation of women among multiracials primarily reflects sex differences in the reporting of race, rather than a tendency for interracial couples to have female babies, or gender differences in college attendance (Corrin and Cook 1999; Harris 2002). With respect to geography, Table 3 supports the claim that although University of Michigan undergraduates are disproportionately from Michigan, they are nevertheless a geographically diverse group. Nearly 93 percent of the black sample is from the Midwest, but between 15 and 26 percent of the white, Asian, and multiracial sample attended high school in the South, West, or Northeast. Although the SOR collected data on four dimensions of racial context, this paper focuses on just two—zip code racial composition and race of roommate. Few students reported having any family members from outside their race. High school racial contexts are excluded because they are highly correlated with neighborhood contexts, and a sizeable number of students refused to name their high school. Descriptive statistics for the remaining context measures are shown in Table 3. Zip code racial dispersion ranges from “0”, when all residents are from the same racial group, to “1”, when residents are evenly distributed across four mutually-exclusive groups—white, black, Asian, Latino. Among SOR participants, there are small racial differences in zip code racial heterogeneity. Mean racial dispersion is .3 for white respondents and .4 for each nonwhite group.
Figure 1. Racial Composition of Multiracial SOR Observers.
0% 5% 10% 15% 20% 25% 30%
Latino/Asian
Asian/NHOPI
Black/Asian
Latino/NHOPI
4 Groups
Black/Latino
Latino/Other
White/NHOPI
White/American Indian
Black/Other
Black/American Indian
White/Other
Asian/Other
White/Black
3 Groups
White/Asian
White/Latino

9
In addition to zip code racial dispersion, neighborhood racial context is also indicated by the percentage of zip code residents from several racial groups. Specifically, I consider the percentage of residents who are nonhispanic white, nonhispanic black, nonhispanic Asian, nonhispanic multiracial, and Latino. These groups are mutually exclusive, so the white, black, and Asian categories exclude individuals who identified with more than one race. As expected (Massey 2001), Table 3 shows large variation in percent white and percent black by race of respondent. Black respondents’ neighborhoods have a mean percent black of 52 percent, whereas white, Asian, and multiracial respondents come from neighborhoods that are less than 15 percent black. By contrast, neighborhood percent white averages 41 percent for blacks, and at least 70 percent for the nonblack groups. The magnitude of differences in percent Asian, percent Latino, and percent multiracial are much smaller, yet percent Asian and percent Latino are highest among Asian and multiracial respondents, respectively. The second dimension of context I consider is race of roommate. When students apply for housing they are allowed to name a specific roommate, as well as identify a room type (i.e., single, double, triple, quad), preferred section of campus, and desired lifestyle (e.g., coed dormitory, substance-free room). Students can also apply for a small number of openings in one of six residential theme communities. Aside from the 20 percent of students who identify a roommate on their housing application, race of roommate is largely assigned at random. This suggests that for the overwhelming majority of SOR participants, relationships between race of roommate and observed race are causal. Turning again to Table 3, it is clear that a student’s own race is related to the race of his or her roommate. Given that the majority of incoming students are white, it is not surprising that whites are more likely than other students to have a same-race roommate. Almost 70 percent of whites have white roommates, whereas over 60 percent of nonwhite students have roommates from outside their racial group.
Table 3. Descriptive Statistics for SOR Respondents.White Black Asian Multiracial
Time to complete SOR (minutes) 6.6 7.3 6.2 7.8Mean Age (years) 18.0 17.8 17.8 17.9Percent Female 50.9 65.6 53.9 63.3Geographic Distribution (percentages):
Michigan 73.8 83.7 67.7 62.4Remainder of Midwest 10.6 8.9 9.5 11.6Northeast 8.2 1.0 17.2 13.3South 4.5 6.4 3.9 7.7West 2.8 0.0 1.8 5.0
Zip Code:Racial Dispersion 0.3 0.4 0.4 0.4Percent White 86.2 40.5 78.2 71.7Percent Black 4.7 51.6 5.7 14.0Percent Asian 4.0 2.4 8.9 5.6Percent Latino 3.1 3.1 4.8 6.2Percent Multiracial 1.4 1.9 1.8 1.8
Percent with Same-Race Roommate 69.7 29.1 17.3 20.9Percent with Different-Race Roommate 26.2 63.6 72.8 70.9Percent with No Roommate 4.1 7.3 9.9 8.2
Number of Observers 929 220 325 198

10
Results
In the SOR, participants were shown a series of photographs and asked to assign a race or races to each person they saw. Response categories were white, black or African-American, Latino or Hispanic, Asian, American Indian or Alaska Native, Native Hawaiian or Other Pacific Islander, and Other. With the exception of Latino, these response categories reflect current federal guidelines for the classification of race (Office of Management and Budget 1997). Latino is included because it is fre-quently used as a racial group in scholarly research, policy debates, and public discourse (Hirschman et al. 2000; Smelser, Wilson, and Mitchell 2001; Office of Management and Budget 1997).
Table 4a contrasts observer-identified race with self-reported race.12 Results for each photograph are shown by race of observer. Numbers in the body of the table report the percentage of observers from each racial group who selected an observed race that matched the stimuli’s self-reported race.13 So for example, 99.4 percent of white observers classified the person in picture 5 as white, which is also how this person identified himself. These data provide initial support for the hypothesis that observer characteristics affect observed race. For 13 of the 18 photos, the probability of a match between observed and self-identified race varies significantly by race of observer.
12 All analyses are based on responses to 18 pictures. Picture 1 was dropped because response patterns suggest that it took one picture for observers to learn the task. 13 For morphs, self-identified race is determined by combining the self-identified races of component pictures.
Table 4a. Percentage of Observer-Reported Classifications That Match Self-Reported Race, by Picture and Race of Observer.
Race of ObserverPhotograph Self-Reported Race of Stimuli White Black Asian Multiracial
5 * White 99.4 99.0 97.5 97.219 * White 99.5 98.4 97.5 97.83 * Black 92.7 94.7 91.5 82.26 * Black 93.5 92.7 93.7 84.9
11 Black 92.9 96.3 93.0 92.34 * Asian 37.5 45.5 34.4 31.5
10 * Asian 91.8 90.5 87.1 85.62 * Latino 78.5 73.8 81.1 70.6
13 * Latino 45.2 41.8 31.0 38.515 * Latino 42.4 55.5 44.6 44.416 Asian-Latino 3.4 2.6 3.2 2.89 Black-Asian 0.9 1.1 2.1 0.6
12 Black-Latino 1.6 2.1 3.2 3.97 * White-Asian 1.0 2.1 2.1 3.3
17 * White-Asian 11.1 13.2 9.9 17.28 * White-Black 4.5 7.5 5.3 9.4
18 White-Black 2.7 3.7 4.6 5.014 * White-Latino 2.6 2.6 2.5 6.7
Mean for Monoracials 77.3 78.8 75.1 72.5Mean for Multiracials 3.5 4.4 4.1 6.1
Number of Observers 929 220 325 198An asterisk indicates that the match between self-reported and observed race variesby race of observer (p < .05).

11
Although the SOR is not designed to assess how characteristics of stimuli affect observed race, results in Table 4a are nevertheless suggestive of some relationships. They show that consistent racial categorization is more common for self-identified whites and blacks, than for self-identified Latinos and Asians. However, inconsistency between self-reported and observed race is even more likely when subjects self-identify as multiracial. The average photograph of a self-identified monoracial has a match rate of over 70 percent, whereas for the average multiracial photograph the match rate is less than 6 percent. These results suggest that although increasing numbers of Americans self-identify with two or more races, they are usually classified as members of single-race groups by observers.
Additional evidence of a relationship between observed race and race of observer is provided in Table 4b, which reports the modal observed race for each photograph, by race of observer. Results indicate that not only does the probability of a match between observed and self-identified race vary by observers’ race; an observer’s race can also affect which observed race is selected. For six of the 18 photographs (numbers 7, 8, 9, 13, 17, 18), modal observed race varies by race of observer. For example, most whites, blacks, and multiracials classified picture 13 as Latino, but a plurality of Asians thought this person was Asian. Similarly, Table 4b presents several cases in which the level of agreement varies by observers’ race. One example is picture 15. Although whites and blacks agreed that the person in picture 15 was most likely Latino, blacks were substantially more likely than whites to reach this conclusion (56 percent vs. 41 percent).
The above results illustrate that observed race need not be consistent with self-reported race, and when there is ambiguity in observed race, race of observer is a factor in how others are classified. Subsequent analyses examine the relationship between observed race and observers’ characteristics in greater detail by considering observers’ race, sex, and racial contexts. I also assess how sex and
Table 4b. Modal Observed Race and Associated Frequency, by Picture and Race of Observer.Self-Reported
Photo Race of Stimuli Mode % Mode % Mode % Mode %5 White W 99.0 W 99.1 W 96.9 W 95.5
19 White W 99.4 W 97.3 W 96.9 W 96.53 Black B 92.2 B 93.7 B 91.0 B 81.96 Black B 92.8 B 91.9 B 93.2 B 84.9
11 Black B 90.6 B 94.6 B 91.6 B 91.54 Asian A 37.6 A 43.9 A 33.4 A 31.7
10 Asian A 91.1 A 91.0 A 87.9 A 85.42 Latino L 78.2 L 72.4 L 79.3 L 69.8
13 Latino L 44.0 L 43.0 A 35.6 L 36.715 Latino L 40.9 L 55.7 L 45.8 L 43.216 Asian-Latino A 50.5 A 53.8 A 41.8 A 42.29 Black-Asian L 28.2 L 27.1 A 43.3 A 25.6
12 Black-Latino L 61.7 L 54.3 L 65.0 L 51.37 White-Asian W 27.0 L 26.7 W 28.2 W 19.1
17 White-Asian W 31.7 A 24.9 A 37.2 A 24.68 White-Black N 19.7 B 21.3 L 20.1 L 15.6
18 White-Black W 25.6 I 21.7 L 24.1 L 18.614 White-Latino W 88.6 W 86.9 W 85.8 W 79.9
Sample Size by Race
Note: W = White, B = Black, A = Asian, L = Latino, I = American Indian, N = NHOPI
929 220 325 198
White Black Asian Multiracial

12
context effects vary by race of observer. Throughout, two indicators of observed race are examined. The first is categorization latency. Several studies argue that observers take longer to categorize stimuli that they find ambiguous (Blascovich et al. 1997; Eberhardt and Banaszynski 2000). In the SOR, time stamps were recorded when each photograph loaded into the observer’s web browser. Differences between times indicate how long each observer viewed each photograph.
The first column in Table 5 reports coefficients from a linear regression of categorization latency on observer’s race. The unit of analysis is the observation, so each observer is in the data as many as 18 times.14 To account for the resulting nonindependence of observations, the cluster command in Stata is used to adjust standard errors. Results indicate that on average, Asians required nearly nine seconds to categorize photographs. Whites were about one second slower than Asians. The longest categorization latencies appear for black and multiracial observers. This pattern of results is consistent with the hypothesis that observers’ race affects observed race (Hypothesis 3). It is also consistent with the argument that compared to whites, blacks and multiracials are more cognizant of the complexities of race, and therefore require more time to select among a larger number of salient categories. This interpretation implies that Asians are less racially-cognizant than other observers, which is consistent with work that argues Asians have traditionally been silent on most racial issues (Espiritu 1992). Of course it is also possible that these patterns reflect group differences in familiarity with computers. It is likely that students who regularly use computers are able to answer items on a web survey more quickly. Unfortunately, the SOR does not allow me to discriminate between these competing hypotheses.
14 Observations are dropped if categorization latencies are over 60 seconds. Although only .75 percent of observations lasted more than 60 seconds, these extreme cases have a substantial impact on the latency results. Defining outliers as latencies greater than 30, 40, or 50 seconds does not produce appreciably different results from those shown here.
Table 5. OLS Regression of Latency and Observed Race on Observer Race.
SecondsPer Picture White Black Asian Latino Multiracial
Observer's Race:White (omitted) (omitted) 0.136 -0.584 ** (omitted) -2.019 **
(.076) (.087) (.245)Black 0.550 * -0.526 ** (omitted) -0.606 ** 0.061 -1.594 **
(.250) (.104) (.118) (.116) (.306)Asian -0.948 ** -0.413 ** 0.149 (omitted) -0.035 -1.653 **
(.232) (.090) (.089) (.099) (.282)Multiracial 1.010 ** -0.697 ** -0.173 -0.636 ** -0.455 ** (omitted)
(.339) (.109) (.100) (.122) (.121)
Constant 8.881 ** 4.299 ** 3.132 ** 2.988 ** 3.266 ** 4.357 **(.123) (.046) (.069) (.075) (.051) (.223)
Adjusted R2 (Percent) 0.59 3.47 0.88 2.81 0.76 3.75Number of Observers - 1,667 1,667 1,667 1,667 1,667Number of Observations 29,763 - - - - -Standard errors are in parentheses.* p < .05, ** p < .01
Number of Photographs Classified as:
13
My second indicator of observed race is a series of variables that detail the number of photographs classified as white, black, Asian, Latino, and multiracial. Here the unit of analysis is the observer. Results in Table 5 provide additional support for the hypothesis that race of observer affects observed race (Hypothesis 3). Although observers were shown the same 18 photographs in the same order, whites reported seeing more whites than did other observers, Asians reported seeing more Asians, and multiracials reported seeing more multiracials. All of these differences are statistically significant, but the in-group preference exhibited by multiracial observers is especially pronounced. On average, multiracials reported seeing 4.4 multiracials among the 18 photographs, whereas the average number of multiracials reported by whites, black, and Asians was between 2.3 and 2.8.
Interestingly, Table 5 does not indicate that blacks are more likely than other observers to categorize stimuli as black. The average black classified 3.1 photographs as black, which is not statistically different from the number of blacks reported by whites, Asians, or multiracials. In fact, point estimates for Asians and whites are actually larger than the point estimate for black observers. Although it is not clear why blacks deviate from the pattern of in-group preference exhibited by other racial groups, it is important to note that this difference might result more from the behavior of nonblacks, than from the behavior of blacks. It might be that, like other groups, blacks have a tendency to classify ambiguous stimuli as in-group members, but that nonblacks also have a tendency to classify racially-ambiguous photographs as black. Such behavior by nonblacks would be consistent with America’s history of policing the black-nonblack line (Davis 1991), and would suggest that when faced with a racial categorization task, nonblacks ask two central questions—Could this person be a member of my group? Could this person be black?
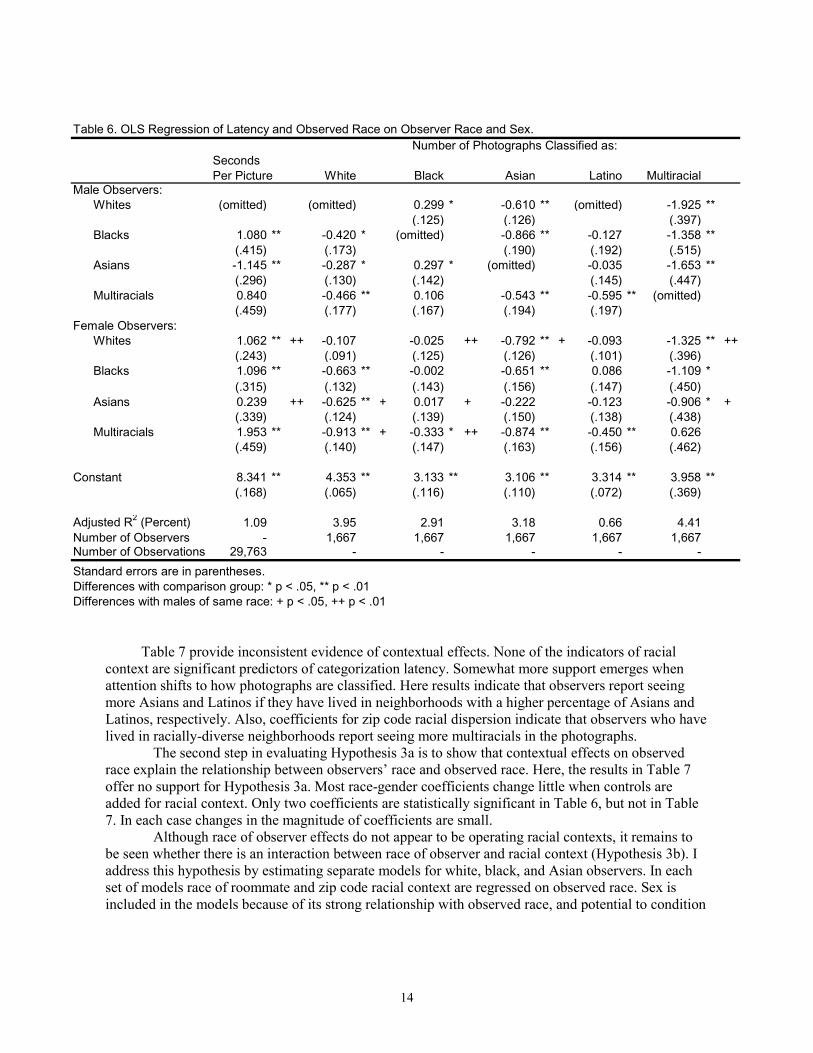
Having established a relationship between observers’ race and observed race, I next consider the influence of gender and race on racial categorization. Table 6 presents results from a series of models that regress observed race on observer’s race and gender. As in Table 5, coefficients for males indicate that black and multiracial men take significantly longer to classify race than do Asian or white men. Quite a different pattern emerges for women. Asians continue to classify race the fastest, and multiracials the slowest, but there is no longer a black-white difference in categorization latency. This change is due to longer latencies for women than men among white, Asian, and multiracial observers, and nearly identical latencies for black men and black women. These results are generally consistent with Hypothesis 5, which holds that women see more complexity in racial classification than men do, and therefore take longer to classify others. The only deviation from this pattern is blacks, for whom gender has no effect on observed race.
The remainder of Table 6 reports race-gender differences in the number of photographs classified into each racial category. Again, there is evidence that nonblack women see race in more complex ways than do nonblack men. Among whites, Asians, and multiracials, women are less likely than men to classify stimuli as single race. Gender interactions are statistically significant for the number of photographs Asians and multiracials classify as white; the number of photographs whites classify as Asian; the number of photographs whites, Asians, and multiracials classify as black; and the number of photographs whites and Asians classify as multiracial. Especially pronounced are gender differences in the number of blacks and multiracials observed in the photographs. Whereas white, black, and Asian women report seeing comparable numbers of blacks in the photographs, white and Asian men actually classify more photographs as black than does any other group. White and Asian men also report seeing significantly fewer multiracials than do multiracial men and women from all racial groups. This pattern of results is consistent with Hypotheses 3 and 4. Whites and Asians are more likely than other observers to use simple categories to classify race (i.e., black as opposed to multiracial), and this tendency is especially pronounced among men.
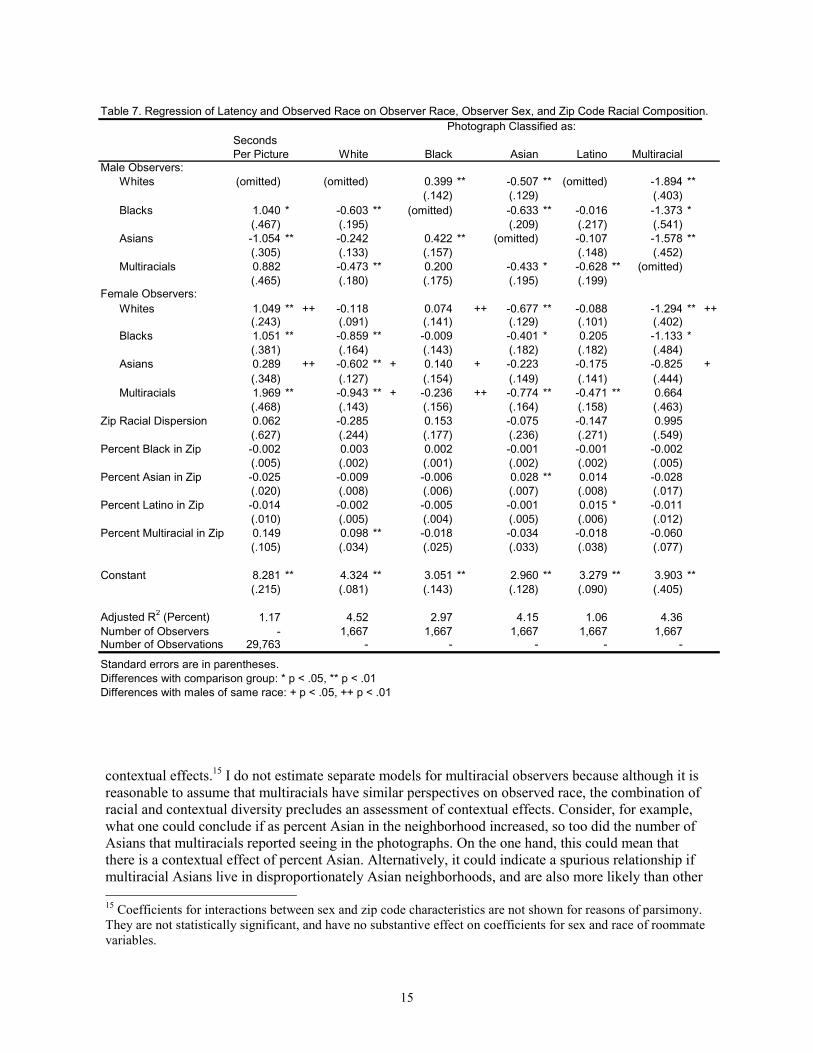
Next, I turn to an assessment of why observers’ race and sex affect observed race. Hypothesis 3a posits that observers’ race affects observed race because contexts are segregated by race. To test this hypothesis I add controls for zip code racial context. The first step in evaluating Hypothesis 3a is to establish that racial contexts affect observed race (Hypotheses 1 and 2). Unfortunately, the results in
14
Table 7 provide inconsistent evidence of contextual effects. None of the indicators of racial context are significant predictors of categorization latency. Somewhat more support emerges when attention shifts to how photographs are classified. Here results indicate that observers report seeing more Asians and Latinos if they have lived in neighborhoods with a higher percentage of Asians and Latinos, respectively. Also, coefficients for zip code racial dispersion indicate that observers who have lived in racially-diverse neighborhoods report seeing more multiracials in the photographs.
The second step in evaluating Hypothesis 3a is to show that contextual effects on observed race explain the relationship between observers’ race and observed race. Here, the results in Table 7 offer no support for Hypothesis 3a. Most race-gender coefficients change little when controls are added for racial context. Only two coefficients are statistically significant in Table 6, but not in Table 7. In each case changes in the magnitude of coefficients are small.
Although race of observer effects do not appear to be operating racial contexts, it remains to be seen whether there is an interaction between race of observer and racial context (Hypothesis 3b). I address this hypothesis by estimating separate models for white, black, and Asian observers. In each set of models race of roommate and zip code racial context are regressed on observed race. Sex is included in the models because of its strong relationship with observed race, and potential to condition
Table 6. OLS Regression of Latency and Observed Race on Observer Race and Sex.
SecondsPer Picture White Black Asian Latino Multiracial
Male Observers:Whites (omitted) (omitted) 0.299 * -0.610 ** (omitted) -1.925 **
(.125) (.126) (.397)Blacks 1.080 ** -0.420 * (omitted) -0.866 ** -0.127 -1.358 **
(.415) (.173) (.190) (.192) (.515)Asians -1.145 ** -0.287 * 0.297 * (omitted) -0.035 -1.653 **
(.296) (.130) (.142) (.145) (.447)Multiracials 0.840 -0.466 ** 0.106 -0.543 ** -0.595 ** (omitted)
(.459) (.177) (.167) (.194) (.197)Female Observers:
Whites 1.062 ** ++ -0.107 -0.025 ++ -0.792 ** + -0.093 -1.325 ** ++(.243) (.091) (.125) (.126) (.101) (.396)
Blacks 1.096 ** -0.663 ** -0.002 -0.651 ** 0.086 -1.109 *(.315) (.132) (.143) (.156) (.147) (.450)
Asians 0.239 ++ -0.625 ** + 0.017 + -0.222 -0.123 -0.906 * +(.339) (.124) (.139) (.150) (.138) (.438)
Multiracials 1.953 ** -0.913 ** + -0.333 * ++ -0.874 ** -0.450 ** 0.626(.459) (.140) (.147) (.163) (.156) (.462)
Constant 8.341 ** 4.353 ** 3.133 ** 3.106 ** 3.314 ** 3.958 **(.168) (.065) (.116) (.110) (.072) (.369)
Adjusted R2 (Percent) 1.09 3.95 2.91 3.18 0.66 4.41Number of Observers - 1,667 1,667 1,667 1,667 1,667Number of Observations 29,763 - - - - -Standard errors are in parentheses.Differences with comparison group: * p < .05, ** p < .01Differences with males of same race: + p < .05, ++ p < .01
Number of Photographs Classified as:
15
contextual effects.15 I do not estimate separate models for multiracial observers because although it is reasonable to assume that multiracials have similar perspectives on observed race, the combination of racial and contextual diversity precludes an assessment of contextual effects. Consider, for example, what one could conclude if as percent Asian in the neighborhood increased, so too did the number of Asians that multiracials reported seeing in the photographs. On the one hand, this could mean that there is a contextual effect of percent Asian. Alternatively, it could indicate a spurious relationship if multiracial Asians live in disproportionately Asian neighborhoods, and are also more likely than other 15 Coefficients for interactions between sex and zip code characteristics are not shown for reasons of parsimony. They are not statistically significant, and have no substantive effect on coefficients for sex and race of roommate variables.
Table 7. Regression of Latency and Observed Race on Observer Race, Observer Sex, and Zip Code Racial Composition.
SecondsPer Picture White Black Asian Latino Multiracial
Male Observers:Whites (omitted) (omitted) 0.399 ** -0.507 ** (omitted) -1.894 **
(.142) (.129) (.403)Blacks 1.040 * -0.603 ** (omitted) -0.633 ** -0.016 -1.373 *
(.467) (.195) (.209) (.217) (.541)Asians -1.054 ** -0.242 0.422 ** (omitted) -0.107 -1.578 **
(.305) (.133) (.157) (.148) (.452)Multiracials 0.882 -0.473 ** 0.200 -0.433 * -0.628 ** (omitted)
(.465) (.180) (.175) (.195) (.199)Female Observers:
Whites 1.049 ** ++ -0.118 0.074 ++ -0.677 ** -0.088 -1.294 ** ++(.243) (.091) (.141) (.129) (.101) (.402)
Blacks 1.051 ** -0.859 ** -0.009 -0.401 * 0.205 -1.133 *(.381) (.164) (.143) (.182) (.182) (.484)
Asians 0.289 ++ -0.602 ** + 0.140 + -0.223 -0.175 -0.825 +(.348) (.127) (.154) (.149) (.141) (.444)
Multiracials 1.969 ** -0.943 ** + -0.236 ++ -0.774 ** -0.471 ** 0.664(.468) (.143) (.156) (.164) (.158) (.463)
Zip Racial Dispersion 0.062 -0.285 0.153 -0.075 -0.147 0.995(.627) (.244) (.177) (.236) (.271) (.549)
Percent Black in Zip -0.002 0.003 0.002 -0.001 -0.001 -0.002(.005) (.002) (.001) (.002) (.002) (.005)
Percent Asian in Zip -0.025 -0.009 -0.006 0.028 ** 0.014 -0.028(.020) (.008) (.006) (.007) (.008) (.017)
Percent Latino in Zip -0.014 -0.002 -0.005 -0.001 0.015 * -0.011(.010) (.005) (.004) (.005) (.006) (.012)
Percent Multiracial in Zip 0.149 0.098 ** -0.018 -0.034 -0.018 -0.060(.105) (.034) (.025) (.033) (.038) (.077)
Constant 8.281 ** 4.324 ** 3.051 ** 2.960 ** 3.279 ** 3.903 **(.215) (.081) (.143) (.128) (.090) (.405)
Adjusted R2 (Percent) 1.17 4.52 2.97 4.15 1.06 4.36Number of Observers - 1,667 1,667 1,667 1,667 1,667Number of Observations 29,763 - - - - -
Standard errors are in parentheses.Differences with comparison group: * p < .05, ** p < .01Differences with males of same race: + p < .05, ++ p < .01
Photograph Classified as:

16
multiracials to classify people as Asian. Unfortunately, sample sizes for multiracial subgroups are insufficient to allow me to discriminate between these alternative hypotheses. I begin testing for racial group differences in contextual effects by estimating models for whites. Results in Table 8 indicate that for whites, racial contexts have a large impact on observed race. Compared to whites who have white roommates, whites with nonwhite roommates report seeing fewer whites and Latinos in the photographs, and more multiracials. This suggests that when whites are immersed in racially-diverse settings, they see greater complexity in the racial identities of others. Moreover, it appears that this effect is causal. Available evidence suggests that deviations from the random assignment of roommates do not account for the race of roommate effect. Students are more likely to have requested a specific roommate if they are Michigan residents, but the race of roommate effect does not vary by residency status. Also, the race of roommate effect does not vary by high school racial composition, even though whites from more diverse schools are probably more likely than other whites to select a nonwhite roommate.
SecondsPer Picture White Black Asian Latino Multiracial
Female 0.993 ** -0.163 -0.345 ** -0.142 -0.202 0.686 **(.261) (.116) (.080) (.096) (.119) (.224)
Race of Roommate: Same (omitted) Different 0.811 -0.381 * -0.028 0.201 -0.385 * 0.739 *
(.419) (.168) (.116) (.140) (.173) (.325) No Roommate 1.850 0.153 -0.259 0.636 * -0.235 0.031
(1.714) (.389) (.268) (.324) (.401) (.753) Female * -0.028 0.357 0.046 -0.142 0.412 -0.496 Different-Race Roomma (.600) (.224) (.155) (.187) (.231) (.434) Female * -0.409 -0.823 0.084 -0.434 0.450 0.338 No Roommate (1.980) (.503) (.347) (.418) (.517) (.972)
Zip Racial Dispersion 1.501 -1.042 0.746 -0.661 -1.049 1.748(1.374) (.673) (.464) (.560) (.693) (1.302)
Percent Black in Zip -0.034 ** 0.015 0.005 0.013 0.006 -0.015(.013) (.009) (.006) (.008) (.009) (.018)
Percent Asian in Zip -0.059 -0.002 -0.030 * 0.043 ** 0.031 -0.015(.042) (.019) (.013) (.016) (.020) (.038)
Percent Latino in Zip -0.033 0.006 -0.020 * 0.012 0.026 * -0.031(.018) (.012) (.008) (.010) (.012) (.023)
Percent Multiracial in Zip 0.174 0.074 0.006 -0.036 0.000 -0.085(.171) (.068) (.047) (.056) (.070) (.131)
Constant 7.978 ** 4.526 ** 3.411 ** 2.385 ** 3.444 ** 1.755 **(.287) (.114) (.078) (.095) (.117) (.220)
Adjusted R2 (Percent) 0.95 0.94 3.58 1.47 0.17 1.03Number of Observers - 927 927 927 927 927Number of Observations 16,537 - - - - -
Standard errors are in parentheses.Differences with comparison group: * p < .05, ** p < .01Differences with males of same race: + p < .05, ++ p < .01
Photograph Classified as:
Table 8. Regression of Latency and Observed Race on Observer Sex, Race of Roommate, and Zip Code Racial Composition: White Observers.

17
Table 8 also presents evidence of neighborhood contextual effects for white observers. Whites who have lived near more Asians classify more of the photographs as Asian, and whites who have had more exposure to Latinos report seeing more Latinos. Both of these findings are consistent with the hypothesis that contexts influence observed race through their effect on observers’ familiarity with different racial groups (Hypothesis 1). Next, I consider whether racial contexts affect white and black observers differently. Table 9 strongly suggests that they do. Race of roommate has no effect on how black observers classify race. Blacks are also not more likely to report seeing Asians and Latinos in photographs if they have lived in neighborhoods with more Asian or Latino residents. Additional differences between black and white observers are apparent in coefficients for percent black, percent multiracial, and zip code dispersion. Blacks report seeing more whites if they have lived in neighborhoods with a higher percentage of black or multiracial residents, and report seeing fewer blacks if they have lived in more diverse neighborhoods.
SecondsPer Picture White Black Asian Latino Multiracial
Female 0.934 -0.695 0.003 0.551 0.035 1.490(1.021) (.356) (.251) (.361) (.463) (.951)
Race of Roommate: Same (omitted) Different 0.765 -0.488 0.083 0.467 0.055 1.078
(1.008) (.359) (.253) (.363) (.466) (.957) No Roommate 1.131 -0.707 -0.401 0.430 -1.186 3.362 *
(1.395) (.546) (.385) (.553) (.709) (1.457) Female * -1.145 0.542 -0.086 -0.449 0.031 -1.160 Different-Race Roommate (1.159) (.412) (.291) (.418) (.536) (1.101) Female * -2.053 0.472 0.661 0.034 1.945 * -4.763 * No Roommate (1.569) (.694) (.489) (.703) (.902) (1.853)
Zip Racial Dispersion 1.616 -0.255 -0.802 * -0.215 1.259 0.257(1.400) (.534) (.376) (.541) (.694) (1.425)
Percent Black in Zip 0.001 0.005 * 0.001 -0.004 -0.003 0.001(.007) (.003) (.002) (.003) (.003) (.007)
Percent Asian in Zip -0.052 0.005 0.001 -0.024 -0.046 0.060(.058) (.028) (.020) (.028) (.036) (.074)
Percent Latino in Zip -0.053 0.009 0.012 0.002 0.004 0.006(.041) (.014) (.010) (.014) (.019) (.038)
Percent Multiracial in Zip 0.133 0.249 * 0.060 0.055 -0.441 ** 0.220(.326) (.125) (.088) (.127) (.163) (.335)
Constant 8.151 ** 3.680 ** 3.214 ** 2.092 ** 3.867 ** 0.758(1.061) (.405) (.285) (.410) (.526) (1.081)
Adjusted R2 (Percent) 0.53 2.70 0.70 0.00 3.48 0.25Number of Observers - 220 220 220 220 220Number of Observations 3,928 - - - - -
Standard errors are in parentheses.Differences with comparison group: * p < .05, ** p < .01Differences with males of same race: + p < .05, ++ p < .01
Photograph Classified as:
Table 9. Regression of Latency and Observed Race on Observer Sex, Race of Roommate, and Zip Code Racial Composition: Black Observers.

18
Although these findings are consistent with the hypothesis that contextual effects differ by race of the observer, the direction of several the coefficients in Table 9 is unexpected. Some suggest that for blacks, more contact with a racial group does not increase their probability of classifying ambiguous stimuli as members of that group. In the case of percent black and percent multiracial, blacks actually exhibit the opposite tendency; categorizing more of the photographs as white if they have lived near fewer whites. Last, I compare contextual effects for Asians to those observed for whites and blacks. Table 10 reports that race of roommate influences observed race for Asians, but not in the same way that it affects whites. Unlike whites, Asians with same-race roommates are not less likely to classify others as multiracial. However, they do report seeing fewer blacks. Other contextual effects deviate more substantially from patterns observed for whites and blacks. Asians categorize others’ race faster if they have lived in more diverse neighborhoods. For whites and blacks the relationship between racial dispersion and categorization latency is positive, but not significant. Among Asians, neighborhood percent black is positively associated with the time required to classify race. For whites this effect is negative; for blacks it is not significant.
SecondsPer Picture White Black Asian Latino Multiracial
Female 0.822 -0.015 -0.201 -0.065 -0.344 0.682(.973) (.360) (.276) (.446) (.429) (.879)
Race of Roommate: Same (omitted) Different -1.044 0.133 0.527 * -0.294 -0.166 -0.061
(.669) (.296) (.227) (.367) (.353) (.723) No Roommate 1.216 0.570 0.194 -0.715 -0.277 -0.092
(1.577) (.508) (.389) (.629) (.605) (1.240) Female * 0.699 -0.348 -0.056 -0.207 0.358 -0.127 Different-Race Roommate (1.054) (.400) (.307) (.496) (.477) (.978) Female * -0.536 -1.090 -0.029 -0.116 0.055 1.824 No Roommate (2.044) (.627) (.481) (.777) (.747) (1.531)
Zip Racial Dispersion -6.016 ** 0.431 0.303 -0.721 1.251 -0.487(1.944) (.788) (.604) (.976) (.938) (1.923)
Percent Black in Zip 0.081 * -0.010 -0.006 0.017 -0.018 0.002(.032) (.013) (.010) (.016) (.015) (.031)
Percent Asian in Zip 0.066 -0.015 -0.007 0.030 -0.017 -0.008(.043) (.015) (.012) (.019) (.018) (.037)
Percent Latino in Zip 0.051 -0.018 0.000 -0.014 -0.001 4.143(.027) (.010) (.008) (.013) (.012) (2.502)
Percent Multiracial in Zip 0.000 0.093 -0.016 -0.056 0.081 -0.111(.079) (.048) (.037) (.060) (.058) (.118)
Constant 8.987 ** 3.879 ** 3.014 ** 3.482 ** 3.039 ** 2.571 **(.751) (.305) (.234) (.378) (.363) (.744)
Adjusted R2 (Percent) 2.30 1.76 2.91 1.11 0.00 1.26Number of Observers - 324 324 324 324 324Number of Observations 5,792 - - - - -Standard errors are in parentheses.Differences with comparison group: * p < .05, ** p < .01Differences with males of same race: + p < .05, ++ p < .01
Photograph Classified as:
Table 10. Regression of Latency and Observed Race on Observer Sex, Race of Roommate, and Zip Code Racial Composition: Asian Observers.

19
Conclusion
The 2000 Census marked a fundamental shift in how we measure race in America. By allowing people to identify with multiple racial groups, it directly confronted the myth that people belong to one and only one racial group. Unfortunately, it left many other myths intact. Implicit in how we measure race in America are assumptions that observed race does not vary across observers, and self-reported race is an adequate proxy for observed race. However, just as we have long known that racial groups are not mutually exclusive, we have also had reason to suspect that characteristics of observers affect observed race.
My results show that for some photographs, observed race does indeed vary across observers. Self-reported race is substantially more likely to be confirmed by observers when people self-identify with only one racial group, and especially if they self-identify as white or black. These findings are both comforting and alarming. They are comforting because they suggest that for the majority of Americans, self-reported race is a reasonable proxy for observed race. They are alarming because the groups that are most likely to be inconsistently identified are the fastest growing segments of our society. The implication is that if we do not become more sophisticated about how we collect racial data, continued immigration from Asia and Latin America, and increasing numbers of interracial unions, will soon threaten our ability to enforce civil rights laws and understand racial differences.
My results also illustrate the complex ways that race and gender affect observed race. White men and Asian men consistently demonstrate a simplistic understanding of race. They take relatively little time to classify others, are the least likely to identify people as multiracial, and the most likely to identify people as black. At the other extreme are multiracial observers. They tend to take a long time to classify race and are far more likely than other observers to identify people as multiracial.
A further set of substantive findings from the SOR concerns race-gender interactions in observed race. Based on studies of racial attitudes and self-identity, I hypothesized that women would see greater complexity in observed race than would men. Findings from the SOR both confirm and extend this hypothesis. They confirm that gender does generally have a large influence on how observers categorize by race. They extend this conclusion by revealing that the magnitude of gender effects depends on the race of the observer. In uncovering numerous gender differences among white and Asian observers, few among multiracials, and none among blacks, my work challenges much of the existing literature on gender differences in racial perspectives. It suggests that rather than affecting understandings of race for all Americans, gender is primarily important for Asians and whites. Much of the existing work in this area relies upon white samples, and so has not been able to test for race-gender interactions.
Last, my work reveals the complex process by which observers’ race and racial contexts affect perspectives on race. I find no support for the hypothesis that residential segregation directly accounts for the relationship between observers’ race and observed race. There is little doubt that residential segregation continues to be a major problem in the United States, but controlling for racial contexts does little to explain why whites, blacks, Asians, and multiracials differ in how they categorize by race. Rather, it appears that observers’ race matters because the United States is, and has long been, racialized. Whites and Asians have tended to deny that race affects opportunities (Espiritu 1992; Frankenberg 1993). Most blacks and multiracials have not had this option. For blacks, parental socialization and personal experiences emphasize that their race and their life chances are linked (Demo and Hughes 1990; Feagin 1991). For multiracials, the significance of race in American society is illustrated each time someone asks which race they really are (Funderburg 1994; Williams 1996). It is likely that these differences in racial cognizance explain why blacks and multiracials classify race in more complex ways than do whites or Asians.
Variation in racial cognizance also likely explains why some results for blacks deviate from those observed for other groups. Studies of the American racial hierarchy have established that as a group, blacks face more prejudice and discrimination than do whites, Asians, or multiracials (Smelser,

20
Wilson, and Mitchell 2001). It is therefore not surprising that for blacks, gender does not affect observed race. Gendered socialization and experiences with sexism likely add little to the racial awareness that, by virtue of their race, black men and women attain. Similarly, it is likely that when most blacks arrive at college, they are sufficiently racially-cognizant that the race of their roommate has little effect on how they classify others.
These insights into observed race offer guidance to researchers and policymakers who are struggling to interpret the new census race data. First, they support efforts to reclassify multiracials when outcomes depend on racial classifications made by strangers. Available evidence suggests that observers rarely classify people as multiracial simply on the basis of phenotype, so not reclassifying multiracials is likely to distort data for single-race groups. Second, results from the SOR clearly illustrate that decisions about how to reclassify multiracials should consider how relevant observers categorize race in relevant contexts. This means, for example, that rules for reclassification might differ in employment discrimination cases where the defendant is a white male, as opposed to a white female. In advocating flexibility in reclassification rules, my work runs counter to existing federal guidelines. Office of Management and Budget (2000) Memorandum 00-02 requires that for civil rights purposes, anyone who identifies as white and any nonwhite race be reclassified as a member of the nonwhite race (Office of Management and Budget 2000).
Although the SOR provides many insights into how people categorize by race, it could be extended in several important ways. First, increasing the age and educational diversity of observers would likely reveal stronger relationships between observed race and characteristics of the observer. Second, employing a probability sample of stimuli would allow researchers to estimate the proportion of the population for whom observed race if fluid. Third, systematically varying the name, hometown, dress, social class, and other attributes of stimuli would expose relationships between observed race and characteristics of the person being observed. Fourth, expanding conceptions of racial contexts beyond physical space would likely reveal stronger contextual effects on observed race, because much of what we learn about race comes from books, television, movies, and the Internet. Pursuing these extensions to the SOR will improve our ability to interpret existing race data, and help us design better ways to collect data on race in the future.

21
References
Blascovich, Jim, Natalie A. Wyer, Laura A. Swart, and Jeffrey L. Kibler. 1997. “Racism and Racial Categorization.” Journal of Personality and Social Psychology 72: 1364-1372.
Cohen, Jacob. 1988. Statistical Power Analysis for the Behavioral Sciences (Second Edition). Hillsdale, NJ: Lawrence Erlbaum Associates.
Corrin, William J. and Thomas D. Cook. 1999. “Spanning Racial Boundaries: Multiracial Adolescents and Their Families, Peers, Schools, and Neighborhoods.” Institute for Policy Research Working Paper 99-20, Northwestern University.
Couper, Mick P. 2001. “The Promises and Perils of Web Surveys.” Pp. 35-56 in The Challenge of the Internet, edited by Andrew Westlake, Wendy Sykes, Tony Manners, and Malcolm Rigg. London: Association for Survey Computing
Davis, F. James. 1991. Who Is Black? One Nation’s Definition. University Park, PA: Pennsylvania State University Press.
Demo, David H. and Michael Hughes. 1990. “Socialization and Racial Identity among Black Adults.” Social Psychological Quarterly 53: 364-374.
Eberhardt, Jennifer L. and Tracy Banaszynski. 2000. “The Fluidity of Racial Categorization.” Unpublished manuscript.
Edmonston, Barry, Joshua Goldstein, and Juanita Tamayo Lott. 1996. Spotlight on Heterogeneity: The Federal Standards for Racial and Ethnic Classification. Washington, DC: National Academy Press.
Espiritu, Yen Le. 1992. Asian American Panethnicity: Bridging Institutions and Identities. Philadelphia: Temple University Press.
Farley, Reynolds. 1996. The New American Reality. New York: Russell Sage Foundation.
Feagin, Joe R. 1991. “The Continuing Significance of Race: Antiblack Discrimination in Public Places.” American Sociological Review 56: 101-116.
Frankenberg, Ruth. 1993. White Women, Race Matters: The Social Construction of Whiteness. Minneapolis, University of Minnesota Press.
Funderburg, Lise. 1994. Black, White, Other: Biracial Americans Talk about Race and Identity. New York: William Morrow.
Grieco, Elizabeth M. and Rachel C. Cassidy. 2001. Overview of Race and Hispanic Origin. Census 2000 Brief. U.S. Census Bureau.
Hahn, Robert A., Joseph Mulinare, and Steven M. Teutsch. 1992. “Inconsistencies in Coding of Race and Ethnicity Between Birth and Death in US Infants: A New Look at Infant Mortality, 1983 through 1985.” Journal of the American Medical Association 267: 259-263.
Harris, David R. 2001. “The Multiracial Count.” Washington Post (March 24).

22
. 2002. “Does It Matter How We Measure? Racial Classification and the Characteristics of Multiracial Youth.” In Counting Races, Recognizing Multiracials, edited by Joel Perlmann and Mary C. Waters. New York: Russell Sage Foundation.
Harris, David R. and Jeremiah Joseph Sim. 2000. “An Empirical Look at the Social Construction of Race: The Case of Multiracial Adolescents.” Population Studies Center Research Report 00-452, University of Michigan.
. 2002. “Who is Multiracial? Assessing the Complexity of Lived Race.” American Sociological Review.
Hirschfeld, Lawrence A. 1996. Race in the Making: Cognition, Culture, and the Child's Construction of Human Kinds. Cambridge, MA: MIT Press.
Johnson, Monica Kirkpatrick and Margaret Mooney Marini. 1998. “Bridging the Racial Divide in the United States: The Effect of Gender.” Social Psychology Quarterly 61: 247-258.
Lempert, Richard O., David L. Chambers and Terry K. Adams. 2000. “Michigan’s Minority Graduates in Practice: The River Runs through the Law School.” Law and Social Inquiry 25: 395-505.
Lent, Richard H. 1970. “Binocular Resolution and Perception of Race in the United States.” British Journal of Psychology 61: 521-533.
Massey, Douglas S. 2001. “Residential Segregation and Neighborhood Conditions in U.S. Metropolitan Areas.” Pp. 391-434 in America Becoming: Racial Trends and Their Consequences, Volume 1, edited by Neil J. Smelser, William Julius Wilson, and Faith Mitchell. Washington, D.C.: National Academy Press.
Office of Management and Budget. 1997. “Revision to the Standards for the Classification of Federal Data on Race and Ethnicity.” Federal Register (October 30).
. 2000. “Guidance on Aggregation and Allocation of Multiple Race Responses for Use in Civil Rights Monitoring and Enforcement.” Office of Management and Budget Bulletin Number 00-02. http://www.whitehouse.gov/OMB/bulletins/b00-02.html.
Office of the Registrar. 2000. Ethnicity Reports. The University of Michigan.
Parker, Lonnae O’Neal. 1999. “White Girl? Cousin Kim is Passing, but Cousin Lonnae Doesn’t Want to Let Her Go.” Washington Post (August 8).
Pettigrew, Thomas F., Gordon W. Allport, and Eric O. Barnett. 1958. “Binocular Resolution and Perception of Race in South Africa.” British Journal of Psychology 49: 265-278.
Schmitt, Eric. 2001. “For 7 Million People in Census, One Race Category Isn’t Enough.” New York Times (March 13) A1.
Schuman, Howard, Charlotte Steeh, Lawrence Bobo, and Maria Krysan. 1997. Racial Attitudes in America: Trends and Interpretations (Revised Edition). Cambridge, MA: Harvard University Press.
23
Schweitzer, Sarah. 2001. “Effect of Racial Profiling Law Debated.” Boston Globe (March 31).
Singer, Eleanor, John Van Hoewyk, and Mary P. Maher. 2000. “Experiments with Incentives in Telephone Surveys.” Public Opinion Quarterly 64: 171-188.
Smelser, Neil J., William Julius Wilson, and Faith Mitchell. 2001. America Becoming: Racial Trends and Their Consequences. Washington, D.C.: National Academy Press.
U. S. Census Bureau. 1994. Statistical Abstract of the United States: 1994. Washington, DC: U.S. Government Printing Office.
. 1998. “Race of Wife by Race of Husband: 1960, 1970, 1980, 1991, and 1992.” http://www.census.gov/population/socdemo/race/interractab1.txt.
Waters, Mary C. 1990. Ethnic Options: Choosing Identities in America. Berkeley: University of California Press.
. 1999. Black Identities: West Indian Immigrant Dreams and American Realities. New York: Russell Sage Foundation.
Williams, Teresa Kay. 1996. “Race as Process: Reassessing the ‘What Are You?’ Encounters of Biracial Individuals.” Pp. 191-210 in The Multiracial Experience: Racial Borders as the New Frontier, edited by Maria P. P. Root. Thousand Oaks, CA: Sage Publications.
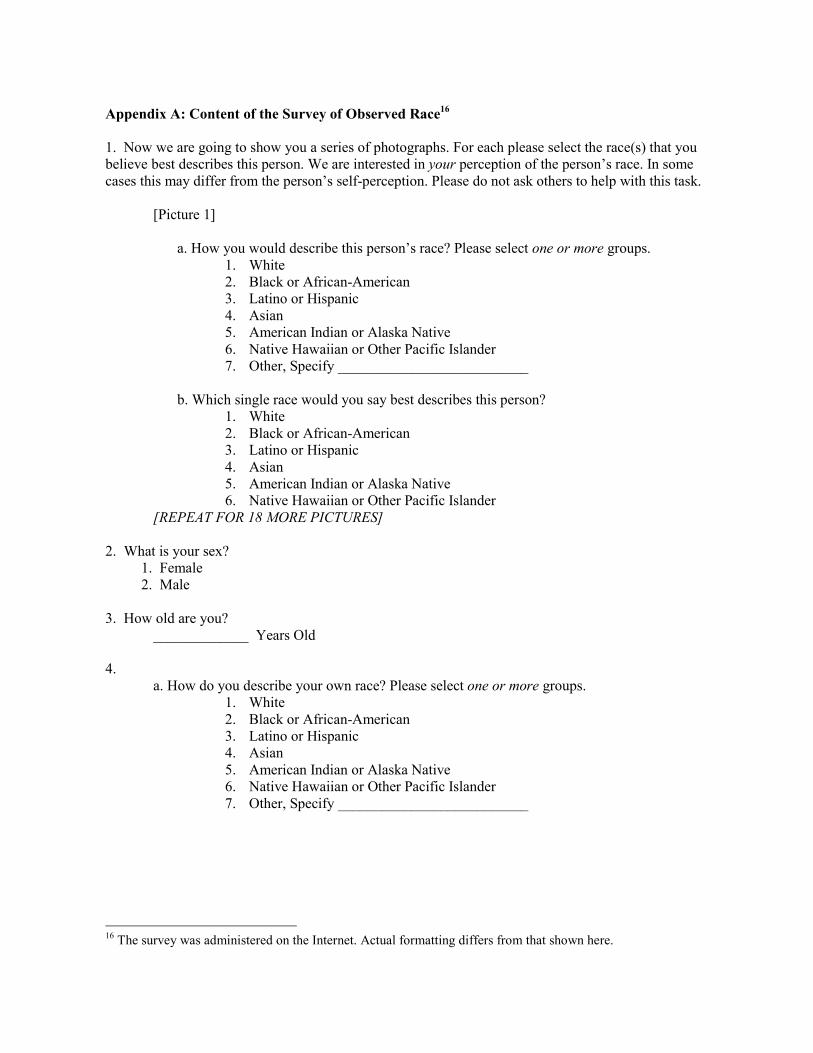
Appendix A: Content of the Survey of Observed Race16 1. Now we are going to show you a series of photographs. For each please select the race(s) that you believe best describes this person. We are interested in your perception of the person’s race. In some cases this may differ from the person’s self-perception. Please do not ask others to help with this task.
[Picture 1]
a. How you would describe this person’s race? Please select one or more groups.
1. White 2. Black or African-American 3. Latino or Hispanic 4. Asian 5. American Indian or Alaska Native 6. Native Hawaiian or Other Pacific Islander 7. Other, Specify __________________________
b. Which single race would you say best describes this person?
1. White 2. Black or African-American 3. Latino or Hispanic 4. Asian 5. American Indian or Alaska Native 6. Native Hawaiian or Other Pacific Islander
[REPEAT FOR 18 MORE PICTURES] 2. What is your sex?
1. Female 2. Male
3. How old are you?
_____________ Years Old 4.
a. How do you describe your own race? Please select one or more groups. 1. White 2. Black or African-American 3. Latino or Hispanic 4. Asian 5. American Indian or Alaska Native 6. Native Hawaiian or Other Pacific Islander 7. Other, Specify __________________________
16 The survey was administered on the Internet. Actual formatting differs from that shown here.

b. Which single race would you say best describes your race? 1. White 2. Black or African-American 3. Latino or Hispanic 4. Asian 5. American Indian or Alaska Native 6. Native Hawaiian or Other Pacific Islander
5. Is everyone in your immediate family the same race as you?
1. No 2. Yes
6. What other races are represented in your immediate family? Select one or more groups for each other race represented in your family.
You
1st person of another
race
2nd person of another
race
3rd person of another
race
4th person of another
race White Black or African-American Latino or Hispanic Asian American Indian or Alaska Native Native Hawaiian or Other Pacific Islander Other, specify
7. Do you currently have a roommate?
1. No 2. Yes
8. Are all of your roommates the same race as you?
1. No 2. Yes
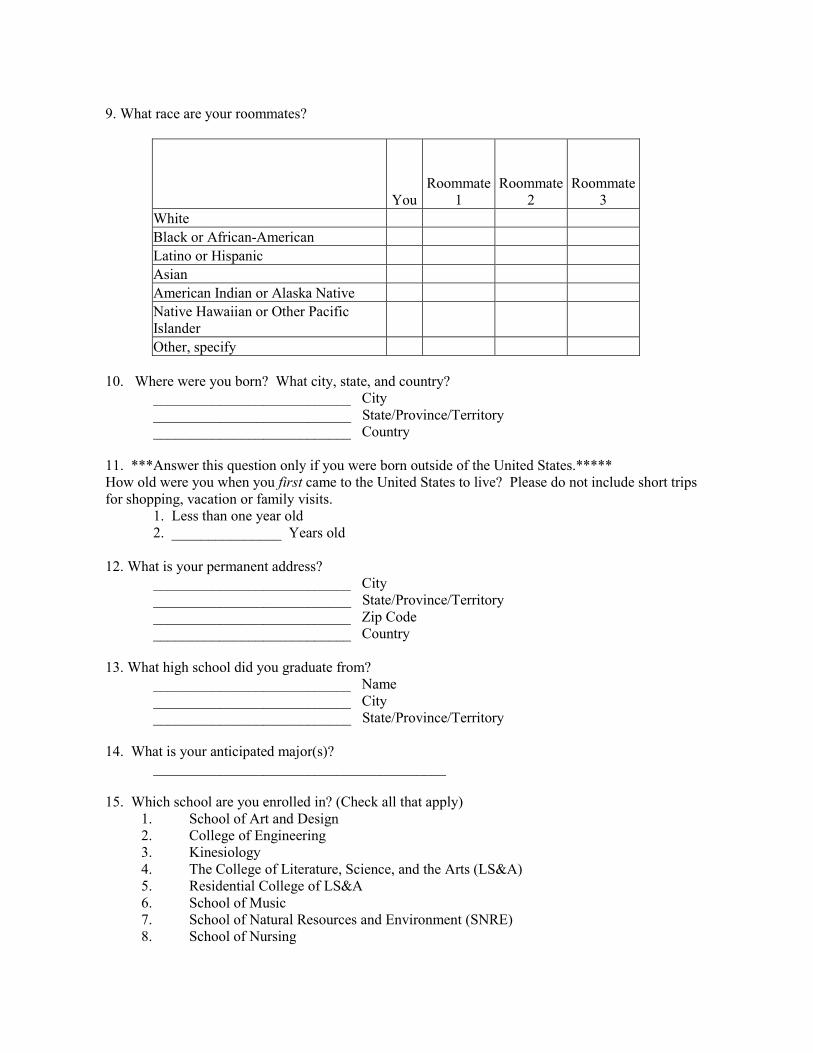
9. What race are your roommates?
YouRoommate
1 Roommate
2 Roommate
3 White Black or African-American Latino or Hispanic Asian American Indian or Alaska Native Native Hawaiian or Other Pacific Islander Other, specify
10. Where were you born? What city, state, and country?
___________________________ City ___________________________ State/Province/Territory ___________________________ Country
11. ***Answer this question only if you were born outside of the United States.***** How old were you when you first came to the United States to live? Please do not include short trips for shopping, vacation or family visits.
1. Less than one year old 2. _______________ Years old
12. What is your permanent address?
___________________________ City ___________________________ State/Province/Territory ___________________________ Zip Code ___________________________ Country
13. What high school did you graduate from?
___________________________ Name ___________________________ City ___________________________ State/Province/Territory
14. What is your anticipated major(s)?
________________________________________ 15. Which school are you enrolled in? (Check all that apply)
1. School of Art and Design 2. College of Engineering 3. Kinesiology 4. The College of Literature, Science, and the Arts (LS&A) 5. Residential College of LS&A 6. School of Music 7. School of Natural Resources and Environment (SNRE) 8. School of Nursing

16. Which of the following standardized tests have you taken?
1. SAT 2. ACT 3. Both 4. Neither
17. What was your score on the SAT?
0-1600 18. We understand that you might not feel comfortable revealing your exact test score, but could you please tell us what range it falls in? Was it…
1. Less than 800 2. 800 - less than 1000 3. 1000 - less than 1200 4. 1200 - less than 1400 5. 1400 or higher
19. What was your score on the ACT?
1-36 20. We understand that you might not feel comfortable revealing your exact test score, but could you please tell us what range it falls in? Was it…
2. Less than 18 3. 18 - less than 22 4. 22 - less than 26 5. 26 - less than 30 6. 30 or higher
Thanks for your help!! A $5 credit will appear on your MCard shortly.

Appendix B: Sample Morphed Photograph17
17 Photograph appears clearer when viewed in electronic format.
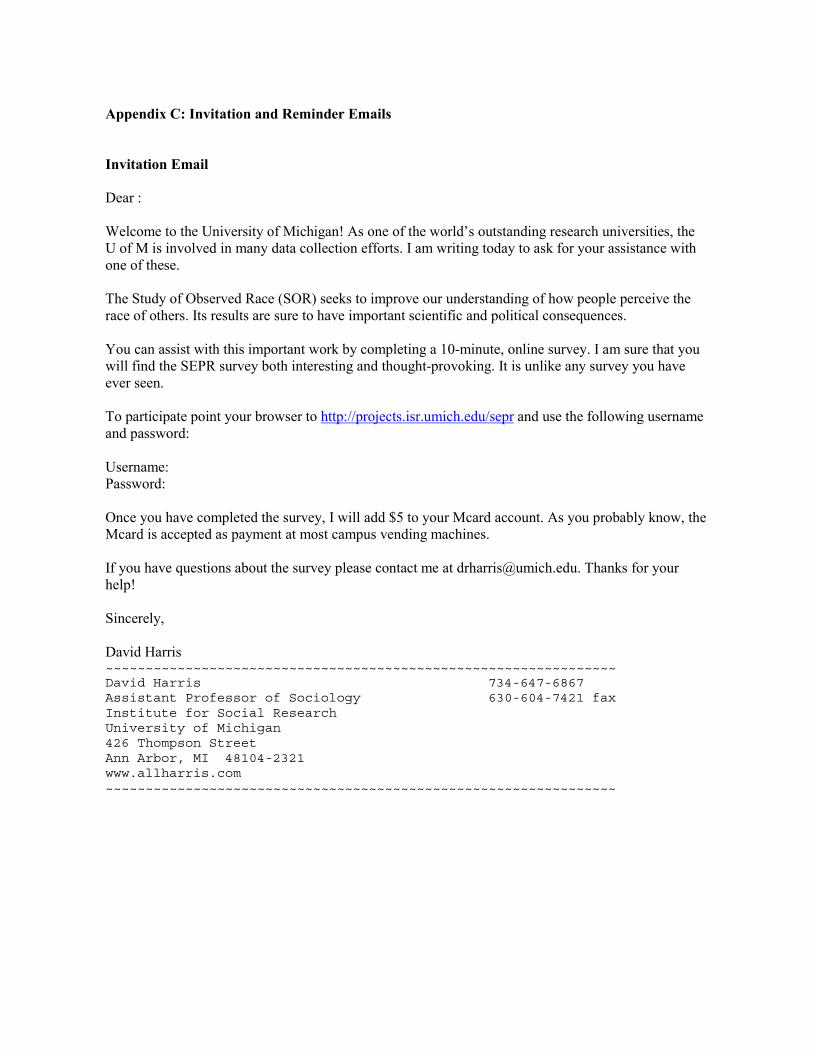
Appendix C: Invitation and Reminder Emails Invitation Email Dear : Welcome to the University of Michigan! As one of the world’s outstanding research universities, the U of M is involved in many data collection efforts. I am writing today to ask for your assistance with one of these. The Study of Observed Race (SOR) seeks to improve our understanding of how people perceive the race of others. Its results are sure to have important scientific and political consequences. You can assist with this important work by completing a 10-minute, online survey. I am sure that you will find the SEPR survey both interesting and thought-provoking. It is unlike any survey you have ever seen. To participate point your browser to http://projects.isr.umich.edu/sepr and use the following username and password: Username: Password: Once you have completed the survey, I will add $5 to your Mcard account. As you probably know, the Mcard is accepted as payment at most campus vending machines. If you have questions about the survey please contact me at [email protected]. Thanks for your help! Sincerely, David Harris ~~~~~~~~~~~~~~~~~~~~~~~~~~~~~~~~~~~~~~~~~~~~~~~~~~~~~~~~~~~~~~~~ David Harris 734-647-6867 Assistant Professor of Sociology 630-604-7421 fax Institute for Social Research University of Michigan 426 Thompson Street Ann Arbor, MI 48104-2321 www.allharris.com ~~~~~~~~~~~~~~~~~~~~~~~~~~~~~~~~~~~~~~~~~~~~~~~~~~~~~~~~~~~~~~~~

First Reminder Dear : A few days ago I sent you email asking for help with an important new study. The survey is at http://projects.isr.umich.edu/sepr. Your username and password are: Username: Password: In an effort to encourage your participation, allow me to respond to some of the reasons why you haven’t completed the survey. Here are the reasons: REASON 1: My time is too valuable to waste on a survey. REASON 2: I’m too busy. REASON 3: I’m not interested in race. REASON 4: It’s racist to conduct a project on racial classification. REASON 5: I don’t want to do a boring survey. REASON 6: Other people have completed the survey so you don’t need me. Here are my responses: REASON 1: My time is too valuable to waste on a survey. RESPONSE: In return for completing the survey, you will receive a $5 credit on your Mcard. Five dollars for 10 minutes of your time is a pretty good deal ($30/hr). Next time you are hungry at 2 am and can’t find any change for the vending machines you’ll appreciate having $5 on your Mcard. REASON 2: I’m too busy. RESPONSE: The survey will take no more than 10 minutes to complete, and because it is an online survey you can complete it whenever you want. Are you really so busy that you can’t find 10 minutes in your day to advance social science? REASON 3: I’m not interested in race. RESPONSE: Your interest in race should have no effect on whether you complete the survey. The results of this survey will help inform a range of social programs that have a direct impact on you, from hiring and admissions policies, to anti-racial profiling efforts, to health care. Your participation will improve the quality of my results, and thus help these programs operate more efficiently. REASON 4: It’s racist to conduct a project on racial classification. RESPONSE: This project is about trying to understand how we determine other people’s race. Like it or not, this is something we all do in everyday life. When a friend refers to one of your black professors or Asian classmates, how often can you honestly say that you didn’t notice the person’s race? (Also see response to Reason 3.)

REASON 5: I don’t want to do a boring survey. RESPONSE: This survey is definitely not boring. It’s like no other survey you have ever seen. I can assure you that you will find the survey interesting and thought-provoking. What’s more, its results are sure to have a significant impact on important intellectual and policy debates. REASON 6: Other people have completed the survey so you don’t need me. RESPONSE: The sample for this survey was designed to be representative. Each person who doesn’t participate increases the odds that my conclusions will apply to a nonrandom subset of UM freshmen. You wouldn’t want that to happen, would you? So, please point your browser to http://projects.isr.umich.edu/sepr, and use the following username and password: Username: Password: If you have questions about the survey, or other reasons for not participating, please contact me at [email protected]. Thanks for your help! Sincerely, David Harris ~~~~~~~~~~~~~~~~~~~~~~~~~~~~~~~~~~~~~~~~~~~~~~~~~~~~~~~~~~~~~~~~ David Harris 734-647-6867 Assistant Professor of Sociology 630-604-7421 fax Institute for Social Research University of Michigan 426 Thompson Street Ann Arbor, MI 48104-2321 www.allharris.com ~~~~~~~~~~~~~~~~~~~~~~~~~~~~~~~~~~~~~~~~~~~~~~~~~~~~~~~~~~~~~~~~

Second Reminder Dear : I would like to make one last appeal for your help. As I have described in two previous emails, SOR is a study that will provide important information about the measurement of race in American society. As a result, it will have a significant impact on how racial policies are administered. The results of this study will impact your life. You can help by pointing your browser to http://projects.isr.umich.edu/sepr, and using the following username and password to answer a brief survey. Username: Password: Participants will receive a $5 credit on their MCard. Many of the students who have already completed the survey have emailed to tell me that they found the survey both interesting and thought-provoking. Nearly all students are completing the survey in 5-10 minutes. If you have any questions about this project please contact me at [email protected]. I would especially appreciate hearing from people who choose not to complete the survey about why they are not participating. Sincerely, David Harris ~~~~~~~~~~~~~~~~~~~~~~~~~~~~~~~~~~~~~~~~~~~~~~~~~~~~~~~~~~~~~~~~ David Harris 734-647-6867 Assistant Professor of Sociology 630-604-7421 fax Institute for Social Research University of Michigan 426 Thompson Street Ann Arbor, MI 48104-2321 www.allharris.com ~~~~~~~~~~~~~~~~~~~~~~~~~~~~~~~~~~~~~~~~~~~~~~~~~~~~~~~~~~~~~~~~